The 1976 Guatemala Earthquake: ESI Scale and Probabilistic/Deterministic Seismic Hazard Analysis Approaches


1
CNR-ISMAR, Calata Porta di Massa, Interno Porto, 80133 Napoli, Italy
2
INGV-Osservatorio Vesuviano, 80133 Napoli, Italy
3
Independent Researcher, 83100 Avellino, Italy
4
CNR-ISA-Via Roma 64, 83100 Avellino, Italy
*
Author to whom correspondence should be addressed.
Geosciences 2019, 9(9), 403; https://doi.org/10.3390/geosciences9090403
Submission received: 30 July 2019
/
Revised: 16 September 2019
/
Accepted: 17 September 2019
/
Published: 19 September 2019
(This article belongs to the Special Issue New Perspectives in the Definition/Evaluation of Seismic Hazard through Analysis of the Environmental Effects Induced by Earthquakes)
Abstract
:A hazard assessment of the 1976 Guatemala earthquake (M = 7.5) was conducted to achieve a better definition of the seismic hazard. The assessment was based on the environmental effects that had effectively contributed to the high destructive impact of that event. An interdisciplinary approach was adopted by integrating: (1) historical data; (2) co-seismic geological effects in terms of Environmental Seismic Intensity (ESI) scale intensity values; and (3) ground shaking data estimated by a probabilistic/deterministic approach. A detailed analysis of primary and secondary effects was conducted for a set of 24 localities, to obtain a better evaluation of seismic intensity. The new intensity values were compared with the Modified Mercalli Intensity (MMI) and Peak Ground Acceleration (PGA) distribution estimated using a probabilistic/deterministic hazard analysis approach for the target area. Our results are evidence that the probabilistic/deterministic hazard analysis procedures may result in very different indications on the PGA distributions. Moreover, PGA values often display significant discrepancy from the macroseismic intensity values calculated with the ESI scale. Therefore, the incorporation of the environmental earth effects into the probabilistic/deterministic hazard analysis appears to be mandatory in order to achieve a more accurate seismic estimation.
1. Introduction
The last decade has witnessed the development of a novel generation of attenuation models (ground motion prediction relations) [1], accompanied by a significant progress of computation possibilities, implemented GIS software, and the introduction of a new Environmental Seismic Intensity (ESI) scale [2,3]. Particularly, recent research focused on hazard characterization has emphasized the importance of revaluating historical seismic events to improve our ability in developing reliable mitigation strategies [3]. These multidisciplinary approaches have found an ideal application in the case of the Guatemala region, one of the most active seismic zones of Central America. During the last century, several strong earthquakes hit the country with dramatic consequences. These earthquakes were mostly associated with devastating environmental phenomena that caused permanent changes in the landscape [4,5,6].
This study analyzed the 1976 Guatemala earthquake, one of the most dramatic seismic events to have occurred in the 20th century. Even as destruction was severe both in terms of numbers of dead/injured and geographical extension, the maximum estimated intensity was IX Modified Mercalli Intensity (MMI) in Gualan, the Mixco area and in the center of Guatemala City.
A re-evaluation of the 1976 earthquake was conducted in order to achieve a better definition of the seismic hazard, taking into account the environmental effects that effectively contributed to the destructive impact, both in terms of human life loss and damage, and the effect on houses and infrastructure. The consequences of the earthquake were felt on a large part of the territory and also a few days after the main shock, with a higher concentration in the western part of the Motagua fault. Several phenomena, including building collapses, surface faulting, ground deformation and soil cracking, landslides, and liquefaction of sandy soils afflicted the population and modified the landscape permanently. All effects induced by the earthquake were analyzed to overcome the intrinsic limitations of the macroseismic scale. Ostensibly, the maximum value of IX MMI was not realistic for the degree of destruction generated by the earthquake. In order to face this apparent contradiction, we reviewed the earthquake environmental effects (EEE) recorded for a set of 24 localities [5,7,8,9,10]. These effects were analyzed in terms of the ESI scale, with the scope of assigning a new intensity level to each locality. The obtained ESI intensity values were then compared with the MMI and the distribution of Peak Ground Acceleration (PGA) estimates using the seismic hazard analysis approach for the target areas. The aim of this study was achieved by integrating (1) previous earthquakes; (2) ESI values distribution; and (3) hazard maps.
1.1. Geological Framework and Historical Seismicity of Guatemala
The tectonic setting of the Central American region (Figure 1) is characterized by the interaction of three major lithospheric plates: The Cocos, the Caribbean, and the North American plates. In this region the relative plate motion is in the order of 2–9 cm/yr and is accompanied by active volcanism and shallow and intermediate seismicity. The Cocos plate moves towards north-northeast with respect to the Caribbean and North America plates at a velocity of 70–80 mm/yr, and subducts beneath Central America at the Middle America Trench [11]. Where the hypocenters of the largest earthquakes occur [12,13]. Over the past 40 years, Guatemala and neighboring areas have experienced 50 events with M ≥ 6, out of which two with M > 7 (USGS data). The last event occurred in the south of Champerico, near the triple junction of the plates, on 7 November 2012 (M = 7.4). Two other strong events occurred in December 1983 (M = 7.1), approximately in the same location of the 7 November event, and in September 1993 (M = 7.2), about 100 km to the northwest, offshore Mexico [11].
Large earthquakes are also produced along the boundary between the North American and the Caribbean plates, defined by a zone of large left lateral strike–slip faults (the Chixoy–Polochic fault, the Motagua fault, etc.) that run through the Guatemala from the Swan Fracture Zone in the Caribbean Sea. The earthquakes generated along these transcurrent faults have a great importance for seismic hazard in Central America, compared to the subduction-related earthquakes, because of their shallow hypocenters and the proximity of many cities and villages to these active structures.
The most destructive event in this region was the earthquake associated with the Motagua fault, that occurred on 4 February 1976, causing 23,000 deaths and 77,200 injuries. The total number of houses destroyed was 258,000 and 1.2 million people were left homeless [4,6,7,8]. Following the main earthquake, at least 18 aftershock events (5.6 ≤ M ≤ 7.9) were recorded, that induced ground effects, mostly slope movements, followed by ground cracks, ground collapse, hydrological changes, topographic changes, tsunami, and in some cases surface faults [14,15].
Strong earthquakes also occurred in 1902 (M = 7.5) and in 1942 (M = 7.9). The event of 19 April 1902 (epicenter in Quetzaltenango) caused landslides and ground fractures within the epicentral area, in Sololà and along the slope of the Agua and Cerro Quemado volcanoes. Significant slope movements dammed the Naranjo and Ixtacapa Rivers, whereas liquefaction and ground settlement phenomena were observed in Cocos. The earthquake of 6 August 1942 (epicentral zone off the southern coast of Guatemala) also induced several landslides and destruction along the west-central highlands in the country. Slope movements affected the Pan-American Highway and secondary roads. Ground settlements also occurred, especially along the western Pacific coast region, [6,16,17].
The historical record of seismicity in the Guatemala region dates back to the 16th century. Destructive historical earthquakes have been accurately described in a series of studies [4,13,16,17,18,19,20,21] and reported in Figure 1. In some cases, these events were characterized by both high damage and remarkable environmental effects.
1.2. The 4 February 1976 Earthquake
On 4 February 1976, at 04 09:01 UTC, an earthquake of M = 7.5 hit the Guatemala region with the epicenter located near Los Amates, about 157 Km NE of Guatemala City [3]. The event was generated by a fault segment with a length of ca. 230 km that was activated with a strike slip mechanism [8,15]. The main earthquake was followed by two large aftershocks occurred on 6 and 7 February near Guatemala City, with magnitude equal to 5.8 and 5.7, respectively [14]. As a consequence, ca. 23,000 deaths and more than 77,000 injuries were reported in a vast part of the territory. Severe environmental effects triggered by the ground motions were recorded over an area of about 18,000 km2, including landslides, liquefaction phenomena, ground cracking, and deformation [4,7,8]. In some districts of the cities of Gualan, Parramos, Patzicia, El Progreso, Rabinal, San Jose Poaquil, and San Martin Jilotepeque, the percentage of houses that collapsed or were seriously damaged even reached 100%.
The main source mechanism was a strike–slip with a mean horizontal displacement of about 1 m and a maximum of 3.4 m [12]. Secondary effects, reported in the Mixo area and other localities, were mainly represented by ground movements of different intensity and volume involved. Harp [5] documented ca. 50,000 landslides, including rock-falls, debris slides and flows, which involved rocks and/or pumiceous pyroclastic deposits over an area of ca. 16,000 km2. The ground instability reported in the Motagua Valley up to Quebradas and Patzaj cities also involved a thick cover of volcaniclastic deposit, locally producing very large slope failures (V > 100,000 m3). In the Motagua valley, along Atlantic coast of Guatemala and Honduras, as well as along the shores of Lakes Amatitlan, Atitlan, and Ilopango, in El Salvador, lateral spreads and liquefaction phenomena were also recorded. The geographic distribution of ground effects, such as landslides and ground cracks, indicates a higher concentration of these fenomena towards the southwestern edge of the Motagua fault. The EEE observation is in a good agreement with the tele-seismic and local data recorded by portable seismic stations during the aftershock sequences. The data confirmed that the highest seismic activity was mostly concentrated in the southwestern edge of the Motagua fault between Guatemala City and Lake Atitlan [14,15].
The intensity level in terms of the ESI scale was evaluated on the basis of both primary effects (e.g., surface faulting) and secondary effects (slope movements, liquefaction, and ground rupture features). The higher ESI intensity level of XI [6] was attributed by taking into account the extent of the area and ground volume involved in slope failures (e.g., landslides, rock-falls, avalanches) [6,22] and was located along the fault zone, as expected. The areal distribution of damages and ground effects reported from localities like Estancia de la Virgen, San Martin Jilotepeque and San Josè Poaquil was helpful in defining the ESI X degree line. The IX level of ESI scale was assigned to some localities in the southwestern part of the fault (Finca San Carlos, Guatemala City, Los Choloyos Mixco Area, Rio Blanco, Rio Los Cubes, Rio Cotzibal) and in Puerto Barrios (eastern edge of the fault).
The total length of the fault zone, together with the extent of the area involved by ground effects represent the criteria used for the definition of the new epicentral intensity (I0 = XI-ESI) calculated for the Guatemala 1976 earthquake. The new intensity calculated with the ESI scale is in a good agreement with an event characterized by a max horizontal offset of 3.40 m and a total length of the surface faulting of 230 km affecting an area of 18,000 km2. Even though the destruction level was dramatic for both the number of dead/injured and geographical extension, the maximum estimated intensity was IX-MMI in the areas of Gualan, Mixco, and the center of Guatemala City.
2. Methods
2.1. The ESI Scale
Traditional intensity scales are usually based on the evaluation of the damage occurred to buildings and man-made infrastructures of inhabited areas (i.e., the EMS-98 [23]). In 2007, a new approach was proposed [2] to evaluate the intensity of an earthquake, virtually applicable to all areas of the world, even where uninhabited. In the proposed approach, the environmental effects induced by the earthquake become key elements to measure seismic intensity. The new macroseismic scale, named the ESI scale (the Environmental Seismic Intensity 2007 scale) was ratified in 2007 by the International Union for Quaternary Research (INQUA). The ESI scale may be regarded as an extension or evolution of traditional macroseismic scales. The 12-degree subdivision of the ESI scale reflects the need for accuracy in the quantification of the earthquake strength and provides a more realistic measure of the intensity. The assessment of geological, hydrological, geomorphological, and vegetation features, once used only marginally to evaluate the seismic risk, plays a privileged and key role in the ESI scale approach. The ESI scale has also been applied to modern and paleo-earthquakes [24,25,26,27,28,29,30], providing significant input for a better evaluation of seismic hazards in different socio-economic contexts [31,32,33,34,35,36,37,38,39].
2.2. Seismic Hazard Analysis (SHA)
A seismic hazard analysis (SHA) is carried out according with the most diffused methods used to calculate the hazard maps, namely, the Probabilistic and Deterministic Seismic Hazard Analysis (PSHA and DSHA, respectively). The PSHA methodology is an inclusive approach and can incorporate: (1) Different source zones where the probability of event occurrence is uniformly distributed; (2) continuous magnitude distribution; (3) different ground motion equations; and (4) parameter uncertainties. The intrinsic nature of the probabilistic approach implies the possibility of missing the individual contribution of each source or event.
On the other hand, the DSHA is characterized by a discrete approach. The seismic source is fixed in space and described by a given magnitude value and a GMPE to estimate the ground motion at the site of interest. In this case, information regarding the frequency of magnitude, location, and probability of the event is not taken into account.
Given the characteristics of the two approaches, they should be considered complementary and used simultaneously. In this work, we decided in fact to use both approaches, because of the focus on a specific earthquake.
2.2.1. Probabilistic Seismic Hazard Analysis (PSHA)
The PSHA is the most widely accepted procedure to evaluate and calculate the risk related to possible earthquake events. This approach was defined by Cornel [40] and it is based on the solution of the hazard integral:
where E represents the mean annual rate of exceeding of a given threshold value A0; f(M) and f(R) are the Probability Density Functions (PDF) of magnitude and distance, respectively; The P function represents the conditional probability to overcome the A0 value for a given magnitude (m) and distance (r) couplet. The term is an expression of the individual capability to generate an earthquake greater than a fixed lower magnitude bound for each seismic source.
The form of PDFs depends on the specific earthquake recurrence model adopted (e.g., Gutenberg and Richter [41] or McGuire and Arabasaz, [42]) and on the source geometry and Ground Motion Prediction Equation (GMPE) adopted.
By resolving Equation (1) under the hypothesis of a poissonian process, it is possible to demonstrate that the probability to exceed a threshold ground motion value (A0) in a fixed time interval (t) is
and the return period (TR) of an event strong enough to generate a ground motion higher to the threshold is
where P represents the poissonian probability to have at least one event (N ≥ 1) during the time interval t.
The output, in terms of single target site approach of the PSHA, obtained from the solution of Equation (1), is the hazard curve.
In this study we have adopted an ad-hoc Fortran code to resolve the hazard integral Equation (1) and calculated the hazard curve and the hazard maps with the possibility of customizing and controlling each step of the process.
The Fortran code was calibrated and tested using the same seismic zonation, parametrization, and GMPE reported by Benito [43], obtaining compatible results.
In this case, the study area is smaller than the one considered in [32] and is located in Guatemala and connected to the Motagua fault and the secondary effects of the 1976 earthquake.
A regular grid of 756 knots (with vertical and horizontal spacing, ∆x and ∆y, respectively, of 0.1°), plus 24 points corresponding to target sites, each characterized by an ESI scale value, was generated to cover about 87,000 km2 (Figure 2 and Figure 3, and Table 1 and Table 2)
The solution of Equation (1), for a single target site, allows the calculation of the hazard curves for the site of interest (see the Analysis and Result Section for more details).
The hazard curve represents the annual frequency of exceedance (or exceedance probability), calculated by Equation (2) of each ground motion threshold value (A0) used in Equation (1). The higher the number of A0 tested values, the higher will be the hazard curve resolution. This will result in a more accurate evaluation of the ground motion value related to a fixed frequency or probability. In this way, for a set of TR Equation (3) or exceedance probability, the corresponding values of ground motion parameters (acceleration, velocity, etc.) will be obtained.
By integrating this procedure over a large number of target points (e.g., a regular grid) it is possible to calculate the geographic distribution of the selected ground motion parameters with the same frequency of exceedance or probability of occurrence or TR (hazard maps).
A set of 200 log-spaced values from 1.0E−4 to 2.4 g (where g is the gravity acceleration = 9.81 m/s2), has been set-up to better define the shape of the curves. Equation (1) was solved for increments of 1 km (in distance) and 0.5 (in magnitude) (Table 1). These steps were selected to match a reasonable compromise between computation time and precision of results.
Another fundamental parameter in calculating the hazard map is the return period (TR). This parameter represents the theorical time interval between two earthquakes with the same magnitude, i.e., the earthquake frequency. The Gutenberg and Richter (G–R) relationship parameters [41] associated with the SZ called “D3_G6” was used to calculate the more realistic TR for the Motagua fault. The fault lies within the SZ reported in Figure 2 and the G–R parameters are also based on the earthquakes that have occurred along this tectonic lineament.
Instead of determining a single TR value associated with a magnitude of 7.5, we used a range of values (7.4 ≤ M ≤ 7.7) to better analyze the hazard variably. The TR value was set to 200, 264, and 300 years and reported in Table 2, along with the corresponding annual probability of exceedance calculated by Equation (3) (for sake of simplicity this paper reports the results for 300 years).
Mechanical properties of the ground subsurface are also an important factor when performing a hazard analysis, therefore the GMPEs include a site characterization in terms of the geotechnical properties of rocks. The GMPEs selected in this work follow this approach, by including a term to correct the PGA estimation as a function of the share waves velocity at a depth of 30 m (Vs30). According to Vs30 values, we may distinguish “rock” (basement lithological units) for geological sites with no amplification effects (Vs30 > 800 m/s) and “soil” (unconsolidated sediments and/or pedogenetic horizons) for sites that amplify the seismic waves (Vs30 < 800 m/s). In this study, we calculated the hazard maps for both “rock” and “soil” ground types. The choice was motivated by the importance of highlighting the likely variability of PGA in association with possible site amplification effects, also in the case of lack of information on Vs30 values at the grid points or target site location. A more realistic PGA range estimation is also easier to compare with the earthquake effects.
2.2.2. Deterministic Seismic Hazard Analysis (DSHA)
The DSHA was performed by assuming the Motagua fault (Figure 1) as a linear seismic source of 230 km. The magnitude was fixed to M = 7.5. The PGA at the grid points and at sites of interest was estimated as the linear combination of GMPEs [44,45]. In this case, the hypocentral distance used in the GMPE corresponds to the minimum distance between the fault-segment and the site. The fault depth was fixed at 5.0 km, as reported in literature [14]. Information on the strike–slip focal mechanism of the earthquake was available but could not be included in the deterministic approach due to the intrinsic limitation of the selected GMPEs.
3. Results and Discussion
3.1. ESI Scale
In spite of the destructive impact of the 1976 Guatemala earthquake, the officially estimated intensity, surprisingly, was only IX-MMI for a limited number of localities [4]. To analyze this apparent incongruence, the primary and secondary environmental effects of the mainshock in terms of the ESI scale definition [2,3] were re-examined.
From the collection of all the published data, it was possible to extrapolate the ESI intensity at 24 target sites, allowing the comparison between the different evaluation methodologies (Table 3).
The data were analyzed and converted into an intensity degree of the ESI scale taking into account the surface faulting, the total length of the fault segment, and the maximum displacement observed, and others secondary co-seismic effects (e.g., landslides, ground deformation) (Figure 4). The maximum intensity value of the ESI scale was attributed to Cabanas, Chuarrancho, El Progreso, Gualan, Quebradas, and Subinal cities, where the damage and the ground effects were extremely intense and could be appropriately described by XI-ESI degree. The secondary effects (mostly landslides) were evaluated in terms of areal extent involved and total volume displaced by slope instability processes [6,22].
Following this assumption, the towns of Estancia de la Virgen, San Martin Jilotepeque, and San Josè Poaquil were characterized by the degree X-ESI, due to the large earthquake-induced landslide that involved a total volume higher than 10E+6 m3. Other towns, located in the vicinity of the fault (Guatemala City and Mixco, San Martin Jilotepeque, Finca San Carlos, Los Choloyos, Rio Blanco, Rio Cotzibal, Rio Los Cubes, Rio Naranjio, Rio Polima, Rio Ruyalchè, and Rio Teocinte) reached intensity IX-ESI.
A degree VIII-ESI was attributed to the La Playa and El Sauza villages, located approximately 185 km away from the epicenter and 40 km from the Motagua fault, where lateral spreads phenomena affecting a series of houses and settlements were recorded. Outside Guatemala, in El Salvador, liquefaction phenomena were observed in the Ilopango lake (about 158 km from the epicenter) and a VII grade-ESI was considered.
3.2. PSHA and DSHA
A preliminary test for the setup of the Fortran code used in this study was performed by considering all the seismic zones in the area of interest, namely, associated with crustal, interplate and in-slab seismicity. The parameters and GMPEs combination used in this test was selected following the approach of Benito [43]. Hazard curves were calculated using a set of 200 log-spaced acceleration (A0) values from 1.0E−4 to 2.4 g, to better define the shape of the curves. The results are reported in Figure 5 for the 24 target sites, together with the curves calculated using only the crustal SZ and using only the SZ denoted as “D3_G6”.
It can be observed (Figure 5) that the hazard at the 24 sites is controlled by the crustal SZ given the remarkable overlap between the curves obtained by crustal SZ (black lines, Figure 5) and the curves obtained by the crustal, in-slab and interplate SZs (red lines, Figure 5). The difference in the annual frequency of exceedance for each acceleration value A0 yielded a maximum residual between the curves of 1.9E−3. This result simplifies the code setup, allowing for the reduction of the input parameters for the hazard computation, by selecting only the crustal SZ. Particularly, only the crustal SZs within a radius of 300 km from each grid knot were considered, consistent with the applicability limits associated with the selected GMPEs [44,45]. The selected crustal SZs is reported in Table 2 with the associated parameters.
The removal of the interplate and in-slab SZ from the hazard computation and the consideration of the GMPE only for the crustal seismicity area proposed by Benito et al. [43] also resulted in a simplification of the computation procedure [43,44,45].
In Figure 6 and Figure 7, different maps obtained by PSHA and deterministic approaches at rock and soil sites were reported, respectively. The probabilistic maps were obtained considering only the crustal SZ or the “D3_G6” SZ and the combination of Climent [44] and Zhao [45] GMPEs evaluated at rock and soil site conditions (Figure 6 and Figure 7, respectively).
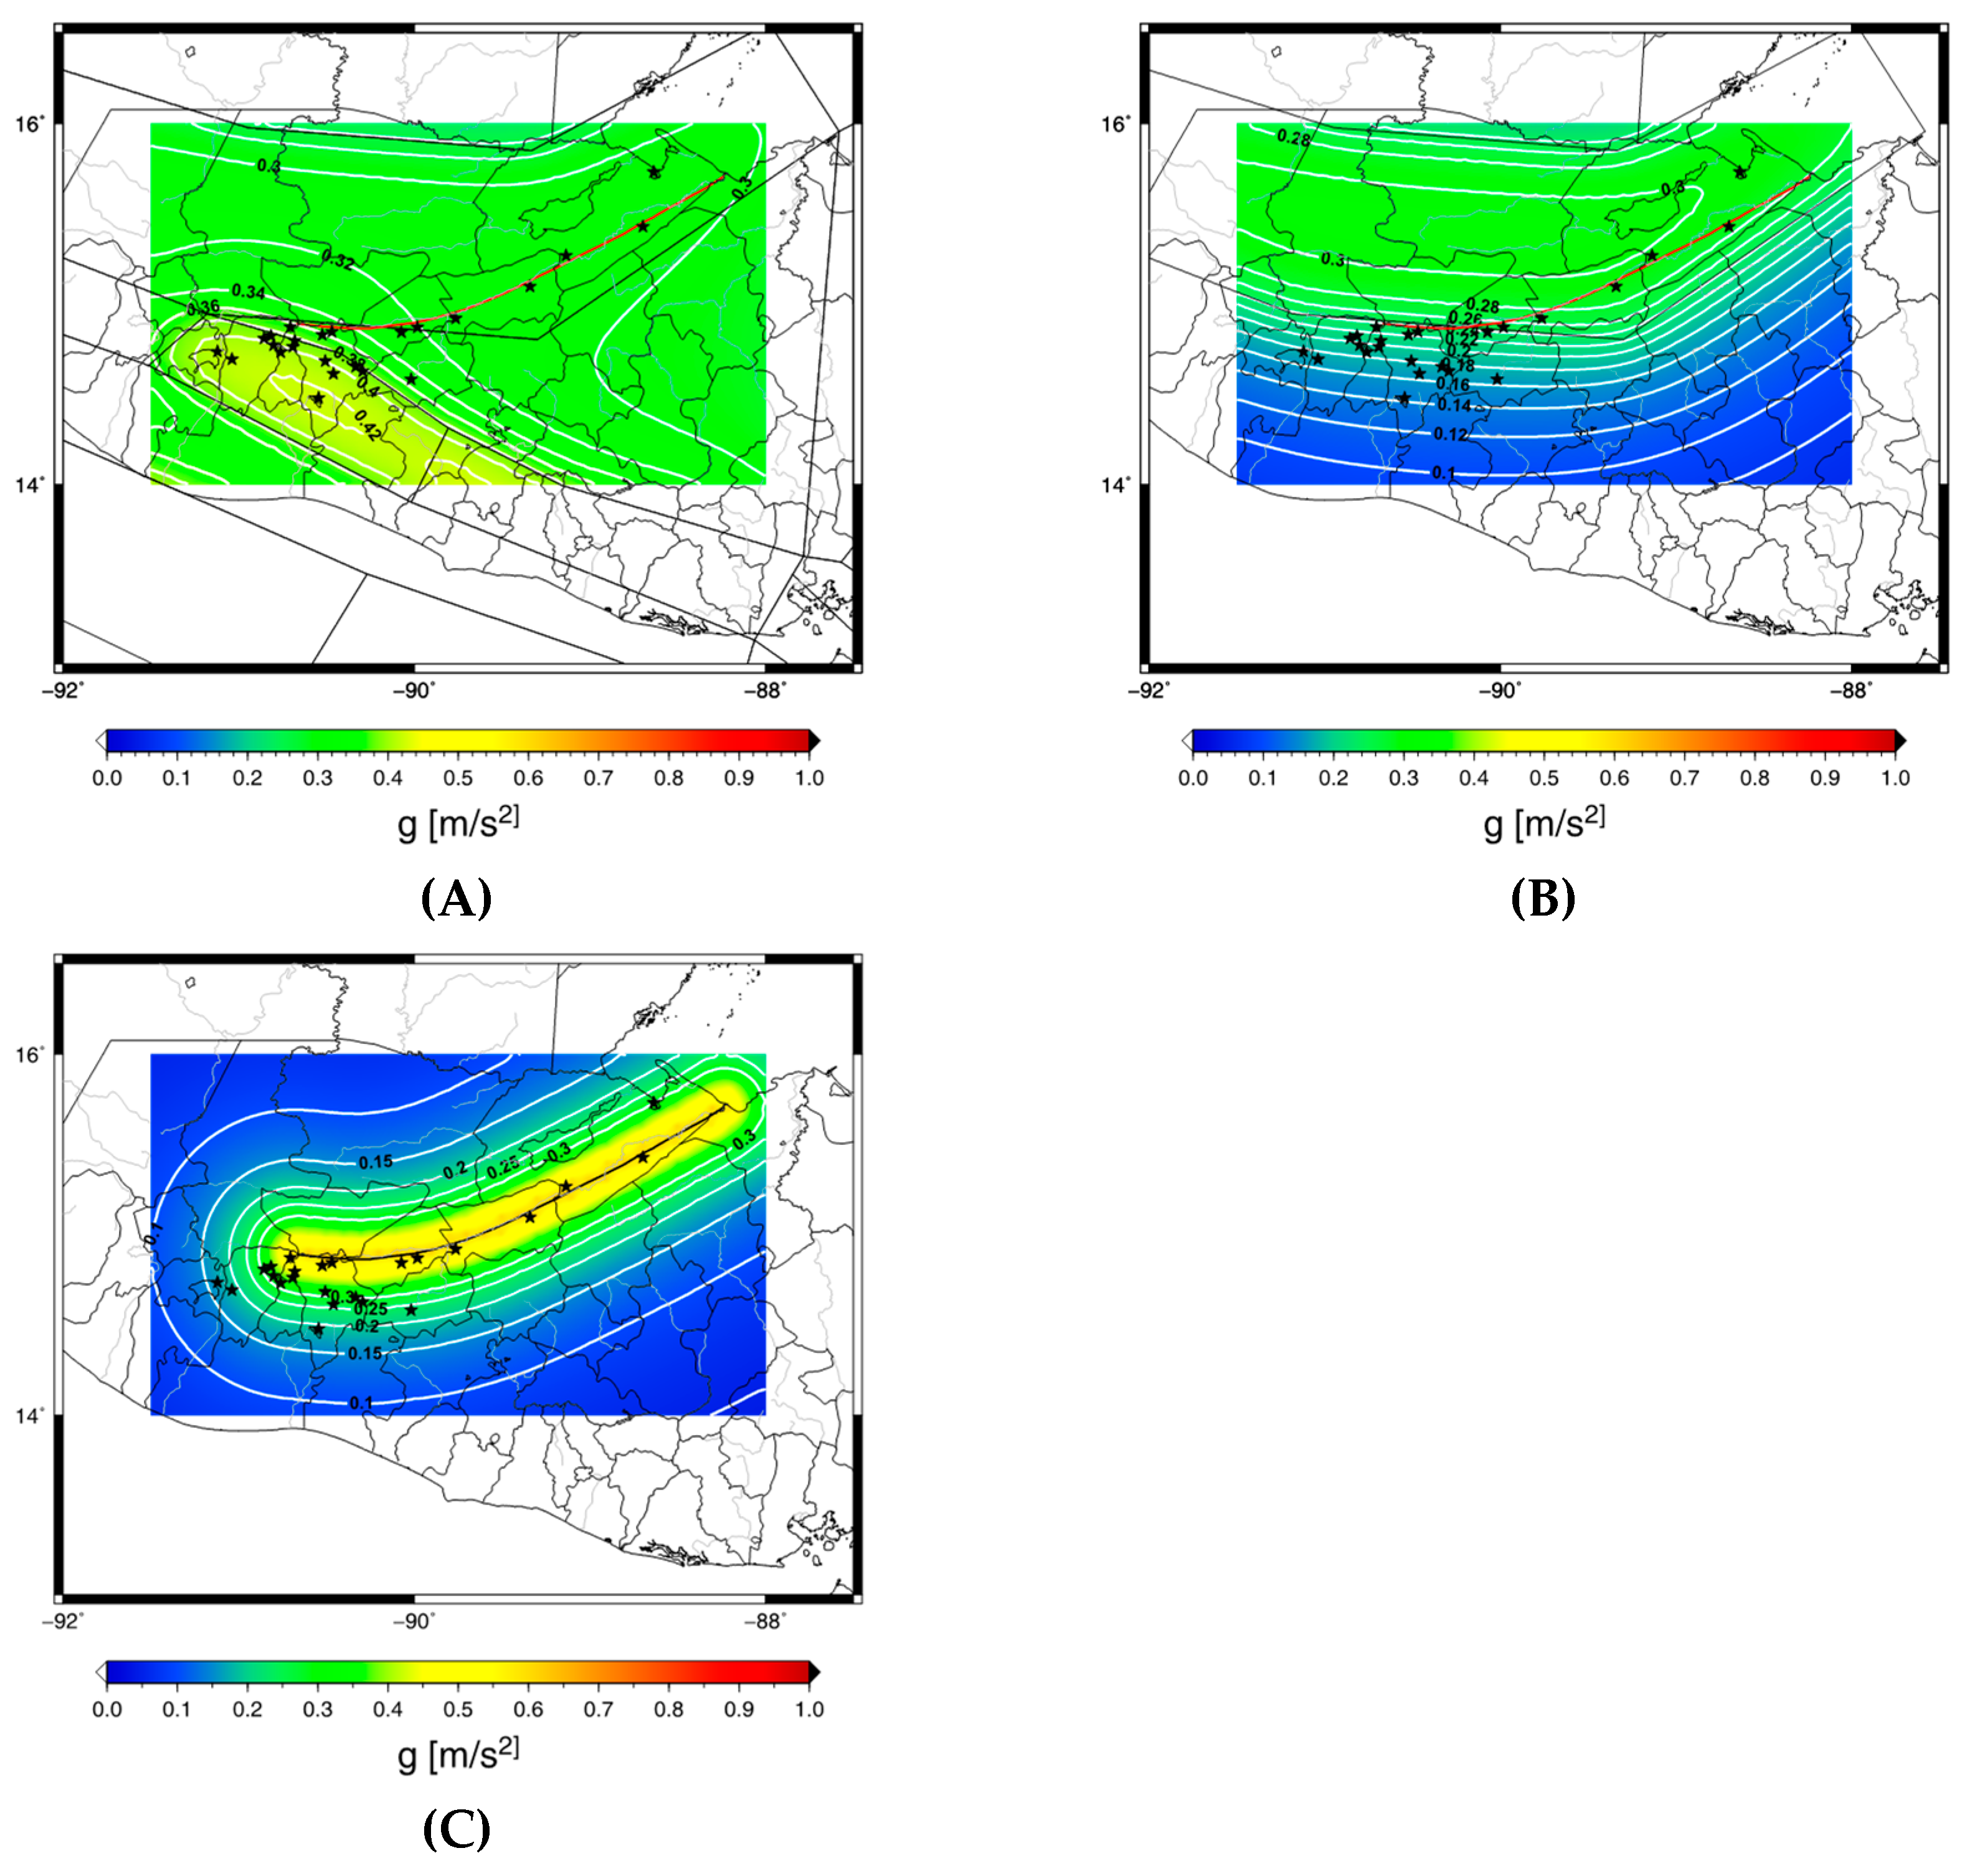
Figure 6A and Figure 7A report the hazard map for TR = 300 years obtained for all the crustal seismic zonation in a grid neighborhood of 300 km. In this case the range of PGA values for the 24 targets site is 0.305–0.422 g for the soil and 0.229–0.317 g at rock. Moreover, as first approach, only the seismogenic zone including the Motagua fault for TR = 300 years (Figure 6B and Figure 7B) was considered, to better compare the probabilistic and deterministic acceleration values with the intensity values. In this case, the PGA range is 0.106–0.223 g for rock and 0.143–0.298 g for soil. Finally, the total fault length (Motagua fault—red line in Figure 1, about 230 km), was used as an extended seismic source to compute the acceleration map based on GMPE PGA estimation (Figure 6C and Figure 7C). In the last case, PGA values range from 0.125 to 0.619 g, which correspond to values higher than the ones obtained by the probabilistic approach. Such a gap, however, is not uncommon as a first approximation. Every point of the extended seismic source, for a length of 230 km, was considered as a point source of a M = 7.5 event.
In Table 4, the intensity (ESI and MMI) and PGA values for 24 different locations in the area for rock and soil site conditions are compared. For the site effects, we reported the PGA interval to better highlight the possible variability of results. PGA values display a significant variability between rock and soil solutions, indicating the complexity of the site effect characterization. For instance, sites yielding values of XI in the ESI scale showed a Deterministic PGA higher than 0.6 g whereas the Probabilistic values reach a maximum value of 0.422 g. However, other sites, such as Rio Blanco and Rio Cotzipal sites, reached higher Deterministic values (around 0.6 g) for lower ESI scale values (IX). In the case of the Puerto Barrios site, there is a general agreement between the ESI scale (IX) and MMI (IX) and both Probabilistic and Deterministic PGA values (0.173–0.365 g and 0.224–0.295 g, respectively), whereas at Lake Atitlan site (ESI scale and MMI VII and VII, respectively) the Probabilistic and Deterministic PGA values are quite different (0.175–0.352 g and 0.125–0.166 g, respectively). The apparent discrepancy between the macroseismic and seismic hazard approaches could be reconciled by considering more realistic characterization site effects that may take into account additional factors, including topographic effects, seismic waves amplification as a function of frequency domain, source directivity, and focal mechanism [47].
The analysis of the Guatemala 1976 event presented in this study indicates that different approaches used to define and/or estimate an earthquake may lead to different results. For example, the ESI scale, which takes in account the environments effects generated by an earthquake, often provides intensity values in the order of two degrees higher than previous macroseimic intensity evaluation. On the other hand, the probabilistic or deterministic approaches, which utilize mathematical/statistical models to approximate the behavior of complex systems, sometimes yield unrealistic estimations.
4. Conclusions
In this study different methodologies have been used to evaluate the same seismic event by comparing the earthquake environmental effects expressed in terms of ESI scale and the hazard maps calculated with probabilistic and deterministic analyses. Advantages and drawbacks of each individual approach were also highlighted. The 1976 Guatemala earthquake was used as a test case to compare different strategies to define how strong an event could be (SHA approaches) or was (MMI and ESI). A multidisciplinary approach based on the combination of geological, geophysics, seismological, and statistical methods was tested to analyze and evaluate the seismic hazard.
All the available data were re-interpreted in the light of the environmental effects recorded in the area struck by the earthquake. An ad-hoc Fortran code was used to resolve the hazard integral and calculate the hazard curve and maps with the possibility of customizing and controlling each step of the process.
The re-evaluation of the 1976 Guatemala event based on the ESI scale resulted in the definition of a new macroseismic field. The general pattern obtained for the ESI scale isoseismal lines displays an ENE-WSW orientation that is compatible with the fault mechanism and geographic distribution of ground effects. A set of probabilistic hazard maps for rock and soil ground sites were calculated using a selection of GMPEs, each producing a different geographic distribution. Particularly, a basic isotropic geometry is the result from the DSHA and a more complex pattern is provided by the PSHA as a function of the different SZs included in the analysis. The results of the above SHA are also reflected by the PGA values that exhibit a high variability.
This research showed that different approaches may produce significantly diverging results. For example, the ESI scale, which takes in account the ground effects generated by an earthquake, yielded intensity values up to two degree higher than the previous macroseismic classification. On the other hand, the probabilistic or deterministic approaches use mathematical/statistical models that may oversimplify the behavior of complex systems, often underestimating the severity of a seismic event.
Our study confirms the importance of collecting both primary and secondary EEE in order to define the nature of an earthquake, and proposes a tool for a more reliable evaluation of the epicentral intensity.
Author Contributions
conceptualization, investigation, data curation, writing, software—original draft preparation M.C.; investigation, writing—review and editing, funding acquisition S.P.; writing—review and editing E.S; writing—review and editing M.S.
Funding
This research received no external funding.
Conflicts of Interest
The authors declare no conflict of interest. The funders had no role in the design of the study; in the collection, analyses, or interpretation of data; in the writing of the manuscript, or in the decision to publish the results.
References
- Power, M.; Chiou, C.; Abrahamson, N.; Bozorgnia, Y.; Shantz, T.; Roblee, C. An Overview of the NGA Project. Earthq. Spectra 2008, 24, 3–21. [Google Scholar] [CrossRef] [Green Version]
- Michetti, A.M.; Esposito, E.; Guerrieri, L.; Porfido, S.; Serva, L.; Tatevossian, R.; Vittori, E.; Audemard, F.; Azuma, T.; Clague, J.; et al. Intensity Scale ESI 2007. In Memorie Descrittive Della Carta Geologica D’Italia; ISPRA Istituto Superiore per la Protezione e la Ricerca Ambientale: Rome, Italy, 2007; Volume 74, p. 53. [Google Scholar]
- Serva, L.; Blumetti, A.M.; Esposito, E.; Guerrieri, L.; Michetti, A.M.; Okumura, K.; Porfido, S.; Reicherter, K.; Silva, P.G.; Vittori, E. Earthquake Environmental Effects, intensity and seismic hazard assessment: The lesson of some recent large earthquakes. In Memorie Descrittive Della Carta Geologica D’Italia; ISPRA Istituto Superiore per la Protezione e la Ricerca Ambientale: Rome, Italy, 2015. [Google Scholar]
- Espinosa, A.F. (Ed.) The Guatemalan Earthquake of February 4, 1976, a Preliminary Report; U.S. Government Printing Office: Washington, DC, USA, 1976. [Google Scholar]
- Harp, E.L.; Keefer, D.K.; Sato, H.P.; Yagi, H. Landslide inventories: The essential part of seismic landslide hazard analyses. Eng. Geol. 2011, 122, 9–21. [Google Scholar] [CrossRef]
- Porfido, S.; Esposito, E.; Sacchi, M.; Molisso, F.; Mazzola, S. Impact of Ground Effects for an appropriate mitigation strategy in seismic area: The example of Guatemala 1976 earthquake. Eng. Geol. Soc. Territ. 2015, 2. [Google Scholar] [CrossRef]
- Harp, E.L.; Wilson, R.C.; Wieczorek, G.F. Landslides from the February 4, 1976, Guatemala Earthquake; U.S. Geological Survey: Leston, VA, USA, 1981.
- Plafker, G.; Bonilla, M.G.; Bonis, S.B. The Guatemalan Earthquake of February 4, 1976; U.S. Geological Survey: Leston, VA, USA, 1976; pp. 38–51.
- Hoose, S.N.; Wilson, R.C.; Rosenfeld, J.H. Liquefaction-Caused Ground Failure during the February 4, 1976, Guatemala Earthquake; U.S. Geological Survey: Leston, VA, USA, 1978.
- Plafker, G. Tectonic aspects of the Guatemala 4 February 1976. Science 1976, 193, 1201–1208. [Google Scholar] [CrossRef] [PubMed]
- Hayes, G.P.; Myers, E.K.; Dewey, J.W.; Briggs, R.W.; Earle, P.S.; Benz, H.M.; Smoczyk, G.M.; Flamme, H.E.; Barnhart, W.D.; Gold, R.D.; et al. Tectonic Summaries of Magnitude 7 and Greater Earthquakes from 2000 to 2015; U.S. Geological Survey Open-File Report 2016–1192; U.S. Geological Survey: Leston, VA, USA, 2017.
- Benz, H.M.; Tarr, A.C.; Hayes, G.P.; Villaseñor, A.; Furlong, K.P.; Dart, R.L.; Rhea, S. Seismicity of the Earth 1900–2010 Caribbean Plate and Vicinity; U.S. Geological Survey Open-File Report 2010–1083-A, Scale 1:8,000,000; U.S. Geological Survey: Leston, VA, USA, 2011.
- Benito Oterino, M.B.; Torres Fernández, Y. (Eds.) Amenaza sísmica en América Central; Entimema: Madrid, Spain, 2009; p. 371. [Google Scholar]
- Person, W.; Spence, W.; Dewey, J.W. Main event and principal aftershocks from teleseismic data. In The Guatemala Earthquake of February 4, 1976; Espinosa, A.F., Ed.; U.S. Geological Survey: Leston, VA, USA, 1976. [Google Scholar]
- Matumoto, T.; Latham, G.V. Aftershocks of the Guatemalan Earthquake of February 4, 1976. Geophys. Res. Lett. 1976, 3, 599–602. [Google Scholar] [CrossRef]
- Ambraseys, N.N.; Adams, R.D. Large-magnitude Central American earthquakes, 1898–1994. Geophys. J. Int. 1996, 127, 665–692. [Google Scholar] [CrossRef]
- Bommer, J.J.; Rodriguez, C.E. Earthquake-induced landslides in central America. Eng. Geol. 2002, 63, 189–220. [Google Scholar] [CrossRef]
- Peraldo, H.G.; Montero, P.W. Sismología Histórica de América Central; IPGH: Mexico City, México, 1999; Volume 513, p. 347. [Google Scholar]
- Tanner, J.G.; Shepherd, J.B. Seismic Hazard in Latin America and the Caribbean, Volume I: Project Catalog and Seismic Hazard Maps; IRDC: Ottawa, ON, Canada, 1997; p. 143. [Google Scholar]
- White, R.A.; Ligorria, J.P.; Cifuentes, I.L. Seismic history of the Middle America subduction zone along El Salvador, Guatemala, and Chiapas, Mexico: 1526–2000. Spec. Pap. Geol. Soc. Am. 2004, 375, 379–396. [Google Scholar]
- Global Historical Earthquake Archive—GHEA. Available online: https://www.emidius.eu/GEH/map.php (accessed on 15 July 2019).
- Porfido, S.; Esposito, E.; Spiga, E.; Mazzola, S. Application of the ESI Scale: Case study of the February 4, 1976 Guatemala earthquake. In Proceedings of the 3rd INQUA-IGCP-567 International Workshop on Active Tectonics, Paleoseismology and Archaeoseismology, Morelia, Mexico, 19–24 November 2012. [Google Scholar]
- Grünthal, G.; Musson, R.; Schwarz, J.; Stucchi, M. European Macroseismic Scale 1998; Cahiers du Centre Européen de Geodynamique et de Seismologie: Luxembourg, 1998; Volume 15. [Google Scholar]
- Silva, P.G.; Pascua, M.A.R.; Pérez-López, R.; Bardaji, T.; Lario, J.; Alfaro, P.; Martínez-Díaz, J.J.; Reicherter, K.; García, J.G.; Giner, J.; et al. Catalogacion de los efectos geologicos y ambientales de los terremotos en Espana en la Escala ESI 2007 y su aplicacion a los estudions paleosismologicos. Geotemas 2008, 6, 1063–1066. [Google Scholar]
- Reicherter, K.; Michetti, A.M.; Silva, P.G. (Eds.) Paleoseismology: Historical and prehistorical records of earthquake ground effects for seismic hazard as-sessment. Geol. Soc. 2009, 316, 1–10. [Google Scholar] [CrossRef]
- Espinosa, A.F.; Husid, R.; Quesada, A. Intensity and Source Parameters from Filed Observations. The Guatemalan Earthquake of February 4, 1976; U.S. Geological Survey: Leston, VA, USA, 2013; pp. 52–66.
- Papanikolaou, I.D. Uncertainty in intensity assignment and attenuation rela-tionships: How seismic hazard maps can benefit from the implementation of the Environmental Seismic Intensity scale (ESI 2007). Quat. Int. 2011. [Google Scholar] [CrossRef]
- Bobrowsky, P.T. (Ed.) Encyclopedia of Natural Hazards; Springer: Berlin/Heidelberg, Germany, 2013; ISBN 978-90-481-8699-0. [Google Scholar]
- Serva, L. History of the Environmental Seismic Intensity Scale ESI-07. Geosciences 2019, 9, 210. [Google Scholar] [CrossRef]
- Porfido, S.; Nappi, R.; de Lucia, M.; Gaudiosi, G.; Alessio, G.; Guerrieri, L. The ESI scale, an ethical approach to the evaluation of seismic hazards. In Proceedings of the EGU General Assembly 2015, Vienna, Austria, 12–17 April 2015. [Google Scholar]
- Chunga, K.; Livio, F.; Mulas, M.; OchoaCornejo, F.; Besenzon, D.; Ferrario, M.F.; Michetti, A.M. Earthquake Ground Effects and Intensity of the 16 April 2016 Mw 7.8 Pedernales, Ecuador, Earthquake: Implications for the Source Characterization of Large Subduction Earthquakes. Bull. Seism. Soc. Am. 2018, 108, 3384–3397. [Google Scholar] [CrossRef]
- Serva, L.; Vittori, E.; Comerci, V.; Esposito, E.; Guerrieri, L.; Michetti, A.M.; Mohammadioun, B.; Mohammadioun, G.C.; Porfido, S.; Tatevossian, R.E. Earthquake Hazard and the Environmental Seismic Intensity (ESI) Scale. Pure Appl. Geophys. 2015, 173, 1479–1515. [Google Scholar] [CrossRef]
- Chunga, K.; Livio, F.A.; Martillo, C.; Lara-Saavedra, H.; Ferrario, M.F.; Zevallos, I.; Michetti, A.M. Landslides Triggered by the 2016 Mw 7.8 Pedernales, Ecuador Earthquake: Correlations with ESI-07 Intensity, Lithology, Slope and PGA-h. Geosciences 2019, 9, 371. [Google Scholar] [CrossRef]
- Silva, P.G.; Rodríguez-Pascua, M.A.; Giner Robles, J.L.; Élez, J.; Pérez-López, R.; Davila, M.B.B. Catalogue of the Geological Effects of Earthquakes in Spain Based on the ESI-07 Macroseismic Scale: A New Database for Seismic Hazard Analysis. Geosciences 2019, 9, 334. [Google Scholar] [CrossRef]
- Nappi, R.; Gaudiosi, G.; Alessio, G.; De Lucia, M.; Porfido, S. The environmental effects of the 1743 Salento earthquake (Apulia, southern Italy): A contribution to seismic hazard assessment of the Salento Peninsula. Nat. Hazards 2017, 86, 295–324. [Google Scholar] [CrossRef]
- Audemard, F.; Azuma, T.; Baiocco, F.; Baize, S.; Blumetti, A.M.; Brustia, E.; Clague, J.; Comerci, V.; Esposito, E.; Guerrieri, L.; et al. Earthquake Environmental Effect for seismic hazard assessment: the ESI intensity scale and the EEE Catalogue. Mem. Descr. Carta Geol. D’Italia 2015, 97, 1–181. [Google Scholar]
- Mavroulis, S.D.; Fountoulis, I.G.; Skourtsos, E.N.; Lekkas, E.; Papanikolaou, I.D. Seismic intensity assignments for the 2008 Andravida (NW Peloponnese, Greece) strike-slip event (June 8, Mw = 6.4) based on the application of the Environmental Seismic Intensity scale (ESI 2007) and the European Macroseismic scale (EMS-98), Geological structure, active tectonics, earthquake environmental effects and damage pattern. Ann. Geophys. 2013, 56, S0681. [Google Scholar]
- Mosquera-Machado, S.; Lalinde-Pulido, C.; Salcedo-Huarto, E.; Michetti, A.M. Ground effects of the October 18, 1992, Murindo Earthquake (NW Colombia), using the Environmental Seismic Intensity Scale (ESI 2007) for the assessment of the intensity. Geol. Soc. 2009, 316, 123–144. [Google Scholar] [CrossRef]
- Lekkas, E.L. The 12 May 2008 Mw 7.9 Wenchuan, China, earthquake: Macroseismic intensity assessment using the EMS-98 and ESI 2007 Scales and their correlation with the geological structure. Bull. Seism. Soc. Am. 2010, 100, 2791–2804. [Google Scholar] [CrossRef]
- Cornell, C.A. Engineering seismic risk analysis. Bull. Seism. Soc. Am. 1968, 58, 1583–1606. [Google Scholar]
- Gutenberg, B.; Richter, C.R. Frequency of earthquakes in California. Bull. Seism. Soc. Am. 1944, 34, 185–188. [Google Scholar]
- McGuire, R.K.; Arabasz, W.J. An introduction to probabilistic seismic hazard analysis. In Geotechnical and Environmental Geophysics, Society of Exploration Geophysicists; Ward, S.H., Ed.; Society of Exploration Geophysics: Tulsa, OK, USA, 1990; Volume 1, pp. 333–353. [Google Scholar]
- Benito, M.B.; Lindholm, C.; Camacho, E.; Climent, A.; Marroquin, G.; Molina, E.; Rojas, W.; Escobar, J.J.; Talavera, E.; Alvarado, G.E.; et al. A New Evaluation of Seismic Hazard for the Central America Region. Bull. Seism. Soc. Am. 2012, 102, 504–523. [Google Scholar] [CrossRef]
- Climent, Á.; Taylor, W.; Real, M.C.; Strauch, W.; Villagran, M.; Dahle, A.; Bungum, H. Spectral Strong Motion Attenuation in Central America; Internal NORSAR Technical Report: Kjeller, Norway, No. 2–17; 1994; p. 46. [Google Scholar]
- Zhao, J.X.; Zhang, J.; Asano, A.; Ohno, Y.; Oouchi, T.; Takahashi, T.; Ogawa, H.; Irikura, K.; Thio, H.K.; Somerville, P.G. Attenuation relations of strong ground motion in Japan using site classification based on predominant period. Bull. Seism. Soc. Am. 2006, 96, 898–913. [Google Scholar] [CrossRef]
- Porfido, S.; Caccavale, M.; Spiga, E.; Sacchi, M. The 1976 Guatemala earthquake revised. Macroseismic data for an appropriate seismic hazard assessment. In Proceedings of the Geo-Risks in the Mediterranean and their Mitigation, Msida, Malta, 20–21 July 2015. [Google Scholar]
- Steven, K.L. Geotechinical Earthquake Engineering; Prentice-Hall International Series; Prentice-Hall: Upper Saddle River, NJ, USA, 1996. [Google Scholar]
Figure 1.
Historical earthquakes in Guatemala included in the Global Historical Earthquake Catalogue (GHEA) for the period 1000–1903 (red points) with Mw = 7 and over; the yellow stars represent the 4th February 1976 Guatemala earthquake epicenter; the red line represents the Motagua fault.
Figure 1.
Historical earthquakes in Guatemala included in the Global Historical Earthquake Catalogue (GHEA) for the period 1000–1903 (red points) with Mw = 7 and over; the yellow stars represent the 4th February 1976 Guatemala earthquake epicenter; the red line represents the Motagua fault.

Figure 2.
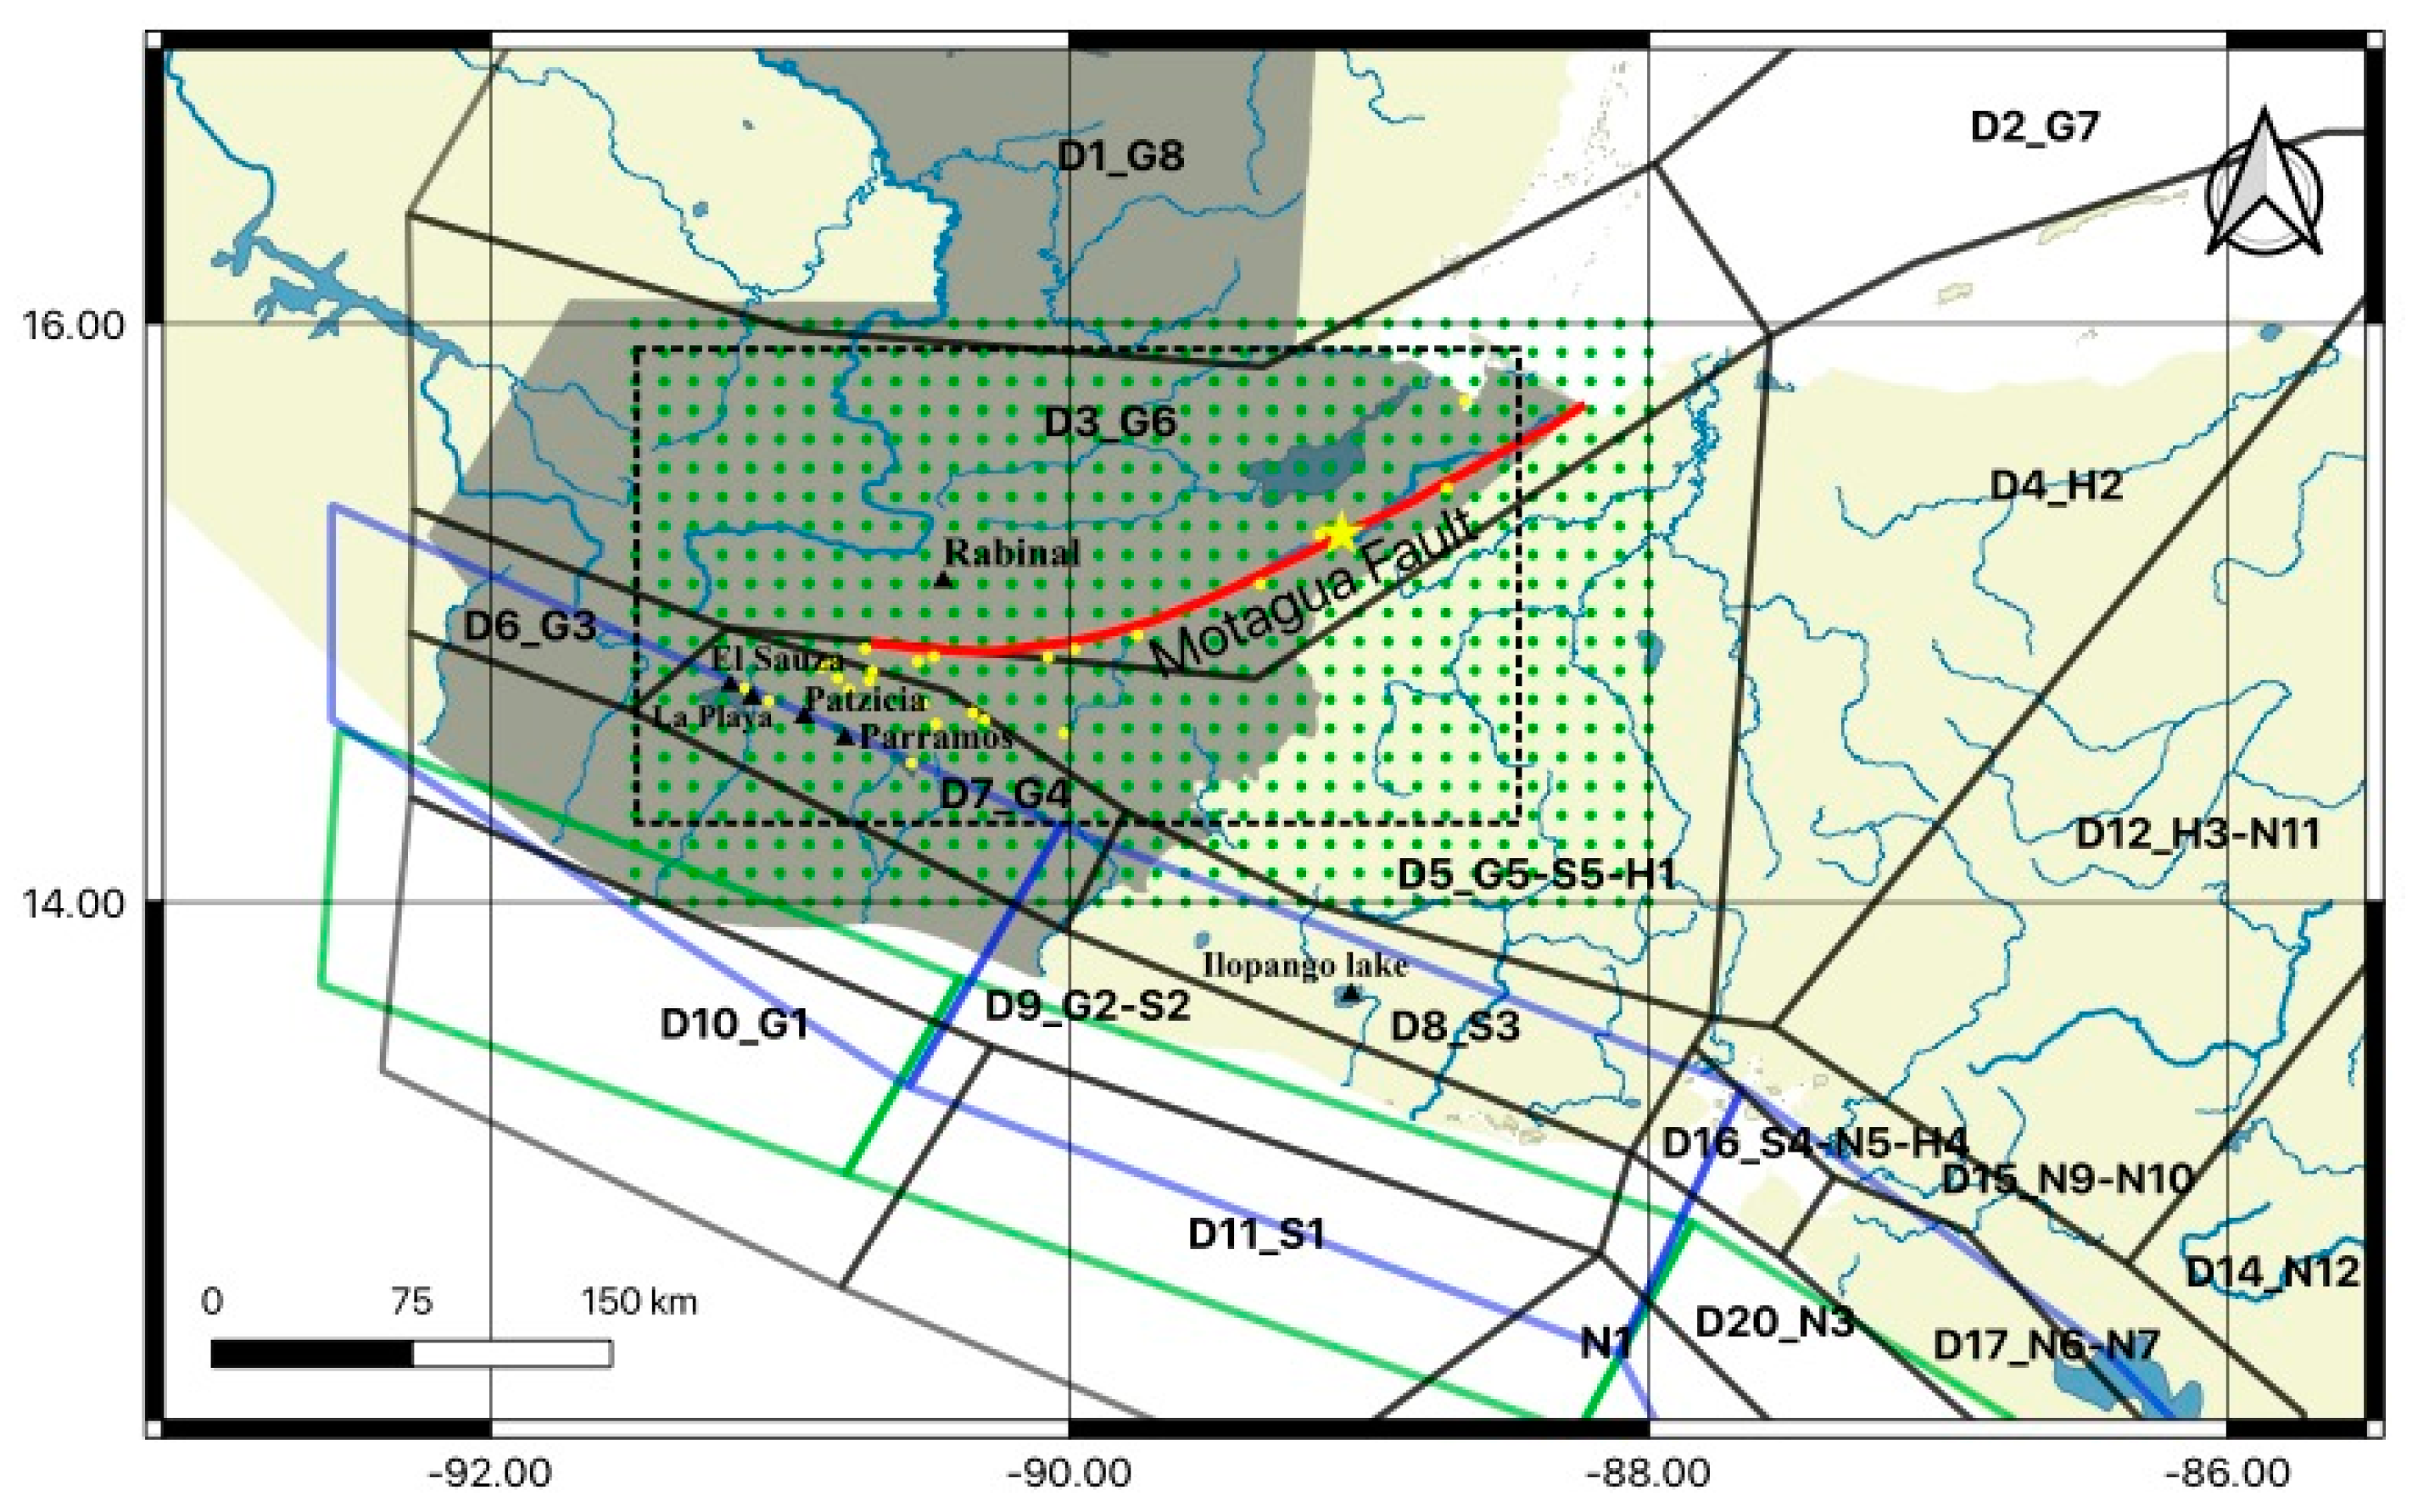
Crustal seismic zones (black polygons); in-slab seismic zones (blue polygons); interplate seismic zones (green polygons); grid points used for the probabilistic approach (green); the red line represents the Motagua fault and the yellow star the 4 February 1976 Guatemala earthquake epicenter. Yellows hexagons represent the target sites and black triangles represent sites of interest. The black dashed box represents the area of interest with the target sites.
Figure 2.
Crustal seismic zones (black polygons); in-slab seismic zones (blue polygons); interplate seismic zones (green polygons); grid points used for the probabilistic approach (green); the red line represents the Motagua fault and the yellow star the 4 February 1976 Guatemala earthquake epicenter. Yellows hexagons represent the target sites and black triangles represent sites of interest. The black dashed box represents the area of interest with the target sites.

Figure 3.
Area of interest with the target sites (yellow hexagons) and other sites of interest (black triangles). In green the grid points used for the probabilistic approach; the red line represents the Motagua fault and the yellow star the 4th February 1976 Guatemala earthquake epicenter.
Figure 3.
Area of interest with the target sites (yellow hexagons) and other sites of interest (black triangles). In green the grid points used for the probabilistic approach; the red line represents the Motagua fault and the yellow star the 4th February 1976 Guatemala earthquake epicenter.

Figure 4.
The 4 February 1976 Guatemala earthquake: Isoseismal lines based on the ESI scale [46].
Figure 4.
The 4 February 1976 Guatemala earthquake: Isoseismal lines based on the ESI scale [46].

Figure 5.
Evaluation of SZ contribution to the hazard. (A) Hazard curves for the 24 target sites. Hazard map for TR = 300 years at rock ground considering only the “D3_G6” SZ (B); considering all the SZ (C); considering the crustal SZ (D). The stars represent the target sites and the red line the Motagua fault.

Figure 6.
Hazard maps for rock ground and 300 years return period for different configurations: (A) Using crustal SZ; (B) using only the SZ “D3_G6”; (C) deterministic PGA distribution calculated from Motagua fault (red line) for M = 7.5. The black stars represent the target sites.
Figure 6.
Hazard maps for rock ground and 300 years return period for different configurations: (A) Using crustal SZ; (B) using only the SZ “D3_G6”; (C) deterministic PGA distribution calculated from Motagua fault (red line) for M = 7.5. The black stars represent the target sites.

Figure 7.
Hazard maps for soil ground and 300 years return period for different configurations: (A) Using crustal SZ; (B) using only the SZ “D3_G6”; (C) deterministic PGA distribution calculated from the Motagua fault (red line) for M=7.5. The black stars represent the target sites.
Figure 7.
Hazard maps for soil ground and 300 years return period for different configurations: (A) Using crustal SZ; (B) using only the SZ “D3_G6”; (C) deterministic PGA distribution calculated from the Motagua fault (red line) for M=7.5. The black stars represent the target sites.


Table 1.
Input parameters of the probabilistic seismic hazard analysis (PSHA) Fortran code.
| Grid Configuration | Hazard Integration Parameters | ||
|---|---|---|---|
| Horizontal spacing (∆X) | 0.1° | Distance increment (dr) [km] | 1.0 |
| Vertical spacing (∆Y) | 0.1° | Magnitude increment (dm) | 0.5 |
| N° of grid points | 780 | Integration distance range [km] | 0÷300 |
| Grid area (km2) | ~87,000 | Return periods [Yrs] | 200; 264; 300 |
| Lat. range | 14.0, 16.0 | Annual probability of exceedance | 0.5; 0.4; 0.3; 0.2 |
| Lon. range | −88.0; −91.5 | Acceleration threshold range (A0) [g] | 1.0E−4 ÷ 2.4 |
Table 2.
Crustal seismic zones (SZ) parameters used in this study.
| Id | Name | N(Mmin)° | b+ | Mmax* | Depth (Km)|| | Area (Km2) |
|---|---|---|---|---|---|---|
| 1 | D1_G8 | 0.75 | 0.78 | 6.7 | 10 | 139,028.293 |
| 2 | D2_G7 | 0.93 | 0.78 | 7.8 | 10 | 76,659.182 |
| 3 | D3_G6 | 1.32 | 0.82 | 7.8 | 10 | 56,656.057 |
| 4 | D4_H2 | 0.73 | 1.21 | 6.3 | 10 | 43,918.544 |
| 5 | D5_G5-S5-H1 | 0.97 | 0.88 | 6.8 | 10 | 38,233.842 |
| 6 | D6_G3 | 0.18 | 0.67 | 6.7 | 10 | 4810.094 |
| 7 | D7_G4 | 0.65 | 0.72 | 7.0 | 10 | 9675.350 |
| 8 | D8_S3 | 1.18 | 0.87 | 7.0 | 10 | 11,967.291 |
| 9 | D9_G2-S2 | 1.60 | 1.03 | 6.3 | 20 | 26,453.291 |
| 10 | D10_G1 | 3.51 | 0.92 | 7.5 | 20 | 22,903.907 |
| 11 | D11_S1 | 9.77 | 1.56 | 7.5 | 20 | 25,079.390 |
| 12 | D12_H3-N11 | 0.36 | 1.09 | 6.3 | 10 | 80,889.087 |
| 14 | D14_N12 | 0.44 | 1.21 | 6.2 | 10 | 61,147.947 |
| 15 | D15_N9-N10 | 0.24 | 0.50 | 6.8 | 10 | 10,023.342 |
| 16 | D16_S4-N5-H4 | 0.52 | 0.97 | 6.6 | 10 | 3005.915 |
| 17 | D17_N6-N7 | 1.68 | 0.95 | 6.5 | 10 | 8024.593 |
| 20 | D20_N3 | 1.35 | 0.88 | 6.8 | 20 | 7934.894 |
| 21 | N1 | 13.73 | 1.18 | 8 | 10 | 26,047.566 |
° N(Mmin) is the number of events with magnitude M ≥ Mmin; Mmin = 4.5. + b is the slop of the Gutenberg-Richter relationship [41]. * Mmax is the maximum magnitude associated to the seismic zone. || Depth is the hypocentral depth of the events.
Table 3.
Primary and secondary effects triggered by the 1976 Guatemala earthquake.
| NO. | Locality | ESI | Type of Effect ° | MMI | Note |
|---|---|---|---|---|---|
| 1 | Cabanas | XI | SF, GC | VIII | Main strike slip fault; ground cracks |
| 2 | Chuarrancho | XI | SF, GC | VIII | Main strike slip fault; ground cracks |
| 3 | El Progreso | XI | SF, GC | VIII | Main strike slip fault; ground cracks |
| 4 | Gualan | XI | SF, GC | IX | Main strike slip fault; ground cracks |
| 5 | Quebradas | XI | SF, GC, L | VIII | Main strike slip fault; ground cracks; Liquefaction phenomena |
| 6 | Subinal | XI | SF, GC | VIII | Main strike slip fault; ground cracks |
| 7 | Estancia De La Virgen | X | SM, GC, TL | VIII | Rotational slump/rock-fall avalanche (V < 106 m3), Temp. Lake |
| 8 | San Martin Jilotepeque | X | SM, GC, L, TL | VIII | Complex rotational slump/eartflow (V = 106 m3), lateral spreads; Temp. Lake |
| 9 | San Josè Poaquil | X | SM, GC | VIII | Complex block slide/rotational slump/rock-fall avalanche (V = 3.5×10⁶ m3); Temp. Lake |
| 10 | Puerto Barrios | IX | SF, GS, GC | IX (VI) | Ground compaction |
| 11 | Finca San Carlos | IX | SF, SM, GC | Rotational slump/avalanche (V < 0.1×10⁶ m3) | |
| 12 | Guatemala City | IX | SF, SM, GC | VII-VIII | Secondary faults = 20 km long |
| 13 | Los Choloyos | IX | SM, L, GC | VII-VIII | Block slide/rock-fall avalanche - lateral spreads (0.75 × 10⁶ < V < 106 m3) |
| 14 | Mixco Area | IX | SF, GC, SM | VII-VIII | Secondary faults = 20 km long |
| 15 | Rio Blanco | IX | SM, GC | VII | Complex rock-fall, avalanche (V < 0.2×10⁶ m3) |
| 16 | Rio Cotzibal | IX | SM, GC | VIII | Rotational slump (V < 0.5×10⁶ m3) |
| 17 | Rio Los Cubes | IX | SM, GC, TL | VIII | Rock-fall avalanche (V < 0.1×10⁶ m3), Temp. Lake |
| 18 | Rio Naranjo | IX | SM, GC | VIII | Rotational slump (V < 0.3×10⁶ m3) |
| 19 | Rio Polima | IX | SM, GC | VIII | Block slides (V < 0.2×10⁶ m3); Temp. Lake |
| 20 | Rio Ruyalchè | IX | SM, GC | VIII | Rotational slump (V < 0.5×10⁶ m3) |
| 21 | Rio Teocinte | IV | SM, GC | VIII | Rotational slump, rock-fall avalanche (0.3 × 10⁶ < V < 0.5×10⁶ m3) |
| 22 | Lake Amatitlan (La Playa, El Sauza) | VIII | SM, L, GC, GS | V (VII) | Lateral spreads < 1 km; subsidence 1 m; ground cracks > 100 cm |
| 23 | Lake Atitlan (Panajachel) | VII | SM, L, GC, GS | V (VI) | Lateral spreads, small subaqueous landslides, subsidence 1 m |
| 24 | Los Amates | XI | Epicenter |
° Type of effects: SF, Surface Faulting; SM, Slope Movements (V volume in m3); GC, Ground Cracks; L, Liquefaction phenomena; GS, Ground Settlements; TL, temporary lake.
Table 4.
Localities affected by EEE (target sites) with the macroseismic evaluation according to the ESI scale, MMI scales, probabilistic PGA range at rock/soil site for crustal and “D3_G6” SZ and Deterministic Acceleration for rock/soil site.
Table 4.
Localities affected by EEE (target sites) with the macroseismic evaluation according to the ESI scale, MMI scales, probabilistic PGA range at rock/soil site for crustal and “D3_G6” SZ and Deterministic Acceleration for rock/soil site.
| ID | Town | ESI | MMI | Probabilistic Rock/Soil Crustal SZ [g] | Probabilistic Rock/Soil “D3_G6” SZ [g] | Deterministic Rock-Soil [g] |
|---|---|---|---|---|---|---|
| 1 | Cabanas | XI | VIII | 0.232–0.311 | 0.223–0.298 | 0.460–0.608 |
| 2 | Chuarrancho | XI | VIII | 0.308–0.411 | 0.131–0.176 | 0.464–0.614 |
| 3 | El Progreso | XI | VIII | 0.317–0.422 | 0.106–0.143 | 0.464–0.613 |
| 4 | Gualan | XI | IX | 0.289–0.386 | 0.131–0.176 | 0.463–0.612 |
| 5 | Quebradas | XI | VIII | 0.289–0.386 | 0.154–0.206 | 0.468–0.618 |
| 6 | Subinal | XI | VIII | 0.292–0.390 | 0.157–0.210 | 0.452–0.598 |
| 7 | Estancia della Virgen | X | VIII | 0.306–0.408 | 0.139–0.186 | 0.301–0.397 |
| 8 | San Martin Jilotepeque | X | VIII | 0.289–0.385 | 0.127–0.172 | 0.255–0.336 |
| 9 | San Jose Poaquil | X | VIII | 0.270–0.361 | 0.165–0.221 | 0.235–0.310 |
| 10 | Puerto Barrios | IX | IX | 0.273–0.365 | 0.173–0.232 | 0.224–0.295 |
| 11 | Finca San Carlos | IX | VIII | 0.300–0.400 | 0.134–0.180 | 0.174–0.230 |
| 12 | Guatemala City | IX | VIII | 0.311–0.415 | 0.126–0.169 | 0.198–0.262 |
| 13 | Los Choloyos | IX | VIII | 0.307–0.410 | 0.123–0.166 | 0.139–0.184 |
| 14 | Mixco | X | VIII | 0.262–0.350 | 0.123–0.166 | 0.241–0.318 |
| 15 | Rio Blanco | IX | VII | 0.229–0.306 | 0.223–0.298 | 0.456–0.604 |
| 16 | Rio Cotzibal | IX | VIII | 0.297–0.397 | 0.152–0.205 | 0.450–0.596 |
| 17 | Rio Los Cubes | IX | VIII | 0.301–0.402 | 0.146–0.196 | 0.210–0.277 |
| 18 | Rio Naranjo | IX | VIII | 0.297–0.396 | 0.146–0.196 | 0.248–0.327 |
| 19 | Rio Polima | IX | VIII | 0.243–0.325 | 0.178–0.238 | 0.272–0.358 |
| 20 | Rio Ruyalche | IX | VIII | 0.230–0.307 | 0.215–0.287 | 0.351–0.463 |
| 21 | Rio Teocinte | IX | VIII | 0.233–0.311 | 0.219–0.292 | 0.225–0.297 |
| 22 | Lake Amatitlan | VIII | VII | 0.239–0.320 | 0.187–0.251 | 0.143–0.189 |
| 23 | Lake Atitlan | VII | VII | 0.264–0.352 | 0.171–0.228 | 0.125–0.166 |
| 24 | Los Amate | XI | IX | 0.235–0.314 | 0.202–0.270 | 0.458–0.606 |
© 2019 by the authors. Licensee MDPI, Basel, Switzerland. This article is an open access article distributed under the terms and conditions of the Creative Commons Attribution (CC BY) license (http://creativecommons.org/licenses/by/4.0/).
Share and Cite
MDPI and ACS Style
Caccavale, M.; Sacchi, M.; Spiga, E.; Porfido, S. The 1976 Guatemala Earthquake: ESI Scale and Probabilistic/Deterministic Seismic Hazard Analysis Approaches. Geosciences 2019, 9, 403. https://doi.org/10.3390/geosciences9090403
AMA Style
Caccavale M, Sacchi M, Spiga E, Porfido S. The 1976 Guatemala Earthquake: ESI Scale and Probabilistic/Deterministic Seismic Hazard Analysis Approaches. Geosciences. 2019; 9(9):403. https://doi.org/10.3390/geosciences9090403
Chicago/Turabian StyleCaccavale, Mauro, Marco Sacchi, Efisio Spiga, and Sabina Porfido. 2019. "The 1976 Guatemala Earthquake: ESI Scale and Probabilistic/Deterministic Seismic Hazard Analysis Approaches" Geosciences 9, no. 9: 403. https://doi.org/10.3390/geosciences9090403
Note that from the first issue of 2016, this journal uses article numbers instead of page numbers. See further details here.