Detailed summaries of the geology, seismology, surface rupture and palaeoseismology for the eleven considered historical surface ruptures from 1968 to 2016 are available as seven EarthArXiv reports ([
120,
121,
122,
123,
124,
125,
126]). Figures and data in these reports include available geological maps, geophysical maps, borehole data, surface rupture maps, displacement data, and available palaeoseismic trench logs. In the process of reviewing available literature, a number of inconsistencies in data usage or reproduction were identified. These are summarized in
Section 4.1 of this paper, with more detail available in the EarthArXiv reports. Below is a concise summary of the seven reports (the three Tennant Creek ruptures are contained within a single report) with key data presented in
Table 3,
Table 4,
Table 5,
Table 6,
Table 7,
Table 8 and
Table 9 and
Figure 3,
Figure 4,
Figure 5,
Figure 6,
Figure 7,
Figure 8,
Figure 9 and
Figure 10, and provided as
Supplementary Data.
3.1. Geology
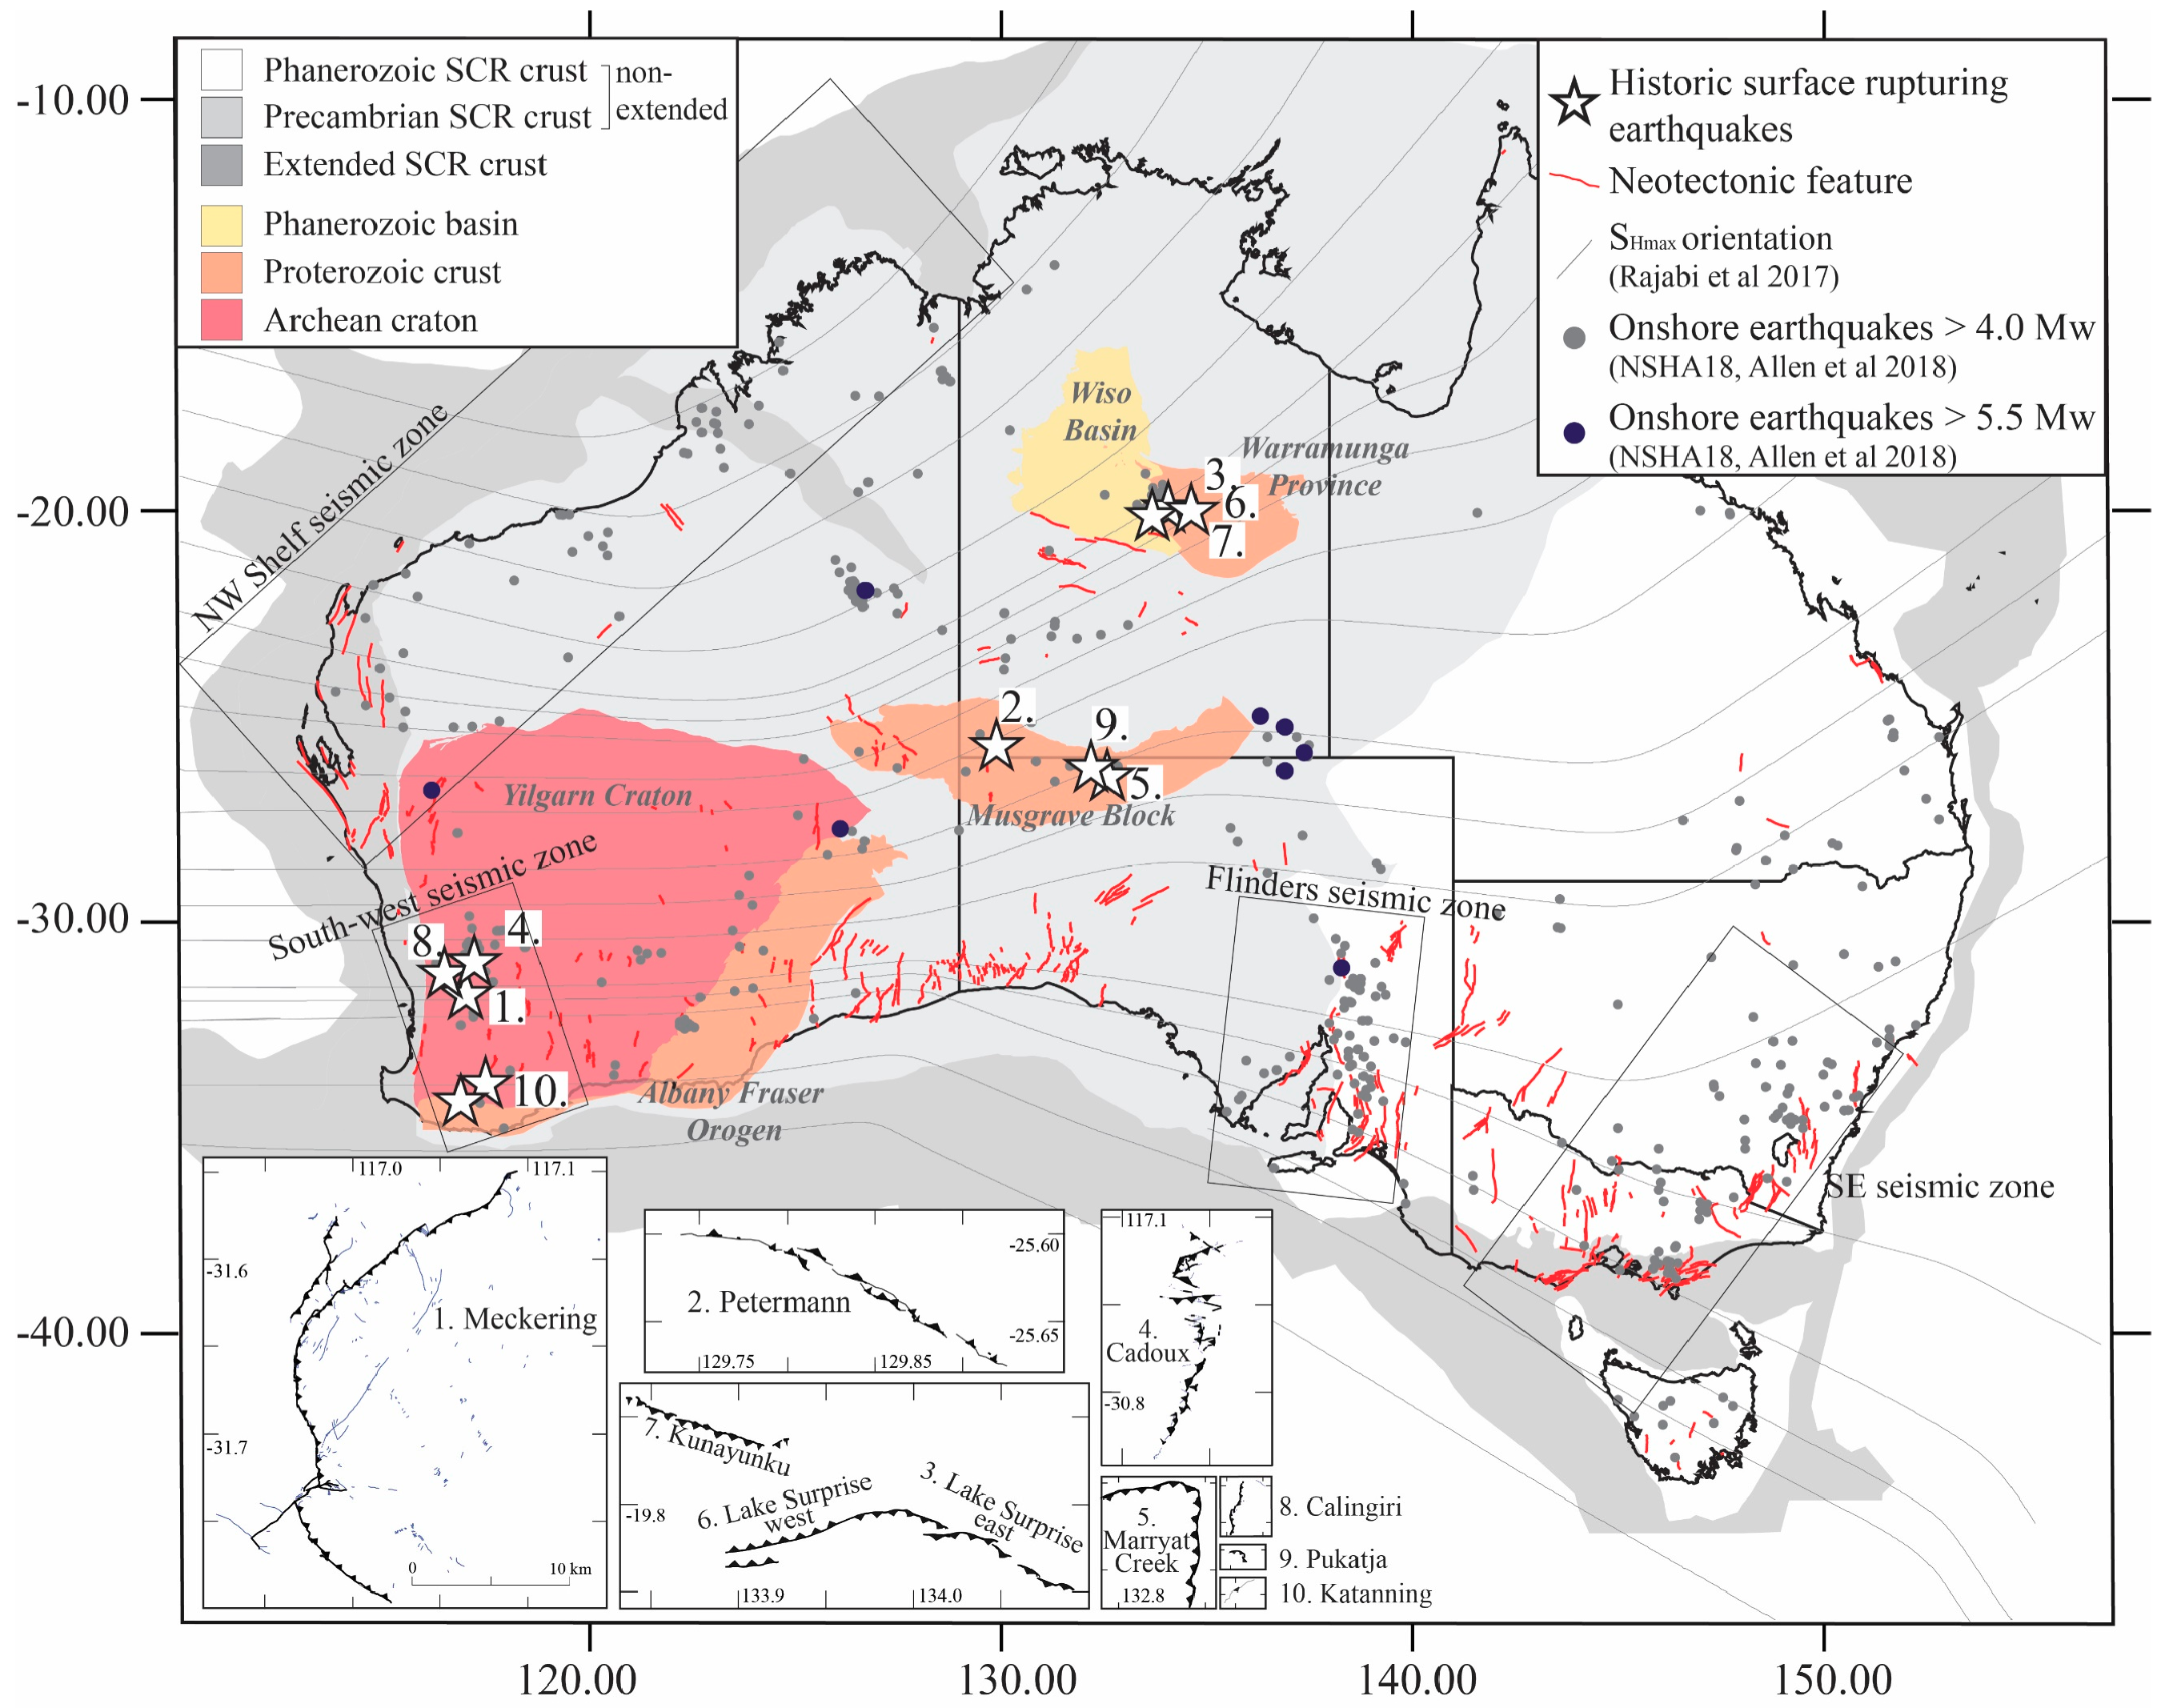
The Meckering, Calingiri, Cadoux, and Katanning events occurred in the Archean Yilgarn Craton within ~25 km of significant terrane boundaries (
Figure 1). The Lake Muir event occurred in the Albany-Fraser Orogen, <15 km south of the south dipping terrane boundary with the Yilgarn Craton (
Figure 1). The Marryat Creek, Pukatja and Petermann events occurred within the Mesoproterozoic Musgrave Block (
Figure 1) within 0–10 km of major terrane boundaries. The Tennant Creek ruptures extend across the boundary of the Proterozoic Warramunga Province and Neoproterozoic–Cambrian Wiso Basin (
Figure 1) (summary of all regional geology in
Table 3, comprehensive details in EarthArXiv reports [
120,
121,
122,
123,
124,
125,
126]).
Table 3.
Summary of regional geology for each historic surface rupture.
Table 3.
Summary of regional geology for each historic surface rupture.
| Rupture | Refs. | Geological Province | Nearby Regional Structure |
|---|
| Name | Age | Sub-Division | Name | Age | Geometry | Dist. from Rupture | Approx. Aligned? |
|---|
| Meckering | [33,91,108,127] | Yilgarn Craton | Archean | Jimperding Metamorphic Belt, Lake Grace Terrane | Boundary Lake Grace and Boddington Terranes | Archean | NW-SE, shallow E dipping suture | ~25 km on HW | Yes |
| Calingiri | [91,108,127] | Yilgarn Craton | Archean | Jimperding Metamorphic Belt, Lake Grace Terrane | Boundary Lake Grace and Boddington Terranes | Precambrian | NW-SE, shallow E dipping suture | ~10 km on HW | Yes |
| Cadoux | [91,108,127] | Yilgarn Craton | Archean | Archean greenstone | Boundary Murchison Terrane and Southern Cross Province | Archean | N-S | ~10 km? | Yes |
| Marryat Creek | [128,129,130,131] | Musgrave Block | Mesoproterozoic | Fregon Domain | Mann Fault | Neoproterozoic | ENE-WSW, ~1km wide suture | <0.5 km | Yes (part) |
| Kunayungku ^ | [66,68] | Wiso Basin | Neoproterozoic – Cambrian | – | – | – | – | – | – |
| Lake Surprise west ^ | [66,68] | Tennant Creek Region | Paleoproterozoic | Warramunga Province | – | – | – | – | – |
| Lake Surprise east ^ | [66,68] | Tennant Creek Region | Paleoproterozoic | Warramunga Province | – | – | – | – | – |
| Katanning, | [91,108,127] | Yilgarn Craton | Archean | Boddington Terrane | – | – | – | – | – |
| Pukatja | [128,129,130,131] | Musgrave Block | Mesoproterozoic | Fregon Domain | Woodroffe Thrust | Neoproterozoic | NE-SW, ~30° S, ~3 km wide suture | ~10 km on HW | No |
| Petermann | [116,128,129,130,131] | Musgrave Block | Mesoproterozoic | Fregon Domain | Woodroffe Thrust | Neoproterozoic | NW-SE, ~30° S, ~3 km wide suture | ~ 10 km on HW | Yes |
| Lake Muir | | Albany Fraser Orogen | Proterozoic | Biranup Zone | Boundary Yilgarn and Albany Fraser Orogen | Mesoproterozoic | E–W, S dipping, ~10–20 km wide shear zone | ~ 5–15 km on HW | No |
Granitic gneiss, migmatite, mylonite, granulite, and/or amphibolite basement rock is observed in trenches or outcrop at <1 m depth at multiple locations along the Petermann (
Figure 2), Pukatja, Marryat Creek (
Figure 2), Cadoux and Meckering ruptures. Proterozoic basement in the vicinity of the Tennant Creek ruptures is variably overlain by 10 s to 100 s of meters of Phanerozoic basin bedrock. Structural measurements (foliations, intrusive boundaries) for bedrock outcrops within 5 km of surface ruptures are qualitatively well-aligned to surface ruptures in eight of ten events, though dip measurements are only qualitatively well aligned in three cases. This may relate to dip measurement difficulties for heavily weathered bedrock. (Summary of basement/bedrock in
Table 4, comprehensive details in EarthArXiv reports [
120,
121,
122,
123,
124,
125,
126]).
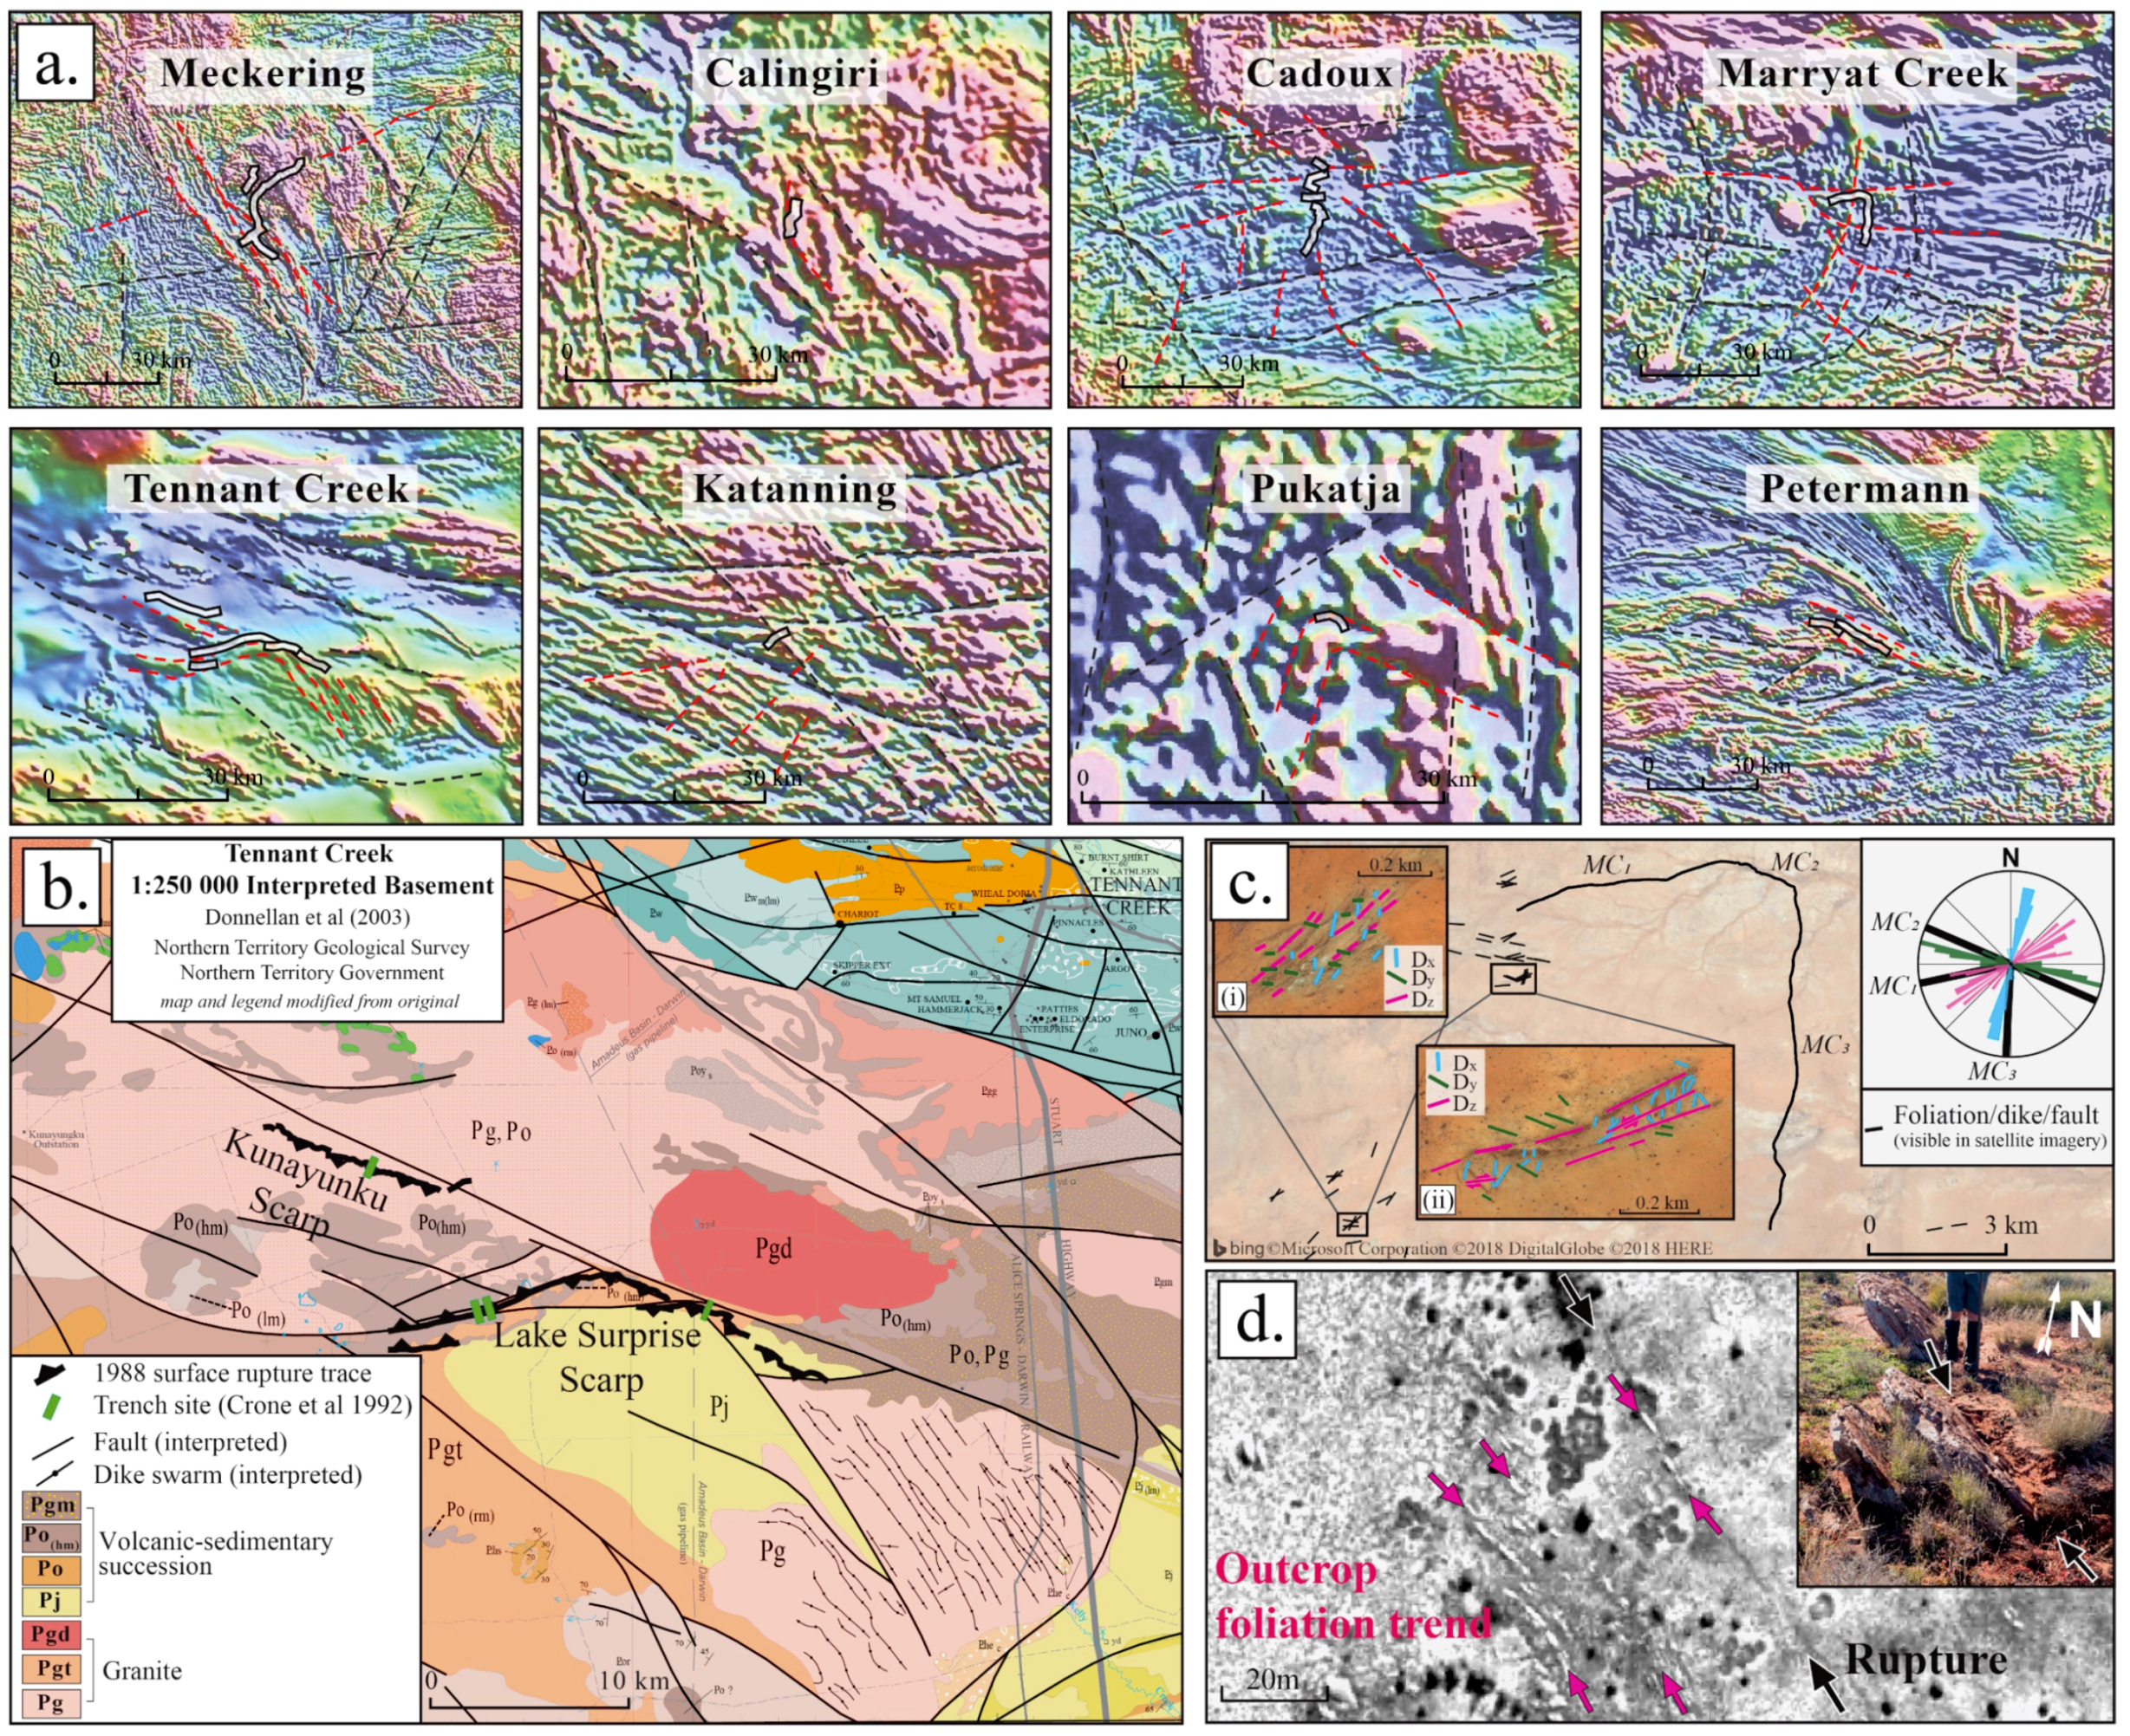
Nine of ten ruptures align with linear magnetic anomalies (
Figure 2) and six align with linear gravity anomalies/gradients. The Katanning rupture does not align with either gravity or magnetics at the scale of available geophysical data (
Figure 2,
Table 2), and the Lake Muir rupture was not studied in this paper (paper in review: [
79]). In cases where surface rupture traces are highly curved, arcuate, and/or segmented (Meckering, Marryat Creek, Tennant Creek, Pukatja), the distinctly-oriented rupture traces all align with distinct orientations of linear geophysical anomalies interpreted as faults, dikes, and lithological contacts (e.g., [
33]).
Figure 2.
Examples of the relationship between geophysical data and surface outcrop to historic ruptures (
a) national total magnetic intensity map with ruptures overlaid, and dashed lines indicating linear anomalies (
b) interpreted basement geology around the three Tennant Creek scarps (no basement outcrops at the surface) demonstrating strong correlation between intrusive/lithological boundaries, basement faults, and historic surface rupture (legend heavily simplified to show lithologies around the ruptures, more details in EarthArXiv report [
126] legend and original map. Map used under creative commons NT Gov) (
c) examples of surface outcrop structures visible in basement around the Marryat Creek rupture including three sets of dike/foliation/fault orientations coincident with the three major orientations of the historic rupture, uninterpreted satellite imagery insets (i) and (ii) available in Marryat Creek EarthArXiv report [
123] (
d) example of mylonite foliation orientation along a section of the Petermann rupture where outcrop occurs within the primary rupture zone.
![Geosciences 09 00408 g002]()
Table 4.
Degree of alignment between rupture, basement structures, and geophysical anomalies.
Table 4.
Degree of alignment between rupture, basement structures, and geophysical anomalies.
| Rupture | Refs. | Mapped Basement | Geophysics | Evidence of Basement Control on Rupture |
|---|
| Description | Depth (m) | Method * | Dominant Strikes | Alignment | Dips | Alignment | Mag. | Alignment | Gravity | Alignment | Y/N | Type # |
|---|
| Meckering | [16,25,33,114] | Granites, gneiss, mafic dikes | 0–20 | Geol. | NW, SW | Mod. | 55°–90° | Low | Yes | Very high | Part | Mod. | Y 1 | FLGS, VS, DG, FDGS |
| Calingiri | [25,114] | Migmatite, gneiss | 0–20 | Geol. | NE | High | 60°–90° | Low | Yes | High | Yes | High | Y | FL/FDG |
| Cadoux | [41,115] | Granite, gneiss, mafic dikes | 0–20 | Geol. + BH | N, NW, NE, W | High | 50°–90° | Mod.–High | Yes | Very high | Yes | Mod. | Y 2 | FLGS, VS, DG |
| Marryat Creek | [47,48,117] | Mylonite, gneiss, granite, mafic dikes | 0–5 | Geol. + BH | W, NNE, NE | Very high | – | – | Yes | Very high | Part | High | Y 3 | FLGS, FTGS, DGS |
| Kunayungku ^ | [50,51,52,66,68,132] | Schist, granite | 50+ | BH + Geo.Int. | NE | Very high | – | – | Yes | High | Yes | Very high | Y 4 | FTG |
| Lake Surprise west ^ | [50,51,66,68,132] | Metavolc., metased., granite | ?20+ | BH + Geo.Int. | NW | Very high | – | – | Yes | Very high | No | | Y 5 | FTG, LG |
| Lake Surprise east ^ | [50,51,66,68,132] | Metavolc., metased., granite | 50+ | BH + Geo.Int. | NE | Very high | – | – | Yes | Very high | Yes | High | Y | FTG, LG |
| Katanning, | [133] | Granite, gneiss | – | Geol. | NW | Very low | – | – | No | – | No | – | N | |
| Pukatja | [9] | Granite, gneiss | 0–10 | Geol. | NE | High | 30° | Very high | Yes | Very high | No | – | Y 6 | LGS, FLGS |
| Petermann | [73,128,134] | Mylonite | 0–10 | Geol. + BH | NW | Very high | 20°–50° | Very high | Yes | Very high | Yes | Very high | Y 7 | FLGS |
3.2. Seismology
The sparse nature of the Australian National Seismograph Network (
https://www.fdsn.org/networks/detail/AU/) results in large (i.e., ≥5–10 km) uncertainties in earthquake epicenter and hypocenter location estimates that are difficult to quantify, including those for the earthquakes studied here [
102]. Epicentral determinations (
Figure 3,
Figure 4,
Figure 5,
Figure 6,
Figure 7,
Figure 8,
Figure 9 and
Figure 10) are typically not sufficiently accurate to unambiguously associate with surface ruptures. Six of ten ruptures have favored epicenter locations that are located on the rupture hanging-wall, within approximated positional uncertainty bounds.
Many publications do not state statistical uncertainties for their epicenter locations. Uncertainties listed in
Table 5 include published uncertainties or an assigned value of ± 10 km where no uncertainties are available [
102]. Epicenters with lower uncertainties are derived using a variety of relocation methods including extra analysis (e.g., InSAR slip distributions, joint hypocenter determination) or extra data (e.g., surface rupture location, aftershocks from temporary seismometer arrays) (comprehensive details in EarthArXiv reports [
120,
121,
122,
123,
124,
125,
126]). The epistemic uncertainty relating to the quality of velocity models used to locate epicenters is unconstrainted but appears to be one of the major sources of inaccurate locations where instrumentation is particularly sparse. For instance, epicenters for Pukatja and Marryat Creek are located up to 17 and 30 km from the identified surface rupture respectively, showing large uncertainties still affecting remote earthquake locations between 1986–2012.
Hypocenters derived from mainshock instrumental data do not project onto rupture planes as defined by surface rupture for any of the studied events. Hypocentral depth estimates based on aftershock data and relocated epicenter locations suggest depths of <5 km (for Tennant Creek [
59], Petermann [
73] and Meckering [
37]). Centroid moment tensor depths are <6 km depth, with the authors’ preferred best-fits all <4 km depth (Meckering [
26,
27,
28]; Cadoux [
28]; Marryat Creek [
28]; Tennant Creek [
55]; Katanning [
70]; Petermann [
74]).
Epicentral location uncertainties limit the study of rupture propagation directions(s) for most events. Model scenarios for the Meckering earthquake support a bilateral rupture [
37]. Unilateral upwards propagation has been proposed for the first Tennant Creek mainshock, complex propagation in the second mainshock, and unilateral upwards propagation to the Southeast in the third mainshock (all on separate faults) [
57].
Seven of ten events show foreshock activity within six months and 50 km of the mainshock epicenter and six of ten show instrumentally recorded prior seismicity (more than five events within 10 years and 50 km). Precise locations are difficult to obtain due to epistemic and statistical uncertainties, particularly for assessing seismicity prior to 1980 due to sparse instrumentation [
102]. Aftershock data are inherently incomplete for most events due to sparse instrumentation. However, temporary seismometers were deployed following most events and magnitude completeness from the national network is >3.0 Mw for all events [
102] (though, the locations of these events are generally highly uncertain compared to the temporary arrays, as discussed above). The Musgrave block events (Marryat Creek, Pukatja, Petermann,
Figure 1,
Table 3) show less aftershock activity in comparison to the Tennant Creek and Western Australia earthquakes (Meckering, Calingiri, Cadoux) which had extended aftershock sequences [
5,
34].
Table 5.
Summary of seismological data and interpretations for each rupture.
Table 5.
Summary of seismological data and interpretations for each rupture.
| Rupture | Refs. | Published Epicenters | Located on Hanging-Wall | Hypocenter Depth 1 (km) | Focal Mechanisms | Rup. Propagation | Foreshocks 4 | Prior Seismicity 5 |
|---|
| N= | Uncert. 2 (km) | Initial | Relocated | Range | Uncert. | N= | CMT Depth 3 (km) | Dip Range | Strike Corr. with Rupture? |
|---|
| Meckering | [11,12,15,18,23,24,25,26,28,90] | 8 | ~10 | 1 | 2 | 2.5–13 | 1–10 km | 4 | 1.5–3 | 29°–45° | Yes | Bilateral | Yes | Yes |
| Calingiri | [11,23,25,38] | 2 | ~10 | 0 | 1 | 1–15 | >5 | 1 | | 50° | Yes | Unknown | Yes | Yes |
| Cadoux | [11,28,40,41,43] | 6 | ~10 | N/A 6 | N/A 6 | 3–15 | >5 | 4 | 4–6 | N/A 6 | Part 6 | Unknown | Yes | Yes |
| Marryat Creek | [11,28,46,47,88] | 7 | >10 | 0 | 1 | 5–19 | >5 | 3 | 0–3 | 35°–67° | Part | Unknown | No | No |
| Kunayungku ^ | [11,55,57,60,61,63] | 4 | 2–10 | ? | 0 | 5–6.5 | 1–4 | 4 | 2.7 | 35°–55° | Yes | Unilateral | Yes | Yes |
| Lake Surprise west ^ | [11,55,57,60,61,63] | 4 | 2–10 | ? | 2 | 3–4 | 0.5–3 | 4 | 3.0 | 38°–70° | Part 7 | Unknown | Yes | Yes |
| Lake Surprise east ^ | [11,55,57,60,61,63] | 4 | 2–10 | ? | 4 | 4.5–5 | 0.5–3 | 4 | 4.2 | 36°–45° | Yes | Unilateral | Yes | Yes |
| Katanning, | [70] | 3 | 0.04–5 | 0 | 2 | <1 | | 1 | | 43° | Yes | Unknown | No | No |
| Pukatja | [9,11] | 6 | >10 | 0 | 1 | 4–12 | 5? | 3 | | 45°–72° | Yes | Unknown | No | No |
| Petermann | [73,74,75] | 6 | 2.5–8 | 4 | 2 | 1–10 | > 5 | 4 | 1–2 | 26°–52° | Yes | Unknown | yes | No |
3.3. Surface Ruptures
Methods for the original mapping of individual ruptures are summarized in
Table 6 and give some indication of data quality (explored in more detail in EarthArXiv reports [
120,
121,
122,
123,
124,
125,
126]). Some readjustment of terminology and classification is required when considering the earlier ruptures (e.g., ‘fault’ may refer to both primary rupture and secondary fractures) and considerable detail of rupture morphology was lost between fine-scale (i.e., 1:500) and whole rupture (1:25,000–1:50,000) for pre-digital maps (Meckering to Tennant Creek). Six of ten ruptures are concave relative to the hanging-wall, three are straight and one is slightly convex (Petermann) (
Table 6). All ruptures are reverse, and only two events have surface measurements consistent with secondary lateral movement (Meckering: dextral; Calingiri: sinistral;
Table 6, explored in individual EarthArXiv reports [
120,
121,
122,
123,
124,
125,
126]).
Nine of ten ruptures studied (Katanning was excluded due to lack of field mapping) show a relationship between surface sediments/bedrock depth to rupture morphology. Discrete rupture and duplexing rupture are more common where bedrock is close to the surface or surface sediments are predominately calcrete/ferricrete/silcrete. Where sands dominate in the surface sediments, rupture tends to present as warping and folding, or correspond with breaks in visible surface rupture (e.g., Petermann: morphology explored in individual EarthArXiv report [
125])).
Figure 3,
Figure 4,
Figure 5,
Figure 6,
Figure 7,
Figure 8,
Figure 9 and
Figure 10 show digitized versions of published primary ruptures, secondary fracturing, and dip values measured at the surface. Primary sources inconsistently derive published length values to describe their mapped rupture (
Table 1 and
Table 6; explored in detail in EarthArXiv reports [
120,
121,
122,
123,
124,
125,
126]) which are then used in secondary sources including scaling relationships. This includes simplifying scarps to straight lengths (Calingiri, Cadoux, Marryat Creek), capturing along-rupture complexity to varying degrees (Pukatja, Tennant Creek), excluding segments that have length, offset and morphology characteristics of primary rupture (Meckering, Tennant Creek, Cadoux), and reporting InSAR derived lengths rather than visible rupture (Katanning). (Explored in more detail in individual EarthArXiv reports [
120,
121,
122,
123,
124,
125,
126]).
Measurements of rupture length in the past have been inconsistent in their approach. Here, we re-classify mapped primary ruptures from original primary sources in order to generate a consistent rupture length dataset (
Table 6). We simplify ruptures to straight lines and define new faults where mapped primary rupture has gaps/steps > 1 km and/or where strike changes by > 20° for distances > 1km [
135]. The Splinter and Burges scarps (Meckering), Lake Surprise west foot-wall scarp (Tennant Creek), and individual Cadoux scarps were not included in original published lengths. These features show offsets, lengths, and locations consistent with primary slip along basement structures proximal to the main scarps, and therefore we include them in our length values.
Where InSAR is available (Katanning and Petermann) we present fault lengths described by both visible rupture and InSAR (
Table 6). Visible rupture in the Petermann event was highly segmented due to ineffective rupture propagation through sand dunes up to six metres high [
73]. Due to this we apply a slightly altered set of criteria to this event, faults are defined where strike of visible rupture and InSAR changes by > 20° and/or where steps in InSAR and visible rupture are > 1 km (
Figure 10) [
75,
78].
Under these criteria seven of ten ruptures have more than one source fault defined (i.e., a multi-fault rupture). The total length of faulting is the same as published values for two events, increases by 2%–51% for four events relative to published length, and decreases by 4%–60% for three events (
Table 1 and
Table 6). These lengths describe primary surface ruptures in a consistent way, accounting for all segments of rupture which show evidence of slip along basement structures. Our preferred length for each rupture, including uncertainties, is presented in
Table 1 and
Table 6.
Table 6.
Summary of surface measurements for each rupture.
Table 6.
Summary of surface measurements for each rupture.
| Rupture | Refs. | Method 3 | Shape 4 | Published | Simplified Faults 1 | Preferred: | Displacement 2 (m) | Disp. Profile Shape 6 |
|---|
| Length (km) | Kin. | Dip Range | N= | Sum Length (km) | % Diff. Publ. | Length (km) | Dip | Max Vert. Disp. | Avg. Vert. Disp. 5 | % Diff. | Max Net Slip | Avg. Net Slip 5 | % Diff |
|---|
| Meckering | [25] | FW; A; SB | CC | 37 | R(D) | 15–54° | 4 | 44.4 | +20% | 40 ± 5 | 35° ± 10 | 1.98 | 0.97 | 51% | 3.7 | 1.78 | 52% | S. Tg. |
| (Splinter) | [25] | | | 9 | R | 24–42° | 3 | 0.67 | 0.22 | 67% | 1.34 | 0.44 | 67% | AS. Tg. |
| Calingiri | [25] | FW | S | 3.3 | R(S) | 12–31° | 1 | 3.3 | 0% | 3.3 ± 0.2 | 20° ± 10 | 0.38 | 0.15 | 61% | 1.26 | 0.46 | 63% | AS. Tg. |
| Cadoux | [41] | FW; A; SB | CC/S | 14 | R | 20–80° | 6 | 20.6 | +47% | 20 ± 5 | 60° ± 30 | 1.4 | 0.35 | 75% | 1.79 | 0.45 | 75% | AS. Tg. |
| Marryat Creek | [48] | FW; A; SC | CC | 13 | R | 36–60° | 3 | 13.6 | +4% | 13 ± 1 | 40° ± 10 | 0.9 | 0.21 | 77% | 1.07 | 0.31 | 71% | Avg. |
| Kunayungku | [63] | FW; A; SC | S | 10.2 | R | 58° | 1 | 8.6 | −15% | 9 ± 1 | 40° ± 5 | 0.9 | 0.36 | 60% | 1.41 | 0.55 | 61% | S. Tg |
| Lake Surprise west | [63] | FW; A; SC | CC | 6.7 | R | 65–84° | 1 | 10.1 | +51% | 9 ± 2 | 60° ± 10 | 1.13 | 0.45 | 60% | 2.26 | 0.84 | 63% | AS. Sine |
| (LS west foot-wall) | [63] | | | 3.1 | R | | 1 | 0.74 | 0.43 | 42% | 1.16 | 0.9 | 22% | Avg. |
| Lake Surprise east | [63] | FW; A; SC | CC | 16 | R | 28–30° | 2 | 15.3 | −4% | 16 ± 0.5 | 35° ± 5 | 1.8 | 0.61 | 66% | 3.6 | 1.23 | 66% | Avg |
| Katanning (visible) 7 | [70,71] | | S | 0.3 | R | | 1 | 0.3 | 0 % | 0.5 ± 0.5 | 40° ± 5 | 0.1 | | | | | | |
| Katanning (InSAR) | [70] | In. | | 2.5 8 | | | 1 | 2.2 | −12% | 0.28 | 0.1 | 50% | 0.32 * | 0.2 * | 38% | AS. Tg. |
| Pukatja | [9] | FW | CC | 1.6 | R | 22–28° | 1 | 1.0 | −60% | 1.3 ± 0.3 | 30° ± 10 | 0.48 | 0.12 | 75% | 0.96 | 0.25 | 74% | AS. Sine |
| Petermann (visible) | [73,77] | FW; SC; In; D; SI | CV | 20 | R | 25–36° | 3 | 21 | +5% | 21 ± 0.5 | 30° ± 5 | 0.96 | 0.2 | | 1.92 | 0.42 | 78% | Avg. |
| Petermann (InSAR) | [73] | In. | | 21 | | | 2 | 21.5 | +2% | | | | | | | |
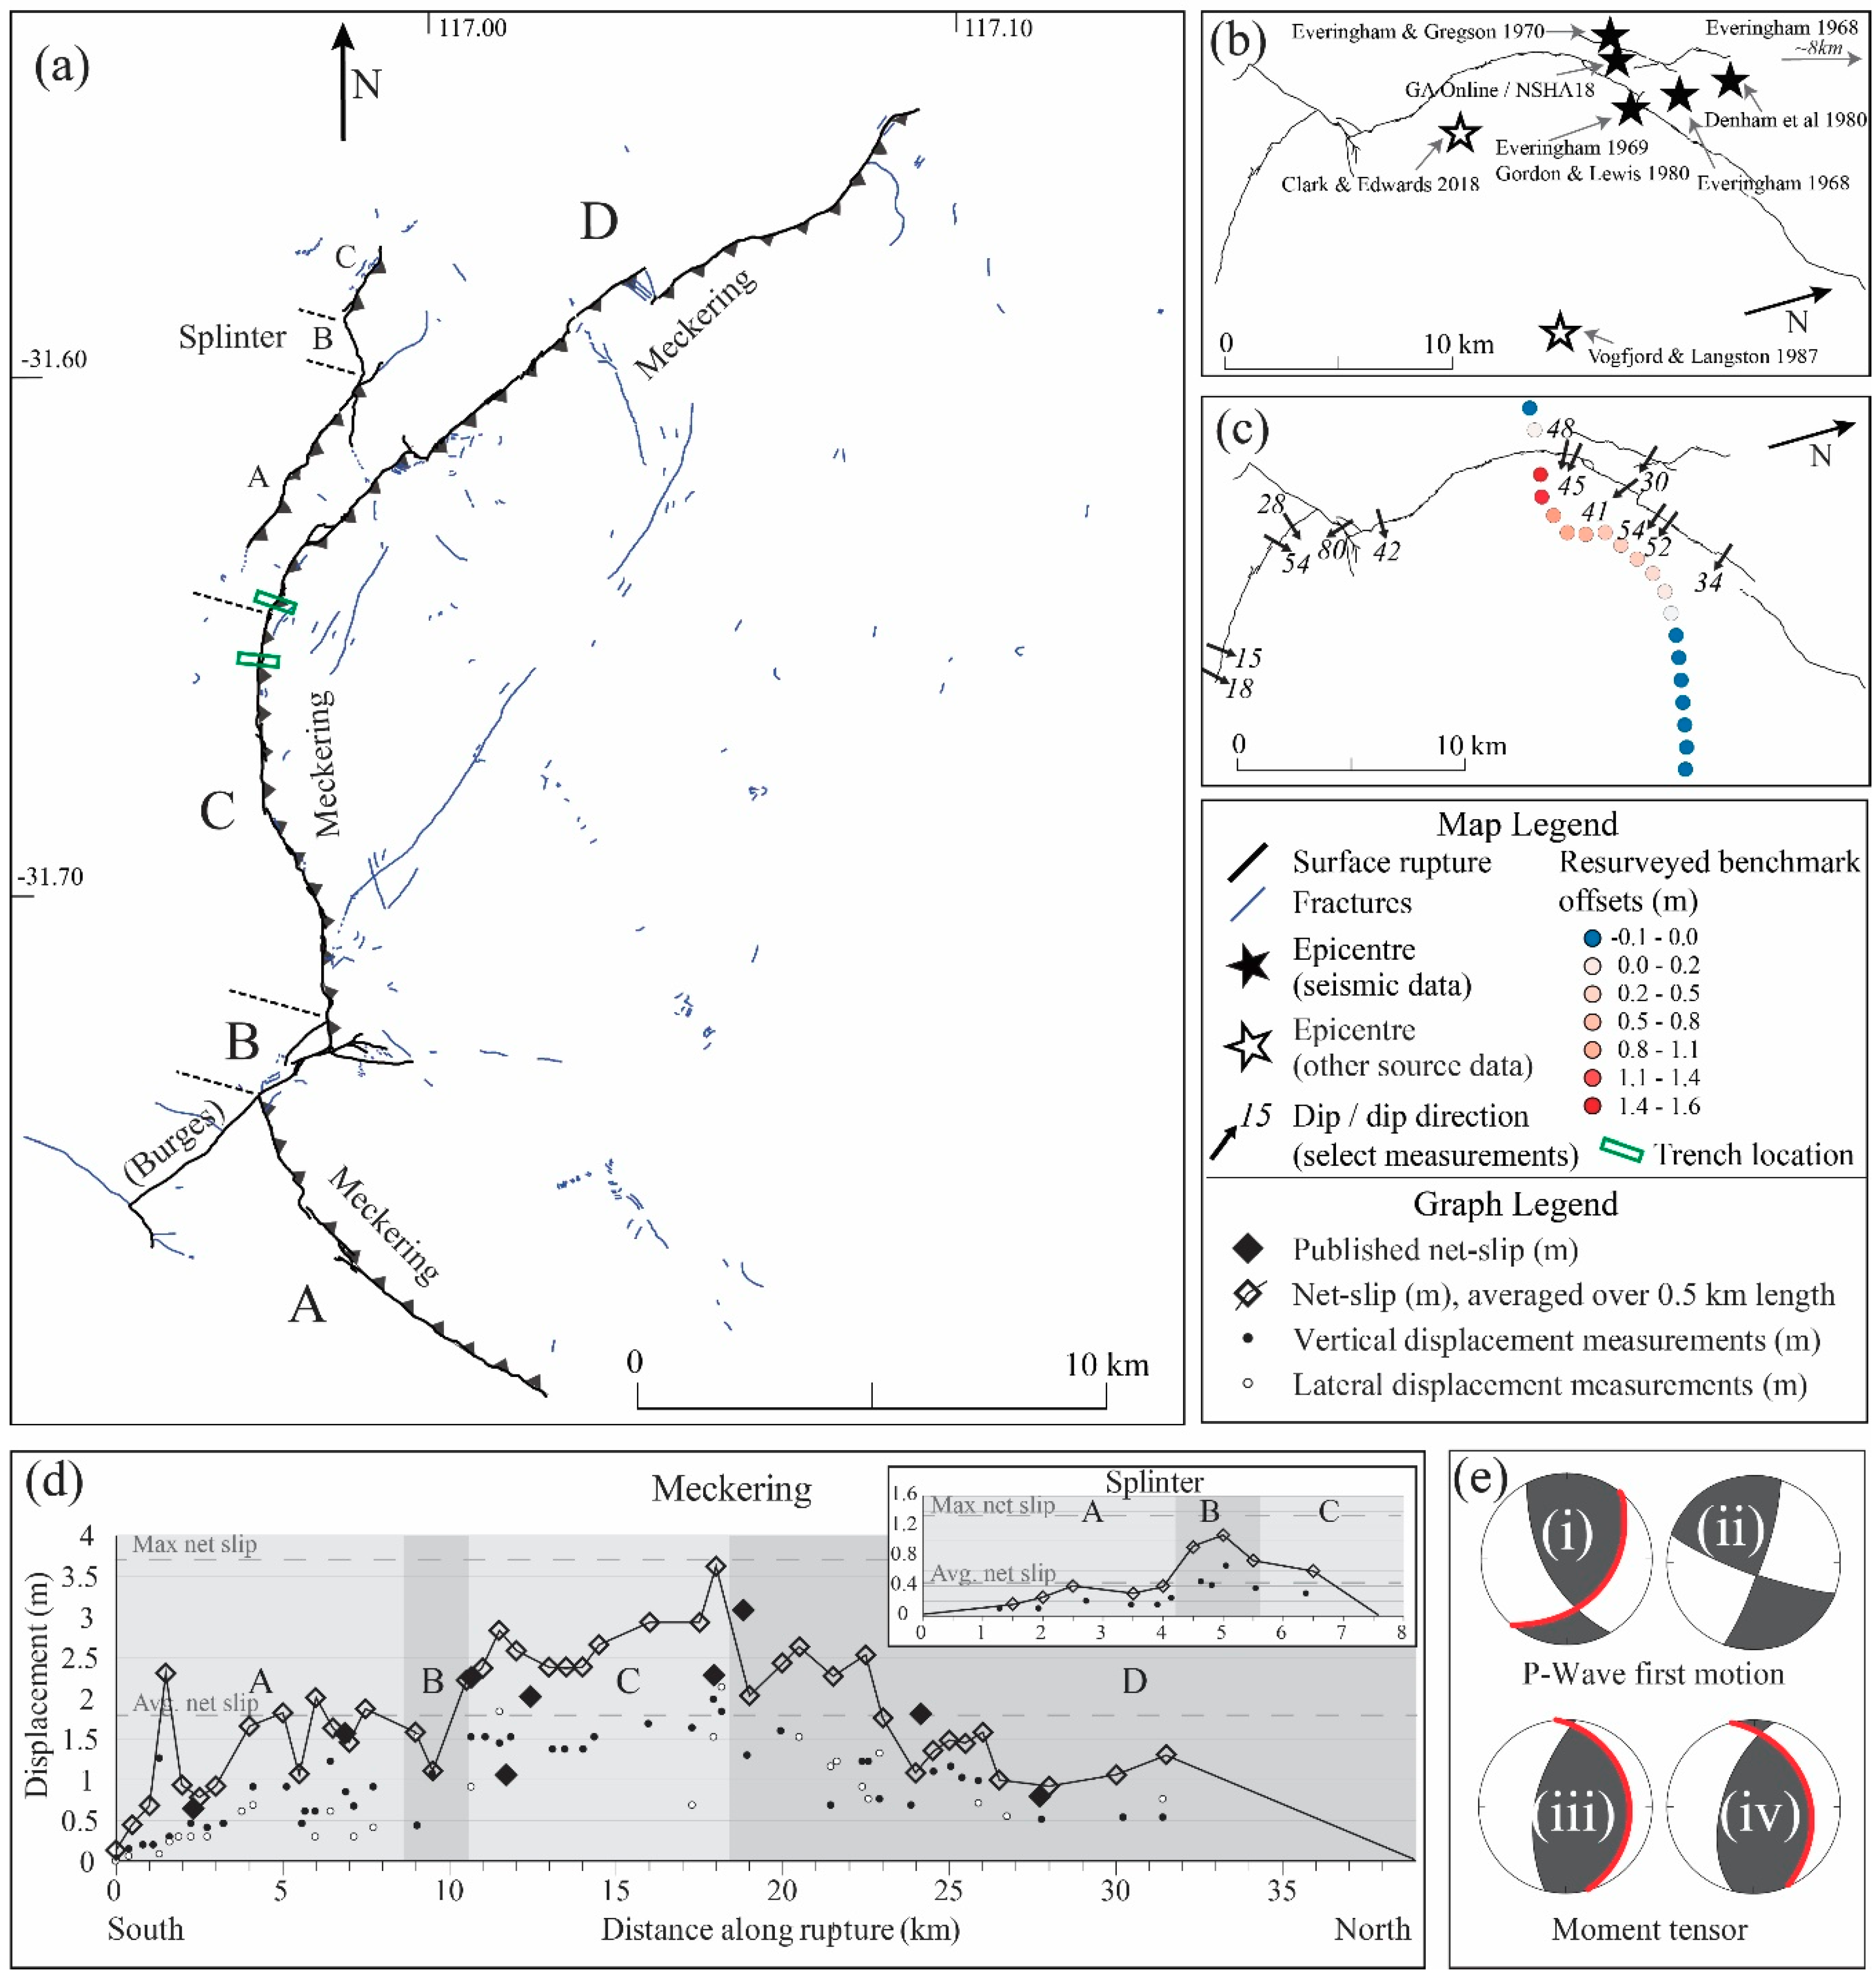
Figure 3.
1968 Mw 6.6 Meckering earthquake (
a) rupture and fracture map of Meckering and Splinter scarps [
25] with faults labelled as per displacement graphs, trench location from [
37] (
b) published epicenter locations, open stars show approximate locations of epicenters without published coordinates (
c) selected dip measurements of scarp and displacement of resurveyed road bench marks [
25] (
d) graphs of along-rupture vertical and lateral displacement measurements and net slip calculations [
25] and net slip calculated from available data averaged over 0.5 km increments (this study) (
e) focal mechanisms (red line shows preferred plane from original publication) from (i) Fitch et al., 1973, (ii) Fitch et al., 1993 & Leonard et al., 2002, (iii) Fredrich et al., 1988, and (iv) Vogfjord and Langston 1987.
Figure 4.
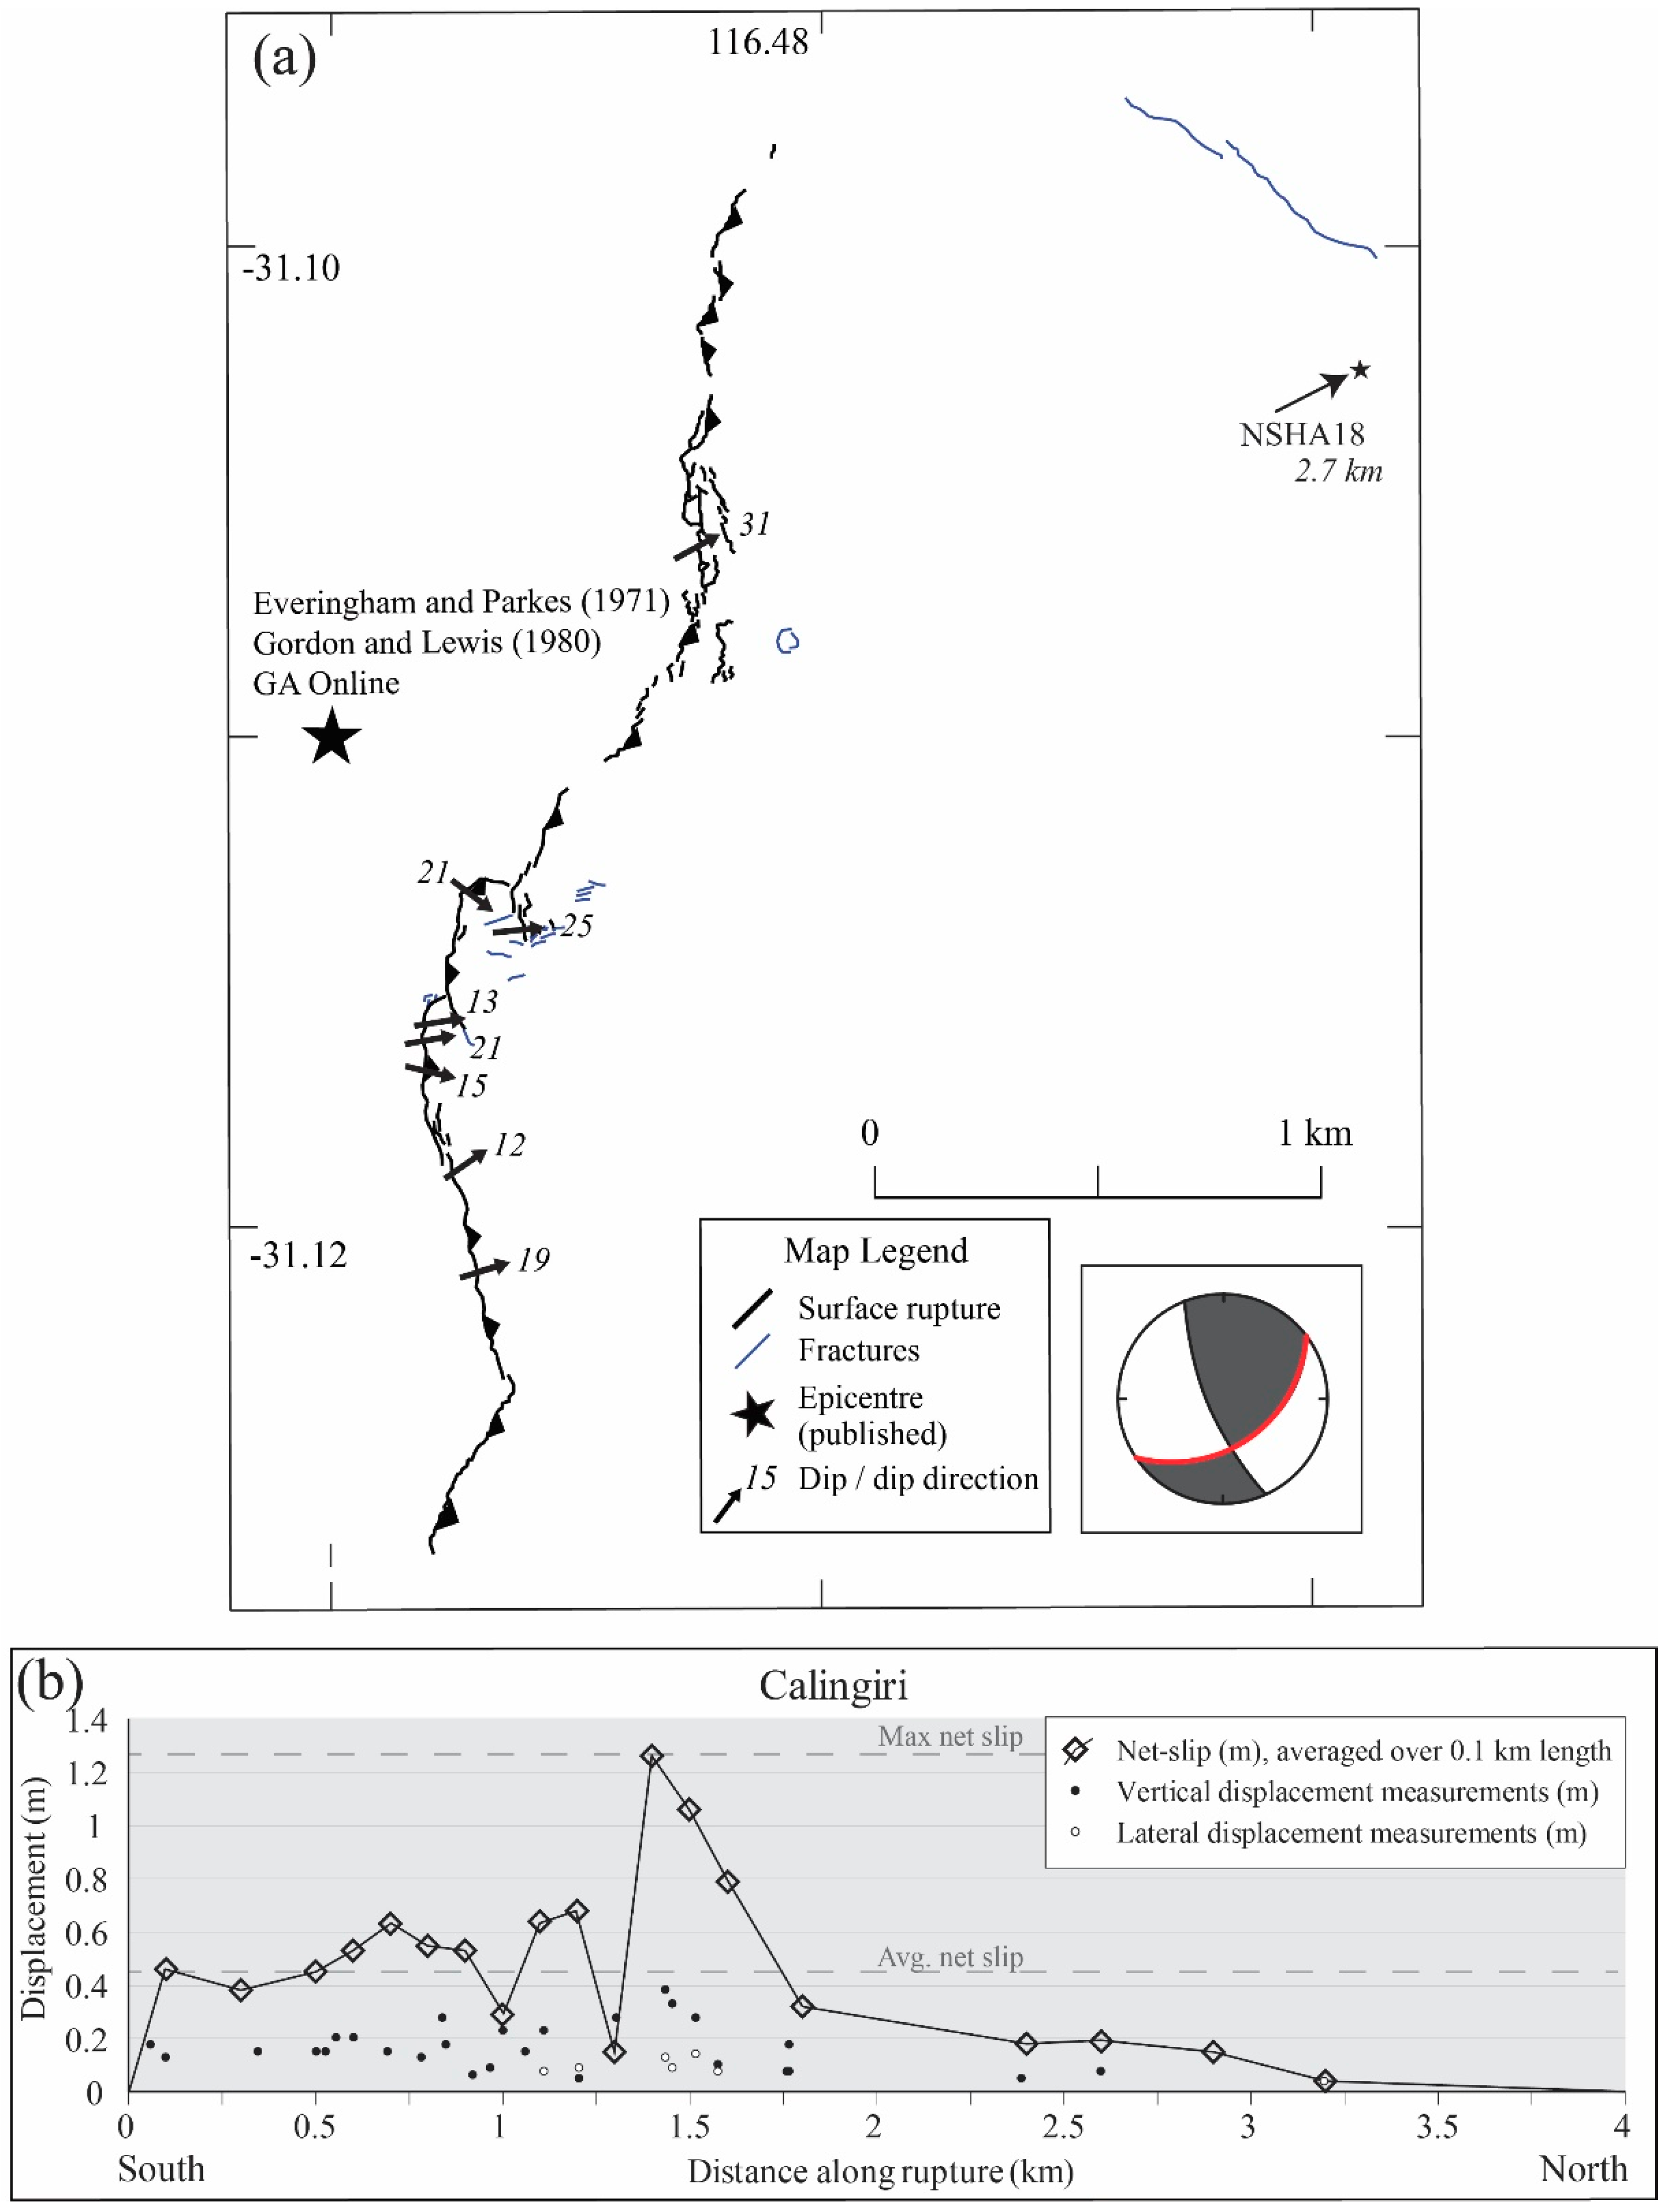
1970 Mw 5.0 Calingiri earthquake (
a) rupture and fracture map of Calingiri [
25] showing published epicenter locations and dip measurements of scarp [
25], focal mechanism (red line shows preferred plane from original publication) from Fitch et al., 1973 (
b) graph of along-rupture vertical and lateral displacement measurements [
25] and net slip calculated from available data averaged over 0.1 km increments (this study).
Figure 4.
1970 Mw 5.0 Calingiri earthquake (
a) rupture and fracture map of Calingiri [
25] showing published epicenter locations and dip measurements of scarp [
25], focal mechanism (red line shows preferred plane from original publication) from Fitch et al., 1973 (
b) graph of along-rupture vertical and lateral displacement measurements [
25] and net slip calculated from available data averaged over 0.1 km increments (this study).
Figure 5.
1979 Mw 6.1 Cadoux earthquake (
a) rupture scarps and fracturing involved in the Cadoux rupture with named faults [
41], focal mechanisms from (i) Denham et al., 1987 (ii) Fredrich et al., 1988 (iii) Everingham and Smith (unpublished, Lewis et al., 1981) (iv) CMT (
b) available dip measurements, black where directly measured and grey were calculated based on available displacement measurements [
41] (
c) published epicenter locations (
d) graph along-rupture of vertical and lateral displacement measurements and calculated net slip [
41] and net slip calculated from available data averaged over 0.5 km increments (this study).
Figure 6.
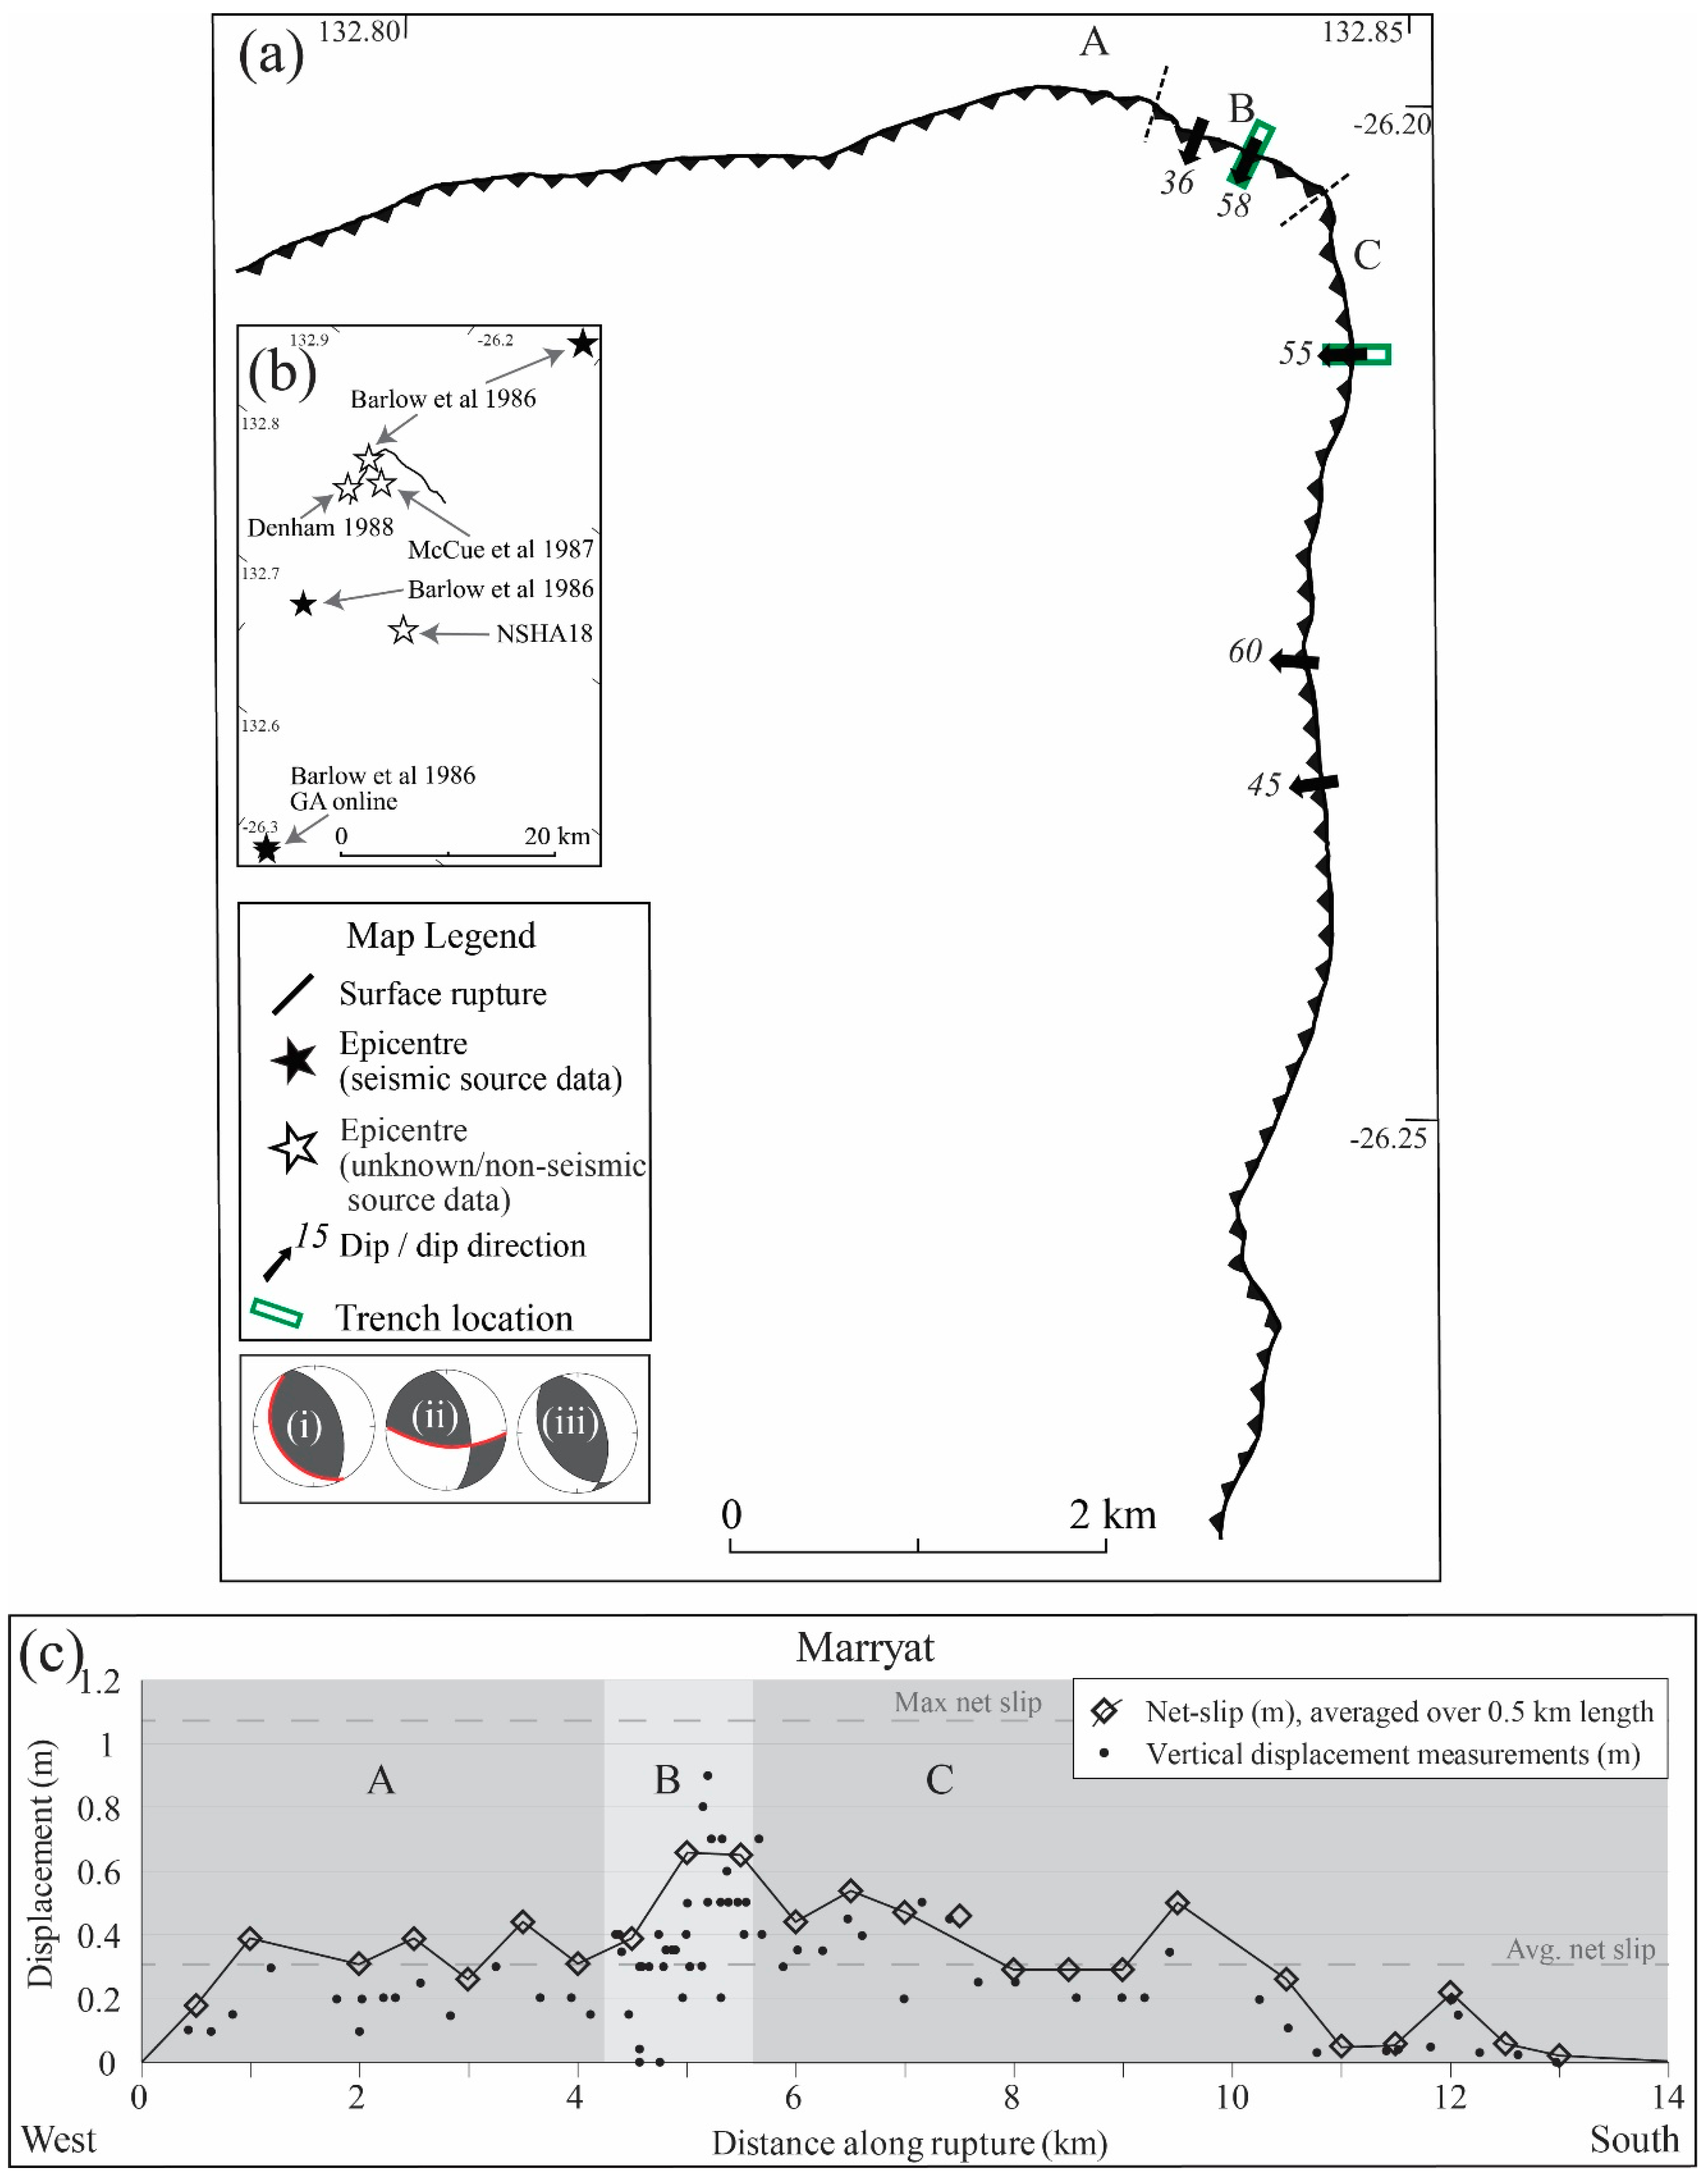
1986 Mw 5.7 Marryat Creek earthquake (
a) rupture and fracture map of Marryat Creek scarp and available dip measurements [
48,
118] with faults labelled as per displacement graphs, focal mechanisms (red line shows preferred plane from original publication) from (i) Fredrich et al., 1968, (ii) Barlow et al., 1986, (iii) CMT, trench location from [
118], (
b) published epicenter locations, and (
c) graph of along-rupture vertical and lateral displacement measurements [
48] and net slip calculated from available data averaged over 0.5 km increments (this study).
Figure 6.
1986 Mw 5.7 Marryat Creek earthquake (
a) rupture and fracture map of Marryat Creek scarp and available dip measurements [
48,
118] with faults labelled as per displacement graphs, focal mechanisms (red line shows preferred plane from original publication) from (i) Fredrich et al., 1968, (ii) Barlow et al., 1986, (iii) CMT, trench location from [
118], (
b) published epicenter locations, and (
c) graph of along-rupture vertical and lateral displacement measurements [
48] and net slip calculated from available data averaged over 0.5 km increments (this study).
Figure 7.
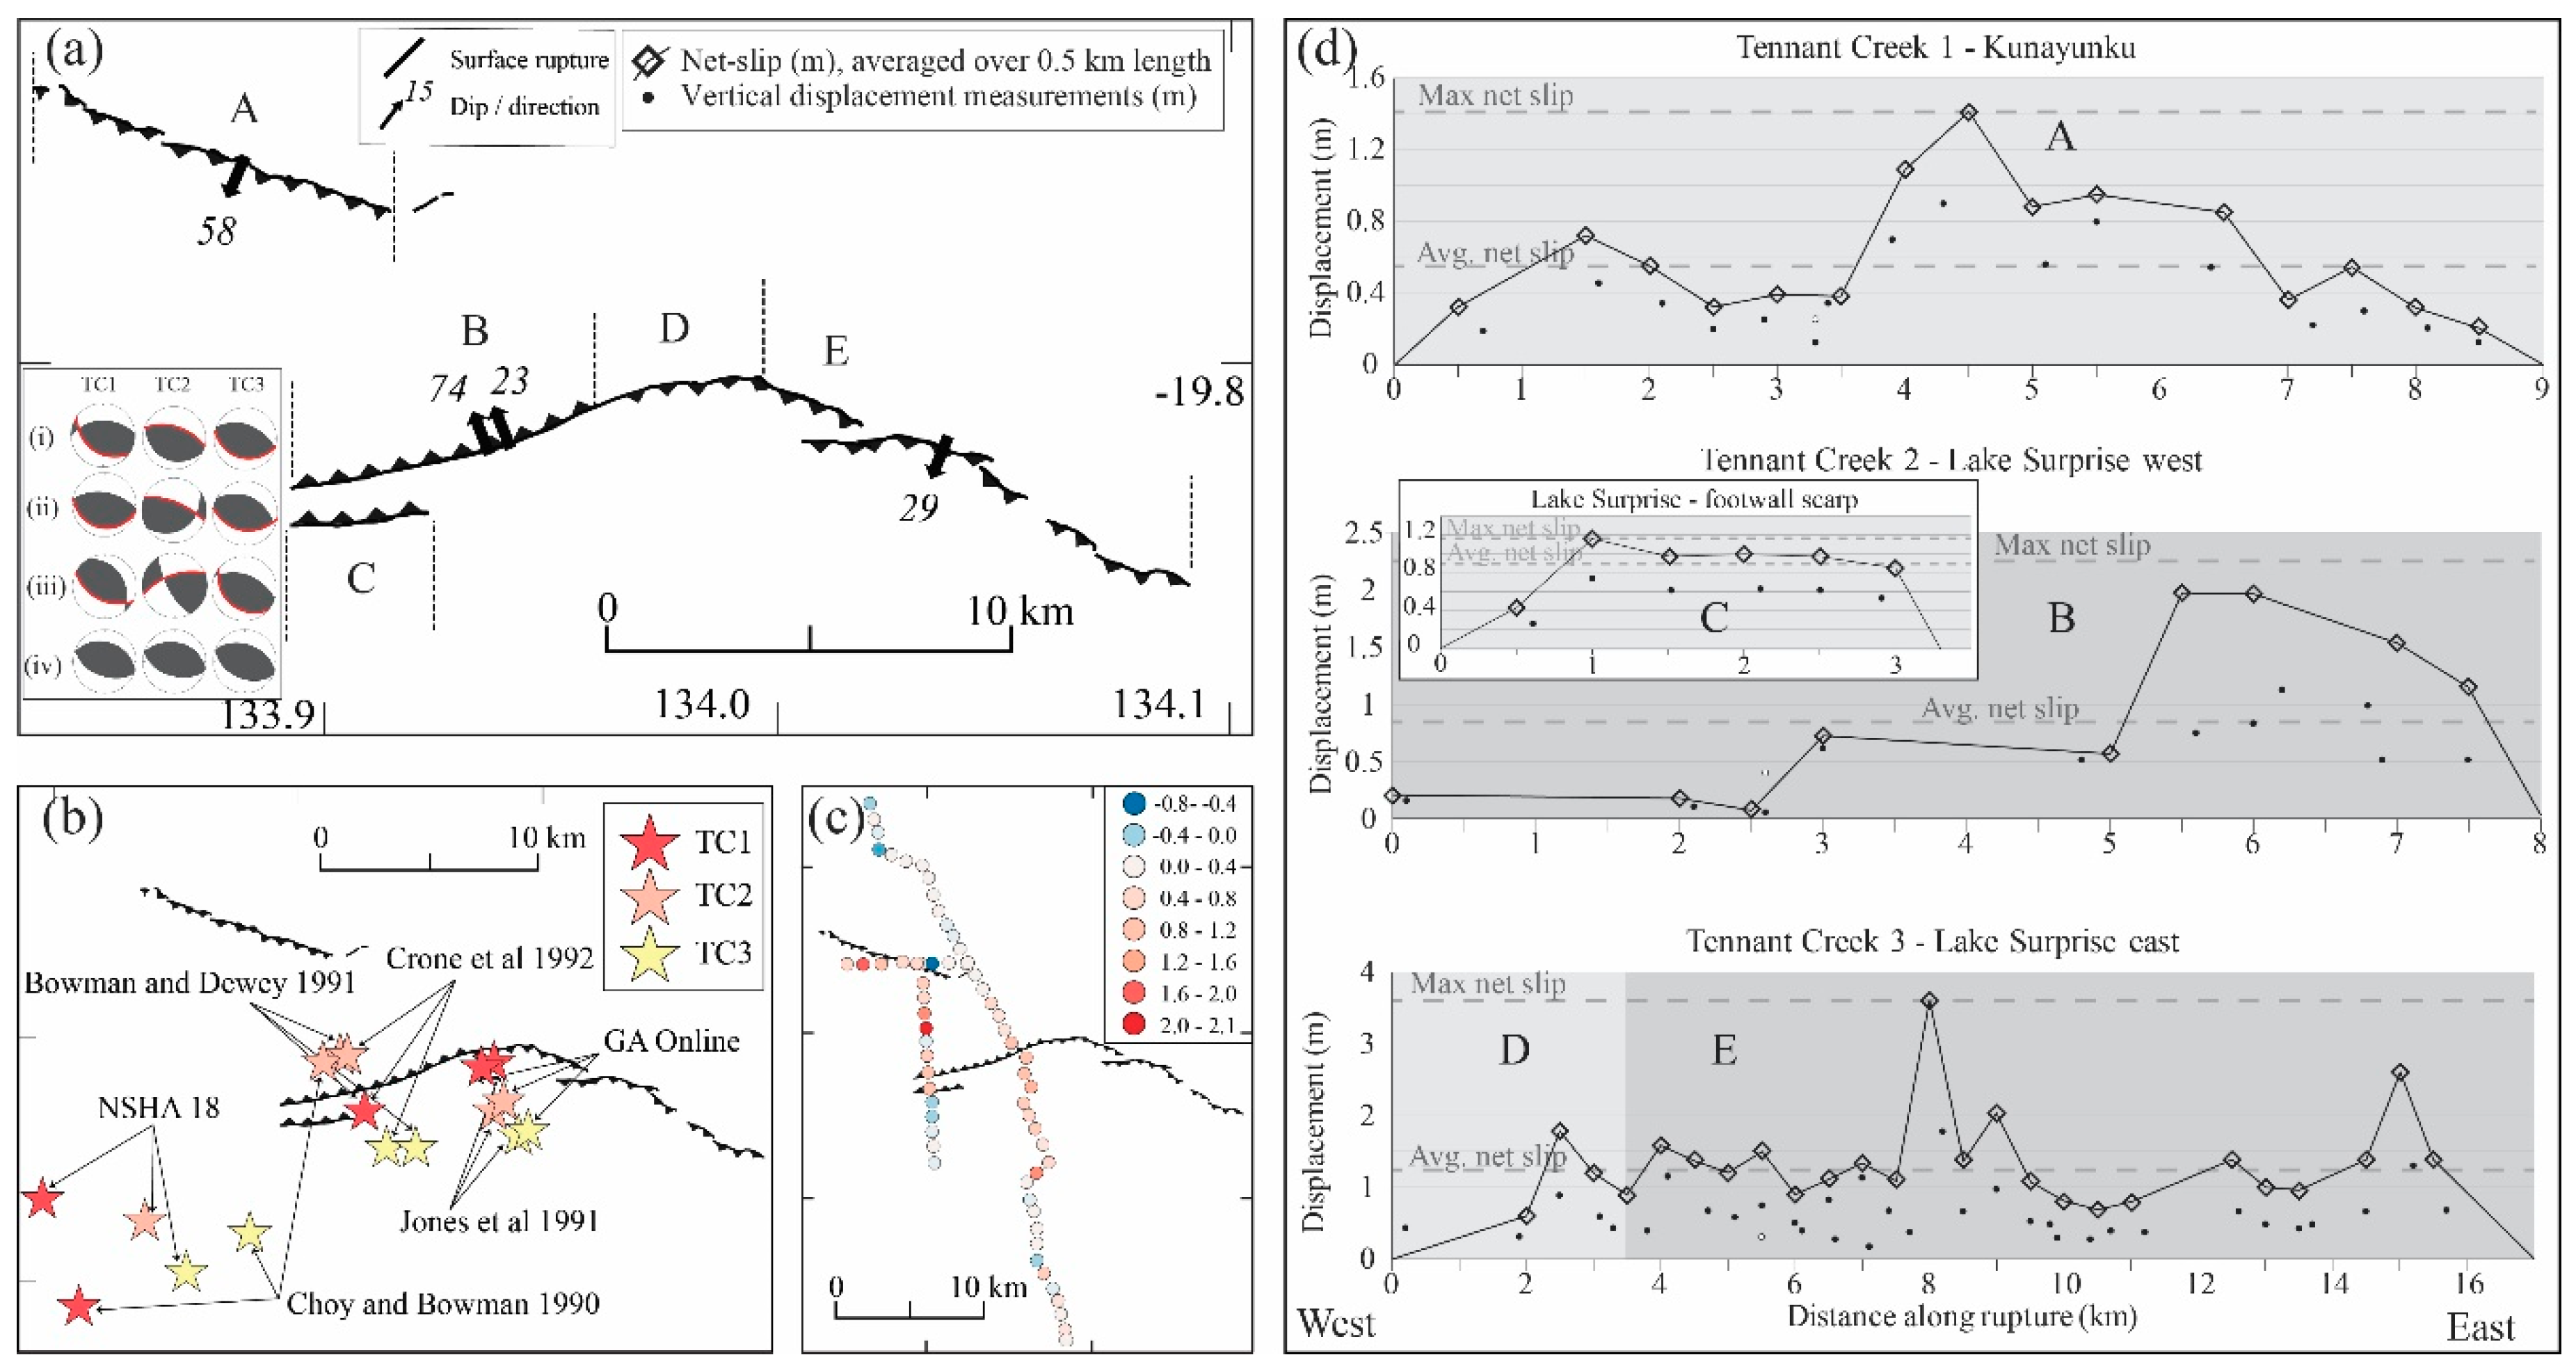
1988 Mw 6.3 (TC1), 6.4 (TC2) and 6.6 (TC3) Tennant Creek earthquakes (
a) rupture and cracking map of Kunayungku and Lake Surprise scarps with available dip measurements also the locations of trenches from [
63] with faults labelled as per displacement graphs, focal mechanisms (red line shows preferred plane from original publication) from (i) McCaffrey 1989, (ii) Choy and Bowman 1990, (iii) Jones et al., 1991, (iv) CMT, (
b) published epicenter locations of all three mainshocks (
c) resurveyed benchmark offsets [
63] uncertainties as discussed in text, and (
d) graphs of along-rupture vertical and lateral displacement measurements [
63] and net slip calculated from available data averaged over 0.5 km increments (this study).
Figure 7.
1988 Mw 6.3 (TC1), 6.4 (TC2) and 6.6 (TC3) Tennant Creek earthquakes (
a) rupture and cracking map of Kunayungku and Lake Surprise scarps with available dip measurements also the locations of trenches from [
63] with faults labelled as per displacement graphs, focal mechanisms (red line shows preferred plane from original publication) from (i) McCaffrey 1989, (ii) Choy and Bowman 1990, (iii) Jones et al., 1991, (iv) CMT, (
b) published epicenter locations of all three mainshocks (
c) resurveyed benchmark offsets [
63] uncertainties as discussed in text, and (
d) graphs of along-rupture vertical and lateral displacement measurements [
63] and net slip calculated from available data averaged over 0.5 km increments (this study).
Figure 8.
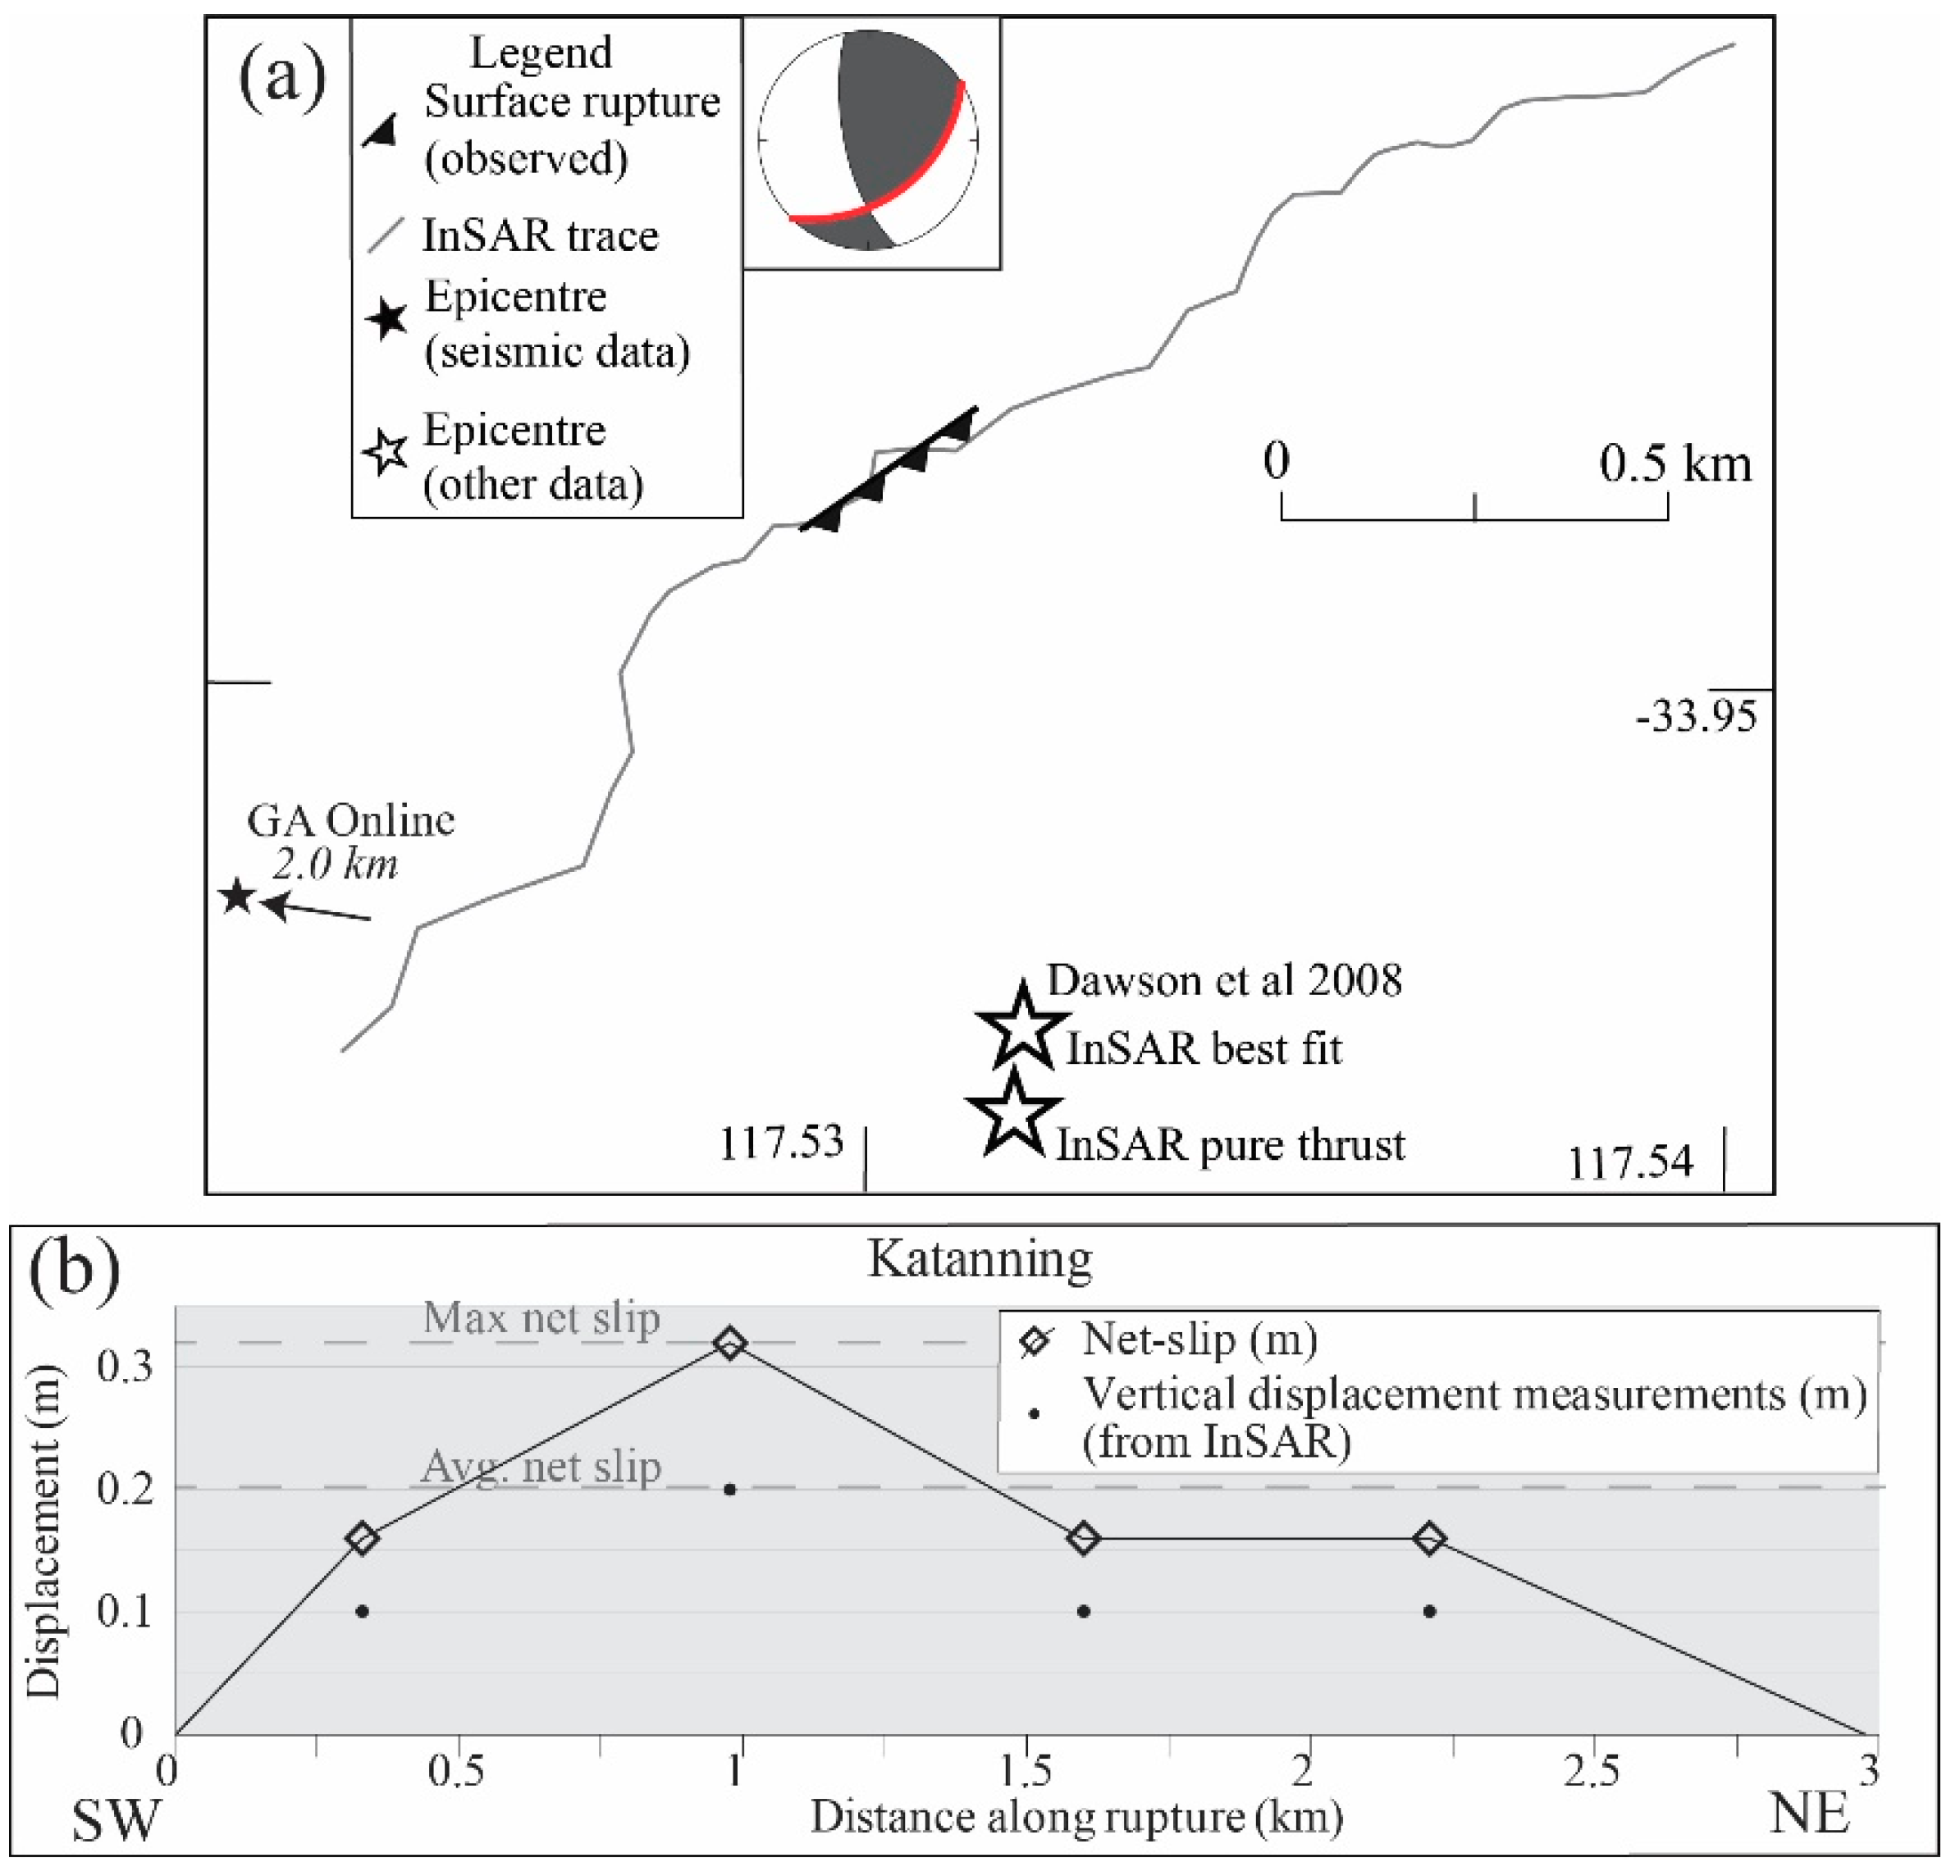
2008 Mw 4.7 Katanning earthquake (
a) approximate visible rupture and InSAR trace (digitized from [
70]), published epicenter locations and focal mechanism [
70] (
b) graph of along-rupture vertical and displacement taken from InSAR data [
70] and net slip calculated from InSAR data (this study).
Figure 8.
2008 Mw 4.7 Katanning earthquake (
a) approximate visible rupture and InSAR trace (digitized from [
70]), published epicenter locations and focal mechanism [
70] (
b) graph of along-rupture vertical and displacement taken from InSAR data [
70] and net slip calculated from InSAR data (this study).
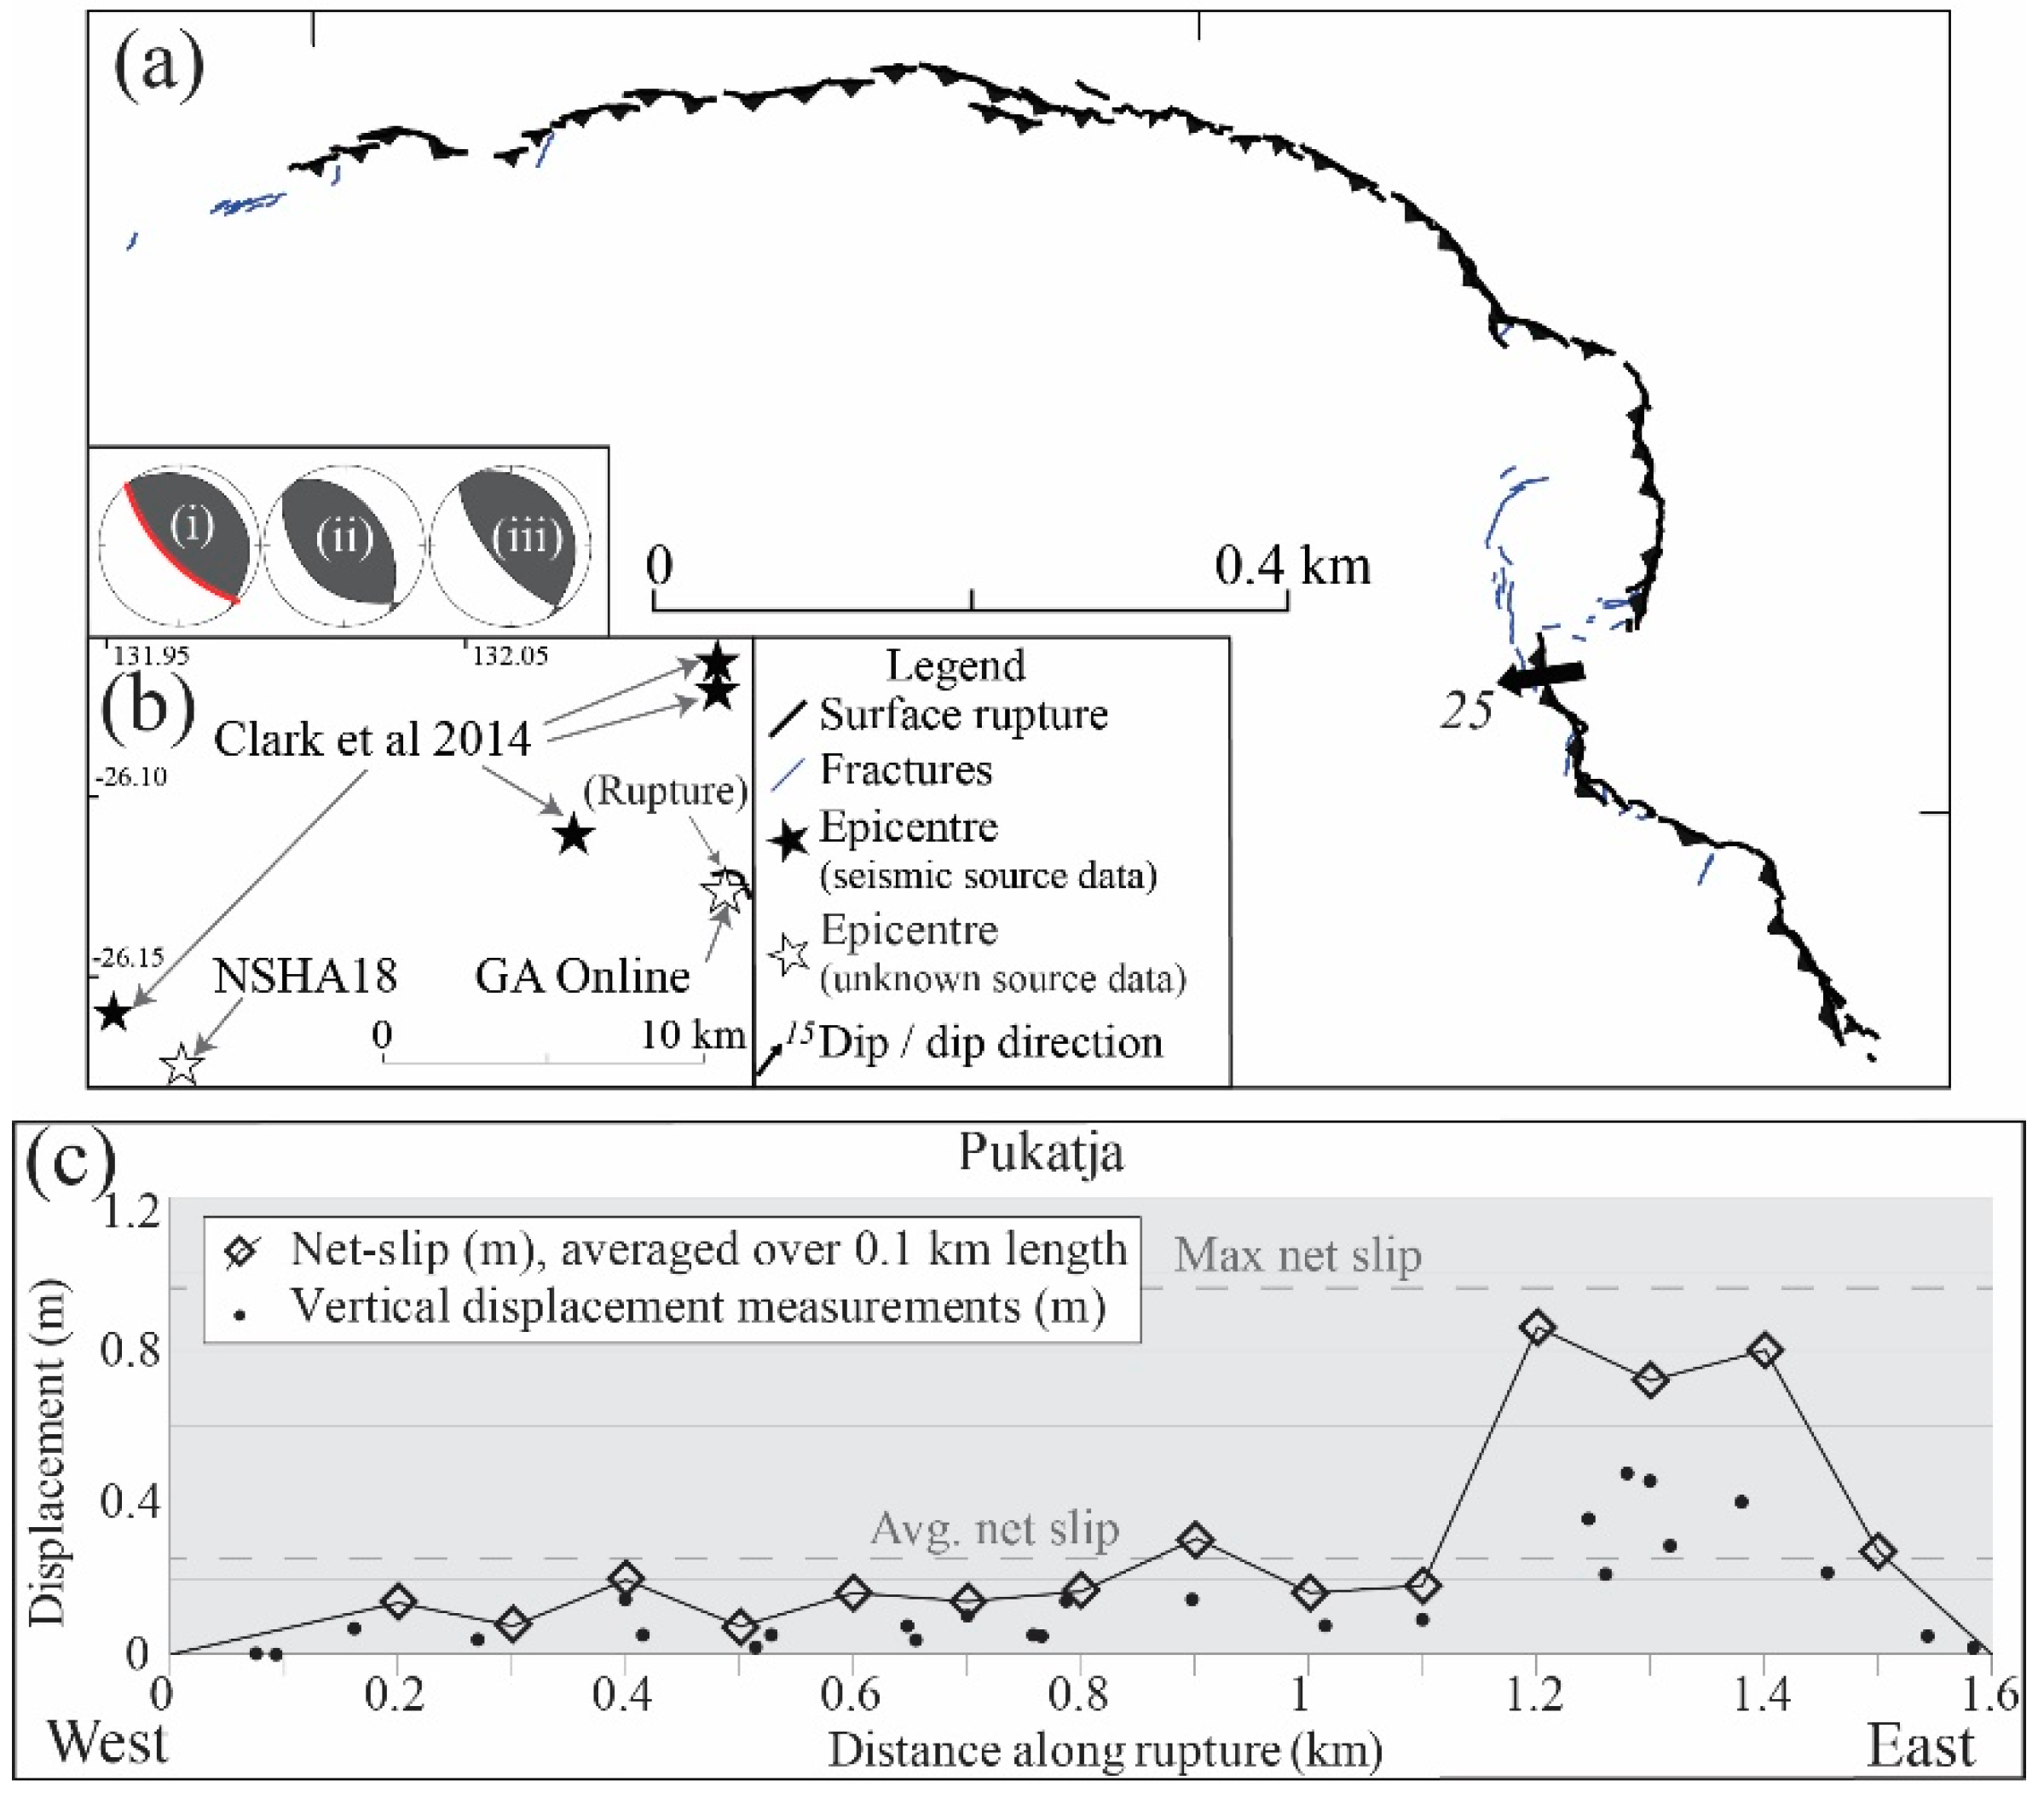
Figure 9.
2012 Mw 5.2 Pukatja/Ernabella earthquake (
a) rupture and fracture map of Pukatja scarp and available dip measurements also the location of hand-dug trench [
9], focal mechanisms as described in [
9] from (i) Clark et al., 2014, (ii) GCMT, (iii) St Louis University; (
b) graph of along-rupture vertical displacement measurements [
9] and net slip calculated from available data averaged over 0.1 km increments (this study).
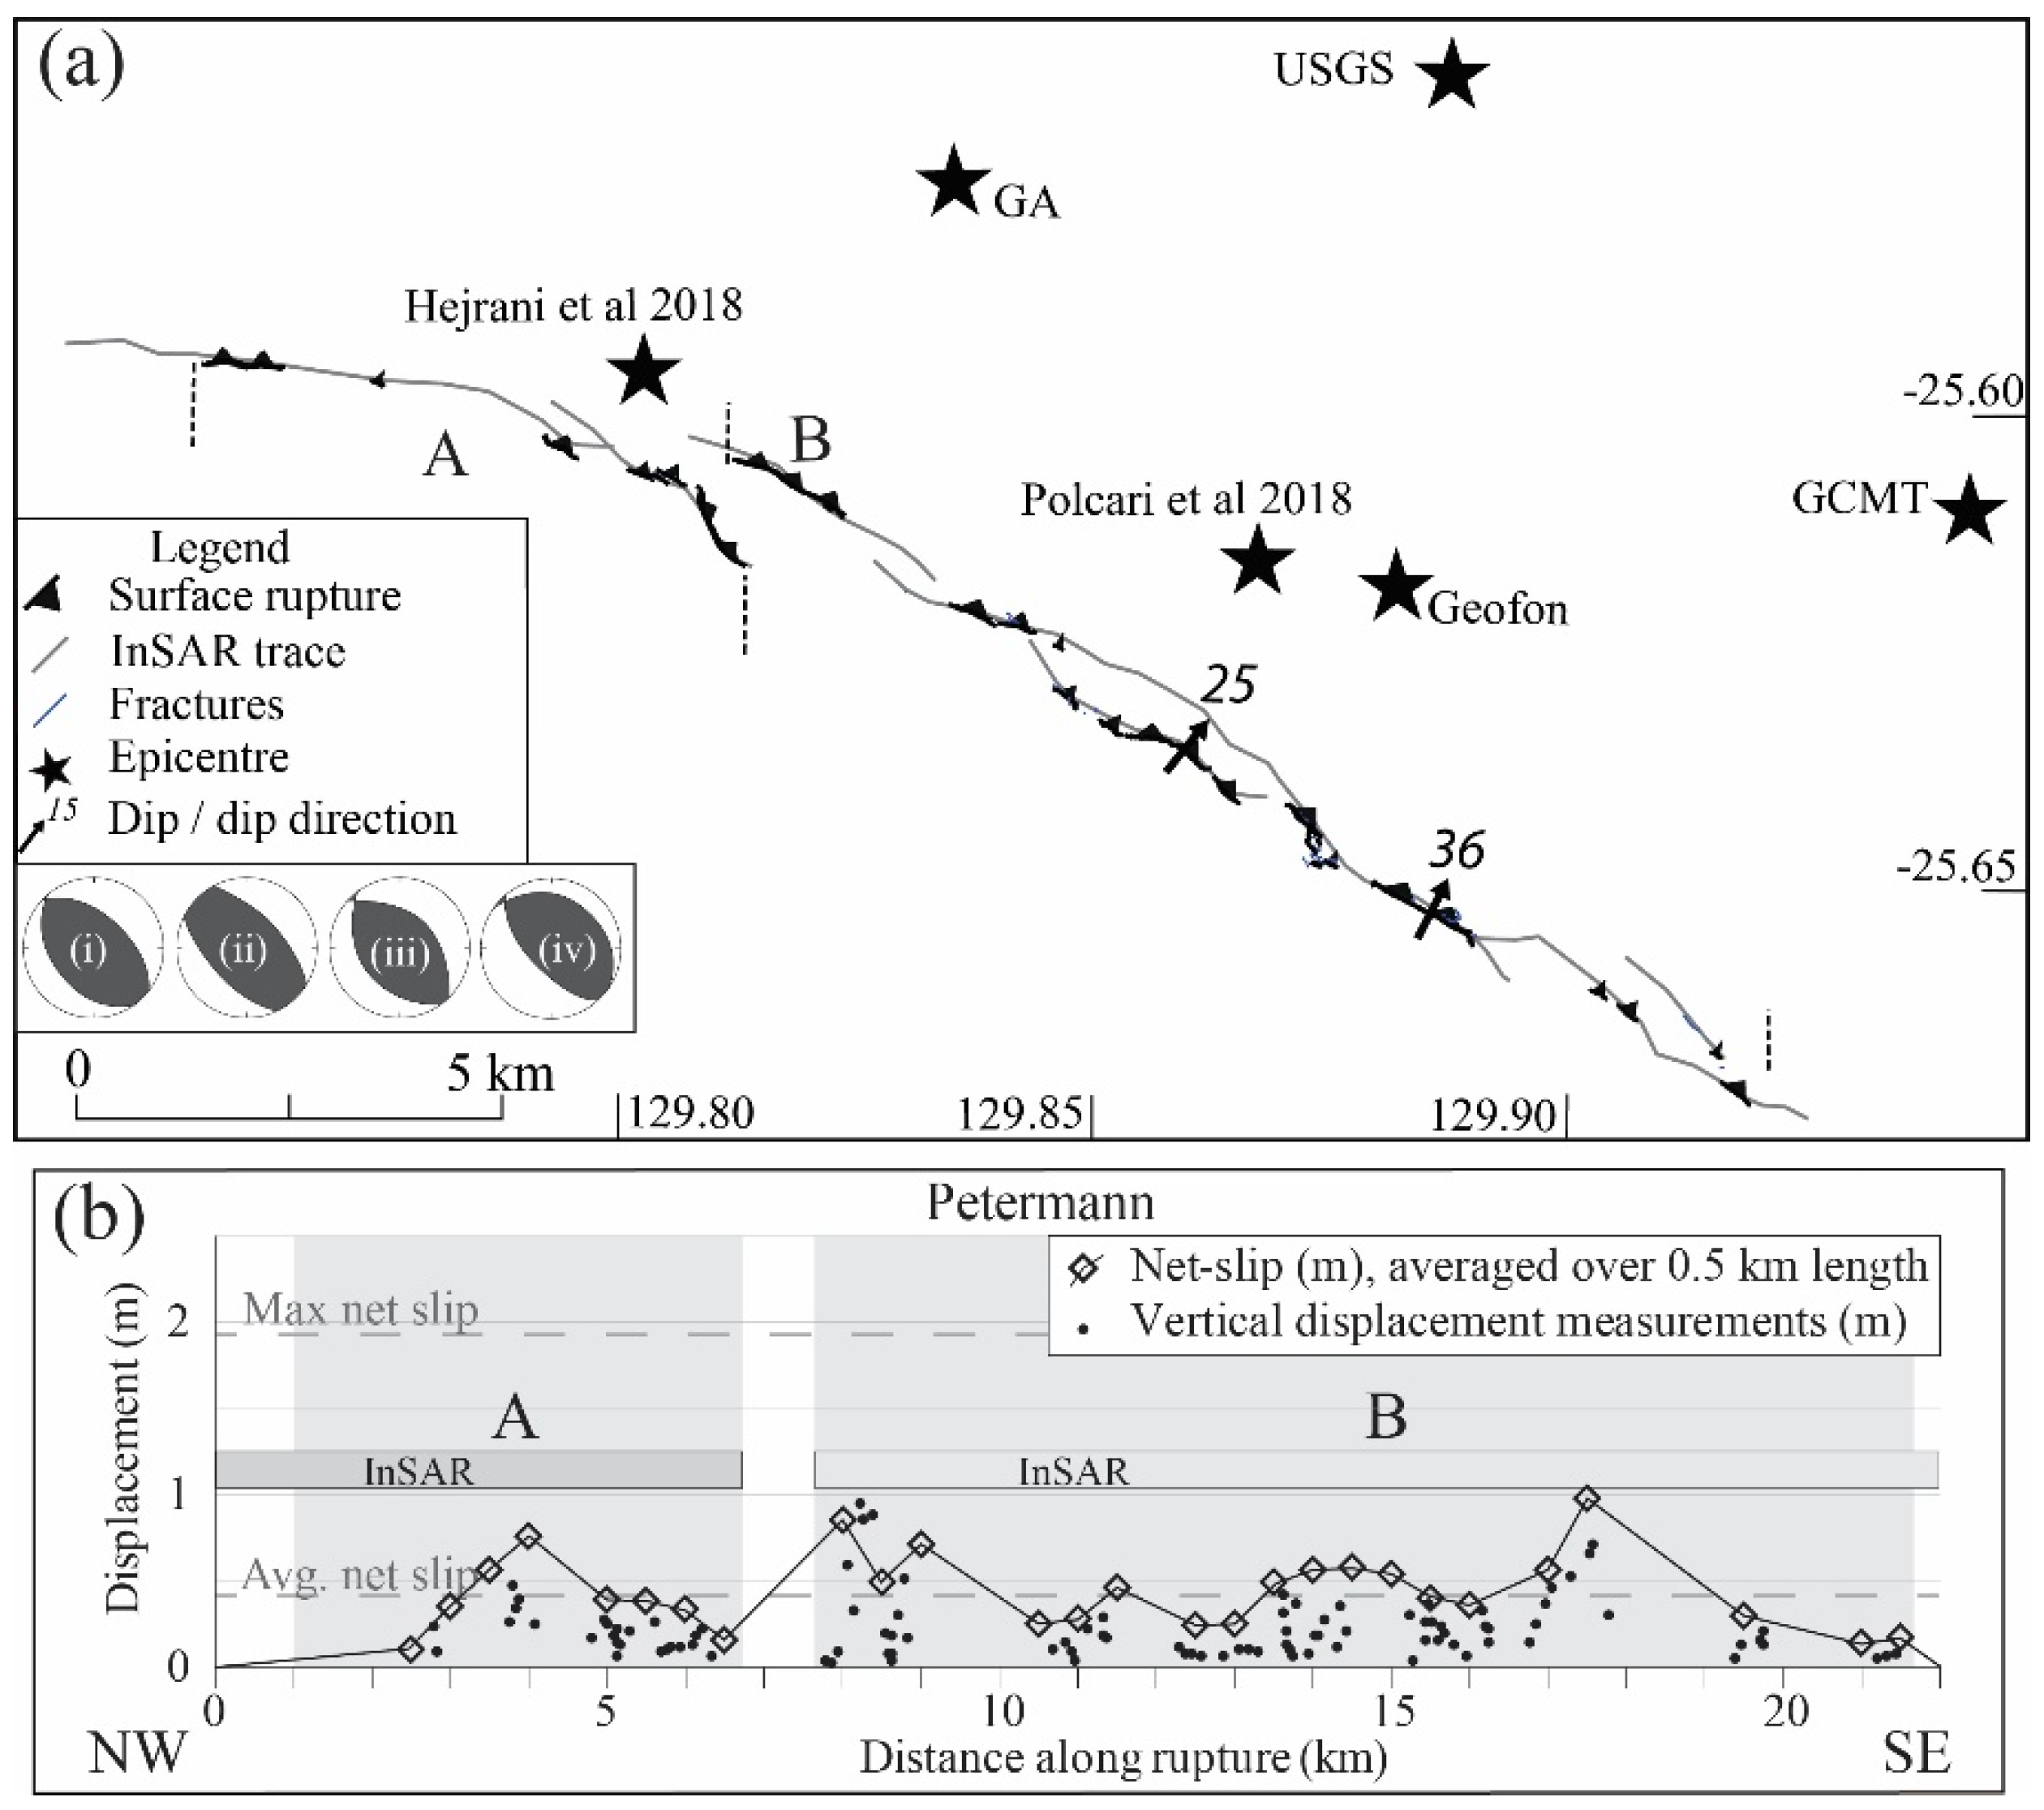
Figure 10.
2016 Mw 6.1 Petermann earthquake (
a) rupture and fracture map of Petermann scarp [
73] showing published epicenter locations and dip measurements of rupture (also the location of hand-dug trenches), focal mechanisms (i–iii) as described in [
73], (i) USGS, (ii) GCMT, (iii) Geofon, and (iv) from Hejrani and Tkalcic 2018; (
b) graph of along-rupture vertical displacement measurements and net slip calculated from available data averaged over 0.5 km increments.
Vertical and lateral offsets for all ruptures were digitized from primary literature (see EarthArXiv reports [
120,
121,
122,
123,
124,
125,
126] for methods and uncertainties). New net-slip values were calculated for all ruptures from measured offsets, with dips assigned to each field offset measurement based on measured surface dips and/or focal mechanisms (dip measurements from primary literature shown on
Figure 3,
Figure 4,
Figure 5,
Figure 6,
Figure 7,
Figure 8,
Figure 9 and
Figure 10 and in
Table 6—preferred dip from this paper in
Table 1 and
Table 6). Offset and net-slip data are presented in
Figure 3,
Figure 4,
Figure 5,
Figure 6,
Figure 7,
Figure 8,
Figure 9 and
Figure 10 along with length weighted averages to reduce bias towards sections of scarp where high number of measurements were taken (generally where offset is higher). Average offset is between 42%–77% lower than the maximum offset for each rupture (
Table 6). Displacement data are visually assigned a displacement profile shape [
7] with six of ten ruptures best described by triangle profiles (2= symmetrical, 4= asymmetrical), two assigned an asymmetrical sine profile, and three best represented by a straight average profile (
Table 6).
Offset data from resurveyed benchmarks (Tennant Creek [
62]) and relevelling along infrastructure (Meckering [
25]) were digitized from original publications to visualize distributed deformation across the rupture zone (
Figure 1 and
Figure 7). No uncertainties are reported for the Meckering data [
25], though they are likely in the order of Tennant Creek where original authors report uncertainties of ± 9.3–25 cm [
62,
136]. Despite large uncertainties, the authors of both datasets believe offsets constrain fault geometries and show distributed hanging-wall uplifts (and to a lesser extent, foot-wall depression).
3.4. Environmental Damage
Environmental damage as described in primary literature or visible in published photos for each event were classified under the ESI-07 Scale [
10] and summarized in
Table 7 (comprehensive details in EarthArXiv reports [
120,
121,
122,
123,
124,
125,
126]). Seven of eleven historic ruptures (excluding Katanning) can be described as an ESI IX – X despite having a wide range of lengths, magnitudes, and displacements.
Fracturing/cracking is reported for all historic surface ruptures, but generally only in the immediate vicinity of the surface rupture, captured by the rupture ESI value. This may relate to a lack of far-field mapping but is considered to be fairly representative of the true spatial distribution based on described mapping campaigns. The Meckering and Petermann events have the most aerially extensive fracturing, with areas of 580 and 210 km2 respectively. Of the total area covered by Meckering and Petermann fracturing, approximately 70% and 77% respectively is on the hanging-wall.
Where events occurred close to population centers (Meckering, Cadoux, Calingiri) ground water bores showed evidence of seismic fluctuation (no anomalies were identified in Tennant Creek bore data). The only observed liquefaction for any historic rupture comes from Meckering, where multiple sand blows were observed on the hanging-wall along the Mortlock River. Rockfalls are reported for three ruptures. Concentric or polygonal cracking was reported in the Meckering, Calingiri, Cadoux and Petermann events [
25,
41,
73], and holes (possibly related to collapsible soils e.g., [
137]) were reported along the rupture on the hanging-wall for Calingiri and Petermann [
41,
73]. It is possible that tree damage, hydrological effects, rock falls, polygonal cracking, or holes occurred for other ruptures than those listed but were not observed or described. Until the 2012 Pukatja event, field investigations immediately following the event were conducted by hard-rock geologists or seismologists not necessarily familiar with earthquake mapping techniques.
3.5. Paleoseismology and Slip Rate
In total, 14 trenches are described across the Meckering, Calingiri, Cadoux, Marryat Creek, Tennant Creek, Pukatja and Petermann ruptures (
Table 8). Tennant Creek, Marryat Creek and Meckering are the only ruptures where detailed palaeoseismic work is published, including multiple trenches, luminescence dating, and soil descriptions and chemistry [
37,
63].
Table 7.
Summary of environmental effects described for each rupture, assigned ESI level, and approximate area around, or distance from, rupture.
Table 7.
Summary of environmental effects described for each rupture, assigned ESI level, and approximate area around, or distance from, rupture.
| Name | Rupture | Fractures | Displaced Rocks | Sand Blows | Tree Shaking | Slope/Rock fall | Hydrology 1 | Holes [41,73] | Concentric Fracturing [25,41,73] | Vegetation Death/Root Tear along Rupture [9,25,47,48,63,73] |
|---|
| ESI | Area (km2) | ESI | Area (km2) | ESI | Area (km2) | ESI | Area (km2) | ESI | Area (km2) | ESI | Dist. (km) | ESI | Dist. (km) |
|---|
| Meckering | X | 190 | VIII | 580 | – | | V | 100 | ● | | IV | 200 | IV | 200 | – | □ | □ |
| Calingiri | IX | 2 | VII | 3 | * | | – | | – | | – | | – | | □ | □ | □ |
| Cadoux | IX | 50 | VI | 55 | – | | – | | ● | | – | | IV | 250 | – | □ | – |
| Marryat Creek | X | 20 | VII | 20 | – | | – | | – | | – | | – | | – | – | □ |
| Tennant Creek ^ | X | 160 | VIII | 160 | – | | – | | – | | – | | ● | | – | – | □ |
| Katanning, | VIII | 0.2 | – | | – | | – | | – | | – | | – | | – | – | – |
| Pukatja | IX | 1 | VII | 1 | – | | – | | * | | VII | 15 | – | | – | – | □ |
| Petermann | X | 12.5 | VII | 210 | IX | 290 | ● | | VI | 20 | VII | 20 | – | | □ | □ | □ |
| Lake Muir | IX | | * | | – | | – | | * | | – | | * | | – | – | – |
Table 8.
Summary of available paleoseismic trenching.
Table 8.
Summary of available paleoseismic trenching.
| Rupture | Ref. | Location | Bedrock | Sediments | Pre-Existing: | Possible Rup. Since 100 ka |
|---|
| Desc. | Age | Depth (m) (HW/FW) | Desc. | Age * | Cenozoic Offset | Bedrock Offset |
|---|
| Meckering 1 | [34,36,37] | Tributary of river | Not exposed | | >3 | Fluvial sands | Late Pleistocene | No | No | N |
| Meckering 2 | [34,36,37] | Farmland | Altered granite | Archean | <1.5 | Ferricrete / sand | T?/Holocene | No | Maybe 1 | N |
| Calingiri | [25] | | | | | | | No | Maybe 1 | |
| Cadoux/Carter scarp | [41] | Farmland | Altered granite | Archean | <0.5 | Sand/soil | Q? | No | No | |
| Cadoux/Tank scarp | [41] | Farmland | Granite | Archean | 0? | | | No | No | |
| Marryat Creek west | [118] | 10m N of dry creek | Altered gneiss | Proterozoic | <0.3 | Ferricrete / eolian sand | T?/<130 ka | No | No | N |
| Marryat Creek south | [118] | ‘Near’ dry creek | Altered greenstone | Proterozoic | <1.25 | Ferricrete/gravel, eolian sand | T?/<130 ka | No | No | N |
| Kunayungku | [63] | Max vert. disp. | Altered sedimentary rock | Cambrian? | <2 | Ferricrete/eolian sand | T?/<30 ka | No | No | N |
| Lake Surprise east | [63] | Max vert. disp. | Not exposed | | >2 | Ferricrete/eolian sand | T?/<46 ka | No | No | N |
| Lake Surprise west 1 | [63] | Monoclinal rupture (near quartz ridge) | Altered “iron-rich quartzite” | Cambrian? | <0.5/>2 | Gravel/eolian sand | Q/<50 ka | No | Yes 3 | Y |
| Lake Surprise west 2 | [63] | Discrete rupture (375m E LSW-1) | Altered “hematitic quartzite” | Cambrian? | <0.5/>0.7 | Ferricrete/gravel/eolian sand | T?/Q/<50 ka | Maybe 2 | Yes 3 | Y |
| Pukatja | [9] | Max. vert. disp. | Not exposed | | >1.5 | Sand | ~104–105 | No | No | Y |
| Petermann 1 | Unpub. | Paleovalley | Not exposed | | >1.5 | Calcrete/eolian sand | T?/Q | No | No | N |
| Petermann 2 | Unpub. | Inter-dune region | Not exposed | | >1.5 | Calcrete/eolian sand | T?/Q | No | No | N |
Of seven ruptures with detailed trench data (
Table 8), five show evidence of no rupture since the lake Pleistocene (Meckering, Marryat Creek, Kunayungku, Lake Surprise east, Petermann). The only evidence of a pre-existing bedrock scarp exposed in any trench occurs in the second Lake Surprise west trench, and no clear evidence was found to support a seismic-offset origin for this topography (see EarthArXiv report [
126] for more detail). Penultimate ruptures since 100 ka are possible for two of seven of these earthquake events, where sediments are estimated to be <100 ka in age, and where either no ferricrete/bedrock is exposed (Pukatja), or a bedrock scarp exists prior to overlying sedimentation (Lake Surprise west) (
Table 8).
Maximum slip rates are calculated by applying minimum and maximum erosion rates for bedrock to determine the amount of slip (from average observed historic slip (
Table 6)) that could have accumulated and been removed in the past million years. Minimum (0.3 m Myr
−1) and maximum (5.7 m Myr
−1) cosmogenic nuclide erosion rates from crystalline bedrock inselbergs across the Precambrian crust of central Australia (
Figure 1) [
138] are applied for ruptures where crystalline basement is exposed in trenches or observed at the surface within two meters of rupture (implying shallow bedrock). Where trenching exposed ferricrete or quartzite, cosmogenic nuclide erosion rates for quartzite exposed on flat bedrock summits in the Flinders Ranges are applied (5–10 m Myr
−1) [
109].
Applying erosion rates from inselbergs and quartzite bedrock summits to surface bedrock across the different cratonic and erosional environments in which ruptures occurred (e.g.,
Figure 1) introduces uncertainties that are unavoidable due to a lack of more appropriate erosion data. Based on a lack of evidence of any preceding ruptures for any of the historic events, including topographic or geomorphic, we prefer the minimum erosional estimates, giving maximum slip rates of 0.2–9.1 m Myr
−1.
Table 9.
Maximum slip rates based on minimum and maximum bedrock erosion rates [
109,
138] and length-weighted average net-slip values (
Table 6).
Table 9.
Maximum slip rates based on minimum and maximum bedrock erosion rates [
109,
138] and length-weighted average net-slip values (
Table 6).
| Name | Rate Applied * | Mw | Pref. Length (km) | Avg. Net-Slip (m) | Maximum Slip Rate (m/Myr) |
|---|
| Min. | Max. | Mean |
|---|
| Meckering | CB | 6.59 | 40 ± 5 | 1.78 | 0.2 | 3.2 | 1.7 |
| Calingiri | CB | 5.03 | 3.3 ± 0.2 | 0.46 | 0.7 | 12.4 | 6.6 |
| Cadoux | CB | 6.1 | 20 ± 5 | 0.45 | 0.7 | 12.7 | 6.7 |
| Marryat Creek | CB | 5.7 | 13 ± 1 | 0.31 | 1 | 18.4 | 9.7 |
| Kunayungku | Q | 6.27 | 9 ± 1 | 0.55 | 9.1 | 18.2 | 13.7 |
| Lake Surprise west | Q | 6.44 | 9 ± 2 | 0.84 | 6 | 11.9 | 8.9 |
| Lake Surprise east * | Q | 6.58 | 16 ± 0.5 | 1.23 | 4.1 | 8.1 | 6.1 |
| Katanning (InSAR) | CB | 4.7 | 0.5 ± 0.5 | 0.2 | 1.5 | 28.5 | 15 |
| Pukatja | CB | 5.18 | 1.3 ± 0.3 | 0.25 | 1.2 | 22.8 | 12 |
| Petermann | CB | 6.1 | 21 ± 0.5 | 0.42 | 0.7 | 13.6 | 7.2 |


