Nitrogen Cycle Dynamics Revealed Through δ18O-NO3− Analysis in California Groundwater


1
The Department of Earth and Environmental Sciences, California State University East Bay, Hayward, CA 94542, USA
2
Lawrence Livermore National Laboratory, 7000 East Ave, Livermore, CA 94550, USA
*
Author to whom correspondence should be addressed.
Geosciences 2019, 9(2), 95; https://doi.org/10.3390/geosciences9020095
Submission received: 31 December 2018
/
Revised: 11 February 2019
/
Accepted: 13 February 2019
/
Published: 18 February 2019
(This article belongs to the Special Issue Hydrogeochemistry and Groundwater Management)
Abstract
:Nitrate is a significant water-quality issue in California, the United States as a whole, and the world. Critical to addressing nitrate contamination is understanding the presence and extent of denitrification, and further refining the techniques used to identify nitrate sources. The use and understanding of nitrate isotopic signatures to identify nitrate sources have advanced tremendously; however, knowledge gaps remain concerning specific fractionation pathways and the role of denitrification in altering source values. Using a large unique database of California groundwater nitrate isotopic compositions, we explored the utility of nitrate–oxygen isotope ratios in determining specific nitrate origins. Lawrence Livermore National Lab (LLNL) samples were supplemented by United States Geological Society (USGS) data to create a dataset of over 1200 dual-isotope results. Methods used at LLNL allowed for the determination of δ15N-NO3−, δ18O-NO3−, δ18O-H2O, δ2H-H2O, excess air, major dissolved gases, and excess N2. Results were examined for the degree to which δ18O-NO3− conforms to the model of nitrification in which two atoms of oxygen are sourced from ambient water and one from the atmosphere. Almost 80% of the results fall within one standard deviation of predicted values. However, 19% of samples had significantly higher values, suggesting the preservation of a synthetic nitrate source signature, mixing of sources, or widespread denitrification. Results were examined with respect to general land-use classifications and, while nitrate concentrations followed the expected pattern of being higher in agricultural settings, δ18O-NO3−patterns are complicated by application of N-fertilizer in various forms, and subsequent N cycling in the soil zone. We found that the current understanding of oxygen isotope-fractionation mechanisms cannot yet explain the prevalence of oxygen-isotope compositions with higher than predicted δ18O values, but when paired with related data such as land use and indicators of denitrification, oxygen-isotope compositions of nitrate can help to assess nitrogen cycle dynamics.
1. Introduction
Nitrate contamination of groundwater is a ubiquitous problem not only in the United States, but also across the globe. Since it is common for distinct nitrate sources to spatially overlap, and because nitrate has high solubility/mobility, methods to identify sources, most often nonpoint [1], are key to mitigation efforts. As such, there have been numerous studies on nitrate-contamination sources and their associated isotopic signatures [2,3,4,5] along with nitrate isotopic signatures of denitrification [6], and mechanisms for change in the isotope composition of nitrate [7].
There are several processes that can affect the isotopic composition of nitrate. For example, microbial fixation of N2 from the atmosphere and subsequent bacterial nitrification (a multistep redox process) produces nitrate of a different isotopic composition (δ15N-NO3−) than industrial production of nitrate fertilizer through the Haber–Bosch and Ostwald processes. Nitrate isotopic composition is determined both by source and by process. While atmospheric molecular oxygen and oxygen in water have different isotopic compositions, microbial nitrification and denitrification are processes that fractionate isotopic composition. Measurement of coupled N and O isotopes in nitrate has been a starting point for source identification of nitrate in groundwater in many recent studies [8,9,10,11].
Analysis of oxygen isotopes in nitrate (δ18O-NO3−) was used to help mitigate the inherent uncertainty of relying solely on δ15N-NO3−, since not only is the oxygen isotope variation greater between some sources than the nitrogen isotopic composition, but the systematic variation of oxygen isotopic compositions with nitrogen isotopic composition can be used to constrain nitrate sources and processes [12,13]. However, interpretation of δ18O-NO3− data is made difficult by complications inherent to nitrification/denitrification dynamics, including multiple sources of oxygen incorporated in nitrate and the variety of fractionation pathways during the multiple steps of nitrification and denitrification, leading some studies to conclude that δ18O-NO3− is of little use in delineating nitrate sources on its own [14].
The nitrification of NH4+ to NO3− involves three oxidation reactions: NH4+ to NH2OH, NH2OH to NO2−, and NO2− to NO3−, with each step catalyzed by a separate oxidoreductase or oxidase [15]. The oxygen atoms involved in each step have been shown in multiple laboratory studies [1,16,17,18] to come from two distinct sources: the oxidation of NH4+ derives oxygen from atmospheric O2, while the second and final oxidation steps use oxygen atoms from ambient H2O. Because of this, a hypothetical δ18O for the nitrified NO3− molecule can be calculated using Equation (1), where δ18O-H2O is the stable isotope composition of oxygen in soil water present at the time of nitrification [3,17,19]:
δ18O-NO3− = 1/3 δ18O-O2 + 2/3 δ18O-H2O
In California, local waters (soil seepage, irrigation waters, etc.) usually have δ18O values of −15‰ to −5‰, depending on the source of the water. Although atmospheric O2 is a relatively constant +23.5‰ [4,13], studies have shown soil O2 to have a variable range of +23‰ to +29‰ (with more enriched values due to fractionation by respiration in soil; [17,19]. From this, we can expect δ18O-NO3− resulting from nitrification of ammonium fertilizers and manure to fall between −2.2‰ and +4.5‰ in California due to the combination of high δ18O atmospheric oxygen and lower δ18O soil-water oxygen atoms. Synthetic NO3−, a product of the Haber–Bosch process and the Ostwald process, is not produced by this same nitrification reaction, however, and derives its oxygen atoms entirely from atmospheric O2, resulting in a much heavier range for δ18O-NO3− of +17‰ to +25‰, [13,17].
The three processes have relatively well-defined fractionation patterns with regard to nitrogen isotopes. While fractionation factors are also known for the isotopes of oxygen, they have not been applied as extensively until recently due to somewhat greater difficulty in measuring δ18O-NO3− in the lab [17]. Recent studies have attempted to account for samples in which δ18O-NO3− deviates from the simple predictive model (Equation (1)). Incorporating kinetic isotope effects and abiotic exchange that occurs during NO2− oxidation (Equation (2)) has helped explain samples that fall below the expected values from Equation (1) [18,20]. Additionally, these same kinetic isotope effects have been shown to control oxygen isotope fractionation during denitrification [21]:
δ18O-NO3− = 1/3 (2 + fabiotic) δ18O-H2O + 1/3 [fabiotic (218εeq-δ18O-O2-ε (k, O2) − 18ε(k, H2O,1)) + δ18O-O2 +
18εk, O2 + 18εk, H2O,1 + 18εk, H20,2]
18εk, O2 + 18εk, H2O,1 + 18εk, H20,2]
Studies have also suggested that, in certain environments where heterotrophic nitrification is significant, nitrate formation may incorporate more than 1/3 of its oxygen from molecular O2 [17]. Although multiple studies have refined the understanding of oxygen incorporation into nitrate, large sample populations from field studies with varying types of land use have not been examined; water samples that are significantly enriched in δ18O-NO3− above the expected values from Equations 1 and 2 are also yet to be adequately explained.
Over the past three decades, application of δ15N-NO3− and δ18O-NO3− for tracing nitrate sources has expanded, creating relatively large datasets that should be examined for adherence to theoretical fractionation patterns and for conformity to the expected ranges for major land-use categories. In particular, we noted the lack of δ18O-NO3− results with the very high values expected for synthetic fertilizers, even in agricultural areas of known high application rates. Thus, an objective of this study is to examine the correlation between land use and significant deviation in δ18O-NO3− from Equations (1) and (2), i.e., that two oxygens are incorporated from ambient groundwater and one from atmospheric O2. Using measured δ18O-H2O should lead to a reasonable approximation of δ18O-NO3− for the same sample. Large-scale anthropogenic addition of synthetic nitrate (for which land use is a reasonable proxy), denitrification, and mixing of groundwaters and precipitation during and after nitrification are all potential complications to this approximation and may be cumulative. Here, we present a collection of samples analyzed for the stable isotope ratios of nitrate and water, along with other variables that are related to nitrate sources and fate in groundwater.
2. Materials and Methods
The dataset used in this study combines results from two extensive databases of analyzed groundwater samples, all from wells in California. The first dataset comprises groundwater samples (see Supplementary Materials) collected by researchers at Lawrence Livermore National Laboratory (LLNL). This collection of samples is the result of multiple studies conducted by LLNL scientists over the previous twenty years (1997–2017). LLNL’s database was reduced here to 583 samples by excluding samples that did not contain N and O isotopes of nitrate, isotopes of water, [NO3−], and, for a smaller subset, noble-gas concentrations and dissolved excess N2.
Stable isotope signatures for the nitrogen and oxygen of nitrate were analyzed for the vast majority of samples using a version of the denitrifying bacteria procedure [22] as described in Singleton et al. [23], at LLNL’s Stable Isotope Laboratory. Denitrifying bacteria reduce nitrate to N2O(g), and the resulting gas is analyzed for δ15N-NO3− and δ18O-NO3− on an IsoPrime isotope ratio mass spectrometer equipped with a TraceGas sample introduction system. Analytical uncertainty (1σ) is 0.5‰ for δ15N-NO3− and 1.0‰ for δ18O-NO3−.
Results from United States Geological Survey (USGS) studies in California were added to complement the LLNL dataset. USGS sample data were retrieved from the National Water Information System’s Web Interface (https://nwis.waterdata.usgs.gov/nwis/qwdata). The USGS samples (numbering 704) were analyzed for stable isotope ratios of nitrate and water, as well as nitrate and dissolved oxygen concentrations. Search parameters for USGS samples restricted results to California groundwater samples collected between 2000 and 2017 that were run for the previously mentioned parameters. USGS samples were analyzed at the Reston Stable Isotope Laboratory (https://isotopes.usgs.gov/lab/methods.html) for stable isotopes of nitrate by continuous-flow isotope-ratio mass spectrometry. Samples required a minimum of 0.002 mg NO3− as N, with samples containing at least 0.06 mg/L NO3− − N measured with ± 0.05‰ uncertainty. The stable isotopes of water were measured by dual-inlet isotope-ratio mass spectrometry, with uncertainties of ± 0.2‰ for δ18O-H2O and ± 2‰ for δ2H-H2O.
It is important to note that, due to analytical constraints, samples with concentrations of nitrate below the detection limit for nitrate concentration were not analyzed for the stable isotopes of nitrate. This creates an inherent bias in the sample population against areas with very low concentrations, which may include some with natural sources, and against heavily denitrified areas. Further, a portion of the population was created from separate projects that were designed to discover sources of nitrate contamination or trace its fate and transport in groundwater. This then adds a potential bias toward locations with NO3− contamination issues. However, since less than 25% of samples contributing to the sample set had that motivation, the dataset is suitable for analysis of isotopic trends when those biases are considered.
To refine the sample population for nitrate-source analysis, a cutoff of δ15N-NO3− of +20‰ was used to remove samples with a clear signal of denitrification. Groundwater samples typically become enriched in 15N to that degree after considerable denitrification, which simultaneously increases the δ18O-NO3− value. Therefore, removing those samples provides a sample population that should reflect isotopic ratios closer to the source values. However, since +20‰ is a somewhat arbitrary cutoff, and mixing between an original nitrate source and denitrified nitrate might bring values to below the cutoff, there are likely to be denitrified samples in the remaining population. The most effective way to prove that denitrification has taken place would be to sample multiple points along a flow path and assess successive changes in isotope ratios and nitrate concentrations. However, this dataset was not collected to examine denitrification, so we could only remove the most obvious cases of denitrification through the aforementioned limit. This step removed 300 samples, reducing the total sample size to 915 samples (244 LLNL, 671 USGS).
The collective sample group covers a wide swath of California, mainly within alluvial groundwater basins (Figure 1), as well as a broad range of land-use types. Precipitation, soil permeability, and depth-to-groundwater significantly vary among the represented alluvial basins, factors that likely affect soil-zone N cycling. Using the United States Department of Agriculture National Agricultural Statistics Service’s Cropland Data Layer (CDL) for 2016 (https://www.nass.usda.gov/Research_and_Science/Cropland/metadata/meta.php), and the State of California’s Department of Conservations Farmland Mapping and Monitoring Program’s (FMMP) (http://www.conservation.ca.gov/dlrp/fmmp/Pages/Index.aspx) ArcMap layer, 145 samples were classified as farmland, 450 as urban, 295 as undeveloped, and 25 confined to animal agriculture. The CDL has a ground resolution of 30 meters and is created from the Landsat 8 OLI/TIRS, DMC DEIMOS-1, and UK2 sensors, which is complemented with extensive ground truthing. According to the USDA, the 2016 data layer used here has 89.5% accuracy for crop-specific covers. The CDL does not incorporate confined animal agriculture as land use, so the FMMP layer took precedence in spatially defining those operations.
3. Results
Of the 915 samples, 781 (85%) fall within a standard deviation of the predicted value for δ18O-NO3− when applying Equation (1). Although 1σ is not a definitive cutoff, it is necessary to allow some deviation around the calculated value due to uncertainties in fractionation factors, the extent of denitrification and groundwater mixing, analytical uncertainty, and other variables. Samples with δ18O-NO3− values above one positive standard deviation greater than the predicted value are subsequently referred to as samples with “excess δ18O-NO3−”. The measured values, along with delineation between excess δ18O-NO3− and nonexcess samples, are shown in Figure 2.
Of the samples identified as having a signature of excess δ18O-NO3−, 25% were on some type of farmland, 52% on developed/urban land, and 22% on undeveloped natural lands. The highest δ18O-NO3− values follow this same trend, with slightly over half of the top 20 (out of n = 134) on developed/urban land. Samples measured as much as a 37‰ difference between the expected δ18O-NO3—value, calculated using Equation (1), and the measured value. The mean difference between the measured values of the excess subset and values predicted by Equation (1) was +7.8‰. For samples with noble-gas analyses (n = 83), there was a slight but negative correlation between the N2/Ar ratio and dissolved Ar, which would indicate gas loss rather than saturated zone denitrification, due to Ar preferentially partitioning into gas bubbles over N2 [24]. There is no strong correlation evident among the excess group between nitrate concentrations and δ15N-NO3− (R2 = 0.0015), which is expected for denitrified samples. Interestingly, there was no significant correlation between elevated nitrate levels and deviation from Equation (1) (R2 = 0.003) or between dissolved oxygen and deviation from Equation (1) (R2 = 0.001). Additionally, the average deviation from the expected Equation (1) value for samples measuring above the California nitrate Maximum Contaminant Level (MCL) of 45 mg/L NO3− was 7.0‰, versus 7.9‰ for those under the MCL. There is a very slight positive correlation (R2 = 0.009) between the deviation from Equation (1) and δ15N-NO3−; a positive correlation here could signal that denitrified samples (with higher δ15N-NO3− values) are more likely to have distinct δ18O water sources and increased residence time in the soil zone.
Water-isotope results are available for all LLNL samples and some USGS samples (164 total, 34 samples with excess δ18O-NO3−), and are plotted with the global meteoric water line (GMWL) in Figure 3. Most samples shifted slightly to the right of the global meteoric water line (GMWL), indicating possible evaporative fractionation prior to reaching the water table. The slopes of both sample populations (excess and nonexcess) were less than 8 (the slope of the GMWL, which reflects the fractionation difference between oxygen and hydrogen as observed in precipitation) but are nearly identical within the margins of error at m = 7.71 (nonexcess; standard error of the regression slope, which represents the average distance that the observed values deviate from the regression line; SEest = 5.53) and m = 7.11 (excess, SEest = 3.39). As expected, the distribution of results along the line reflect geographic location, i.e., samples from coastal areas have heavier isotopic signatures (higher on the line), and samples from inland counties fall lower on the line.
A trend was observed in comparing each land-use sample grouping, with natural land-cover having a lower occurrence of excess δ18O-NO3− (11%) compared to Urban (16%) and Farmland (20%). Nested within the Farmland category are animal-agriculture operations (e.g., dairy). Samples taken at these locations show a much higher incidence of excess δ18O-NO3− of 48% (n = 25).
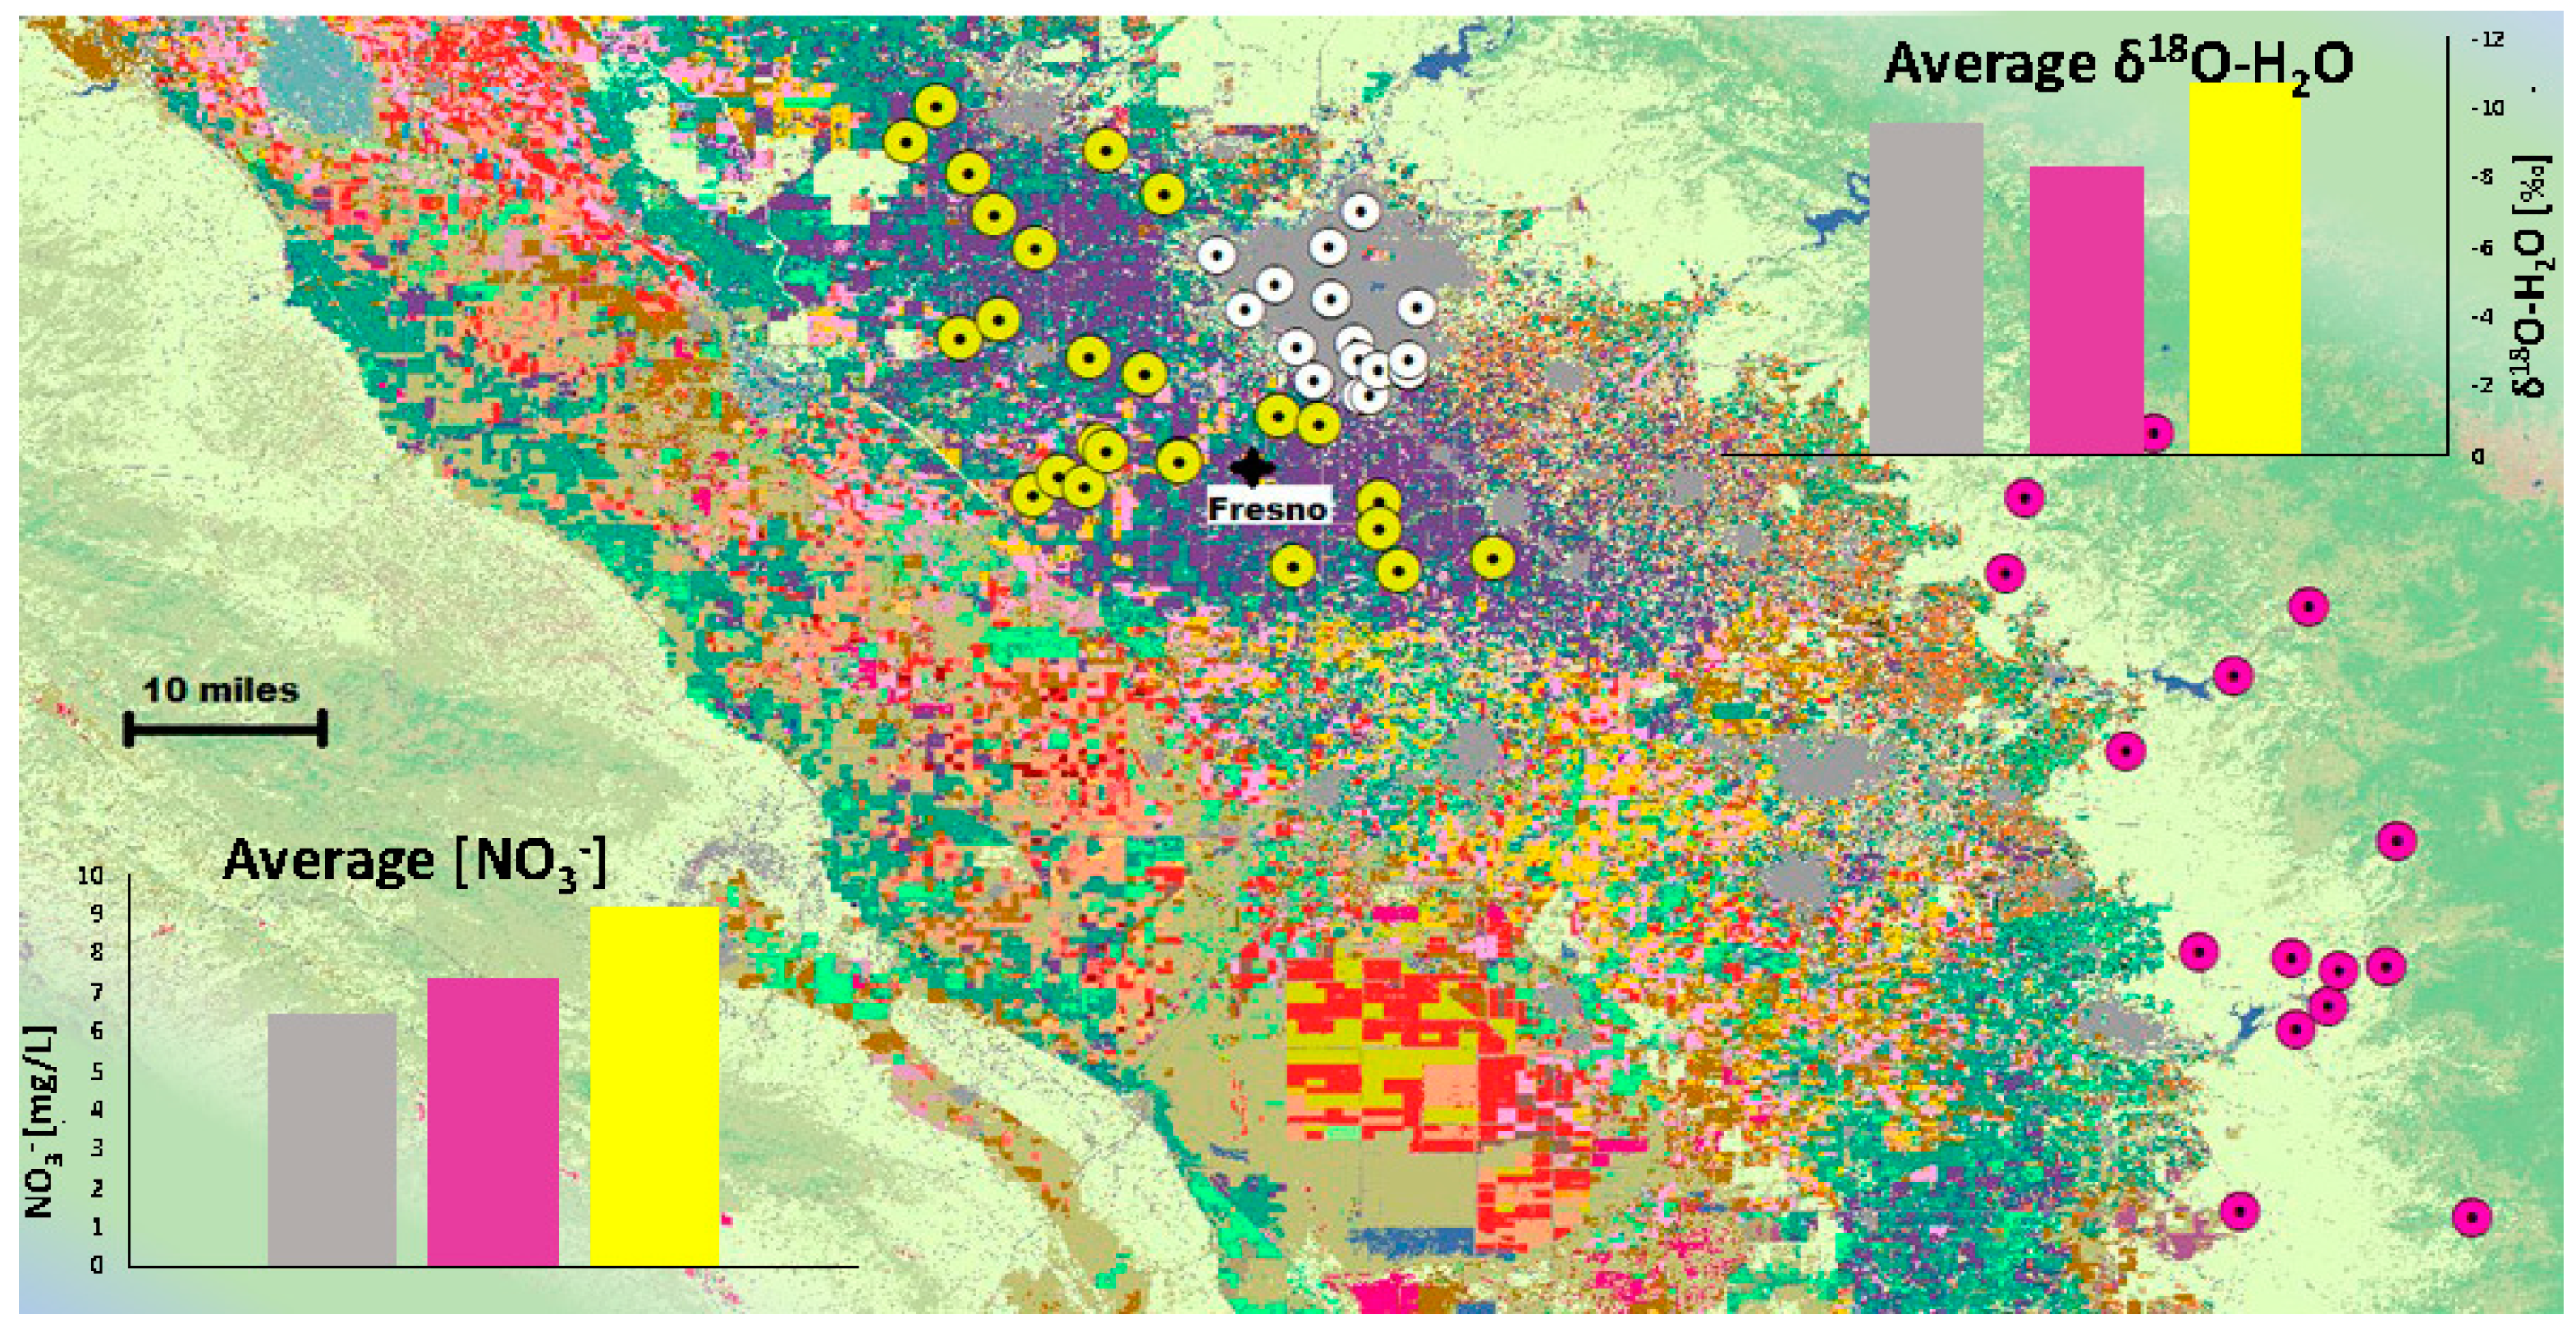
To examine these patterns on a local scale, 67 samples (with three subgroups covering the land-use categories defined above) within an approximate 50-mile radius of Fresno, CA (Figure 4) were selected for further analysis. This area was chosen as a representative small area with a diverse array of land-use types. The Natural category (n = 15) contained samples defined by the CDL as either grass/pasture, shrubland, rural/residential, or natural nonagricultural vegetation. Farmland (n = 25) included designations of alfalfa, almonds, idle cropland, garlic, grapes, pistachios, winter wheat, and pasture, while urban (n = 25) samples were listed as varying intensities of developed (low, medium, open space) or vacant disturbed. The average nitrate concentrations, δ18O-H2O, and δ18O-NO3− are shown in Figure 4 and Figure 5. Average nitrate concentrations are highest in the farmland land-use category, as expected, likely due to fertilizer application for agricultural production. Relatedly, the farmland samples have the lowest δ18O-H2O, which is likely indicative of the reliance on low δ18O-H2O river water (originating from the Sierra Nevada range) distributed for irrigation in the Central Valley. The relationship between δ18O-H2O and δ18O-NO3− is unclear. Both farmland and urban categories have lower δ18O-NO3− values than predicted by Equation (1) (Figure 5), while the average value for natural samples was almost twice as high as predicted (4.3‰–2.3‰).
4. Discussion
4.1. Excess δ18O-NO3−
Given the variety of processes that affect the isotopic composition of nitrate, and in particular the δ18O-NO3− value, it is noteworthy that so many sample results fall within a close grouping around the predicted values using the simple relations expressed in Equation (1). In fact, linear regression through the nonexcess sample population on Figure 2, has a slope (m = 0.83, SEest = 2.55), close to that of Equation (1) (m = 0.66, SEest = 2.07). This indicates that, in general, field samples follow the 2:1 paradigm, i.e., during heterotrophic nitrification, two oxygen atoms derive from soil water and one from atmospheric O2. This result also suggests that most applied N must undergo nitrification within the soil zone.
The 2:1 slope is not a universal signature of nitrification. Mayer et al. [17] found that, in certain acid forest soil horizons, where ammonium is limited, and nitrification rates are low, autotrophic nitrification can play a significant role. The authors suggest that, in those environments, significantly less than 2/3 of the nitrate oxygen comes from H2O. Though it is likely that a combination of heterotrophic and chemolithoautotrophic nitrification takes places concurrently in soils, especially in acid soils where chemolithoautotrophic nitrifiers become inhibited [25], the parameters required for significant autotrophic nitrification are most likely not present for most samples used in this study. Additionally, very recent research suggests that heterotrophic nitrification may fundamentally include nitric oxide as an obligate intermediate product, which has implications for the ratio of O-O2:O-H2O required for oxidation to nitrate [26].
That so many samples are within one standard deviation of their predicted value may be a function of multiple cycles of nitrification and denitrification occurring within the same nitrate pool in near-surface soils. One probable cause for the varying values in the selected subset being substantially different than the values predicted by Equation (1) is that the water measured for δ18O-H2O is different from the original water where nitrification took place. Since nitrification/denitrification processes have been shown to occur within extremely thin lenses (2–3 mm) at shallow depths (0–9 mm) [27], it is possible and likely that the measured water, which in some samples is collected from 150 m and deeper wells, has undergone long-distance transport or some amount of isotopic alteration through mixing and/or evaporation. Since evaporation has a stronger effect on the top layer of soil, it is possible that the process of nitrification incorporates evaporated, high-δ18O-H2O waters, which are subsequently diluted by the input of low δ18O-H2O precipitation, causing lower measured δ18O-H2O than was incorporated into the NO3− molecule. As nitrate is cycled in shallow soils, the δ18O-NO3− value generated from the initial nitrification process can become obscured and modified to more closely resemble the δ18O-H2O groundwater signature of the most recent nitrification.
Several studies have attempted to incorporate kinetic isotope effects into Equation (1) to more closely track fractionations that occur during nitrification in the soil and explain deviations from the 2:1 model [17,18,20] When these processes were considered (using equilibrium isotope effects and fabiotic values shown in Table 1) they increased the slope of the expected value line from 0.66 to 1, and although they captured some of the samples termed ‘excess’, the shift upward on the y-axis only captures minor deviations and promotes a fit further from the primary grouping (Figure 6).
It is also important to note the potential causes for the minority of samples that fall one standard deviation below their predicted values (n = 19). Abiotic O exchange between nitrite, which is an intermediate produced during the reversible phases of nitrification and denitrification, and H2O, evaporation of the sample water between nitrification and isotope analysis, and O exchange between nitrate and H2O can reduce the δ18O-NO3− below the predicted value using measured δ18O-H2O. Additionally, the denitrifier method of δ18O-NO3− analysis measures isotopes in both nitrite and nitrate. Any residual nitrite could potentially shift the isotopic profile to lower values.
4.2. δ18O-NO3− at Local Scales
Equally important for examining larger trends among sizeable populations is analyzing smaller subsets to test if general trends hold at regional and local scales, and where and why they do not. The selection of samples shown in Figure 4 and Figure 5 attempts to examine nitrate relationships across three land-use types. As noted above, nitrate concentration averages are in the expected patterns; Farmland has the highest average, most likely due to higher nitrate loading from inorganic and organic fertilizers, while urban and natural samples have significantly lower concentrations. Nitrate levels in the natural category (n = 295) are within the expected range for the absence of anthropogenic impact (<13–18 mg/L as NO3−) [29].
As noted previously, δ18O values for water also fall into the expected relative values. Agricultural producers in California, especially in the Central Valley, depend on imported water for their operations. Most imported water is isotopically light (δ18O of −10‰ to −13‰) river water that originates from the nearby Sierra mountain range (Visser et al., 2013 [30]). Due to the porous high-conductivity nature of agricultural sediments, this water infiltrates rapidly and retains its isotopic source signal [30]. The urban signal is most likely a combination of isotopically light imported water and local precipitation, causing the average to fall between the natural and farmland categories. Correcting back to the GMWL adjusts the δ18O for both excess and nonexcess samples by only 1‰ on average (Figure 3), suggesting that excess δ18O-NO3− values require the addition and interplay of more processes than evaporation alone.
The average δ18O-NO3− values in each subgroup present a more complicated picture. The farmland category has both the lowest δ18O-NO3− and the smallest difference between the measured and expected results. This could be due to the low application rates of Haber–Bosch/Ostwald-based nitrate fertilizers coupled with limited evaporative forcing or mixing. However, denitrification enriches the remaining nitrate pool in 18O over 16O, and so we would expect a shift above the expected value, yet the average is below.
4.3. Dual Nitrate Isotope Plot and Denitrification-Related Shifts
A complicating factor in determining the oxygen isotope composition of nitrate sources is the variety of fertilizer types that combine synthetic nitrate with ammonium/ammonia in varying proportions. In 2007, according to the California Department of Food and Agriculture, although 45% of nitrogen fertilizer sales were for nitrate fertilizers, only 3% were entirely nitrate (calcium nitrate). The remaining 42% were forms of ammonium, ammonia, or urea nitrate, while 69% of all nitrogen fertilizer sales contained ammonium or ammonia [31]. Using these percentages, one calculates that approximately 18% of nitrogen inorganic fertilizer was applied directly as nitrate. However, as seen in Figure 7, this loading of nitrate and ammonium/ammonia together masks potential signals of Haber–Bosch/Ostwald-created nitrate on a dual isotope plot.
It is also interesting to note how few samples plot within the previously designated range for (inorganic) NH4+ or NO3− fertilizers shown in Figure 7, considering the likely lower manure/septic nitrogen load relative to inorganic sources. In fact, of the 170 farmland samples, only 35% fell within either the NH4+ fertilizer, NO3− fertilizer, or soil ranges, and of the total sample set comprising all land uses, most were squarely within the soil zone (n = 600 or 66%). The percentage of farmland samples with a fertilizer or soil signature remains low (43%) when conservatively removing animal agriculture and related feed crops (alfalfa, triticale, oats, etc.), which are potentially fertilized by or subject to manure application. By way of illustration, if the 2007 fertilizer sales are indeed representative of use across California, we would expect approximately 18% (n = 20) of the nonanimal agricultural-related crop samples to fall in the NO3− fertilizer range; instead, only three samples fall in that range. This is either due to insufficient sample size/inherent biases in the sample set, or, more likely, the lack of preservation of the Haber–Bosch/Ostwald signal once that nitrate is cycled in soil, enters groundwater, and potentially undergoes denitrification.
Although an attempt was made to remove the samples affected by the largest amount of denitrification, it is very likely that denitrified samples remain. This is evidenced by the slope of the linear regression through the sample population (m = 0.43) which is similar to the typical denitrification slope of 0.5. Denitrification, which increases δ15N-NO3− and δ18O-NO3−, at an approximate rate of 1:2, for the remaining pool of NO3− by preferentially selecting the lighter isotope, is likely responsible for shifting some samples into the manure/septic box in Figure 7.
That so many samples are fully within the manure and septic-nitrate range suggests either a large-scale issue with septic contamination of groundwater (or a bias toward contaminated wells) or a ubiquitous mechanism that enriches nitrate in the heavy isotopes of N and O, such as denitrification. Using data for the year 2000, when approximately 10% of Californian homes relied upon a private septic system [32], and with an estimated 0.04 kg/day (0.1 lbs./d) sewage released per system from a four-person household [33], approximately 544,000 kg (1,200,000 lbs) of septic waste potentially discharged from drain fields, of which a significantly smaller percentage is sewage-derived nitrate. This contrasts with the approximately 590 million kg (1.3 billion lbs) of nitrogen fertilizer added to California land in the year 2000 [34].
Additionally, a large-scale study of the Tulare Lake Basin, a regionally important groundwater source for 4 million people and intensive agriculture, found that cropland was responsible for 93.7% of groundwater nitrate loading [35]. Synthetic nitrate fertilizer was the dominant source of nitrate input in this region (estimated 2.04 × 10⁸ kg N/yr), 1.6 times the amount of estimated manure input (1.28 × 10⁸ kg N/yr); this is significant since the Tulare Lake Basin is home to approximately half of California’s dairy herd [36]. This makes widespread contamination by septic or sewage waste unlikely and suggests the locus of the central sample mass in Figure 7 is likely a product of widespread denitrification.
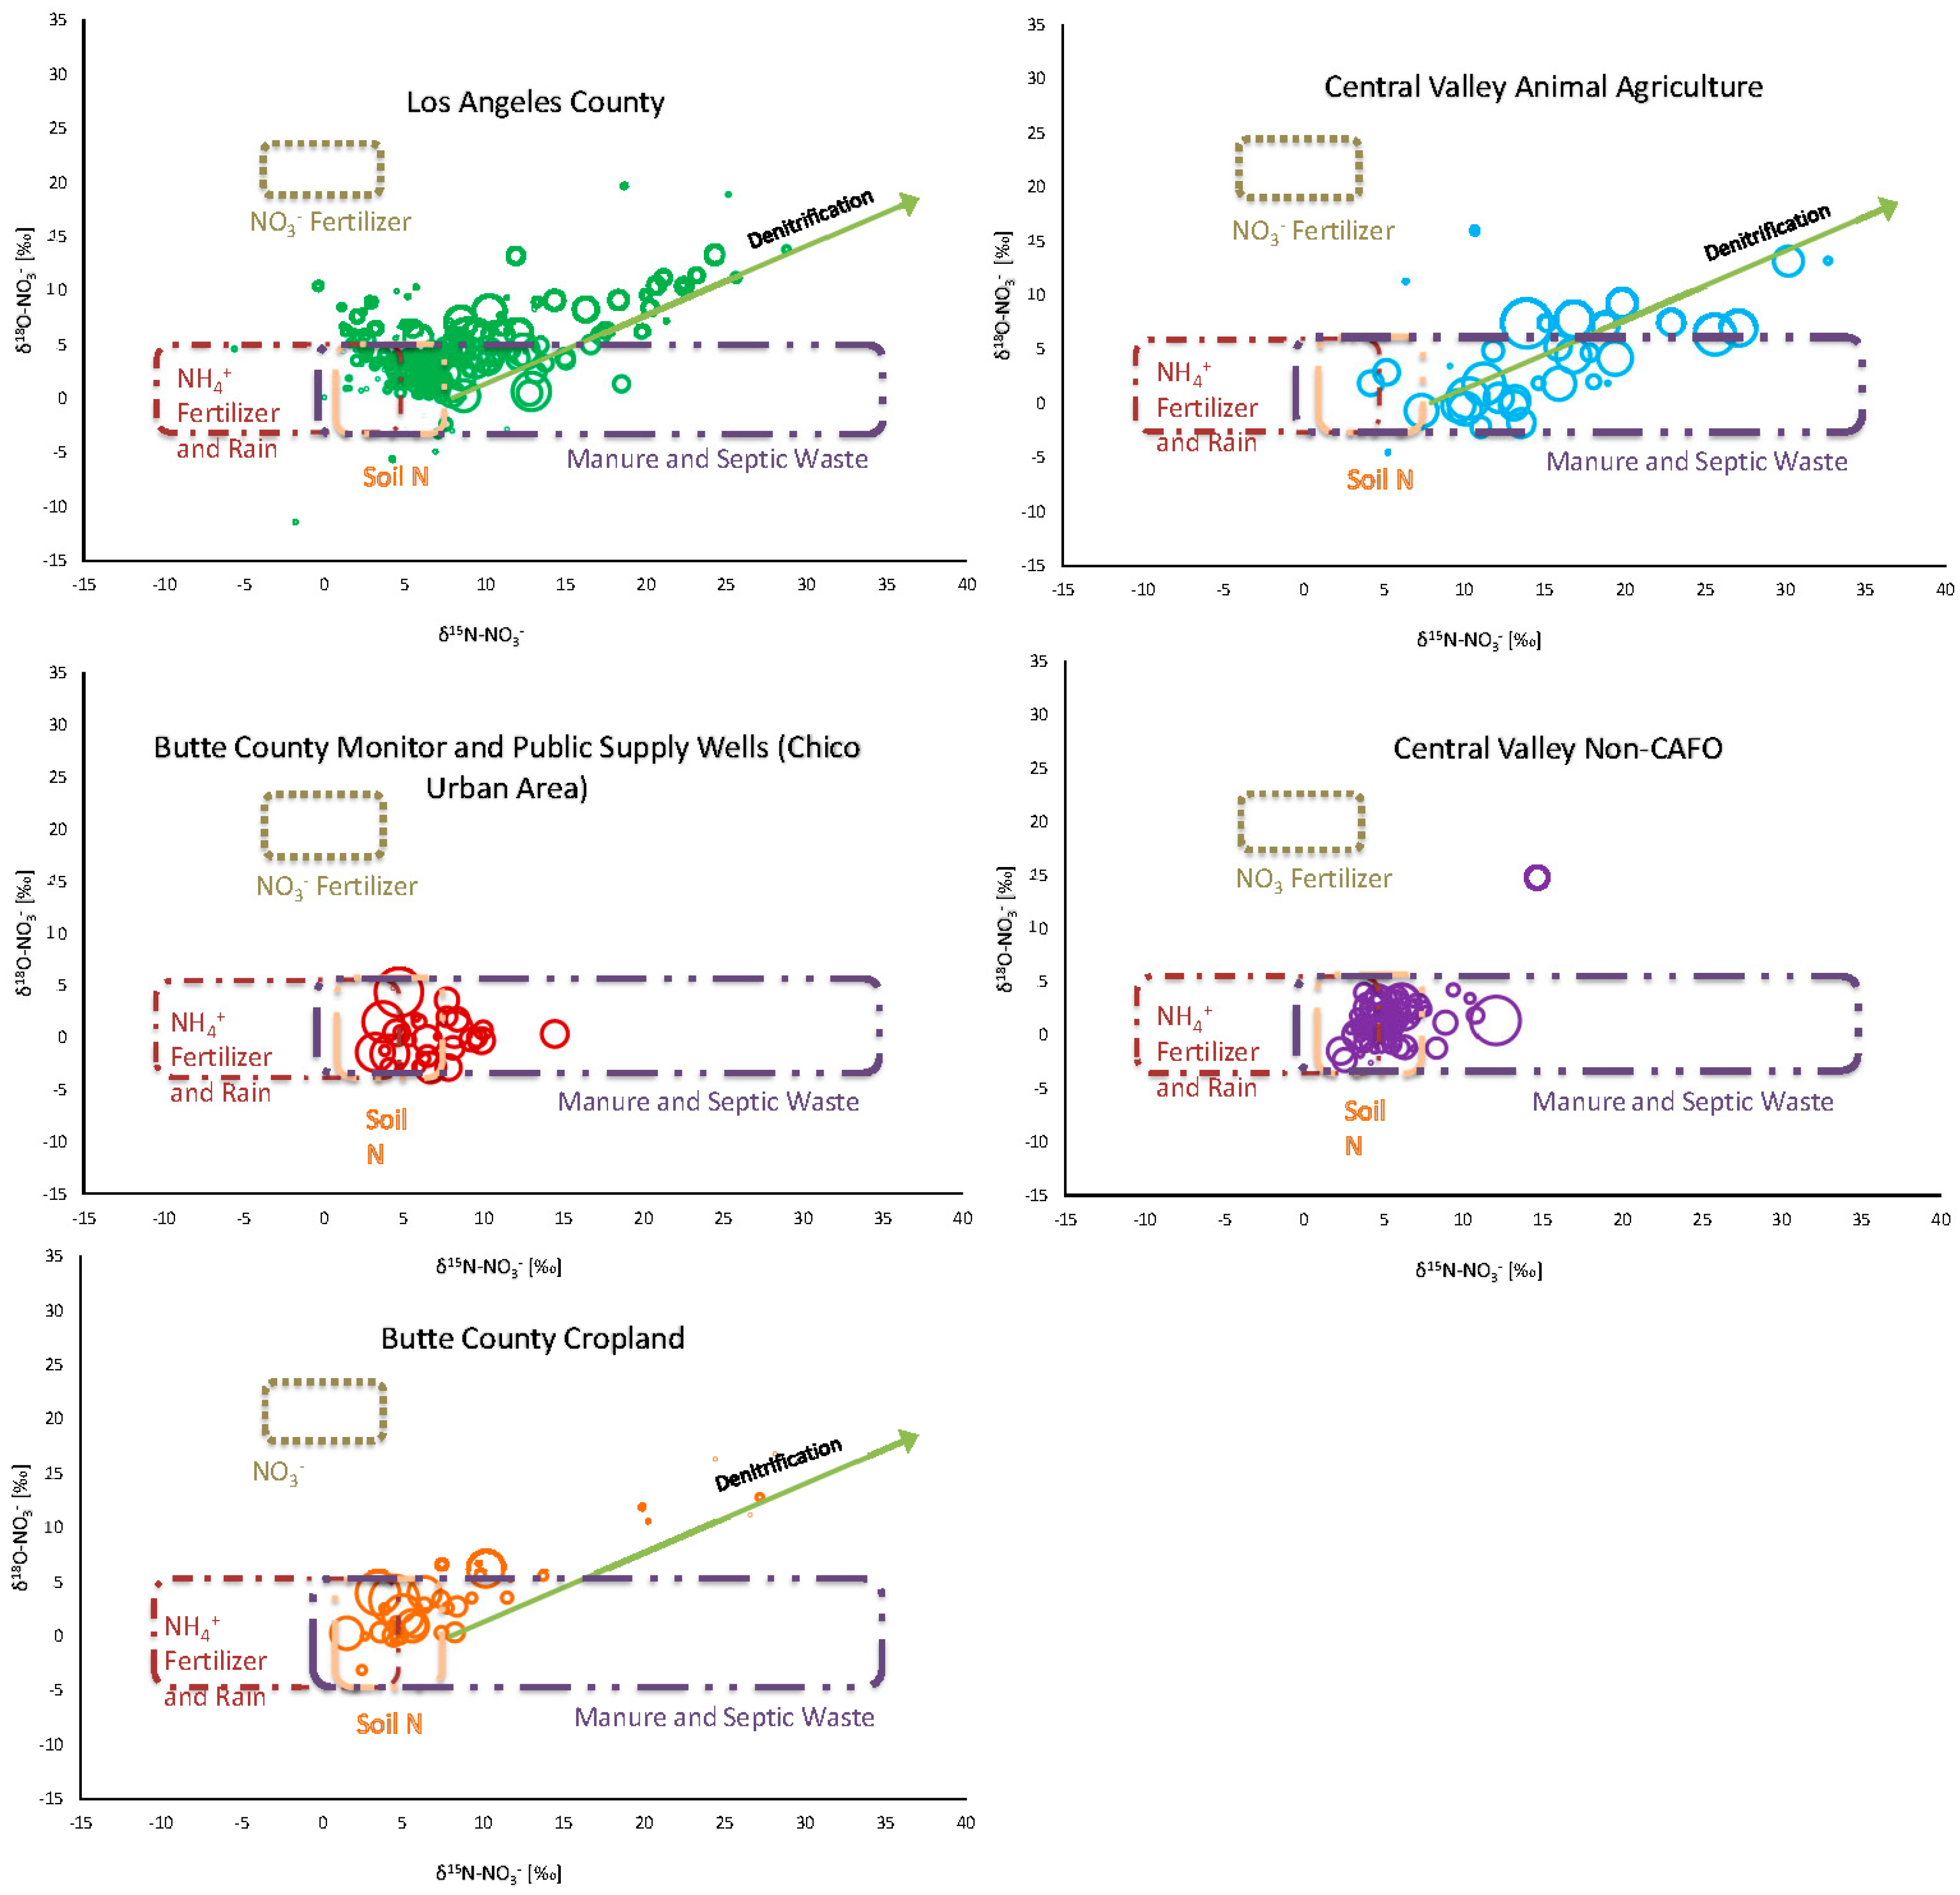
In addition to the overall sample population, five separate sample subgroups were analyzed: a collection of municipal wells in the urban sprawl of Los Angeles County (n = 246; samples from LLNL and USGS datasets), concentrated animal-feeding operation (CAFO) samples from the Central Valley (n = 72; LLNL), Central Valley agriculture not directly associated with animal operations (n = 81; USGS), Butte County cropland samples in the areas surrounding the city of Chico (n = 38; USGS), and samples from both monitoring and public supply wells in the urban, developed portion of Chico, California, where both septic and nonanimal agricultural sources exist (n = 31; LLNL) (Figure 8).
Between the subsets, trends emerge; the Central Valley dairy samples are distinctly centered within the δ15N range associated with manure/septic nitrate (average δ15N = 15.5‰), in contrast to other Central Valley samples that are presumably affected by primarily synthetic nitrate fertilizer (average δ15N = 5.4‰) centered around the edge of the inorganic nitrate/soil nitrification range.
In areas of intensive animal agriculture or known septic contamination issues, high δ15N-NO3− values were measured in concert with elevated nitrate levels, along with evidence for denitrification. Each of the remaining study areas, with land use associated with synthetic fertilizer input varying from low to high, had markers for the presence of denitrification: samples falling along the 1:2 trendline, a negative monotonic relationship between and δ15N-NO3− and NO3−, and the presence of significant amounts of excess N2. For the 123 samples in which excess N2 was measured, there was a cumulative 1576 mg/L of denitrified nitrate. The total measured NO3− for those samples was 9533 mg/L, suggesting a minimum average denitrification rate of 17%, and significant pervasive denitrification across the sample population. It is also important to remember that these samples represent saturated zone conditions, where denitrification often proceeds to completion. However, partial denitrification likely takes place in shallower depths of the soil zone, which can complicate measuring for markers of denitrification.
4.4. Abiotic Oxygen Exchange during and after Nitrification
Analysis of the dataset at large through selected subsets and individual samples has shown that no single variable is responsible for the occurrence or extent of excess δ18O-NO3−. The highest deviations from expected δ18O-NO3− values do not show a consistent nitrate source. They include samples with multiple lines of evidence that nitrate formed during interaction with mantle fluids, samples with low and high levels of nitrate, and samples with proximate sources of both wastewater and fertilizer.
One possibility of a more pervasive process is the exchange between the oxygen isotope of nitrate during or after nitrification with ambient water [37]. However, recent studies have shown that high rates of abiotic oxygen exchange between nitrite and H2O occurring during the second step of nitrification, i.e., NO2− →NO3−, require a buildup of NO2−. Though nitrite can accumulate in certain settings (i.e., activated-sludge mixtures; [38]), it is seldom observed to accumulate to appreciable amounts in either natural or agricultural environments [39,40]. Additionally, NO2−↔H2O oxygen exchange would only have an appreciable effect on the resulting δ18O-NO3− if nitrification did not reach a (quasi-) steady state [34]. Currently, there is conflicting evidence as to the impact of oxygen isotope exchange between nitrate and water; Kaneko and Poulson [41] determined the rate of exchange to be extremely slow, and thus concluded that δ18O-NO3− source signatures are relatively well-preserved. However, Kool et al. [37], in a soil-incubation experiment, found O exchange to have a meaningful impact on the final value δ18O-NO3−.
Negligible fractionation from abiotic oxygen exchange, coupled with a substantial number of samples in the ‘excess’ group suggests that excess δ18O-NO3− does not require unique circumstances, but may instead be a product of nitrogen loading and interaction (during nitrification) with water that had higher δ18O-H2O values relative to the actual water sampled and used in Equation (1) to predict δ18O-NO3−. Though exceptions apply, such as interaction with mantle fluids, the most likely causes of excess δ18O-NO3− are application of synthetic nitrate fertilizer and/or separation of the water encountered during nitrification and the groundwater sampled.
5. Conclusions
First, this analysis reveals that understanding the cause of significantly elevated δ18O-NO3− in groundwater samples requires a suite of variables at the level of an individual sample or localized region. However, this study shows that most samples do conform, within 1 sigma, to the straightforward application of the 2 O-H2O: 1 O-O2 paradigm for nitrification. Deviations from this model, which accounted for approximately 22% of the sample population, occur across the spectrum of land use, at negligible and high concentrations of nitrate, areas with and without evidence for significant denitrification, and in locations lacking a proximate source of synthetic nitrate.
From this, it is reasonable to infer that mechanisms exist in these domains that result in excess δ18O, mainly the mixing and transport of highly mobile nitrate molecules to water sources other than those in which they were nitrified, coupled with the isotopic effects of evaporation in the soil zone, and input of low δ18O-H2O precipitation. In the case of δ18O-NO3− values approaching +23‰, unaltered synthetic nitrate is the most likely source. Lower values (exceeding 1σ) probably represent a distinct nitrification environment (i.e., δ18O-H2O) from the sample setting. However, the effects of fractionation and abiotic exchange during nitrification, and especially successive nitrification and denitrification cycles of the same nitrate pool, as well as the potential for microbiota to nitrify in the absence of available soil water and shift away from the strict 2:1 model, need to be explored further.
Supplementary Materials
The following are available online at https://www.mdpi.com/2076-3263/9/2/95/s1. Table S1: Groundwater samples.
Author Contributions
Conceptualization, N.V., J.E.M., A.V., B.E., and M.J.S.; formal analysis, N.V.; investigation, N.V.; project administration, J.E.M. and B.E.; supervision, J.E.M.; writing—original draft, N.V.; writing—review and editing, N.V., J.E.M., B.E., and M.J.S.
Funding
Data collection and analysis reported herein was funded in a large part by the California State Water Resources Control Board, Groundwater Ambient Monitoring and Assessment Program (https://www.waterboards.ca.gov/gama/).
Conflicts of Interest
The authors declare no conflict of interest.
References
- Andersson, K.K.; Hooper, A.B. O2 and H2O are each the source of one O in NO2 produced from NH3 by nitrosomonas: 15N-NMR evidence. FEBS Lett. 1983, 164, 236–240. [Google Scholar] [CrossRef]
- Aravena, R.; Evans, M.L.; Cherry, J.A. Stable Isotopes of Oxygen and Nitrogen in Source Identification of Nitrate Septic Systems. Groundwater 1993, 31, 180–186. [Google Scholar] [CrossRef]
- Böhlke, J.K.; Denver, J.M. Combined Use of Groundwater Dating, Chemical, and Isotopic Analyses to Resolve the History and Fate of Nitrate Contamination in Two Agricultural Watersheds, Atlantic Coastal Plain, Maryland. Hydrogeochem. Water Chem. 1995, 31, 2319–2339. [Google Scholar] [CrossRef]
- Kendall, C. Tracing nitrogen sources and cycling in catchments. In Isotope Tracers in Catchment Hydrology; Kendall, C., McDonnell, J.J., Eds.; Elsevier: New York, NY, USA, 1998; pp. 519–576. [Google Scholar]
- Moore, K.; Ekwurzel, B.E.; Esser, B.K.; Hudson, G.B.; Moran, J.E. Sources of groundwater nitrate revealed using residence time and isotope methods. Appl. Geochem. 2006, 21, 1016–1029. [Google Scholar] [CrossRef] [Green Version]
- Billy, C.; Billen, G.; Sebilo, M.; Birgand, F.; Tournebize, J. Nitrogen isotopic composition of leached nitrate and soil organic matter as an indicator of denitrification in a sloping drained agricultural plot and adjacent uncultivated riparian buffer strips. Soil Biol. Biochem. 2010, 42, 108–117. [Google Scholar] [CrossRef]
- Evans, R.D. Physiological mechanisms influencing plant nitrogen isotope composition. Tren. Plant Sci. 2001, 6, 121–126. [Google Scholar] [CrossRef]
- Barnes, R.T.; Raymond, P.A. Land-use controls on sources and processing of nitrate in small watersheds: Insights from dual isotopic analysis. Ecol. Appl. 2010, 20, 1961–1978. [Google Scholar] [CrossRef] [PubMed]
- Chen, F.; Jia, G.; Chen, J. Nitrate sources and watershed denitrification inferred from nitrate dual isotopes in the Beijiang River, south China. Biogeochemistry 2009, 94, 163–174. [Google Scholar] [CrossRef]
- Jin, Z.; Qin, X.; Chen, L.; Jin, M.; Li, F. Using dual isotopes to evaluate sources and transformations of nitrate in the West Lake watershed, eastern China. J. Contam. Hydrol. 2015, 177, 64–75. [Google Scholar] [CrossRef] [PubMed]
- Xue, D.; De Baets, B.; Van Cleemput, O.; Hennessy, C.; Berglund, M.; Boeckx, P. Use of a Bayesian isotope mixing model to estimate proportional contributions of multiple nitrate sources in surface water. Environ. Pollut. 2012, 161, 43–49. [Google Scholar] [CrossRef] [PubMed]
- Fenech, C.; Rock, L.; Nolan, K.; Tobin, J.; Morrissey, A. The potential for a suite of isotope and chemical markers to differentiate sources of nitrate contamination: A review. Water Res. 2012, 46, 2023–2041. [Google Scholar] [CrossRef]
- Xue, D.; Botte, J.; De Baets, B.; Accoe, F.; Nestler, A.; Taylor, P.; Van Cleemput, O.; Berglund, M.; Boeckx, P. Present limitations and future prospects of stable isotope methods for nitrate source identification in surface- and groundwater. Water Res. 2009, 43, 1159–1170. [Google Scholar] [CrossRef] [PubMed]
- Minet, E.; Coxon, C.E.; Goodhue, R.; Richards, K.G.; Kalin, R.M.; Meier-Augenstein, W. Evaluating the utility of 15N and 18O isotope abundance analyses to identify nitrate sources: A soil zone study. Water Res. 2012, 46, 3723–3736. [Google Scholar] [CrossRef] [PubMed]
- Canfield, D.E.; Glazer, A.N.; Falkowski, P.G. The evolution and future of Earth’s nitrogen cycle. Science 2010, 330, 192–196. [Google Scholar] [CrossRef] [PubMed]
- Hollocher, T.C. Source of the oxygen atoms of nitrate in the oxidation of nitrite by nitrobacter agilis and the evidence against a P-O-N anhydride mechanism in oxidative phosphorylation. Arch. Biochem. Biophys. 1984, 233, 721–727. [Google Scholar] [CrossRef]
- Mayer, B.; Bollwerk, S.M.; Mansfeldt, T.; Hütter, B.; Veizer, J. The oxygen isotope composition of nitrate generated by nitrification in acid forest floors. Geochim. Cosmochim. Acta 2001, 65, 2743–2756. [Google Scholar] [CrossRef]
- Snider, D.M.; Spoelstra, J.; Schiff, S.L.; Venkiteswaran, J.J. Stable Oxygen Isotope Ratios of Nitrate Produced from Nitrification: 18O-Labeled Water Incubations of Agricultural and Temperate Forest Soils. Environ. Sci. Technol. 2010, 44, 5358–5364. [Google Scholar] [CrossRef]
- Kendall, C.; Elliot, E.M.; Wankel, S.D. Tracing anthropogenic inputs of nitrogen to ecosystems. In Stable Isotopes in Ecology and Environmental Science, 2nd ed.; Michener, R., Lajtha, K., Eds.; Blackwell Publishing: Malden, MA, USA, 2007; pp. 375–449. ISBN 9781405126809. [Google Scholar]
- Buchwald, C.; Casciotti, K.L. Oxygen isotopic fractionation and exchange during bacterial nitrite oxidation. Limnol. Oceanogr. 2010, 55, 1064–1074. [Google Scholar] [CrossRef] [Green Version]
- Knöller, K.; Vogt, C.; Haupt, M.; Feisthauer, S.; Richnow, H.-H. Experimental investigation of nitrogen and oxygen isotope fractionation in nitrate and nitrite during denitrification. Biogeochemistry 2011, 103, 371–384. [Google Scholar] [CrossRef]
- Casciotti, K.L.; Sigman, D.M.; Hastings, M.G.; Böhlke, J.K.; Hilkert, A. Measurement of the oxygen isotopic composition of nitrate in seawater and freshwater using the denitrifier method. Anal. Chem. 2002, 74, 4905–4912. [Google Scholar] [CrossRef]
- Singleton, M.J.; Hudson, G. Membrane Inlet Mass Spectrometry for Measuring Dissolved Gases; UCRL-TR-214564; Lawrence Livermore National Laboratory: Livermore, CA, USA, 2005; 2p.
- Singleton, M.J.; Moran, J.E.; Roberts, S.R.; Hillegonds, D.J.; Esser, B.K. California GAMA Special Study: An Isotopic and Dissolved Gas Investigation of Nitrate Source and Transport to a Public Supply Well in California’s Central Valley; LLNL-TR-42795; Lawrence Livermore National Laboratory: Livermore, CA, USA, 2010; 28p.
- Pedersen, H.; Dunkin, K.A.; Firestone, M.K. The relative importance of autotrophic and heterotrophic nitrification in a conifer forest soil as measured by N-15 tracer and pool dilution techniques. Biogeochemistry 1999, 44, 135–150. [Google Scholar] [CrossRef]
- Caranto, J.; Lancaster, K.M. Nitric oxide is an obligate bacterial nitrification intermediate produced by hydroxylamine oxidoreductase. Proc. Natl. Acad. Sci. USA 2017, 114, 8217–8222. [Google Scholar] [CrossRef] [PubMed] [Green Version]
- Laverman, A.M.; Meile, C.; Van Cappellen, P.; Wieringa, E.B.A. Vertical distribution of denitrification in an estuarine sediment: Integrating sediment flowthrough reactor experiments and microprofiling via reactive transport modeling. Appl. Environ. Microbiol. 2001, 73, 40–47. [Google Scholar] [CrossRef] [PubMed]
- Nishizawa, M.; Sakai, S.; Konno, U.; Nakahara, N.; Takaki, Y.; Saito, Y.; Imachi, H.; Tasumi, E.; Makabe, A.; Koba, K.; Takai, K. Nitrogen and oxygen isotope effects of ammonia oxidation by thermophilic thaumarchaeota from a geothermal water stream. Appl. Environ. Microbiol. 2016, 82, 4492–4504. [Google Scholar] [CrossRef] [PubMed]
- Nolan, B.T.; Hitt, K.J.; Ruddy, B.C. Probability of nitrate contamination of recently recharged groundwaters in the conterminous United States. Environ. Sci. Technol. 2002, 36, 2138–2145. [Google Scholar] [CrossRef] [PubMed]
- Visser, A.; Moran, J.E.; Aql, R.; Singleton, M.J.; Esser, B.K. Examination of Water Quality in “Tritium-Dead” Drinking Water Wells; LLNL-TR-558107; Lawrence Livermore National Laboratory: Livermore, CA, USA, 2013; 54p.
- Tomich, T.P.; Brodt, S.B.; Dahlgren, R.A.; Scow, K.M. The California Nitrogen Assessment Challenges and Solutions for People, Agriculture, and the Environment; University of California Press: Oakland, CA, USA, 2016; 304p. [Google Scholar]
- U.S. Census Bureau. Historical Census of Housing Tables: Sewage Disposal. 2011. Available online: https://www.census.gov/hhes/www/housing/census/historic/sewage.html (accessed on 20 March 2018).
- U.S. Environmental Protection Agency. Sewage Sludge Use and Disposal Reuse (40 CFR Part 503)—Fact Sheet. Available online: https://www.ecfr.gov/cgi-bin/retrieveECFR?gp=2&SID=3ba5c96eb4bfc5bfdfa86764a30e9901&ty=HTML&h=L&n=pt40.30.503&r=PART (accessed on 20 April 2017).
- Ruddy, B.C.; Lorenz, D.L.; Mueller, D.K. County-Level Estimates of Nutrient Inputs to the Land Surface of the Conterminous United States, 1982–2001; U.S. Geological Survey Scientific Investigations Report; 2006-5012; U.S. Geological Survey: Reston, VA, USA, 2006; 17p.
- Viers, J.H.; Liptzin, D.; Rosenstock, T.S.; Jensen, V.B.; Hollander, A.D.; McNally, A.; King, A.M.; Kourakos, G.; Lopez, E.M.; De LaMora, N.; et al. Nitrogen Sources and Loading to Groundwater. Technical Report 2 in: Addressing Nitrate in California’s Drinking Water with a Focus on Tulare Lake Basin and Salinas Valley Groundwater. Report for the State Water Resources Control Board Report to the Legislature; Center for Watershed Sciences, University of California: Davis, CA, USA, 2012. [Google Scholar]
- Harter, T.; Lund, J.R. Addressing Nitrate in California’s Drinking Water: With a Focus on Tulare Lake Basin and Salinas Valley Groundwater. Report for the California State Water Resources Control Board; Center for Watershed Sciences, University of California: Davis, CA, USA, 2012; 80p. [Google Scholar]
- Kool, D.M.; Wrage, N.; Oenema, O.; Van Kessel, C.; Van Groenigen, J.W. Oxygen exchange with water alters the oxygen isotopic signature of nitrate in soil ecosystems. Soil Biol. Biochem. 2011, 43, 1180–1185. [Google Scholar] [CrossRef]
- Glass, C.; Silverstein, J. Denitrification kinetics of high nitrate concentration water: PH effect of inhibition and nitrite accumulation. Water Res. 1997, 32, 831–839. [Google Scholar] [CrossRef]
- Paul, E.A.; Clarke, F.E. Soil Microbiology and Biochemistry; Academic Press: San Diego, CA, USA, 1989. [Google Scholar]
- Shen, Q.R.; Ran, W.; Cao, Z.H. Mechanisms of nitrite accumulation occurring in soil nitrification. Chemosphere 2003, 50, 747–753. [Google Scholar] [CrossRef]
- Kaneko, M.; Poulson, S.R. The rate of oxygen isotope exchange between nitrate and water. Geochim. Cosmochim. Acta 2013, 118, 148–156. [Google Scholar] [CrossRef]
Figure 1.
California map showing all sample points used in this study. Color variation is from the USDA Cropland Data Layer. Most of the samples are concentrated within California’s Central Valley, which produces a high volume and diverse selection of agricultural products. The Farmland Mapping and Monitoring Program (FMMP) layer, which is not shown here, was used to define areas of confined animal agriculture, and to cross-check Cropland Data Layer (CDL) findings.

Figure 2.
Plotting δ18O-H2O versus δ18O-NO3− reveals the relationship between the isotopic composition of oxygen for groundwater and nitrate. Solid green line is modeled after Equation (1), and the dashed orange line labeled ‘Excess δ18O-NO3−’ is one positive standard deviation away from the predicted value, and separates the light blue, or ‘excess’ samples.

Figure 3.
Results for stable isotopes of water for samples categorized as ‘excess’ and ‘nonexcess’. The red line represents the Global Meteoric Water Line, which follows the equation δ2H-H2O = 8* δ18O-H2O + 10.
Figure 3.
Results for stable isotopes of water for samples categorized as ‘excess’ and ‘nonexcess’. The red line represents the Global Meteoric Water Line, which follows the equation δ2H-H2O = 8* δ18O-H2O + 10.

Figure 4.
Focusing on a specific section of California’s Central Valley, centered around Fresno, three subgroupings of samples were chosen. Samples across several crop types are shown with yellow symbols (n = 25), samples in the undeveloped Sierra foothills with purple symbols (n = 15), and samples in a developed urban area with gray (n = 26). Shown also are average nitrate concentrations and isotopic ratios across the three defined land-use categories. [NO3−] and δ18O-H2O follow expectations for higher nitrate loading, and use of imported river water for irrigation, respectively, by farmland.

Figure 5.
For δ18O-NO3−, the measured value is shown as the colored bar, and the mean value predicted by Equation (1) (using 23.5‰ for O2 and the mean measured δ18O-H2O) is shown in black text.
Figure 5.
For δ18O-NO3−, the measured value is shown as the colored bar, and the mean value predicted by Equation (1) (using 23.5‰ for O2 and the mean measured δ18O-H2O) is shown in black text.

Figure 6.
δ18O-H2O vs. δ18O-NO3− with lines showing predicted values following Equation (1) of Snider et al., 2010. Three separate lines are shown, tightly grouped, using differing values of abiotic exchange (fabiotic). The orange line labeled ‘Excess‘ is 1 σ above the line using fabiotic = 0.52.
Figure 6.
δ18O-H2O vs. δ18O-NO3− with lines showing predicted values following Equation (1) of Snider et al., 2010. Three separate lines are shown, tightly grouped, using differing values of abiotic exchange (fabiotic). The orange line labeled ‘Excess‘ is 1 σ above the line using fabiotic = 0.52.

Figure 7.
Dual nitrate isotope plot with samples grouped by land use. Source fields are modified from Kendall, 1998. Ranges for synthetic fertilizer δ15N are lower due to the atmospheric N source, whereas animal digestion and excretion enriches δ15N of the resulting manure. δ18O-NO3− values are adjusted for compositions typical of California, based on the likely δ18O-H2O range, as described in the text.

Figure 8.
Dual nitrate isotope plots for the five sample groupings, with sample points scaled for nitrate concentration. Denitrification trends are evident in the Central Valley dairy, Butte Country Agriculture, and LA County samples. Two sources can be inferred from the Los Angeles plot: lower [NO3−] clustered around 2-4 δ15N-NO3− likely representing background levels from natural processes, and higher [NO3−] forming between 5-12 δ15N-NO3−, likely from wastewater sources.


Table 1.
Values compiled from several sources to model kinetic isotope effects and abiotic exchange on the oxygen isotopic composition of NO3− during nitrification. The colored values for fabiotic correspond to the colored line in Figure 6. Here, we used an average of the values shown for εk,H20.
Table 1.
Values compiled from several sources to model kinetic isotope effects and abiotic exchange on the oxygen isotopic composition of NO3− during nitrification. The colored values for fabiotic correspond to the colored line in Figure 6. Here, we used an average of the values shown for εk,H20.
| fabiotic | εk,O2 | εk,H2O | εk,eq | |
|---|---|---|---|---|
| 0.37 | 10 | 17.8 | 14 | |
| 0.52 | 12.3 | |||
| 0.88 | 15.6 | |||
| 15.2 | ||||
| source | [18] | [28] | [20] | [18] |
© 2019 by the authors. Licensee MDPI, Basel, Switzerland. This article is an open access article distributed under the terms and conditions of the Creative Commons Attribution (CC BY) license (http://creativecommons.org/licenses/by/4.0/).
Share and Cite
MDPI and ACS Style
Veale, N.; Visser, A.; Esser, B.; Singleton, M.J.; Moran, J.E. Nitrogen Cycle Dynamics Revealed Through δ18O-NO3− Analysis in California Groundwater. Geosciences 2019, 9, 95. https://doi.org/10.3390/geosciences9020095
AMA Style
Veale N, Visser A, Esser B, Singleton MJ, Moran JE. Nitrogen Cycle Dynamics Revealed Through δ18O-NO3− Analysis in California Groundwater. Geosciences. 2019; 9(2):95. https://doi.org/10.3390/geosciences9020095
Chicago/Turabian StyleVeale, Nate, Ate Visser, Bradley Esser, Michael J. Singleton, and Jean E. Moran. 2019. "Nitrogen Cycle Dynamics Revealed Through δ18O-NO3− Analysis in California Groundwater" Geosciences 9, no. 2: 95. https://doi.org/10.3390/geosciences9020095
Note that from the first issue of 2016, this journal uses article numbers instead of page numbers. See further details here.