1. Introduction
Hurricane Sandy struck the New York–New Jersey area in late October 2012 with record storm surge and vast coastal erosion [
1]. In the aftermath of Hurricane Sandy, a variety of efforts associated with beach nourishment were applied to re-build the beach and dune system and to re-create its geomorphological character and accompanying habitats. Subsequently, in 2016, the National Fish and Wildlife Foundation (NFWF) funded several proposals to assess the outcomes of beach nourishment projects that were conducted to assist in the recovery [
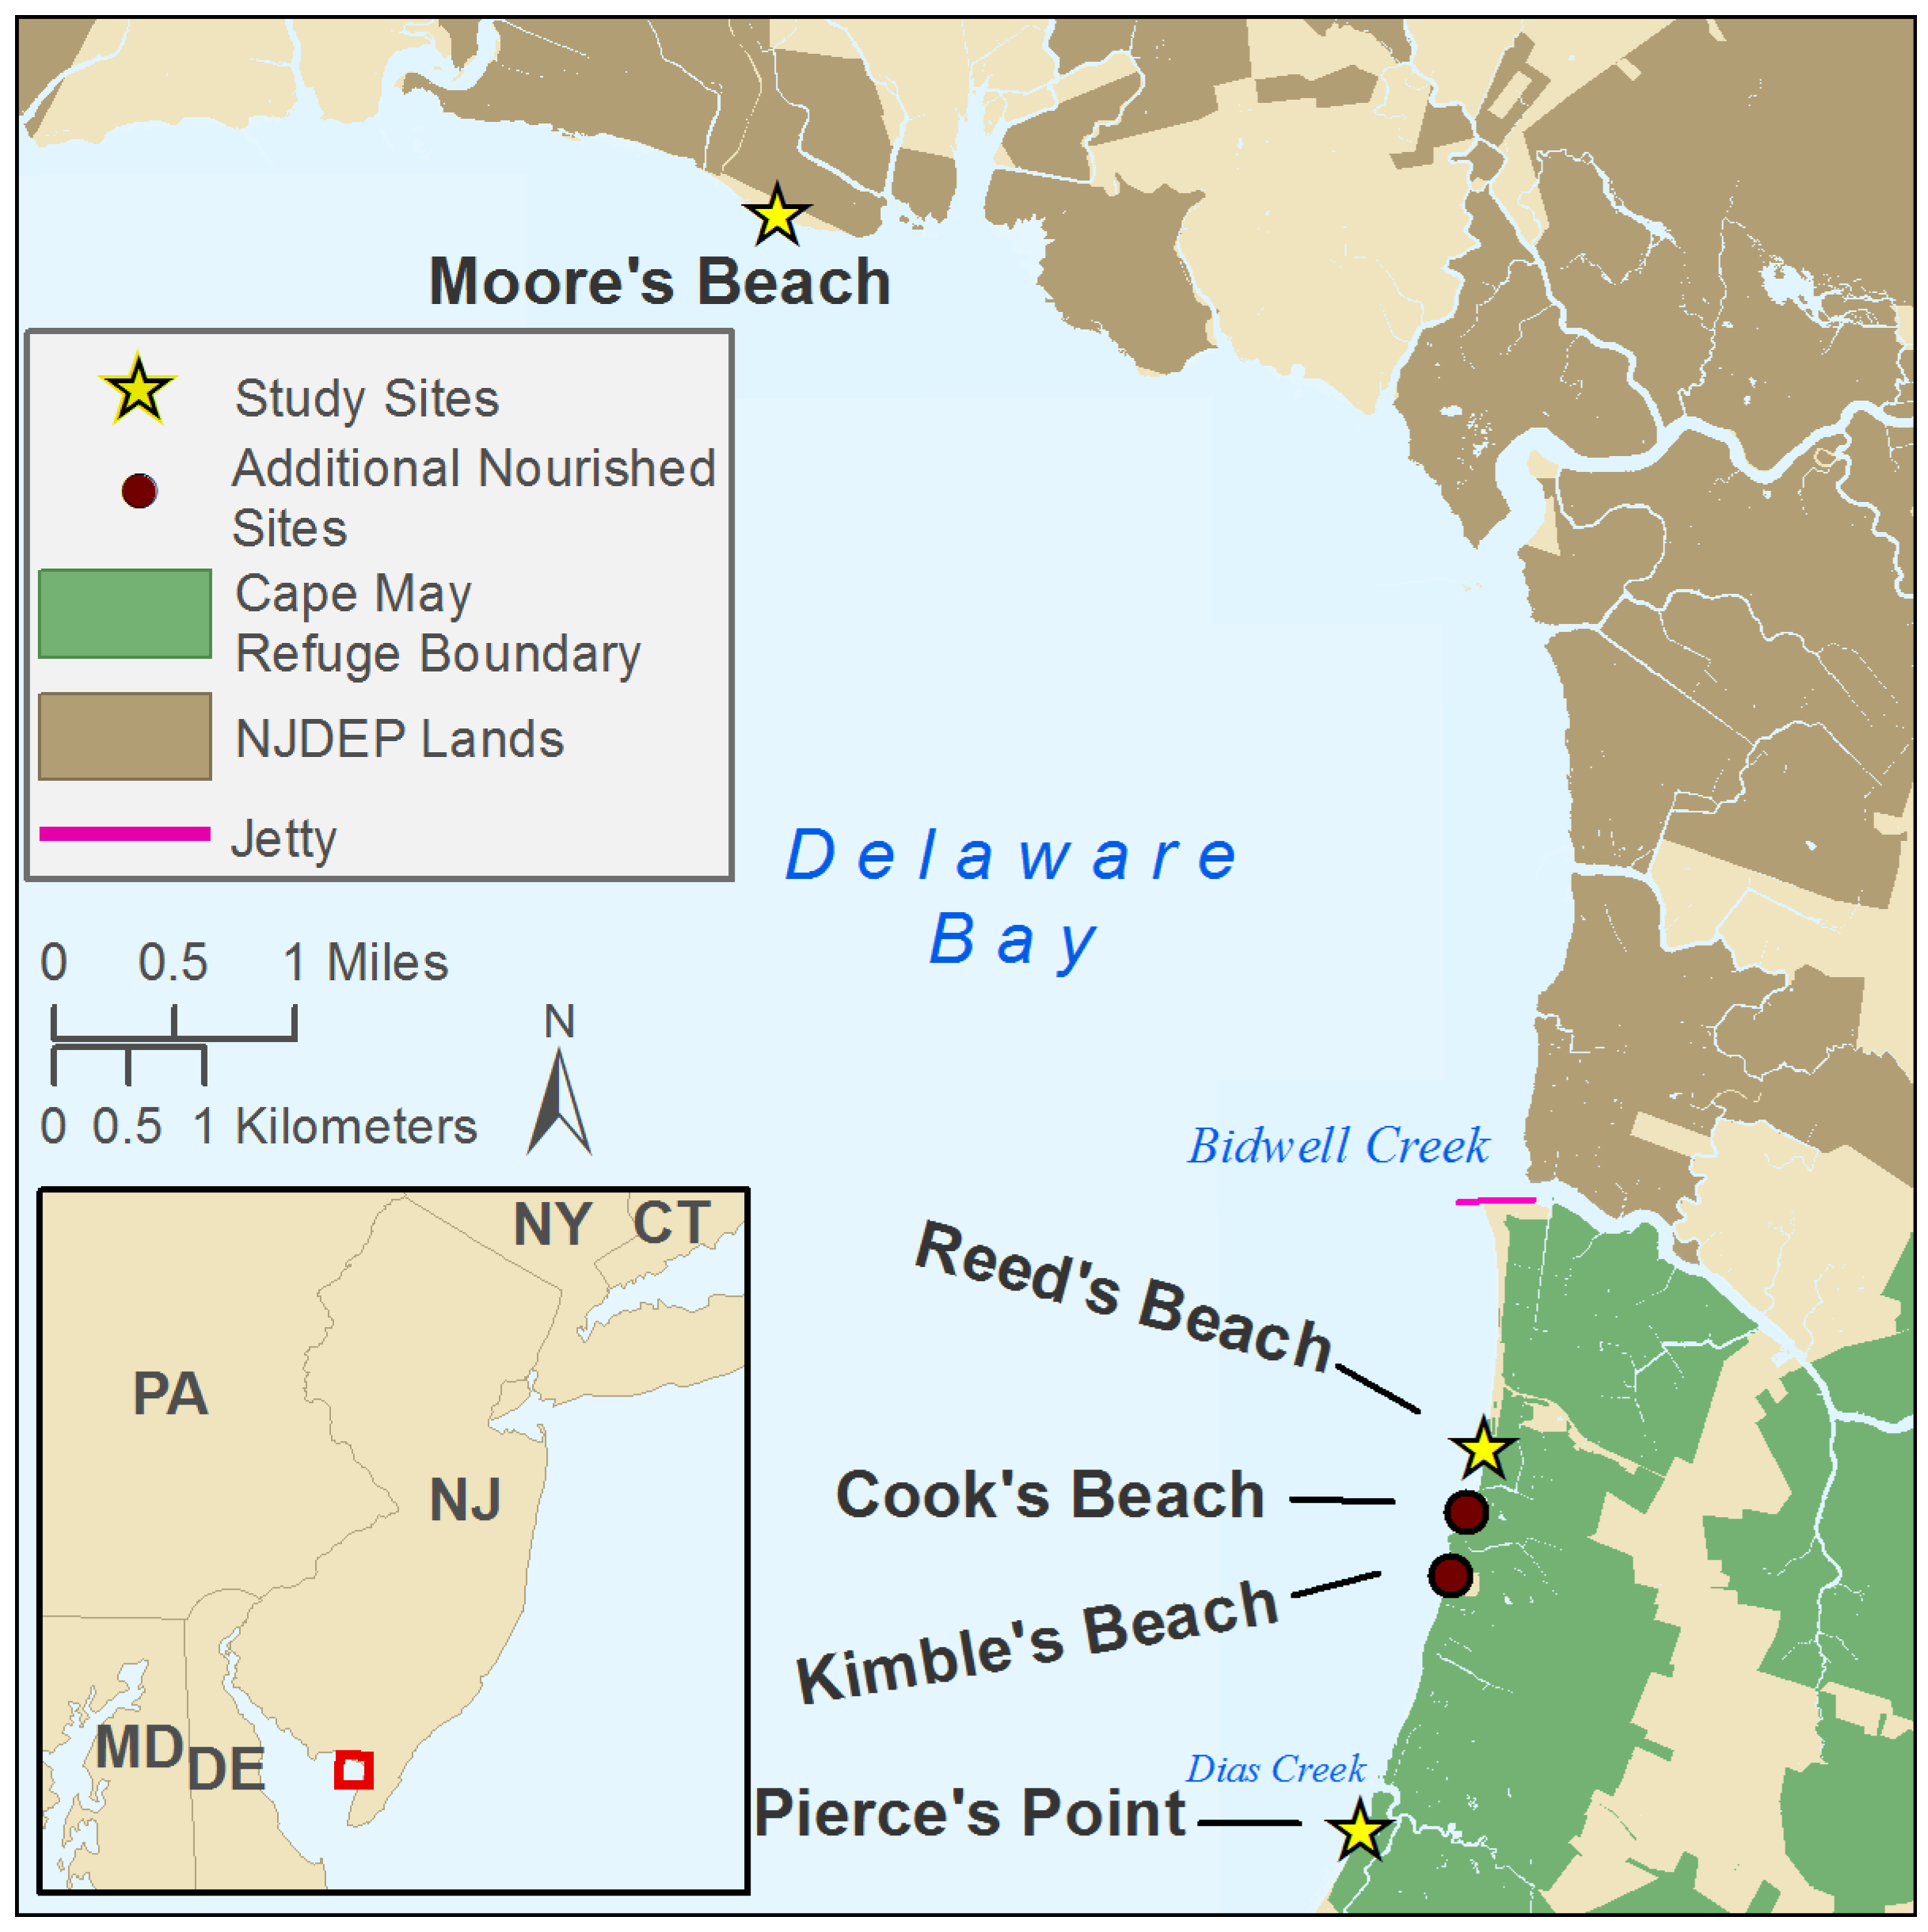
2]. This is a study from one of the NFWF-funded projects: detailing the methodology applied, the metrics derived, and the evaluation of the nourishment products at three beaches in the Delaware Bay estuary, New Jersey (
Figure 1).
Estuarine beaches in sites of restricted fetch are especially vulnerable to storm impacts because of a lack of a continuing input of sediment supply to buffer episodic sediment loss [
3,
4]. Estuarine beaches are also prone to a stepwise displacement that may result in the loss of beach and dune features as well as components of the habitat because of negative sediment budget at the local scale. Attempts at modifying sediment budget through beach nourishment offer an opportunity to re-establish the beach and dune features and their associated habitats. However, the continued retention of the morphological features remains dependent on the spatial sediment budget and the temporal evolution of the site. This study provides metrics on the morphological characteristics of sites of three estuarine beaches in New Jersey that were eroded during Hurricane Sandy, received post-Sandy nourishment to improve horseshoe crab and red knot habitat, and have evolved under the post-Sandy drivers of limited sediment availability, fetch-restricted incident wave energy, local sediment budget, and long-term impacts of sea-level rise [
5,
6]. A comparative analysis of the sites at four different points in time is derived through the construction and compartmentalization of digital elevation models of recovery, retention, and displacement of the offshore tidal flats, beaches, and dune features at the three sites.
In the US, a long history of placing sediment on beaches to balance the local sediment budget has resulted in reviews of the efficacy of such action as well as the arguments that sediment placement both restores habitats and provides additional buffering to the anthropogenic development inland of the nourished beaches [
7,
8,
9,
10,
11,
12,
13]. Estuarine beaches have become the sites of increased interest for sediment placement as development pressures and management issues have increased [
3,
14,
15,
16,
17,
18]. The expanded interest has also been augmented by the relatively recent creation of National Estuarine Research Reserves at 29 sites within the USA that incorporate a variety of projects intended to reduce the effects of erosion and to promote the regeneration of the habitats in this reduced energy environment [
19]. Among this site-specific interest in estuarine beaches, there is a concern for the temporal and spatial connection between actions and the resulting impacts expressed as an element in evaluation of performance in coastal restoration attempts [
4,
20], incorporating a need to consider the impacts of outcomes as well as the achievement of goals.
As a means to provide evaluation of the geomorphological vectors of change at the local level, Sherman [
21] and Rosati [
22] have indicated that the most informative metric is sediment budget, the spatial–temporal measure of sediment input and output at the scale of several kilometers. Cooper and Pethick [
23] and Marchand et al. [
24] indicate that sediment budget is appropriate to management decision-making because the scales of application are similar. This attribute is linked to the portrayal of sediment budget and outcomes as net conditions at the temporal scale rather than a focus on individual events [
25,
26,
27]. Therefore, the data gathering thrust in this study is directed toward a collection of datasets on a seasonal basis that represent steps in the vectors of change to generate metrics of net sediment budget and evolution of geomorphological features associated with the beach nourishment.
1.1. Local Drivers
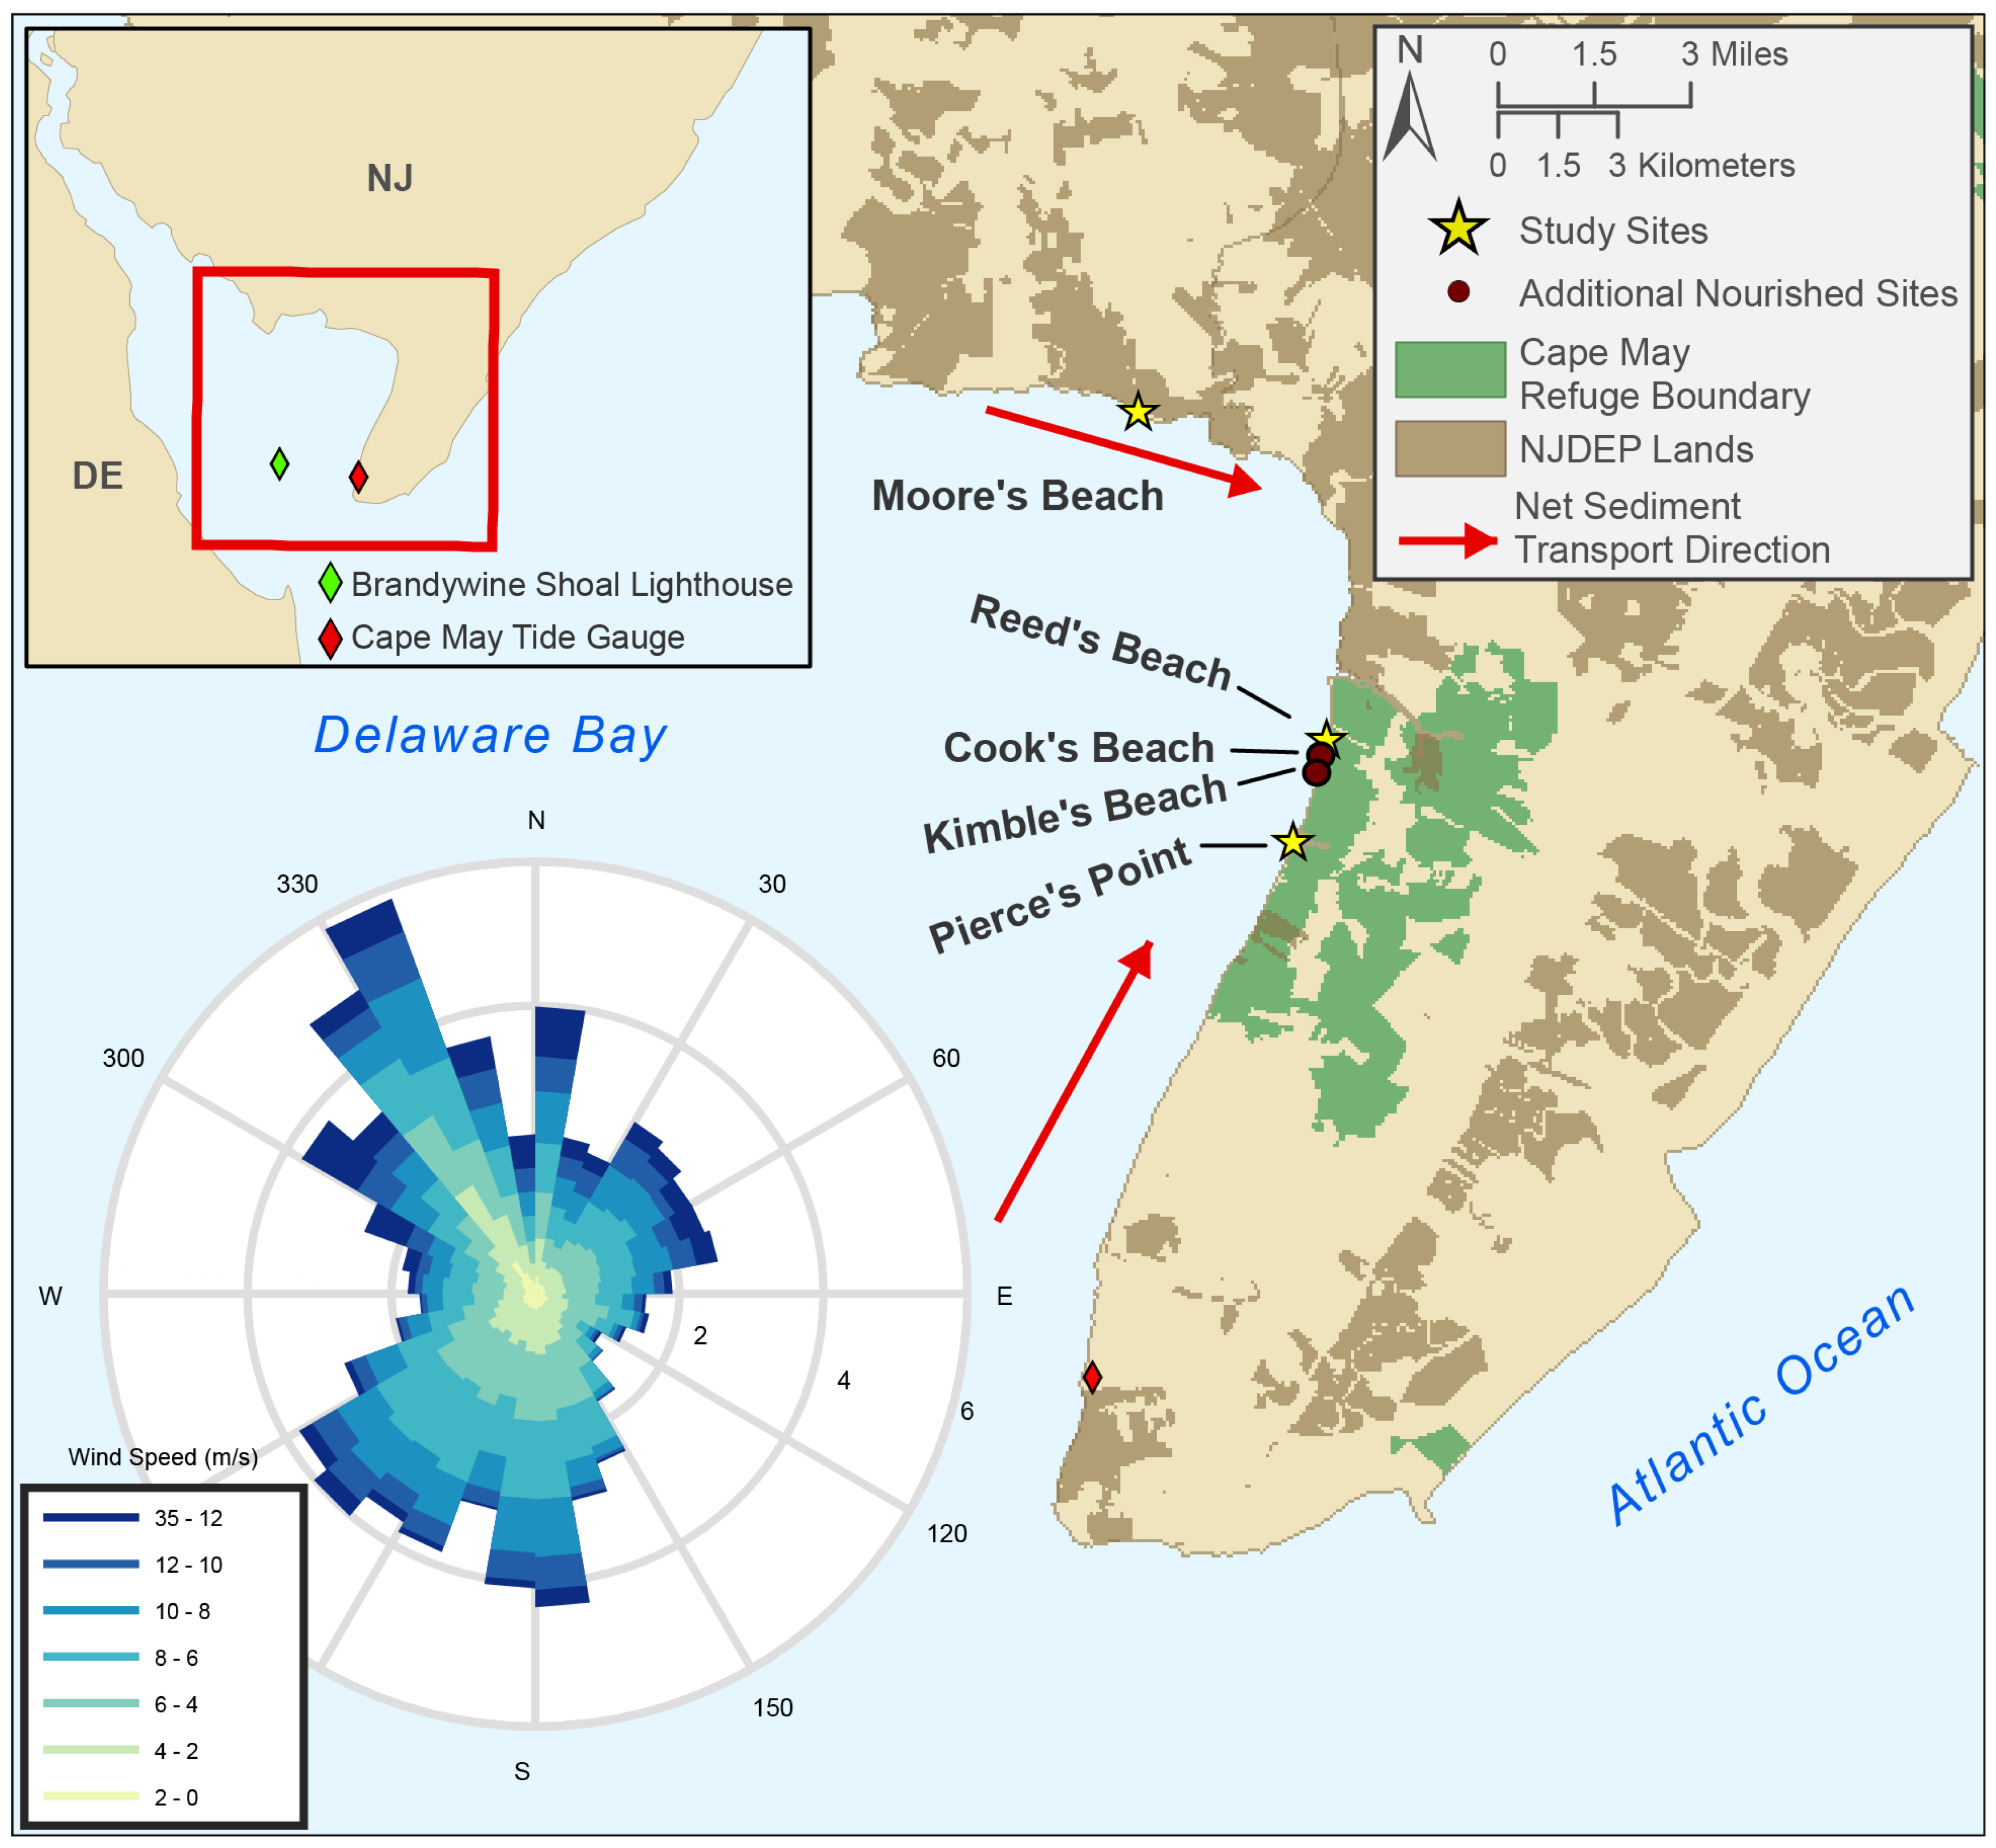
A primary driver of shoreline response is the incident wave record that establishes the net direction and magnitude of inshore sediment transport. Whereas there is no long-term record of the waves present along these three estuarine locations in Delaware Bay, a wind record does exist at a buoy located in the bay [
28] (
Figure 2). These data indicate major wind directions are from the northwest and from the southwest, thereby having considerable effect on the New Jersey side of Delaware Bay. However, the southwest winds (and associated waves and currents from the southwest) are dominant at the study sites because of the sheltering effect of the landmass to the north of the three sites. The result is a net dominant flow and alongshore transport to the north at Pierce’s Point and Reed’s Beach, and a net dominant flow and alongshore transport to the east at Moore’s Beach. Furthermore, the restricted-fetch environment limits the potential for incident waves to interact with the offshore sediments, thereby reducing the opportunity for cross-shore transport [
29,
30,
31,
32]. The result is a relative concentration of sediment transport along the beach face and nearshore by alongshore processes and interaction with natural and anthropogenic features in the vicinity of the shoreline.
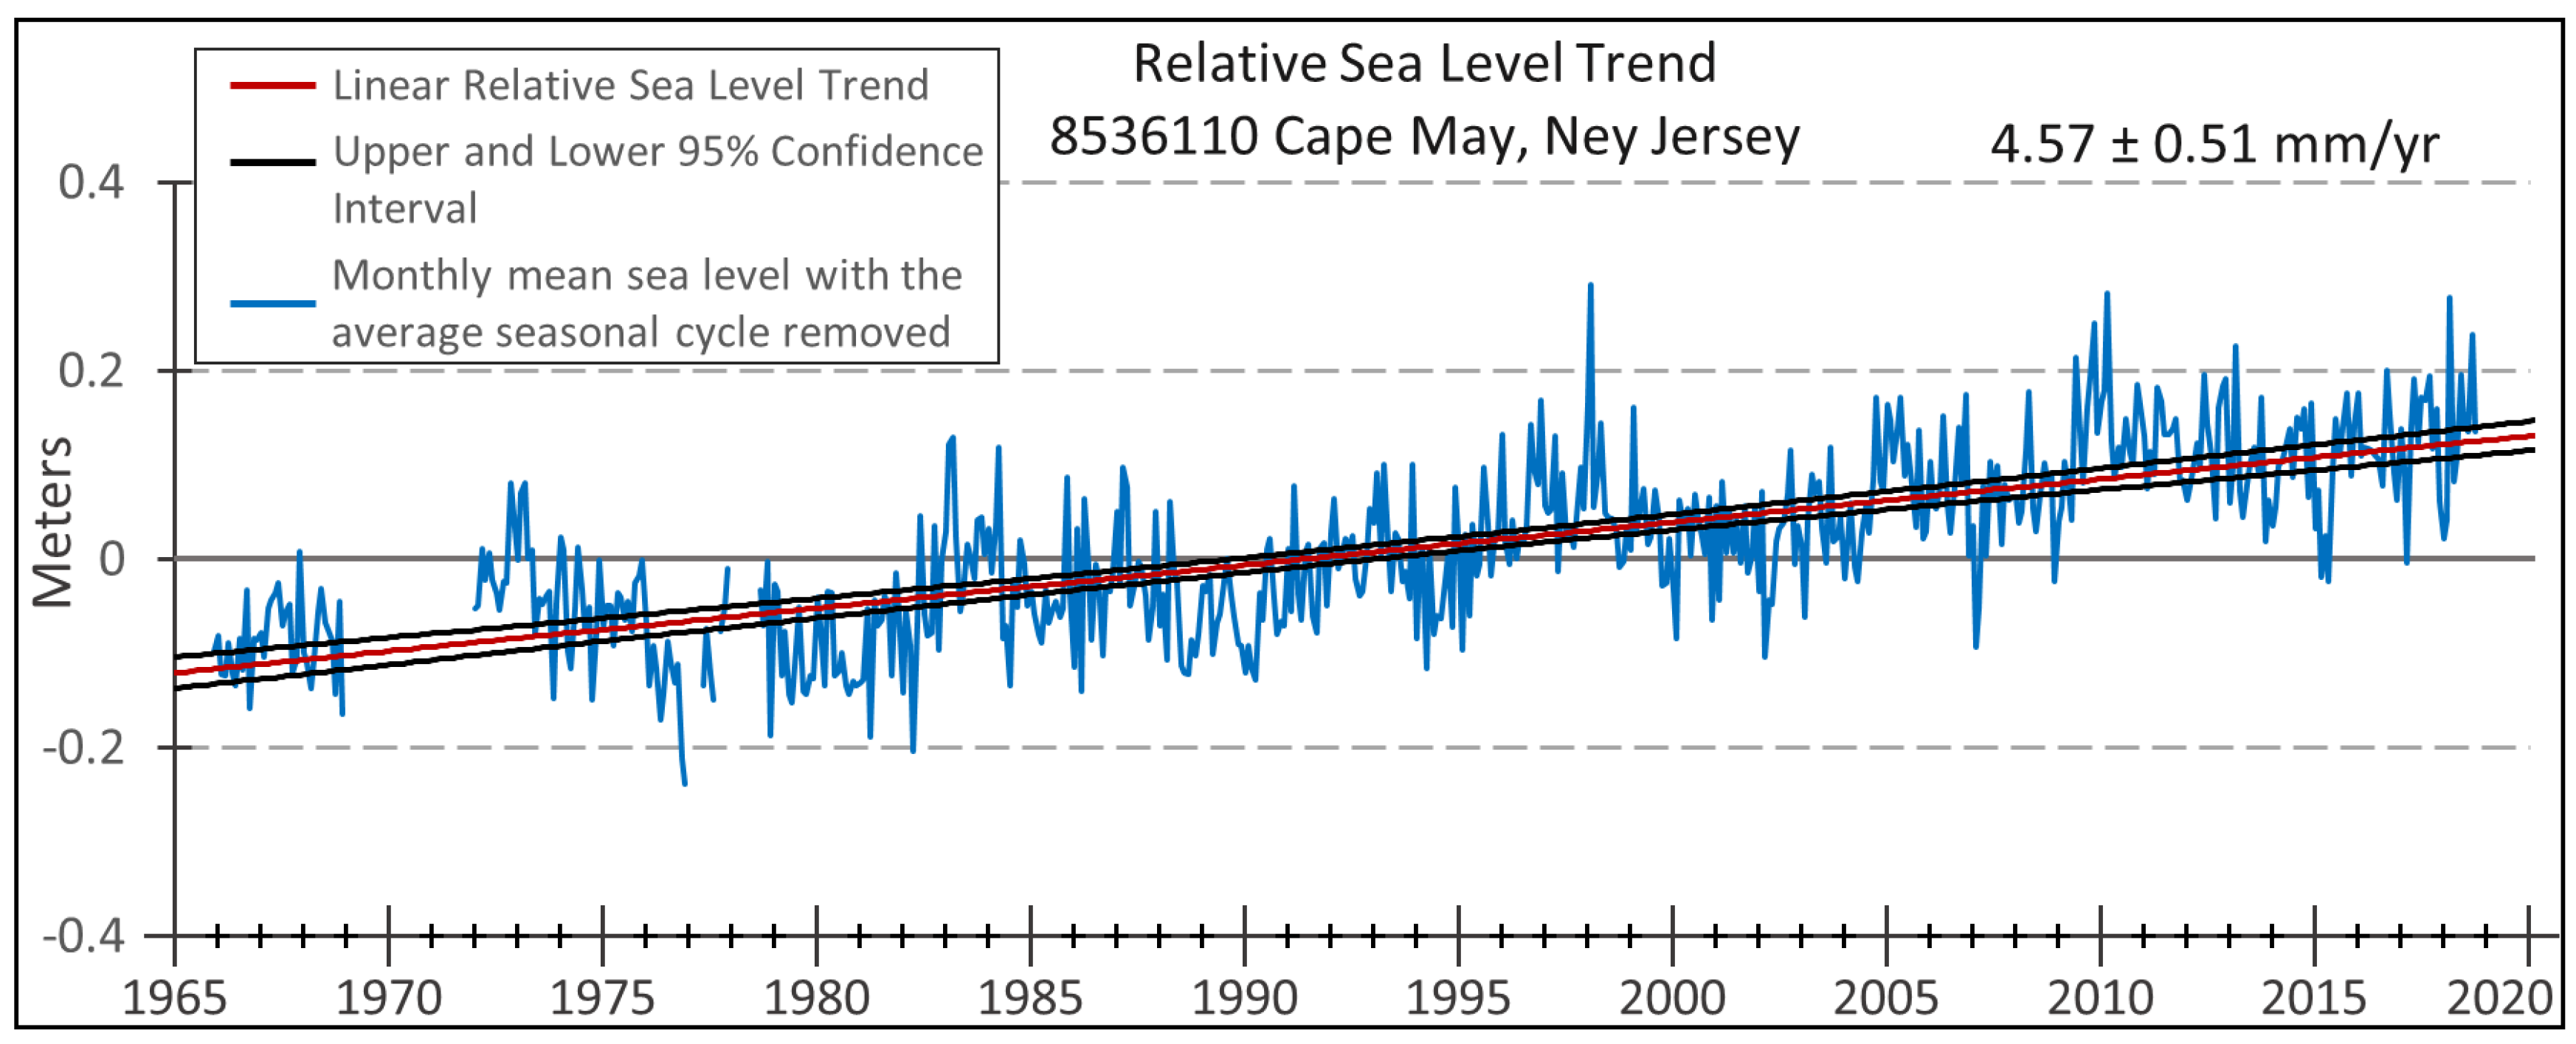
A secondary driver affecting morphological development at these sites is relative sea-level rise. The record at the nearby Cape May tide gauge indicates a rate of 4.57 mm/year [
33] (
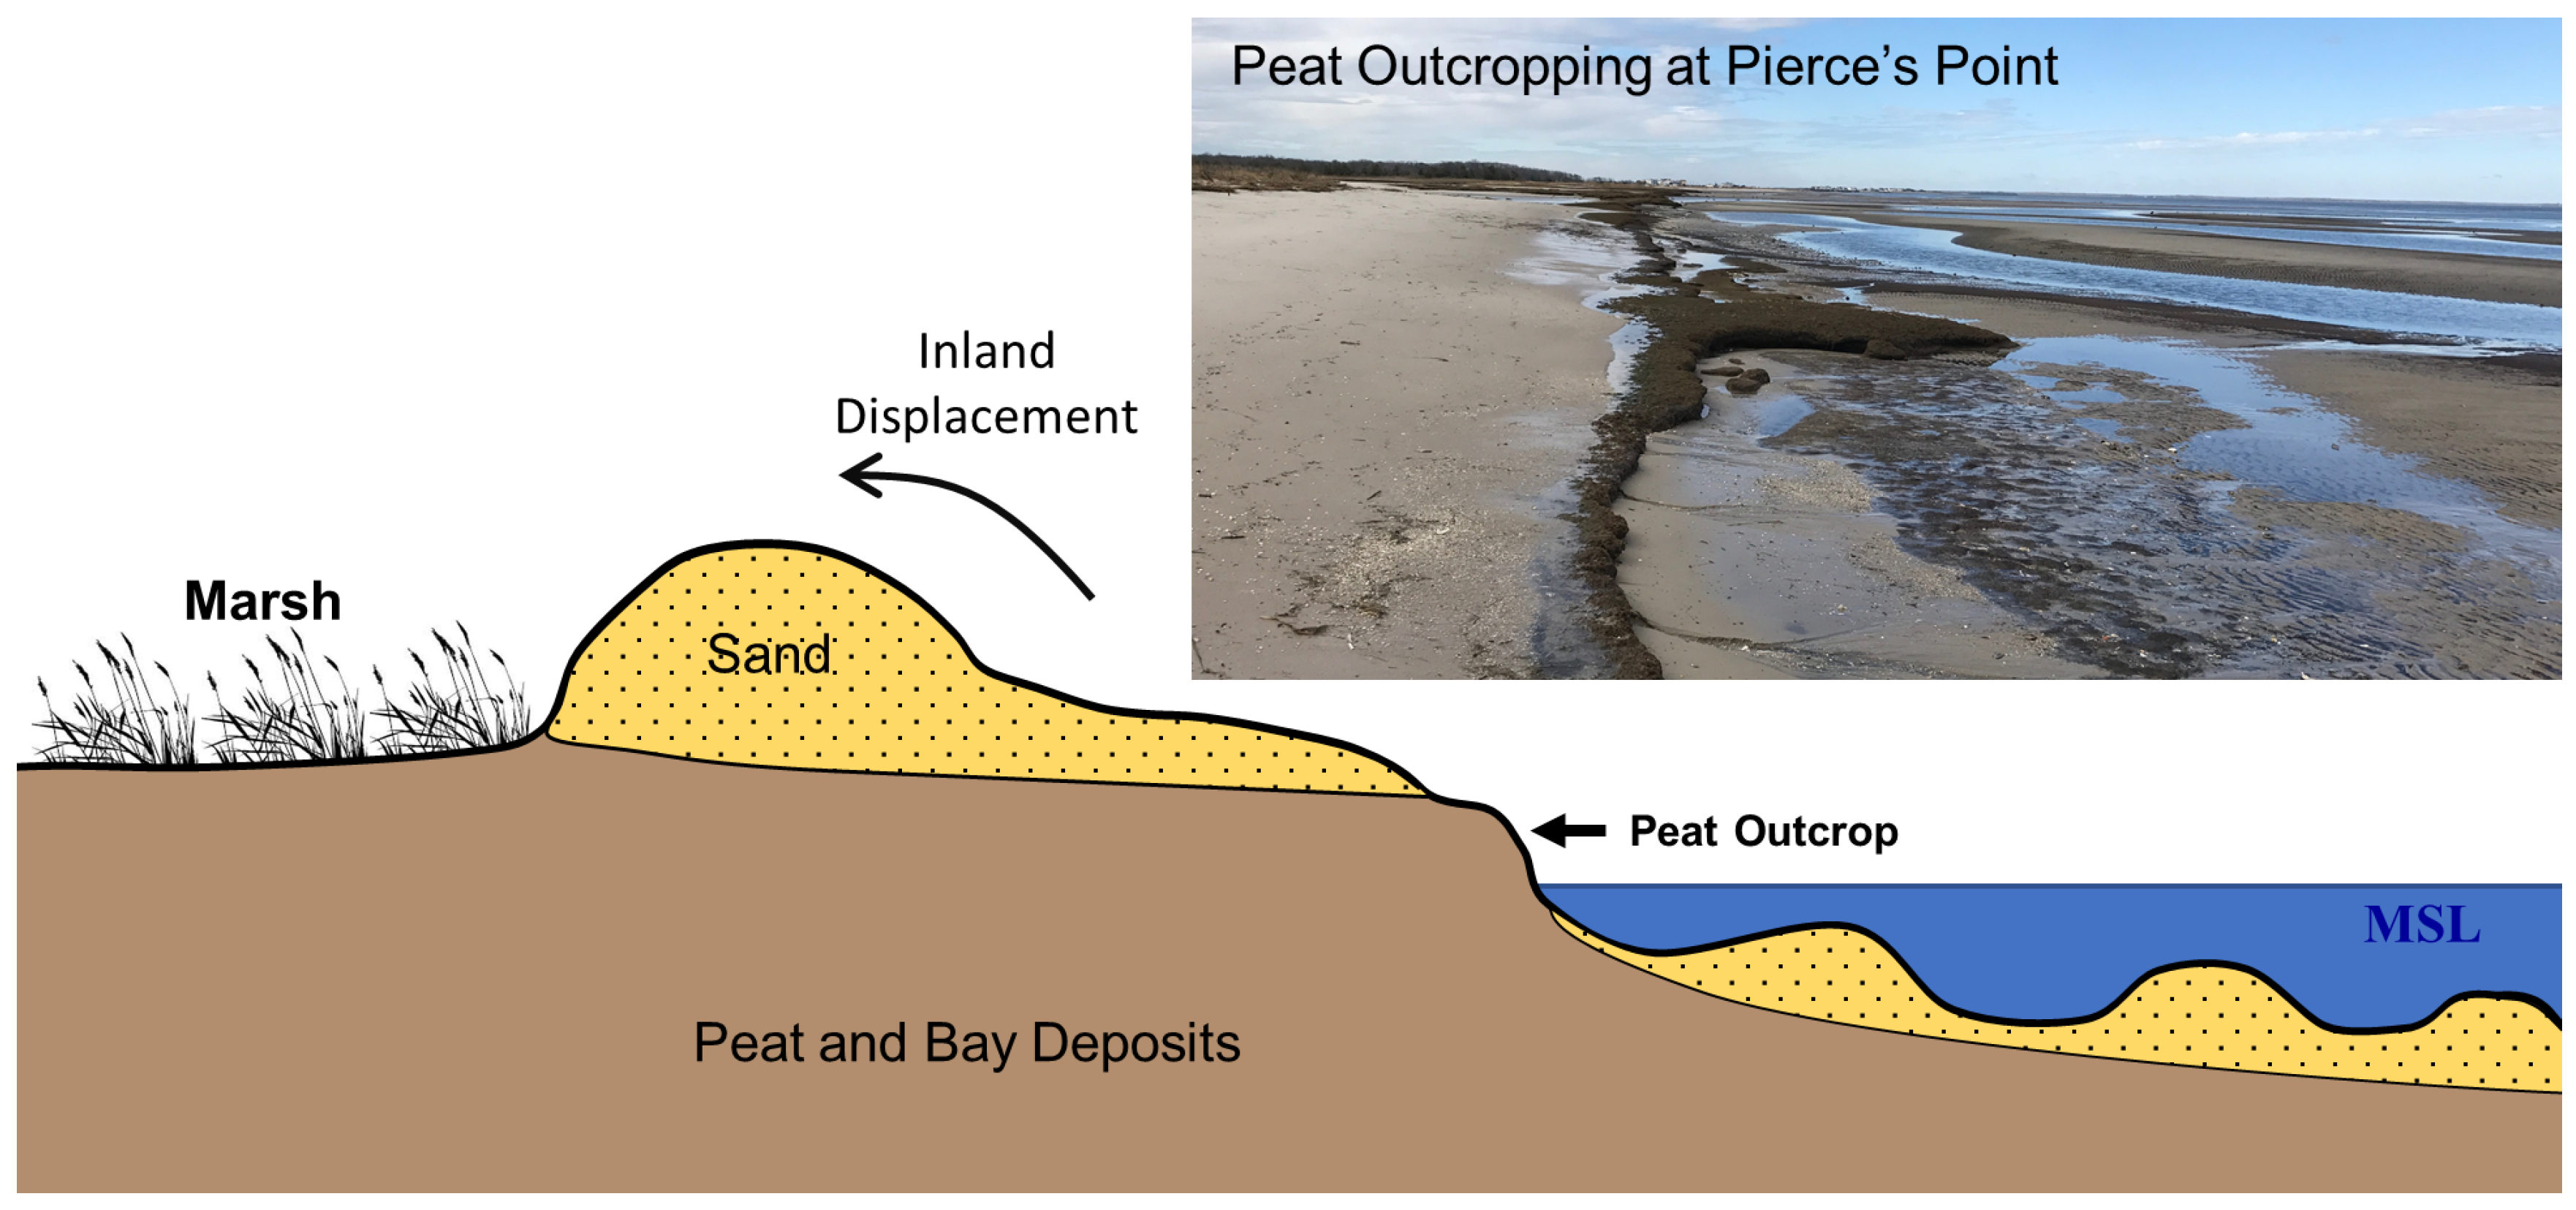
Figure 3). Coupled with a negative or balanced sediment budget, the morphological effect in this barrier island environment is the variable rate of inland displacement of the beach and dune features that migrate over an adjacent wetland and result in outcrops of peat in the beach profile in a rollover mode [
23,
34] (
Figure 4). As the beach feature migrates inland, the exposed peat feature will erode as well. However, it may be displaced at a different rate due to it not eroding as individual grains, but as larger masses of peat. Locations of tidal channels, overwash deposits, inland topography, and local sediment supply will determine the location and extent of peat exposures at the shore and the extent of the subaerial and nearshore sand features.
1.2. Site Locations
In general, the estuarine beaches along the New Jersey portion of Delaware Bay occur along narrow barrier spits and barrier islands separated from the mainland by a wetland [
35], a classic barrier island scenario. Several small streams drain the mainland but do not transport sufficient sediment to create deltaic forms at their mouths nor contribute much to alongshore transport. As a result, most of the estuarine coast is characterized by short tidal creeks with small shoals at the creek mouths, and a suite of subaerial geomorphological features that accompany the inland transgression of the barrier island across the adjacent marshland. The presence of groins and jetties on the shoreline alter the alongshore transport processes, and bulkheads associated with housing impact the resulting beach and dune geomorphologies at the local level.
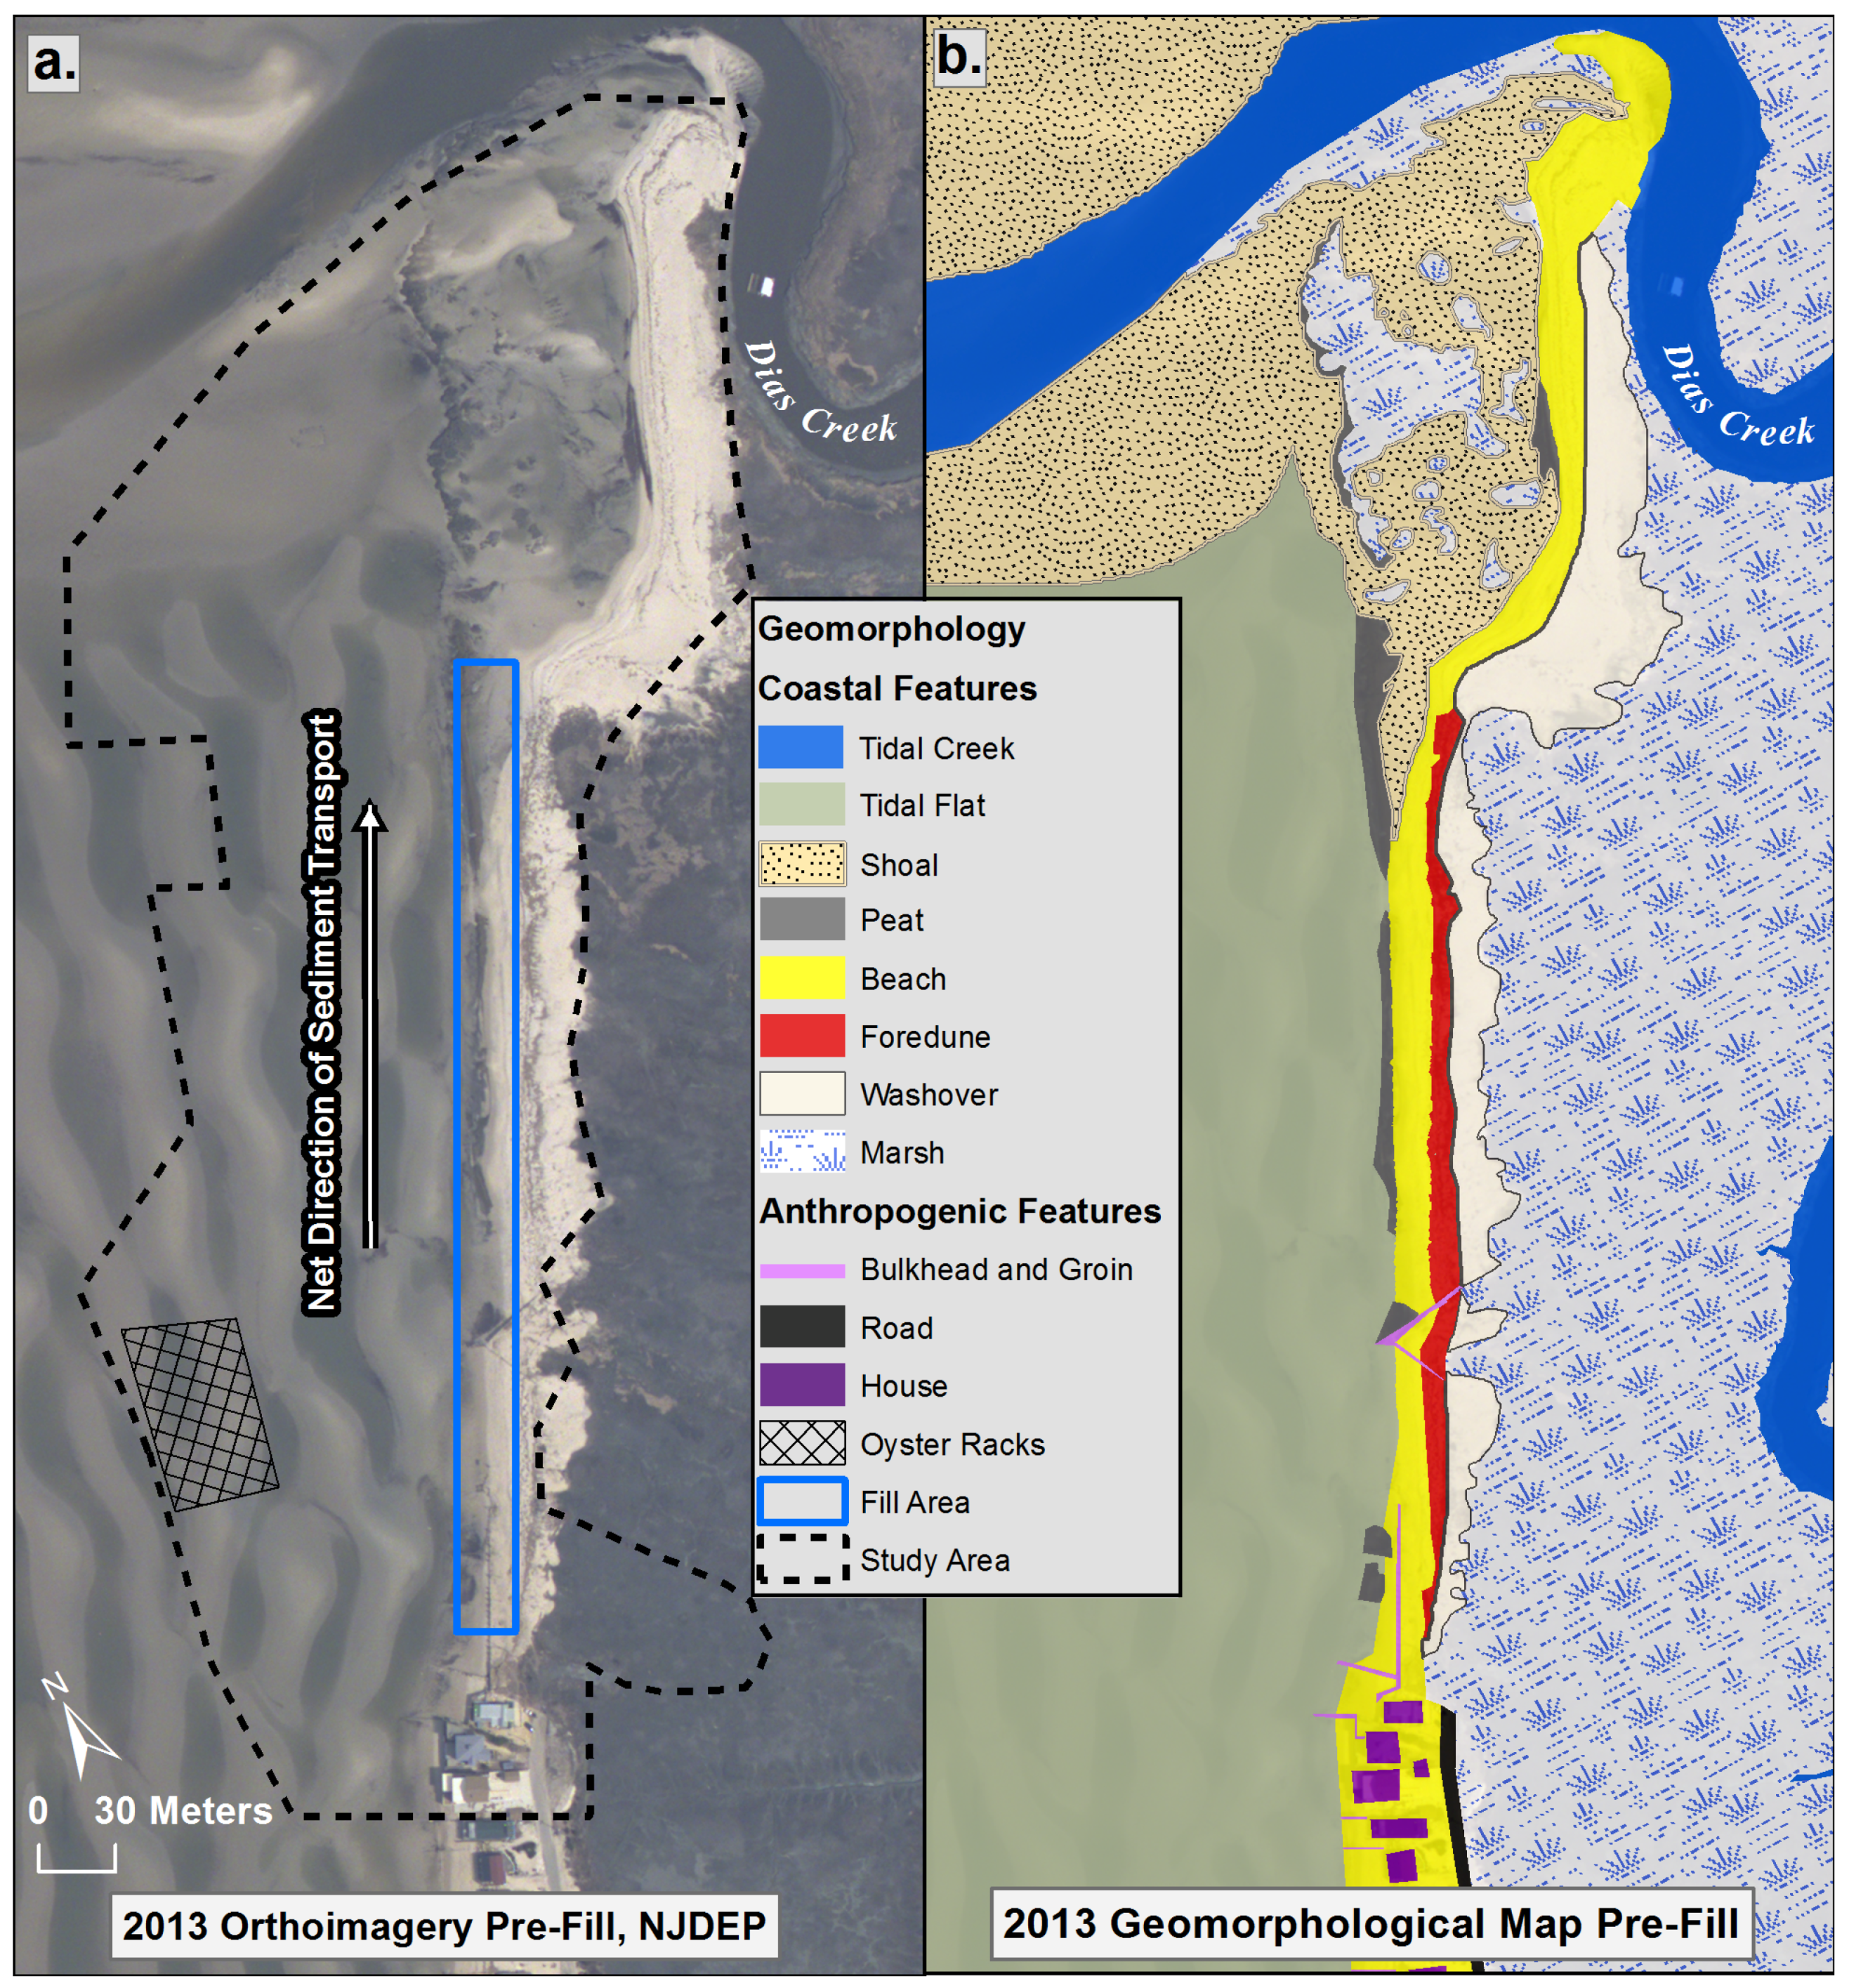
1.2.1. Pierce’s Point
This study site extends northerly alongshore from a cluster of houses to Dias Creek for 670 m and cross-shore for about 250 m (
Figure 5). The houses had bulkheads and short wooden groins on their seaward margin and the presence of a beach-dune morphology was absent for most of the housing development. Prior to the placement of sediment on the beach starting in mid-2013, (
Figure 5), the beach-dune system incorporated variable morphology north from the cluster of houses to Dias Creek (
Figure 5). Immediately north of the housing, a deteriorating bulkhead occupied the sandy beach for a distance of 70 m, and a v-shaped bulkhead was present in the beach approximately 130 m north of the housing. Approximately 80 m offshore, there was an active aquaculture site with several rows of oyster racks. North of the housing, the beach was migrating landward, indicating the results of the net direction of the alongshore transport and a negative sediment budget interacting with the impact of the structures. North of the deteriorated bulkhead, overwash and eolian transfers extended the dune feature into the adjacent wetland. Erosion of the beach zone resulted in an inland displacement and exposure of the marsh peat at several locations in the study area. The northerly alongshore sediment transport caused the buildup of a small beach feature into the creek mouth at Dias Creek, in the vicinity of exposed peat and active marsh in the beach zone. Several shoals developed near the mouth of Dias Creek, and patches of sediment accumulated on the marsh surface in the vicinity of the creek mouth. The shoals further mark the boundary of the interaction of the tidal creek flows with the northerly alongshore transport. In 2013 and 2014, 7651 m
3 of sand were trucked into the site and placed over a length of 360 m north of the development (
Figure 5).
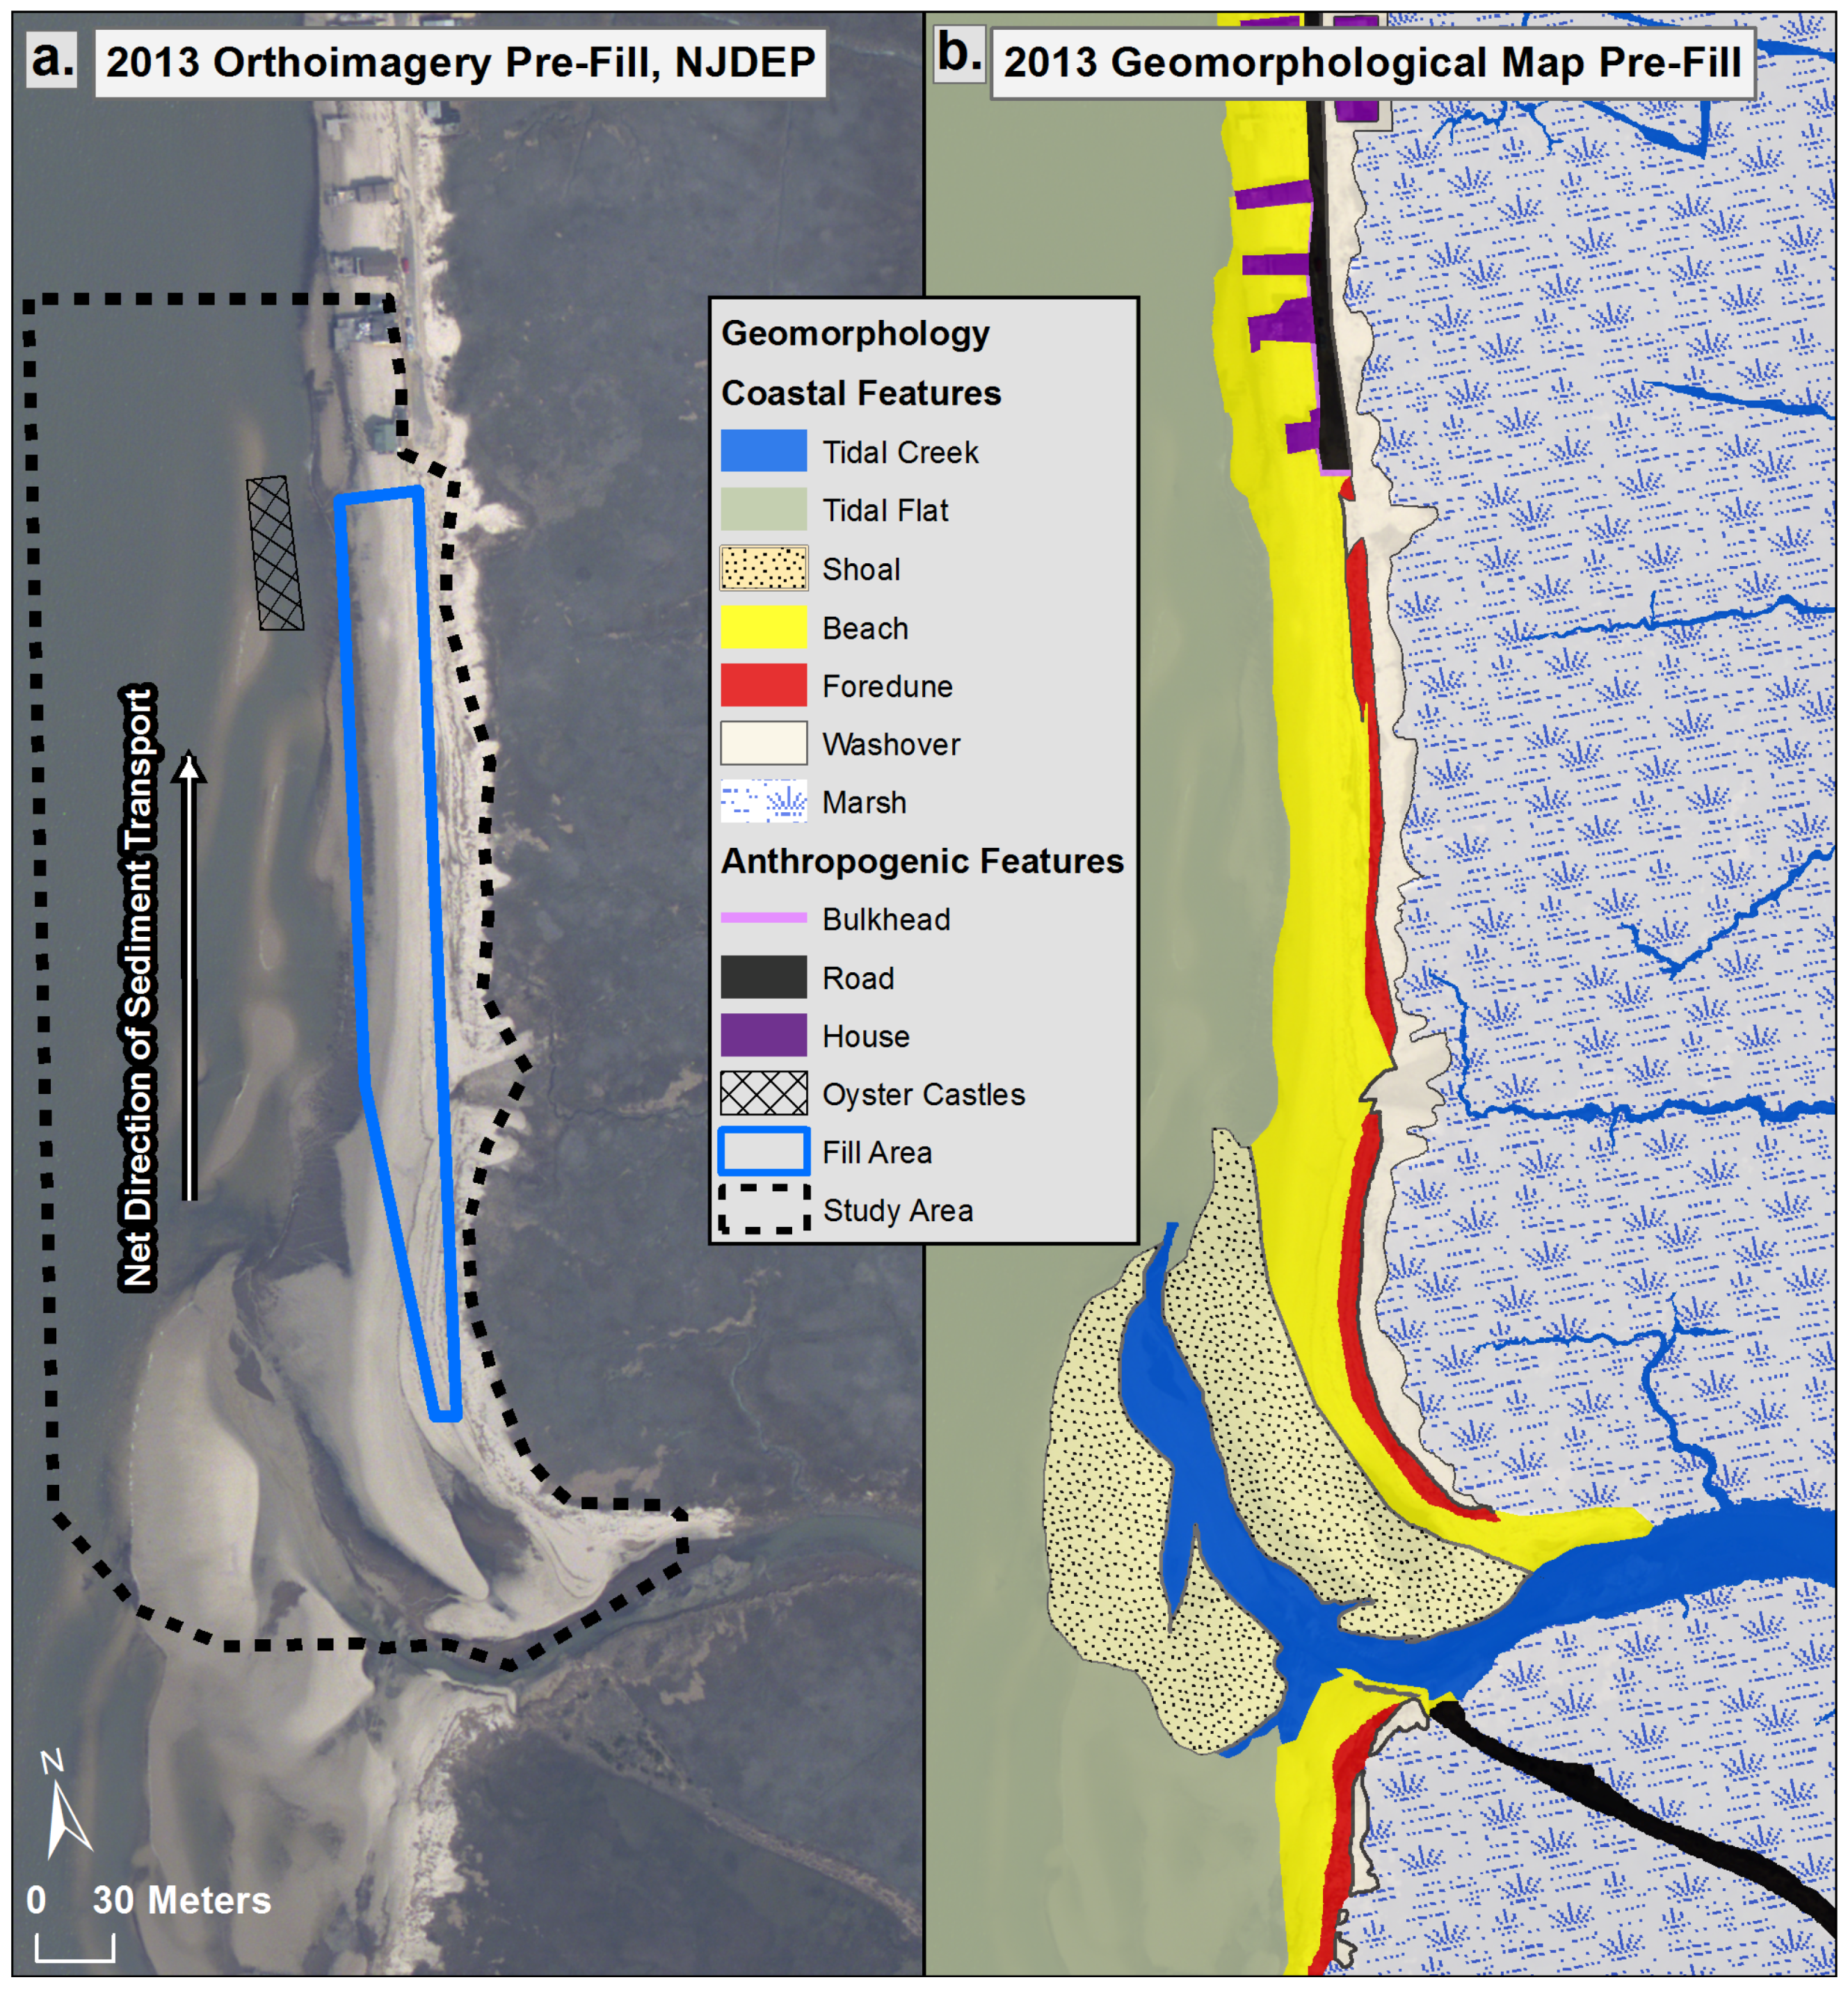
1.2.2. Reed’s Beach
The study area has an alongshore length of 520 m and a cross-shore width of 120 m. This site is located at the southern margin of a zone of accumulation updrift of the jetty at Bidwell Creek, approximately 1.3 km to the north. The beach-dune system at this site in 2013 (
Figure 6) extended south of housing to a tidal creek. The entire group of housing was lined by a bulkhead on its seaward margin. There was no subaerial beach-dune system seaward of the housing, the high tide swash line reached the bulkhead. The coastal dune feature was displaced inland in the area to the south of the housing, with no apparent seaward accumulation associated with the net south to north sediment transport direction. There were a few breaks in the dune feature where sediment in the form of washover fans had been transported inland to the marsh. The dune form had a well-defined ridge line in the northern portion of the site and was less well-defined to the south. There were no peat outcrops in the beach face. There were sand shoals exposed at the margin of the creek at low tide. A narrow series of shore parallel bars and troughs were present on the tidal flat at this site. In addition to the sediment placement of 3204 m
3 directly on Reed’s Beach in 2013 (
Figure 6), two beaches immediately to the south received trucked sand as well. Cook’s Beach was the recipient of 3053 m
3 and 12,120 m
3 was placed at Kimble’s Beach. In the post-fill period, two rows of oyster castles, mounds composed of recycled oyster shell, were installed approximately 20 m offshore in the northern portion of the site in an attempt to reduce wave energy and alongshore transport.
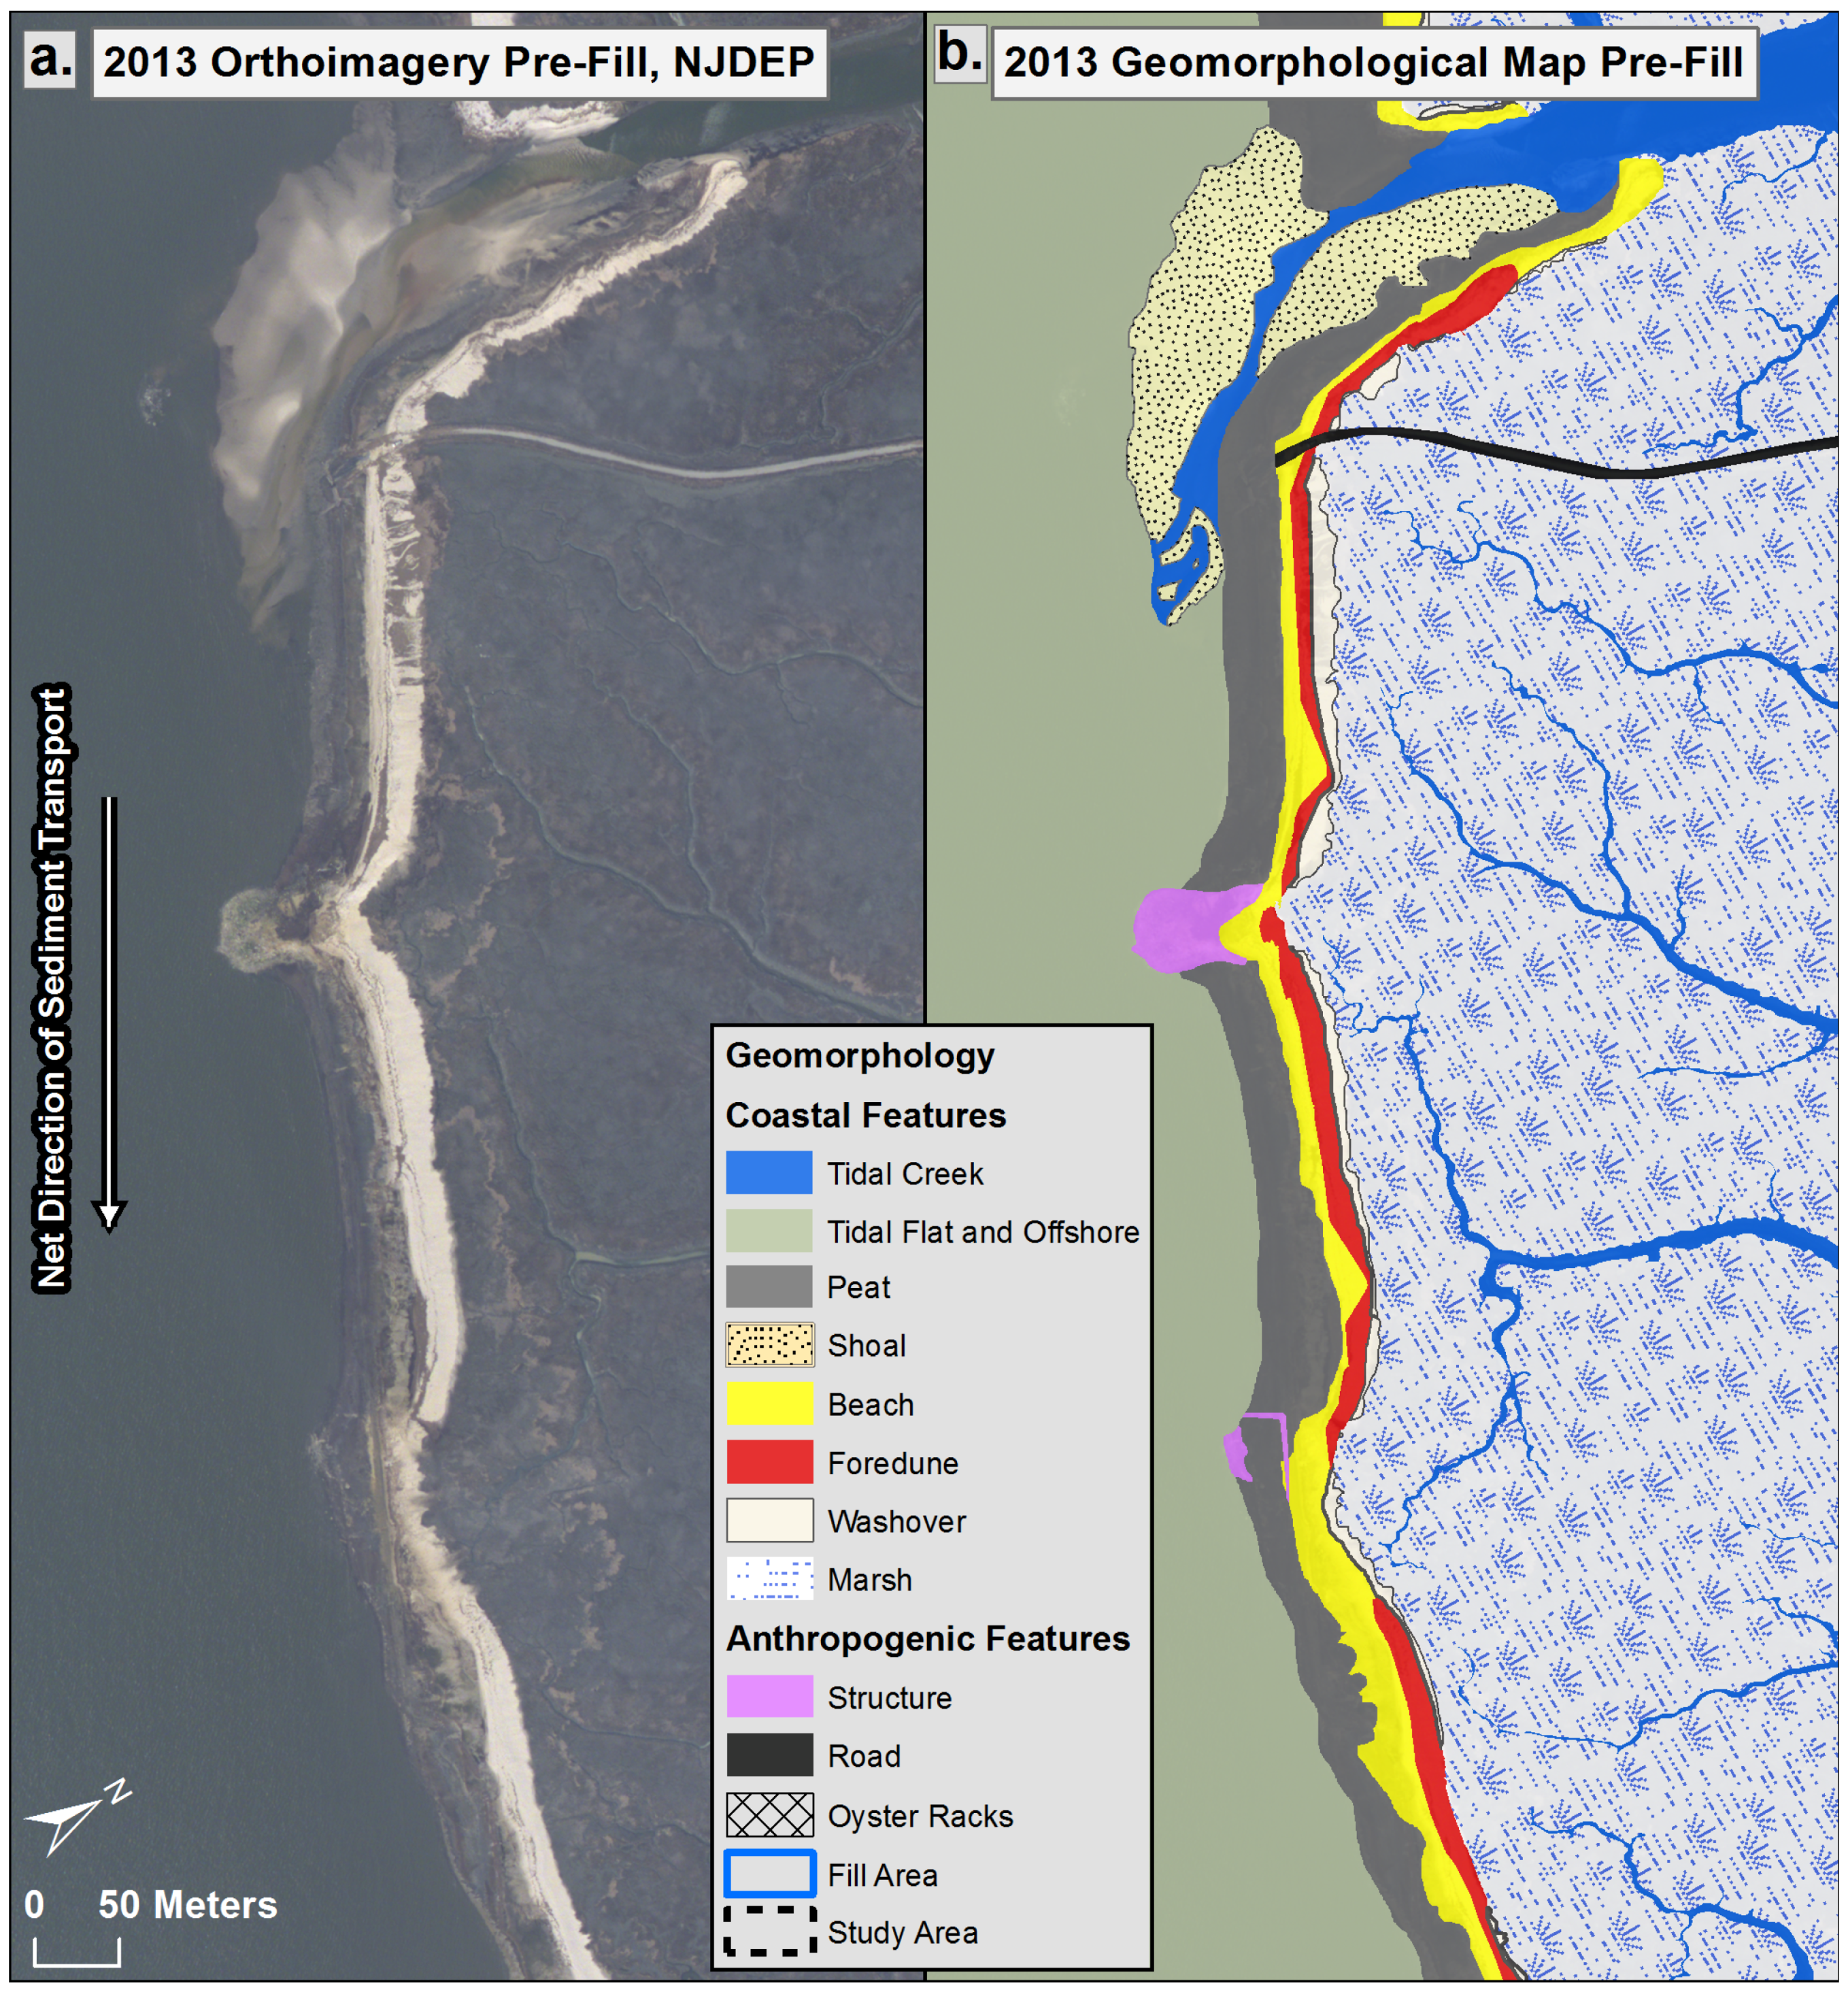
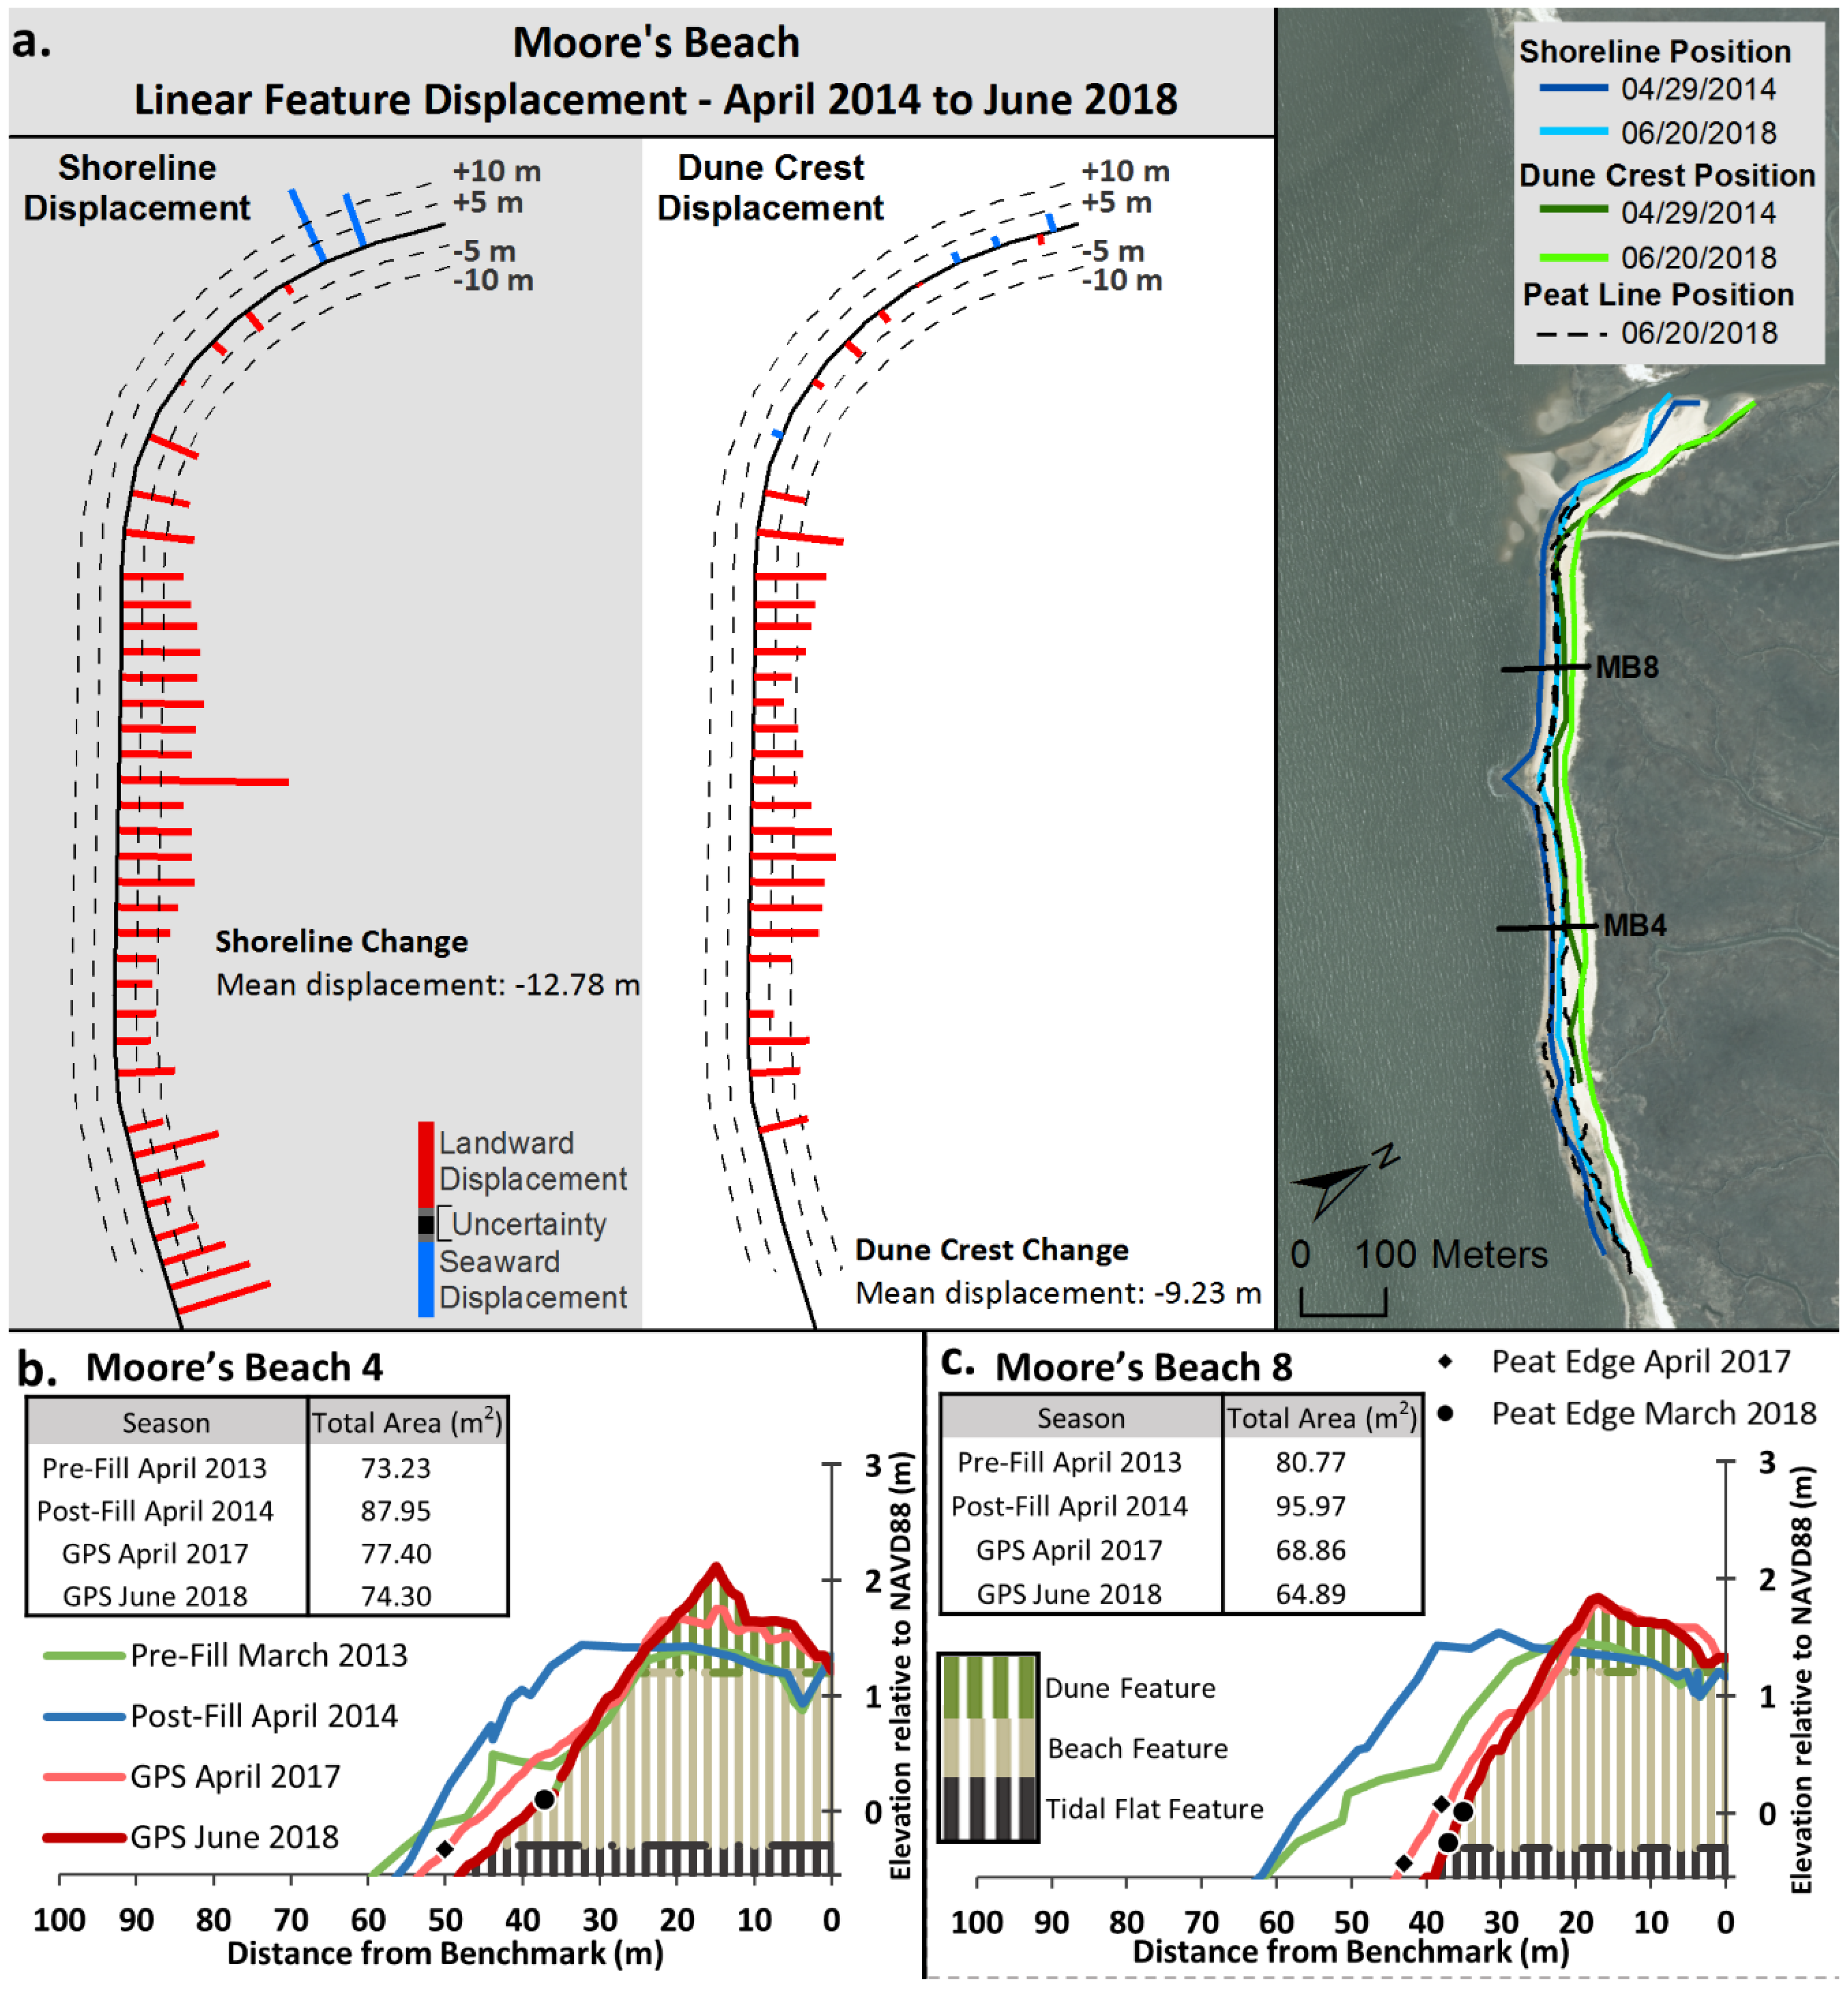
1.2.3. Moore’s Beach
The beach-dune system at this site (
Figure 7) extends for 1.1 km from a tidal creek at the western margin to a major re-entrant in the shoreline configuration at the east. The study area has a general width of 125 m, tapering to the east. Sediment transport is from west to east. There was a shoal at the creek mouth and a narrow beach along the eastern margin of the creek. Approximately 100 m offshore, the shoal was the site of an active aquaculture project incorporating several rows of oyster racks. A number of foundations of former buildings were in the beach face and on the tidal flat. There was a seaward projection of the shoreline at the location of the cluster of remains of foundations located about midway along the site, and another seaward projection associated with building remains at the eastern margin. Several levels of peat deposits outcropped in the beach face and lower on the profile into the tidal flat. Peat exposures occurred along the entire site in the beach face and into the tidal flat. There were few bars and troughs exposed on the tidal flat. Most of the tidal flat was beyond the depth of the lower boundary of the survey effort. The foredune area was overwashed at numerous locations and fan-shaped sand deposits extended inland over the adjacent marsh. The trucked sediment, amounting to 17,720 m
3, was placed on the beach in 2013 and 2014 over a distance of 690 m.
2. Methods
The basis for the temporal and spatial comparison of vectors of morphological change was the creation of digital elevation models (DEMs) from field surveys [
37,
38,
39,
40]. Field topographic surveys were conducted with geodetic GPS equipment in real-time kinematic mode along cross-shore transects. Surveys were collected in a time sequence incorporating: (1) GPS survey in 2013, prior to beach nourishment in the post-Sandy period; (2) GPS survey in 2014 post the beach nourishment; and (3) a series of more recently acquired GPS surveys in 2017 and 2018. The timing of these surveys allowed for the characterization of the study site immediately pre- and post-fill. The pre- and post-nourishment survey dataset was collected by the Richard Stockton Coastal Research Center [
5]. Their 2013 and 2014 surveys had a variable transect spacing ranging from 15 m to 120 m; we supplemented their surveys with 2014 LiDAR data where there were gaps in data due to transect spacing [
41]. The surveys conducted in 2017 and 2018 were a part of an ongoing monitoring effort to collect spring and fall surveys annually through 2022 [
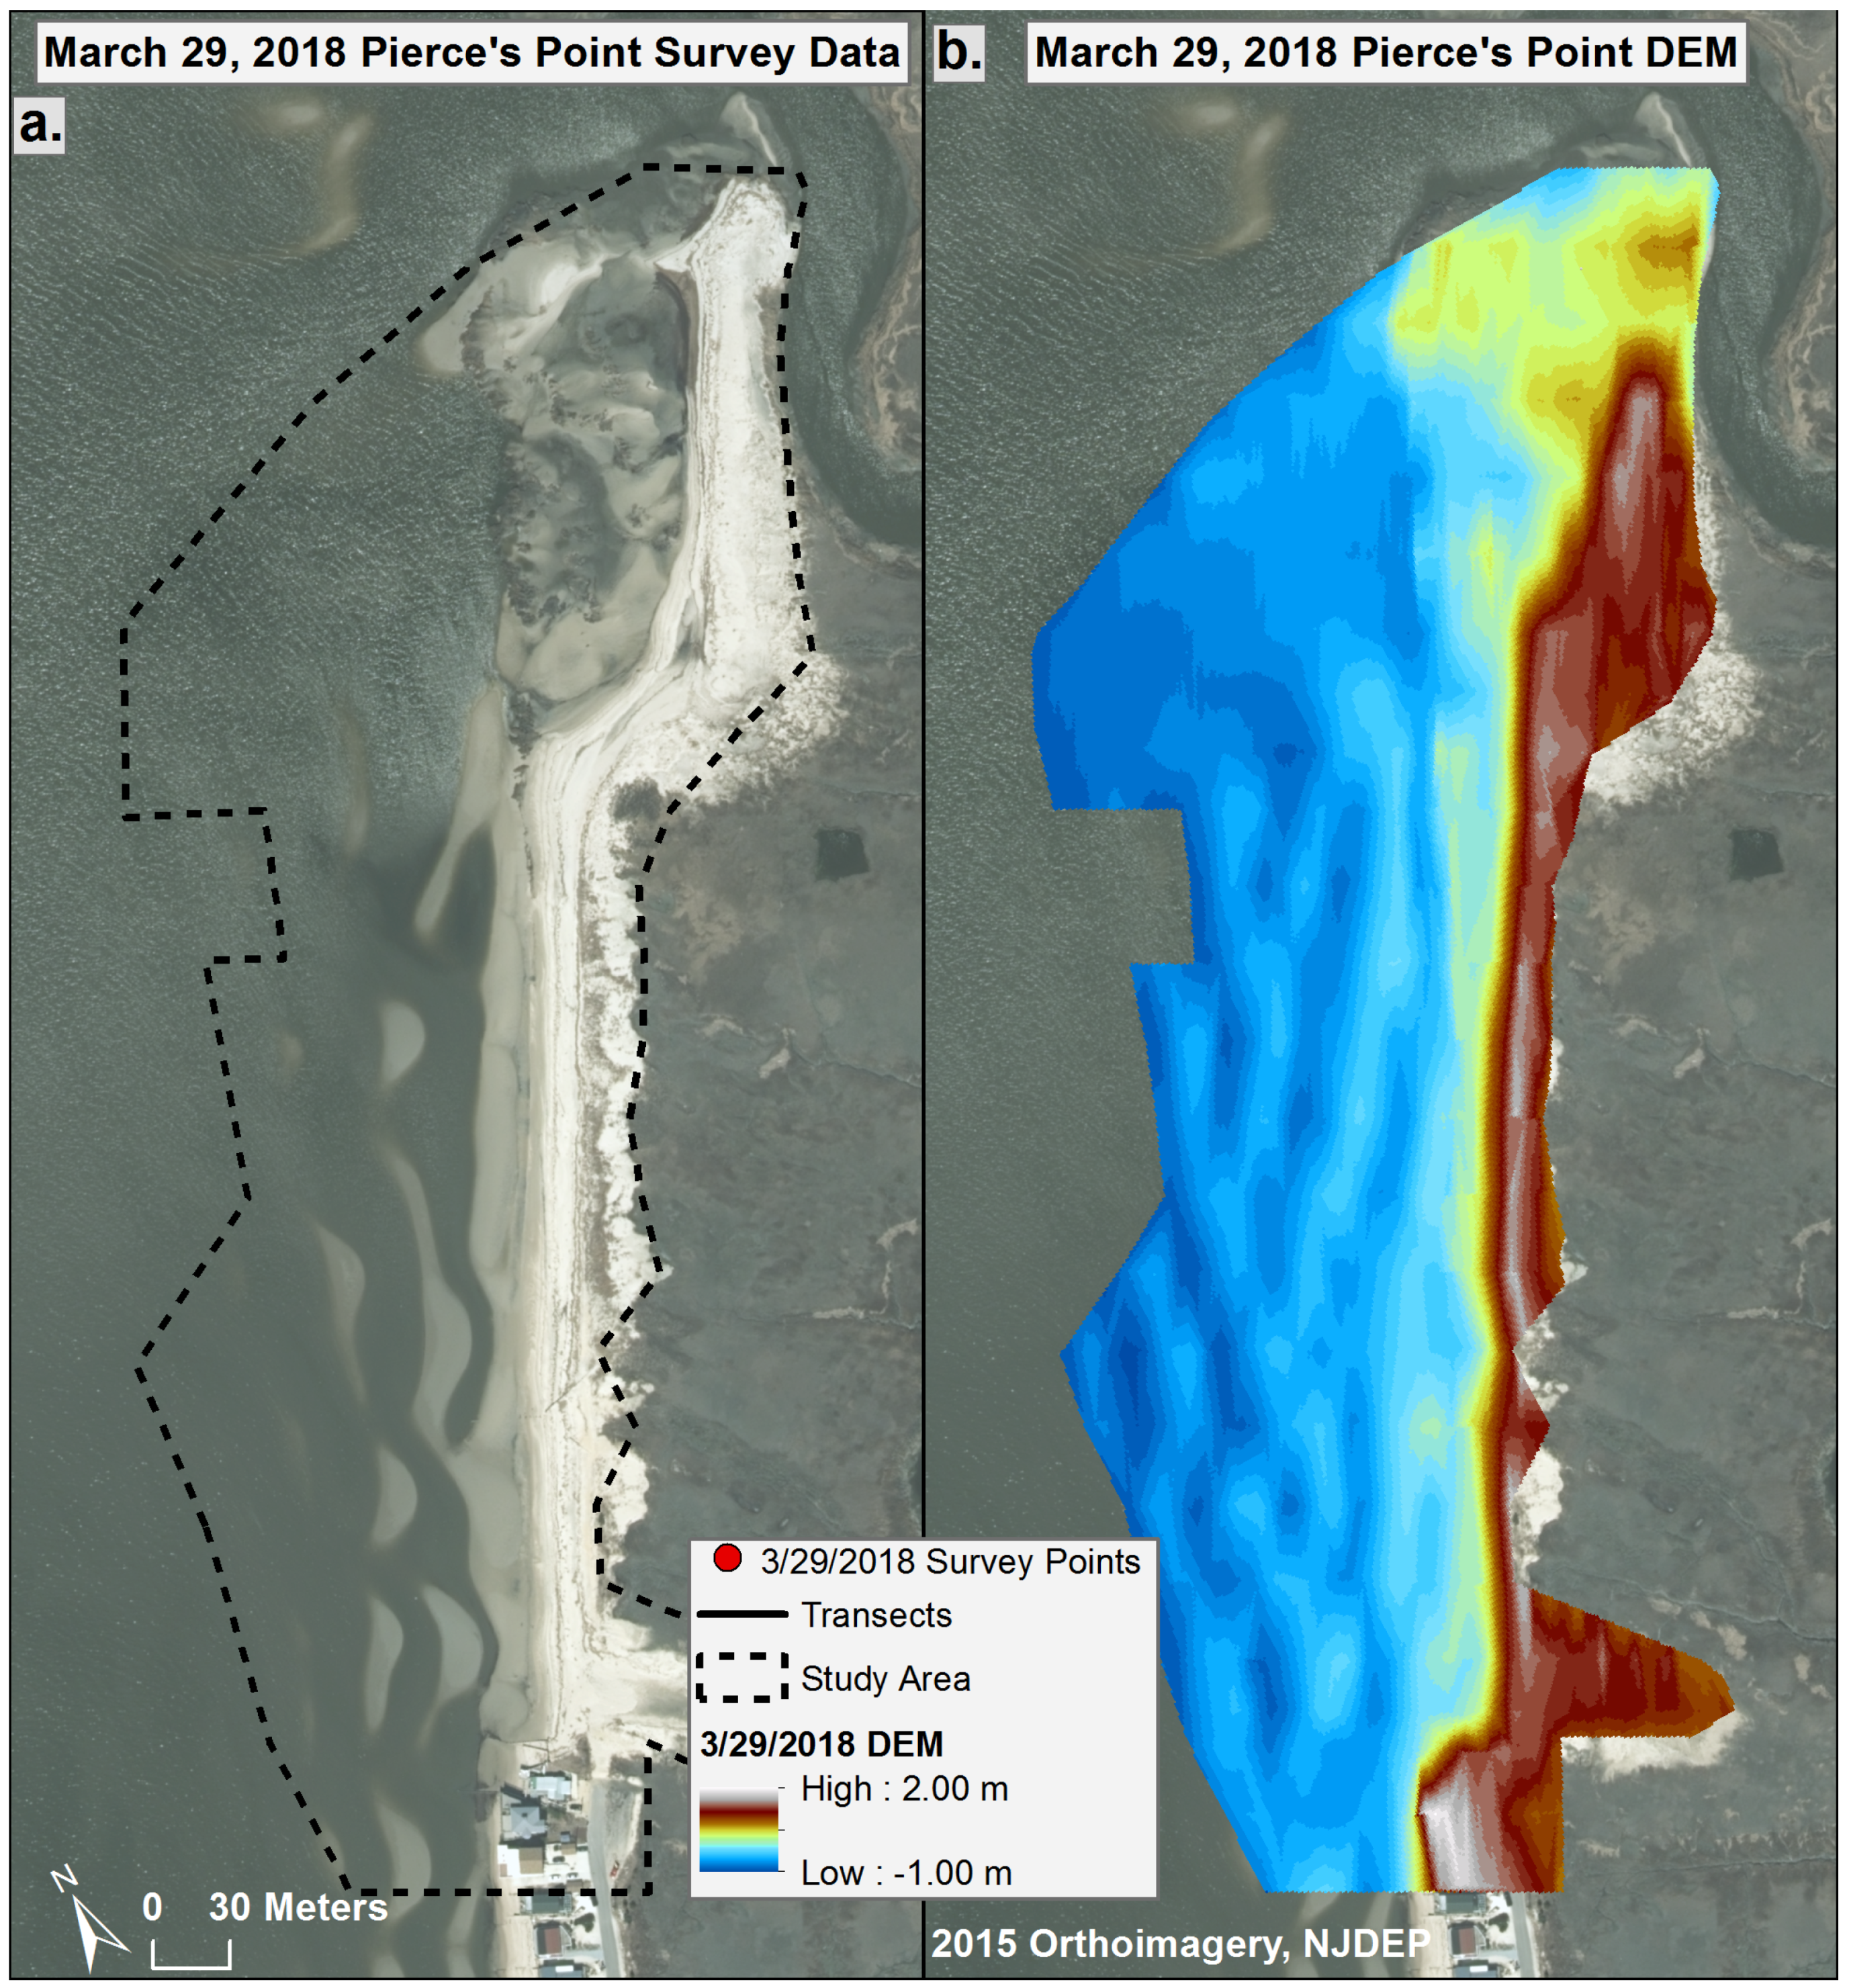
6]. The 2017 and 2018 transects had a spacing of 30 m. An example of the point collection is provided for the 2018 survey at Piece’s Point illustrating the concept of using consistent transects to generate a DEM from the interior wetland, across the dune and beach topography, into the tidal flat (
Figure 8).
DEMs were created by using Delaunay triangulation to interpolate the elevations of the unsurveyed areas between the survey transects [
40]. The creation of the DEMs permitted the quantification of resulting forms and the total volume under the produced surface form. Subtracting two DEMs created from different survey periods yielded rasters of elevation change and allowed volumetric change to be quantified. Given these DEMs, they were used to develop dimensional analyses of sediment budget, characteristics of beach, dune, and tidal flat features, spatial associations, vectors of change, and comparisons of the three sites.
2.1. Derived Metrics
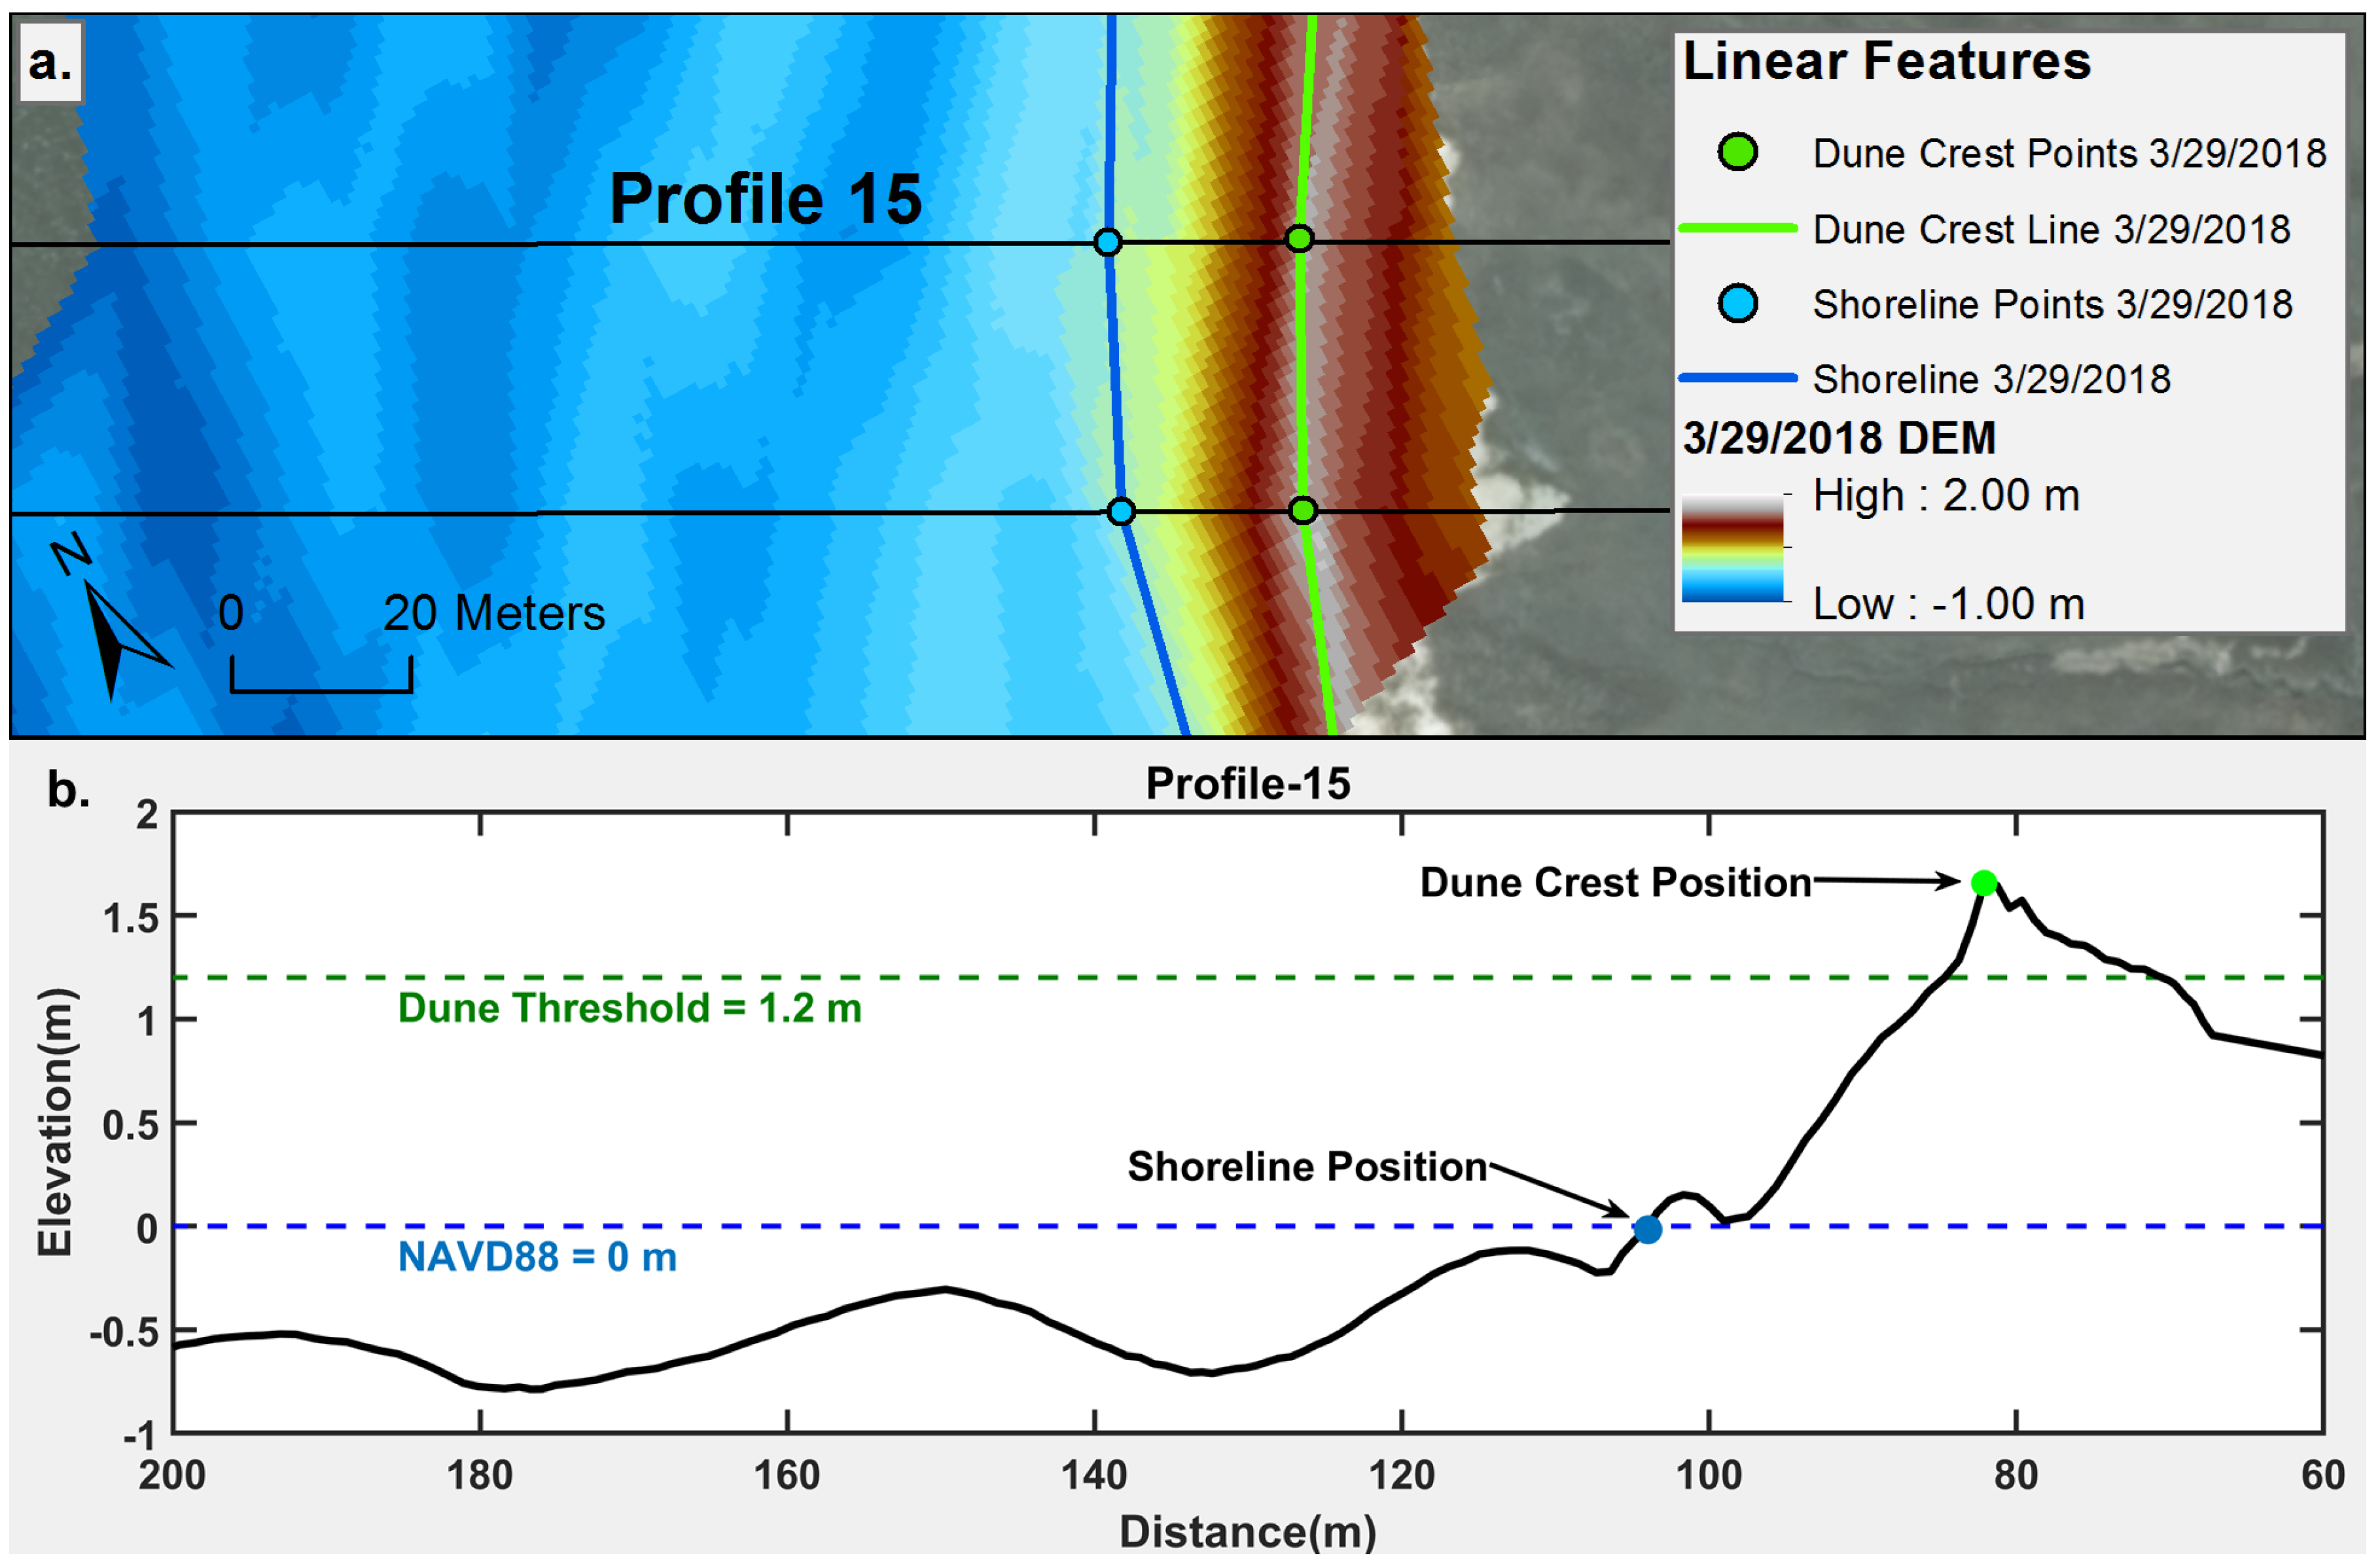
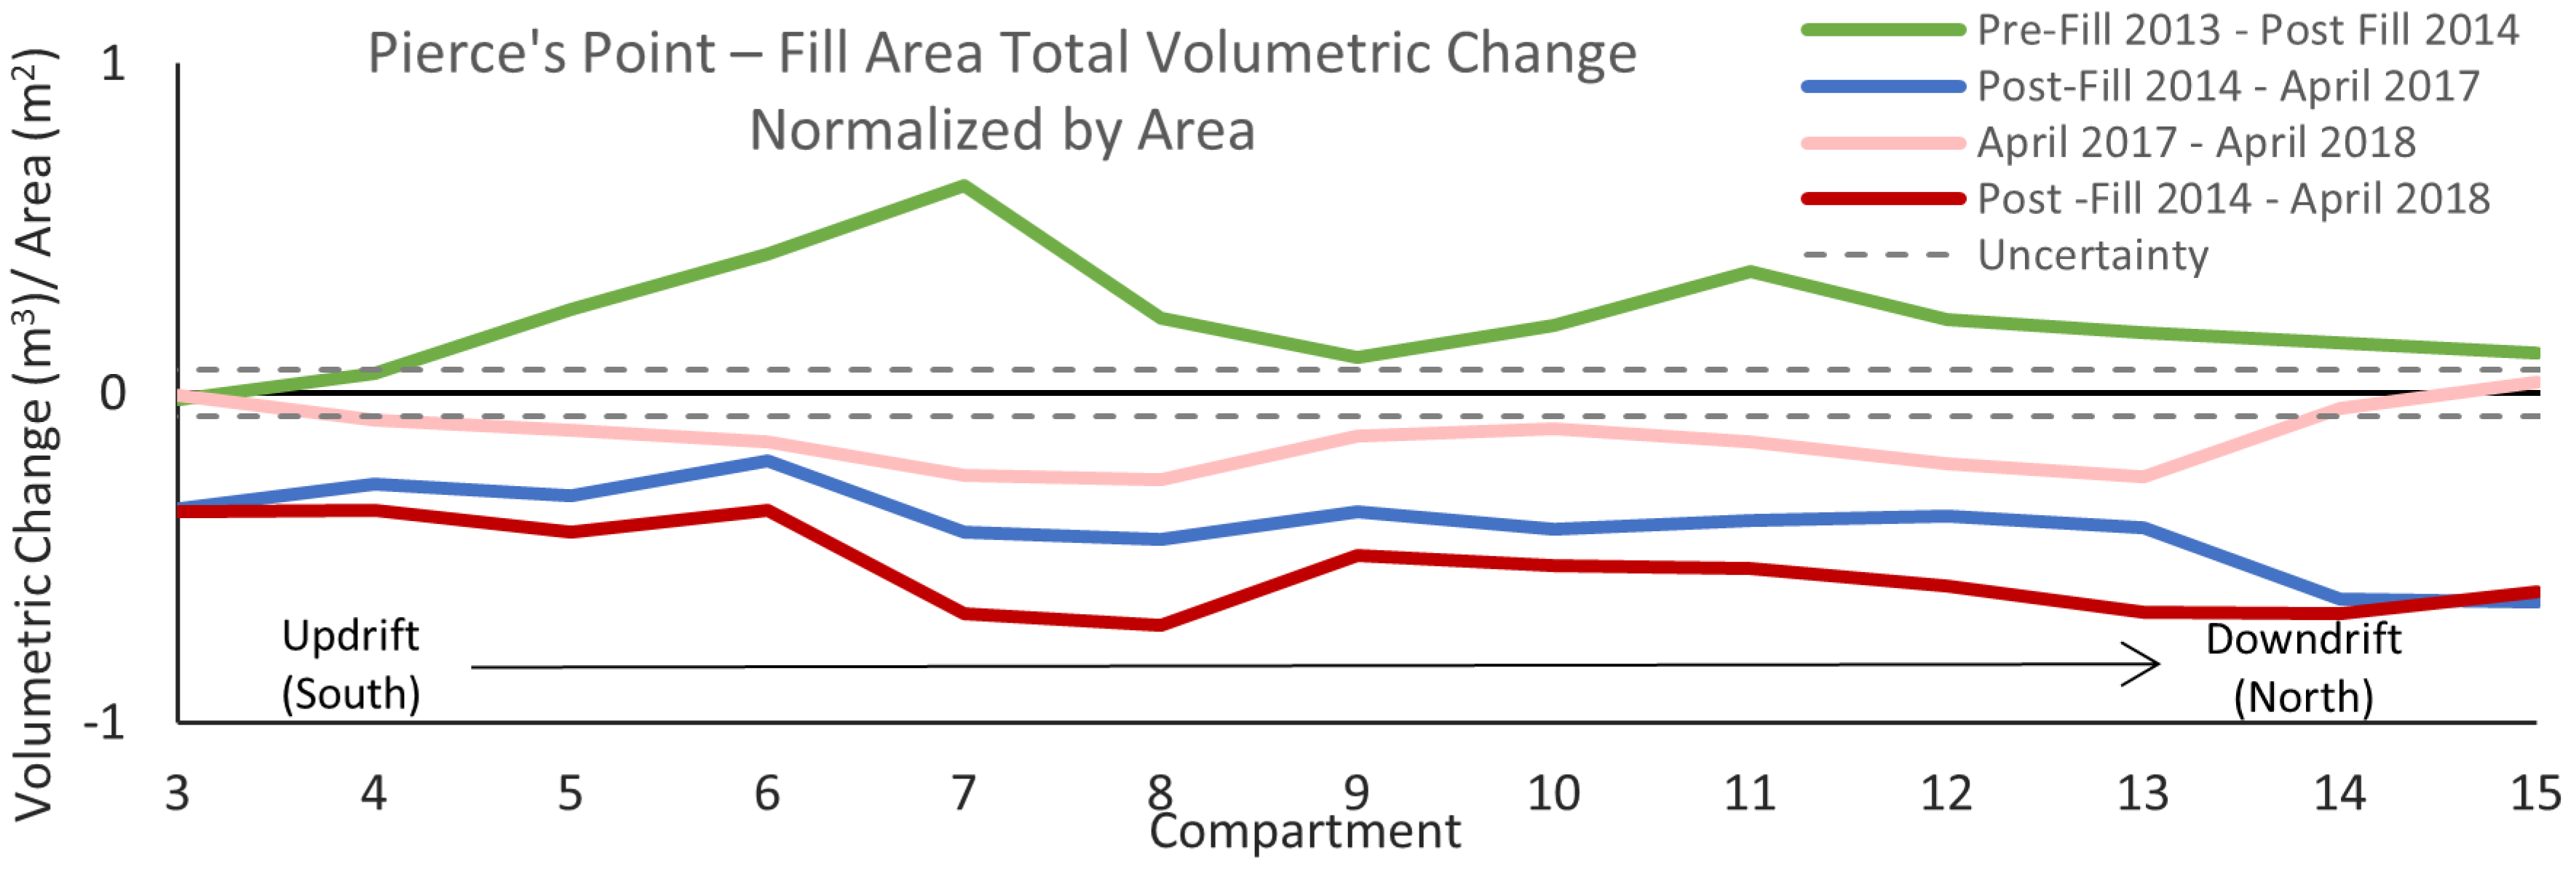
Spatial volume and Sediment Budget: Values of spatial volume were derived from the full DEM and divided into the several geomorphological feature categories. Geomorphologically, the DEM had elevation zones with the dune feature incorporating elevations above 1.2 m and the beach feature at elevations between −0.3 and 1.2 m. The tidal flat encompassed elevations between −0.3 m to −1 m at Pierce’s Point and Reed’s Beach, and between −0.55 m to −1 m at Moore’s Beach. Sediment budget was derived by comparing volumes in each of the feature categories in the study area. Sediment budget was also calculated for alongshore compartments of the site, at 30 m intervals, and further subdivided into the portion of the site where fill was placed, as well as updrift and downdrift of the fill zone. The elevational basis was a bit more complex at the northern end of Pierce’s Point, where the salt marsh existed on the seaward side of the beach in the elevation assigned to the beach feature. In this instance, the area occupied by the saltmarsh was classified as beach because of elevation and morphological position for purposes of volume comparison.
The sediment volumes were determined for each of the compartments at the three sites based on the DEMs for March 2013 (prior to initiation of fill), April 2014 (following completion of the fill at the three sites), April 2017 (initiation of this project), and March 2018 (completion of an annual cycle), and separated into an updrift zone, fill zone, and downdrift zone of the study areas. Gaps in the tables were created when surveys did not overlap, and absences of uncertainty values occur when comparable survey points were missing in a compartment. Volumes were assigned to geomorphological features based on elevation and relative position.
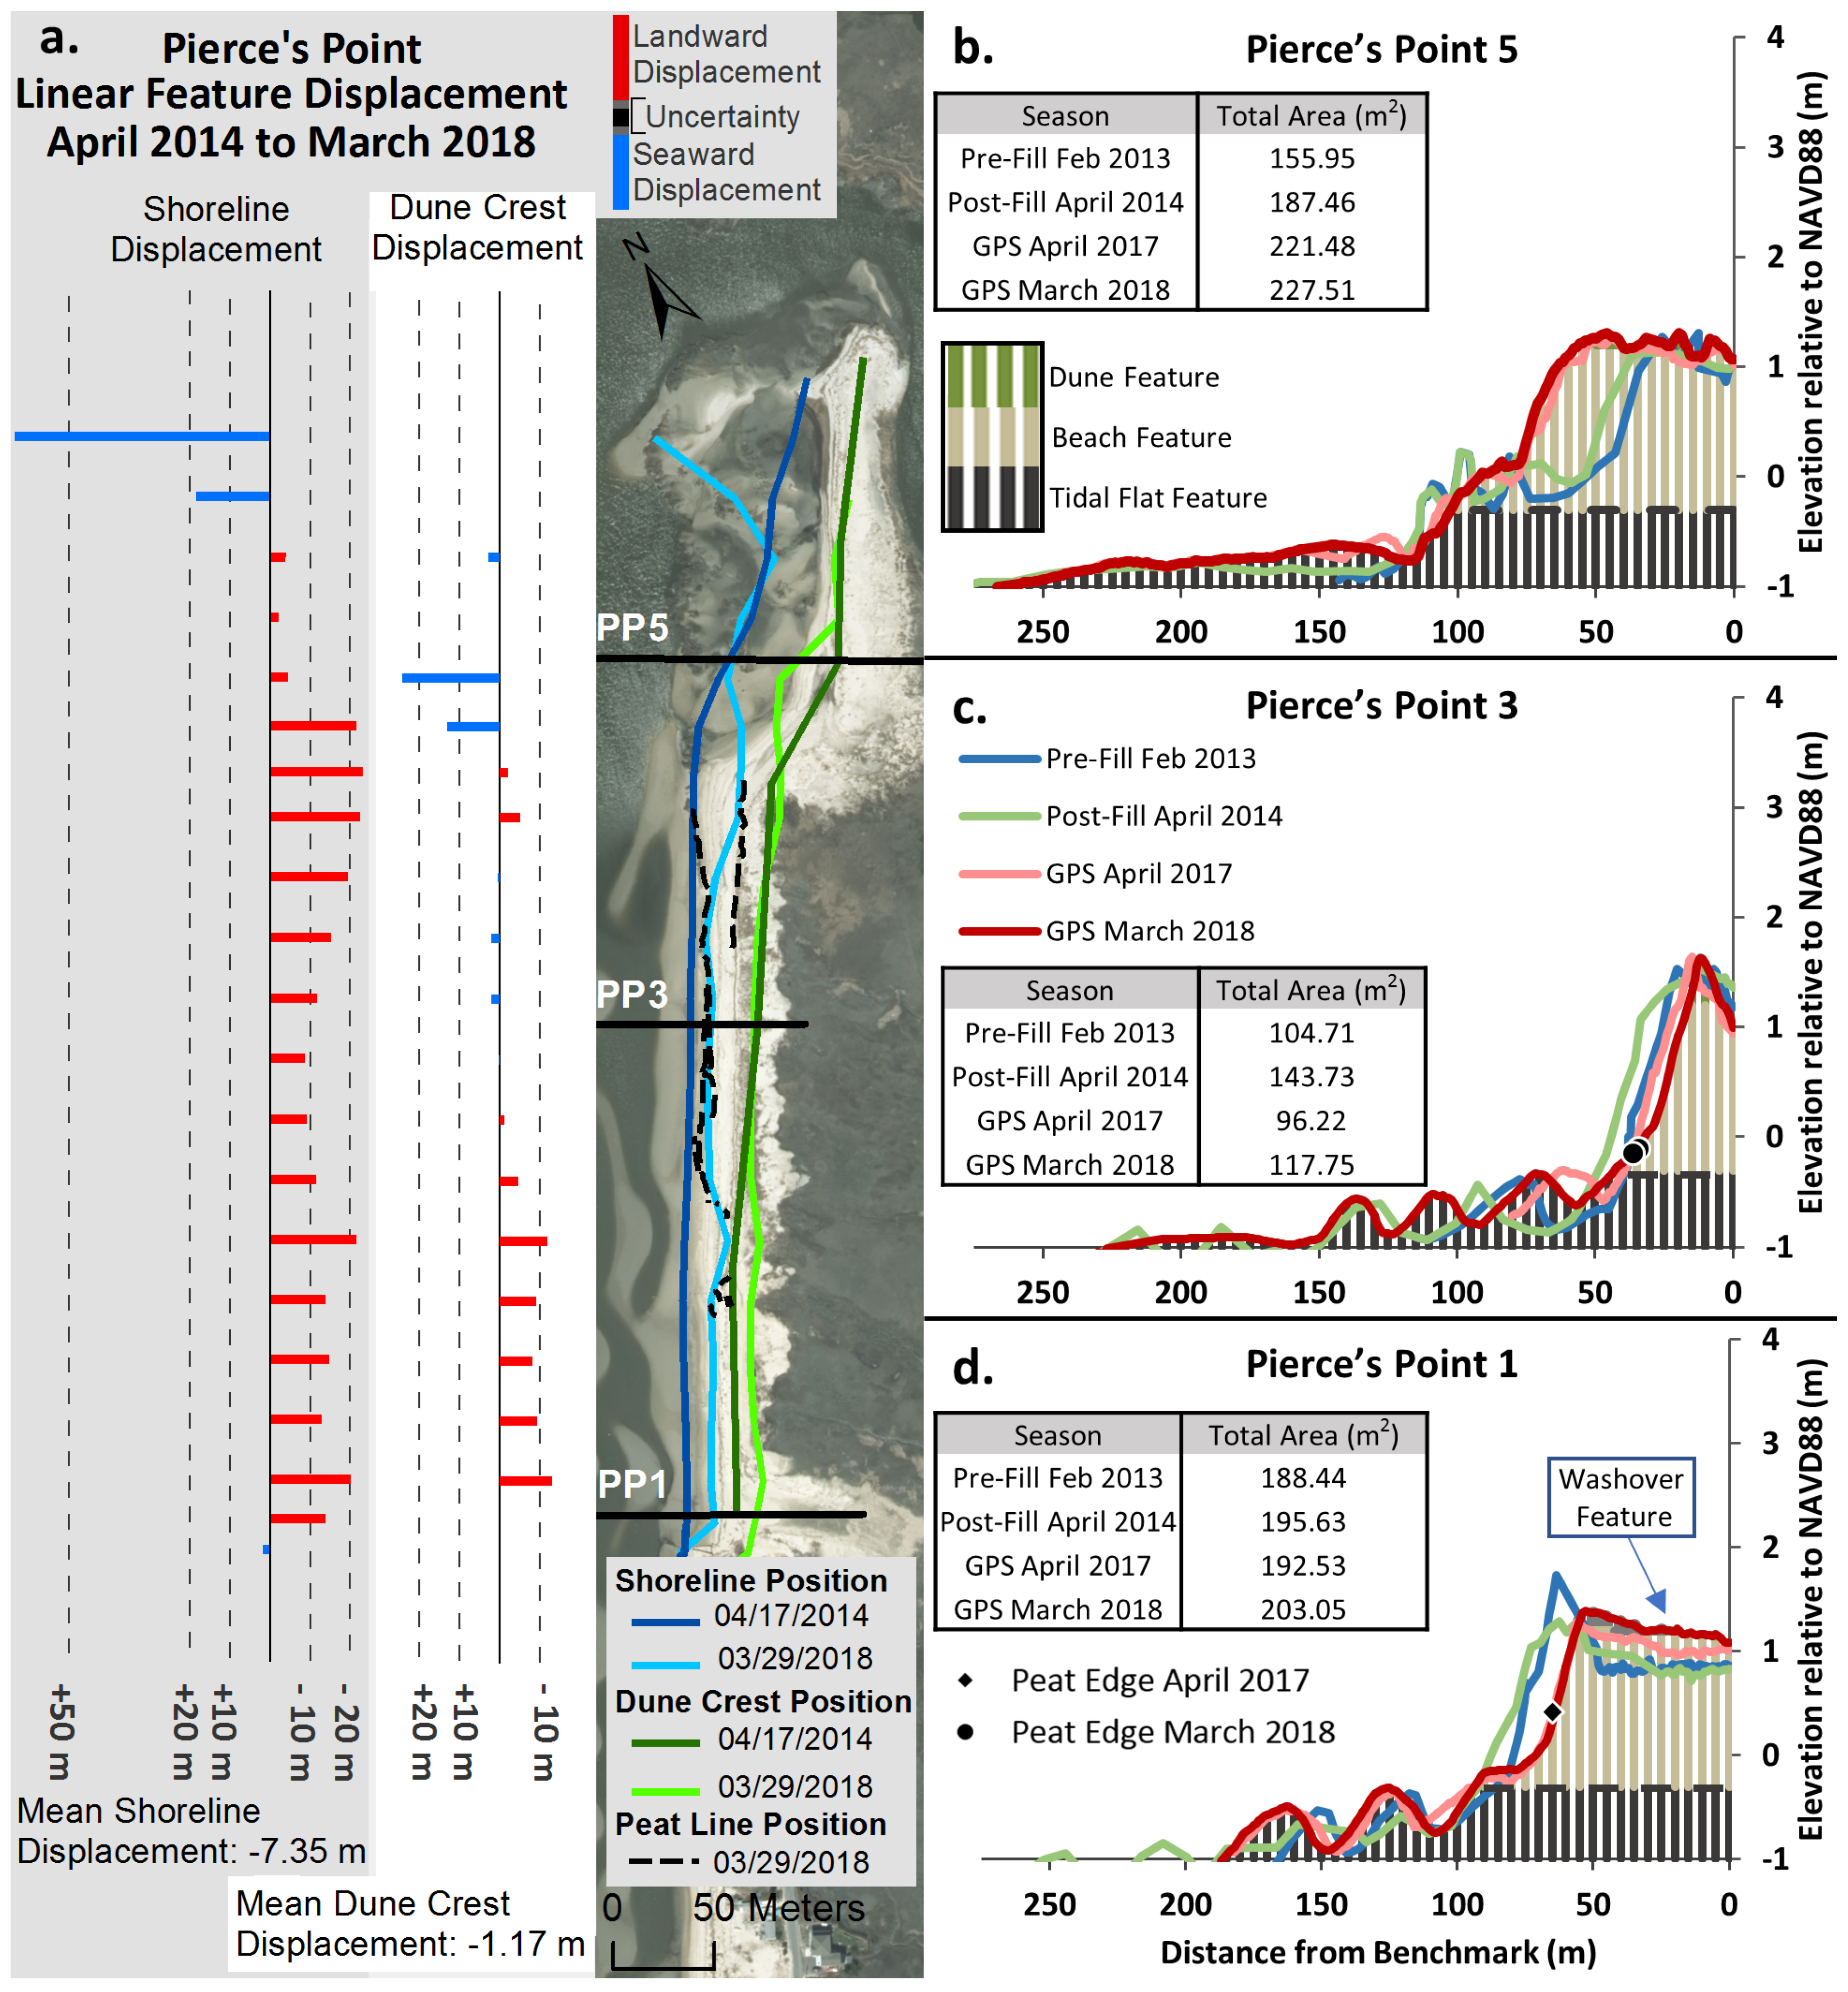
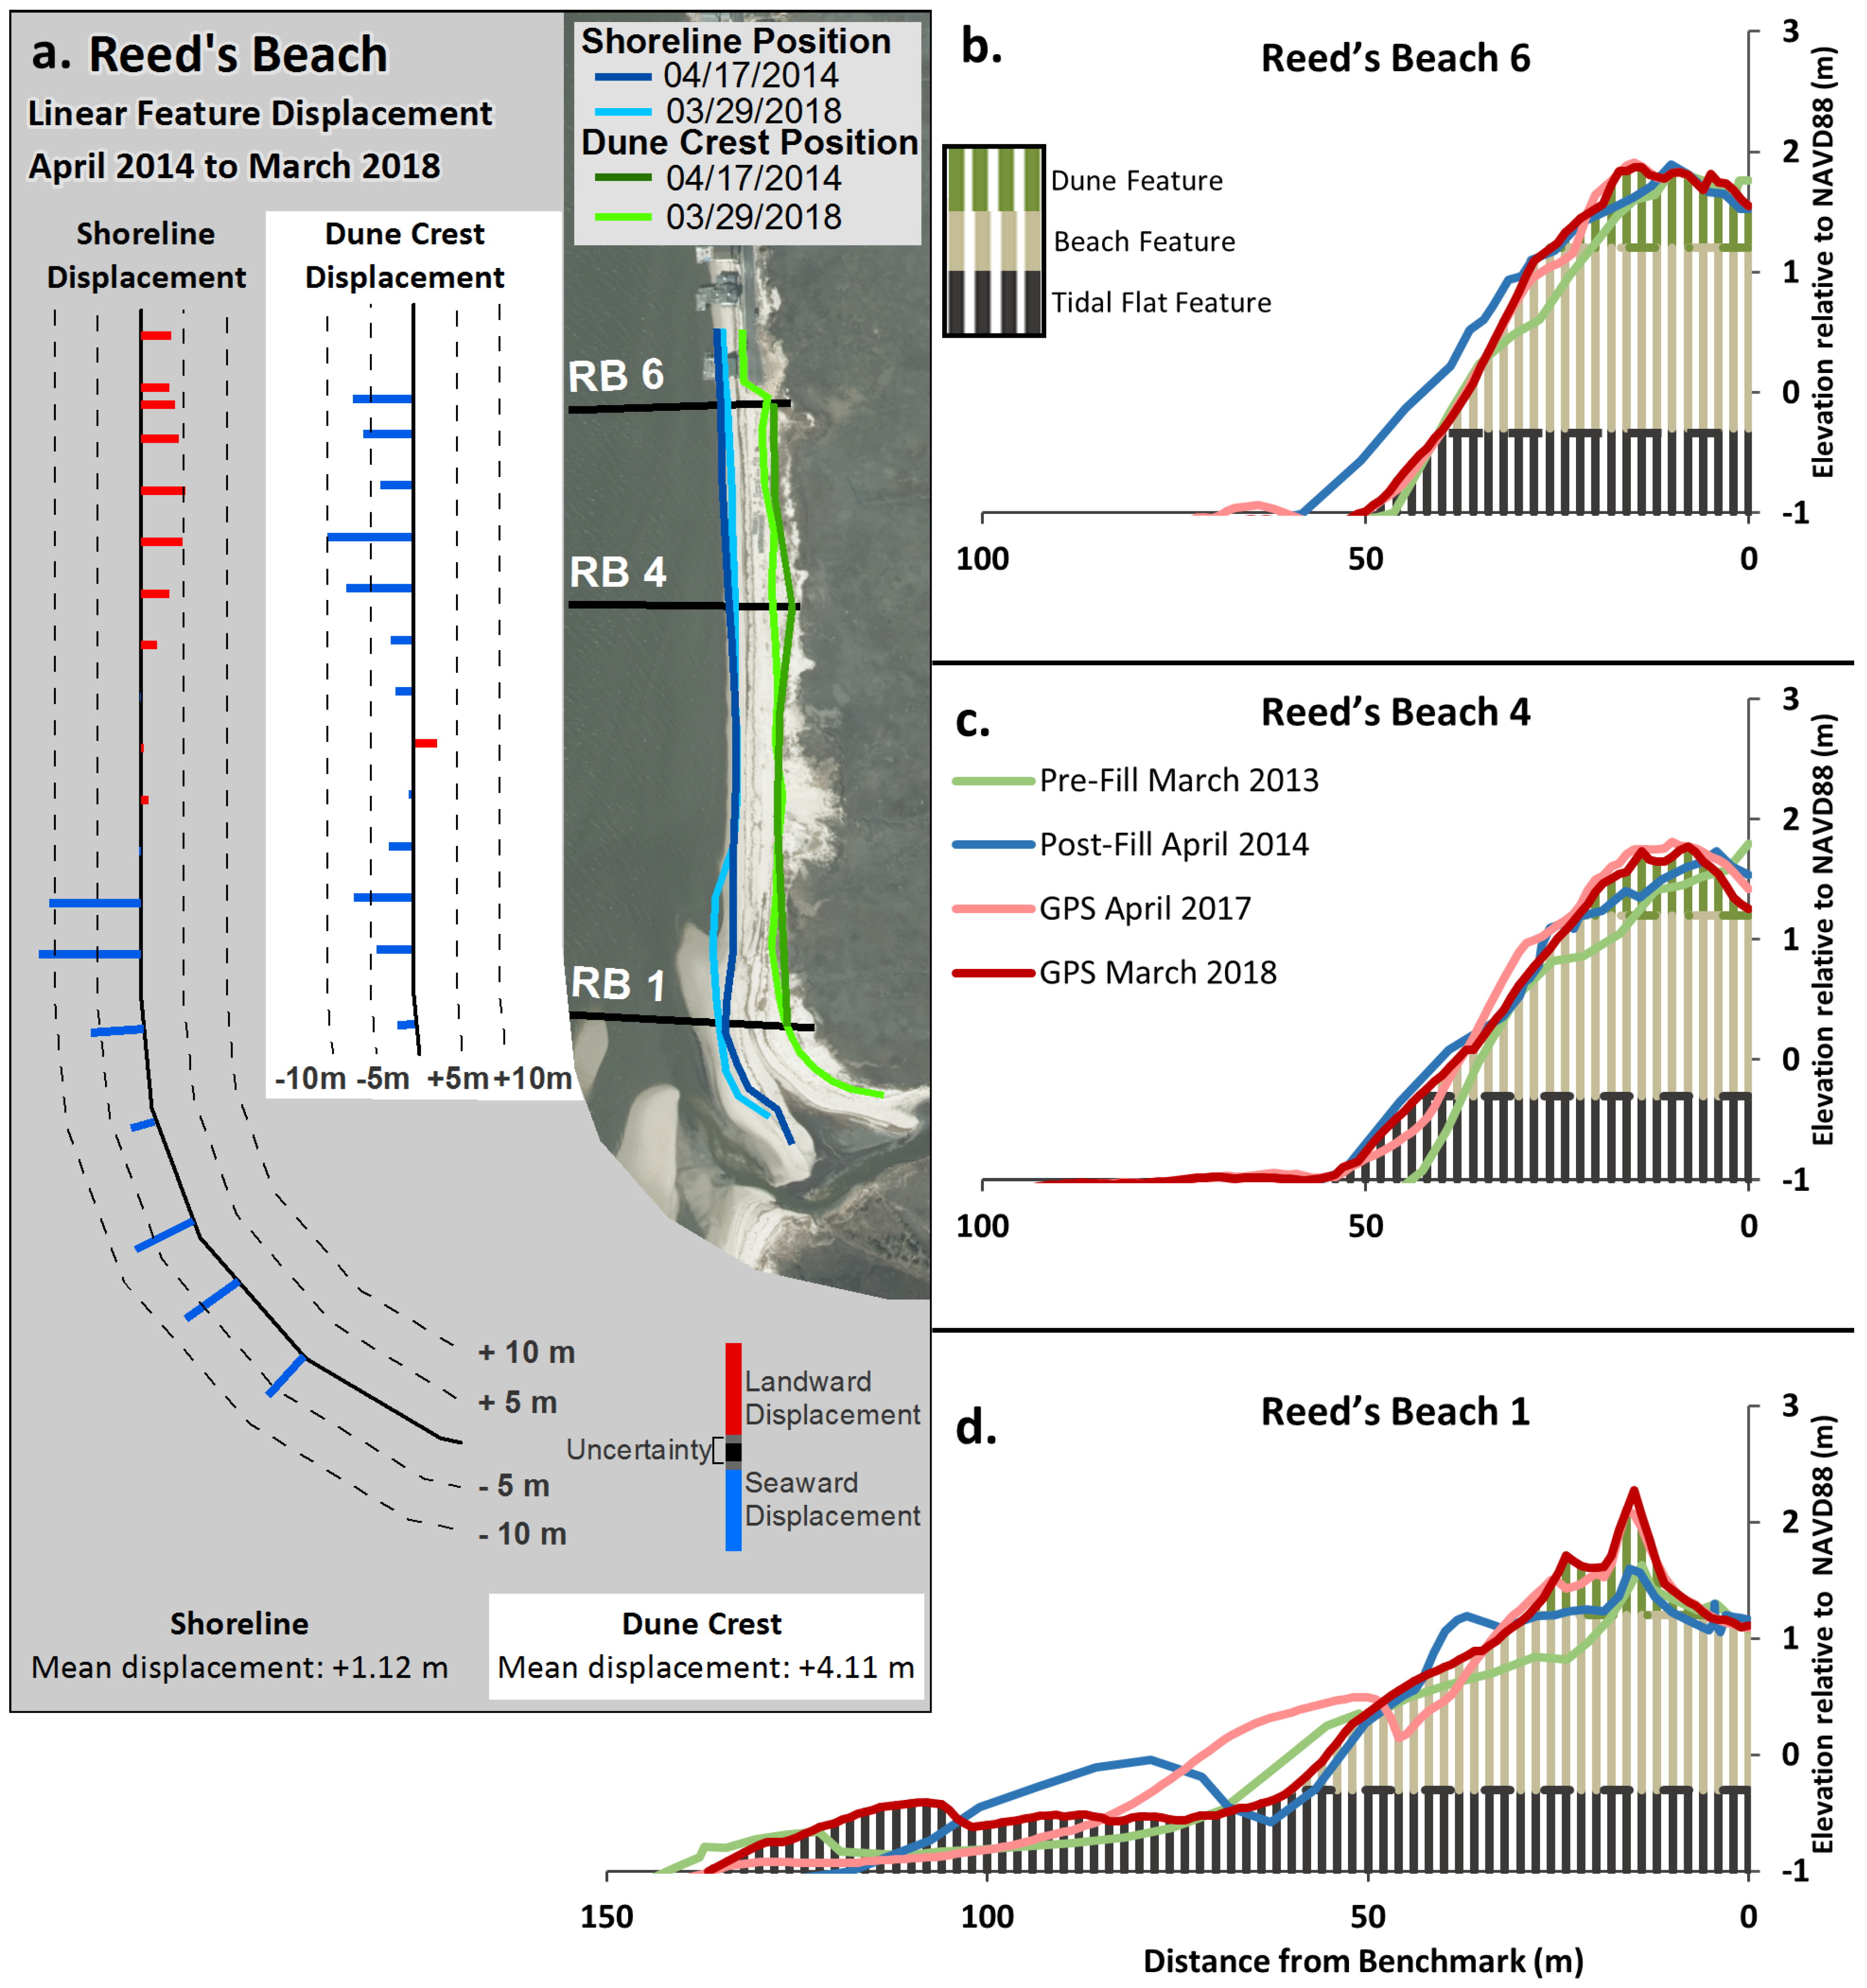
Linear Features and Displacement: Additionally, surveyed transects were analyzed to generate traces of the several topographical features from each survey period. Two linear features were determined on the DEMs and tracked through the period of survey: (1) the shoreline position; and (2) the position of the dune crest line.
Shoreline: The intercept of the NAVD88 0.0 elevation on each transect and along the DEM was used to represent a shoreline position (
Figure 9). The use of the constant elevation reduced the uncertainty and permitted a more definite comparison of feature through the five year record. The metric of displacement was determined by the application of the DSAS program created and maintained by the USGS [
43] that compares position along established transects to generate vectors of change. The resulting displacement was portrayed temporally and spatially by the Shoreline Mapping Program [
44].
Dune crest: The dune was a linear feature inland of the active beach. It was usually vegetated but may incorporate aspects of overwash to flatten and extend the feature inland. Profiles were created from the 30 m spaced survey transects and the highest elevation immediately inland of the free sand beach established the position of the dune crest. The dune crest line was the linear connection of the high elevations in the alongshore direction. Dune crests may be interrupted in areas of overwash. Dune crest position and changes were portrayed with the application of DSAS [
43] and the Shoreline Change Mapper Program [
44].
Edge of peat outcrop: in addition to the collection of cross-shore transects, the spatial position of the leading edge of a peat outcrop was tracked in the field at 1 m intervals where it was encountered in each of the 2017 and 2018 surveys. There was no displacement metric generated for the peat outcrop because the peat edge eroded on the basis of undercutting, or protection by overlying sand, or by factors exploiting fractures in the peat mass.
Cross-section of Geomorphological features: The spatial boundaries of the tidal flat, beach, dune, washover, and marsh features were determined by their elevations and relative position. Profiles incorporate the locations of the boundaries of the features and their cross-sectional areas encompassed within the DEM. Creating the boundaries and applying them to the DEM were steps in the calculation of volumes, volume changes, and the resulting sediment budget. In addition, the topographic profiles included the locations of peat outcrop edges when they were present.
2.2. Elevation, Volume, and Volumetric Change Uncertainty
DEMs need an uncertainty value to establish some measure of validity to the products, a combination of instrument and interpolation uncertainty. The GPS unit using Real-Time Kinematic (RTK) survey style had a horizontal uncertainty of ±0.02 m and vertical uncertainty of ±0.04 m determined from comparison with control points and precision reported during quality assurance and quality control checks. Uncertainty introduced by interpolation was quantified by building DEMs with incomplete data sets, missing one transect,
i, and then comparing the interpolated values,
, with the actual values,
at the same location,
j. A measure of elevation uncertainty was calculated by iterating this process for all
transects, omitting only the transects at the boundaries of the survey, and for each point within the survey, a total of
m points. Combining the uncertainty from the instrument,
and the error from interpolation in the DEM creation yields an estimate of vertical uncertainty per square meter in the DEM,
(Equation (
1)). This was used to determine the volume uncertainty,
, of volumes derived from one survey DEM, using the number of surveyed points,
p, and the area of the DEM (Equation (
2)) [
36]. Volumetric change uncertainty,
, between two DEMs, was calculated using RMSE of the volume uncertainty of the two DEMs (Equation (
3)).
Uncertainty values were calculated for each of the compartment volume determinations and for comparisons between surveys. However, because of the variable spacing of transects between the 2013–2014 and 2017–2018 surveys, there were some compartments used in this analysis that lacked the earlier data points and uncertainty values could not be determined.
4. Discussion
The sediment budget metrics derived from the geotemporal comparisons of the DEMs provide for an analysis of the post-fill modifications of the beach nourishment, but also permit an evaluation of the drivers and the responses in the three sites. Although all sites are within the fetch-limited estuarine environment, the dimensions of change are somewhat different, and their geomorphological responses offer insights to their continuing vectors of evolution.
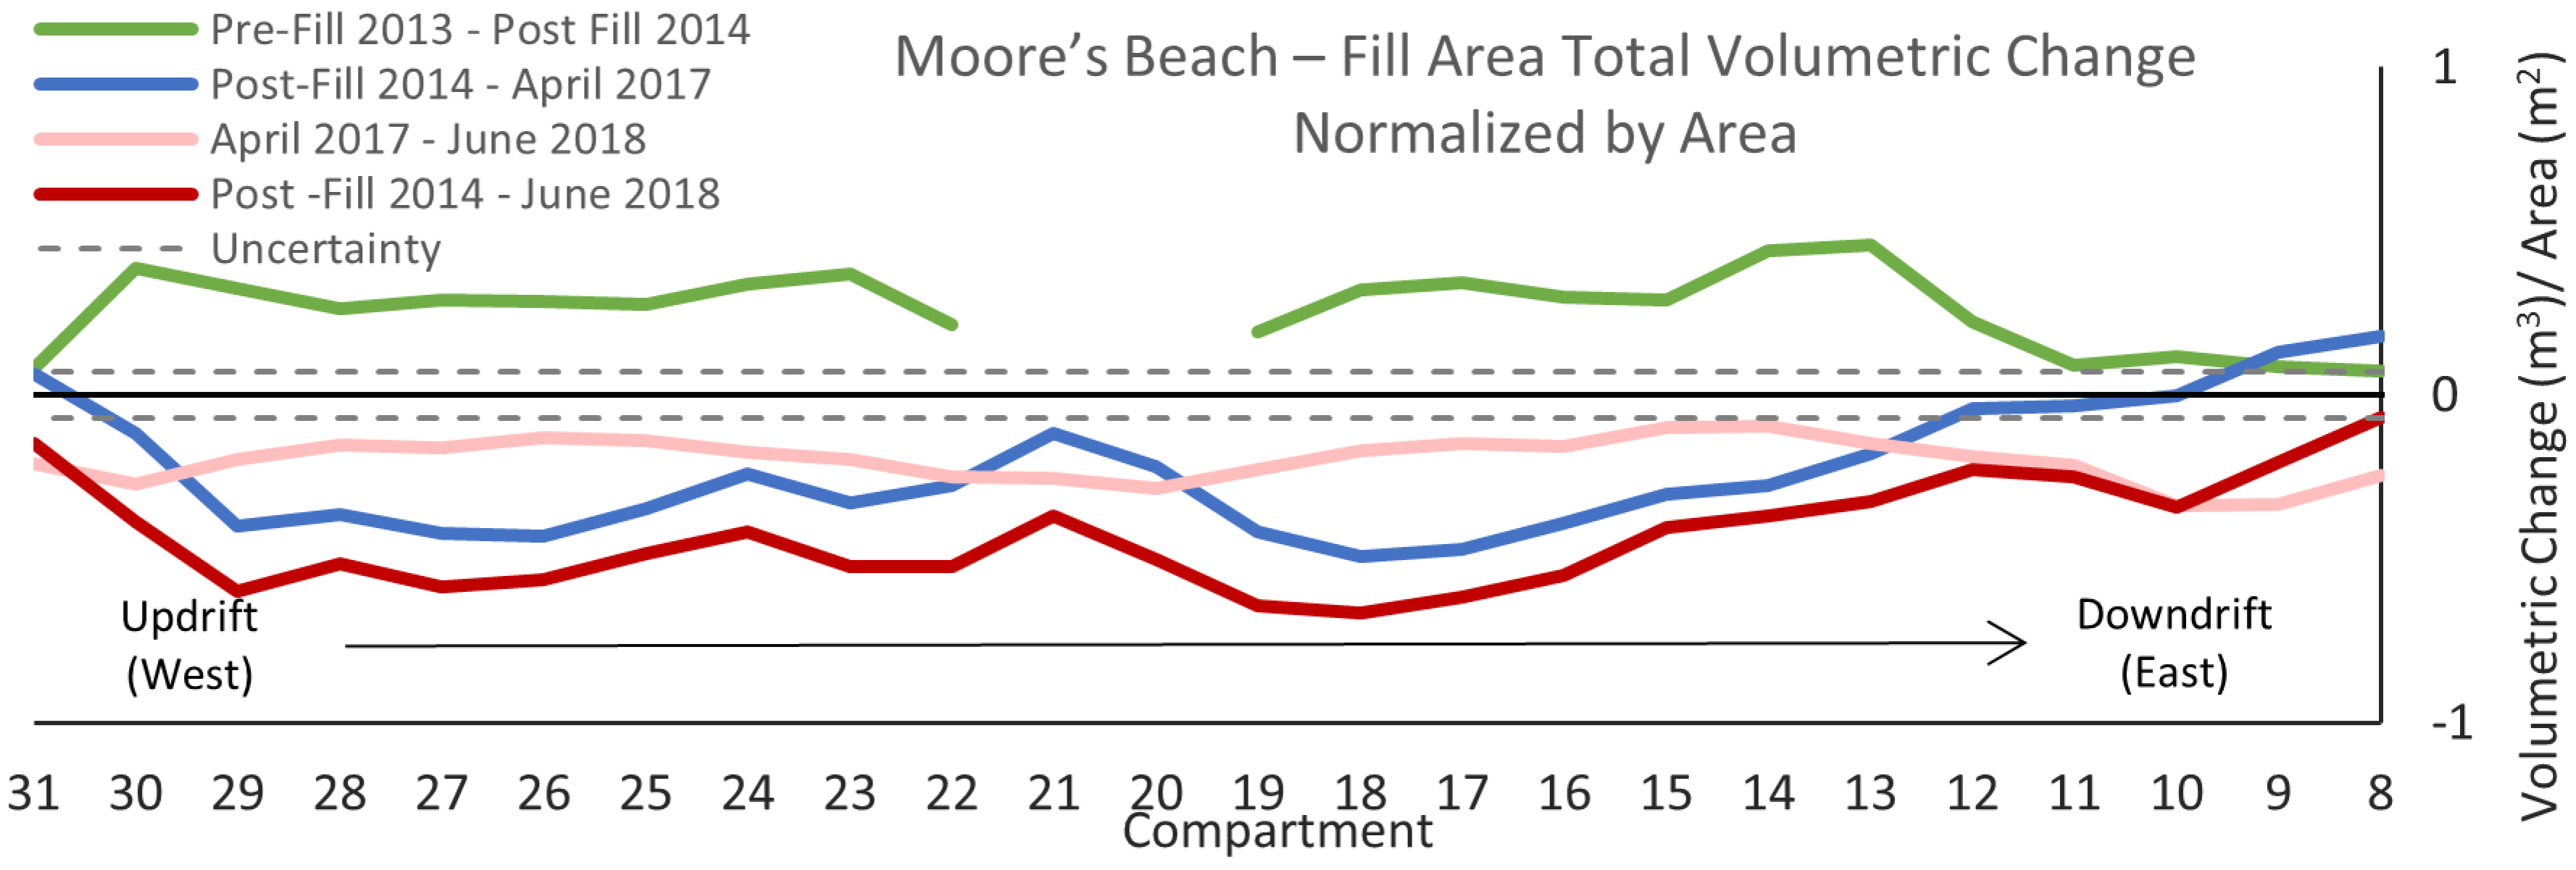
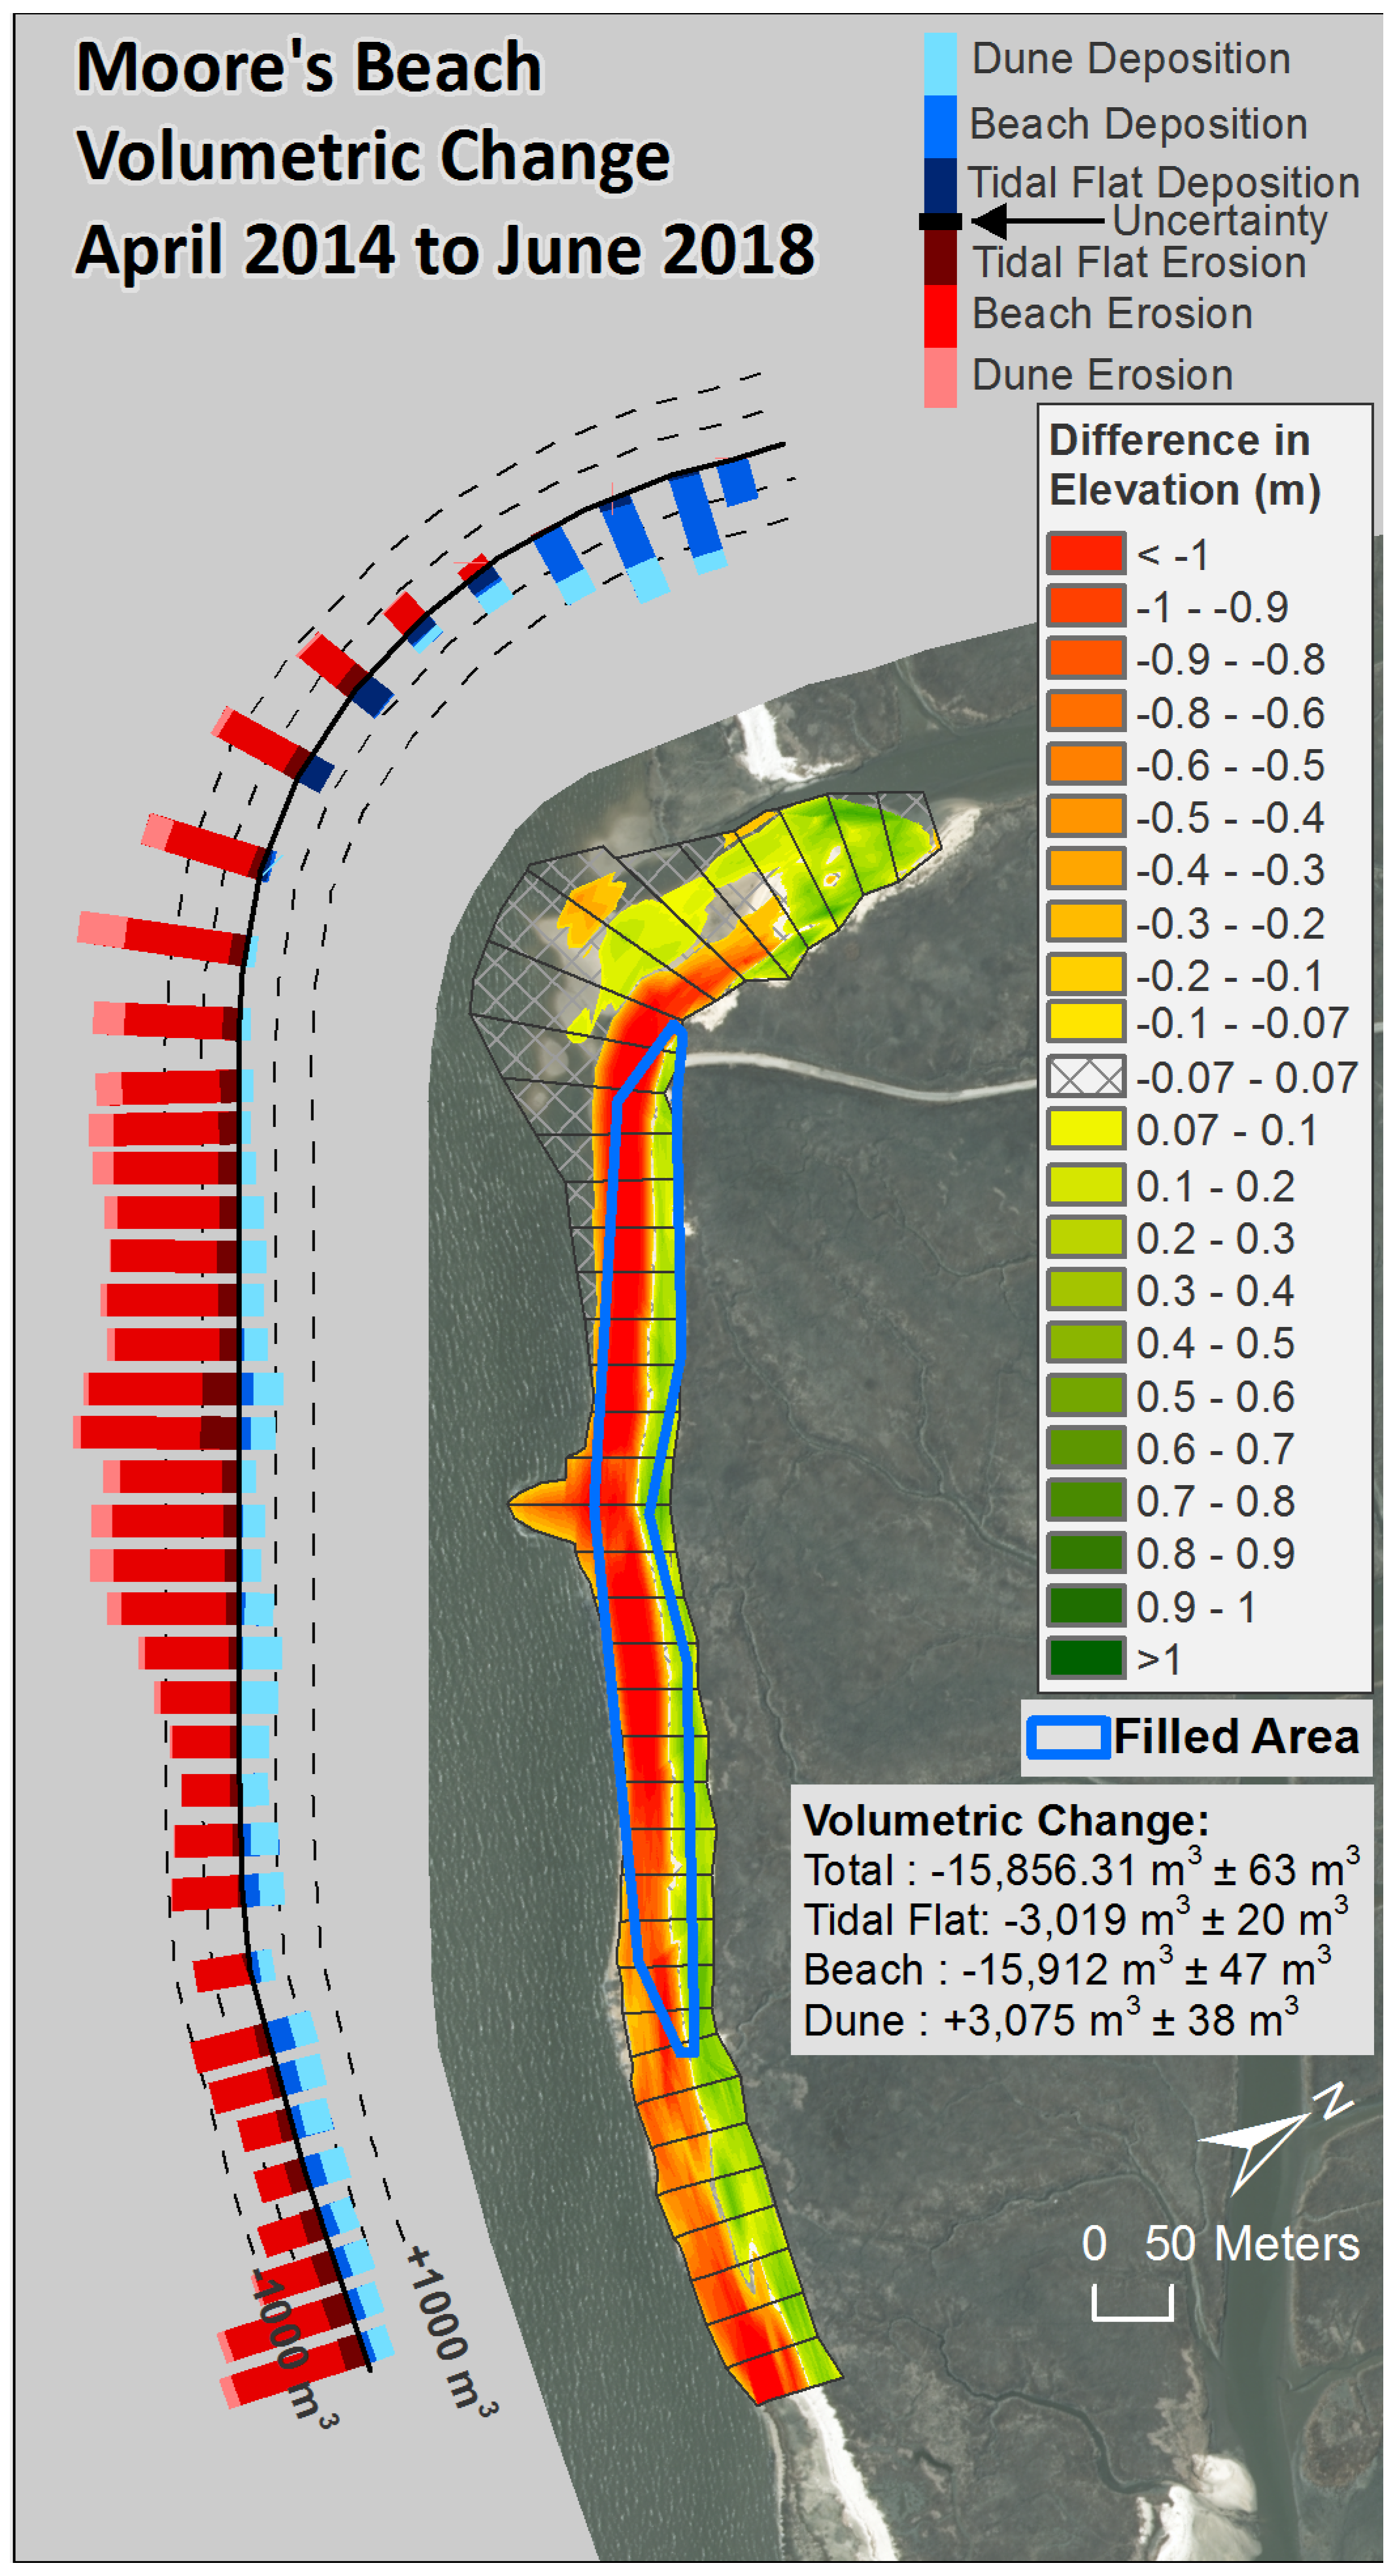
The Moore’s Beach site had the greatest dimension of volume change and displacement of geomorphological features following placement of the fill, a loss of 15,856 m
3 ± 63 m
3. All of the emplaced fill had been eroded, and there was no gain of volume in the tidal flat within the study area. A combination of the absence of offshore bars and troughs and the greater offshore water depths at this site probably caused greater incident wave energy to reach the shore and generated greater opportunity for sediment mobilization and transport. The two remnants of building foundations in the beach acted as groins and slowed some of the alongshore transport, but also caused an increased inland shoreline position displacement downdrift. The geomorphological evolution of the site was recorded in the volume changes and the spatial shifts of the tidal flat, beach, and dune features (
Figure 18). The DEM comparison showed a loss of sediment from the tidal flat and the beach for the entire site, except at the creek mouth at the updrift end of the study area. Nearly all of the volume gains were in the dune elevation category, augmented by some beach volume gains downdrift of the fill area. Thus, in a classic rollover mode, the beach-dune system was shifting inland through transfers of sediment across the dune zone and into the adjacent marshes. In addition, the beach face was occupied by exposed peat for the length of the study area, except for the creek mouth. The negative sediment budget for the site, the increased exposure of peat low on the profile, and the absence of nearshore sand bars pointed to a decreasing sediment mass to support the continuing presence of the dune-beach component of this barrier island as it shifted inland, accompanied by washover fans topping an ever-expanding peat exposure at the estuarine margin.
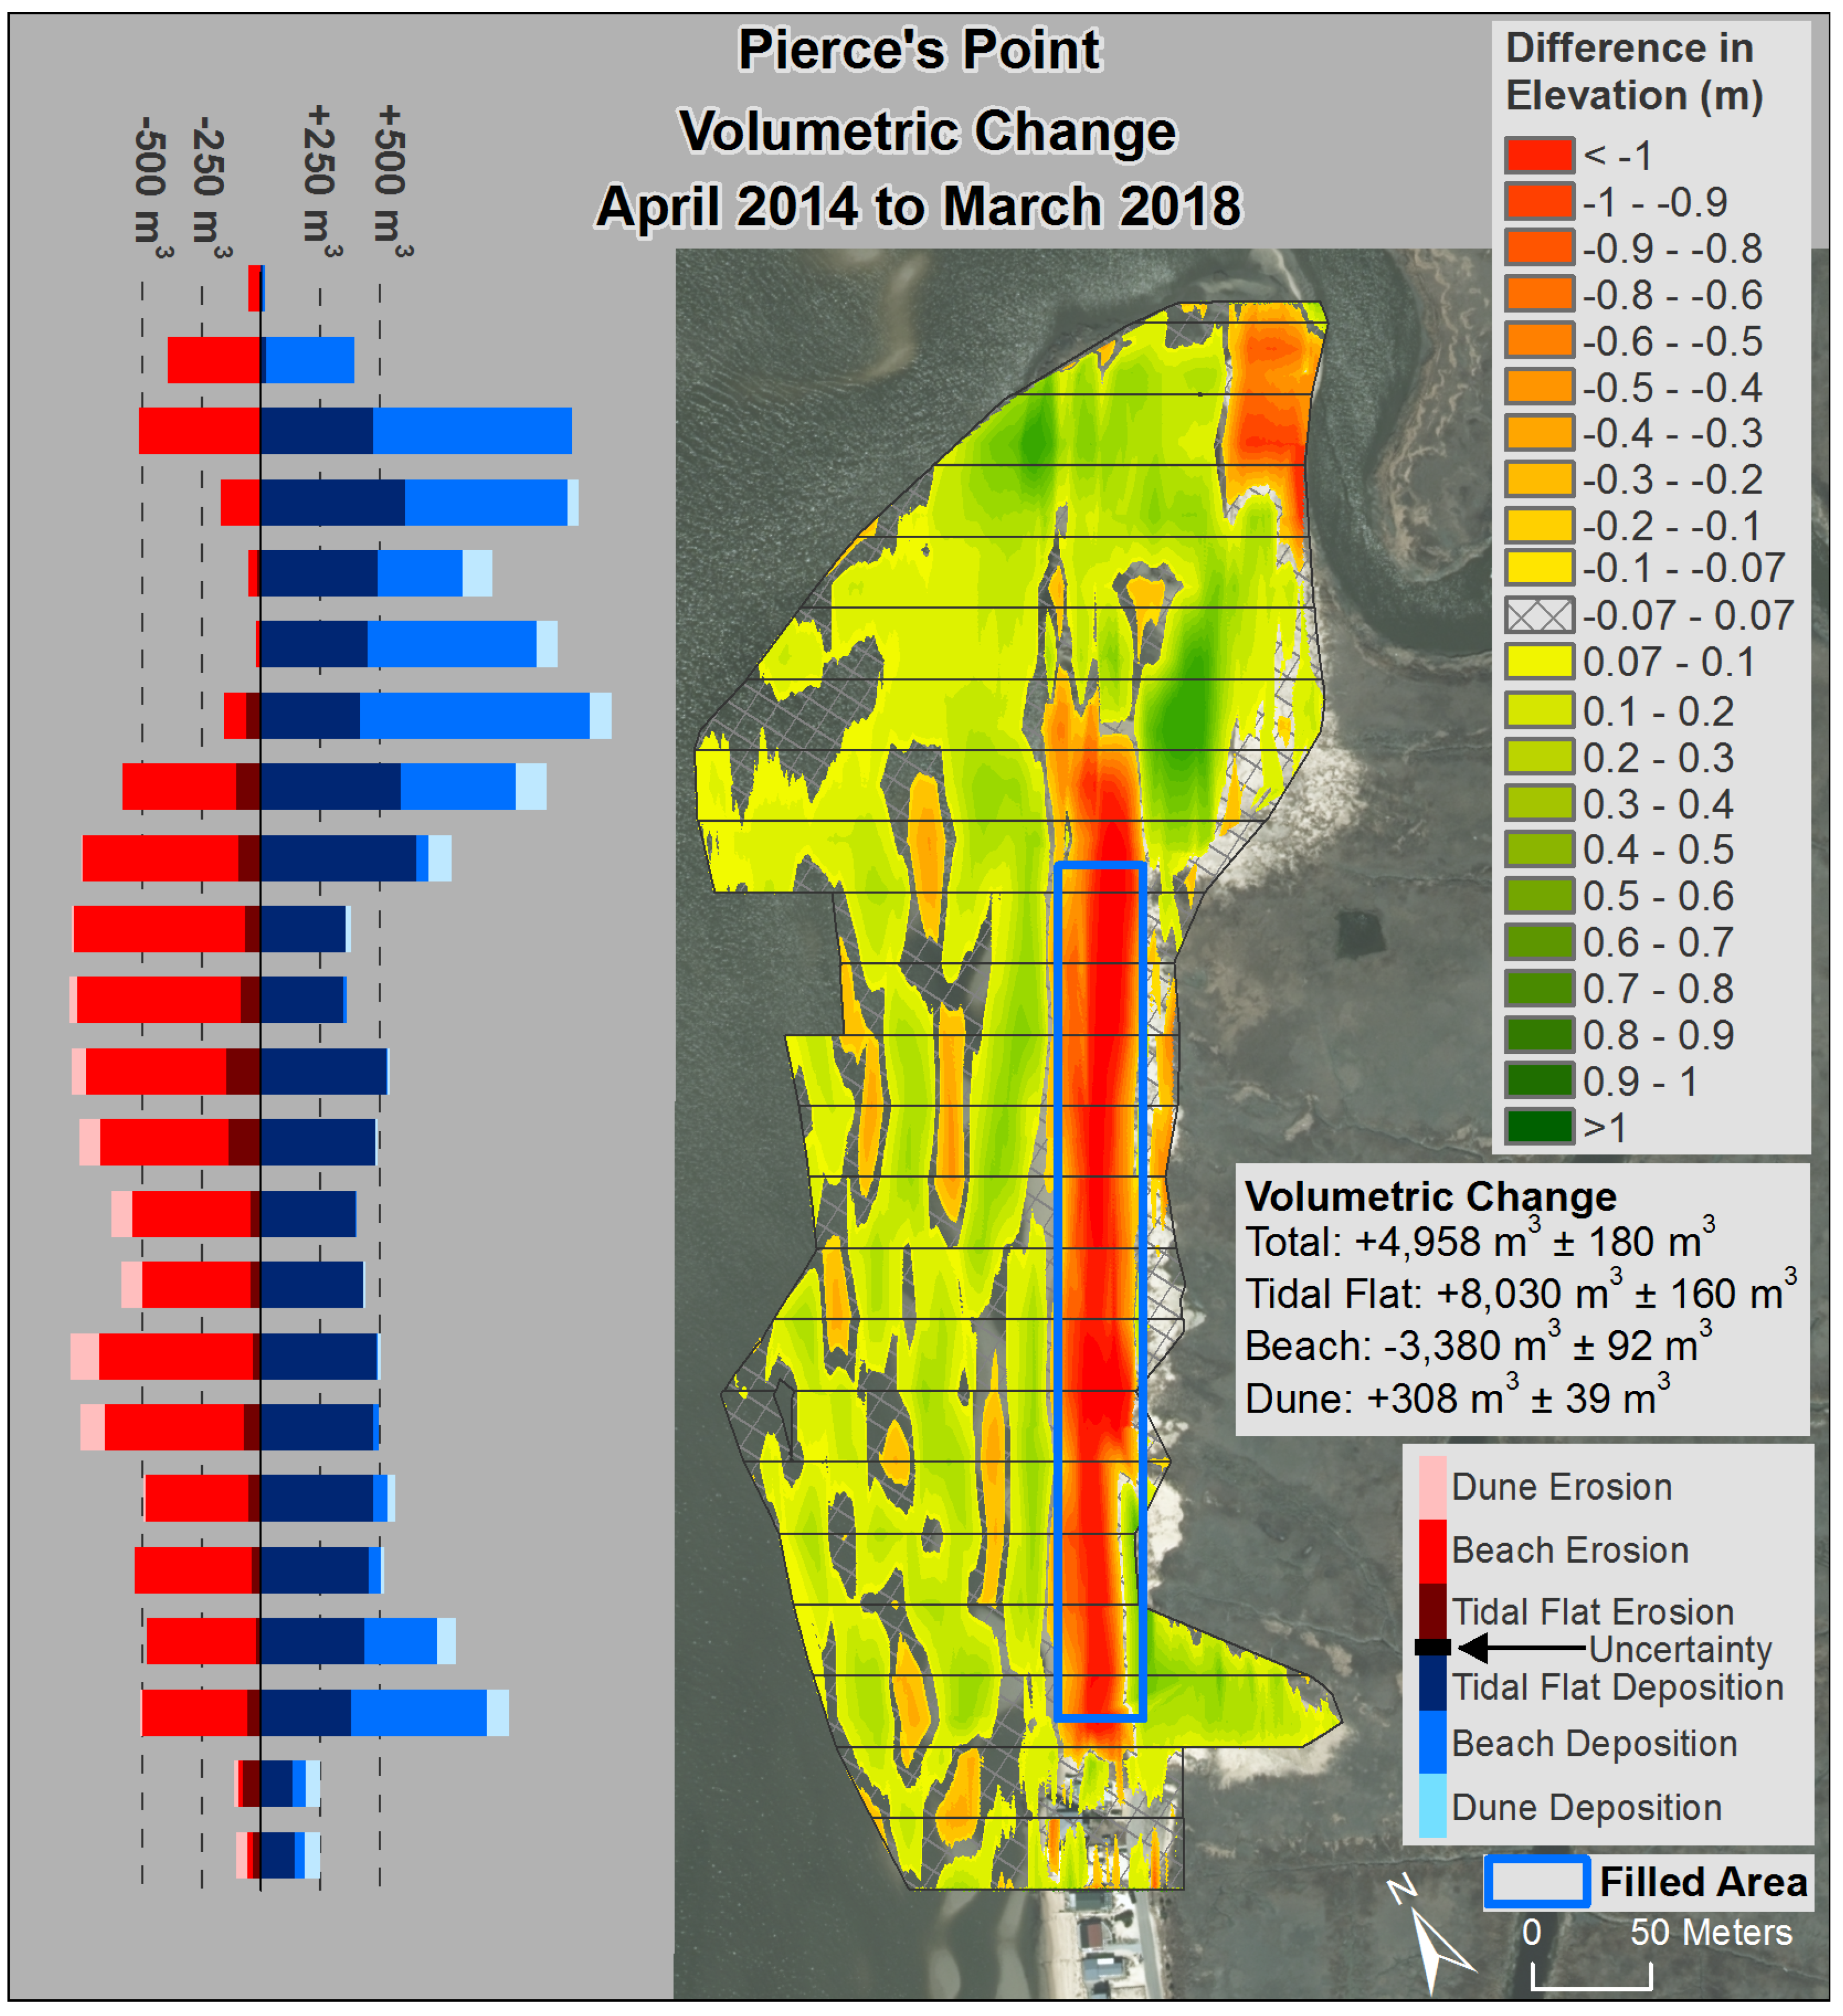
The Pierce’s Point site had a mix of losses and gains, primarily in the tidal flat and beach, with a net gain of nearly 5000 m3. The tidal flat gained more than twice as much as was lost from the beach, thereby indicating that there was input from outside the study area. The tidal flat updrift of the site was replete with multiple bars and troughs extending seaward of the tidal zone and updrift as well. This was a large source of sediment in the offshore topography for potential beach accretion. However, the surveys indicated a general increase in offshore bar width along with an offshore displacement, while retaining a similar elevation of the bars. A further evaluation of the bar and trough topography was that oyster racks in the offshore have a prescribed elevation of the cages above the bottom and they did not require adjustment during the period of these surveys. The major subaerial accumulation was in the beach elevation category downdrift of the fill area and in the embayment adjacent to the tidal creek. The growth of this feature suggests downdrift accumulation associated with alongshore transport at beach face elevations. This accumulation was also atop a marsh surface that existed between the downdrift end of the fill area and the creek. There was some dune feature growth at the updrift margin of the study area and at the inland margin of the accumulation downdrift of the fill. However, these positive components of the dune feature were areas of washover that achieved the elevations assigned to the dune category. They were limited in spatial extent, and unvegetated where sediment could easily be remobilized. The barrier island rollover mode was present in the northern half of the site and in several of the compartments in the updrift portion of the site. There was a peat exposure at these locations and an inland displacement of the beach and dune features in these locations. In many of the downdrift compartments with peat exposure, the sand accumulations were tens of meters inland and over the pre-existing marsh. Over the four-year period of monitoring, the original fill area had lost all of the sediment placed on the beach, with little transport into the adjacent dune zone except at the location of the large overwash fan at the updrift margin. With exposure of the peat low on the beach and little transfer of sediment into the upper beach and adjacent dune, most of the site had a negative sediment budget and the geomorphological features were diminishing. There was growth of the subaerial beach and dune feature at the downdrift portion of the study area, but that volume was perched atop a marsh feature that will not contribute sediment to the dune-beach form as it erodes. The unknown contributor at this site was the source of the great amount of sediment on the tidal flat and offshore. There was no sign of beach accretion in the vicinity of the study area that might be indicative of onshore transport. Rather, the signs pointed to alongshore transport, displacement associated with interruptions or interference with alongshore transport, and modifications of the offshore bars and troughs where tidal creek processes interacted with the incident wave and current processes. That is, the tidal creeks were sites of shoals that took on the form of deltas rather than shore-aligned bars and troughs. The net result was a transgressive barrier island morphology that was responding to the negative sediment budget in the beach-dune system.
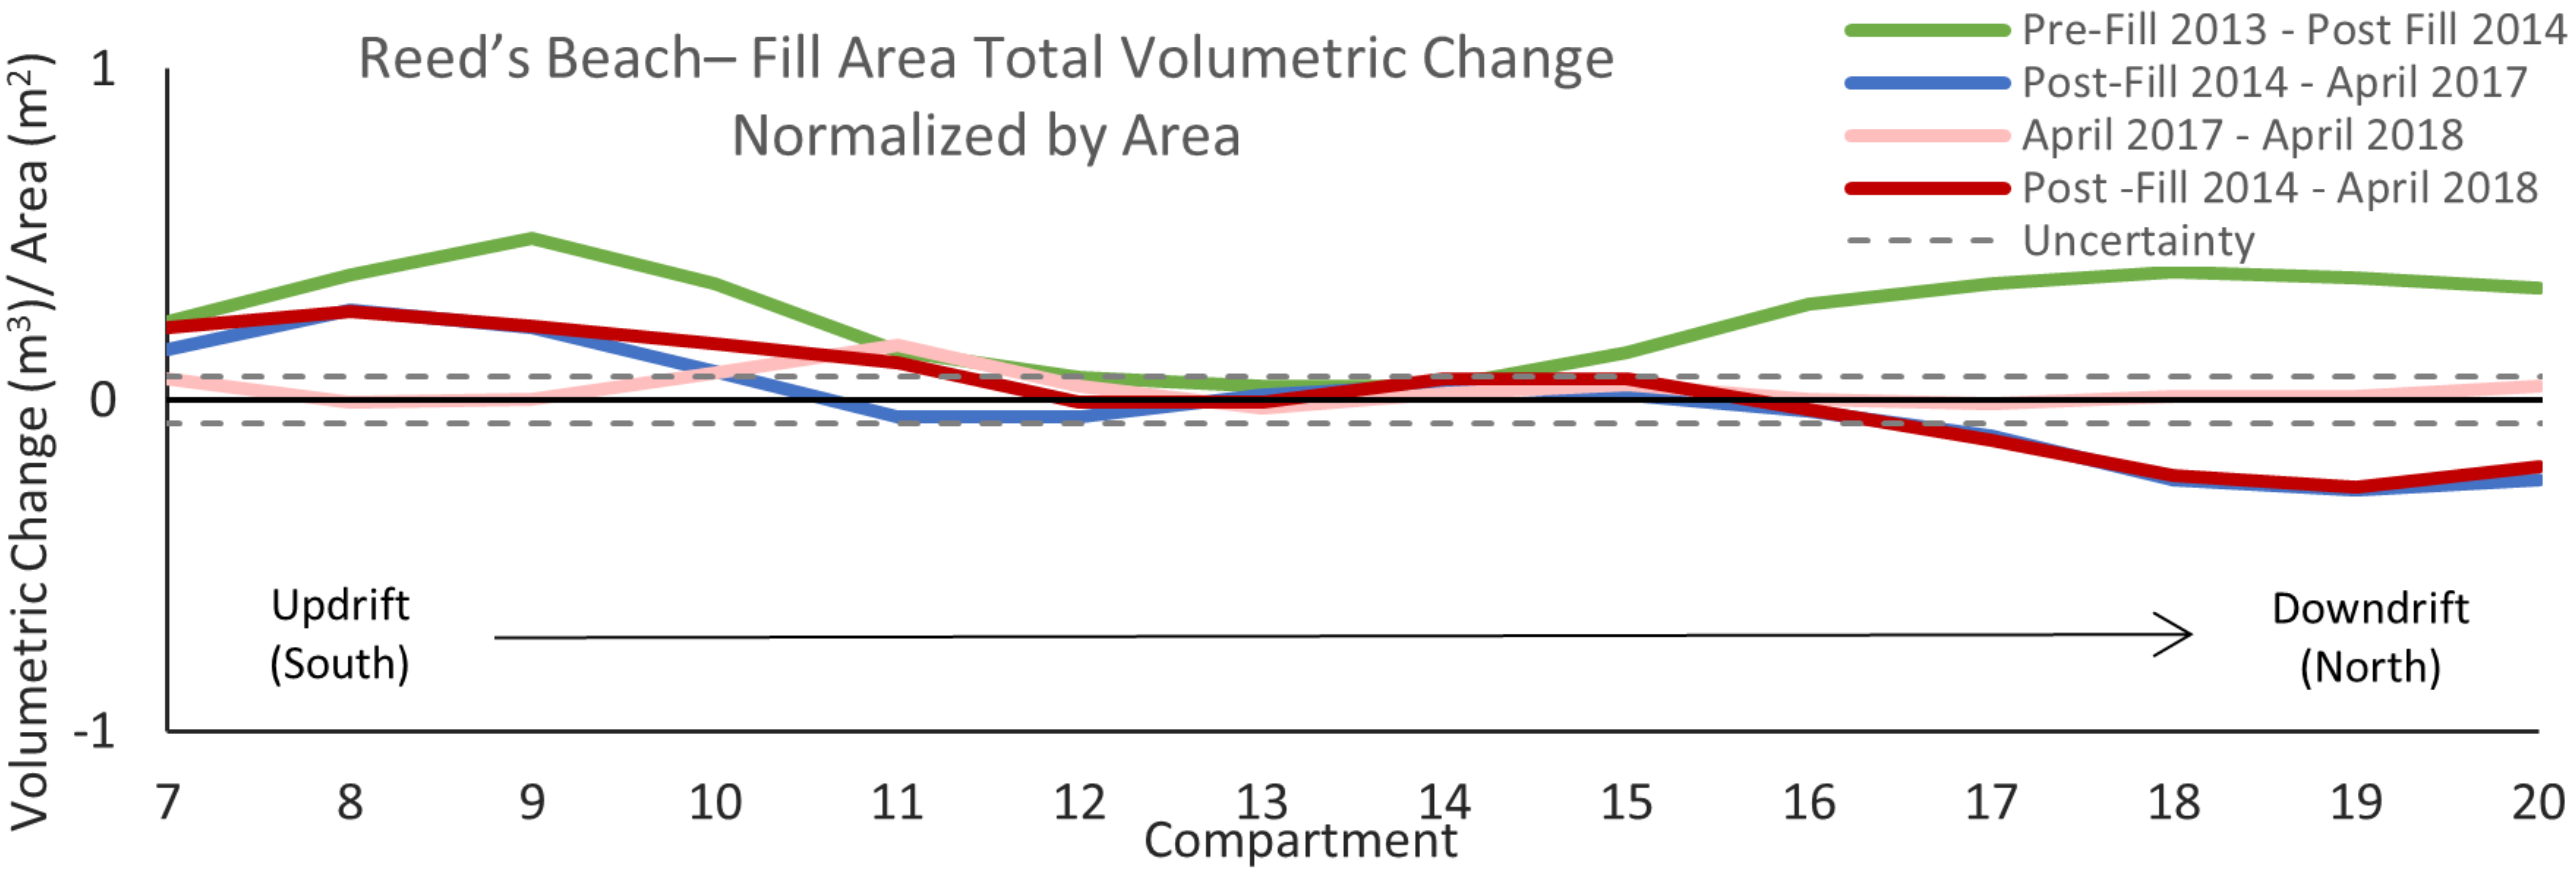
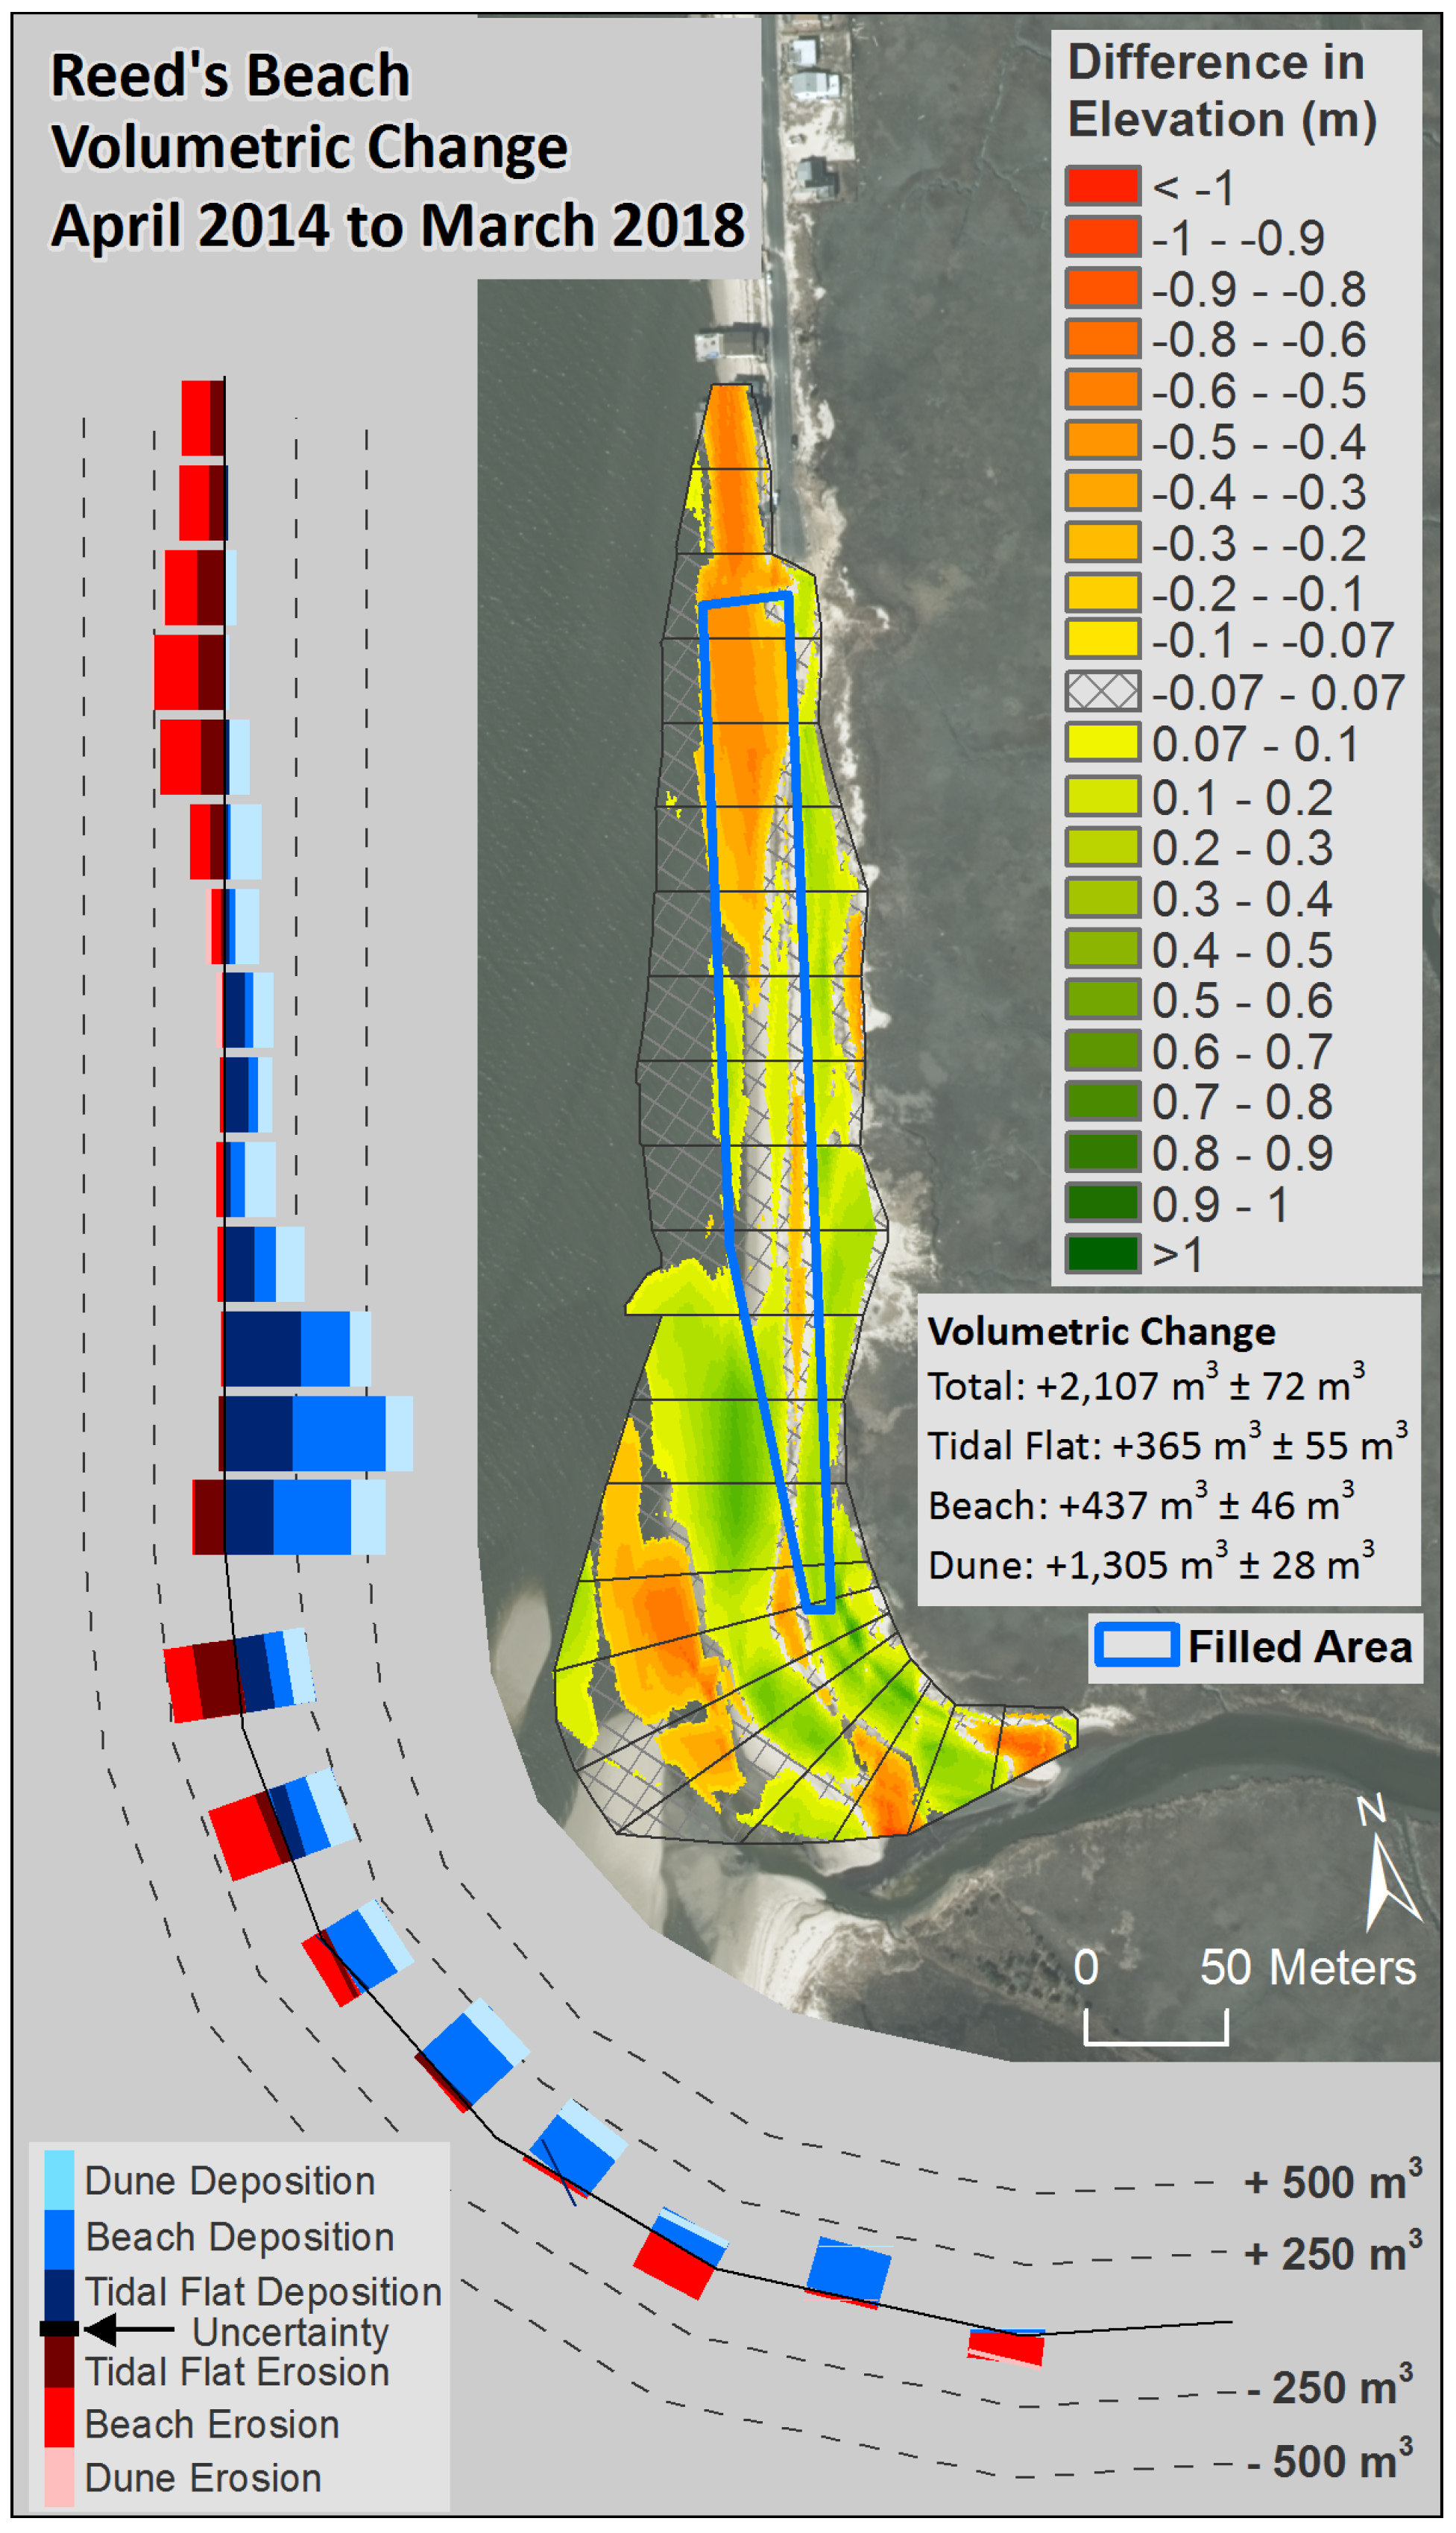
The Reed’s Beach site was a mix of volume gains and losses, with net gain in each of the tidal flat, beach, and dune features, amounting to 2107 m3 ± 72 m3. However, the gain was because of the large placement of fill on the two beaches immediately updrift, at Cook’s Beach and Kimble’s Beach, rather than the fill on-site. Northerly alongshore transport had removed most of the sediment placed at these updrift beaches. Field observation at these locations in 2018 had revealed that they were now shorelines of exposed peat and active marsh. Much of the positive sediment budget at Reed’s Beach was in the tidal flat at the mouth of the creek at the updrift end of the study site. Some of the location of accumulation was related to the shifting of the creek channel and the modification of the associated deltaic shoals. Some of it was associated with accumulation along the creek margin in the elevations of beach and dune topography. Downdrift of the creek, the beach zone had either no change or had a negative sediment budget, representing a loss of about half of the emplaced beach fill in the northern portion of the site. The node of volumetric gain to the south was most likely fed by material placed updrift. Once beyond downdrift of Compartment 15, the only volume gains were in the dune zone. In this area, the gains widened the dune zone by shifting the dune crest seaward and augmenting the accumulation on the inland margin of the dune, probably through eolian transport. In the updrift portion of the site, the dune showed gains through overwash processes and expansion over the adjacent marsh. There were no peat exposures in the beach at this site, although the beach to the south of the creek was composed entirely of peat and marsh at the shoreline. Relative to the barrier island rollover model, the northern (downdrift) portion of Reed’s Beach exhibited inland migration of the tidal flat and beach topographies, while retaining volume in the dune zone and seaward displacement of the dune crest. Toward the updrift margin of the study area, there was an increasing volume in the three landform categories, expansion of the dune zone into the adjacent marsh, and a net seaward displacement of the features. These positive metrics were the product of the sediment source from updrift and that source seems to have been exhausted. There is considerable sediment available for downdrift transport that is presently in the tidal creek delta. That may buffer some of the succeeding geomorphological evolution. In addition, this site is at the southern margin of sediment trapped by the lengthy jetty at Bidwell Creek, 1.3 km to the north. This location updrift of the jetty may assist in retaining shoreline position and the associated beach-dune topography in a relatively stable condition and support maintenance of the barrier island system.
In each of the three sites, the beach fill was largely mobilized and transported out of the fill zone. At each site, the sediment budget metrics have portrayed the relative gains and losses in the geomorphological features in the alongshore context, emphasizing the importance of alongshore transport in areas of limited fetch. The analyses of the DEMs have identified vectors of change of the beach features that are part of the desired beach habitat. However, the locations of these beach features were primarily at the margins of the tidal creeks or locations where the beach was migrating over marsh or dunal vegetation. Whereas the creek margins are favorable habitats because they are bare sand on the upper beach, they are not loci of natural sediment accumulation and therefore have limited longevity. Furthermore, the presence of peat exposures in the beaches is indicative of the limited sediment available to maintain the sandy beach feature and the potential limited extent of the beach habitat, both in the zones of fill as well as in the downdrift locations. The large alongshore displacements at Moore’s Beach will continue and diminish the volume of sediment composing the beach and dune topography, leading to increased exposure of the peat. Pierce’s Point will also continue to lose sediment in the area immediately north of the housing and have an increasing exposure of the peat in the beach face, partially offset by the sediment accumulation in the beach elevation zone near the creek mouth. Reed’s Beach benefited by the contribution of the fill at updrift locations and the retention of sediment caused by the jetty at Dias Creek. The beach and dune system at this site will be retained much longer than at the other two sites.


