Article

Evidence for Basement Reactivation during the Opening of the Labrador Sea from the Makkovik Province, Labrador, Canada: Insights from Field Data and Numerical Models

by
Alexander L. Peace
1,*,
Edward D. Dempsey
2,
Christian Schiffer
3,4,
J. Kim Welford
1,
Ken J. W. McCaffrey
3,
Jonathan Imber
3 and
Jordan J. J. Phethean
3
1
Department of Earth Sciences, Memorial University of Newfoundland, St. John’s, NL A1B 3X5, Canada
2
School of Environmental Sciences, University of Hull, Hull HU6 7RX, UK
3
Department of Earth Sciences, Durham University, Durham DH1 3LE, UK
4
Department of Earth Sciences, Uppsala University, 752 36 Uppsala, Sweden
*
Author to whom correspondence should be addressed.
Geosciences 2018, 8(8), 308; https://doi.org/10.3390/geosciences8080308
Submission received: 26 July 2018 / Revised: 13 August 2018 / Accepted: 15 August 2018 / Published: 20 August 2018
(This article belongs to the Special Issue Stress Quantification in Sedimentary Basins)

Abstract

:
The onshore exposures adjacent to modern, offshore passive continental margins may preserve evidence of deformation from the pre-, syn-, and post-rift phases of continental breakup that allow us to investigate the processes associated with and controlling rifting and breakup. Here, we characterize onshore brittle deformation and pre-rift basement metamorphic mineral fabric from onshore Labrador in Eastern Canada in the Palaeoproterozoic Aillik Domain of the Makkovik Province. Stress inversion (1) was applied to these data and then compared to (2) numerical models of hybrid slip and dilation tendency, (3) independent calculations of the regional geopotential stress field, and (4) analyses of palaeo-stress in proximal regions from previous work. The stress inversion shows well-constrained extensional deformation perpendicular to the passive margin, likely related to pre-breakup rifting in the proto-Labrador Sea. Hybrid slip and dilatation analysis indicates that inherited basement structures were likely oriented in a favorable orientation to be reactivated during rifting. Reconstructed geopotential stresses illuminate changes of the ambient stress field over time and confirm the present paleo-stress estimates. The new results and numerical models provide a consistent picture of the late Mesozoic-Cenozoic lithospheric stress field evolution in the Labrador Sea region. The proto-Labrador Sea region was characterized by a persistent E–W (coast-perpendicular) extensional stress regime, which we interpret as the pre-breakup continental rifting that finally led to continental breakup. Later, the ridge push of the Labrador Sea spreading ridge maintained this general direction of extension. We see indications for anti-clockwise rotation of the direction of extension along some of the passive margins. However, extreme persistent N–S-oriented extension as indicated by studies further north in West Greenland cannot be confirmed.

Graphical Abstract

1. Introduction

Understanding the geological manifestations of rifting and continental breakup is crucial to further our understanding of the behavior of the crust and lithosphere under extension [1,2,3] as well as reducing the exploration risk at rifted continental margins [4,5,6]. The coastal exposures adjacent to modern, offshore passive margins often preserve evidence for rifting- and breakup-related deformation [7,8,9]. In addition, passive margin settings also provide the opportunity to characterise the relationship between rift-related deformation and pre-rift structures [10,11], concepts which are useful when undertaking offshore studies where such observations are more problematic [11,12]. Inheritance of such pre-existing structural features has been shown by a plethora of previous work to significantly influence various aspects of rift and margin development, including magmatism [13,14,15], sedimentary basin geometry [11,12,16], and the timing and nature of breakup [17,18,19].
Presented herein is an analysis of structural field data obtained in proximity to the town of Makkovik in Labrador, Canada (Figure 1), which is located within the Aillik Domain of the Palaeoproterozoic Makkovik Province (Figure 2), in addition to hybrid slip and dilation tendency analysis and independent regional geopotential stress models based on plate tectonic reconstructions [21].
The aims of this study were to: (1) determine if onshore deformation exposed in Labrador can be attributed to the Mesozoic-Cenozoic opening of the Labrador Sea, (2) characterise structures that predate Mesozoic rifting, and (3) understand the relationship, if any, of such structures to subsequent rifting. Studies on the role of pre-existing structures in Labrador are required to compliment studies documenting structural reactivation on the conjugate West Greenland margin [7,12,25,26] to determine if both margins display similar expressions of rifting or if different processes were in play, as would be suggested by asymmetric rift models of the Labrador Sea [22].

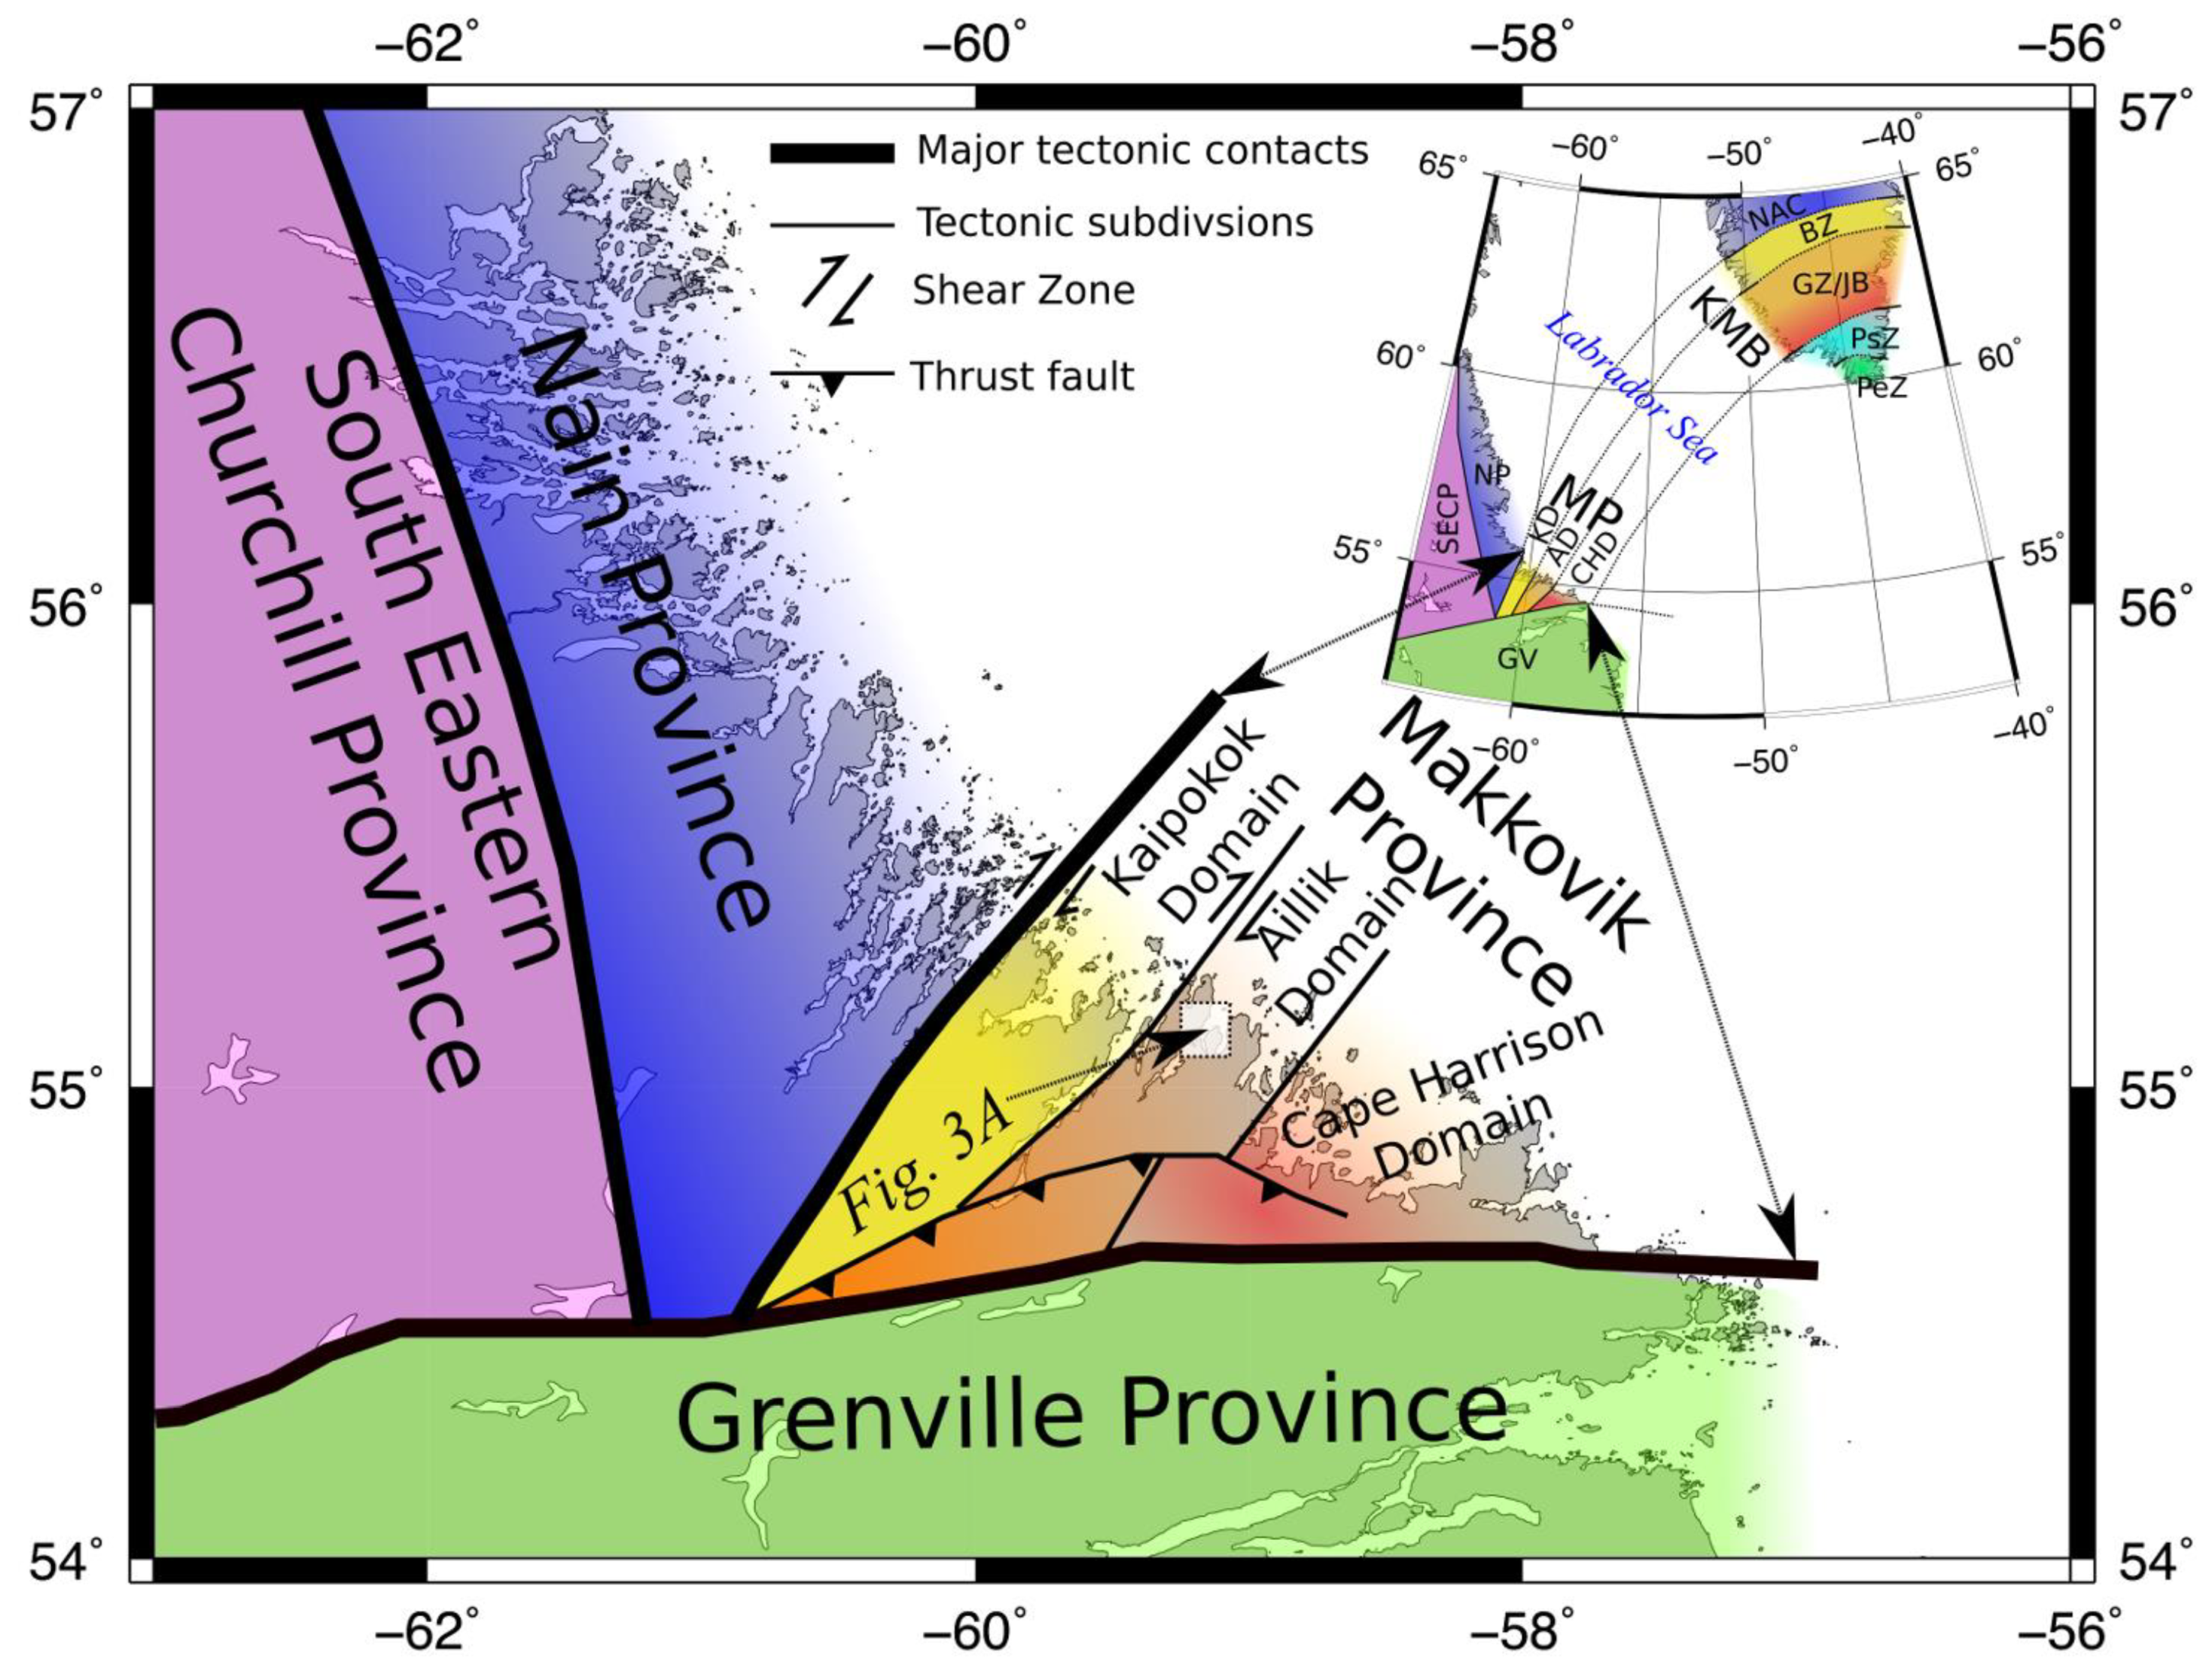
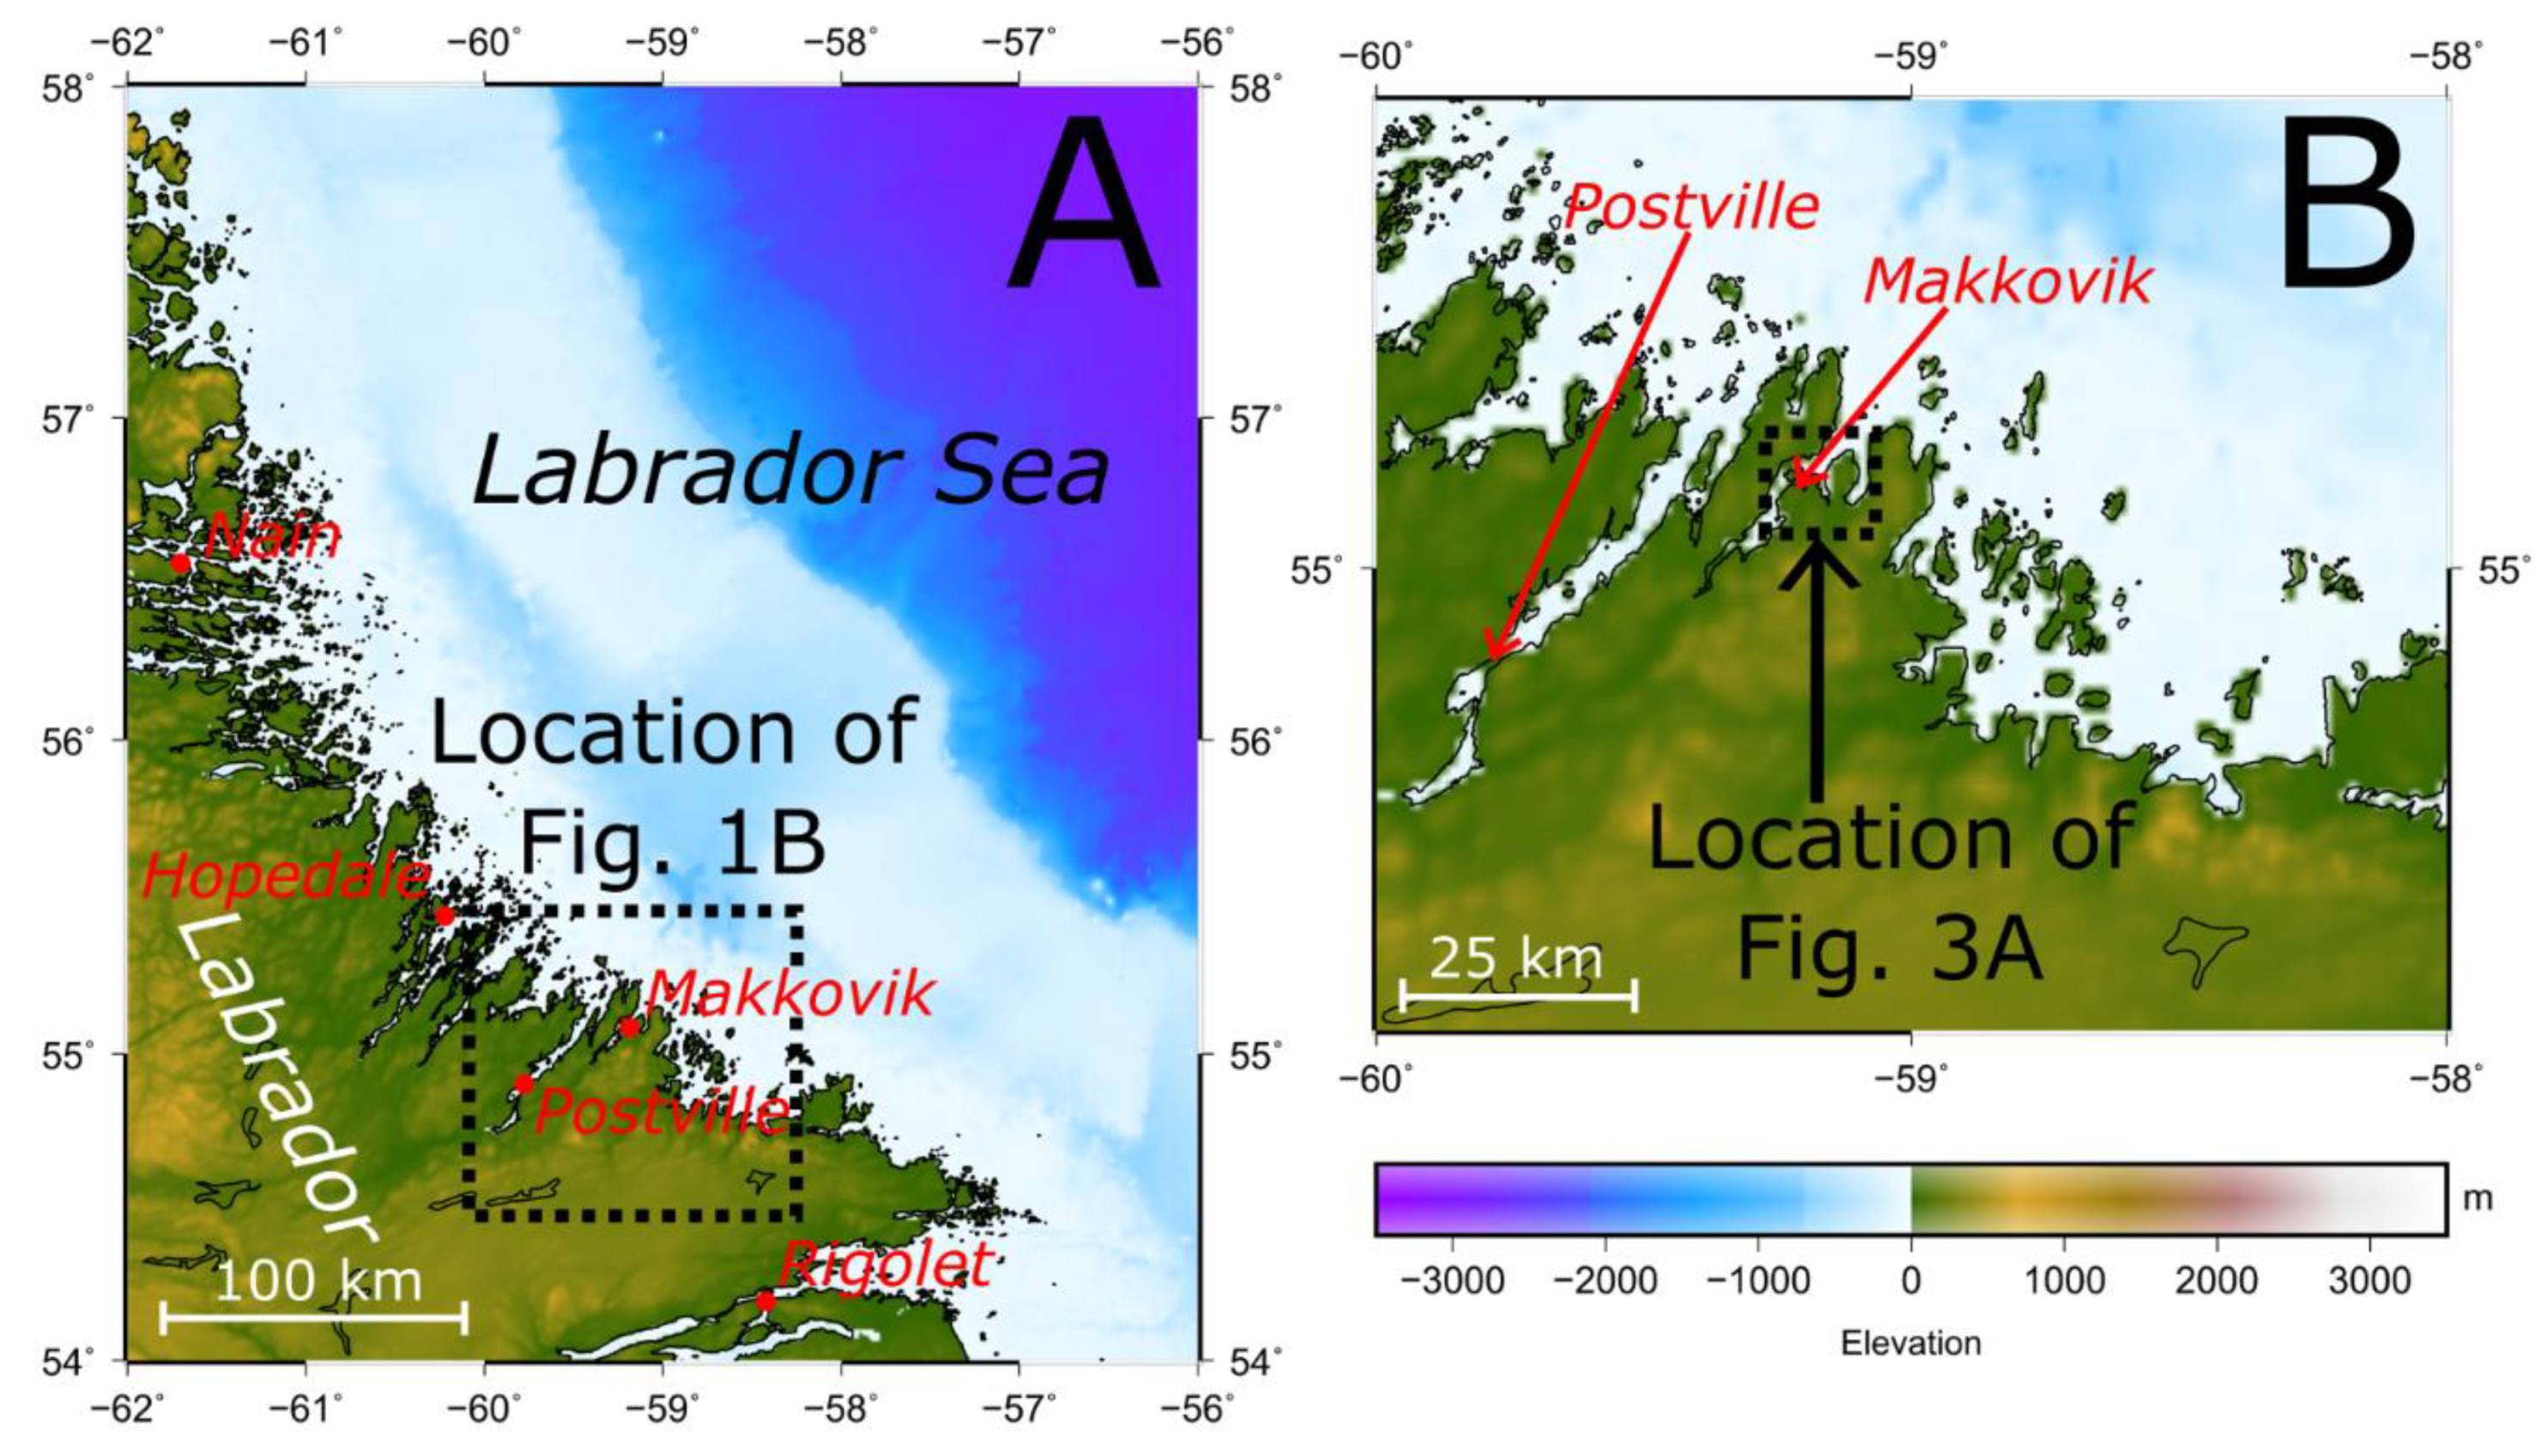
2. Geological Setting

The Labrador Sea separates Labrador in eastern Canada from Southwest Greenland (Figure 2A) and is floored by a small (~900 km wide) oceanic basin [22,27,28]. The Labrador margin provides an ideal location to conduct a study of rift-related deformation for a number of reasons, including near-continuous coastal exposure [22], complementary studies on the conjugate West Greenland margin [7,8,25], and limited production of oceanic crust making conjugate margin studies easier [22,29,30].
Continental breakup in the Labrador Sea occurred at ~62 Ma [31] following a series of rifting events [27,32] that had certainly begun by the Early Cretaceous but had possibly started much earlier in the Jurassic or even the Triassic [33]. The margins of the southern Labrador Sea are considered to be typical non-volcanic margins [27] with igneous rocks limited to deep wells in offshore Labrador [34], major coast-parallel dykes in southwest Greenland [33,35], and their possible minor equivalents in Labrador [36]. The margins of the northern Labrador Sea and Davis Strait are by contrast considered to be volcanic, displaying evidence for seaward dipping reflectors [37] and other widespread magmatism [14,38,39].
The field data presented in this contribution are from the Palaeoproterozoic Aillik Domain of the Makkovik Province [23,40,41], which is separated from the Nain Province to the northwest by the Kanairiktok shear zone and from the Grenville Province to the south by the Grenville Front [42,43]. The Makkovik Province is characterised as a Palaeoproterozoic accretionary belt and is the smallest defined tectonic component of the Canadian shield [40]. Prior to the opening of the Labrador Sea, the Makkovik Province was adjacent to the Ketilidian mobile belt (KMB; Figure 2), which currently forms part of Southwest Greenland [24,44,45,46]. The Makkovik Province can be structurally divided into three zones with distinctive geological characteristics; from northwest to southeast, these are the Kaipokok, Aillik, and Cape Harrison domains (Figure 2) [47].

3. Field Data Acquisition and Stress Inversion

3.1. Field-Based Methods

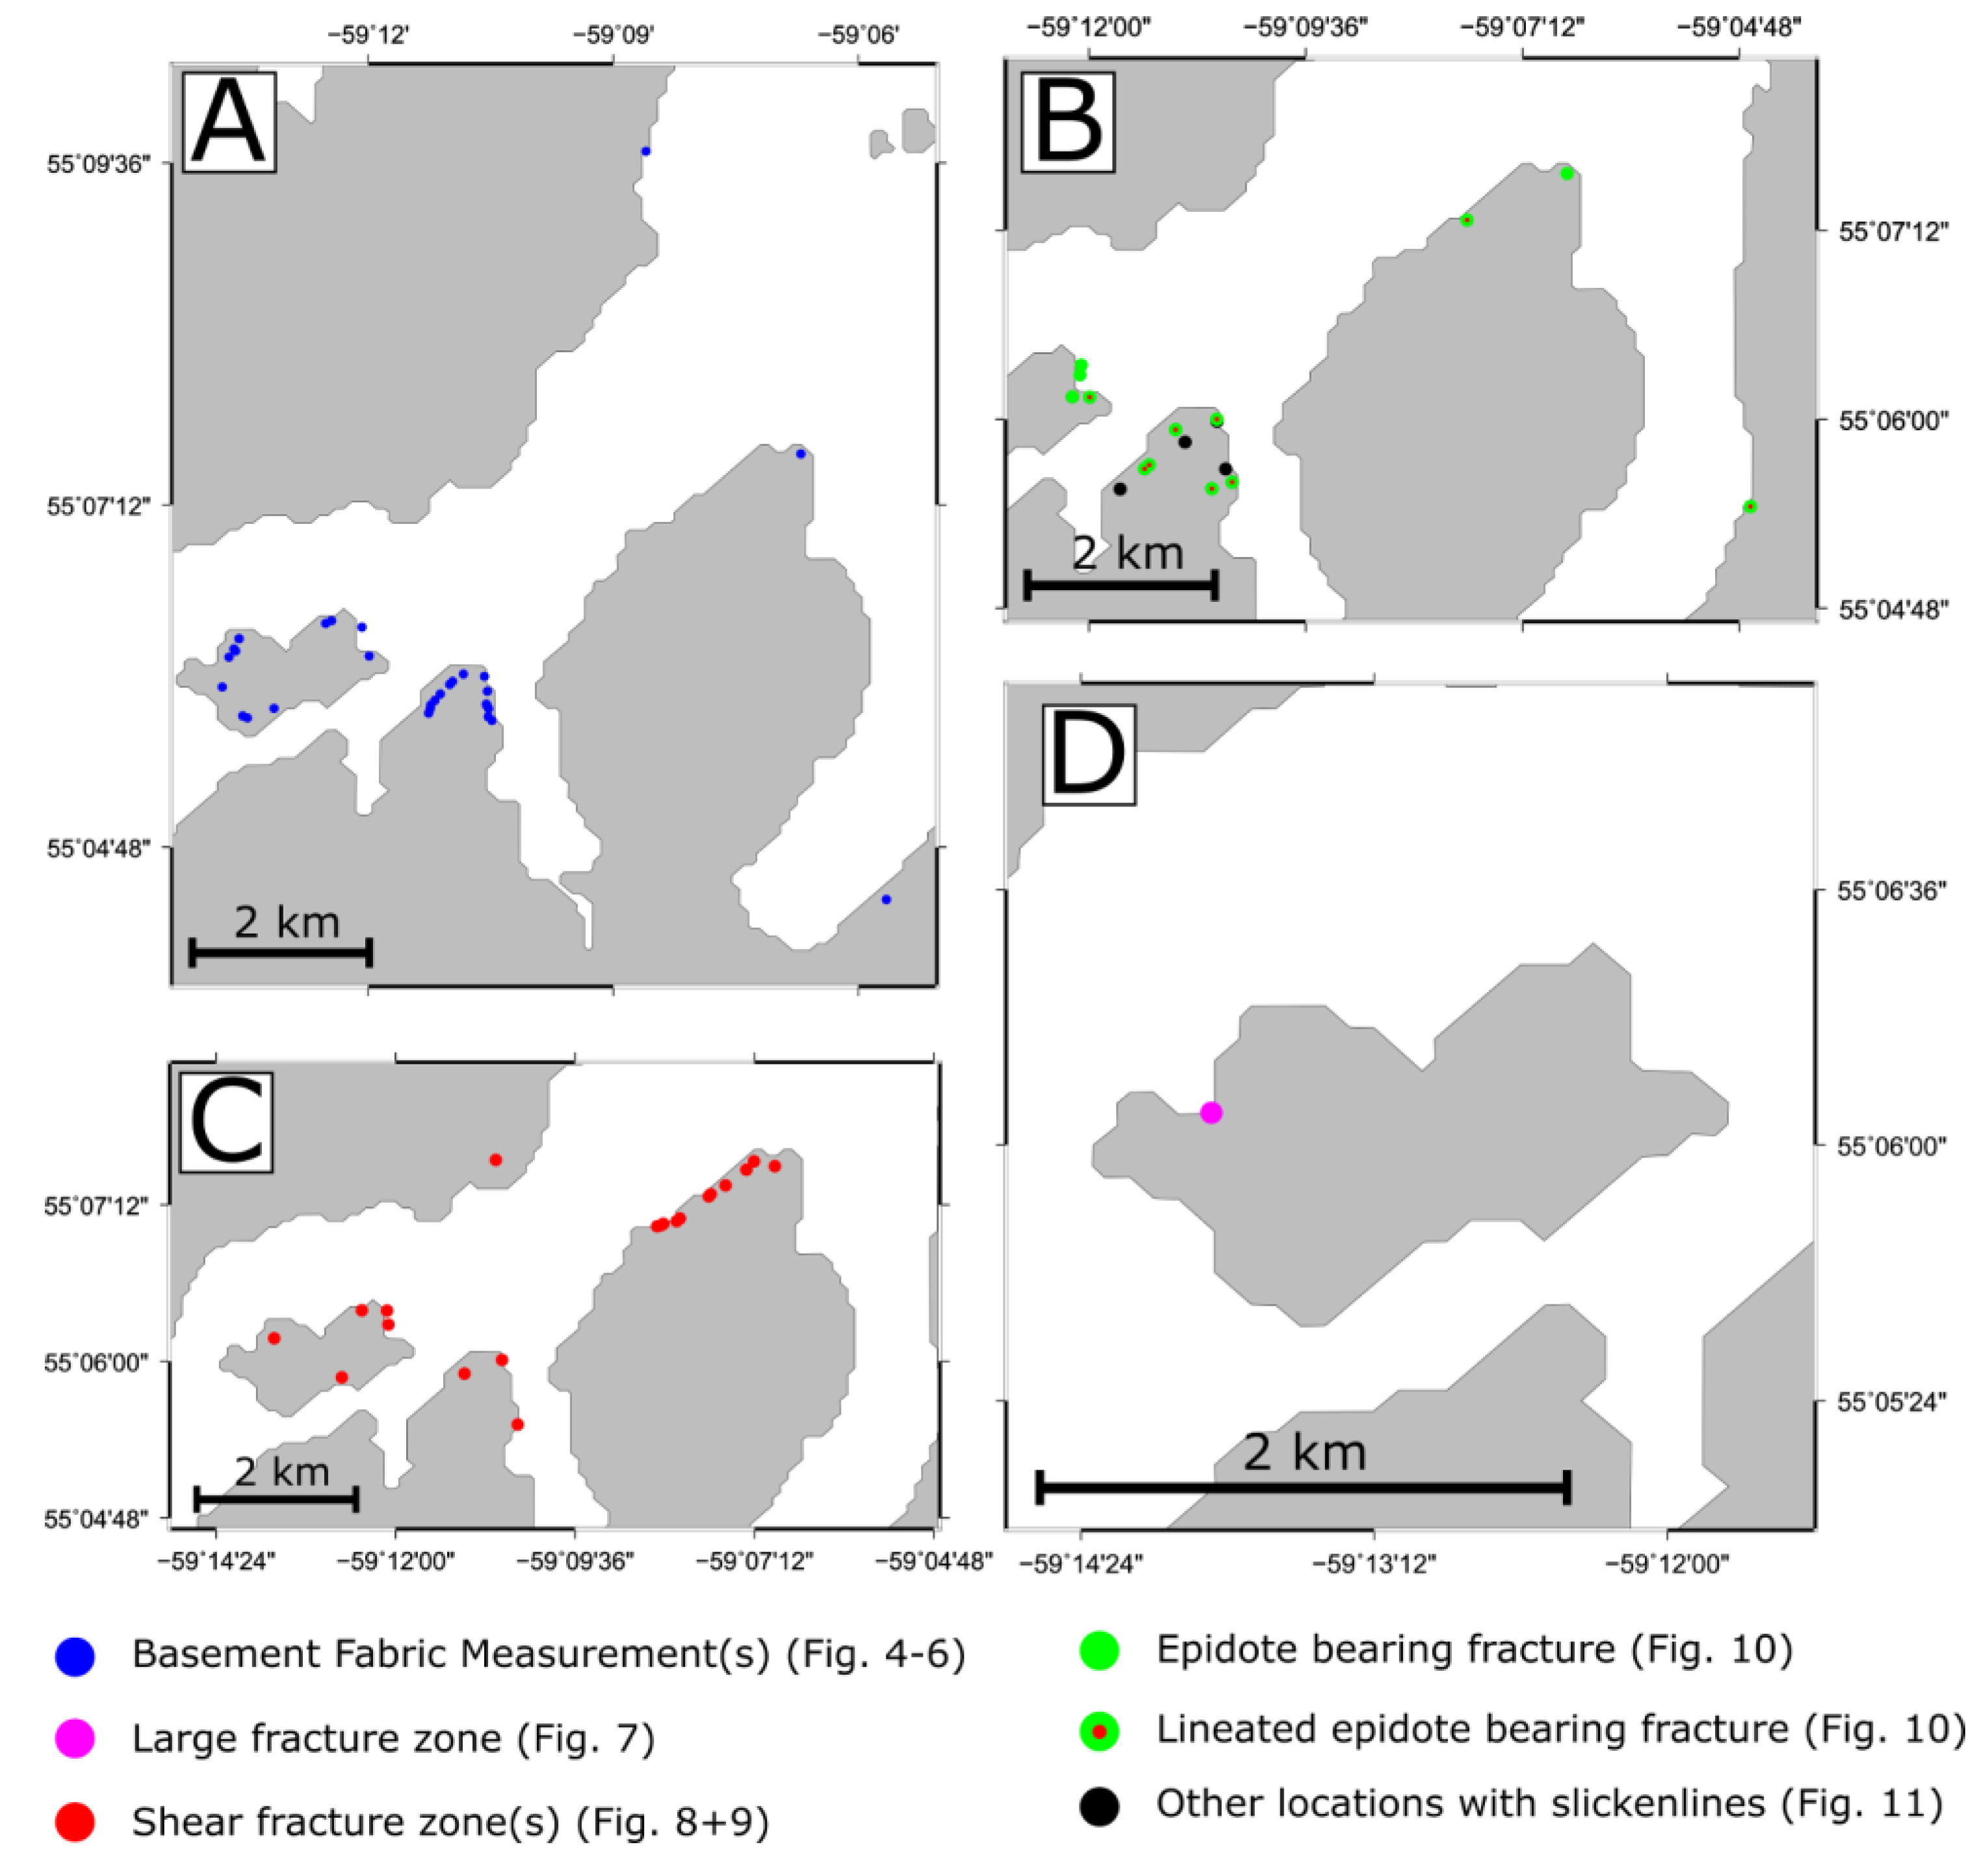
3.1.1. Field Data Acquisition

In this study, onshore brittle deformation from onshore Labrador in Eastern Canada was characterised in the Palaeoproterozoic Aillik Domain of the Makkovik Province. All field data presented and analysed herein (Figure 3) were collected during the same field campaign in summer 2015, with the results re-evaluating the potential rift-related magmatism described in [22]. The data include measurements of the orientation of the metamorphic mineral foliation in the basement in addition to measurements from brittle structures, some of which contained kinematic indicators that were used to perform stress inversions that could be used to build structural reactivation models using the MOVETM software (Midland Valley, Glasgow, UK).

3.1.2. Stress Inversion of Field Data

Stress inversion (palaeo-stress analysis) uses fault geometry and kinematic data to reconstruct past stress configurations [48]. The main principle of stress inversion is that the slip on a plane occurs in the direction of the maximum resolved shear stress [49]. We employ the MyFault software version 1.05 by Pangea Scientific Ltd. [50] for our stress inversion, applying the minimised shear stress variation method. The minimised shear stress variation calculation is a standard inversion method [51,52,53] that allows all faults to fail simultaneously, enabling us to calculate the orientation and relative magnitudes (stress ratios) during deformation of the fault set analysed. This method provides a more robust solution than, for example, the simple shear tensor average [50]. Using stress inversion we determined if the observed onshore deformation events are compatible with previous interpretations of the Mesozoic rifting direction prior to the opening of the Labrador Sea [8], and thus elude towards whether the observed brittle deformation was associated with such events.
The key assumption of stress inversion is that the magnitude of the slip stress on a fault is similar for all faults in the set at the time of slip [50], i.e., all deformation is assumed to occur simultaneously within a fault set. For this reason, it is particularly important to determine if all the faults analysed belong to the same deformation event. Thus, previous work devotes considerable effort to separating data into separate fault sets in space and time [52]. However, distinguishing which structures are related to rifting can be problematic given that most margins, including Labrador, have experienced multiple phases of deformation both prior to rifting [8,12,54] and in some cases after rifting, such as fault reactivation during margin inversion [55,56].
For the purposes of this study, two independent stress inversions were performed, ‘inversion A’ and ‘inversion B’. Inversion A was performed on all slip surfaces with slicken lines collected during the fieldwork (i.e., no age constraint), whilst inversion B was performed exclusively on striated slip-surfaces with syn-kinematic epidote mineralisation, which appears to be proximally related to the presence of previously dated dykes [36,57]. This segregation is due to the epidote mineralisation representing the only brittle deformation that could be relatively age-constrained. The close association of this event with the mafic dykes conceivably indicates that the mineralisation is genetically linked to the dykes. It is conceivable that the epidote mineralization event is actually part of the same deformation event as that which produced the other kinematic indicators (inversion A) but that the presence of the epidote is simply an artifact of the proximity of these structures to the dykes. The dykes that contain the epidote mineralisation are classified as alkaline lamprophyre, ultramafic lamprophyre, and carbonatite [58], and they are inferred to belong to the ~590 to 555 Ma intrusive event [36,57]. Thus, ~590–555 Ma is taken to provide an upper age limit for the syn-mineralisation brittle deformation.
The data were first quality-checked in the field by not recording any ambiguous kinematic indicators, and secondly during the analysis by ensuring that none of the angles between the fault planes and the kinematic indicators (misfit angle) exceeded a misfit angle of 25°. When using a misfit angle tolerance of 25°, none of our fault planes required omission from the dataset; moreover, this value is lower that the misfit angle used in some previous studies (e.g., >40° [52]).

3.2. Field Observations and Stress Inversion Results

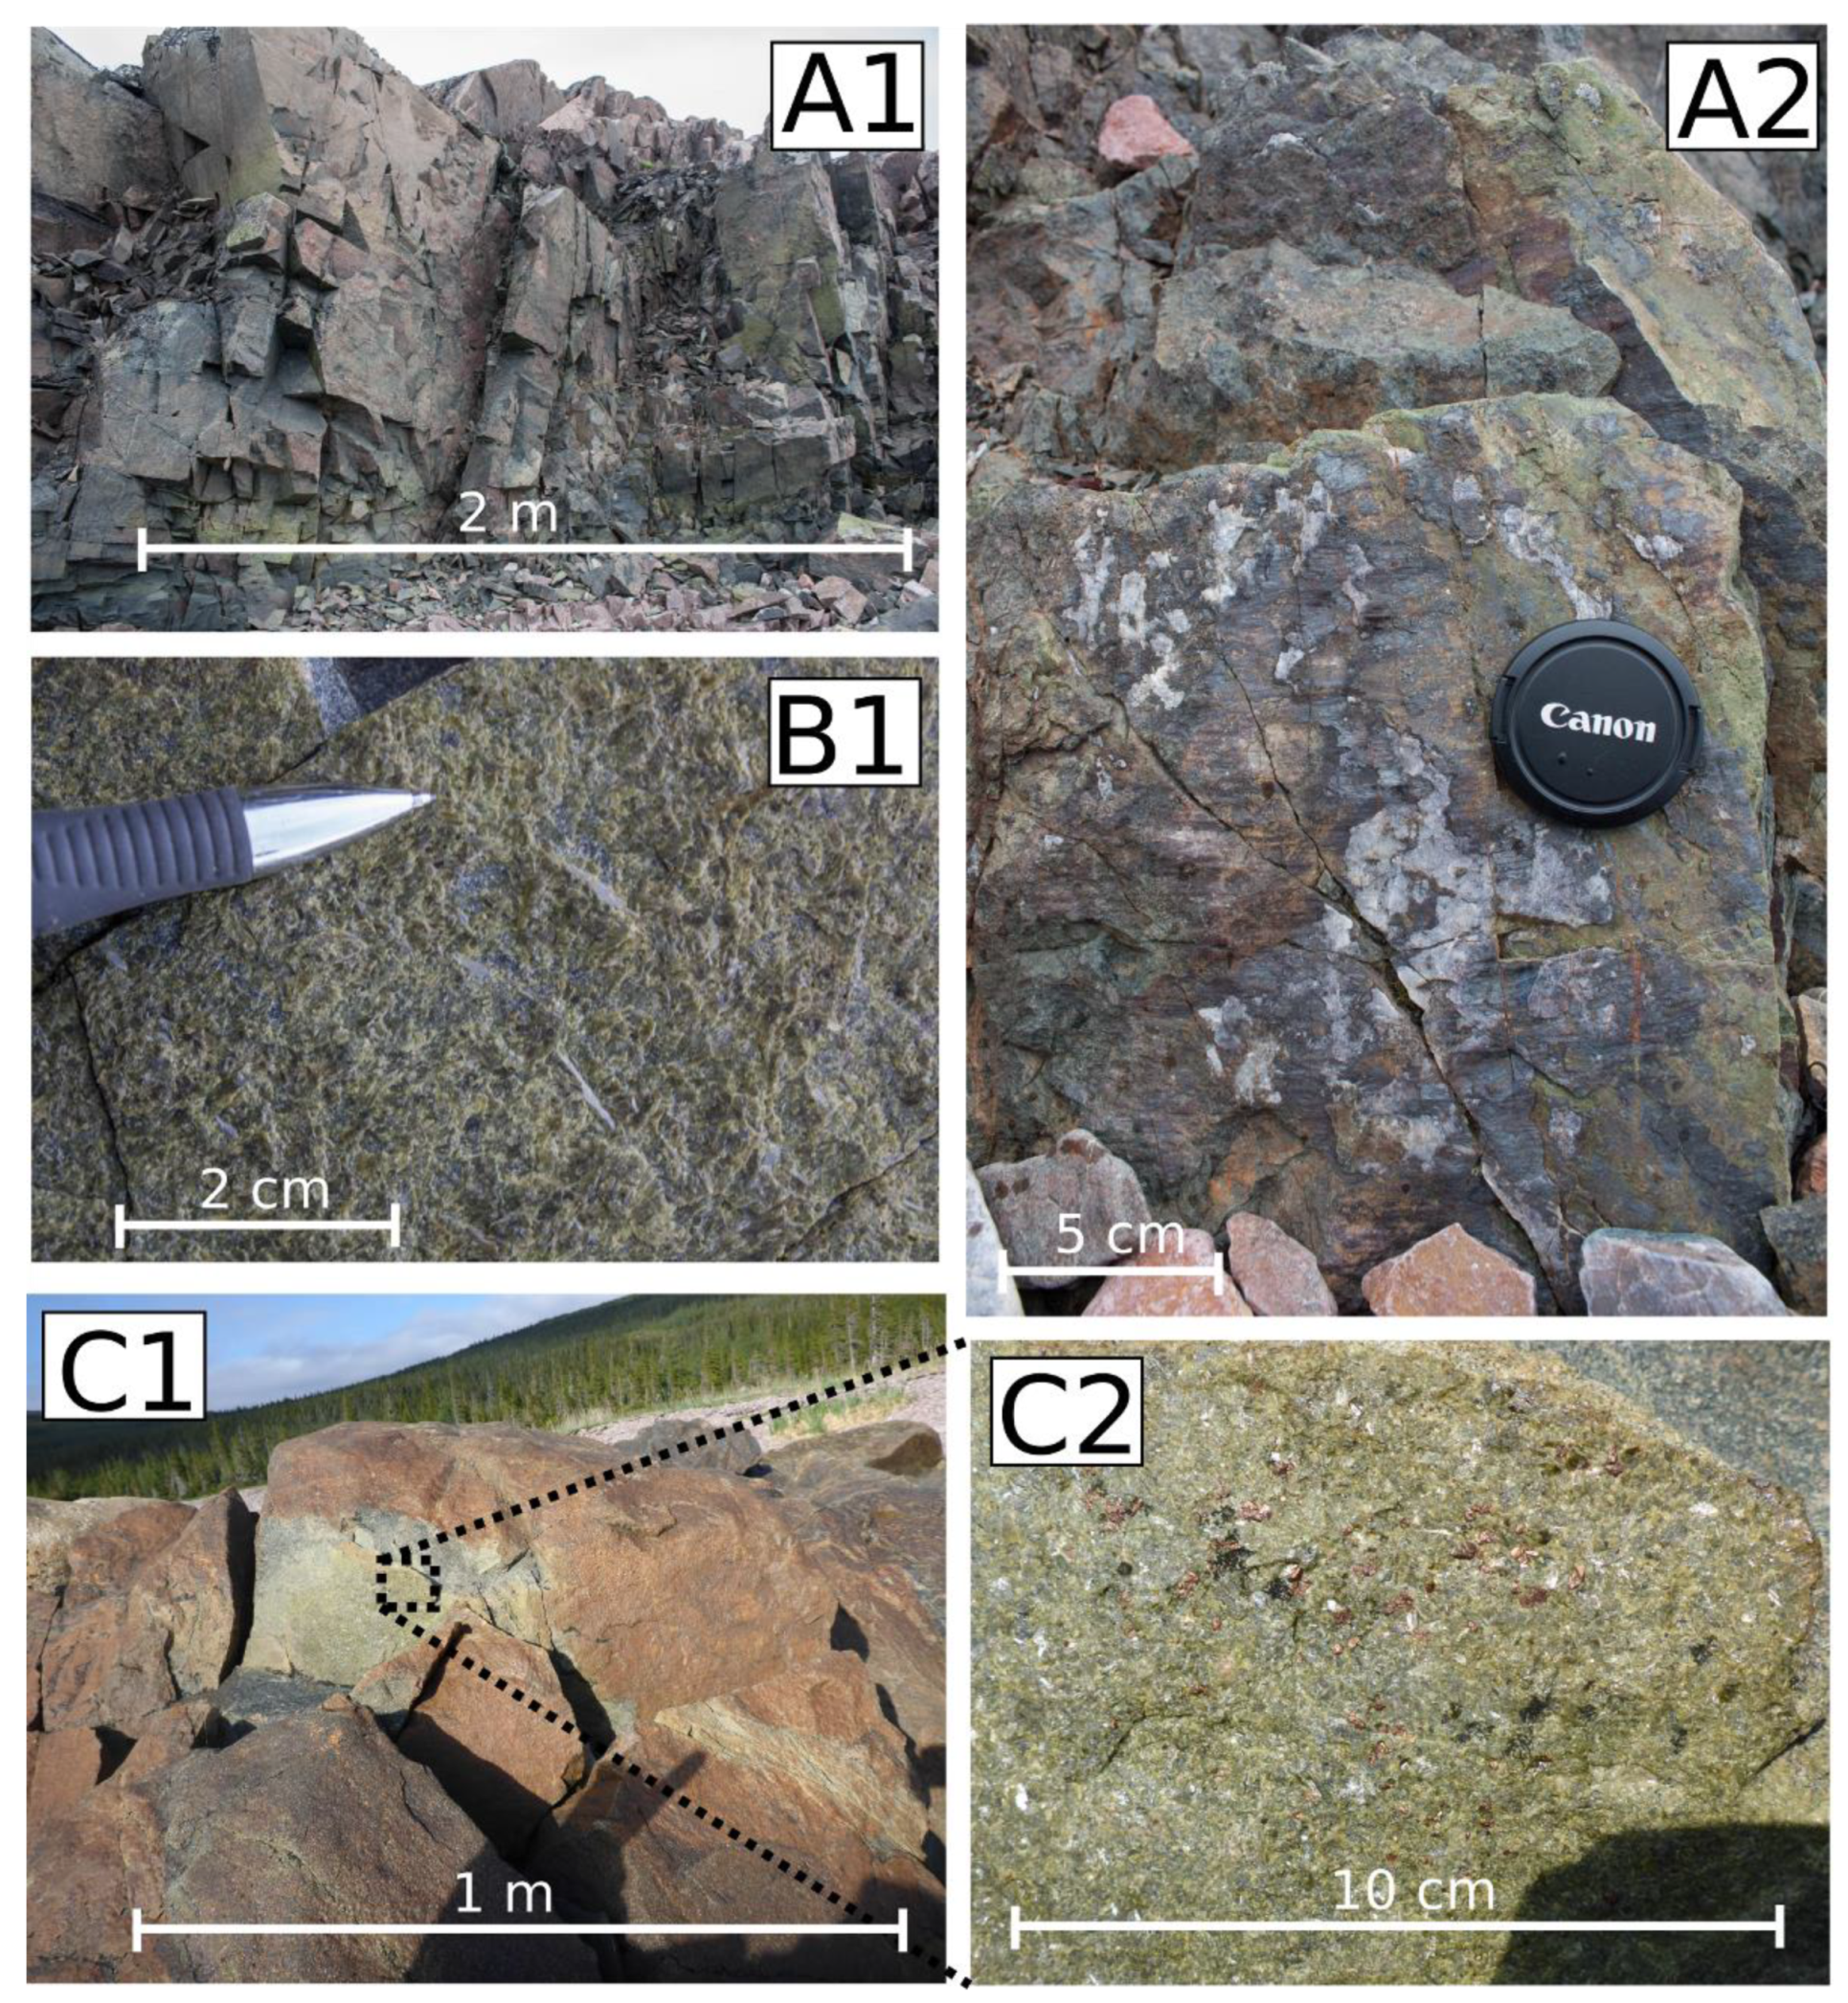
3.2.1. Basement Metamorphic Mineral Foliation

A metamorphic mineral foliation was readily observable in many units in the field (Figure 4). The orientation data obtained on the basement rocks in the study area show that the metamorphic fabric is consistently striking approximately N–S (dipping east or west) across the study area (Figure 5). The limited data collected suggest that the folding might be asymmetric with the eastern fold limbs being steeper. The fabric was observed to be predominantly planar, although at some localities this aspect of the basement fabric was indistinguishable and thus no measurements were recorded. Regional geological maps of the Aillik Domain also show many structures with an approximately N–S orientation, including lithological contacts and shear zones, as well as numerous folds with axial planes of this orientation [41].

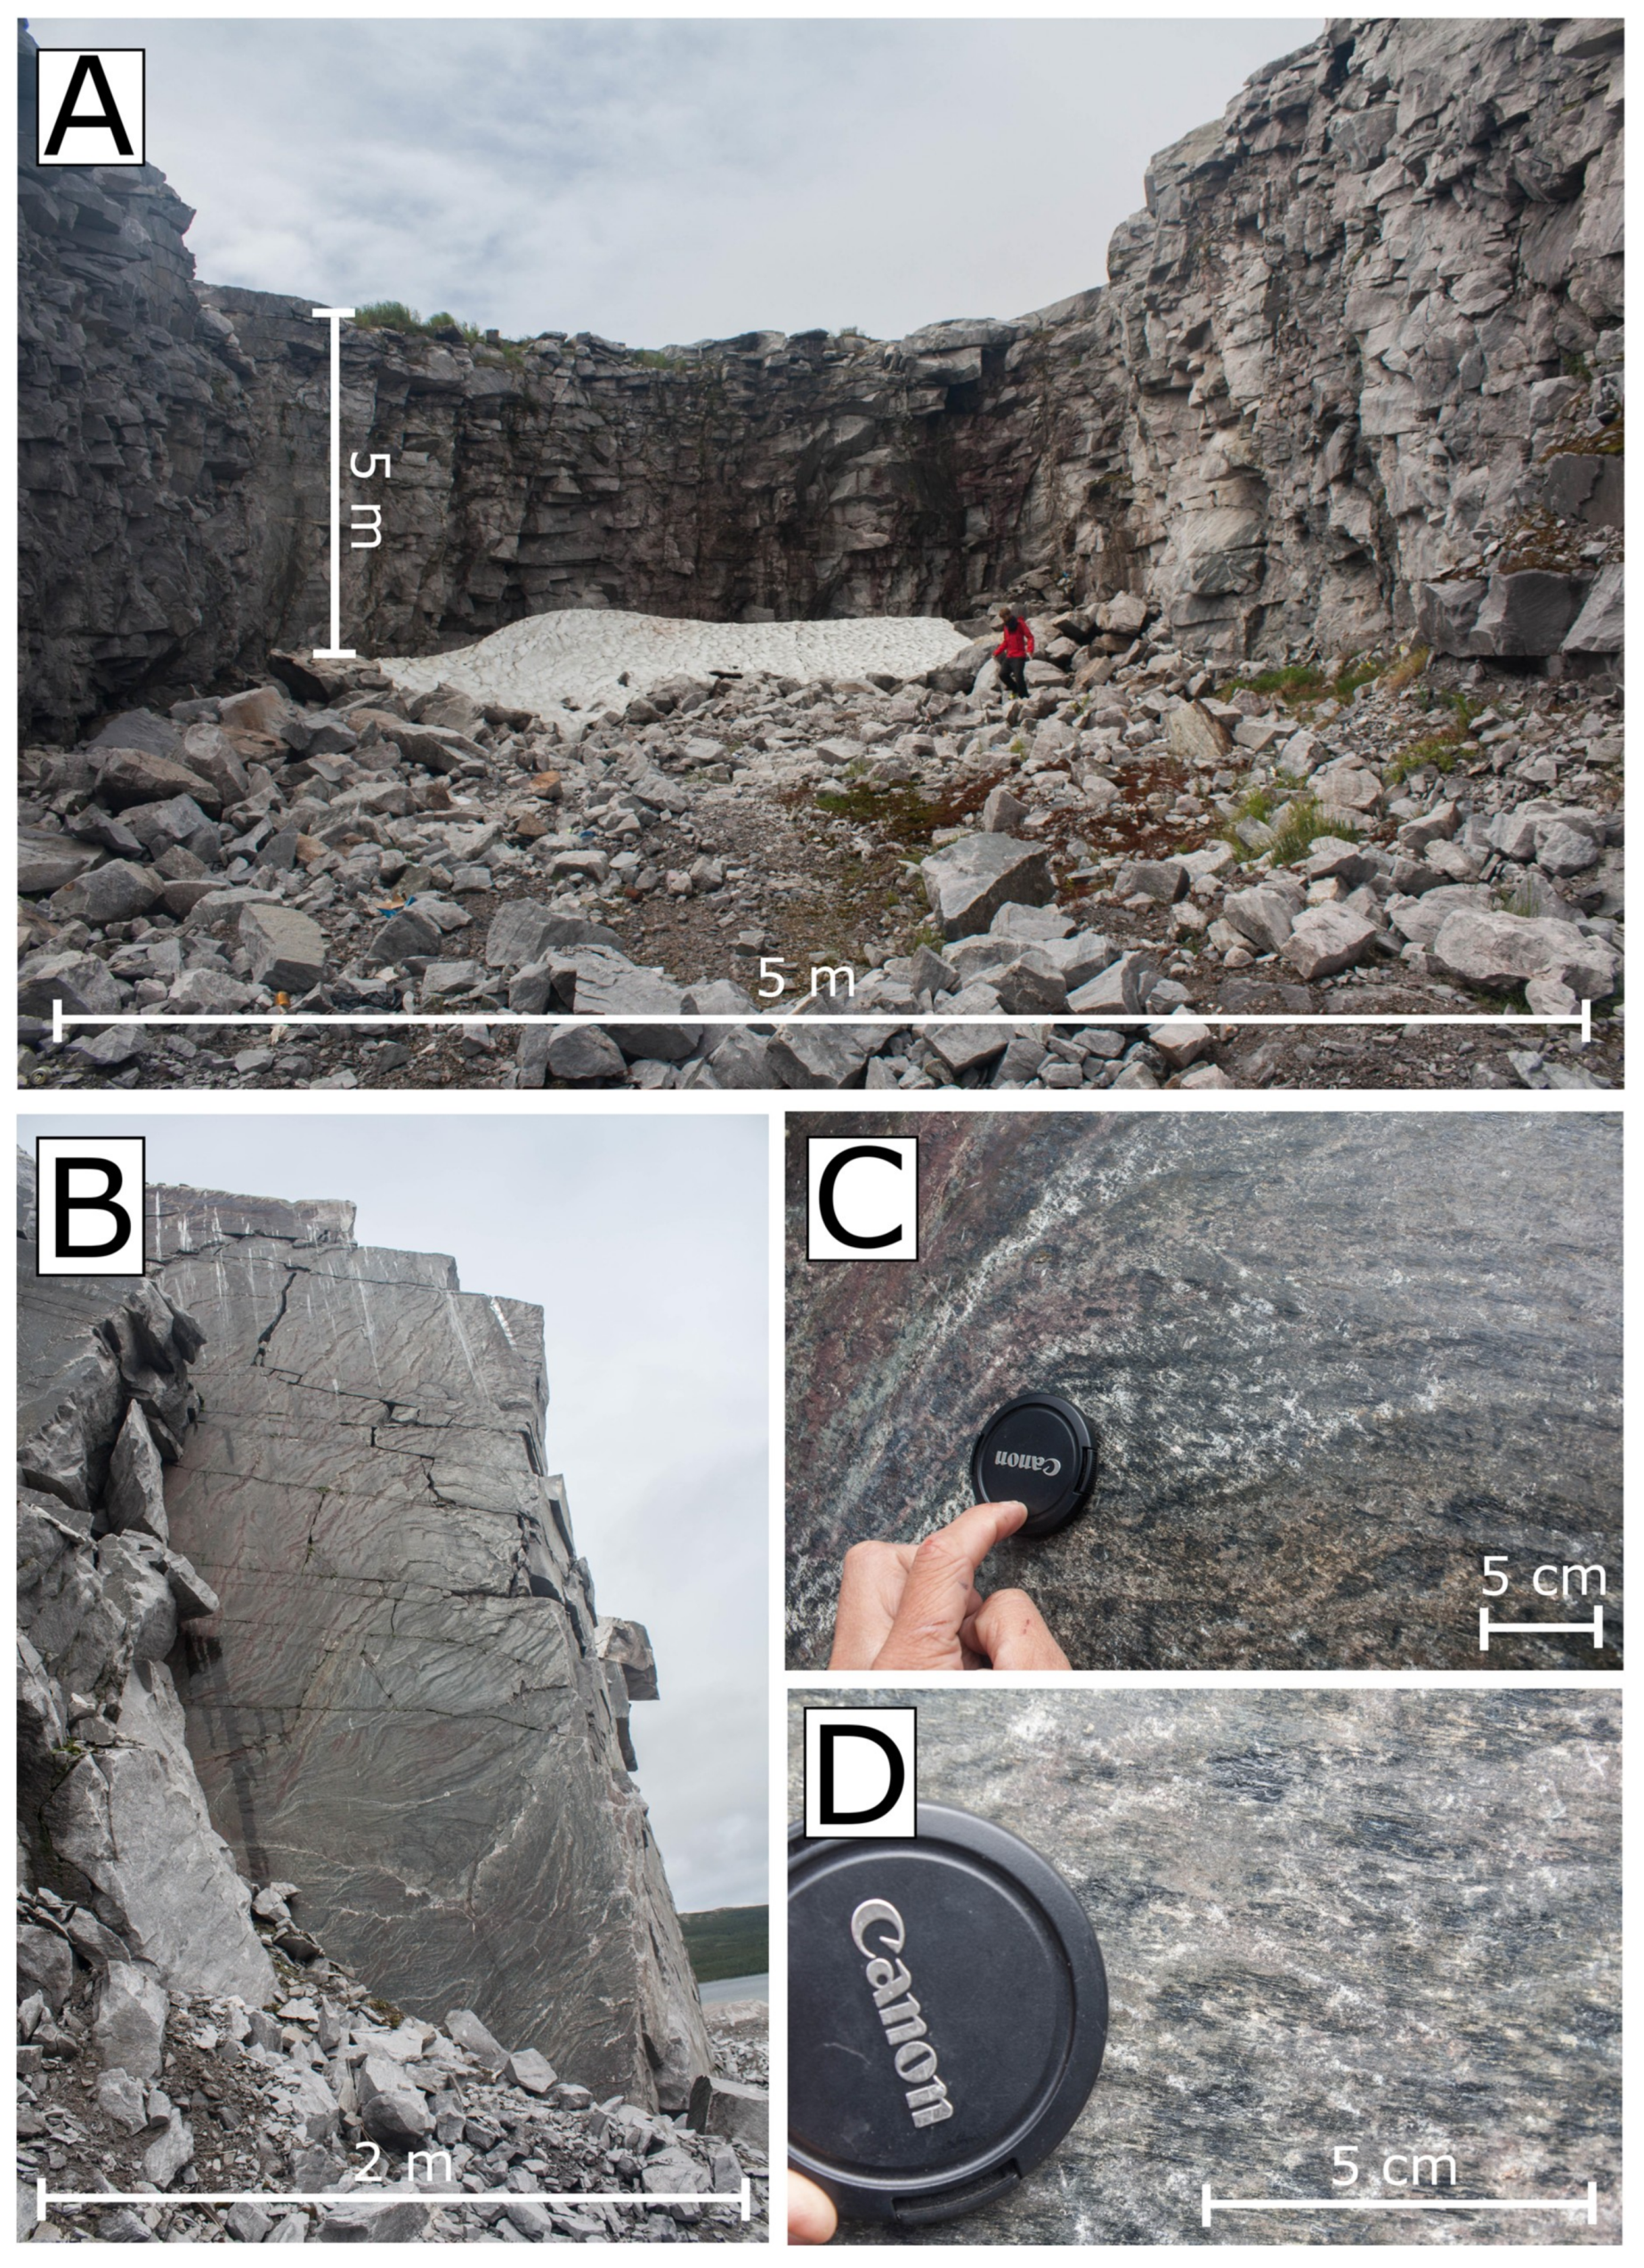
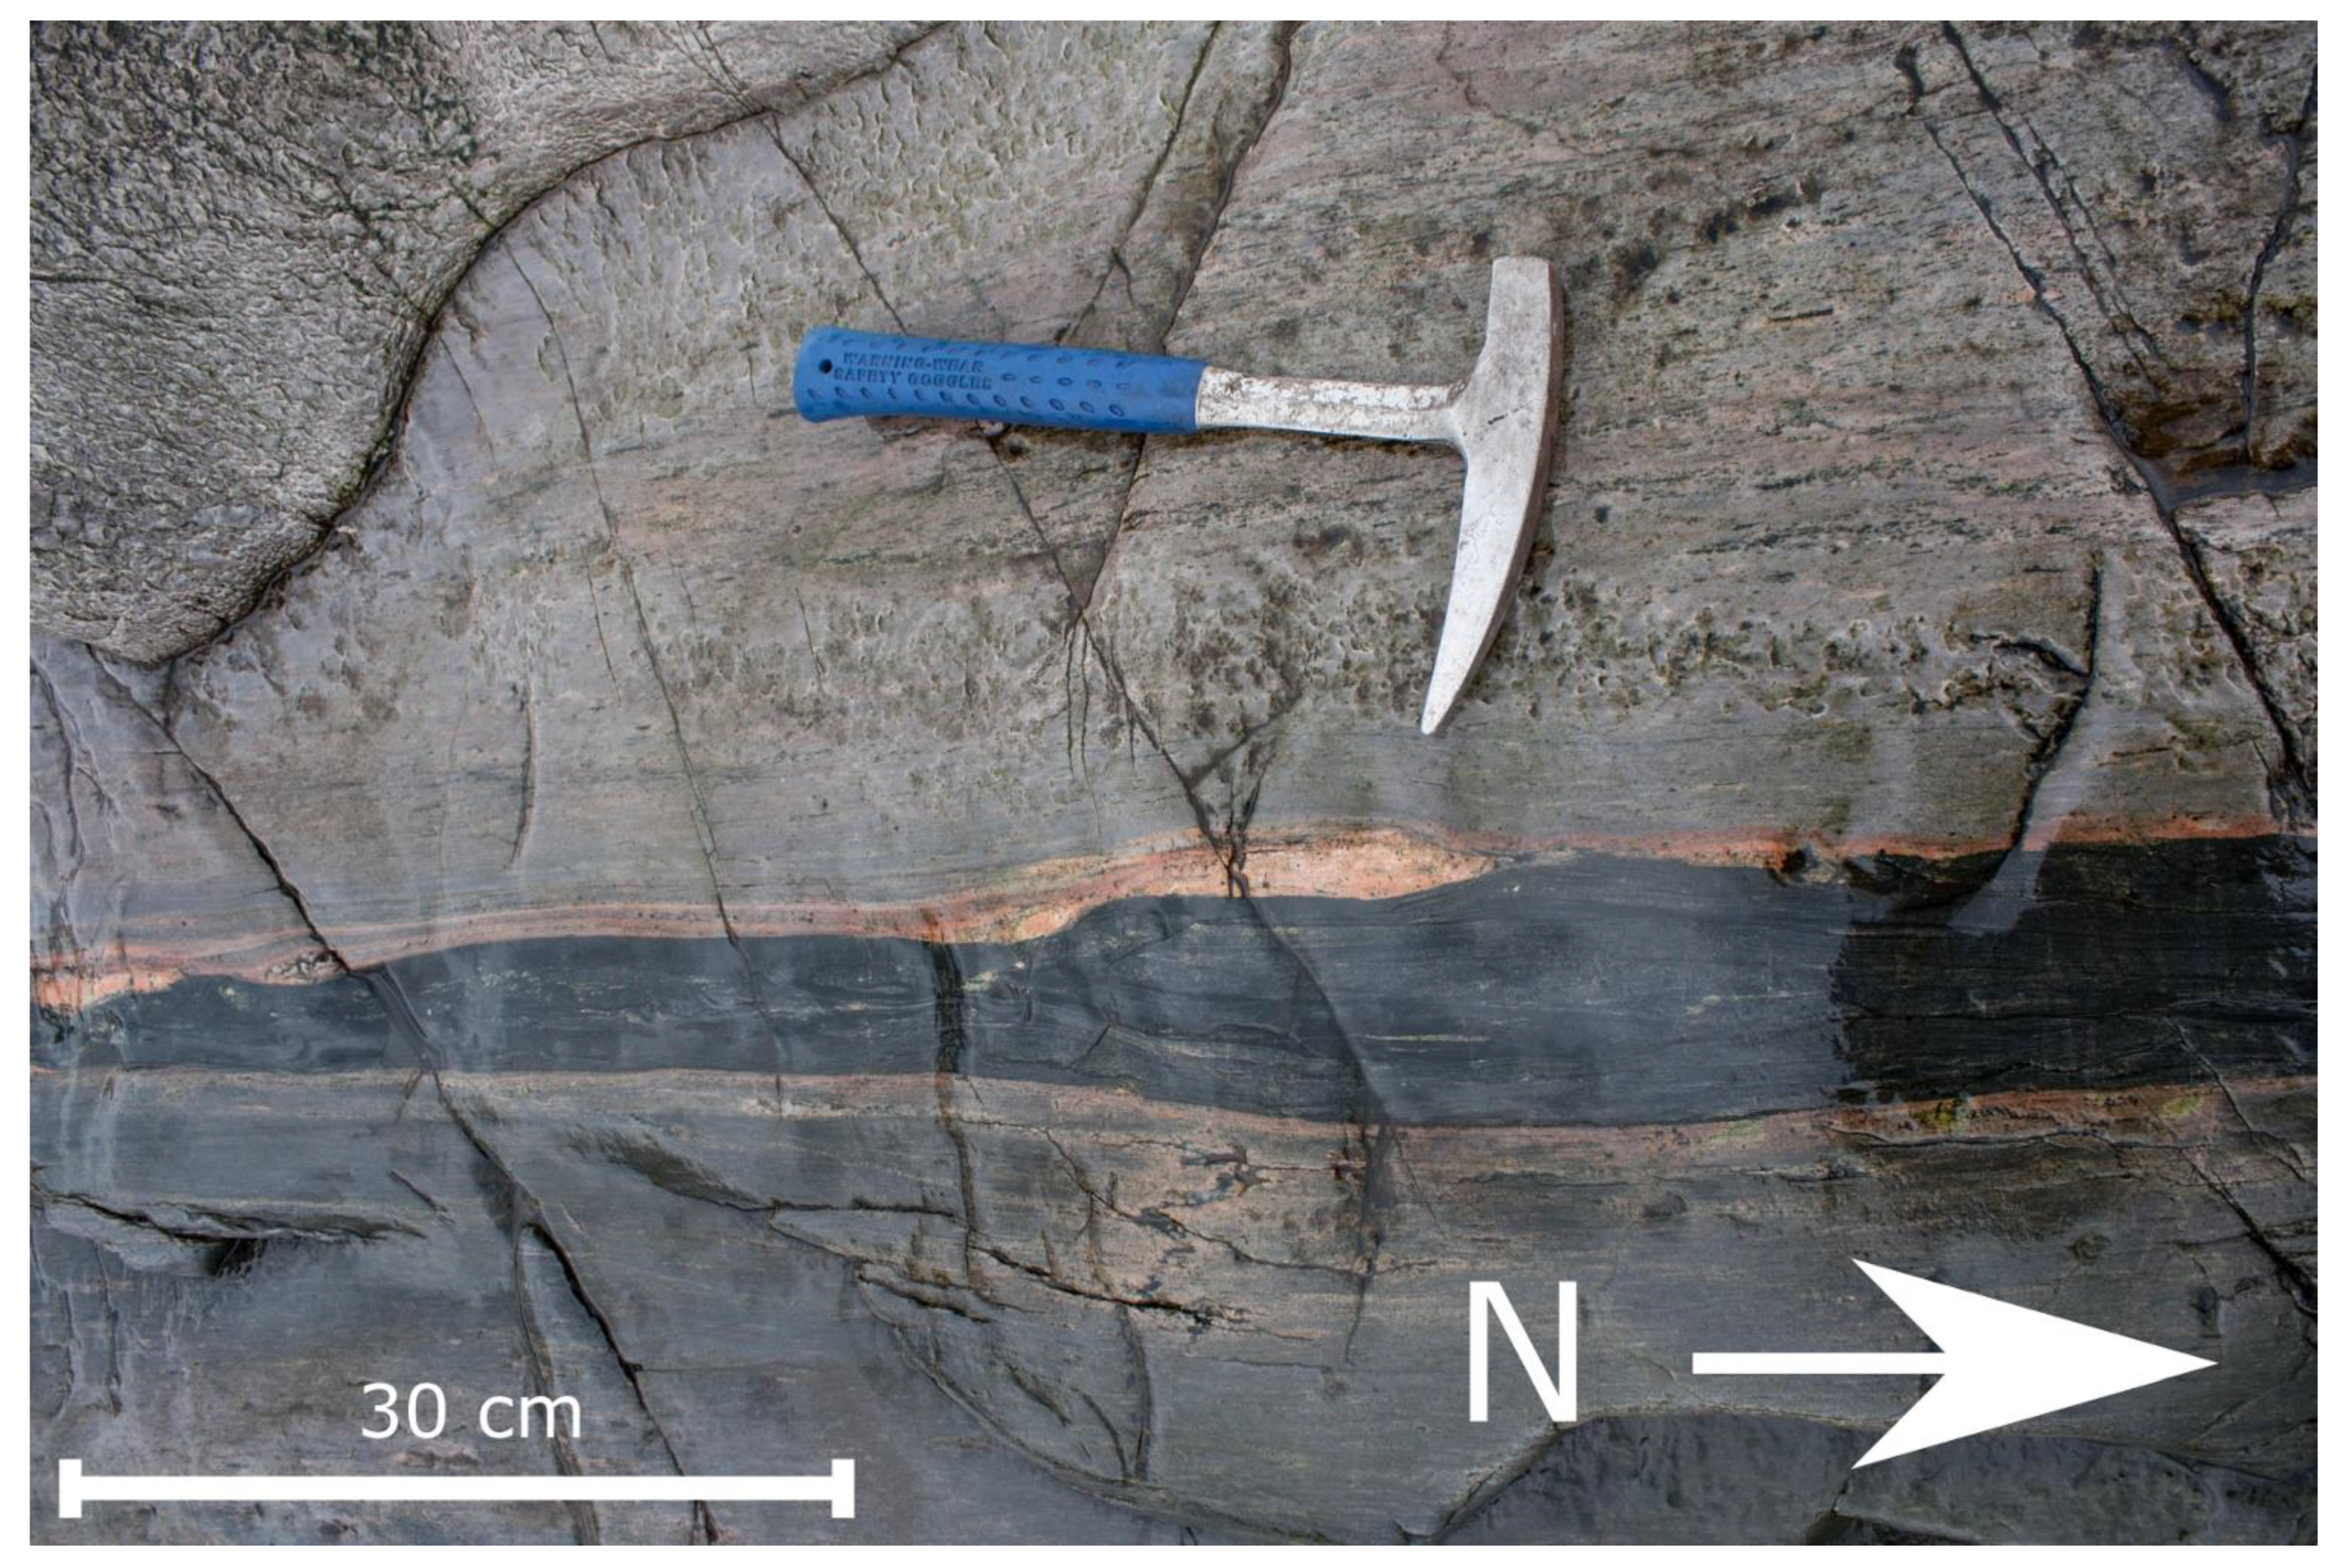
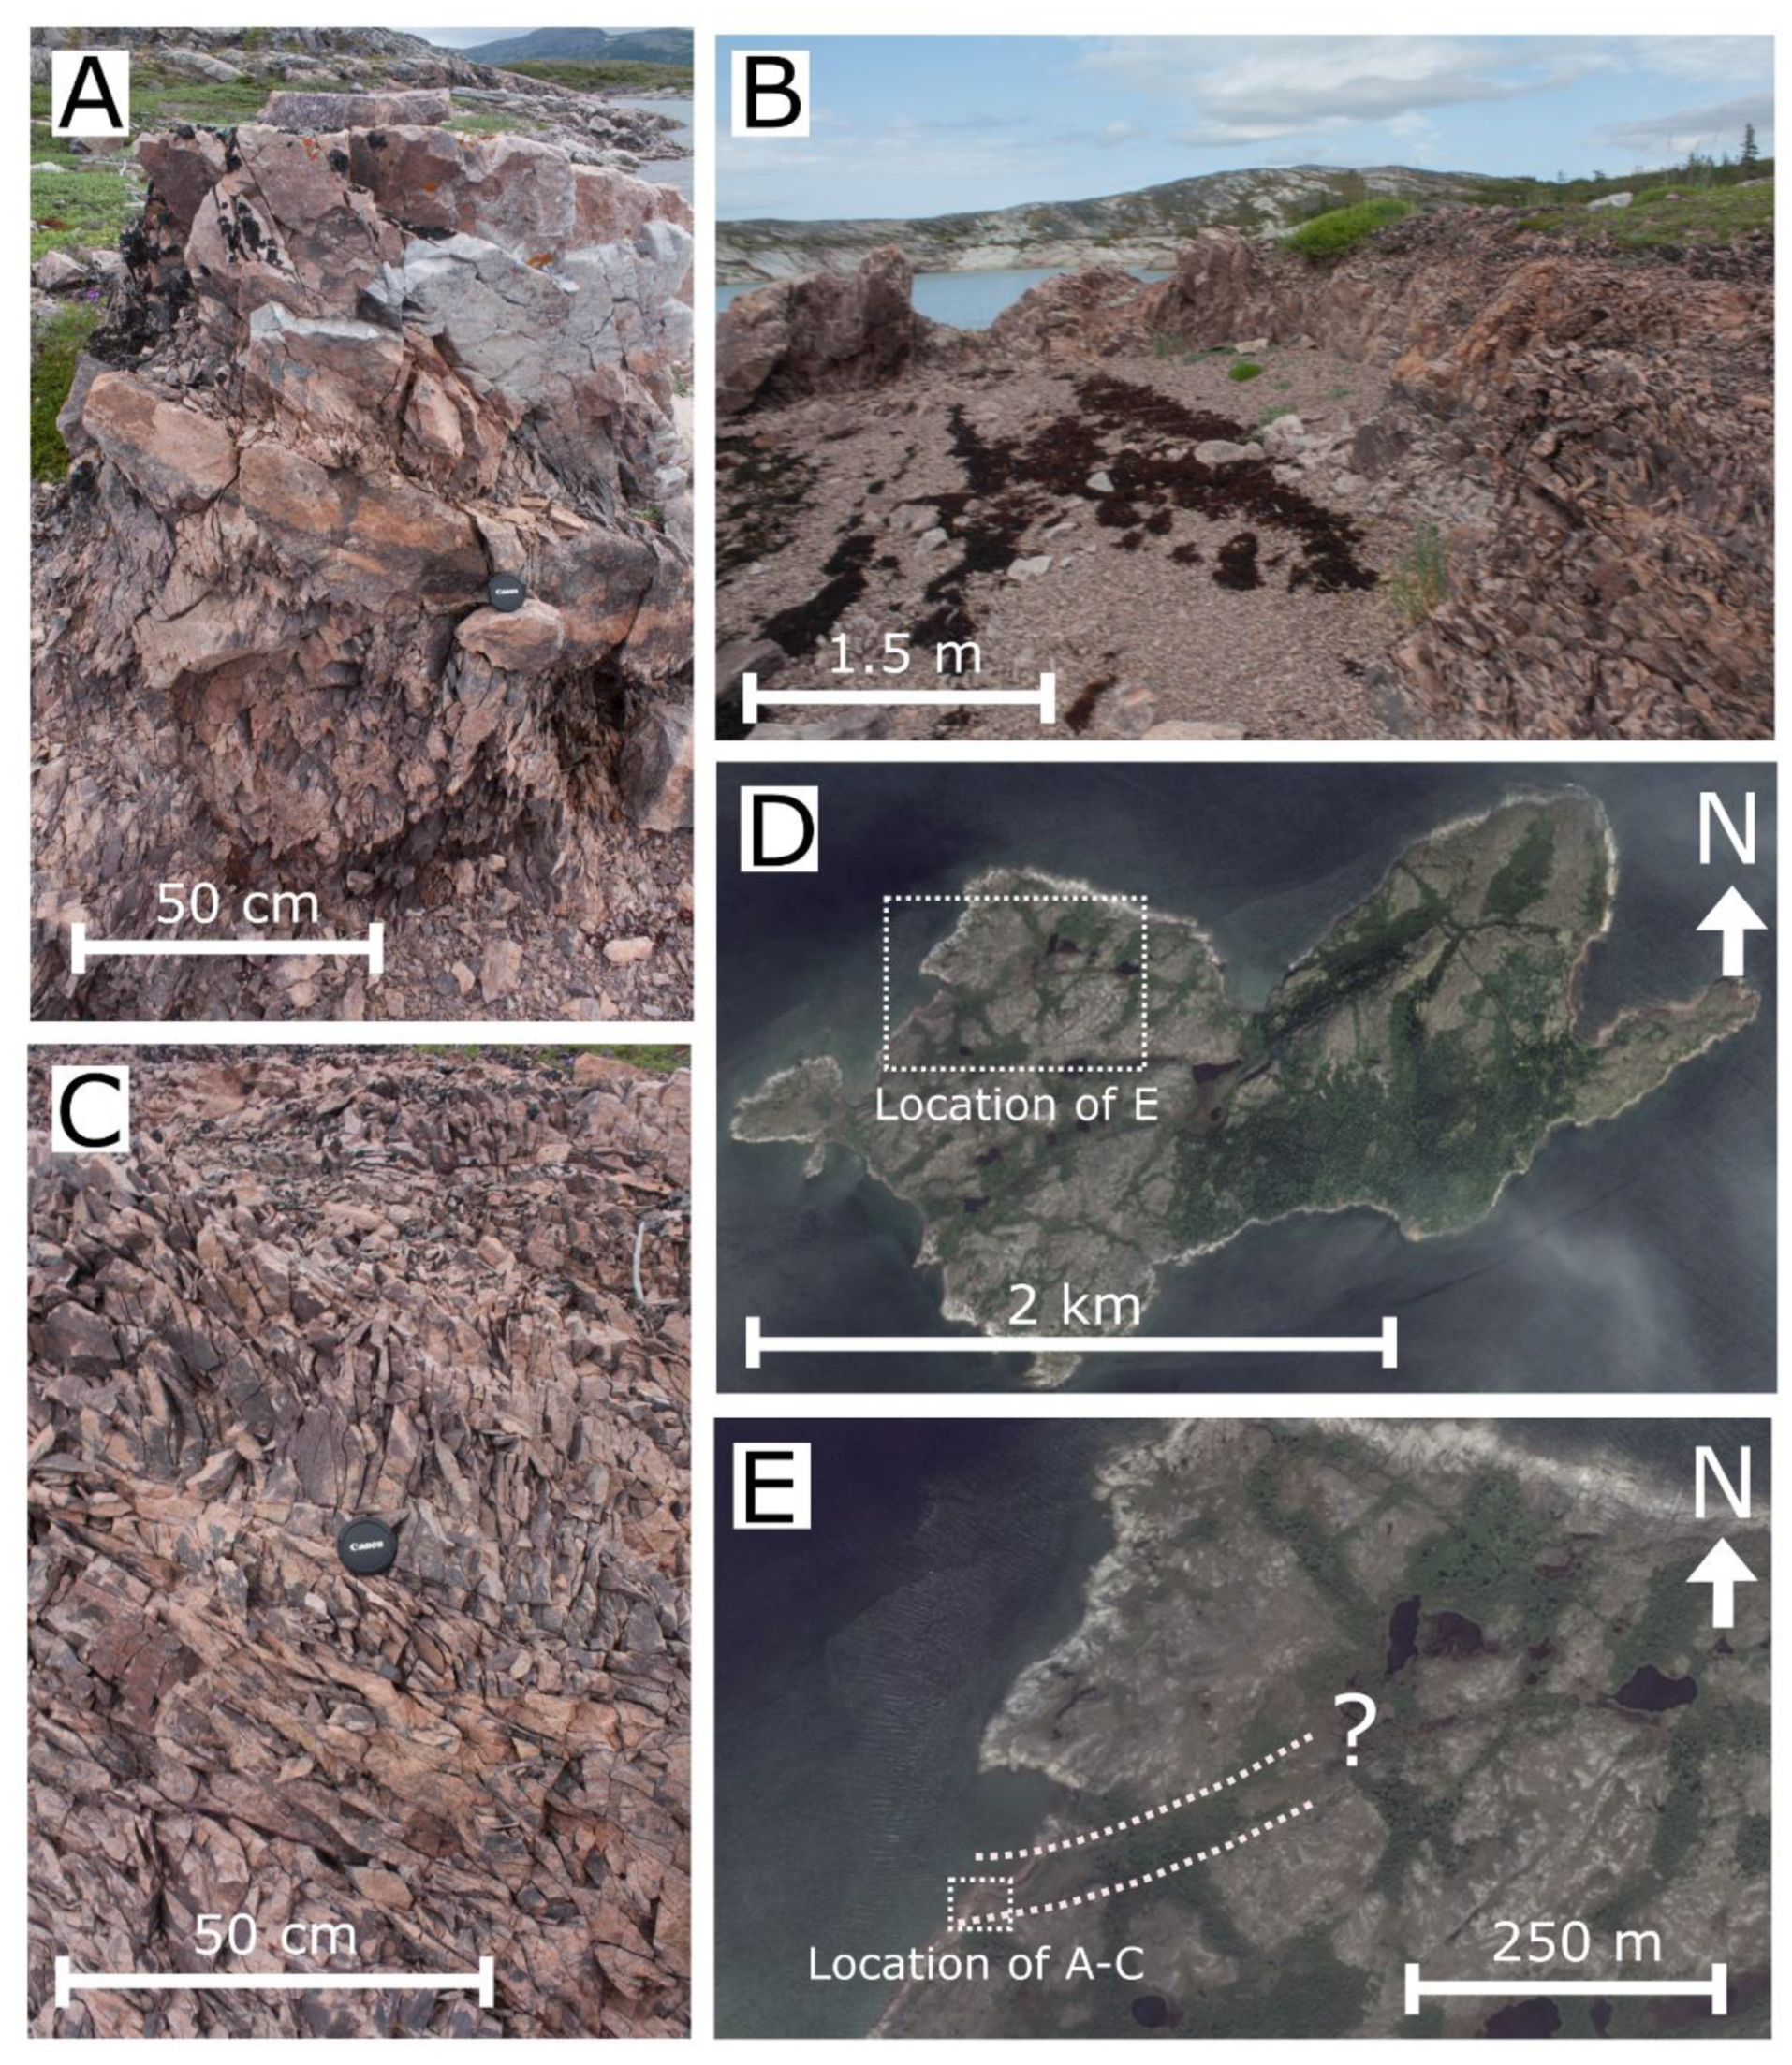
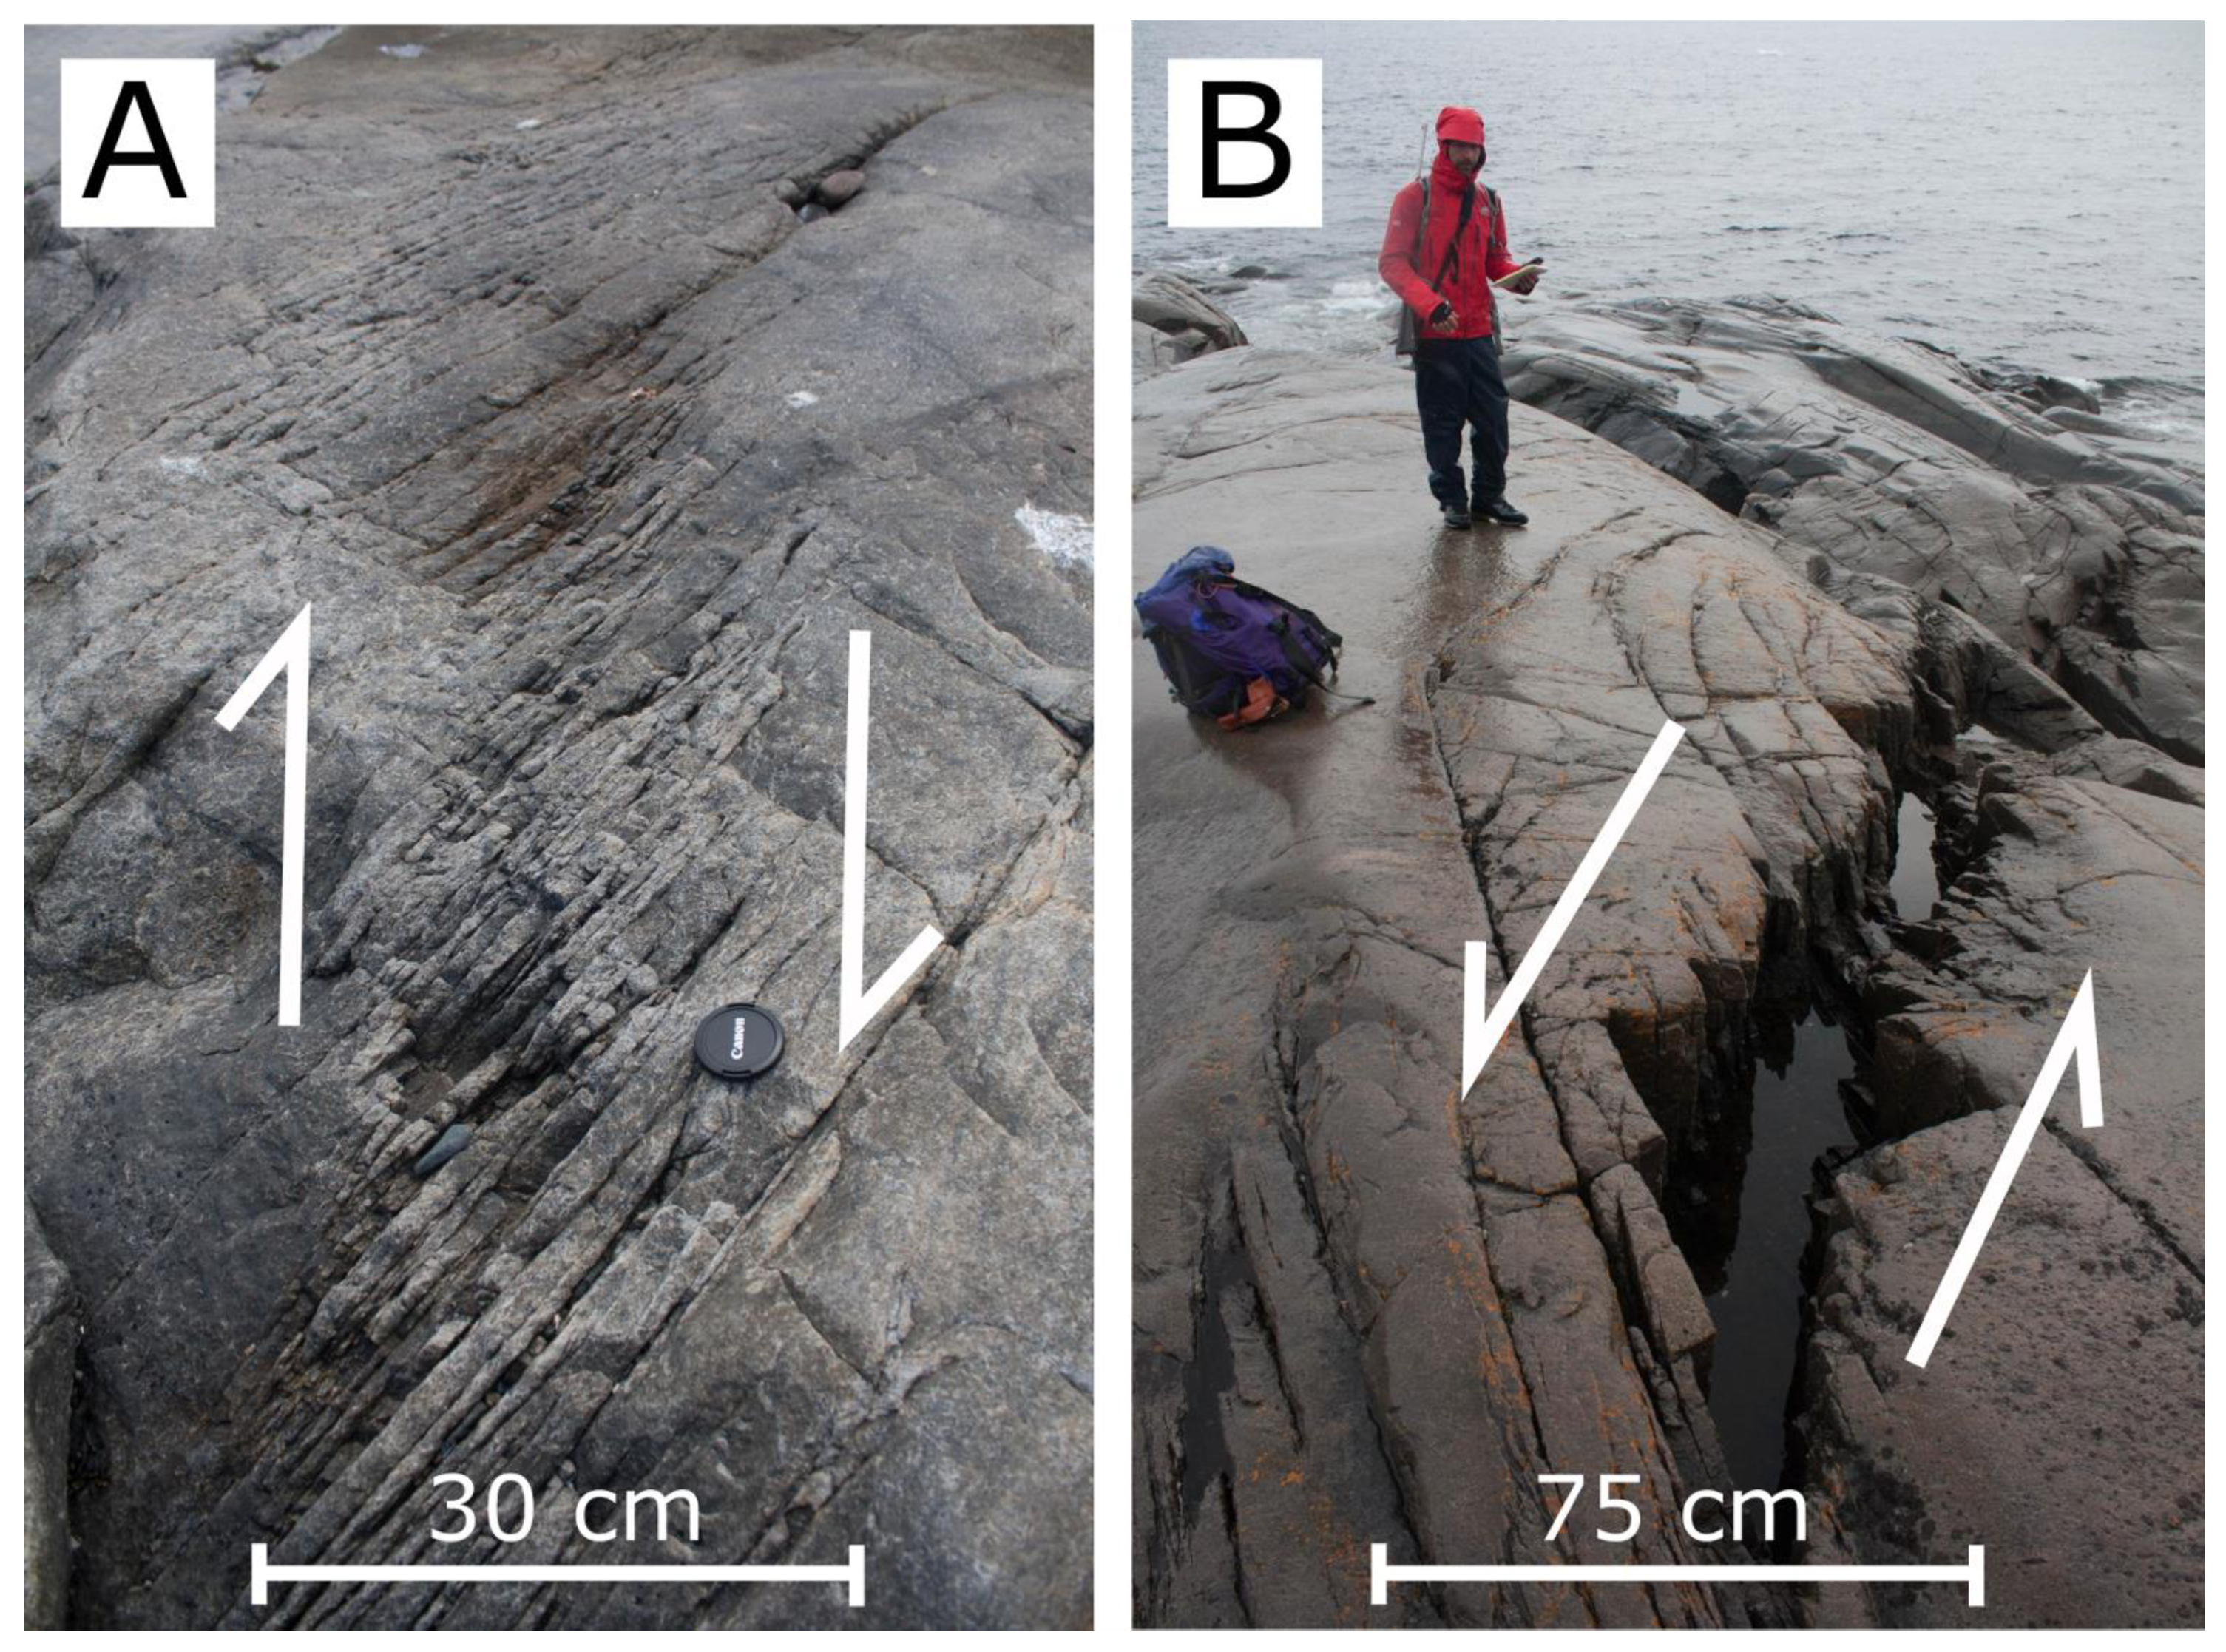
3.2.2. Brittle Deformation

Evidence for brittle deformation was observed across the study area in all lithological units encountered. Fractures were observed ranging in size from a few centimeters to damage zones that are several hundred meters wide (Figure 6). Establishing relative chronologies for the brittle deformation events was challenging due to a lack of distinguishing characteristics and the manifestation of fracture systems varying between lithologies. Also, remarkably few crosscutting relationships enabled observations to be correlated between localities.
Observations of brittle deformation of particular note include: (1) large (>10 m) deformation zones, e.g., the north coast of Big Island (Figure 6); (2) widespread fracture zones in the basement possibly indicating shear deformation (Figure 7 and Figure 8); and (3) those associated with kinematic indicators that were measured are modeled herein (Figure 9 and Figure 10).
Wide zones (>10 m) of intense brittle deformation were observed at several locations, including Big Island (Figure 6), Makkovik Peninsula, Cape Strawberry, and north of Ikey’s Point (Figure 3). The large deformation zone on the north coast of Big Island comprises a 100-m wide coastal exposure of mineralised fault breccia of the felsic basement rocks, with a possible continuation inland before a lack of exposure prohibited further observations (Figure 6). Within the mineralised breccia, some proto-cataclasite regions were observed as bands typically from 10 to 30 cm wide but in some cases up to 1 m, which were classified using the system of [60]. A relative age and the possible relationship between the different wide zones of deformation and the other structures described could not be established.

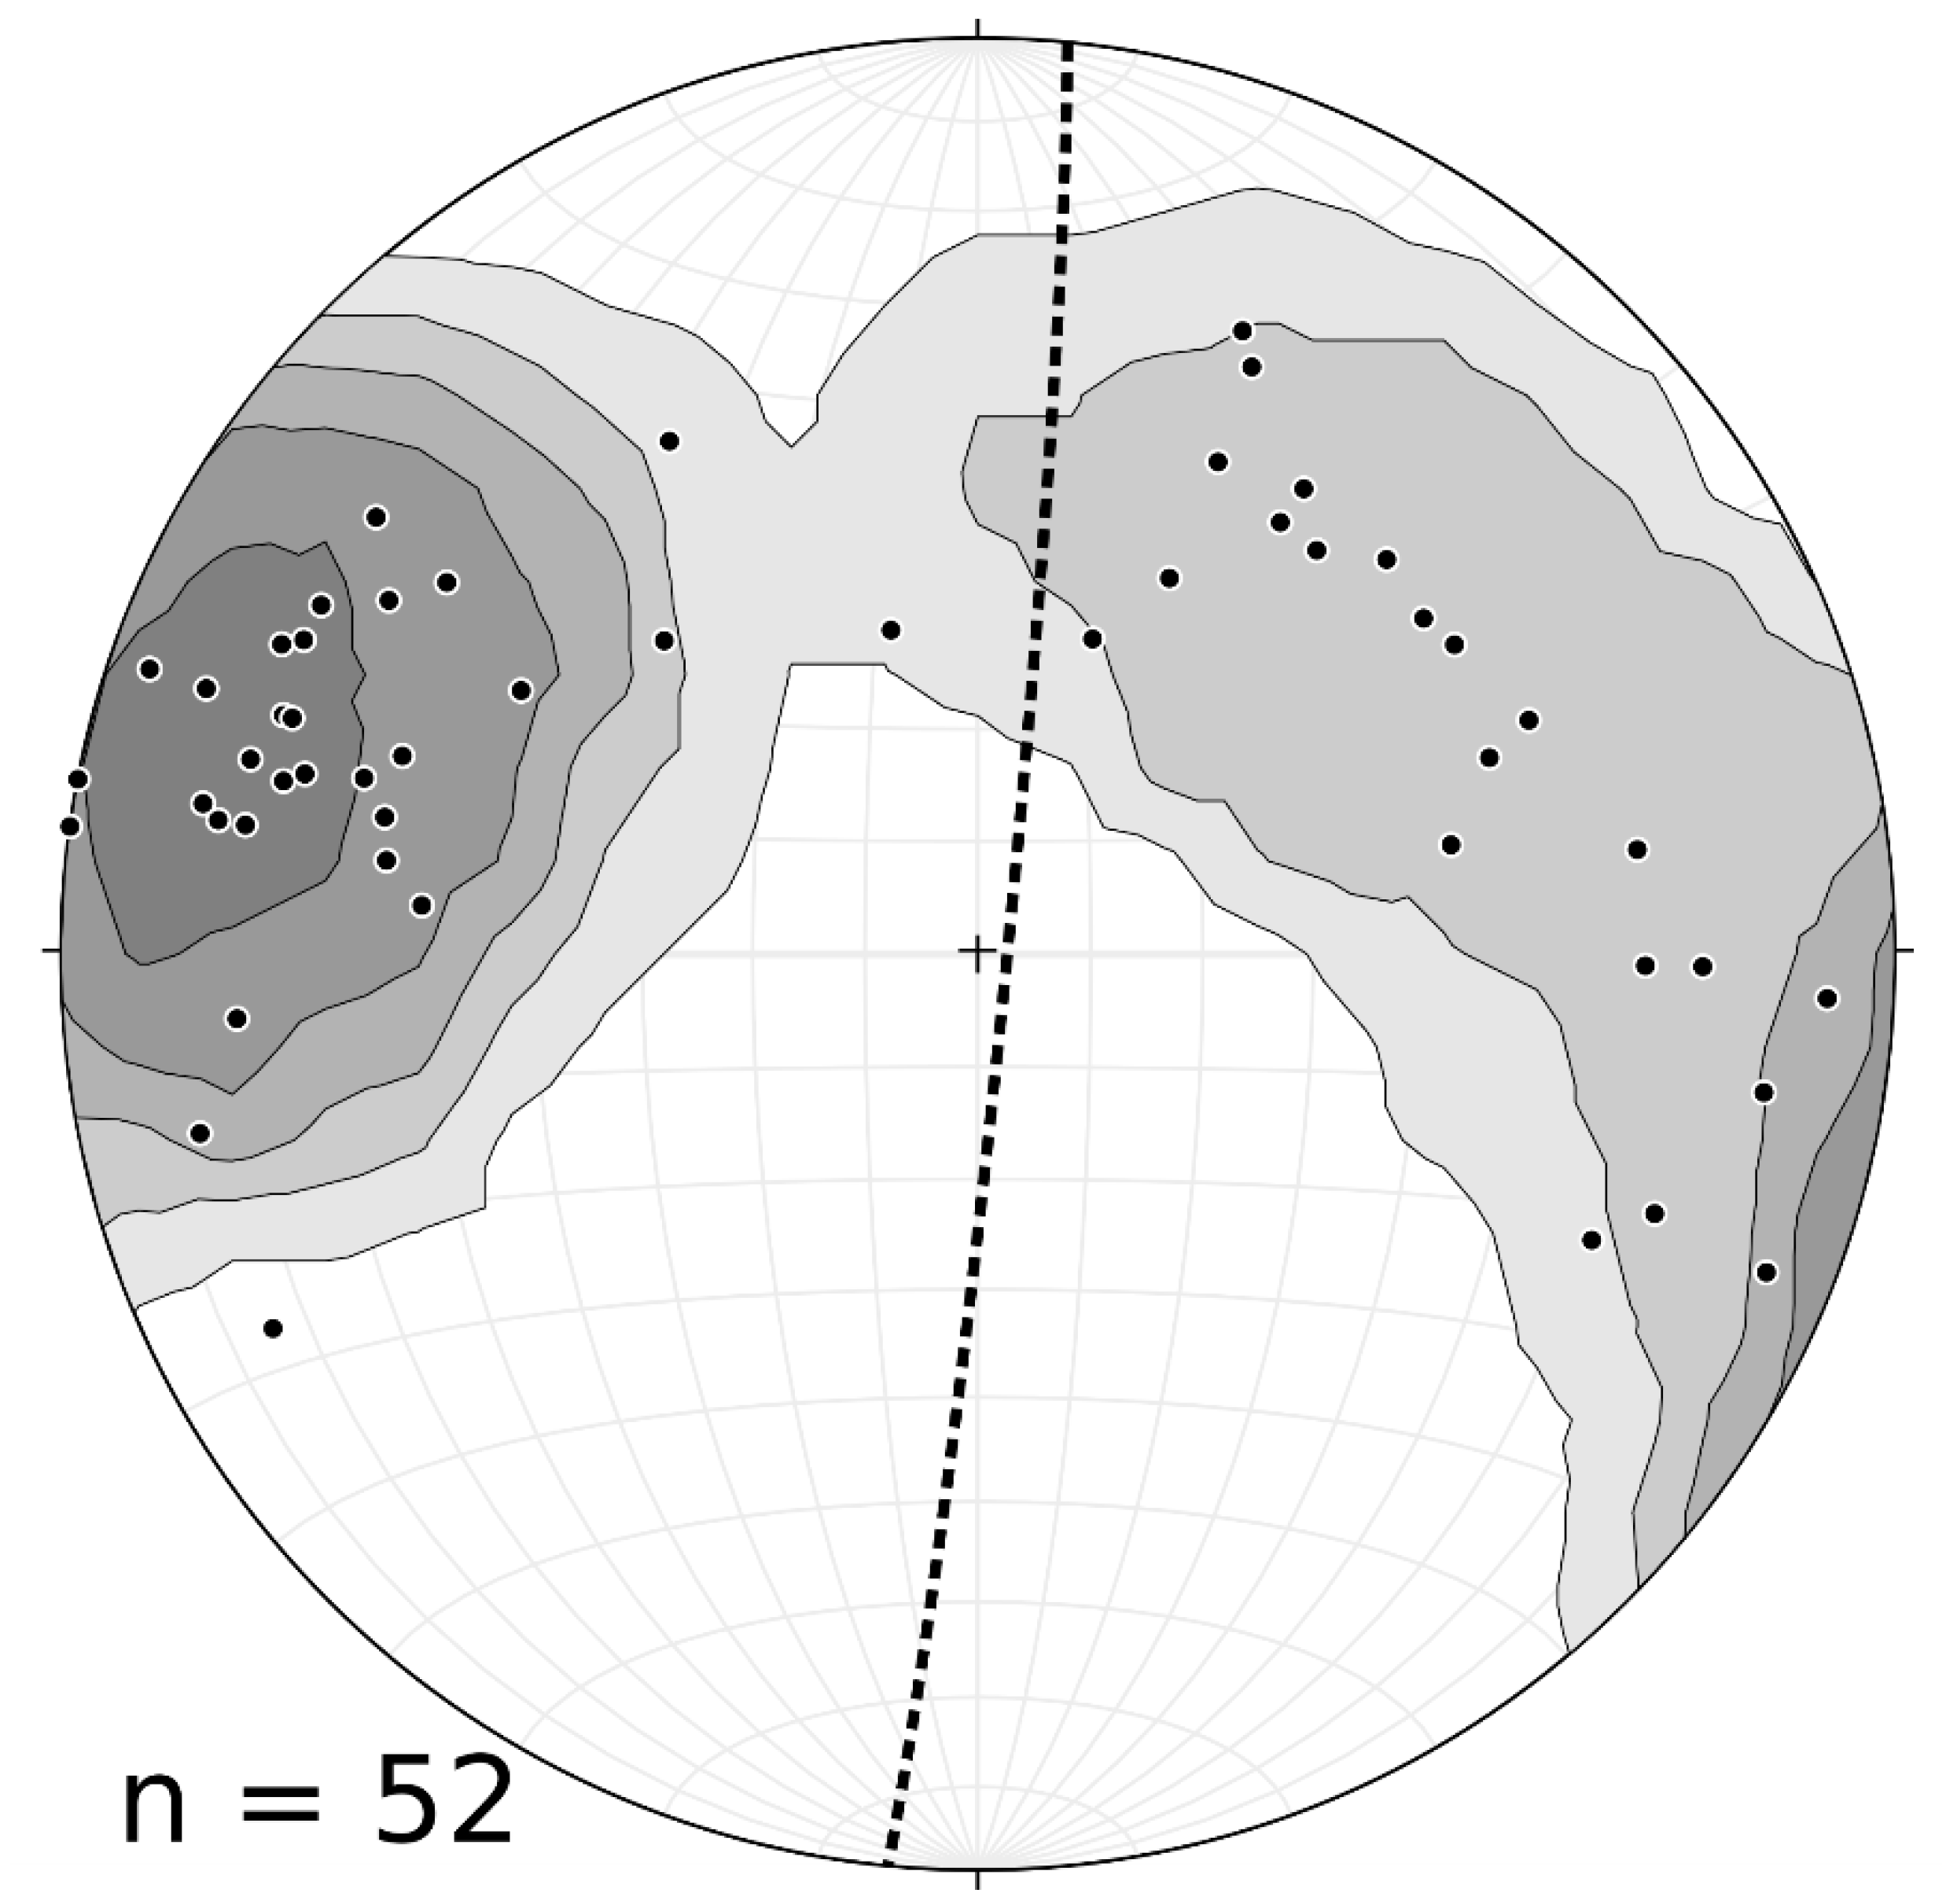
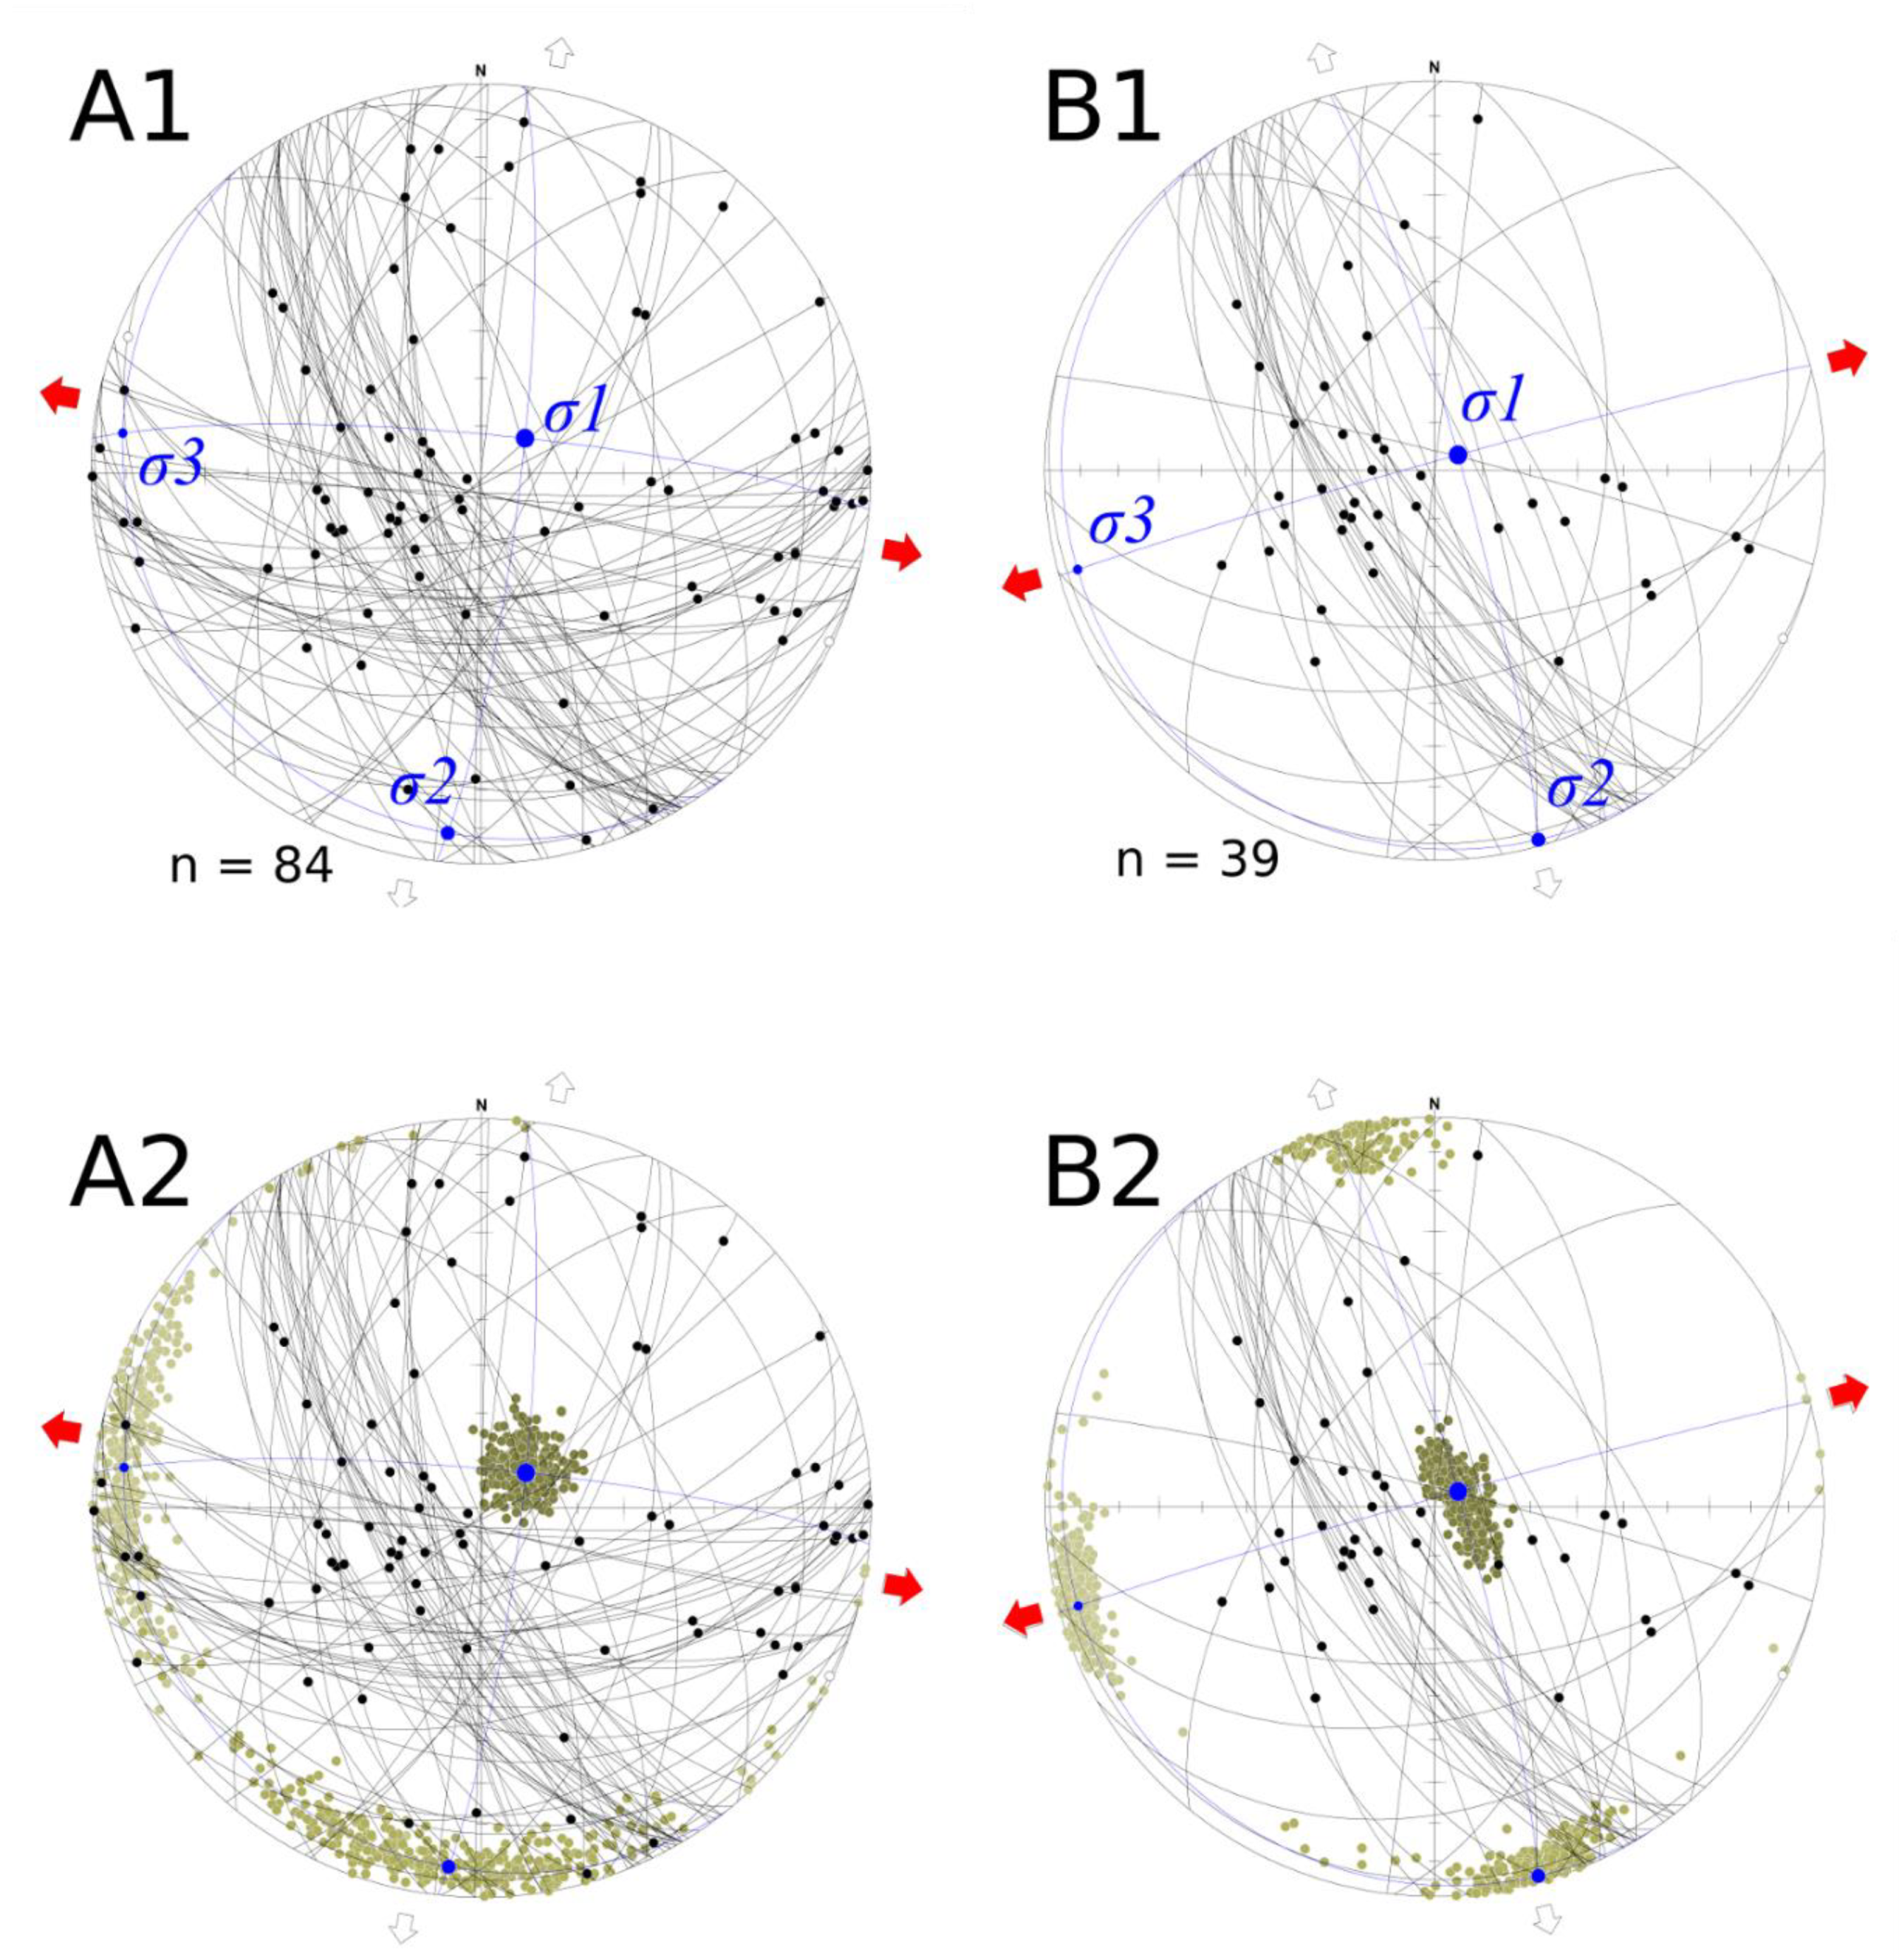
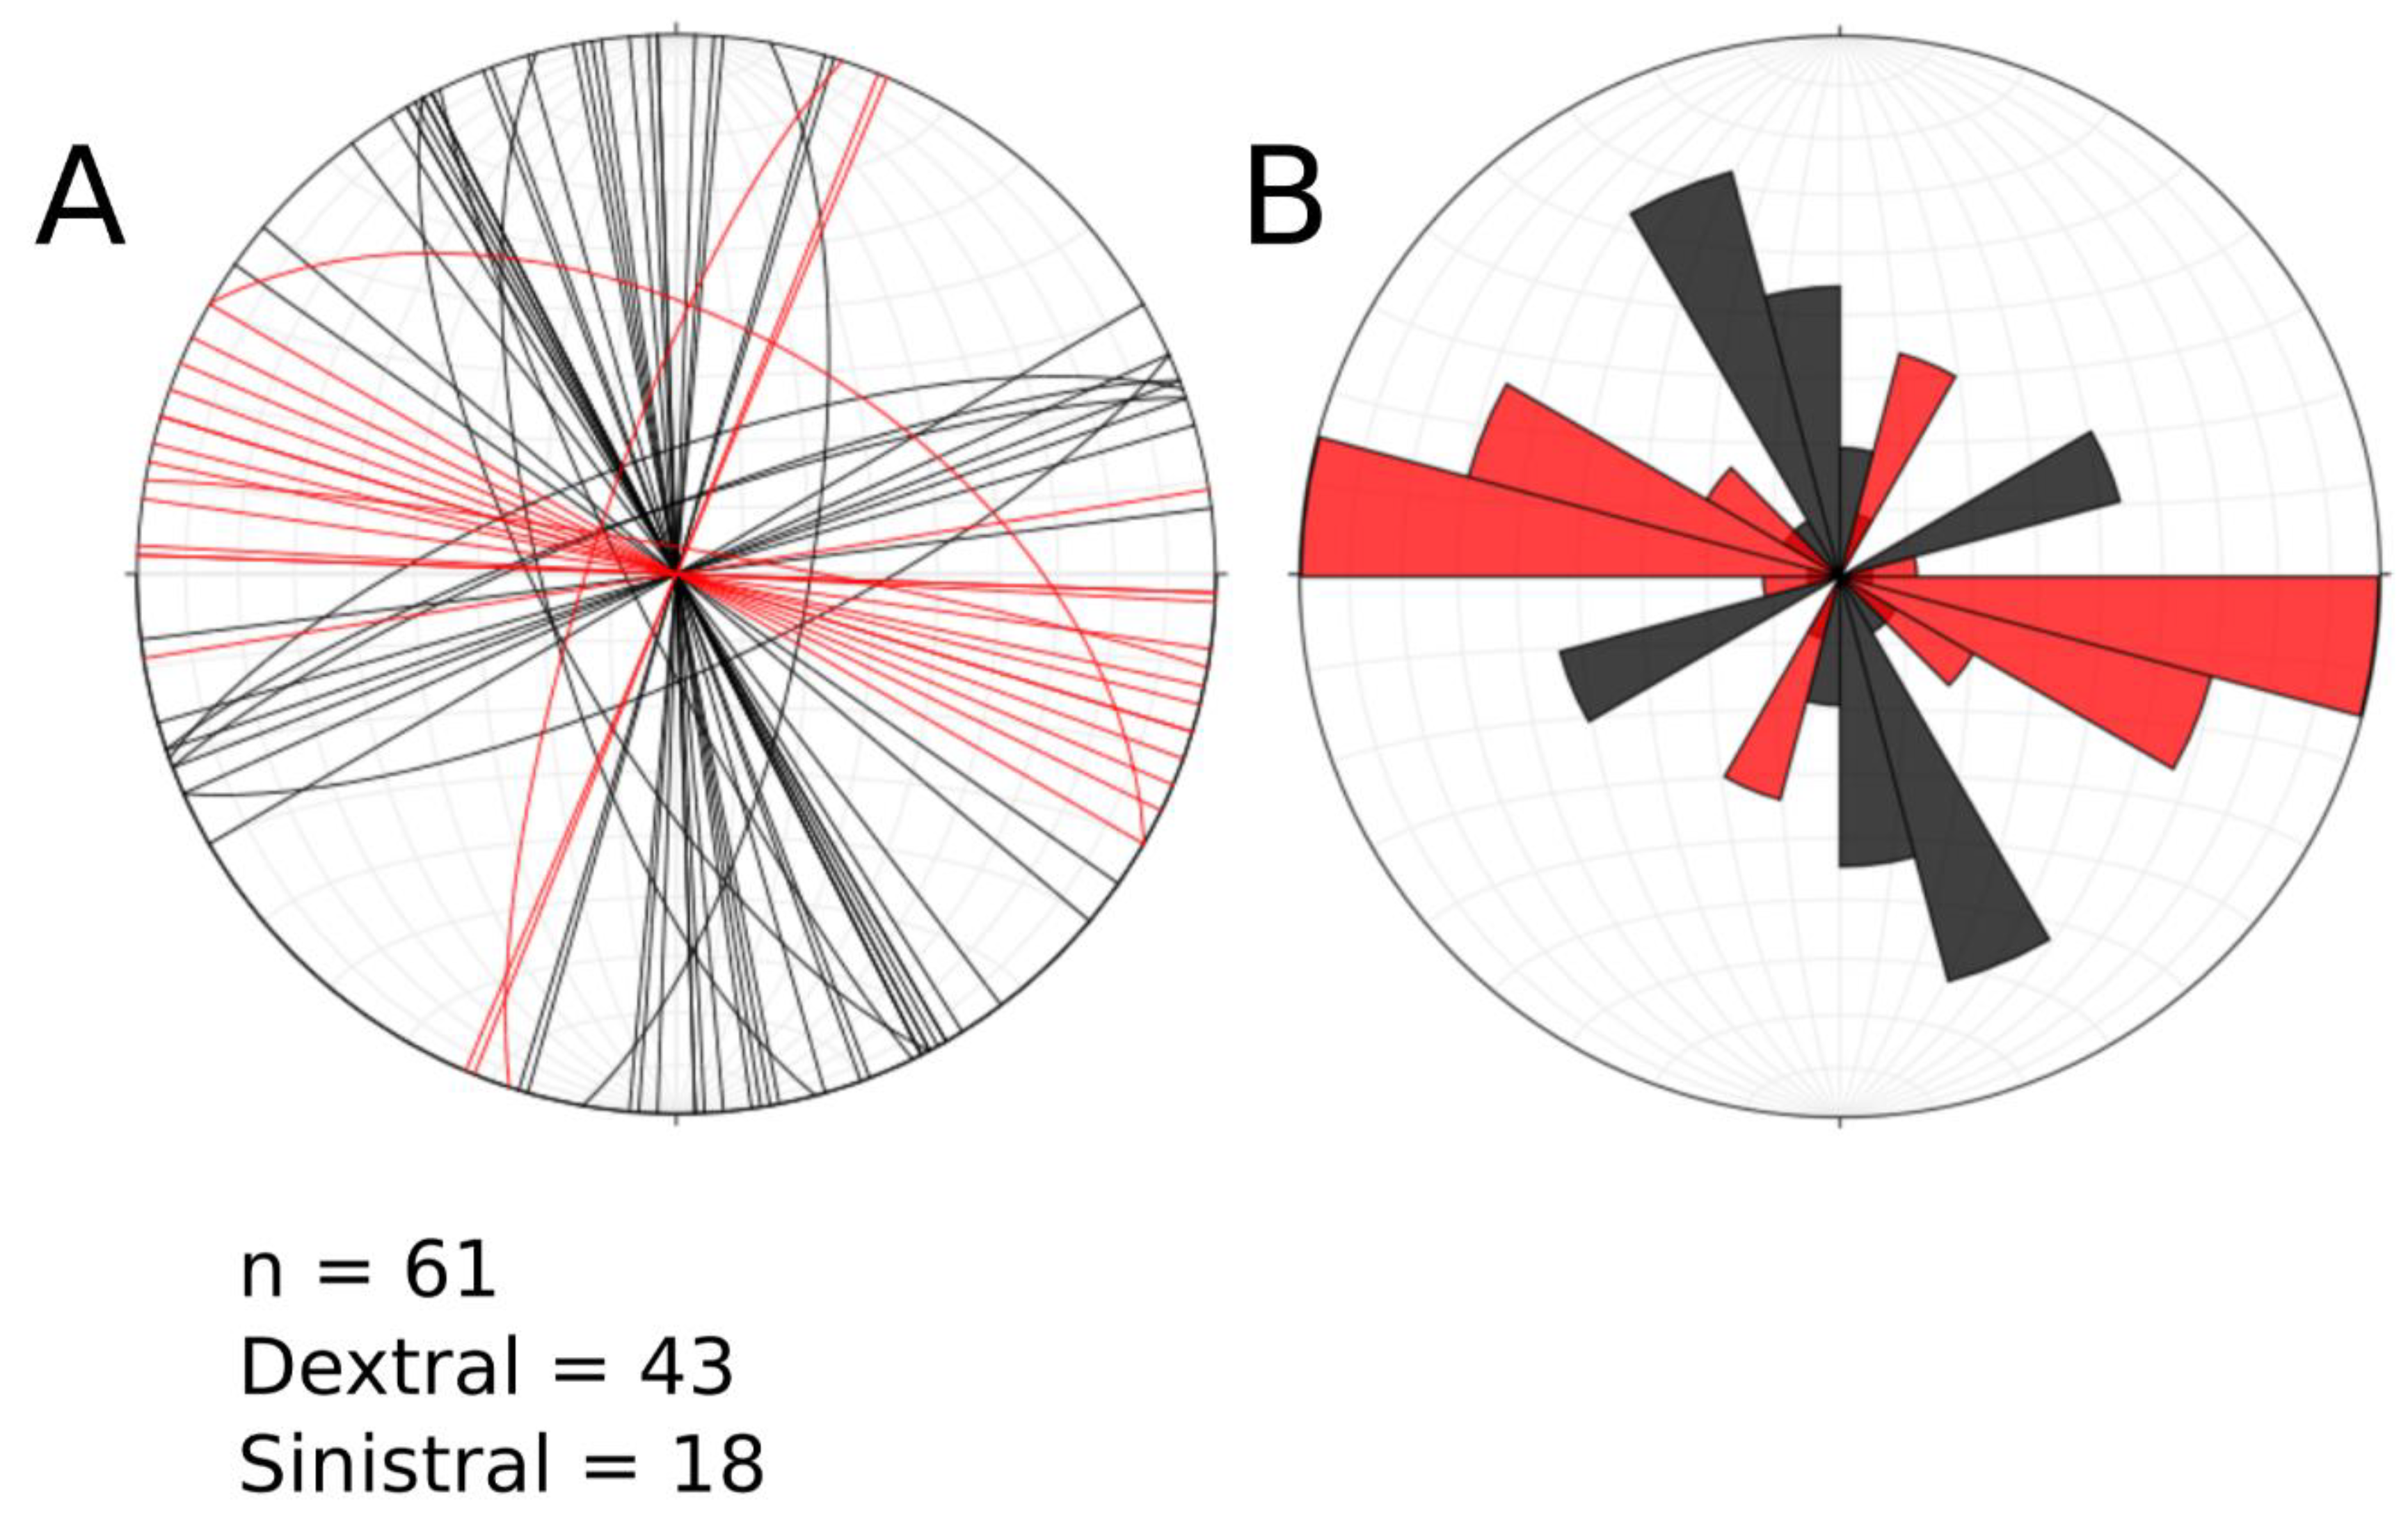
3.2.3. Results of Stress Inversion of Field Data

In addition to the wide zones of brittle deformation, smaller, abundant fracture zones in the basement that potentially represent shear deformation were also recorded (Figure 7). These display both a dextral (Figure 7A) and a sinistral (Figure 7B) shear sense. In total, 61 of these fracture zones were observed across the study area, of which 43 were characterised as dextral and 18 were characterised as sinistral (Figure 8). As with the aforementioned wide zones (>10 m) of brittle deformation, a chronology of the sinistral and dextral deformation events was not satisfactorily established, as few localities were observed with cross-cutting relationships between these fracture zones.
Although brittle deformation was observed to be widespread and readily observable (Figure 6, Figure 7, Figure 8, Figure 9 and Figure 10), reliable kinematic indicators, such as slicken lines, were not observed in conjunction with the majority of this deformation. However, some faults and fractures were observed with kinematic indictors that were sufficient to conduct a stress inversion. Some of the brittle deformation observed with reliable kinematic indicators was associated with significant epidote-dominated mineralisation (Inversion B, Figure 10), whilst at other locations little to no mineralisation was observed to be associated with the deformation (Inversion A, Figure 9). The widespread brittle deformation event modelled in inversion B was characterised by the occurrence of abundant mineralisation dominated by epidote but also including pyrite and chalcopyrite on the mineralised surfaces.
The results of both stress inversions A and B are shown in Figure 11, Table 1 and Table 2. A total of 84 measurements were used in stress inversion A, whilst in stress inversion B, although 110 fault and fracture planes were recorded, only 39 were observed to contain measurable kinematic indicators. Thus, the second stress inversion on just the epidote deformation event contains 39 data points. The absence of kinematic indicators does not imply that movement did not occur on the other 71 planes (110 − 39 = 71) with epidote mineralisation but that it has not been preserved. The analysed fault data in both stress inversions A and B include tensile, normal, reverse, and strike slip deformation.
The results of stress inversion A (all kinematic data) show that if this deformation all occurred during the same event, it represents an extensional regime, as σ1 (maximum principal stress) is oriented at 051°/78°, whilst σ3 (minimum principal stress) is orientated 276°/08°. This stress field configuration indicates a near E–W extension direction as depicted by the red arrows on Figure 11A1. The results of the stress inversion on just the epidote-bearing faults (inversion B) again indicate that this deformation event occurred during an extensional regime as σ1 (maximum principal stress) is oriented near vertical at 056°/84°, whilst σ3 (minimum stress) is orientated 254°/6°. This stress field configuration indicates an extension direction of approximately ENE–WSW as depicted by the red arrows on Figure 11B1. Plotting the resolved stresses in the slip direction in both stress inversions A and B on Mohr circles (Figure 12) shows that the principal stress orientations in inversion B are better constrained than those of inversion A.

4. Structural Reactivation Modelling

4.1. Structural Reactivation Modelling Methodology

Hybrid slip and dilation tendency analysis was performed on the basement fabric to examine its potential for reactivation during the stress configuration obtained from the stress inversion analysis described above and the extension directions inferred from previous studies [8]. This modelling was carried out using the stress analysis module of MOVE™ developed by Midland Valley. Slip Tendency (or Critical Pressure Perturbation) is the ratio of resolved shear stress (τ) to normal stress (σn) on a particular plane [61,62,63,64,65,66]. The higher the value, the greater the likelihood the plane will slip (shear failure). Dilation Tendency is a ratio that varies between 0 and 1. The higher the value, the more likely the plane/fracture will dilate (tensile failure). For a plane to dilate in a pure tensile fracture, perpendicular to sigma 1 (where θ = 0), it must be under stress conditions where: σ3 = σn < 0 and σ3 ≥ tensile strength of the rock. Alternatively, hybrid failure between shear and tensile fracturing may occur when σ3< σn < 0 and σ3 < tensile strength of the rock. All modelling was carried out at an assumed depth of deformation of 3 km, a differential stress of 100 MPa, and stress orientations derived from the field data. These values were chosen as a reasonable starting point given the other significant unknowns and the style of deformation and mineralogy. Similar assumptions have been made in [51].
It should be noted that the precise locations of the principal stress directions vary slightly between the results produced using MyFault and MOVE due to the marginally different algorithms used in these pieces of software. The modelling was conducted on a theoretical surface that is representative of the field observations of the basement metamorphic fabric (i.e., a plunging fold with associated 2nd-order folding).
The results of the slip and dilation tendency modelling were then used to identify potential ‘slip surfaces’ or ‘weak zones’ with a high reactivation potential. These surfaces were then modelled using the ‘3D move on Fault’ module of the MOVE™ software to gain insights into the surface expression of reactivating such zones through brittle extensional failure. This allowed for the production of a semi-schematic depiction of how the orientation of pre-existing basement structures may have influenced the manifestation of rifting and margin development.

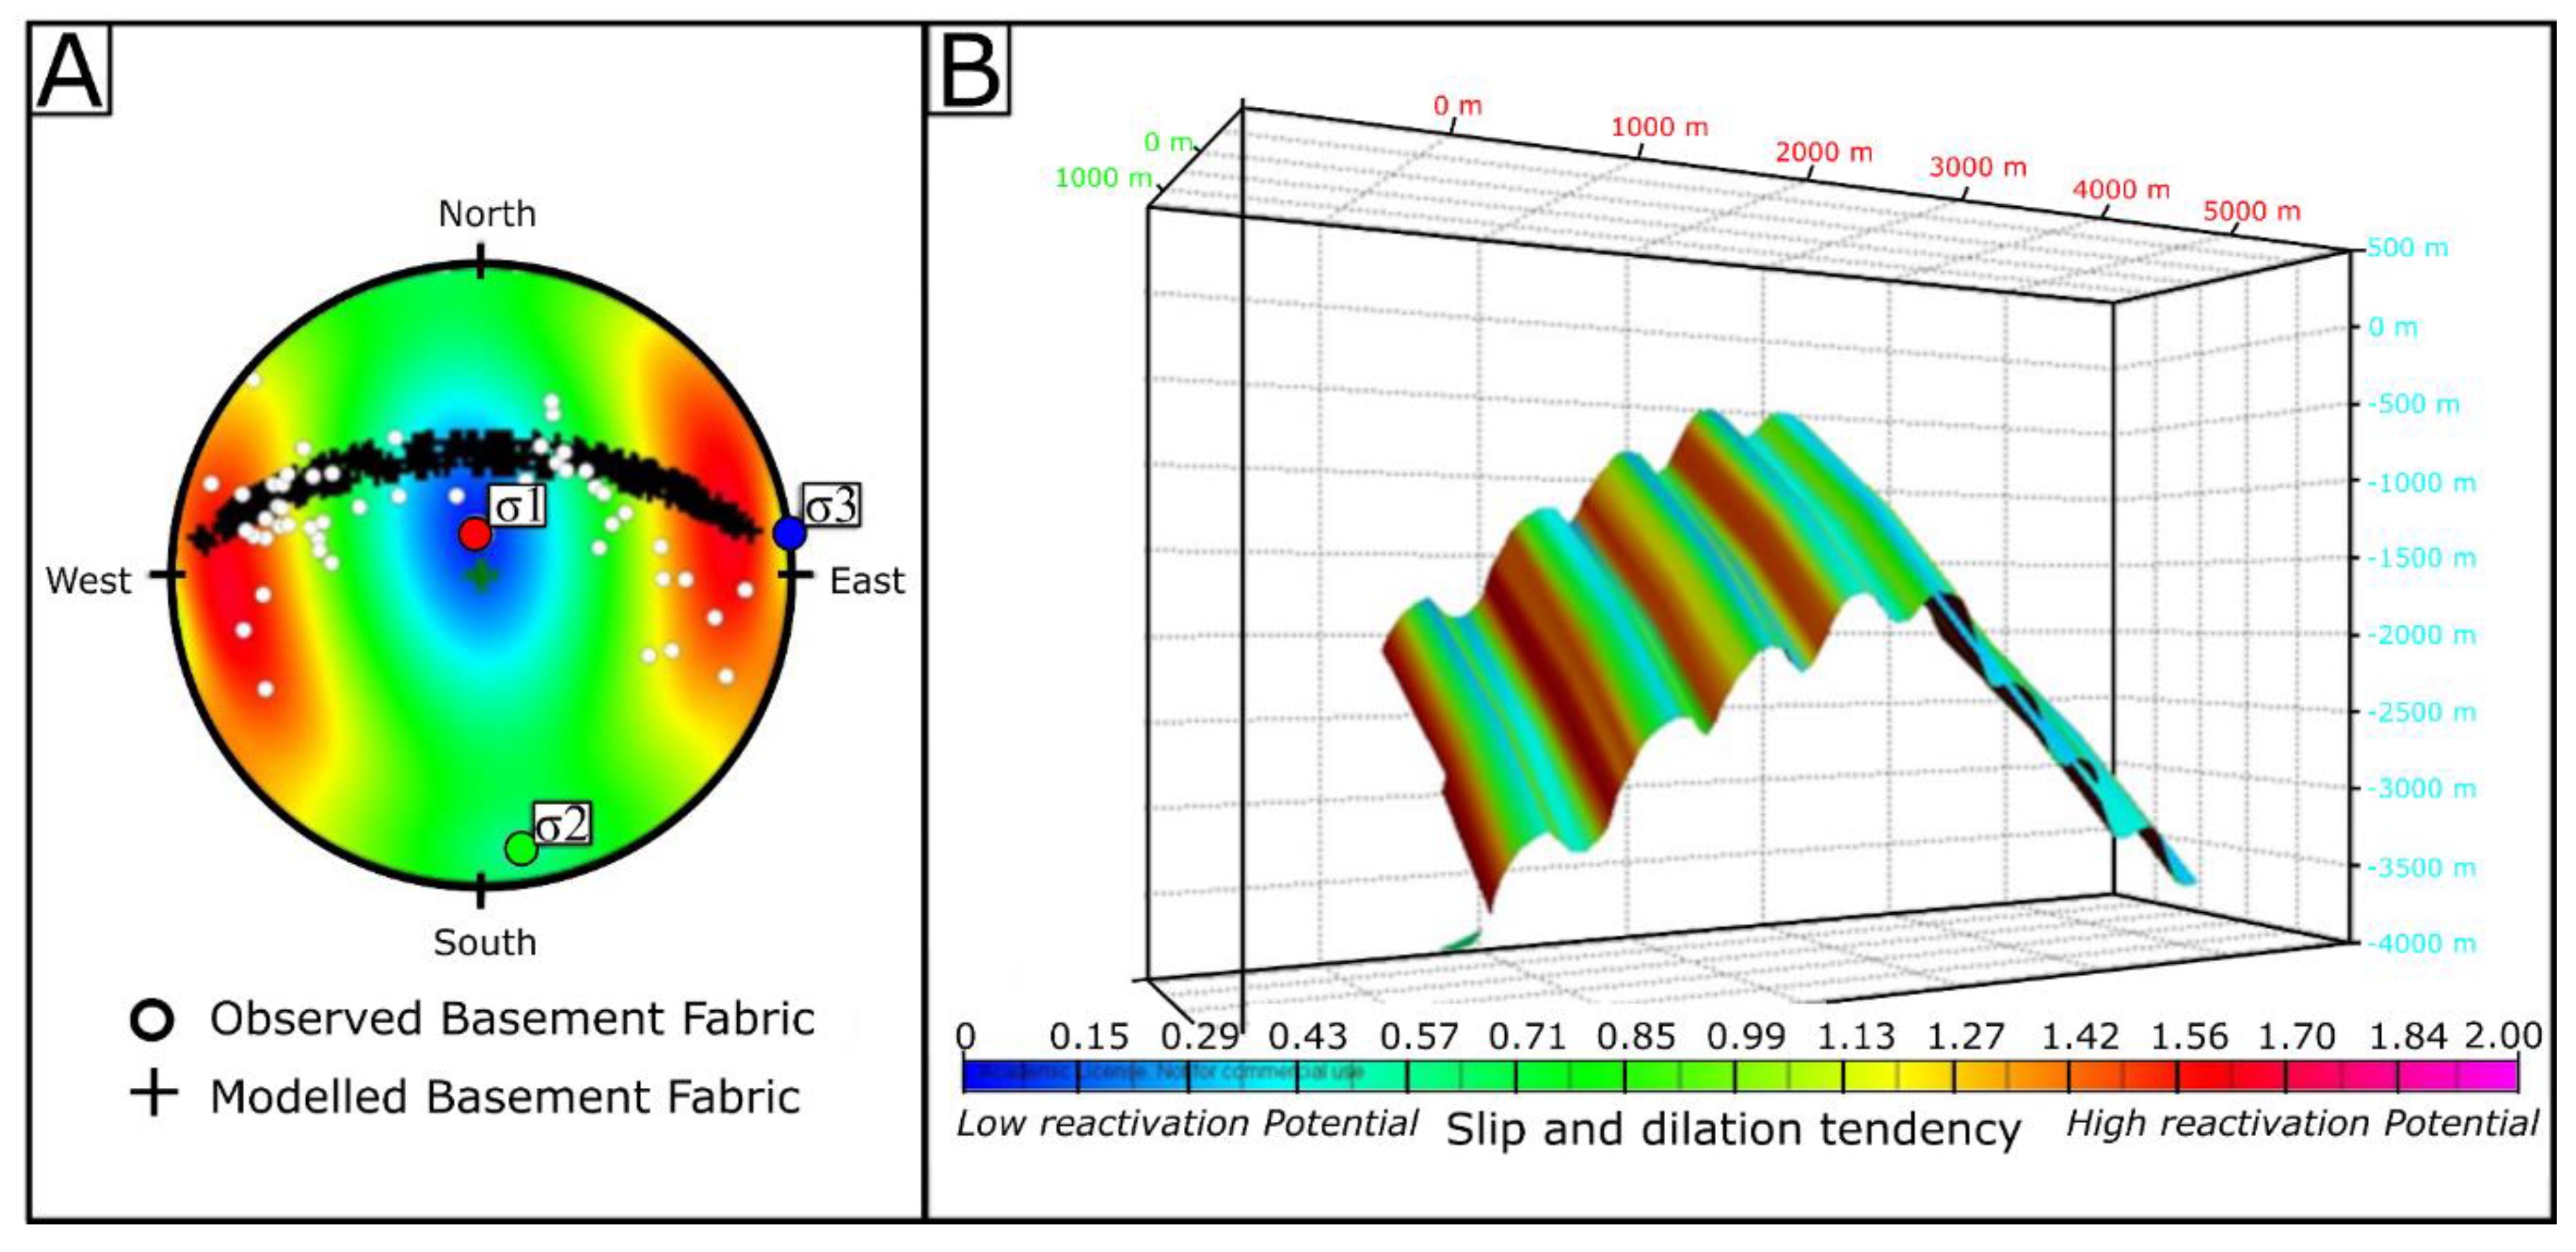
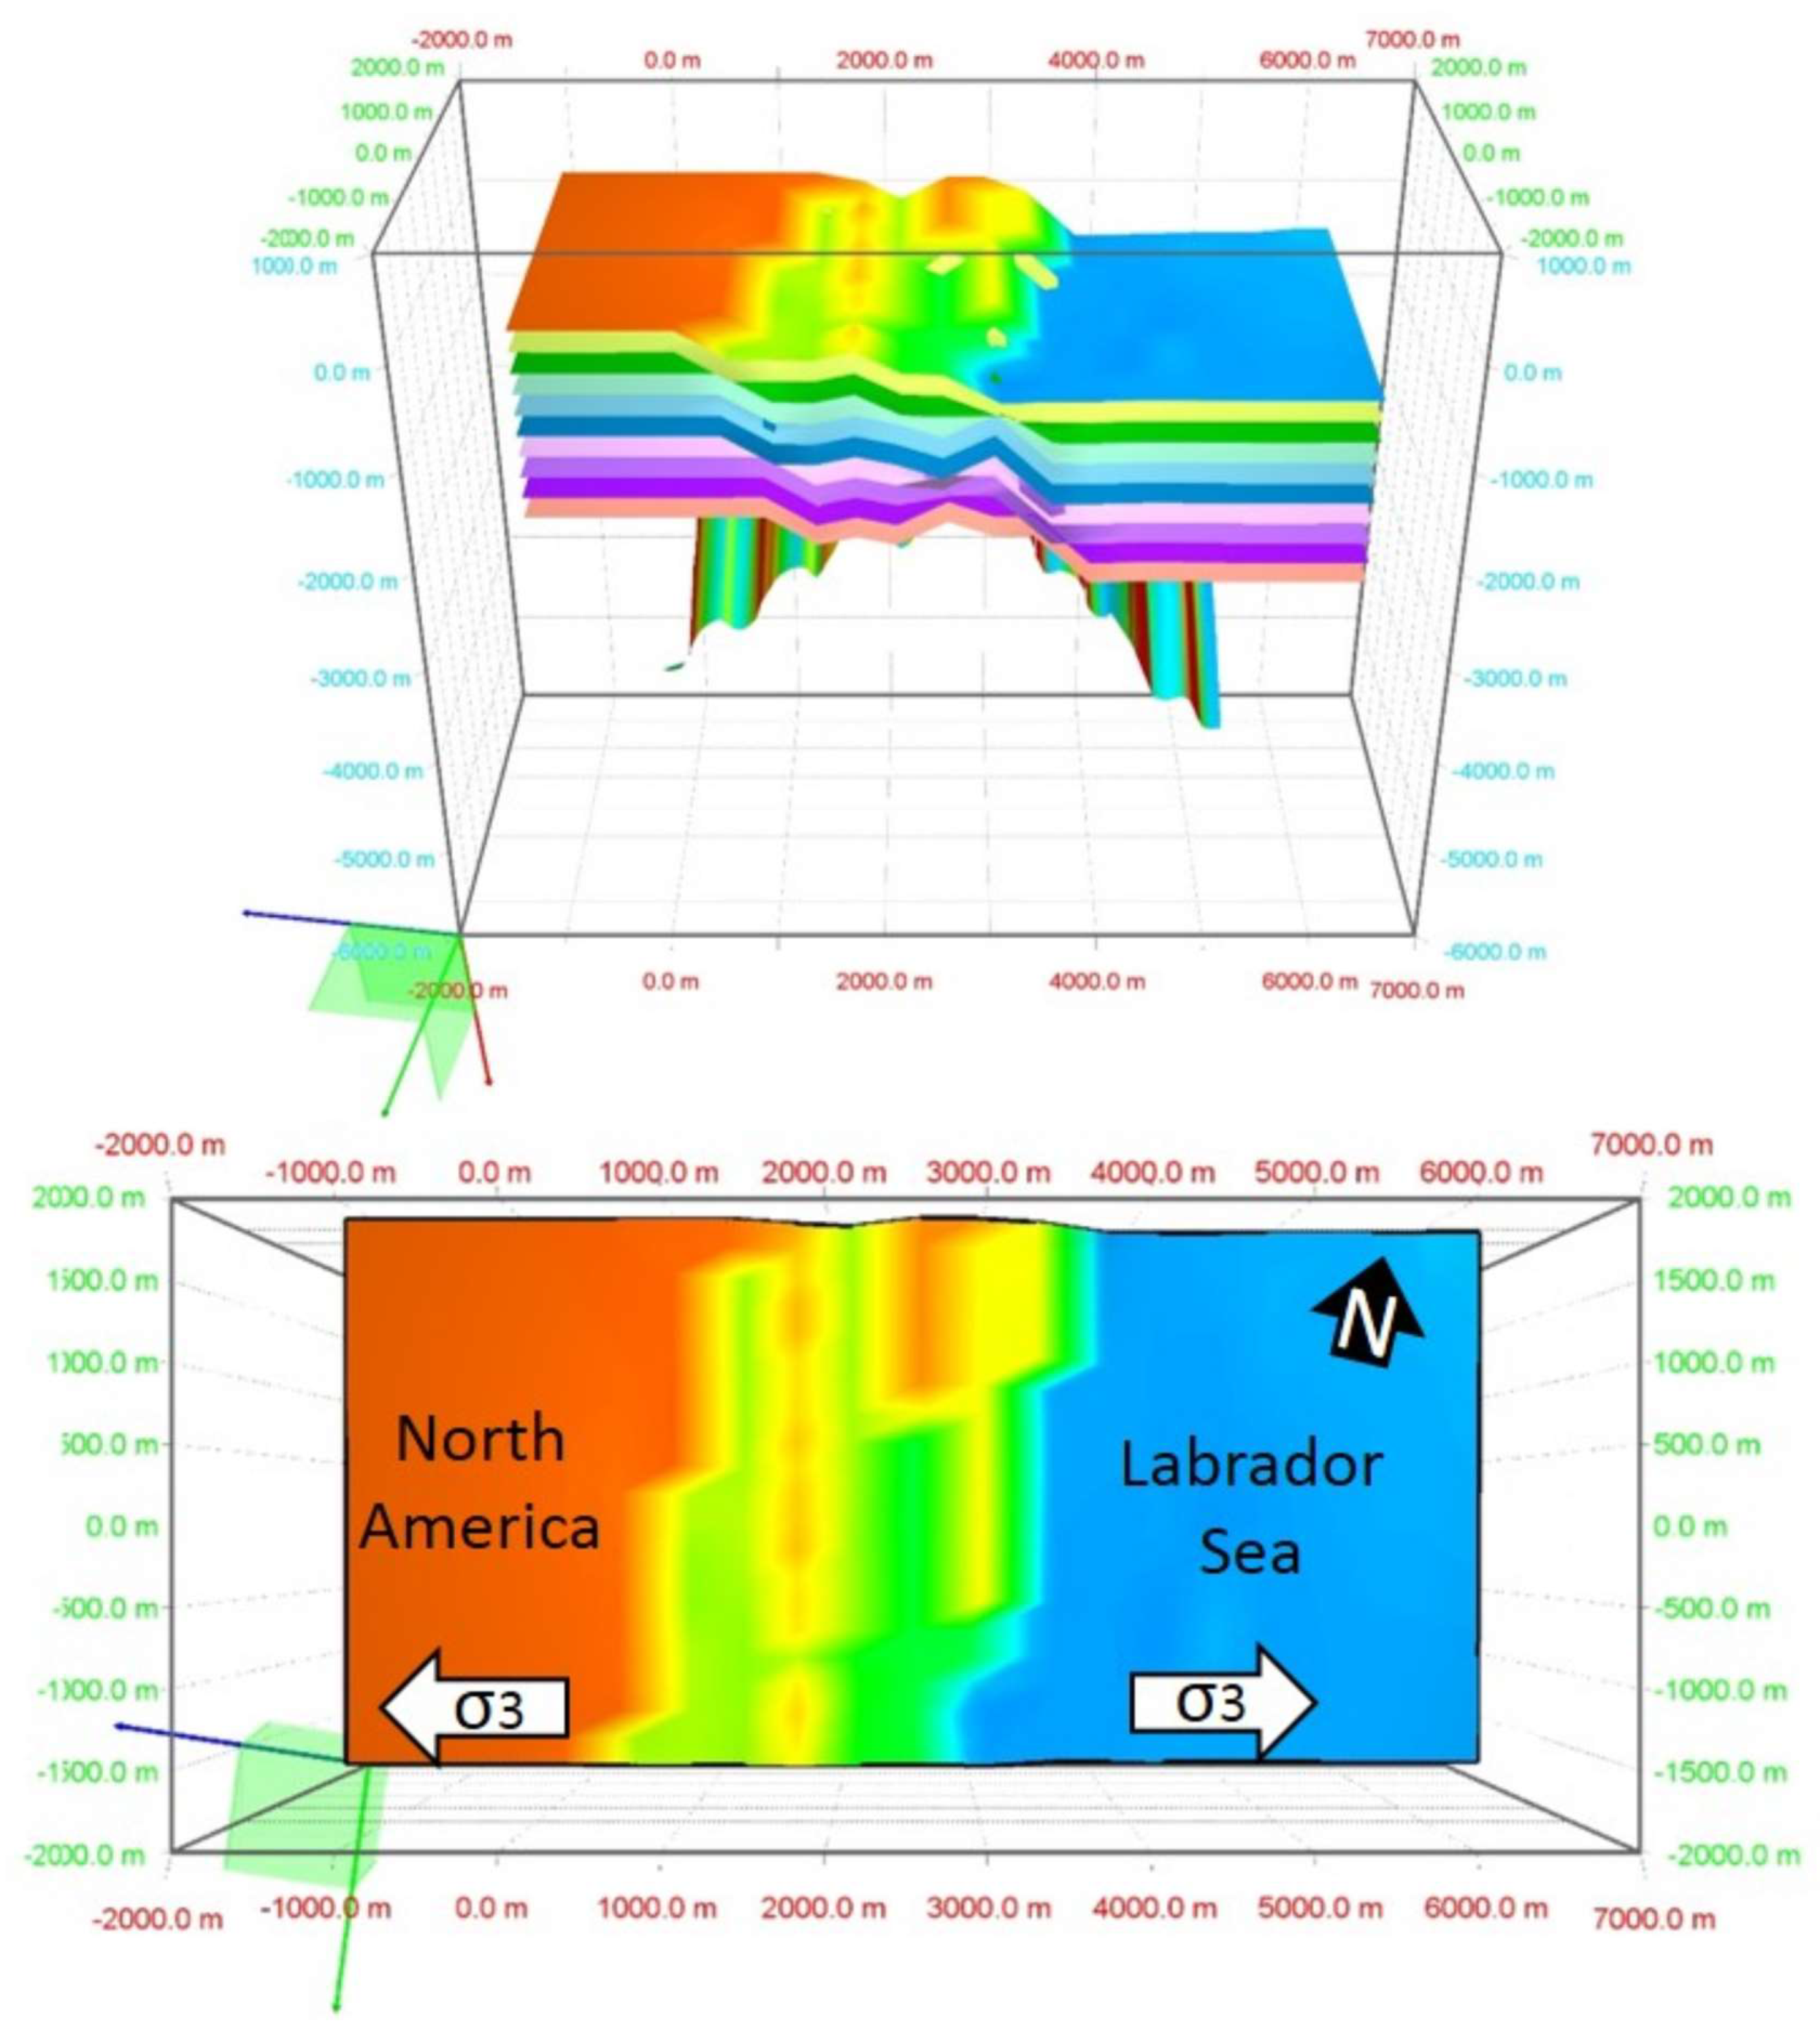
4.2. Structural Reactivation Modelling Results

The results of the MOVETM slip and dilation tendency analysis are shown in Figure 13. Figure 13A shows both the field observations of basement metamorphic fabric (white) and the modelled surface (black) on top of the slip and dilation tendency using the stress ellipsoid calculated in MOVETM. When this basement fabric orientation is considered with respect to the slip and dilation tendency analysis (Figure 13A), it is clear that the fold limbs would have been preferentially orientated to slip and/or dilate at the time of rifting; thus, they have a higher reactivation potential. This is demonstrated graphically in Figure 13B, where the modelled fold (representative of the basement structure of the field area; Figure 5) is shown coloured with regards to the slip and dilation tendency, demonstrating that a reactivation potential is apparent on the fold limbs as opposed to the fold axis. This allows us to tentatively hypothesise that brittle, rift-related structures may have formed parallel to the pre-existing basement metamorphic fabric where weaker zones may have been located.
The results of the MOVETM extensional analysis are shown in Figure 14. These results demonstrate that incremental brittle failure of the fold limbs may have led to the formation of rift basins oblique to the main extension direction (as observed on this part of the Labrador margin) through the reactivation of the preferentially orientated folded basement fabric.

5. Geopotential Stress Field Modelling

5.1. Geopotential Stress Field Modelling Methodology

In addition to the analysis of field data and modelling in MOVE™, we investigated the stress field evolution in the entire Northwest Atlantic Ocean (i.e., the Labrador Sea–Davis Strait–Baffin Bay) by means of modelling of lithospheric geopotential stresses through time. Geopotential stresses arise from horizontal gradients in geopotential energy (GPE), the integral over the vertical column of a lithostatic pressure anomaly that can be described by:
G P E = H L ( L z ) Δ ρ g   d z
where L is the depth up to which density variations are incorporated, H the topographic elevation, Δρ the vertical density anomaly with respect to a reference lithosphere, and g is the gravitational acceleration at Earth’s surface. In areas far away from active/convergent plate boundaries, geopotential stresses (including ridge push) are by far the most dominant forces acting on the plates.
Our methods to estimate geopotential stresses from lithospheric density structure follow [6768], with the difference that we require reconstructed lithospheric density models through time (see below). Here, we summarise only the most fundamental principles of the stress calculation.
The asthenospheric-lithospheric density column at each point is estimated as follows: The asthenosphere is defined by expansion of peridotite along an adiabatic gradient [∂T/∂z] = 0.6 °C/km with a reference potential temperature of 1315 °C, a thermal expansion coefficient of α = 2.4 × 10⁻⁵ K−1, and a reference density of 3350 kg·m−3. The lithosphere and sedimentary layers follow a steady-state conductive geotherm using boundary conditions of 0 °C at the surface and the adiabatic temperature at the respective LAB (lithosphere-asthenosphere boundary) depth. Representative thermal conductivities, heat production rates, and thermal expansion coefficients are assumed for the mantle lithosphere and the crustal and sedimentary layers lithosphere [67], which are considered to be temperature-dependent [69,70]. We include sub-lithospheric mantle pressure and temperature anomalies, which may change the potential temperature of the mantle adiabat.
A thin sheet approximation of the lithosphere [71,72,73] is assumed and horizontal tractions at the base of the lithosphere are neglected, as mantle flow patterns and mechanical asthenosphere–lithosphere coupling are poorly constrained.
Given this, the equations of equilibrium of stresses read:
( τ ¯ x x x + τ ¯ x y y = 1 L ( G P E x + L τ ¯ z z x ) τ ¯ y x x + τ ¯ y y y = 1 L ( G P E y + L τ ¯ z z y ) )
In Equation (2), x and y are local horizontal coordinates, τ ¯ is the depth-integrated deviatoric stress, τ ¯ x x ,   τ ¯ y y ,   τ ¯ x y are horizontal deviatoric stresses, L is the reference depth, and τ ¯ z z is the vertical sub-lithospheric pressure anomaly. The final equations of the equilibrium of stresses (Equation (2)) are solved using the Finite Element Method [74]. The Earth is parameterised using a dense grid of flat, thick triangles with elastic rheology, forming a spherical shell. The material parameters of each element comprise Young’s modulus (E), Poisson’s ratio (ν), and a uniform thickness (L). For detailed information please consult [67].
We follow published approaches to calculate the GPE and the corresponding stress field using a reference depth of L = 100 km as an approximation of the elastic layer of the Earth’s lithosphere that supports and transmits stresses [75,76].
We use a representation of the present lithospheric structure, including elevation, LAB depth, crustal and sedimentary thicknesses, corresponding densities, as well as sub-lithospheric pressure from [67,77] We reconstruct the lithospheric structural elements back in time using GPlates (version 2.0) with the global reconstructions from [21].
Additionally, the structural model was modified in the following ways:
(1) The Greenland ice sheet was subtracted for any time steps >5 Ma.
(2) Present-day dynamic topography was subtracted from the elevation model used for the reconstruction and for each time-step, dynamic topography was again added from [78] while assuming a maximum dynamic topography of 1000 m for these models.
(3) The opening oceanic areas in the reconstructions were filled with ocean-age-dependent, average values of surface heat flow, LAB depth, crustal thickness, and topography observed in the present-day lithospheric model for oceanic areas.
(4) Sediments were subtracted from basins using average sedimentation and subsidence rates over time observed in the Northwest Atlantic [79,80,81,82,83,84]. The subtracted sediments were then converted and added to a corresponding crystalline crust.
These modifications of the lithospheric model result in a rough character of the different grids in some places. To avoid this, we apply smoothing to the dataset by averaging the values within a running window of radius 50 km (topography and sedimentary layers), 100 km (upper and middle crust), 150 km (lower crust and Moho depth), and 200 km (LAB depth and surface heat flow). Since this analysis was conducted on a 1 × 1 degree grid, this should mostly affect areas in high latitudes for shallower layers, but globally for LAB depth.
Next, a linearised inversion [67,85] changes the assigned free parameters (thickness, densities and heat production of the lithospheric layers, and thermal expansion of the mantle lithosphere) in order to produce a consistent model that fits topography, surface heat flow, and lithospheric isostatic compensation within representative a priori errors. The errors for topography and surface heat flow are progressively increased for reconstructions back in time.
The lithospheric model is built on a large number of assumptions and approximations; hence, the errors are large and impossible to quantify. However, the large-scale, first-order model elements and main sources of geopotential stress changes (opening and closure of ocean basins, the global drift of the continental plates) should be recovered well enough to investigate changes in stress field.

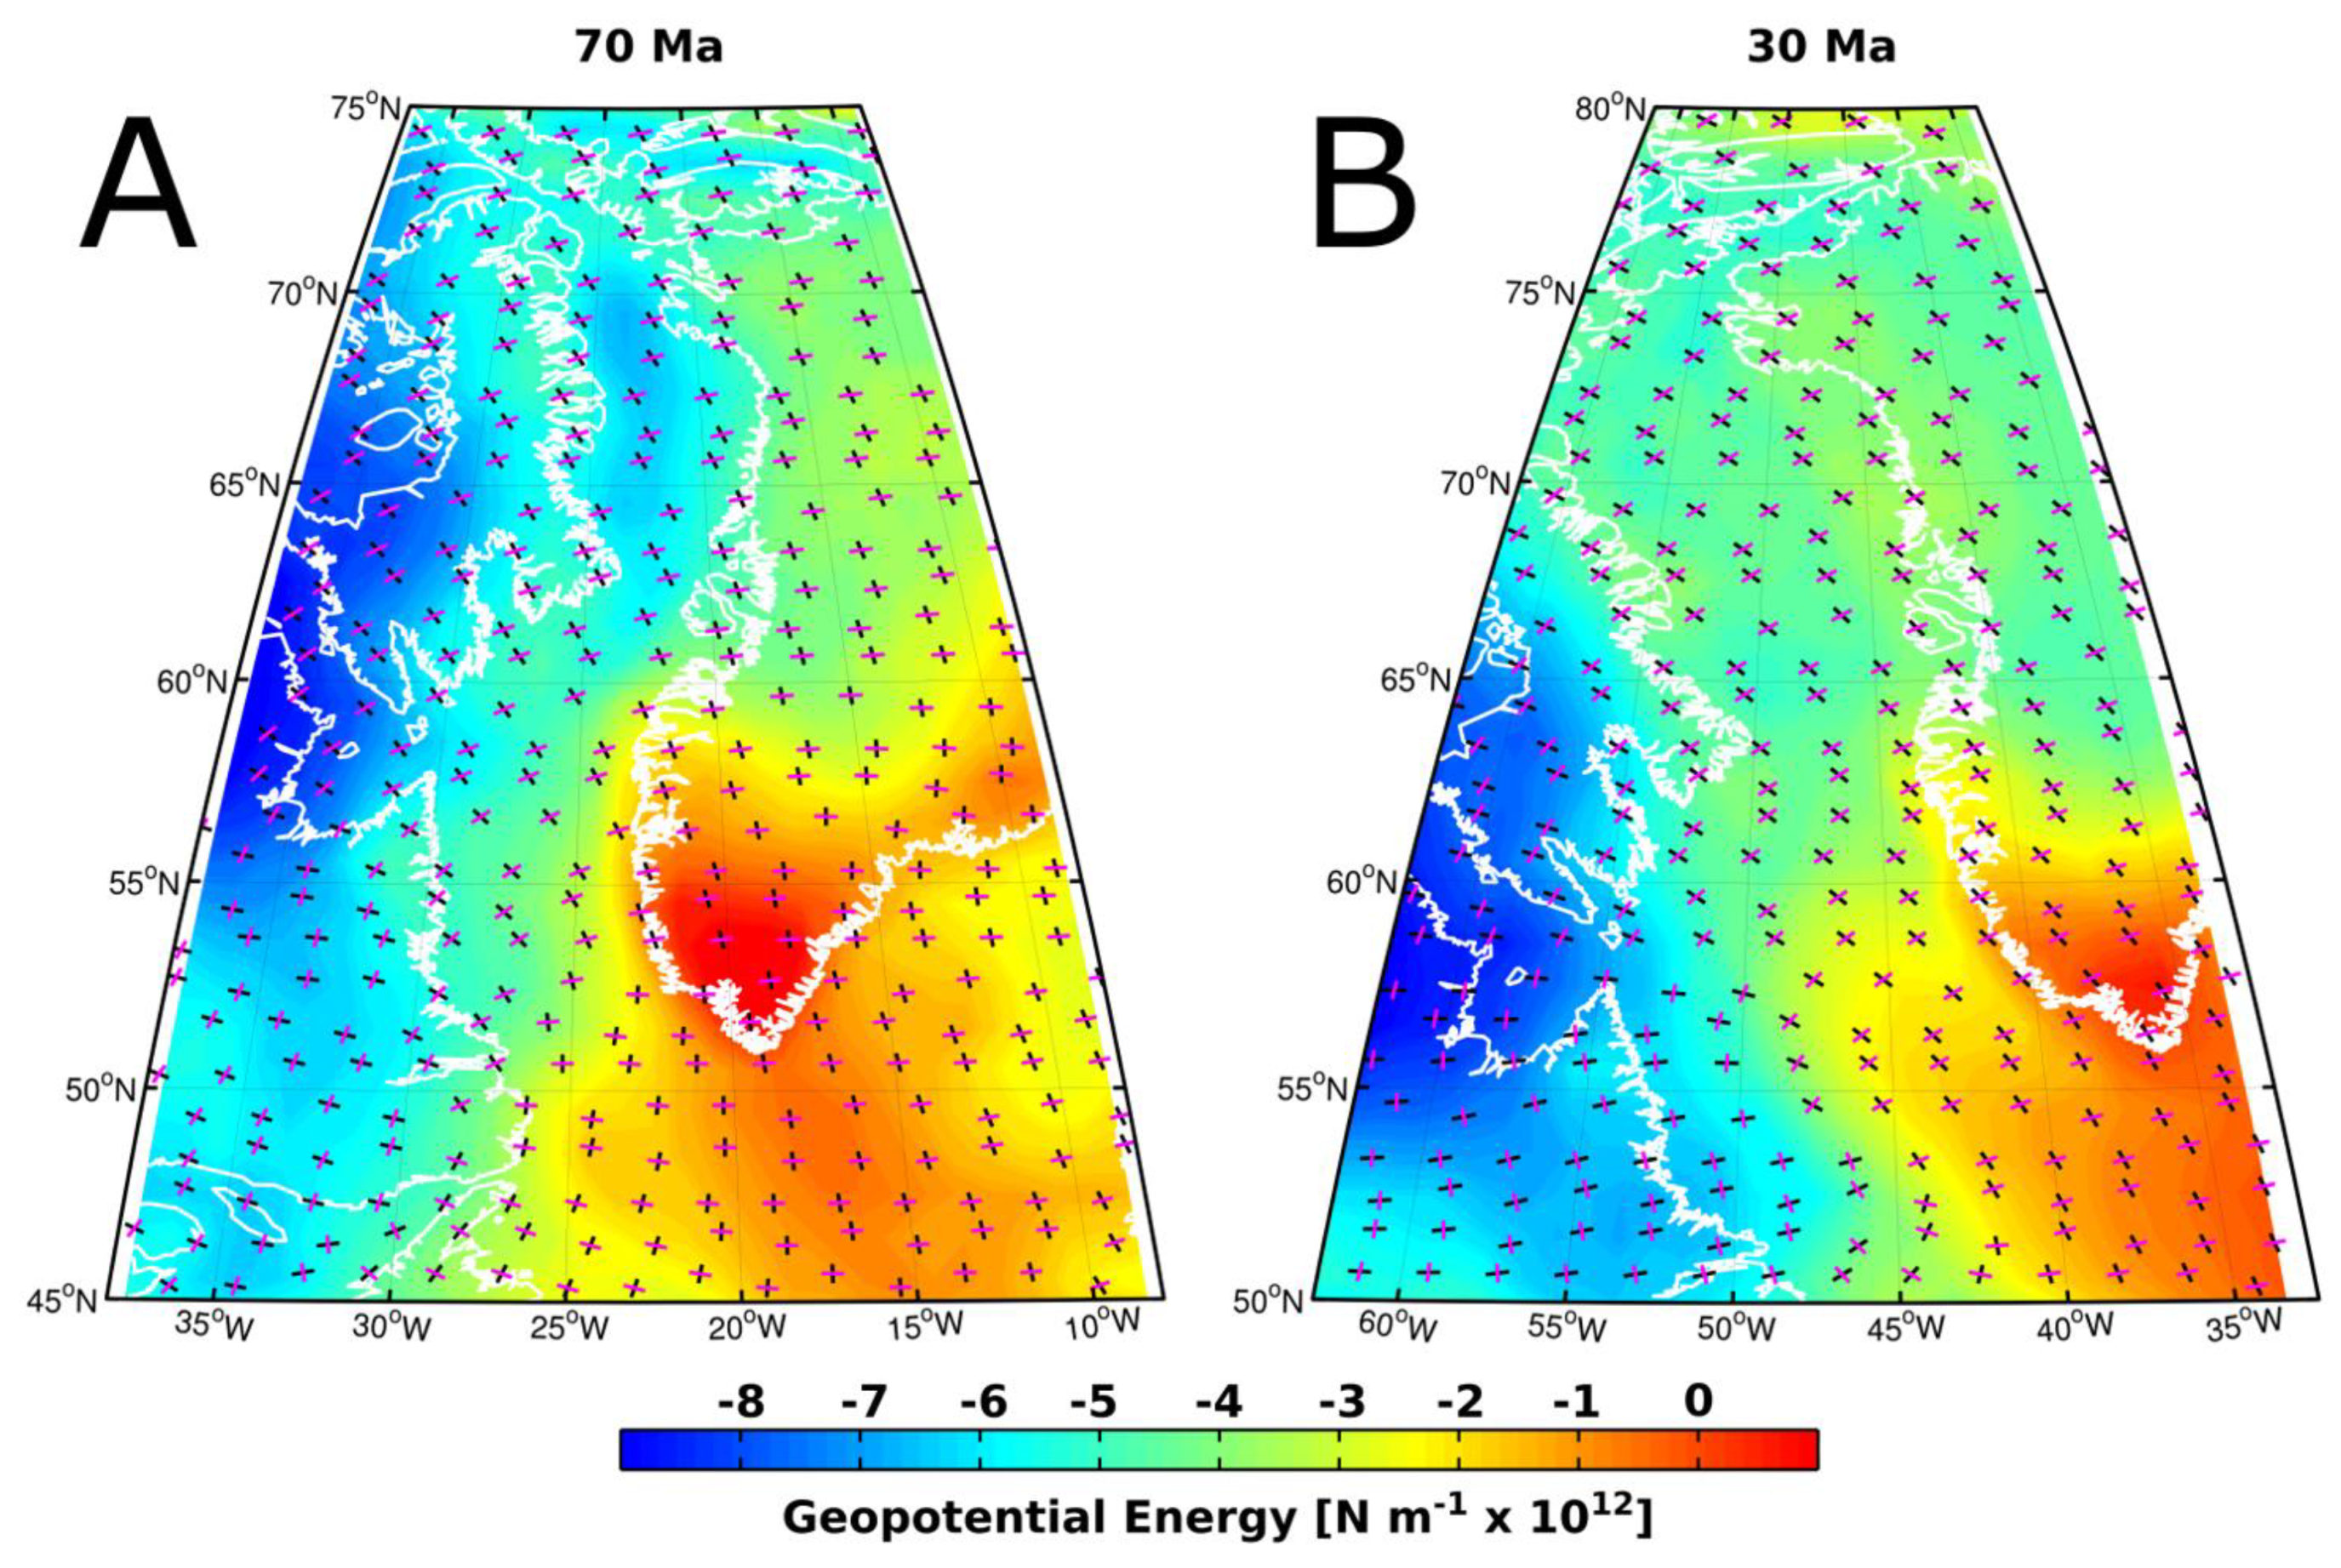
5.2. Reconstructed Geopotential Stress Field Results

We have reconstructed models of lithospheric density structure for the Cenozoic and latest Mesozoic. From these results, two representative snapshots are shown at 70 Ma and 30 Ma (Figure 15). The change in lithospheric structure, including far-field stress transfer through the elastic plates, results in quite dramatic changes of lithospheric stress in the region. At 70 Ma, extension (pink bars in Figure 15) is approximately perpendicular to the entire West Greenland and northeastern Canadian margins, corresponding to active rifting and subsequent opening of the Labrador Sea and Baffin Bay. This corresponds to a roughly N–S-oriented compression resulting from low GPE in the north and high GPE in the south, where the Central Atlantic would be currently opening [86].
In contrast, the stress field at 30 Ma, after the opening of the Labrador Sea and Baffin Bay, only slightly rotated anti-clockwise in Baffin Bay and Davis Strait. However, along the Labrador coast, stress directions changed dramatically to coast-parallel extension from previously coast-perpendicular extension, while in the central and eastern Labrador Sea and Southwest Greenland, ~E–W-oriented extension is retained. This is the effect of the high GPE along the formed spreading ridge in the east and the low GPE of the North American craton in the west, producing a compressional stress perpendicular to the coastline (coast-parallel extension).

6. Discussion

6.1. Stress Inversion

Overall, both inversions A and B displayed minimal errors in the values of the principal stress orientations (Figure 11(A2,B2)). This is as a result of the dataset containing a sufficient distribution of orientations to constrain the principal stress orientations and the minimal measuring error between the fault planes and kinematic indicators as demonstrated by the use of a relatively low misfit angle compared to previous work [52]. The near-vertical nature of σ1 in both inversion A and inversion B again indicates that the results are realistic for extensional deformation. Error analysis of the results of the stress inversion (Figure 11) demonstrates that there is minimal ambiguity associated with σ1 in both inversions A and B. However, σ3 (and thus σ2) is better constrained in inversion B than in inversion A. This may imply that when modelling the whole dataset (inversion A), multiple deformation events could have been incorporated, an interpretation also backed up by the distribution on the Mohr circle (Figure 12). Given the minimal error associated with the stress inversions, the main caveat is that the only dated age constraint is the ~590–555 Ma dykes [36,57].

6.2. Geopotential Stress Field Modelling

Our modelling of the geopotential stress field in the Labrador Sea and Baffin Bay allows us to compare palaeo-stress estimations from published literature [8] and those presented in this contribution. We can confirm a persistent coast-perpendicular extension throughout the proto- Labrador Sea and Baffin Bay prior to seafloor spreading. This was previously reported by [8] and has been confirmed by field results presented in this work. However, we cannot confirm the major change of stress direction from E–W to N–S in Central-West Greenland reported by [8], but we do observe such a behaviour along the Labrador coast. This misfit of the datasets may result from an insufficient reconstructed model (approximations and errors), other effects not considered in our modelling (e.g., horizontal mantle tractions, changing plate tectonic far field stresses), or the observed palaeo-stress measurements representing a more local deviation of the stress field not recovered in our regional lithospheric scale model. The missing geological indications for a switch in stress field from 70 to 30 Ma along the Labrador coast may be due to the low amplitude stresses applied at the passive margin.

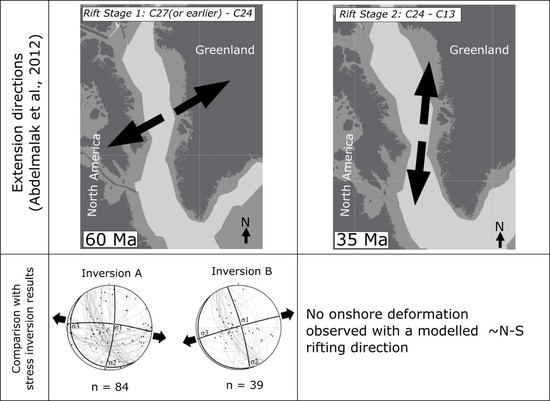
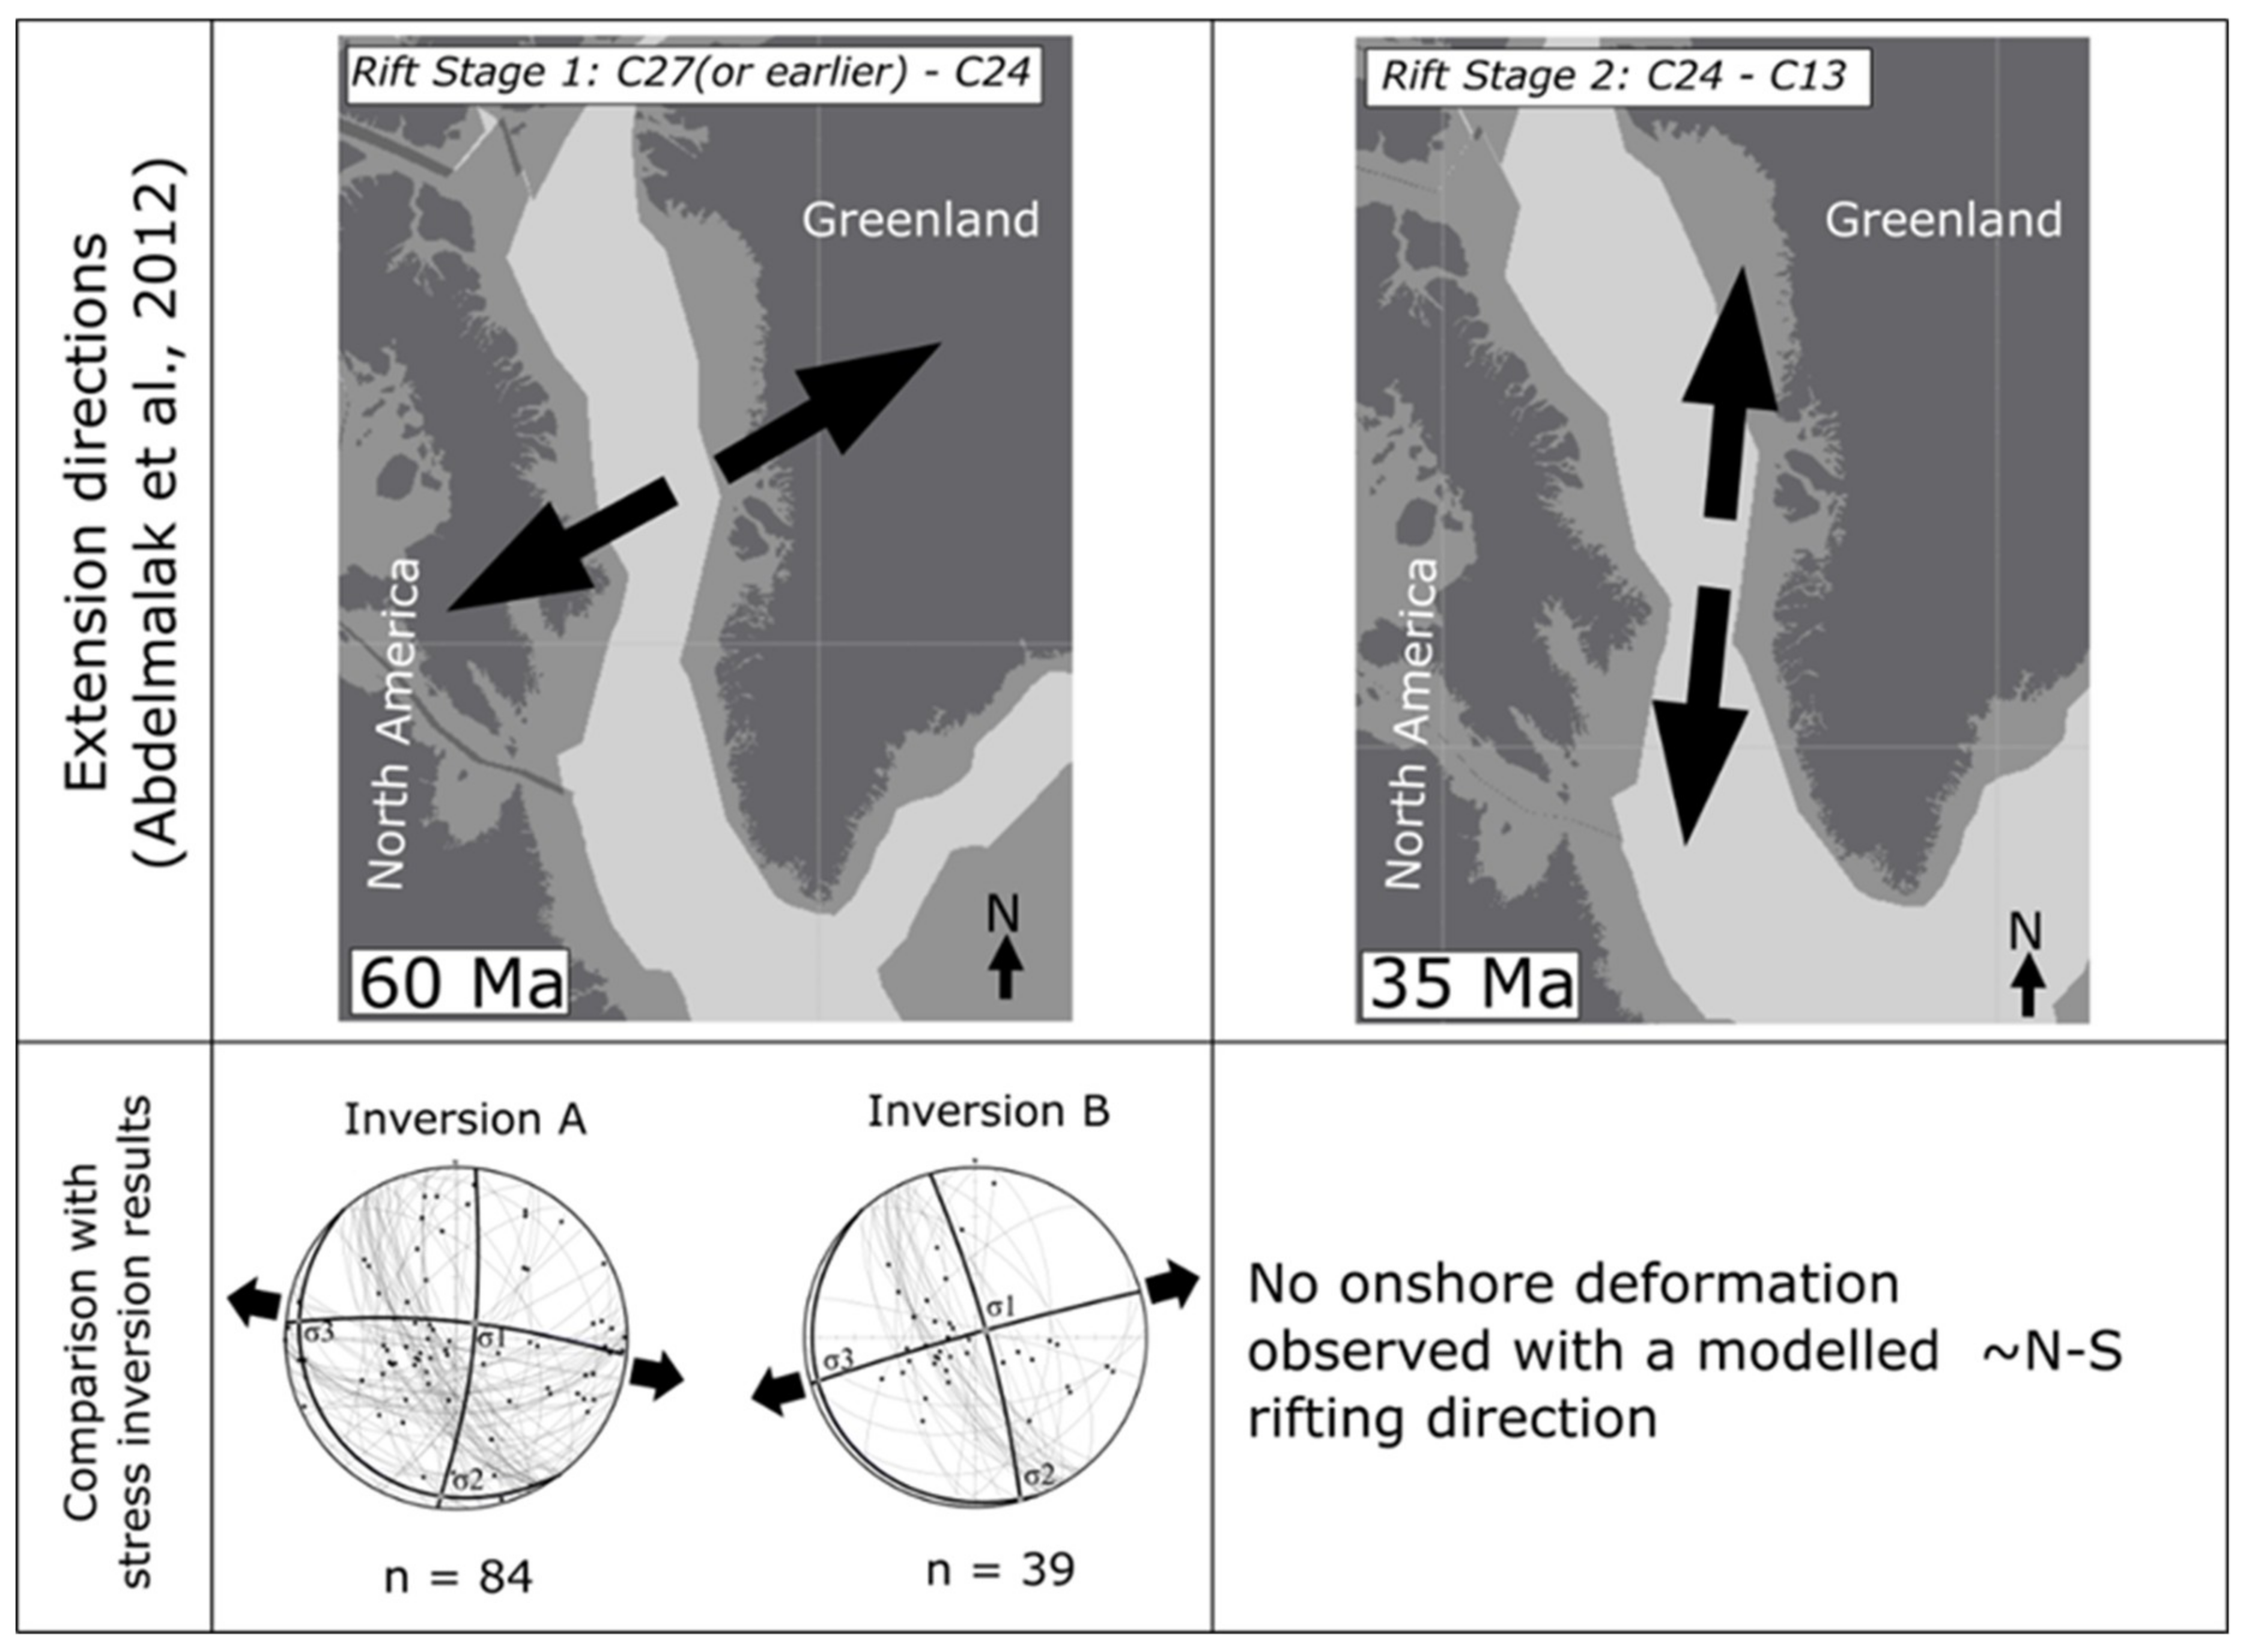
6.3. An Onshore Expression of Mesozoic Rifting?

Given that a similar extension direction was derived in both inversions A (~E–W) and B (~ENE–WSW), it is possible that all modelled deformation (inversion A) was associated with a singular event in which the epidote mineralisation (inversion B) is a localised mineralogical effect related to the abundant proximal mafic dykes [22,57,58]. However, it should be noted that when the entire dataset is modelled, the error associated with σ2 and σ3 and the spread of data on the Mohr circle (Figure 12) is much greater, possibly implying that inversion A possibly includes deformation related to multiple geological events or that polymodal faulting was in operation. To further test whether all deformation modelled in inversion A is related to a singular Mesozoic event, a significantly larger dataset is required from elsewhere on the Labrador margin, from outside the Aillik Domain within the Makkovik Province, and also from outside the Makkovik Province to ensure that this is not a localised effect.
As previously noted, Abdelmalak, M.M., et al. [8] performed stress inversions based on onshore field data obtained on the conjugate West Greenland margin demonstrating that two key stages of rifting can be identified (Figure 16), a conclusion that is concordant with much of the previous work in this area [7,54,87]. Comparison between the results of the stress inversions in this study (field data and geopotential stress analyses) and those of [8] shows that a similar extension direction has been calculated here as in their rift stage 1 (Chron 27 or earlier to Chron 24) (Figure 16). Rifting during the second stage identified by [8] (~N–S) is inconsistent with the calculated extensional direction in this study. Thus, it is possible that the deformation characterised in the first stage identified by [8] was produced in the same event as the deformation analysed in the stress inversions in this study. However, the data that constitutes inversion A show a series of approximately E–W normal faults that would be consistent with deformation during the second N–S phase of deformation identified by [8]. This implies that inversion A might include brittle deformation from both stage 1 and 2. Furthermore, during rift stage 2, continental breakup had already occurred and thus deformation may have localised onto the Labrador Sea spreading axis and away from the margin, phenomena observed post breakup at other passive margins.
However, other candidate deformation events exist to explain the observed deformation. For example, various Neo-Proterozoic-Cambrian deformation events or even far-field effects of the Appalachian-Caledonian orogeny remain candidates [88,89]. Moreover, it has been noted that during orogenesis, associated deformation can be found thousands of kilometers from the deformation front [90] and thus deformation associated with these events cannot be ruled out. It, however, remains compelling that the results documented herein are in agreement with those from other regions where better chronological constraints were available, e.g., [8].

6.4. Basement Fabric and Mesozoic Rifting

It is widely accepted that pre-existing strength anisotropies in the continental crust can have a profound influence on subsequent deformation [12,17,91,92,93,94]. In particular, pre-existing basement-hosted faults may represent long-term weakened zones and thus have the potential to be rejuvenated multiple times [25,92,95,96,97]. However, it is not just basement-hosted faults that can provide a strength anisotropy that may be later reactivated. For example, David Ashby [9] demonstrated that rift orientation in the Santos basin, Southeast Brazil, may have been inherited through the reactivation of a pre-existing basement dyke swarm, while [98] showed that the intrinsic metamorphic fabric of basement terranes of the Northwest Highlands, Scotland may have had a significant influence on fault and fracture orientation during subsequent rifting along the North Coast Transfer Zone during the Permian.
Here, hybrid slip and dilation tendency analysis was performed on the basement fabric to examine its potential for reactivation during the stress configuration obtained from the stress inversion of field data, the geopotential stress analysis, and the extension directions inferred from previous studies [8]. These results have demonstrated that manifestations of ductile deformation, such as folds, also have the potential to induce significant mechanical weaknesses that may be conducive to reactivation during rifting. Thus, fold structures should be considered as candidates for reactivation during subsequent deformation.

7. Conclusions

The conclusions of this initial structural and numerical modelling study focusing on potential rift-related deformation in the Aillik Domain of the Makkovik Province, Labrador are that:
(1) The syn-mineralisation (epidote) deformation is modelled to have been produced during an ENE–WSW extensional event. Kinematically, this ENE–WSW extensional event is incompatible with the orientation of the dykes during intrusion so is inferred to be younger than ~590–555 Ma based on the age of mafic dykes which are cross cut by the brittle deformation.
(2) It is possible that the post ~590–555 Ma extensional event produced all brittle deformation analysed herein, with the epidote mineralisation representing a localised effect due to proximity to mafic dykes.
(3) Given the extension directions interpreted from previous work and the geopotential stress field analysis, it is possible that the deformation event(s) documented in this study represent an onshore expression of rifting prior to the opening of the Labrador Sea that was approximately ENE–WSW during the Cretaceous.
(4) The regional metamorphic mineral fabric within the studied part of the Aillik Domain of the Makkovik Province is orientated parallel to the rifting direction inferred by previous studies on the conjugate West Greenland margin and by the stress inversion performed by this work. Such an orientation of the basement fabric and its intrinsic strength anisotropy would have potentially been particularly susceptible to ~E–W rifting as confirmed by the modelling results. Thus, the metamorphic basement fabric may have influenced the orientation of rift development by allowing rifting to easily propagate through the proto-Labrador Sea region.
(5) This work has uncovered evidence for multiple brittle deformation events in the Aillik Domain of the Makkovik Province. Establishing a complete chronology of these onshore deformation events should be a priority of future structural work in this region. This should include attempting to gain an absolute date for the deformation event that was used for the stress inversion in this study. Future work should also aim to collect data and conduct similar analysis elsewhere on the Canadian margin.
(6) The geopotential stress modelling did not reveal an anti-clockwise rotation of the extensional stress component from E–W (in present-day coordinates) to SW–NE, or even to N–S along the West Greenland margin as inferred by previous work. This could be an indication that this reported stress field change may have been a local effect not fully recovered in our model. In contrast, a switch of stress field orientation from E–W to N–S has been modelled at 30 Ma on the Labrador Sea margin that was not seen as a major element of the palaeo-stress analysis.
(7) Finally, future work should expand this analysis throughout the Labrador margin, Baffin Island, and West Greenland to ascertain whether the observations outlined herein (i.e., the role of basement structures during rifting and breakup) are a localised feature of the Makkovik Provence or whether they are an intrinsic feature throughout the Labrador Sea–Baffin Bay system.

Author Contributions

Conceptualisation, A.P., E.D.D., C.S., J.K.W., K.J.W.M., J.I., and J.J.J.P.; Methodology, A.P., E.D.D., and C.S.; Writing (Review & Editing), A.P., E.D.D., C.S., J.K.W., K.J.W.M., J.I., and J.J.J.P.; Field data acquisition; A.P. and J.J.J.P.; Numerical models: E.D.D. and C.S.

Funding

A.P.’s funding for this research was primarily provided by Royal Dutch Shell in the form of a CeREES studentship at Durham University, followed by a postdoctoral fellowship funded by the Hibernia Geophysics support fund at Memorial University of Newfoundland. C.S.’s postdoctoral fellowship at Durham University was funded by the Carlsberg Foundation. The Durham University Center for Doctoral Training (CDT) in Energy, the Durham Energy Institute (DEI), and St. Aidan’s College at Durham University are also thanked for their contribution towards the costs of this research. This research would not have been possible without the hospitality of the people of Makkovik, Labrador.

Acknowledgments

This research would not have been possible without the advice of Alana Hinchey of the Geological Survey of Newfoundland and Labrador, and the hospitality of the people of Makkovik. Finally, this research was presented at the GAC-NL Annual technical meeting held in St. John’s in April 2017 and the authors would like to thank the meeting’s organisers for this opportunity.

Conflicts of Interest

The authors declare no conflict of interest.

References

  1. McKenzie, D. Some remarks on the development of sedimentary basins. Earth Planet. Sci. Lett. 1978, 40, 25–32. [Google Scholar] [CrossRef] [Green Version]
  2. Reston, T.J.; Gaw, V.; Pennell, J.; Klaeschen, D.; Stubenrauch, A.; Walker, I. Extreme crustal thinning in the south Porcupine Basin and the nature of the Porcupine Median High: Implications for the formation of non-volcanic rifted margins. J. Geol. Soc. 2004, 161, 783–798. [Google Scholar] [CrossRef]
  3. Lister, G.S.; Etheridge, M.A.; Symonds, P.A. Detachment models for the formation of passive continental margins. Tectonics 1991, 10, 1038–1064. [Google Scholar] [CrossRef]
  4. Van Wijk, J.W.; Huismans, R.S.; ter Voorde, M.; Cloetingh, S.A.P.L. Melt generation at volcanic continental margins: No need for a mantle plume? Geophys. Res. Lett. 2001, 28, 3995–3998. [Google Scholar] [CrossRef] [Green Version]
  5. Schofield, N.; Jolley, D.; Holford, S.; Archer, S.; Watson, D.; Hartley, A.; Howell, J.; Muirhead, D.; Underhill, J.; Green, P. Challenges of future exploration within the UK Rockall Basin. In Petroleum Geology of NW Europe: 50 Years of Learning–Proceedings of the 8th Petroleum Geology Conference; Levell, B., Bowman, M., Eds.; Geological Society: London, UK, 2018; Volume 8, pp. 211–229. [Google Scholar]
  6. Scotchman, I.C.; Doré, A.G.; Spencer, A.M. Petroleum systems and results of exploration on the Atlantic margins of the UK, Faroes and Ireland: What have we learnt? In Petroleum Geology of NW Europe: 50 Years of Learning–Proceedings of the 8th Petroleum Geology Conference; Levell, B., Bowman, M., Eds.; Geological Society: London, UK, 2018; Volume 8, pp. 187–197. [Google Scholar]
  7. Wilson, R.W.; Klint, K.E.S.; Van Gool, J.A.M.; McCaffrey, K.J.W.; Holdsworth, R.E.; Chalmers, J.A. Faults and fractures in central West Greenland: Onshore expression of continental break-up and sea-floor spreading in the Labrador–Baffin Bay Sea. Geol. Surv. Denmark Greenl. Bull. 2006, 11, 185–204. [Google Scholar]
  8. Abdelmalak, M.M.; Geoffroy, L.; Angelier, J.; Bonin, B.; Callot, J.P.; Gélard, J.P.; Aubourg, C. Stress fields acting during lithosphere breakup above a melting mantle: A case example in West Greenland. Tectonophysics 2012, 581, 132–143. [Google Scholar] [CrossRef]
  9. Ashby, D. Influences on Continental Margin Development: A Case Study from the Santos Basin, South-eastern Brazil. Ph.D. Thesis, Durham University, Durham, UK, May 2013. [Google Scholar]
  10. Chenin, P.; Manatschal, G.; Lavier, L.L.; Erratt, D. Assessing the impact of orogenic inheritance on the architecture, timing and magmatic budget of the North Atlantic rift system: A mapping approach. J. Geol. Soc. 2015, 172, 711–720. [Google Scholar] [CrossRef]
  11. Phillips, T.B.; Jackson, C.A.L.; Bell, R.E.; Duffy, O.B. Oblique reactivation of lithosphere-scale lineaments controls rift physiography—The upper crustal expression of the Sorgenfrei-Tornquist Zone, offshore southern Norway. Soild Earth 2018, 9, 403–429. [Google Scholar] [CrossRef]
  12. Peace, A.; McCaffrey, K.; Imber, J.; van Hunen, J.; Hobbs, R.; Wilson, R. The role of pre-existing structures during rifting, continental breakup and transform system development, offshore West Greenland. Basin Res. 2018, 30, 373–394. [Google Scholar] [CrossRef]
  13. Bureau, D.; Mourgues, R.; Cartwright, J.; Foschi, M.; Abdelmalak, M.M. Characterisation of interactions between a pre-existing polygonal fault system and sandstone intrusions and the determination of paleo-stresses in the Faroe-Shetland basin. J. Struct. Geol. 2013, 46, 186–199. [Google Scholar] [CrossRef]
  14. Peace, A.L.; Foulger, G.R.; Schiffer, C.; Mccaffrey, K.J.W. Evolution of Labrador Sea–Baffin Bay: Plate or Plume Processes? Geosci. Can. 2017, 44. [Google Scholar] [CrossRef]
  15. Koopmann, H.; Brune, S.; Franke, D.; Breuer, S. Linking rift propagation barriers to excess magmatism at volcanic rifted margins. Geology 2014, 42, 1071–1074. [Google Scholar] [CrossRef]
  16. Morley, C.K.; Haranya, C.; Phoosongsee, W.; Pongwapee, S.; Kornsawan, A.; Wonganan, N. Activation of rift oblique and rift parallel pre-existing fabrics during extension and their effect on deformation style: Examples from the rifts of Thailand. J. Struct. Geol. 2004, 26, 1803–1829. [Google Scholar] [CrossRef]
  17. Schiffer, C.; Peace, A.; Phethean, J.; Gernigon, L.; McCaffrey, K.J.W.; Petersen, K.D.; Foulger, G.R. The Jan Mayen Microplate Complex and the Wilson Cycle. Geol. Soc. Lond. Spec. Publ. 2018, 470. [Google Scholar] [CrossRef]
  18. Dore, A.G.; Lundin, E.R.; Fichler, C.; Olesen, O. Patterns of basement structure and reactivation along the NE Atlantic margin. J. Geol. Soc. 1997, 154, 85–92. [Google Scholar] [CrossRef]
  19. Petersen, K.D.; Schiffer, C. Wilson cycle passive margins: Control of orogenic inheritance on continental breakup. Gondwana Res. 2016, 39, 131–144. [Google Scholar] [CrossRef]
  20. Smith, W.H.; Sandwell, D. Global Sea Floor Topography from Satellite Altimetry and Ship Depth Soundings. Science 1997, 277, 1956–1962. [Google Scholar] [CrossRef]
  21. Seton, M.; Müller, R.D.; Zahirovic, S.; Gaina, C.; Torsvik, T.; Shephard, G.; Talsma, A.; Gurnis, M.; Turner, M.; Maus, S.; et al. Global continental and ocean basin reconstructions since 200Ma. Earth-Sci. Rev. 2012, 113, 212–270. [Google Scholar] [CrossRef] [Green Version]
  22. Peace, A.; McCaffrey, K.J.W.; Imber, J.; Phethean, J.; Nowell, G.; Gerdes, K.; Dempsey, E. An evaluation of Mesozoic rift-related magmatism on the margins of the Labrador Sea: Implications for rifting and passive margin asymmetry. Geosphere 2016, 12, 1701–1724. [Google Scholar] [CrossRef] [Green Version]
  23. LaFlamme, C.; Sylvester, P.J.; Hinchey, A.M.; Davis, W.J. U-Pb age and Hf-isotope geochemistry of zircon from felsic volcanic rocks of the Paleoproterozoic Aillik Group, Makkovik Province, Labrador. Precambrian Res. 2013, 224, 129–142. [Google Scholar] [CrossRef]
  24. Kerr, A.; Hall, J.; Wardle, R.J.; Gower, C.F.; Ryan, B. New reflections on the structure and evolution of the Makkovikian-Ketilidian Orogen in Labrador and southern Greenland. Tectonics 1997, 16, 942–965. [Google Scholar] [CrossRef]
  25. Japsen, P.; Bonow, J.M.; Peulvast, J.P.; Wilson, R.W. Uplift, Erosion and Fault Reactivation in Southern West Greenland, Field Reports; Geological Survey of Denmark and Greenland: Kobenhavn, Denmak, 2006. [Google Scholar]
  26. Wilson, R.W.; McCaffrey, K.J.W.; Holdsworth, R.E.; Peace, A.; Imber, J.; GEUS. Tectonic inheritance during extension in rifts and passive margins: Greenland’s playground for basement inheritance. In Proceedings of the Arthur Holmes Meeting 2016: The Wilson Cycle: Plate Tectonics and Structural Inheritance during Continental Deformation, London, UK, 23–25 May 2016. [Google Scholar]
  27. Chalmers, J.A.; Pulvertaft, T.C.R. Development of the continental margins of the Labrador Sea: A review. Geol. Soc. Lond. Spec. Publ. 2001, 187, 77–105. [Google Scholar] [CrossRef]
  28. Delescluse, M.; Funck, T.; Dehler, S.A.; Louden, K.E.; Watremez, L. The oceanic crustal structure at the extinct, slow to ultraslow Labrador Sea spreading center. J. Geophys. Res. B Solid Earth 2015, 120, 5249–5272. [Google Scholar] [CrossRef] [Green Version]
  29. Chalmers, J.A.; Laursen, K.H. Labrador Sea: The extent of continental and oceanic crust and the timing of the onset of seafloor spreading. Mar. Pet. Geol. 1995, 12, 205–217. [Google Scholar] [CrossRef]
  30. Chian, D.; Louden, K.E.; Reid, I. Crustal structure of the Labrador Sea conjugate margin and implications for the formation of nonvolcanic continental margins. J. Geophys. Res. Solid Eaeth Banner 1995, 100, 24239–24253. [Google Scholar] [CrossRef]
  31. Gerlings, J.; Funck, T.; Jackson, H.R.; Louden, K.E.; Klingelhofer, F. Seismic evidence for plume-derived volcanism during formation of the continental margin in southern Davis Strait and northern Labrador Sea. Geophys. J. Int. 2009, 176, 980–994. [Google Scholar] [CrossRef] [Green Version]
  32. Keen, C.E.; Dickie, K.; Dafoe, L.T. Structural characteristics of the ocean-continent transition along the rifted continental margin, offshore central Labrador. Mar. Pet. Geol. 2018, 89, 443–463. [Google Scholar] [CrossRef]
  33. Larsen, L.M.; Heaman, L.M.; Creaser, R.A.; Duncan, R.A.; Frei, R.; Hutchison, M. Tectonomagmatic events during stretching and basin formation in the Labrador Sea and the Davis Strait: Evidence from age and composition of Mesozoic to Palaeogene dyke swarms in West Greenland. J. Geol. Soc. 2009, 166, 999–1012. [Google Scholar] [CrossRef]
  34. Umpleby, D.C. Geology of the Labrador Shelf; Geological Survey of Canada: Ottawa, Canada, 1979. [Google Scholar]
  35. Hansen, K. Lamprophyres and carbonatitic lamprophyres related to rifting in the Labrador Sea. Lithos 1980, 13, 145–152. [Google Scholar] [CrossRef]
  36. Tappe, S.; Foley, S.F.; Stracke, A.; Romer, R.L.; Kjarsgaard, B.A.; Heaman, L.M.; Joyce, N. Craton reactivation on the Labrador Sea margins: 40Ar/39Ar age and Sr-Nd-Hf-Pb isotope constraints from alkaline and carbonatite intrusives. Earth Planet. Sci. Lett. 2007, 256, 433–454. [Google Scholar] [CrossRef]
  37. Chalmers, J.A. The continental margin off southern Greenland: Along-strike transition from an amagmatic to a volcanic margin. J. Geol. Soc. 1997, 154, 571–576. [Google Scholar] [CrossRef]
  38. Storey, M.; Duncan, R.A.; Pedersen, A.K.; Larsen, L.M.; Larsen, H.C. 40Ar/39Ar geochronology of the West Greenland Tertiary volcanic province. Earth Planet. Sci. Lett. 1998, 160, 569–586. [Google Scholar] [CrossRef]
  39. Keen, C.E.; Dickie, K.; Dehler, S.A. The volcanic margins of the northern Labrador Sea: Insights to the rifting process. Tectonics 2012, 31, 1–13. [Google Scholar] [CrossRef]
  40. Ketchum, J.W.F.; Culshaw, N.G.; Barr, S.M. Anatomy and orogenic history of a Paleoproterozoic accretionary belt: The Makkovik Province, Labrador, Canada. Can. J. Earth Sci. 2002, 39, 711–730. [Google Scholar] [CrossRef]
  41. Hinchey, A.M. Geology of the Makkovik Area, Labrador (NTS 13O/03 and parts of NTS 13O/02). Available online: https://www.nr.gov.nl.ca/nr/mines/maps/lab/html_lb/images/Map2013-07.pdf (accessed on 20 August 2018).
  42. Culshaw, N.; Brown, T.; Reynolds, P.H.; Ketchum, J.W.F. Kanairiktok shear zone: The boundary between the Paleoproterozoic Makkovik Province and the Archean Nain Province, Labrador, Canada. Can. J. Earth Sci. 2000, 37, 1245–1257. [Google Scholar] [CrossRef]
  43. St-Onge, M.R.; Van Gool, J.A.M.; Garde, A.A.; Scott, D.J. Correlation of Archaean and Palaeoproterozoic units between northeastern Canada and western Greenland: Constraining the pre-collisional upper plate accretionary history of the Trans-Hudson orogen. Geol. Soc. Lond. Spec. Publ. 2009, 318, 193–235. [Google Scholar] [CrossRef]
  44. Garde, A.A.; Hamilton, M.A.; Chadwick, B.; Grocott, J.; McCaffrey, K.J.W. The Ketilidian orogen of South Greenland: Geochronology, tectonics, magmatism, and fore-arc accretion during Palaeoproterozoic oblique convergence. Can. J. Earth Sci. 2002, 39, 765–793. [Google Scholar] [CrossRef]
  45. Wardle, R.J.; Gower, C.F.; James, D.T.; St-Onge, M.R.; Scott, D.J.; Garde, A.A.; Culshaw, N.G.; van Gool, J.A.; Connelly, J.N.; Perreault, S.; et al. Correlation chart of the Proterozoic assembly of the northeastern Canadian-Greenland Shield. Can. J. Earth Sci. 2002, 39, 895. [Google Scholar] [CrossRef]
  46. McCaffrey, K.J.W.; Grocott, J.; Garde, A.A.; Hamilton, M.A. Attachment formation during partitioning of oblique convergence in the Ketilidian orogen, south Greenland. Geol. Soc. Lond. Spec. Publ. 2004, 227, 231–248. [Google Scholar] [CrossRef]
  47. Kerr, A.; Ryan, B.; Gower, C.F.; Wardle, R.J. The Makkovik Province: Extension of the Ketilidian Mobile Belt in mainland North America. Geol. Soc. Lond. Spec. Publ. 1996, 112, 155–177. [Google Scholar] [CrossRef]
  48. Angelier, J. Inversion of field data in fault tectonics to obtain the regional stress-III. A new rapid direct inversion method by analytical means. Geophys. J. Int. 1990, 103, 363–376. [Google Scholar] [CrossRef] [Green Version]
  49. Bott, M.H.P. The Mechanics of Oblique Slip Faulting. Geol. Mag. 1959, 96, 109–117. [Google Scholar] [CrossRef]
  50. Michael, A.J. Determination of stress from slip data: Faults and folds. J. Geophys. Res. 1984, 89, 11517–11526. [Google Scholar] [CrossRef]
  51. Dempsey, E.D.; Holdsworth, R.E.; Imber, J.; Bistacchi, A.; Di Toro, G. A geological explanation for intraplate earthquake clustering complexity: The zeolite-bearing fault/fracture networks in the Adamello Massif (Southern Italian Alps). J. Struct. Geol. 2014, 66, 58–74. [Google Scholar] [CrossRef] [Green Version]
  52. Abdunaser, K.M.; McCaffrey, K.J.W. A new structural interpretation relating NW Libya to the Hun Graben, western Sirt Basin based on a new paleostress inversion. J. Earth Syst. Sci. 2015, 124, 1745–1763. [Google Scholar] [CrossRef]
  53. Dichiarante, A.M.; Holdsworth, R.E.; Dempsey, E.D.; Selby, D.; McCaffrey, K.J.W.; Michie, U.M.; Morgan, G.; Bonniface, J. New structural and Re-Os geochronological evidence constraining the age of faulting and associated mineralization in the Devonian Orcadian Basin, Scotland. J. Geol. Soc. 2016, 173, 457–473. [Google Scholar] [CrossRef] [Green Version]
  54. Oakey, G.N.; Chalmers, J. A new model for the Paleogene motion of Greenland relative to North America: Plate reconstructions of the Davis Strait and Nares Strait regions between Canada and Greenland. J. Geophys. Res. Solid Earth 2012, 117, 1–28. [Google Scholar] [CrossRef]
  55. Arne, D.C.; Grist, A.M.; Zentilli, M.; Collins, M.; Embry, A.; Gentzis, T. Cooling of the Sverdrup Basin during Tertiary basin inversion: Implications for hydrocarbon exploration. Basin Res. 2002, 14, 183–205. [Google Scholar] [CrossRef]
  56. Holford, S.P.; Tuitt, A.K.; Hillis, R.R.; Green, P.F.; Stoker, M.S.; Duddy, I.R.; Sandiford, M.; Tassone, D.R. Cenozoic deformation in the Otway Basin, southern Australian margin: Implications for the origin and nature of post-breakup compression at rifted margins. Basin Res. 2014, 26, 10–37. [Google Scholar] [CrossRef] [Green Version]
  57. Tappe, S.; Foley, S.F.; Jenner, G.A.; Heaman, L.M.; Kjarsgaard, B.A.; Romer, R.L.; Stracke, A.; Joyce, N.; Hoefs, J. Genesis of ultramafic lamprophyres and carbonatites at Aillik Bay, Labrador: A consequence of incipient lithospheric thinning beneath the North Atlantic Craton. J. Petrol. 2006, 47, 1261–1315. [Google Scholar] [CrossRef]
  58. Foley, S.F. Emplacement Features of Lamprophyre and Carbonatitic Lamprophyre Dykes at Aillik Bay, Labrador. Geol. Mag. 1989, 126, 29–42. [Google Scholar] [CrossRef]
  59. Cardozo, N.; Allmendinger, R.W. Spherical projections with OSXStereonet. Comput. Geosci. 2013, 51, 193–205. [Google Scholar] [CrossRef]
  60. Woodcock, N.H.; Mort, K.M. Classification of fault breccias and related fault rocks. Geol. Mag. 2008, 145, 435–440. [Google Scholar] [CrossRef]
  61. Hobbs, B.E.; Means, W.D.; Williams, P.F. An Outline of Structural Geology; John Wiley & Sons: New York, NY, USA, 1976. [Google Scholar]
  62. Jaeger, J.C.; Cook, N.G.W. Fundamentals of Rock Mechanics, 3rd ed.; Chapman and Hall: London, UK, 1979. [Google Scholar]
  63. Morris, A.; Ferrill, D.A.; Henderson, D.B.; Morris, A.; Ferrill, D.A.; Henderson, D.B. Slip-tendency analysis and fault reactivation. Geology 1996, 24, 275–278. [Google Scholar] [CrossRef]
  64. Lisle, R.J.; Srivastava, D.C. Test of the frictional reactivation theory for faults and validity of fault-slip analysis. Geology 2004, 32, 569–572. [Google Scholar] [CrossRef]
  65. Neves, M.C.; Paiva, L.T.; Luis, J. Software for slip-tendency analysis in 3D: A plug-in for Coulomb. Comput. Geosci. 2009, 35, 2345–2352. [Google Scholar] [CrossRef]
  66. Moeck, I.; Kwiatek, G.; Zimmermann, G. Slip tendency analysis, fault reactivation potential and induced seismicity in a deep geothermal reservoir. J. Struct. Geol. 2009, 31, 1174–1182. [Google Scholar] [CrossRef] [Green Version]
  67. Schiffer, C.; Nielsen, S.B. Implications for anomalous mantle pressure and dynamic topography from lithospheric stress patterns in the North Atlantic Realm. J. Geodyn. 2016, 98, 53–69. [Google Scholar] [CrossRef]
  68. Nielsen, S.B.; Stephenson, R.A.; Schiffer, C. Deep controls on intraplate basin inversion. In Intraplate Earthquakes; Talwani, P., Ed.; Cambridge University Press: Cambridge, UK, 2014; pp. 257–274. [Google Scholar]
  69. Bouhifd, M.A.; Andrault, D.; Fiquet, G.; Richet, P. Thermal expansion of forsterite up to the melting point. Geophys. Res. Lett. 1996, 23, 1143–1146. [Google Scholar] [CrossRef]
  70. McKenzie, D.; Jackson, J.; Priestley, K. Thermal structure of oceanic and continental lithosphere. Earth Planet. Sci. Lett. 2005, 233, 337–349. [Google Scholar] [CrossRef]
  71. Bird, P.; Piper, K. Plane-stress finite-element models of tectonic flow in southern California. Phys. Earth Planet. Inter. 1980, 21, 158–175. [Google Scholar] [CrossRef]
  72. England, P.; Houseman, G. Finite strain calculations of continental deformation: 2. Comparison with the India-Asia Collision Zone. J. Geophys. Res. Solid Earth 1986, 91, 3664–3676. [Google Scholar] [CrossRef]
  73. England, P.; McKenzie, D. A thin viscous sheet model for continental deformation. Geophys. J. R. Astron. Soc. 1982, 70, 295–321. [Google Scholar] [CrossRef] [Green Version]
  74. Zienkiewicz. The Finite Element Method, 3rd ed.; McGraw-Hill: Berkshire, UK, 1977. [Google Scholar]
  75. Flesch, L.M.; Haines, A.J.; Holt, W.E. Dynamics of the India-Eurasia collision zone. J. Geophys. Res. Solid Earth 2001, 106, 16435–16460. [Google Scholar] [CrossRef] [Green Version]
  76. Ghosh, A.; Holt, W.E.; Wen, L.; Haines, A.J.; Flesch, L.M. Joint modeling of lithosphere and mantle dynamics elucidating lithosphere-mantle coupling. Geophys. Res. Lett. 2008, 35. [Google Scholar] [CrossRef] [Green Version]
  77. Schiffer, C.; Tegner, C.; Schaeffer, A.J.; Pease, V.; Nielsen, S.B. High arctic geopotential stress field and implications for geodynamic evolution. Geol. Soc. Spec. Publ. 2018, 460. [Google Scholar] [CrossRef]
  78. Müller, R.D.; Sdrolias, M.; Gaina, C.; Steinberger, B.; Heine, C. Long-term sea-level fluctuations driven by ocean basin dynamics. Science 2008, 319, 1357–1362. [Google Scholar]
  79. Arthur, M.A.; Srivastava, S.P.; Kaminski, M.; Jarrard, R.; Osler, J. Seismic stratigraphy and history of deep circulation and sediment drift development in Baffin Bay and the Labrador Sea. In Proceedings of the Ocean Drilling Program: Scientific Results; Texas A&M University: Texas, TX, USA, 1989; Volume 105, pp. 957–988. [Google Scholar]
  80. Cloetingh, S.; Gradstein, F.M.; Kooi, H.; Grant, A.C.; Kaminski, M.M. Plate reorganization: A cause of rapid late Neogene subsidence and sedimentation around the North Atlantic? J. Geol. Soc. 1990, 147, 495–506. [Google Scholar] [CrossRef]
  81. Gradstein, F.M.; Srivastava, S.P. Aspects of Cenozoic stratigraphy and paleoceanography of the Labrador Sea and Baffin Bay. Palaeogeogr. Palaeoclimatol. Palaeoecol. 1980, 30, 261–295. [Google Scholar] [CrossRef]
  82. Piper, D.J.W. Late Cenozoic evolution of the continental margin of eastern Canada. Nor. J. Geol. 2005, 85, 305–318. [Google Scholar]
  83. Royden, L.; Keen, C.E. Rifting process and thermal evolution of the continental margin of Eastern Canada determined from subsidence curves. Earth Planet. Sci. Lett. 1980, 51, 343–361. [Google Scholar] [CrossRef]
  84. Wolf, T.C.W.; Thiede, J. History of terrigenous sedimentation during the past 10 my in the North Atlantic (ODP Legs 104 and 105 and DSDP Leg 81). Mar. Geol. 1991, 101, 83–102. [Google Scholar] [CrossRef]
  85. Tarantola, A.; Valette, B. Generalized nonlinear inverse problems solved using the least squares criterion. Rev. Geophys. 1982, 20, 219–232. [Google Scholar] [CrossRef]
  86. De Lamotte, D.F.; Fourdan, B.; Leleu, S.; Leparmentier, F.; De Clarens, P. Style of rifting and the stages of Pangea breakup. Tectonics 2015, 34, 1009–1029. [Google Scholar] [CrossRef] [Green Version]
  87. Hosseinpour, M.; Müller, R.D.; Williams, S.E.; Whittaker, J.M. Full-fit reconstruction of the labrador sea and baffin bay. Solid Earth 2013, 4, 461–479. [Google Scholar] [CrossRef]
  88. Hatcher, R. The Appalachian orogen: A brief summary. In From Rodinia to Pangea: The Lithotectonic Record of the Appalachian Region; Geological Society of America: Boulder, CO, USA, 2010. [Google Scholar]
  89. Haworth, R.T.; Hipkin, R.; Jacobi, R.D.; Kane, M.; Lefort, J.P.; Max, M.D.; Miller, H.G.; Wolff, F. Geophysical framework and the Appalachian-Caledonide connection. Geol. Soc. Lond. Spec. Publ. 1988, 38, 3–20. [Google Scholar] [CrossRef] [Green Version]
  90. Nielsen, S.B.; Stephenson, R.; Thomsen, E. Dynamics of Mid-Palaeocene North Atlantic rifting linked with European intra-plate deformations. Nature 2007, 450, 1071–1074. [Google Scholar] [CrossRef] [PubMed]
  91. Butler, R.W.H.; Holdsworth, R.E.; Lloyd, G.E. The role of basement reactivation in continental deformation. J. Geol. Soc. 1997, 154, 69–71. [Google Scholar] [CrossRef]
  92. Holdsworth, R.E.; Butler, C.A.; Roberts, A.M. The recognition of reactivation during continental deformation. J. Geol. Soc. 1997, 154, 73–78. [Google Scholar] [CrossRef]
  93. Holdsworth, R.E.; Handa, M.; Miller, J.A.; Buick, I.S. Continental reactivation and reworking: An introduction. Geol. Soc. Lond. Spec. Publ. 2001, 184, 1–12. [Google Scholar] [CrossRef]
  94. Holdsworth, R.E.; Stewart, M.; Imber, J.; Strachan, R.A. The structure and rheological evolution of reactivated continental fault zones: A review and case study. Geol. Soc. Lond. Spec. Publ. 2001, 184, 115–137. [Google Scholar] [CrossRef]
  95. McCaffrey, K. Controls on reactivation of a major fault zone: The Fair Head-Clew Bay line in Ireland. J. Geol. Soc. 1997, 154, 129–133. [Google Scholar] [CrossRef]
  96. Bellahsen, N.; Fournier, M.; d’Acremont, E.; Leroy, S.; Daniel, J.M. Fault reactivation and rift localization: Northeastern Gulf of Aden margin. Tectonics 2006, 25, 1–14. [Google Scholar] [CrossRef]
  97. Autin, J.; Bellahsen, N.; Leroy, S.; Husson, L.; Beslier, M.O.; D’Acremont, E. The role of structural inheritance in oblique rifting: Insights from analogue models and application to the Gulf of Aden. Tectonophysics 2013, 607, 51–64. [Google Scholar] [CrossRef] [Green Version]
  98. Wilson, R.W.; Holdsworth, R.E.; Wild, L.E.; McCaffrey, K.J.W.; England, R.W.; Imber, J.; Strachan, R.A. Basement-influenced rifting and basin development: A reappraisal of post-Caledonian faulting patterns from the North Coast Transfer Zone, Scotland. Geol. Soc. Lond. Spec. Publ. 2010, 335, 795–826. [Google Scholar] [CrossRef]
Figure 1. (A) The northeast coast of Labrador, Canada. (B) The area surrounding the study area shown in detail in Figure 3. Both subfigures (A,B) use the topography and bathymetry of [20] V17.1.
Geosciences 08 00308 g001
Figure 2. Simplified tectonic framework of central Labrador modified from [22] based on [23], including the location of Figure 3A within the Makkovik Province. Abbreviations: NAC, North Atlantic Craton; BZ, Border Zone; GZ/JB, Granite Zone/ Julianehåb Batholith; NP, Nain Province; MP, Makkovik Province; PsZ, Psammite Zone; PeZ, Pelite Zone; SECP, southeastern Churchill Province; KD, Kaipokok Domain; AD, Aillik Domain; GV, Grenville Province; KMB, Ketilidian Mobile Belt. Inset: The correlation of the Makkovik and Ketilidian orogenic belts has been modified from [24].
Geosciences 08 00308 g002
Figure 3. The location of the data analysed, including: (A) the locations where basement fabric orientation was measured, (B) the locations of the data used in the stress inversion calculations, (C) the locations where zones of shear fractures were recorded and (D) the large fracture zone on Big Island.
Geosciences 08 00308 g003
Figure 4. An example of the metamorphic fabric observed in the basement units on Big Island, ~2 km northwest of Makkovik. Viewing angle is looking down on the exposure with north to the right.
Geosciences 08 00308 g004
Figure 5. Planes to poles for all basement foliation measurements displayed using Kamb contouring. The contour interval is 2σ, and the counting area is 14.8% of the Stereonet. Folding is shown by this dataset, with the dominant structural trend of the limbs dipping to the east and west. The axial plane is shown with a dashed line (005/87 E: strike, dip, dip-direction) that was calculated in the Stereonet software (version 9.94 Richard W. Allmendinger, Dept. of Earth & Atmospheric Sciences, 3128 Snee Hall, Cornell University, Ithaca, NY 14853-1504, USA) for OXS (mac operating system) [59].
Geosciences 08 00308 g005
Figure 6. Field (AC) and Google Earth images (D,E) of a zone of extensive intense brittle deformation on Big Island north of Makkovik. Subfigure (E) shows the possible continuation of this zone inland. (A,C) are looking southwest whereas (B) is looking northeast.
Geosciences 08 00308 g006
Figure 7. Examples of the abundant fracture zones in the basement that potentially indicate shear deformation on (A) the north coast of Big Island and (B) the coastline north of Ikey’s point (Figure 3).
Geosciences 08 00308 g007
Figure 8. (A) Stereonet showing the orientations of fracture zones, such as those in Figure 7, categorised as either sinistral (red) or dextral (black). Most fracture zones are plotted as vertical as their dip could not be discerned from the field observations. (B) The data from subfigure (A) plotted on a rose diagram using 15° bins (total bins = 24) and divided into two dextral and two sinistral sets of structures. The data presented in this figure were plotted in the Stereonet software for OXS [59].
Geosciences 08 00308 g008
Figure 9. Examples of brittle deformation not associated with the epidote mineralisation that contributed to the data used in inversion A. The quarry near Makkovik shown on subfigure (A) located at 55.0756° N/59.169299° W contained multiple surfaces similar to those in subfigure (B) with readily observable slicken lines, such as those in subfigures (C,D).
Geosciences 08 00308 g009
Figure 10. Examples of the variability in occurrences of the widespread brittle deformation event associated with epidote mineralisation modelled in this study as inversion B. Subfigure (A1) is located on Big Island (Figure 1) where abundant epidote mineralisation often associated with slicken lines, such as those in (A2), was observed to be widespread. The outcrop in subfigure (B1) was observed on Makkovik Peninsula and shows an example of a mineralised surface in which no kinematic indicators are present. Surfaces such as those in (B1) potentially represent mode I fractures. Subfigures (C1) and (C2) show an outcrop of mafic dyke in Fords Bight containing pyrite and epidote.
Geosciences 08 00308 g010
Figure 11. Stress inversion results for both inversion A and inversion B, with all subfigures denoted with ‘A’ related to inversion A and all subfigures denoted with ‘B’ related to inversion B. Subfigures (A1,B1) display the calculated three principal stress orientations (σ1 > σ2 > σ3), along with measured fault planes, associated slicken lines, and the dominant stretching direction (red arrows). Subfigures (A2,B2) show the error calculations associated with the stress inversions. All plots in this figure were produced in MyFault version 1.05.
Geosciences 08 00308 g011
Figure 12. Mohr circles (A) and (B) for inversions A and B with the maximum resolved stresses in the fault plane shown in grey. This figure demonstrates that inversion B is a better-oriented dataset to perform a stress inversion on.
Geosciences 08 00308 g012
Figure 13. (A) Stereographic projection depicting observed (white) and modelled (black) basement metamorphic fabric measurements along with the slip and dilation tendency. (B) Graphical representation in MOVETM of the surface that is used in the reactivation modelling and corresponds to the black points in (A). The surface in (B) is coloured with the slip and dilation tendency (reactivation potential) for the stress regime shown in (A).
Geosciences 08 00308 g013
Figure 14. The semi-schematic results of the extensional analysis that was carried out in MOVE™ showing changes to topography as a result of modelled slip on fold limbs.
Geosciences 08 00308 g014
Figure 15. Geopotential energy and geopotential stresses calculated for Labrador Sea, Baffin Bay, and environs at reconstructions at (A) 70 Ma and (B) 30 Ma. Pink bars show the direction of maximum horizontal deviatoric stress (extension). Black bars show the direction of minimum horizontal deviatoric stress (compression). High geopotential energy (GPE) (red colours) is observed in areas of high topography and shallow lithosphere. Vice-versa, low geopotential energy corresponds to thick cratonic keels, low topography, and sedimentary basins. Positive sub-lithospheric pressure anomalies, pushing up the lithospheric column, therefore, increase GPE.
Geosciences 08 00308 g015
Figure 16. Comparison between the stretching directions in [8] and the stretching direction (σ3) produced by the inversions in this study. In addition, the results of the geopotential stress field analysis reproduce a comparable direction for stage 1 but do not resolve stage 2 deformation.
Geosciences 08 00308 g016
Table 1. Calculated principal stress directions from the stress inversion on all modelled data (inversion A).
Principal Stress AxisAzimuthPlunge
σ1051°78°
σ2185°
σ3276°
Table 2. Calculated principal stress directions from the stress inversion on the epidote data (inversion B).
Principal Stress AxisAzimuthPlunge
σ1056°84°
σ2164°
σ3254°

