Magnetic Properties of Iron Sand from the Tor River Estuary, Sarmi, Papua


1
Department of Physics, University of Cenderawasih, Jayapura 99358, Indonesia
2
Faculty of Mining and Petroleum Engineering, Institut Teknologi Bandung, Jalan Ganesha 10, Bandung 40132, Indonesia
*
Author to whom correspondence should be addressed.
Geosciences 2018, 8(4), 113; https://doi.org/10.3390/geosciences8040113
Submission received: 25 February 2018
/
Revised: 27 March 2018
/
Accepted: 27 March 2018
/
Published: 30 March 2018
(This article belongs to the Special Issue Selected Papers from 1st International Congress on Earth Sciences in SE Asia)
Abstract
:Information about the strategic mineral balance, published in 2013, presumed a significant amount of iron sand deposited in Sarmi, Papua, Indonesia. However, the magnetic properties of these iron sands have never been studied. Our preliminary study on the distribution of magnetic susceptibility of iron sand from the Sarmi Coast area has revealed that the iron sand from the Tor River estuary had the highest mass-specific magnetic susceptibility values with an χLF average of 3.083 ×10⁻⁵ m3/kg. We extracted the raw sand from the Tor River estuary using a mechanical magnetic extraction method and analyzed the magnetic properties and mineral composition. The magnetic susceptibility values increased significantly with an χLF average of 27.496 ×10⁻⁵ m3/kg. The chemical composition acquired from both the X-ray fluorescence and energy dispersive spectroscopy confirmed that the magnetic properties of the extracted sample originated from the high percentage of iron oxide. The hysteresis curve showed high saturation magnetization about 24.7 (emu/g), remanent magnetization of about 6.1 (emu/g) and a low coercive field of about 20 (Oe). The X-ray diffraction patterns identified a magnesioferrite (MgFe2O4) mineral structure. This result showed the novelty of iron sand from Sarmi, Papua when compared with that from Java Island.
1. Introduction
Indonesia, a geologically unique country, is well known to possess a large deposit of natural iron minerals; comprising primarily of iron ore, iron sand, and lateritic iron ore. The amount of iron sand resources in Indonesia, published in 2008, reached up to 160 million tons, having higher concentrations spread out along the South Java seashore [1]. This is reasonable, since a significant number of volcanoes lie in the island of Java. It is known that volcanic activity influences the distribution of iron through its liquid hydrothermal phase [2].
Studies on the magnetic properties of iron oxide sediment have been generally conducted to investigate the geological aspects of their formation and assess the environmental changes as well as to predict the source of pollutants [3,4,5]. However, the conventional use of iron sand in the cement industry, which has a low economic value, has driven researchers to study the magnetic properties of iron sand to produce higher valuable application [6,7,8]. A previous study on iron oxide nanoparticles synthesis based on iron sands also demonstrated a higher performance of these materials [9].
Several studies on iron sands from Java Island have been reported. The magnetic study of iron sand from Central Java revealed that magnetite is the predominant mineral, while other minerals such as hematite and ilmenite are also present [10]. Chemical reaction carried out on iron sand from the Southern Coast of Yogyakarta has resulted in ceramic permanent magnets [11] and magnetic nanoparticles [12]. Materials from Dlodo’s beach, Tulungagung, East Java were successfully synthesized as color pigments [13]. Recently, iron sands from Java have been synthesized as magnetite iron oxide nanoparticles using co-precipitation methods and have exhibited superparamagnetic behavior [14,15].
Peculiarly, the Geological Agency of Indonesia, Ministry for Energy and Mineral Resources in 2013 released information of the strategic minerals balance that 600 million tons of iron sand was presumed to be deposited in the Sarmi coast area, on the northern coast of Papua Province, Indonesia [16]. Although the northern coastline of Papua lies in the Pacific Ocean, which dispersed iron and manganese sediment [2], the existence of iron sand is still occasional, due to the absence of an active volcano in these areas. For the record, the eastern half of the island of Papua is the major land mass of Papua New Guinea, while the western half is referred to as the Papua Province, Indonesia, the areas discussed in this paper. Our preliminary study on the distribution of magnetic susceptibility of iron sand in the Sarmi coast area revealed that the site of the Tor River estuary had the highest magnetic susceptibility [17]. In this study, the magnetic properties together with the mineral composition and particle size of iron sand from the Tor River estuary will be discussed.
2. Materials and Methods
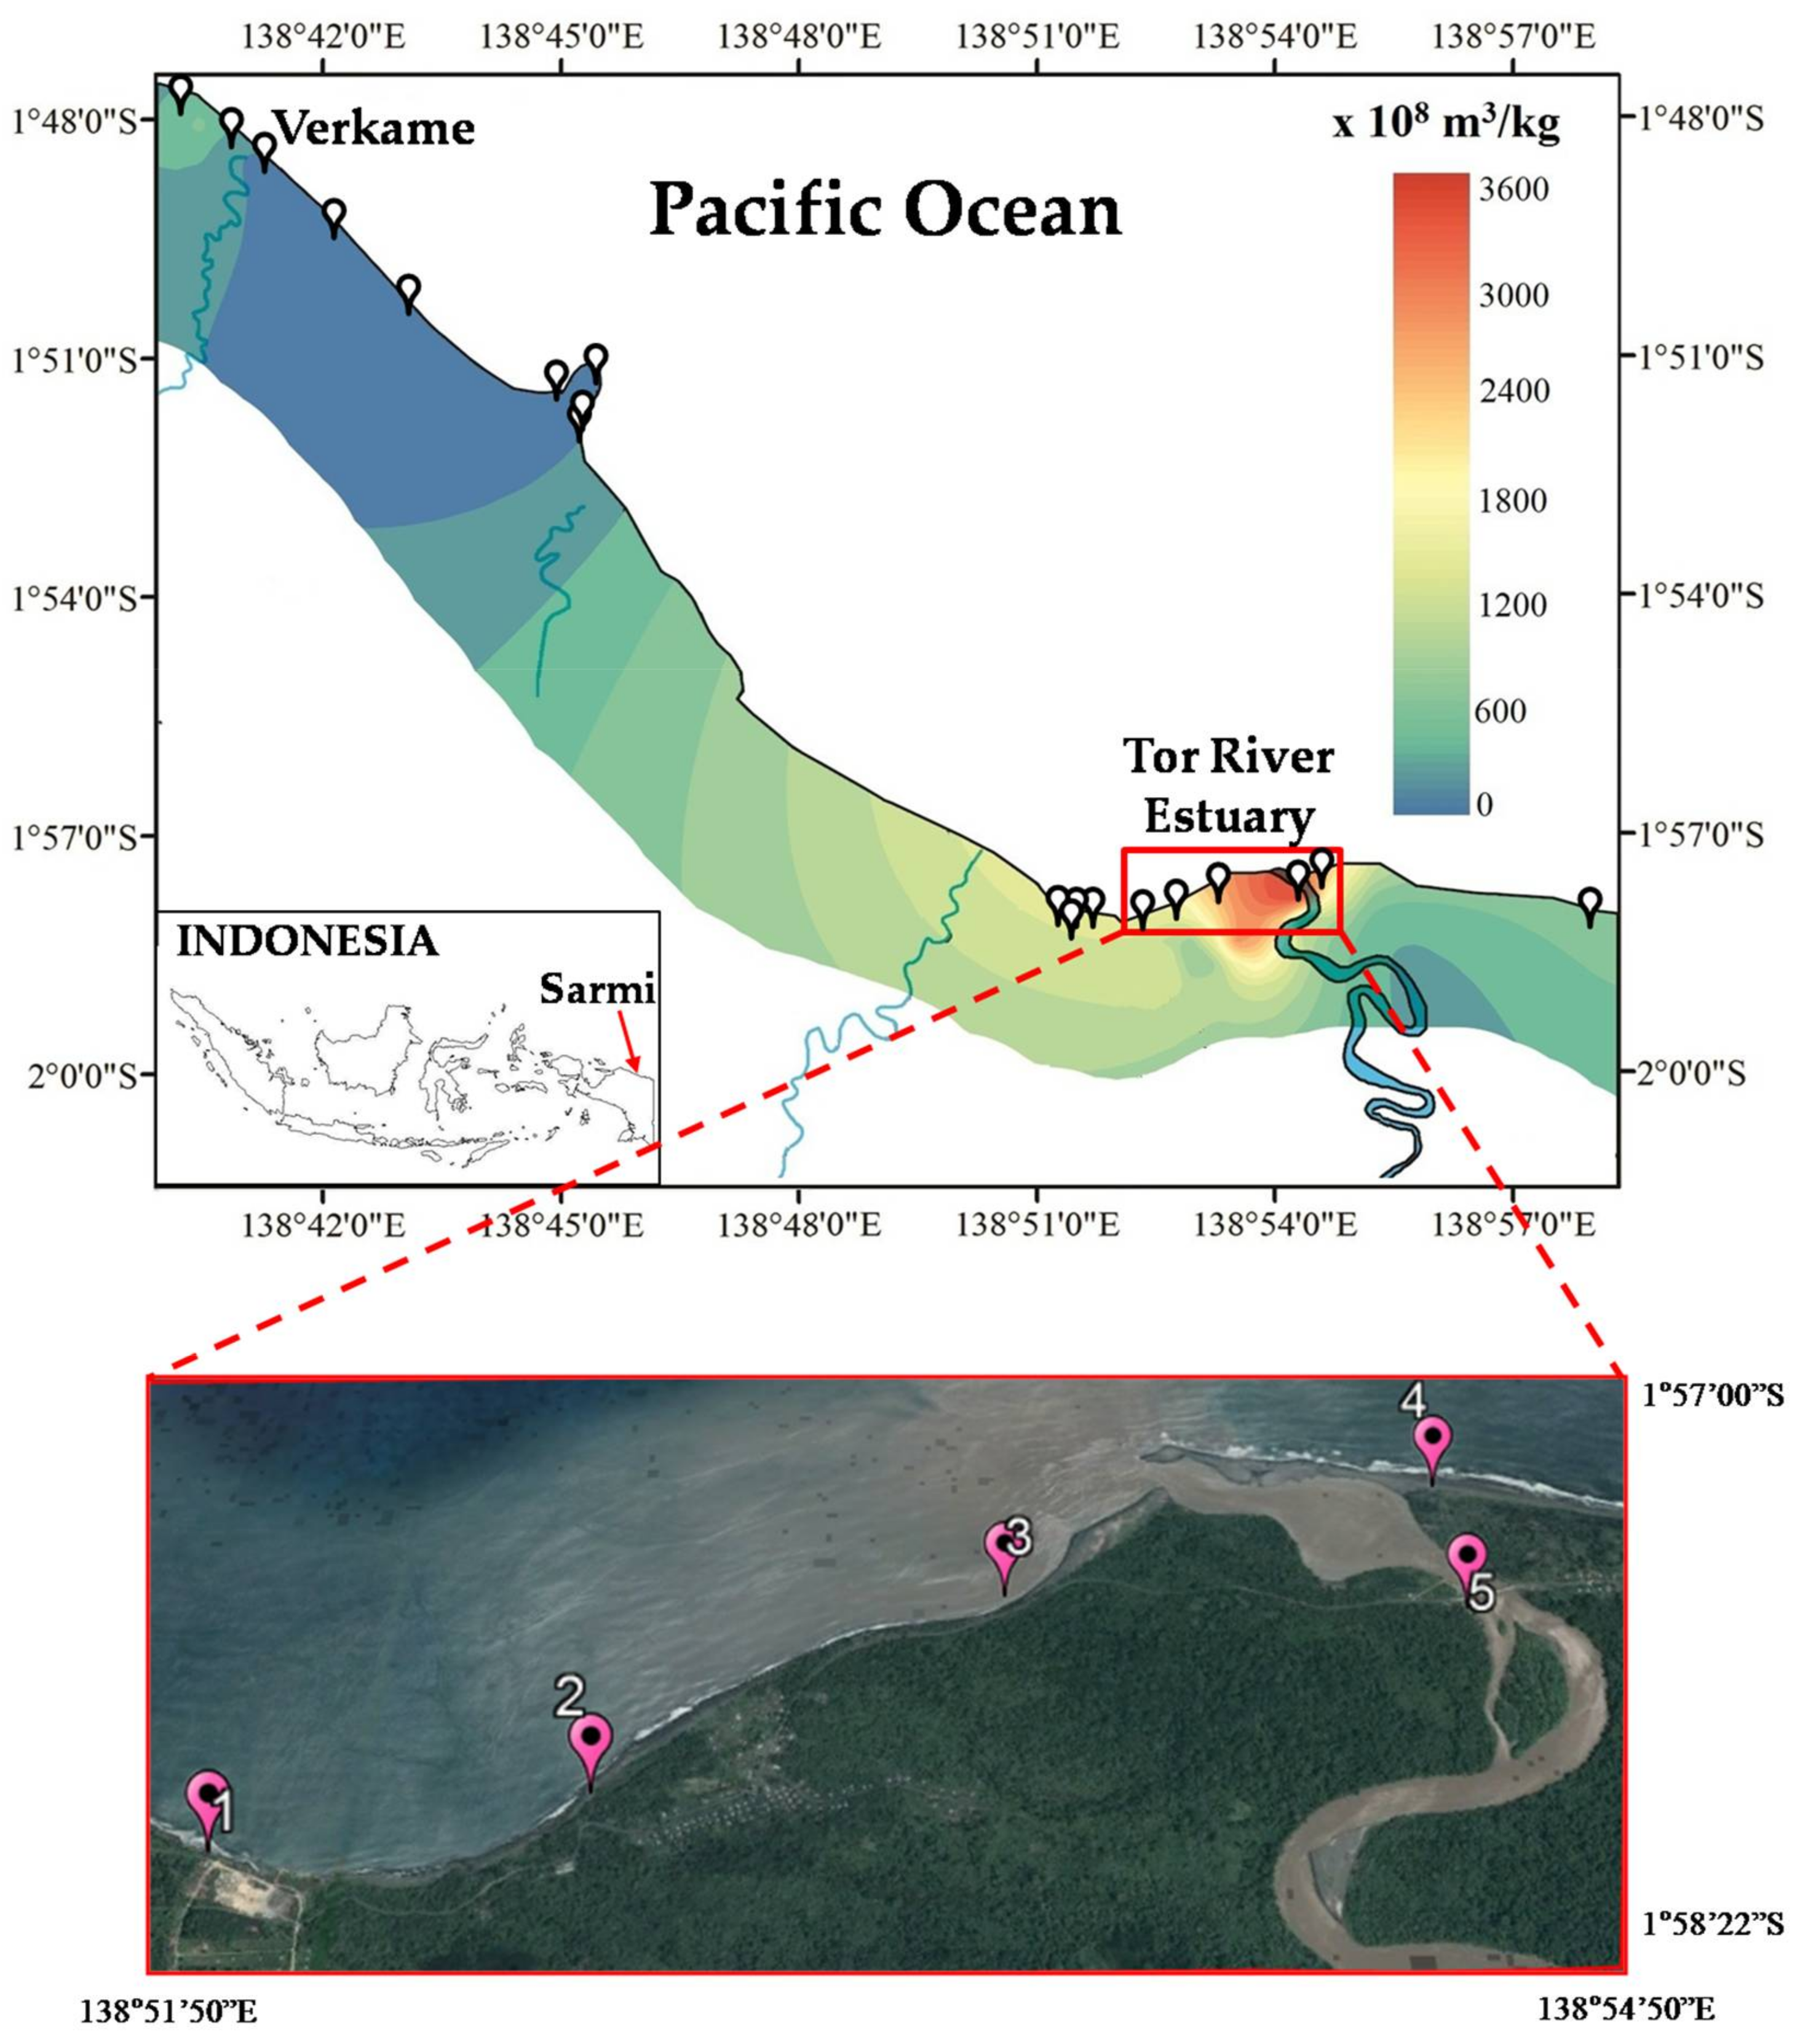
Our preliminary study was conducted in an area encompassing between the geographic positions of 1°47′52.30″S–138°40′27.60″E and 1°57′57.50″S–138°57′7.60″E and showed that the site of the Tor River estuary had the highest mass-specific magnetic susceptibility value, which varied from 3 × 10⁻⁵ to 4 × 10⁻⁵ m3/kg. The distribution map of the magnetic susceptibility of iron sand in the Sarmi shoreline is shown in Figure 1, and the details of this study is described elsewhere [17]. In this study, we focused on the Tor Rover estuary site as marked in the red box, with an area of about 12.5 km2.
The raw samples from the estuary site were collected from five points (marked as point numbers 1–5 in the red box, Figure 1), where each point had three samples taken. Hence, the raw samples were extracted using the mechanical magnetic extraction method. The extraction was carried out by removing the magnetic stirrer dipped in the solution every 5 min until no magnetic minerals could be drawn. The magnet used in the stirrer was a weak magnet so that only strong magnetic minerals could be extracted. The effectiveness of this method has been previously studied in [18]. The mass-specific magnetic susceptibility value of the extracted samples was once again measured using a Bartington MS2B magnetic susceptibility system (Bartington Instrument Ltd., Whitney, UK) with a dual-frequency sensor. The mass-specific magnetic susceptibility measured at low frequency (470 Hz) was termed χLF, while that at 4700 Hz was termed χHF. Parameter frequency-dependent magnetic susceptibility χFD (%) was calculated as 100% × (χLF − χHF)/χLF.
Hereafter, the best extracted sample with the highest mass-specific magnetic susceptibility values was chosen for further characterization. These samples originated from the estuary site points #2 and #3. The remanent magnetization (Mr), saturation magnetization, and coercivity (Hc) were characterized using a vibrating sample magnetometer (VSM) OXFORD 1.2 H machine (Oxford Instrument, Oxfordshire, UK) with an applied magnetic field between −10 kOe and 10 kOe. The chemical composition was calculated using Scan Quant X (SQX) software (Rigaku, Tokyo, Japan) using a Rigaku ZSX Primus II WDXRF spectrometer (Rigaku, Tokyo, Japan). The JEOL JSM-IT-300 scanning electron microscope (JEOL Ltd., Tokyo, Japan) with energy dispersive spectroscopy (SEM/EDS) was used to analyze the surface images of the extracted samples. The image measurement was obtained on the back-electron detector-shadow (BED-S) image mode at a 20-kV electron beam accelerating voltage within an 11-mm working distance to give the grain contrast imaging. The X-ray diffraction patterns were collected using a Shimadzu 7000 X-ray Diffractometer with Cu Kα radiation in the 2theta range of 15 to 65 degrees to study the crystal properties of the extracted samples.
3. Results
Table 1 lists the results of the mass-specific magnetic susceptibility measurements for the extracted samples when compared with the raw samples from the previous study [17]. The magnetic susceptibility values increased significantly after the mechanical magnetic extraction was applied. All samples showed a very small of average of χFD (%) values, less than 1%, suggesting negligible superparamagnetic grains [19].
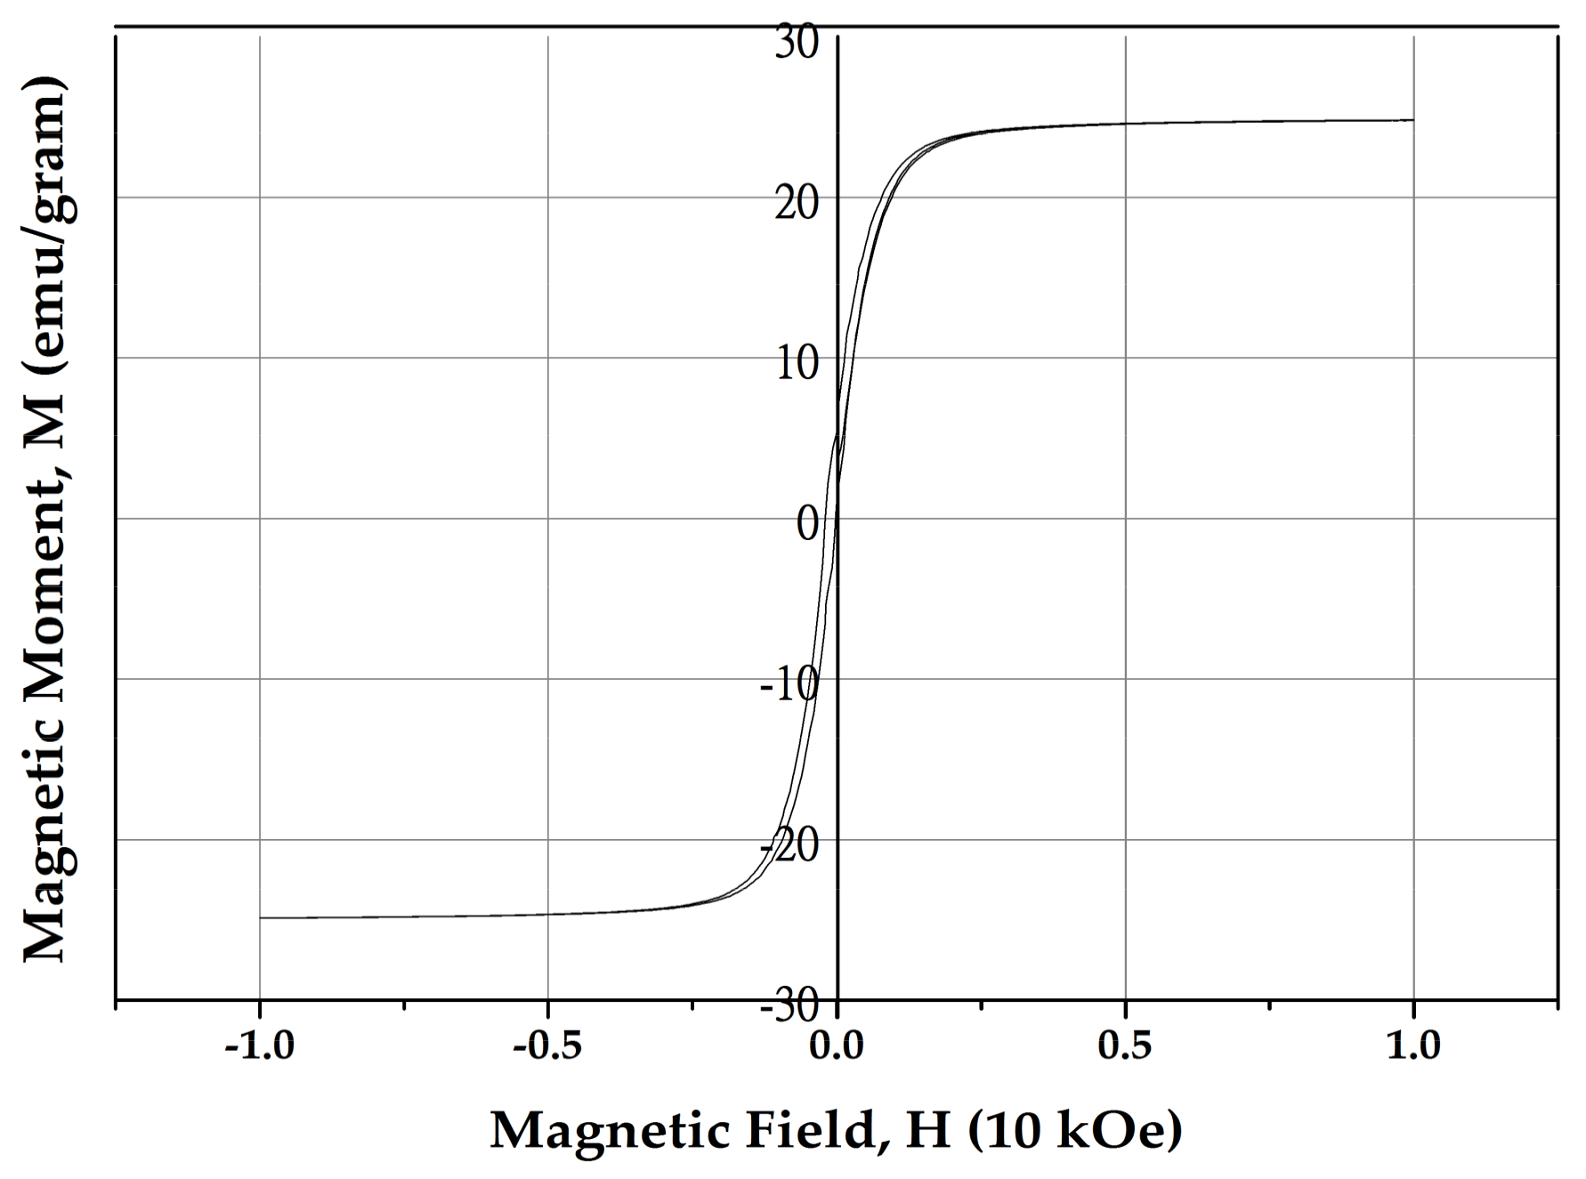
The hysteresis curve measured at room temperature of the extracted samples is shown in Figure 2. The curve showed hysteresis loop with high saturation magnetization about 24.7 (emu/g), remanent magnetization of about 6.1 (emu/g) and a low coercive field of about 20 (Oe).
Table 2 lists the geochemical composition of the extracted sample, which is aquired from X-ray fluorescence (XRF) analysis. Fe2O3 is the dominant oxide (54.4 wt %) whereas SiO2, Al2O3, CaO, TiO2, and MgO, occur in lesser amounts. The rest oxides have a mass ratio values smaller than 2%, where the data is not displayed.
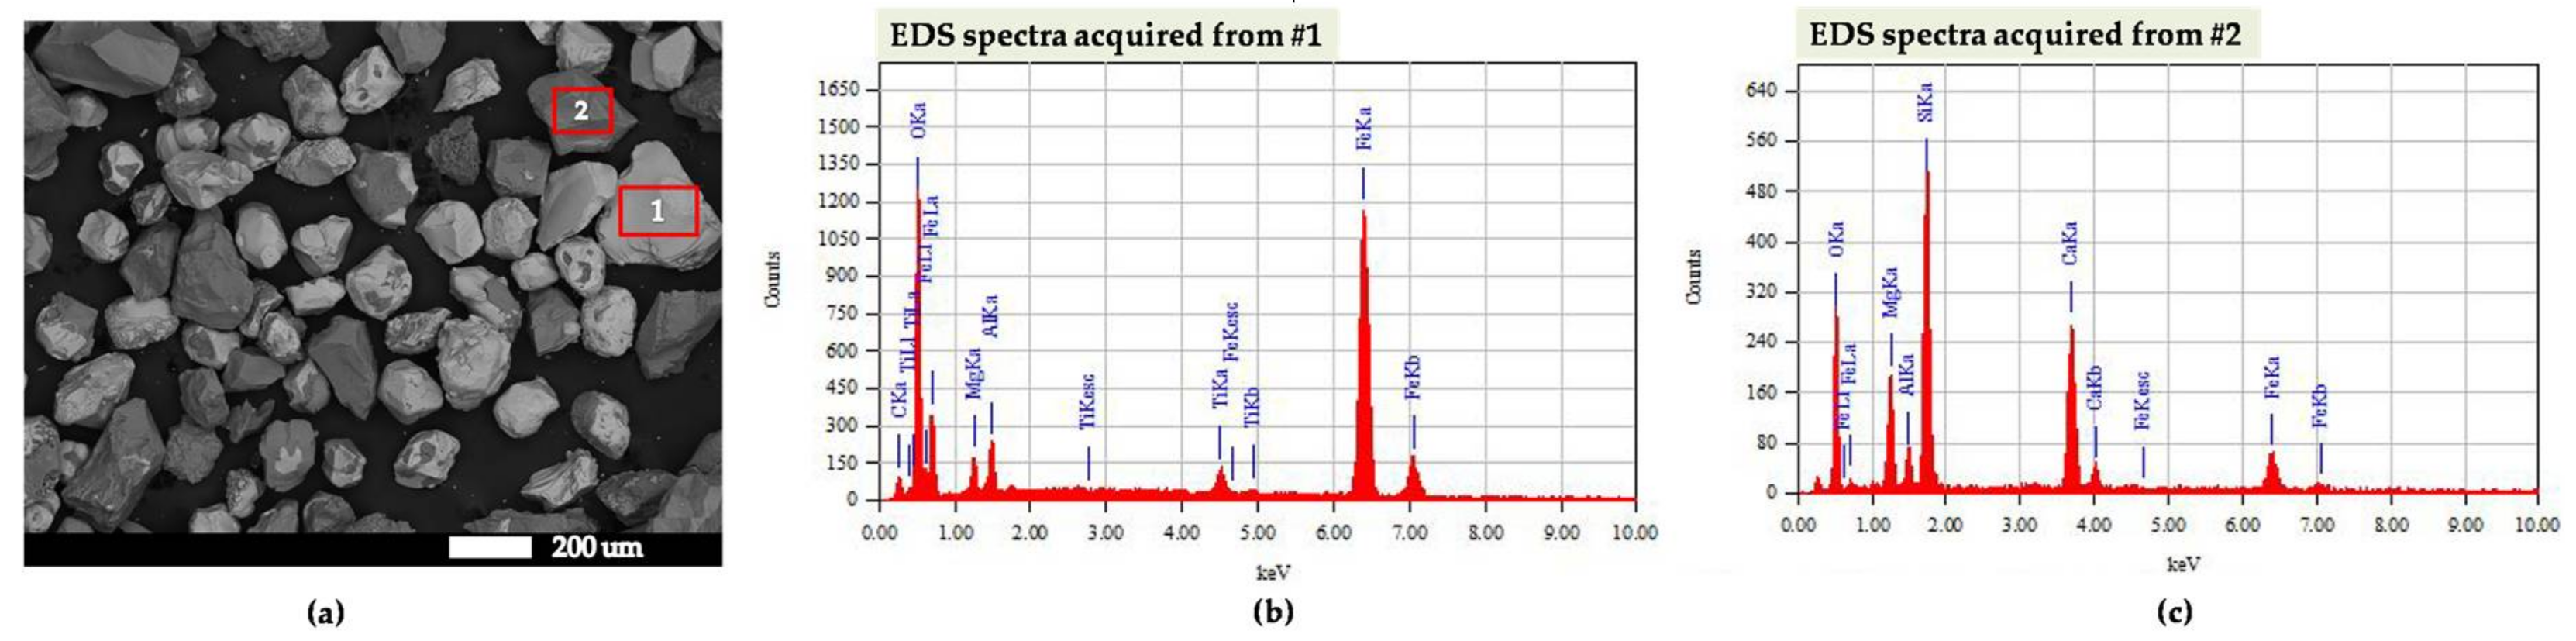
Figure 3a shows the scanning electron microscopy images of the extracted sample, obtained with the back-electron detector-shadow image mode, where it is shown that the particle sizes were about 150−200 um. A clear grain contrast image was shown from the surface, where the brighter particles dominated the darker particles. The brighter particles were represented by selected area #1, while the darker particles were by selected area #2. The acquired energy dispersive spectroscopy (EDS) spectra from the selected areas #1 and #2 correspond to the composition of magnesioferrite and aluminian-augite, respectively, which dominate our sample (Figure 3b,c).
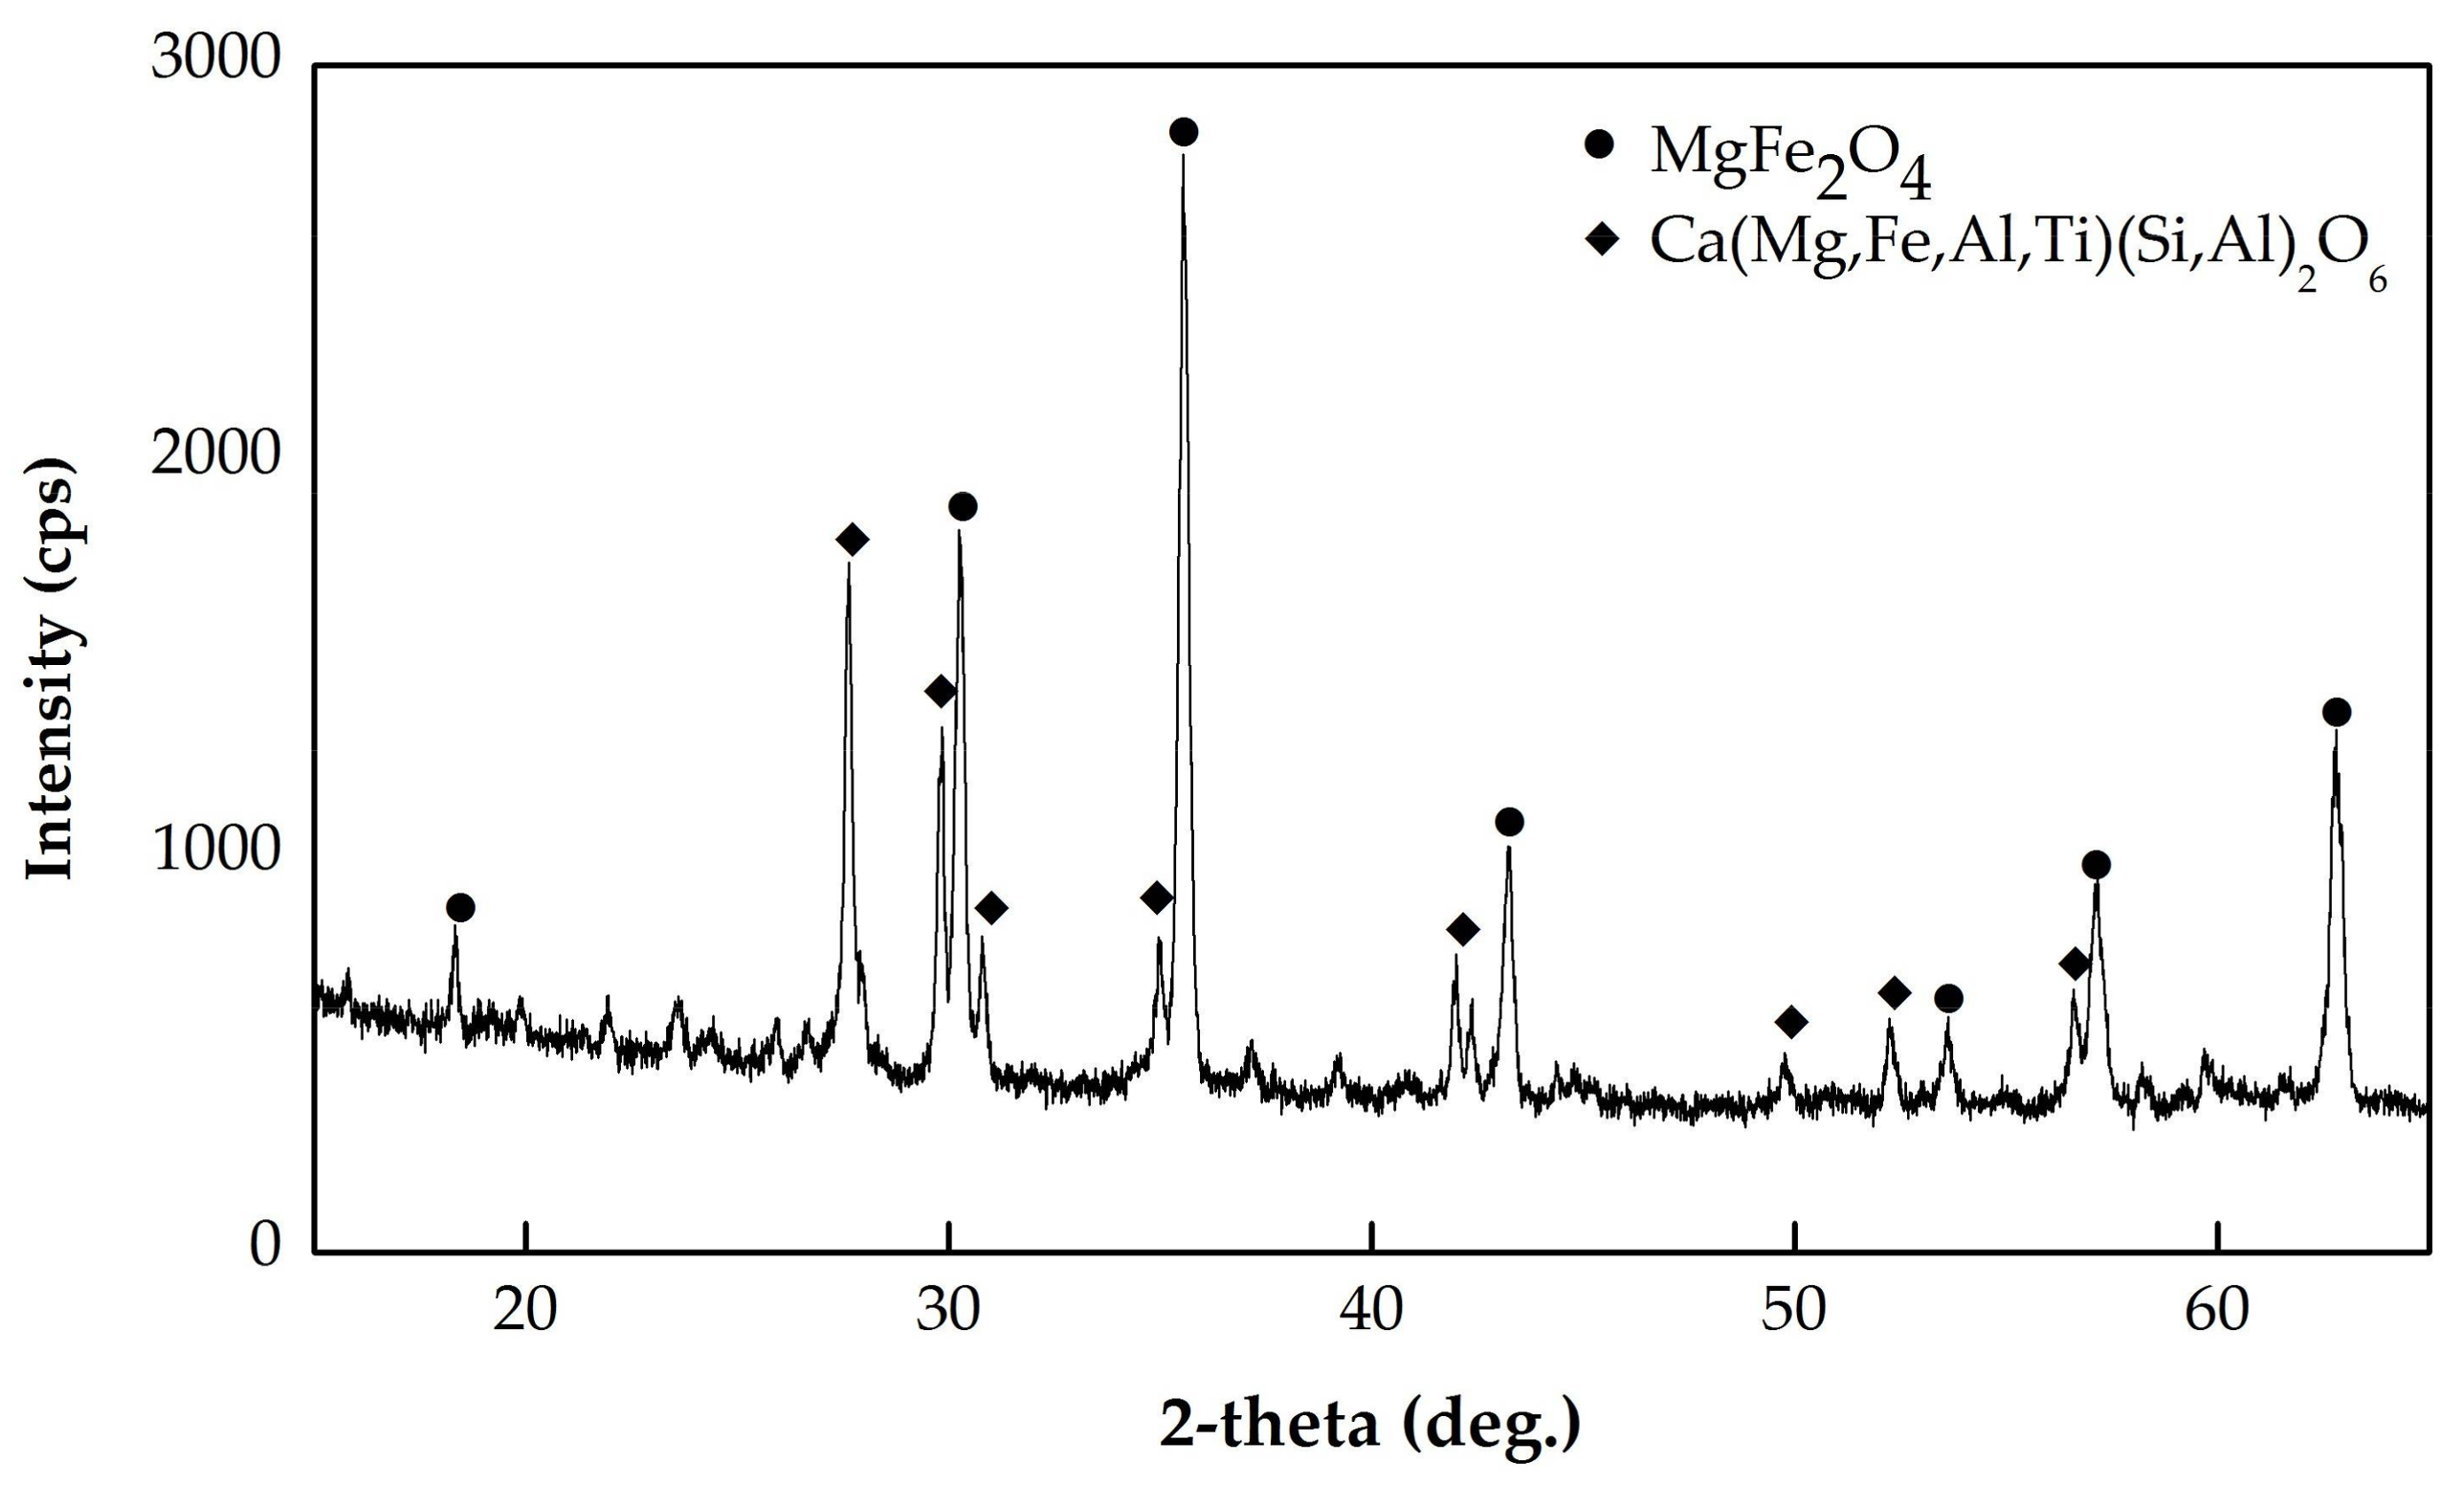
Figure 4 shows the X-ray diffraction (XRD) patterns of the extracted sample. The qualitative phase identification showed the typical pattern for magnesioferrite (MgFe2O4) according to the International Centre for Diffraction Data (ICDD# 00-017-0464), together with augite–aluminian minerals of Ca(Mg,Fe,Al,Ti)(Si,Al)2O6 (ICDD#00-041-1483).
4. Discussion
The magnetic distribution data notably showed that significant magnetic materials converged only in the Tor River estuary and not dispersed along the shoreline. Contrarily, the magnetic susceptibility of sand from the Verkame area was much lower than expected [16,17]. Therefore, the hypothesis that iron sand in the Sarmi coast area originated from Pacific Ocean deposits becomes inadequate. Importantly for the readers, Sarmi is one of the most rural areas in Indonesia, which has a very low population density and sterile from industry and agriculture. Hence, the possibility of anthropogenic pollution contributing to the magnetic properties may also be less possible.
The concentration of iron in the estuary area has been examined [20]. Indeed, the primary sources of estuarine sediments were rivers, offshore and littoral areas, and the shorelines of the estuaries. Sand brought into estuaries from the offshore and littoral material, which makes sand, is the predominant material exposed on ocean beaches [21]. For those reasons, the source of iron sand on the Sarmi coast area can be suspected to be derived from the Tor River. However, aware of the need for verification, study into the magnetic properties of the sediment along the Tor River is being conducted.
The XRF analyses confirmed that the magnetic properties of the extracted sample originated from the high percentage of iron oxide, while the SEM images and EDS spectra confirmed that the sample has two different minerals. The XRD patterns identified the two different minerals are magnesioferrite and augite–aluminian. Moreover, the magnetic properties of extracted iron sand from the Tor River estuary in Sarmi are comparable with the bulk MgFe2O4. The magnetic properties of bulk MgFe2O4 have been reported [22,23], with saturation magnetization value in the range of 15.23–43.4 emu/g. Magnesioferrite is a typical spinel material which has a high permeability and resistivity but low coercivity behavior [24]. However, when the particles size is nanometer, this material may have a higher saturation magnetization with a unique superparamagnetic behavior [23,24,25].
As discussed earlier, iron sands from Java Island are dominantly composed of a magnetite mineral, although hematite and ilmenite are also present in some areas [10,11,12,13]. The magnesioferrite (MgFe2O4) mineral were one of the novelty properties of iron sands from Sarmi, Papua. Although many synthesis approaches have been developed, the natural magnesioferrite (MgFe2O4) mineral has rarely been found. To the best of the author’s knowledge, it has been identified in soils from the Alto Paranaíba region, State of Minas Gerais, Brazil [26,27] and in Victorian Brown Coal Fly Ash from the Latrobe Valley, Australia [28]. Magnesioferrite is known to be an important magnetic oxide with a spinel structure, with a widespread application in microwave devices due to their low magnetic, dielectric losses and high resistivity. Therefore, the iron sand from Sarmi, Papua has a promising potential application in the future.
5. Conclusions
Unlike other regions in Indonesia, the magnesioferrite mineral was found in iron sands from the Tor River estuary in Sarmi, Papua. The iron sand had the typical magnetic properties of bulk MgFe2O4 with high saturation magnetization of 24.7 (emu/g) and a low coercive field of 20 (Oe). With the important and wide application of magnesioferrite, the iron sand from the Tor River estuary in Sarmi has promising potential application in the future. Further study on the magnetic properties of the sediment along the Tor River is needed to verify the origin and formation of the iron sand.
Acknowledgments
This research was fully funded by the Ministry of Research, Technology, and Higher Education of the Republic of Indonesia, through Post-Doctoral Research Grant 2017 (Contract Number: 01/UN20.2.2/PP/PD/2017).
Author Contributions
Octolia Togibasa and Satria Bijaksana conceived the experiments, analyzed the data and wrote the paper; Gesti Cita Novala performed the magnetic extraction experiments.
Conflicts of Interest
The authors declare no conflict of interest.
References
- Rochani, S.; Pramusanto, P.; Sariman, S.; Anugrah, R.I. The current status of iron minerals in Indonesia. Indones. Min. J. 2008, 11, 1–17. [Google Scholar]
- Skornyakova, I.S. Dispersed iron and manganese in Pacific Ocean sediments. Int. Geol. Rev. 1965, 7, 2161–2174. [Google Scholar] [CrossRef]
- Huliselan, E.K.; Bijaksana, S.; Srigutomo, W.; Kardena, E. Scanning electron microscopy and magnetic characterization of iron oxides in solid waste landfill leachate. J. Hazard. Mater. 2010, 179, 701–708. [Google Scholar] [CrossRef] [PubMed]
- Sudarningsih, S.; Bijaksana, S.; Ramdani, R.; Hafidz, A.; Pratama, A.; Widodo, W.; Iskandar, I.; Dahrin, D.; Fajar, S.J.; Santoso, N.A. Variations in the concentration of magnetic minerals and heavy metals in suspended sediments from Citarum river and its tributaries, West Java, Indonesia. Geosciences 2017, 7, 66. [Google Scholar] [CrossRef]
- Mariyanto; Bijaksana, S. Magnetic properties of Surabaya river sediments, East Java, Indonesia. AIP Conf. Proc. 2017, 1861. [Google Scholar] [CrossRef]
- Jamieson, E.; Jones, A.; Cooling, D.; Stockton, N. Magnetic separation of Red Sand to produce value. Miner. Eng. 2006, 19, 1603–1605. [Google Scholar] [CrossRef]
- Abdel-Karim, A.-A.M.; Barakat, M.G. Separation, upgrading, and mineralogy of placer magnetite in the black sands, northern coast of Egypt. Arab. J. Geosci. 2017, 10. [Google Scholar] [CrossRef]
- Tanii, H.; Inazumi, T.; Terashima, K. Mineralogical Study of Iron Sand with Different Metallurgical Characteristic to Smelting with Use of Japanese Classic Ironmaking Furnace “Tatara”. ISIJ Int. 2014, 54, 1044–1050. [Google Scholar] [CrossRef]
- Alkadasi, N.A.N. Synthesis of Fe3O4 nano particles from Ironstone from The Republic of Yemen. Orient. J. Chem. 2014, 30. [Google Scholar] [CrossRef]
- Yulianto, A.; Bijaksana, S.; Loeksmanto, W. Comparative Study on Magnetic Characterization of Iron Sand from Several Locations in Central Java. KFI 2003, 14, 63–168. [Google Scholar]
- Rusianto, T.; Wildan, M.W.; Abraha, K.; Kusmono. The potential of iron sand from the coast south of Bantul Yogyakarta as raw ceramic magnet materials. J. Teknol. 2012, 5, 62–69. [Google Scholar]
- Rusianto, T.; Wildan, M.W.; Abraha, K.; Kusmono, K. Iron sand as renewable resource for production magnetic nano particles materials. In Proceedings of the Engineering International Conference 2013, Semarang, Indonesia, 21 November 2013; Fathur, R., Ed.; Faculty of Engineering, Semarang State University: Semarang, Indonesia, 2013. [Google Scholar]
- Mufti, N.; Atma, T.; Fuad, A.; Sutadji, E. Synthesis and characterization of black, red and yellow nanoparticles pigments from the iron sand. AIP Conf. Proc. 2014, 1617. [Google Scholar] [CrossRef]
- Sunaryono, S.; Taufiq, A.; Mashuri, M.; Pratapa, S.; Zainuri, M. Various magnetic properties of magnetite nanoparticles synthesized from iron-sands by co-precipitation method at room temperature. Mater. Sci. Forum. 2015, 827, 229–234. [Google Scholar] [CrossRef]
- Rahmawati, R.; Taufiq, A.; Sunaryono, S.; Fuad, A.; Yuliarto, B.; Suyatman, S.; Kurniadi, D. Synthesis of magnetite (Fe3O4) nanoparticles from iron sands by coprecipitation-ultrasonic irradiation methods. J. Mater. Environ. Sci. 2018, 9, 155–160. [Google Scholar]
- Geological Agency of Indonesia—Information of Strategic Minerals Balance in Sarmi Regency. (In Bahasa: Pusat Sumber Daya Geologi: Informasi Neraca Komoditi Logam di Kabupaten/Kota Sarmi). Available online: http://webmap.psdg.bgl.esdm.go.id/geosain/neraca-content.php?kabupaten=Sarmi (accessed on 13 April 2016).
- Togibasa, O.; Akbar, M.; Pratama, A.; Bijaksana, S. Distribution of magnetic susceptibility of natural iron sand in Sarmi Coast area. IOP J. Phys. Conf. Ser. 2018, in press. [Google Scholar]
- Novala, G.C.; Sudarningsih; Kirana, K.H.; Fajar, S.J.; Mariyanto; Bijaksana, S. Testing the effectiveness of mechanical magnetic extraction in riverine and lacustrine sediments. IOP J. Phys. Conf. Ser. 2018, in press. [Google Scholar]
- Kanu, M.O.; Meludu, O.C.; Oniku, S.A. Measurement of Magnetic Susceptibility of Soils in Jalingo, N-E Nigeria: A Case Study of the Jalingo Mechanic Village. World Appl. Sci. J. 2013, 24, 178–187. [Google Scholar]
- Eisma, D. Dissolved iron in the Rhine estuary and the adjacent North Sea. Neth. J. Sea Res. 1975, 9, 222–230. [Google Scholar] [CrossRef]
- Meade, R.H. Transport and Deposition of Sediments. In Estuaries Environmental Framework of Coastal Plain Estuaries; Nelson, B.W., Ed.; Geological Society of America: Boulder, CO, USA, 1972; Volume 133, pp. 91–120. [Google Scholar]
- Chen, D.; Zhang, Y.; Tu, C. Preparation of high saturation magnetic MgFe2O4 nanoparticles by microwave-assisted ball milling. Mater. Lett. 2012, 82, 10–12. [Google Scholar] [CrossRef]
- Šepelák, V.; Baabe, D.; Mienert, D.; Litterst, F.J.; Becker, K.D. Enhanced magnetization in nanocrystalline high-energy milled MgFe2O4. Scr. Mater. 2003, 48, 961–966. [Google Scholar] [CrossRef]
- Setiadi, E.A.; Simbolon, S.; Saputra, A.S.P.; Marlianto, E.; Djuhana; Kurniawan, C.; Yunus, M.; Sebayang, P. Synthesized of PEG-6000 coated MgFe2O4 nanoparticles based on natural iron sand by co-precipitation method. IOP Conf. Ser. Mater. Sci. Eng. 2018, 309. [Google Scholar] [CrossRef]
- Franco, A., Jr.; Silva, M.S. High temperature magnetic properties of magnesium ferrite nanoparticles. J. Appl. Phys. 2011, 109. [Google Scholar] [CrossRef]
- Silva, F.D.; Costa Couceiro, P.R.; Fabris, J.D.; Goulart, A.T.; Ker, J.C. Magnesioferrite and pedogenetic transformation pathway of magnetic iron oxides in two soil profiles developing on tuffite of the Alto Paranaíba Region, State of Minas Gerais, Brazil. Rev. Bras. Cienc. Solo 2005, 29, 763–775. [Google Scholar] [CrossRef]
- Silva, F.D.; Goulart, A.T.; Costa Couceiro, P.R.; Fabris, J.D. Chemical and mineralogical mechanisms related to the transformation of magnesioferrite, in a soil forming on tuffite in Alto Paranaíba, MG. Quim. Nova 2009, 32, 1850–1855. [Google Scholar] [CrossRef]
- Choo, T.K.; Cashion, J.; Selomulya, C.; Zhang, L. Reductive leaching of iron and magnesium out of magnesioferrite from Victorian Brown Coal fly ash. Energy Fuels 2016, 30, 1162–1170. [Google Scholar] [CrossRef]
Figure 1.
Map of distribution of mass-specific magnetic susceptibility value of iron sand along the Sarmi shoreline. The red box shows the Tor Rover estuary site. The inset shows the map of Indonesia with an arrow showing Sarmi location.
Figure 1.
Map of distribution of mass-specific magnetic susceptibility value of iron sand along the Sarmi shoreline. The red box shows the Tor Rover estuary site. The inset shows the map of Indonesia with an arrow showing Sarmi location.

Figure 2.
Magnetic hysteresis curve of the extracted sample measured at room temperature.

Figure 3.
(a) Scanning electron microscopy images of the extracted sample obtained with the back-electron detector-shadow image mode; (b) energy dispersive spectroscopy spectra acquired from selected area #1; (c) energy dispersive spectroscopy spectra acquired from selected area #2.
Figure 3.
(a) Scanning electron microscopy images of the extracted sample obtained with the back-electron detector-shadow image mode; (b) energy dispersive spectroscopy spectra acquired from selected area #1; (c) energy dispersive spectroscopy spectra acquired from selected area #2.

Figure 4.
X-ray diffraction patterns of the extracted sample.

Table 1.
Magnetic susceptibility of the extracted samples compared with the raw samples.
| Samples | Average χLF (×10−5 m3/kg) | Average χHF (×10−5 m3/kg) | χFD (%) |
|---|---|---|---|
| (a) extracted samples | 27.496 ± 0.003 | 27.199 ± 0.003 | 0.7 ± 0.2 |
| (b) raw samples | 3.083 ± 0.001 | 3.082 ± 0.002 | 0.6 ± 0.4 |
χLF: magnetic susceptibility at low frequency; χHF: magnetic susceptibility at high frequency; χFD: frequency dependent magnetic susceptibility.
Table 2.
Chemical composition of the extracted sample aquired from X-ray fluorescence.
| Oxide | Composition |
|---|---|
| Fe2O3 | 54.4% |
| SiO2 | 21.6% |
| Al2O3 | 6.34% |
| CaO | 6.10% |
| TiO2 | 4.27% |
| MgO | 2.79% |
© 2018 by the authors. Licensee MDPI, Basel, Switzerland. This article is an open access article distributed under the terms and conditions of the Creative Commons Attribution (CC BY) license (http://creativecommons.org/licenses/by/4.0/).
Share and Cite
MDPI and ACS Style
Togibasa, O.; Bijaksana, S.; Novala, G.C. Magnetic Properties of Iron Sand from the Tor River Estuary, Sarmi, Papua. Geosciences 2018, 8, 113. https://doi.org/10.3390/geosciences8040113
AMA Style
Togibasa O, Bijaksana S, Novala GC. Magnetic Properties of Iron Sand from the Tor River Estuary, Sarmi, Papua. Geosciences. 2018; 8(4):113. https://doi.org/10.3390/geosciences8040113
Chicago/Turabian StyleTogibasa, Octolia, Satria Bijaksana, and Gesti Cita Novala. 2018. "Magnetic Properties of Iron Sand from the Tor River Estuary, Sarmi, Papua" Geosciences 8, no. 4: 113. https://doi.org/10.3390/geosciences8040113
Note that from the first issue of 2016, this journal uses article numbers instead of page numbers. See further details here.