2.1. Geology of the Research Area
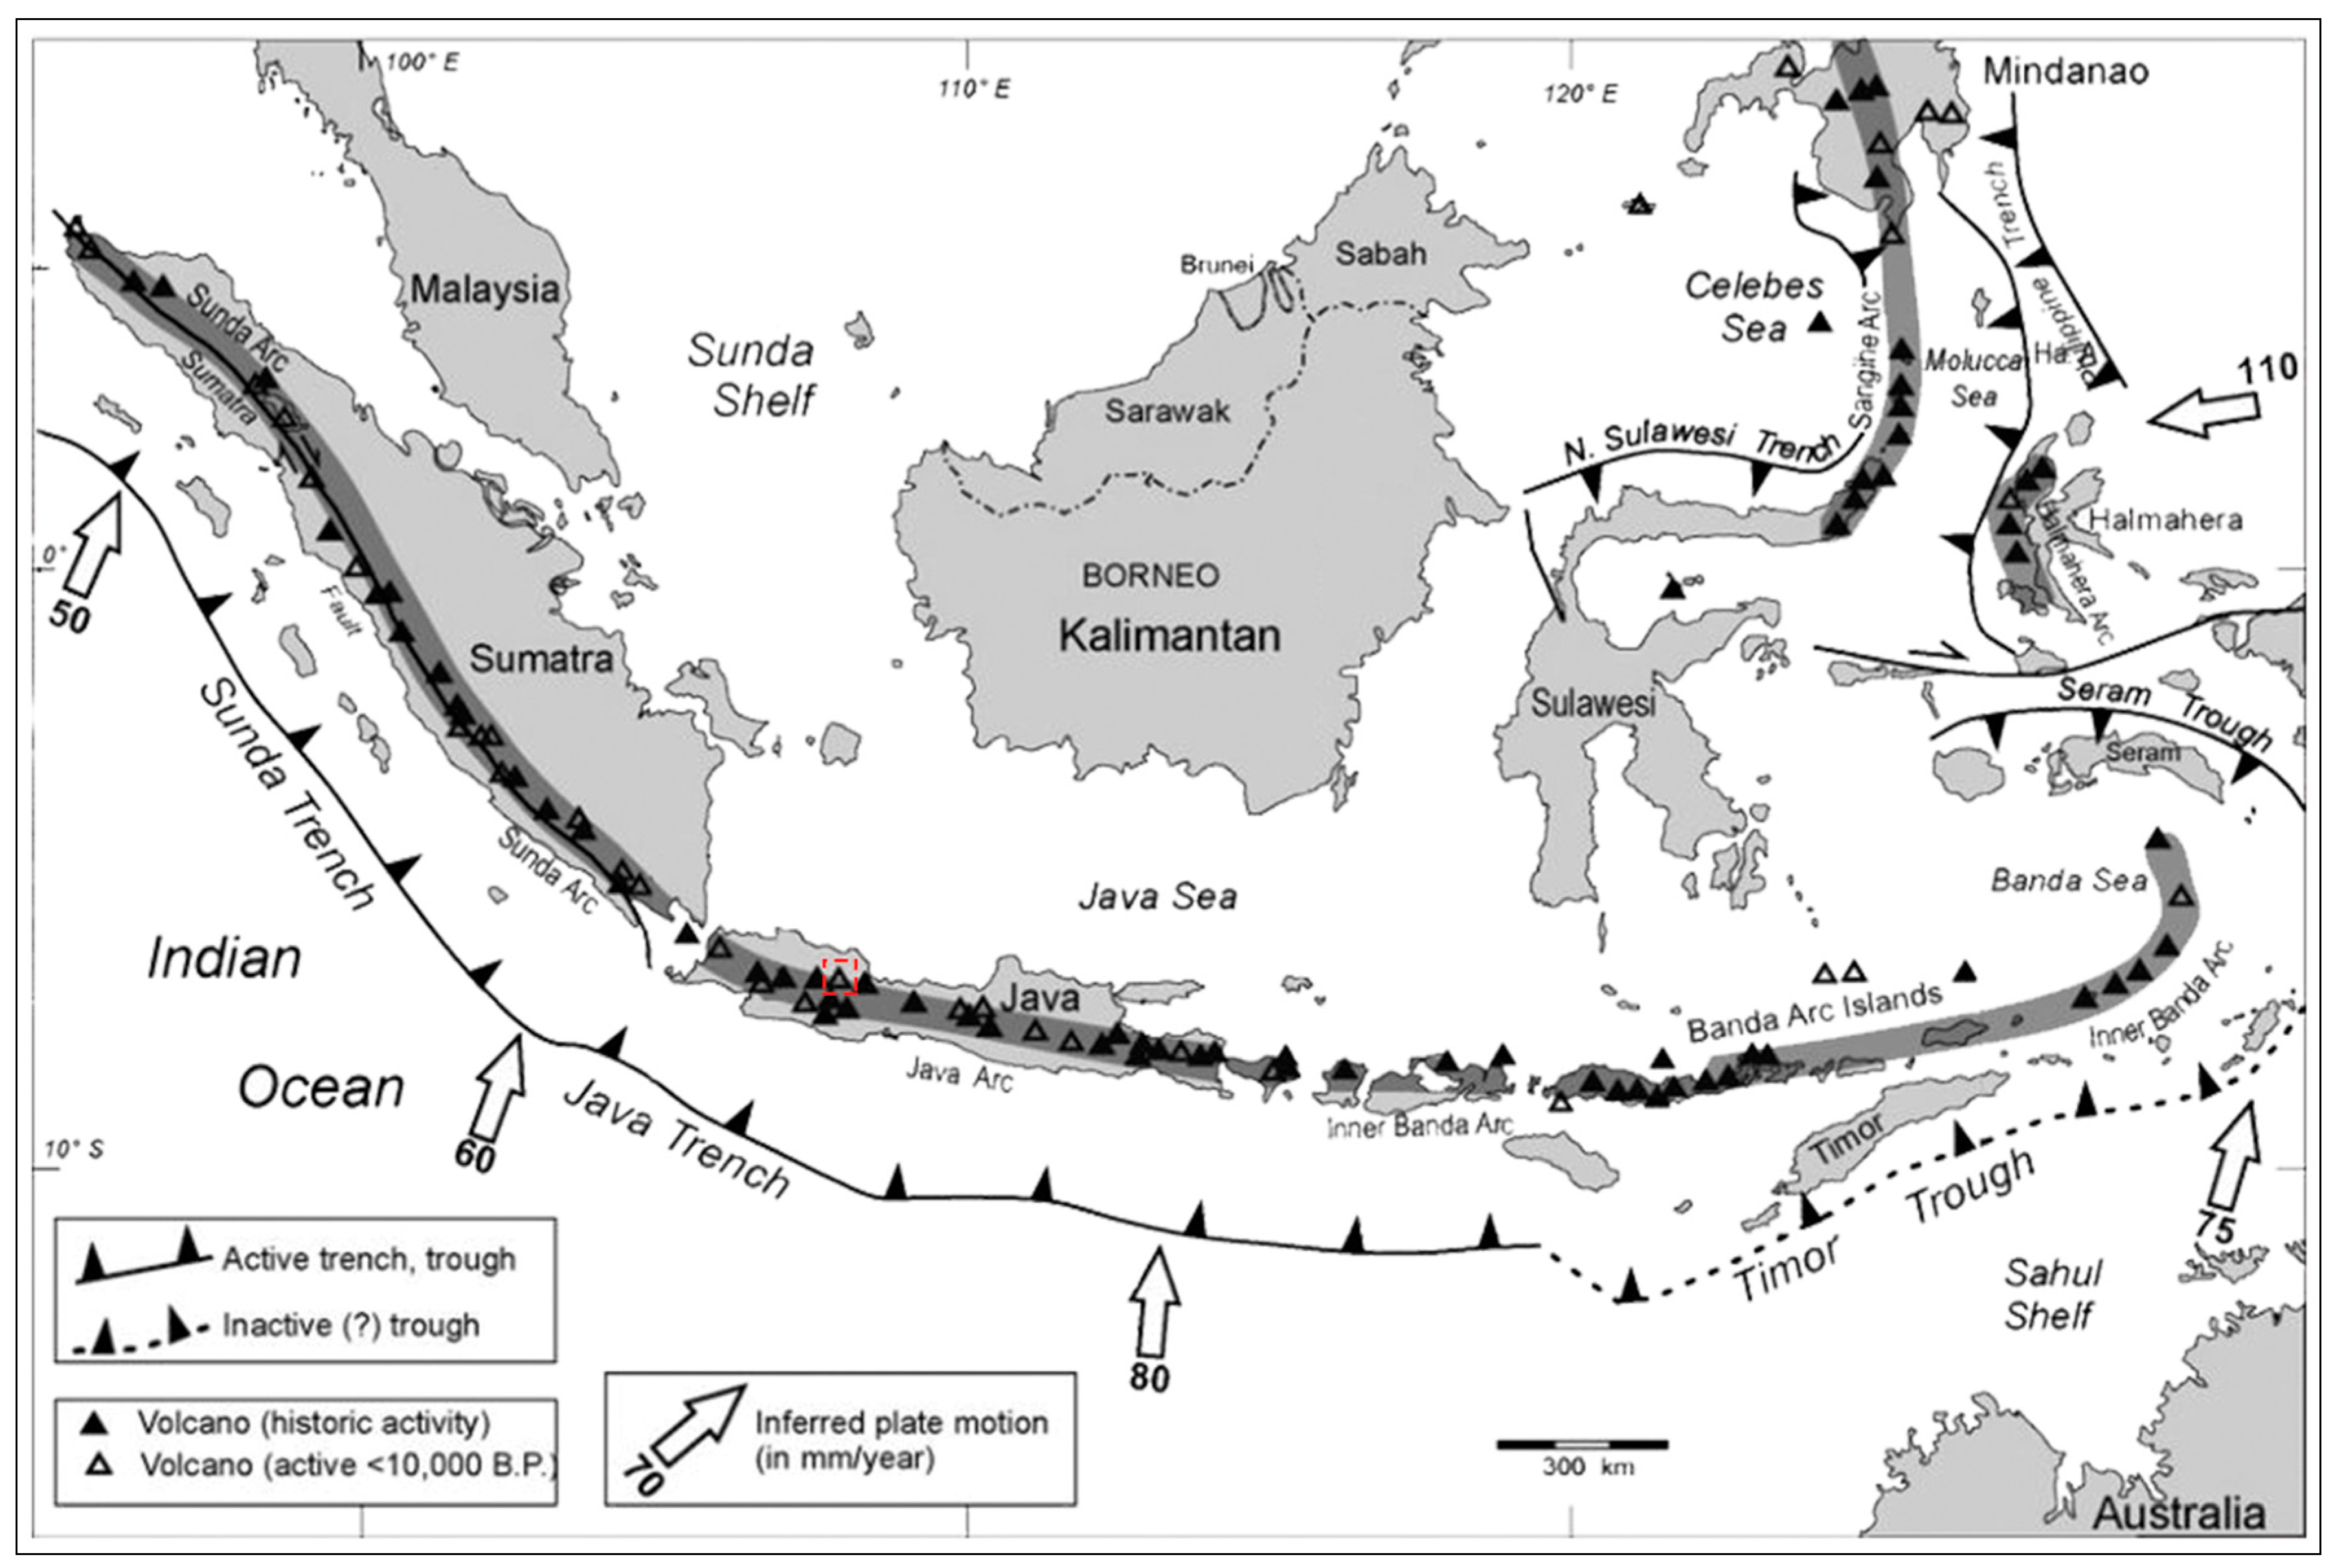
West Java has been recognized to have many Quaternary volcanoes, both active and dormant, associated with volcanic lines produced by the subduction activity of the Indian-Australian plates beneath the Eurasia continental plates [
9,
10,
11] (
Figure 1). These volcanic products are controlled by regional structures that provide conduits for magma to ascend into the shallower zone of crust. Furthermore, the regional structures provide secondary permeability for the hydrothermal fluid pathway and for the meteoric water to migrate, interact and accumulate in the geothermal reservoir [
11].
The Tampomas Volcano in West Java Province is associated with Quaternary volcanism along an active margin tectonic system [
12]. This small dormant stratovolcano, with peak at 1685 m above sea level, has no record of historic eruptions since the Dutch colonization of Indonesia. It is categorized as a type C volcano, but does not have fumarolic fields [
9]. Reconnaissance surveys have been done by the Volcanological Survey of Indonesia (VSI) and Pertamina at the beginning of the 1980s, but it was not considered attractive for exploration drilling. This is probably because there is no manifestation of a high temperature system present at Tampomas Volcano, such as fumaroles, solfataras, boiling springs, hot-warm ground and steam vents.
Unlike other high-terrain geothermal systems located in Indonesia, which generally have a high temperature system, the Tampomas Volcano is categorized into an “intermediate temperature system over volcanic-arc” based on the presence of the manifestation type, which was only hot/warm springs [
13]. The intermediate temperature of the Tampomas system is contrary to the geothermal system present in West Java, which has a high temperature of more than 225 °C [
13]. The fumaroles discharged at the peak have ceased long ago, as reported from geochemical research by the Volcanological Survey of Indonesia (VSI) in 1983 [
14]. This intermediate temperature of around 150–200 °C also has been confirmed from previous research [
14,
15,
16]. There are several aspects that control the hydrogeochemical composition of water at the Tampomas Volcano: (1) deep fluid discharging product at Tampomas, (2) high rainfall intensity at tropical regions and (3) geological features, such as a permeable fault, that act as conduits for ascending geothermal fluids.
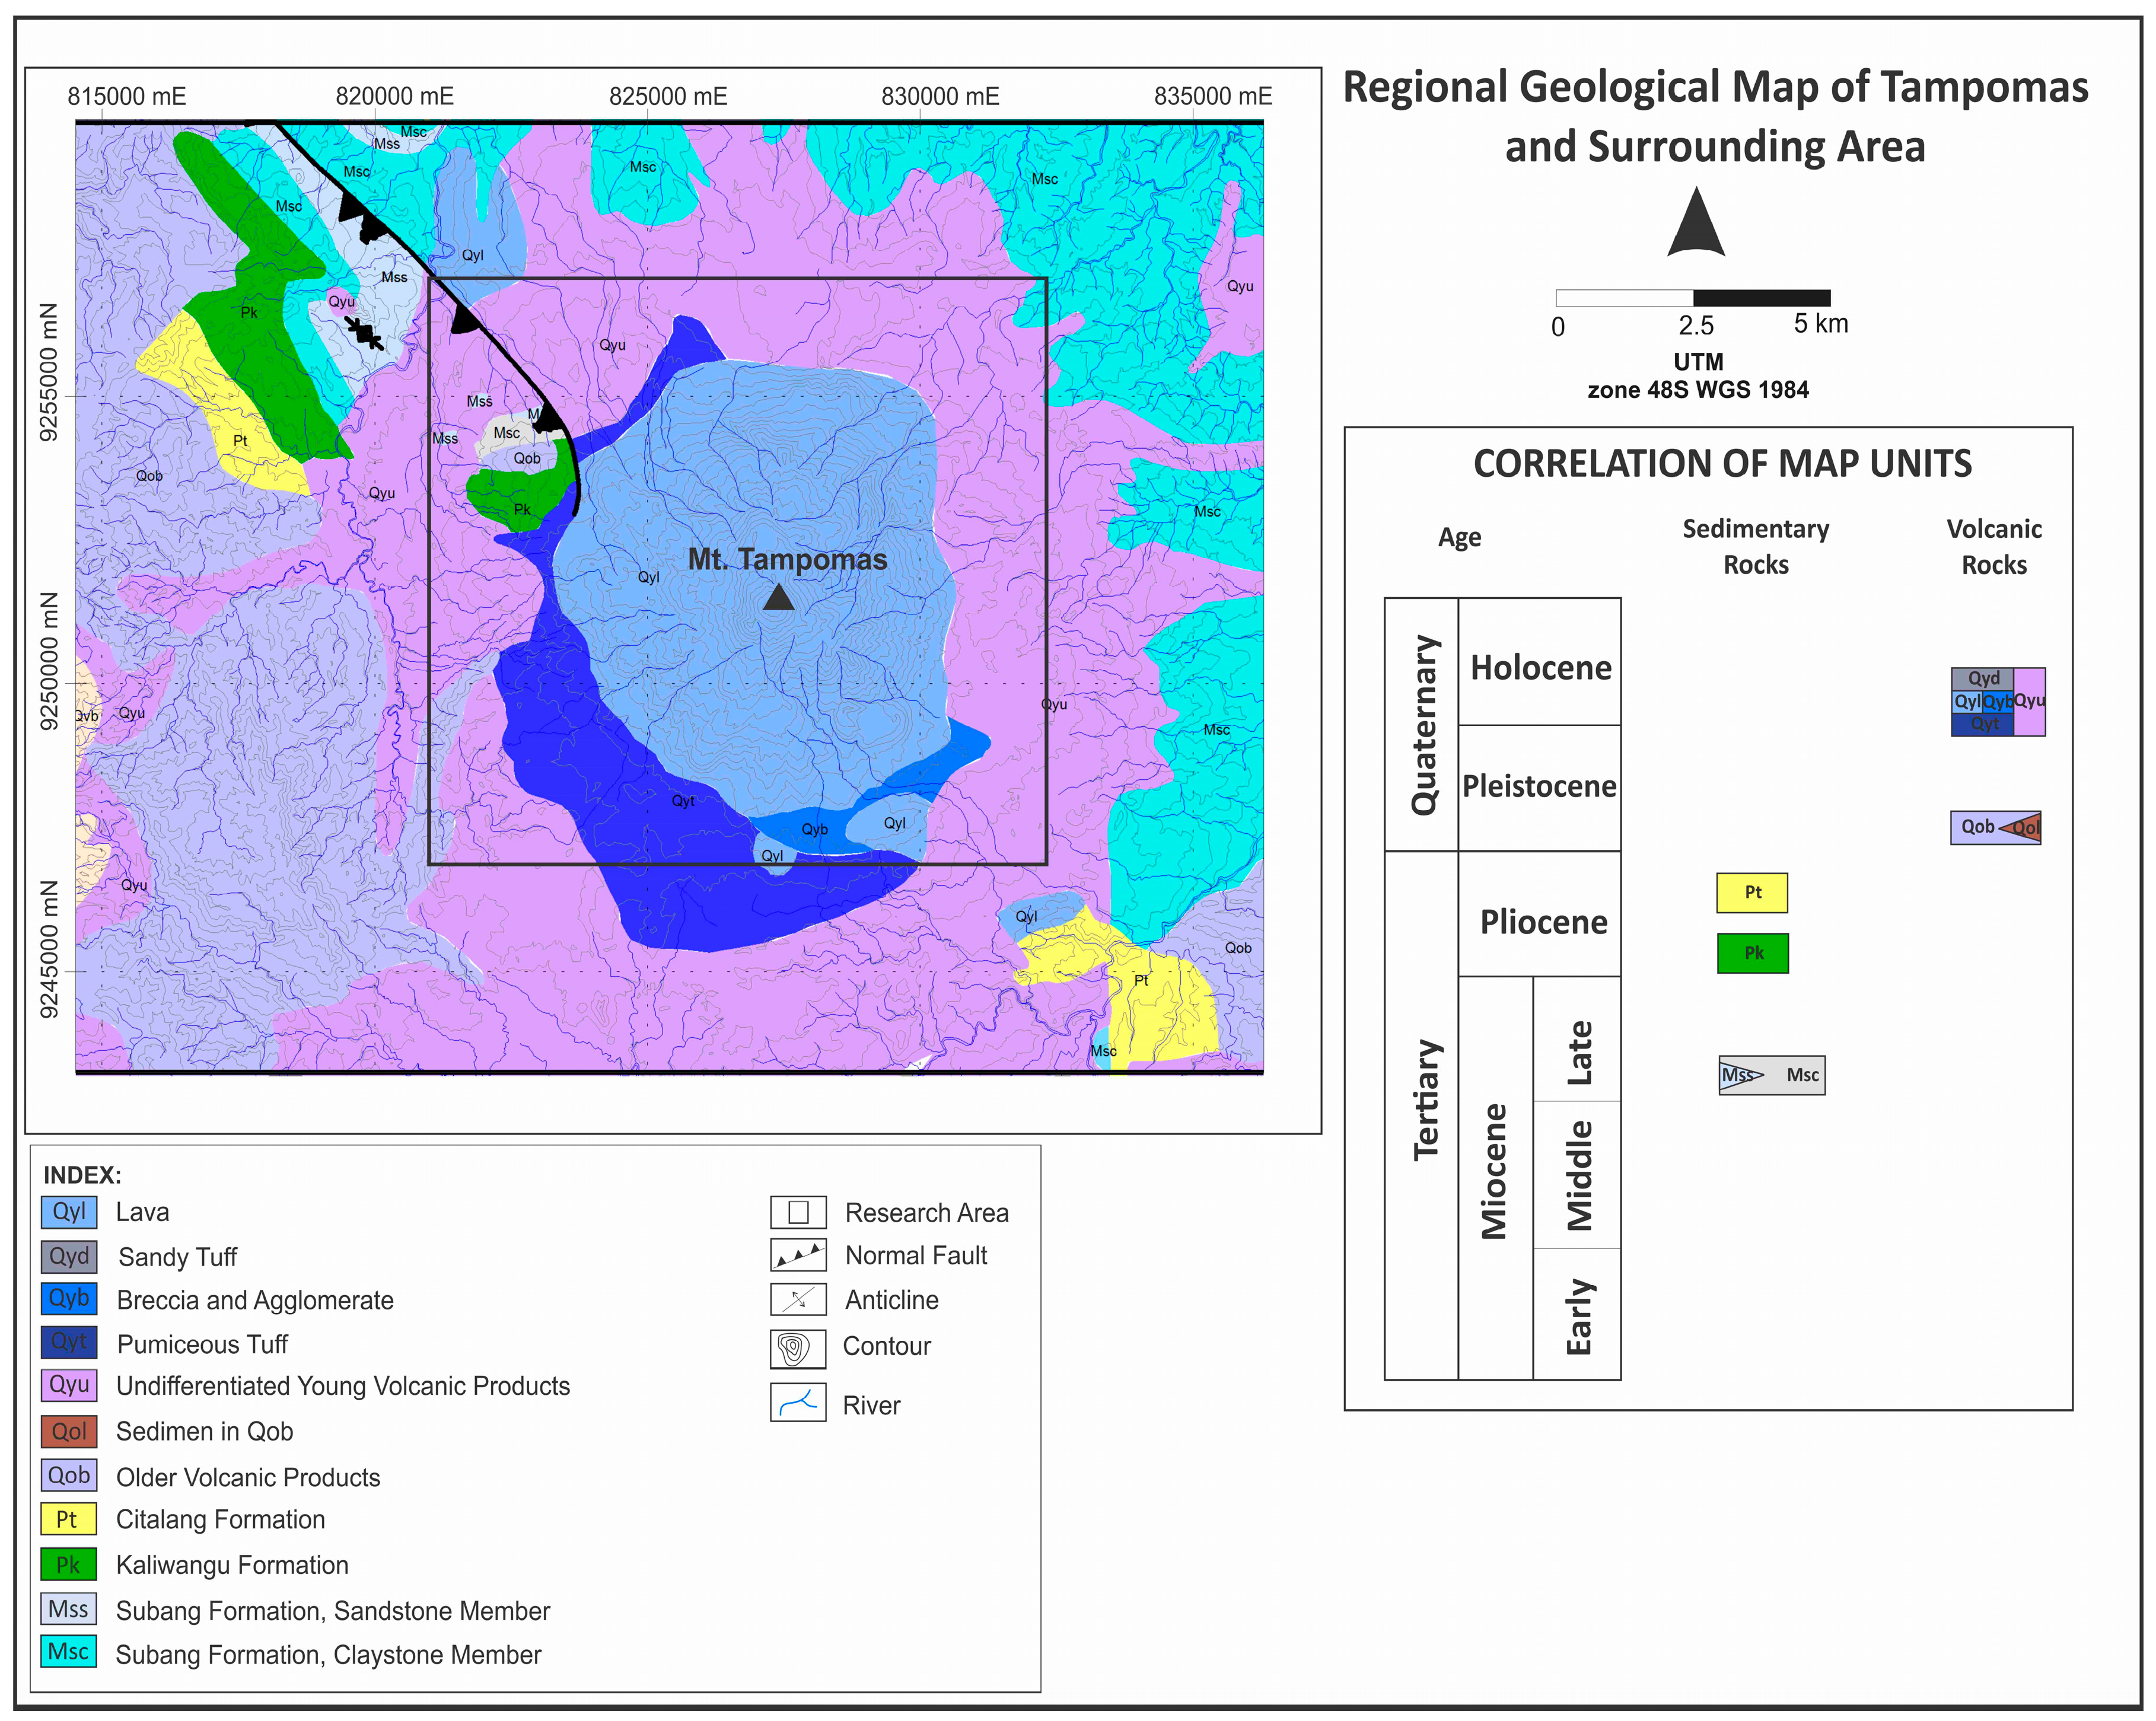
Physiographically, the Tampomas Volcano is located at the northern part of the West Java Basin, which is composed by Tertiary sedimentary clastic rocks [
10]. These Tertiary sedimentary rocks have experienced a tectonic event and have folded and faulted along with volcanic activities during the age of the Plio-Pleistocene. This is believed to control the movement of Tampomas Volcano’s magma [
17]. Regionally, the Tampomas area is comprised of six stratigraphic units (
Figure 2), which are discussed from the oldest to youngest based on [
17]. (1) The Subang Formation consists of two subdivisions: the claystone formation and sandstone formation [
18]; another is the (2) Kaliwangu Formation, which is composed of tuffaceous sandstone, conglomerate and, rarely, limestone and claystone; (3) the Citalang Formation is composed of tuffaceous marl intercalated by tuffaceous sandstone, breccia and conglomerate; (4) old volcanic product and igneous rocks are other formations, which are mainly composed of volcanic breccia, lahar and lava; the igneous rocks are composed of both andesite and basalt; (5) young volcanic product is composed of tuffaceous sand, lapilli, lava, agglomerate and pumiceous tuff distributed at the west and southwest parts of Tampomas; (6) the last formation, alluvium, is clay, silt, sand and gravel mainly deposited in the Holocene streams.
Prior research has been conducted to investigate the geological condition of the Tampomas Volcano. The result shows that volcanic activity at the Tampomas Volcano started during the Plio-Pleistocene, which was followed by a regional fault in West Java [
17] (
Figure 2). The geothermal system of the Tampomas Volcano was formed during active tectonic activity in the Middle Pleistocene, which produced pumiceous breccia (most likely from the latest Tampomas eruption). It was stated that the geothermal fluid could interact with the Tertiary sediment of the Subang Formation [
17].
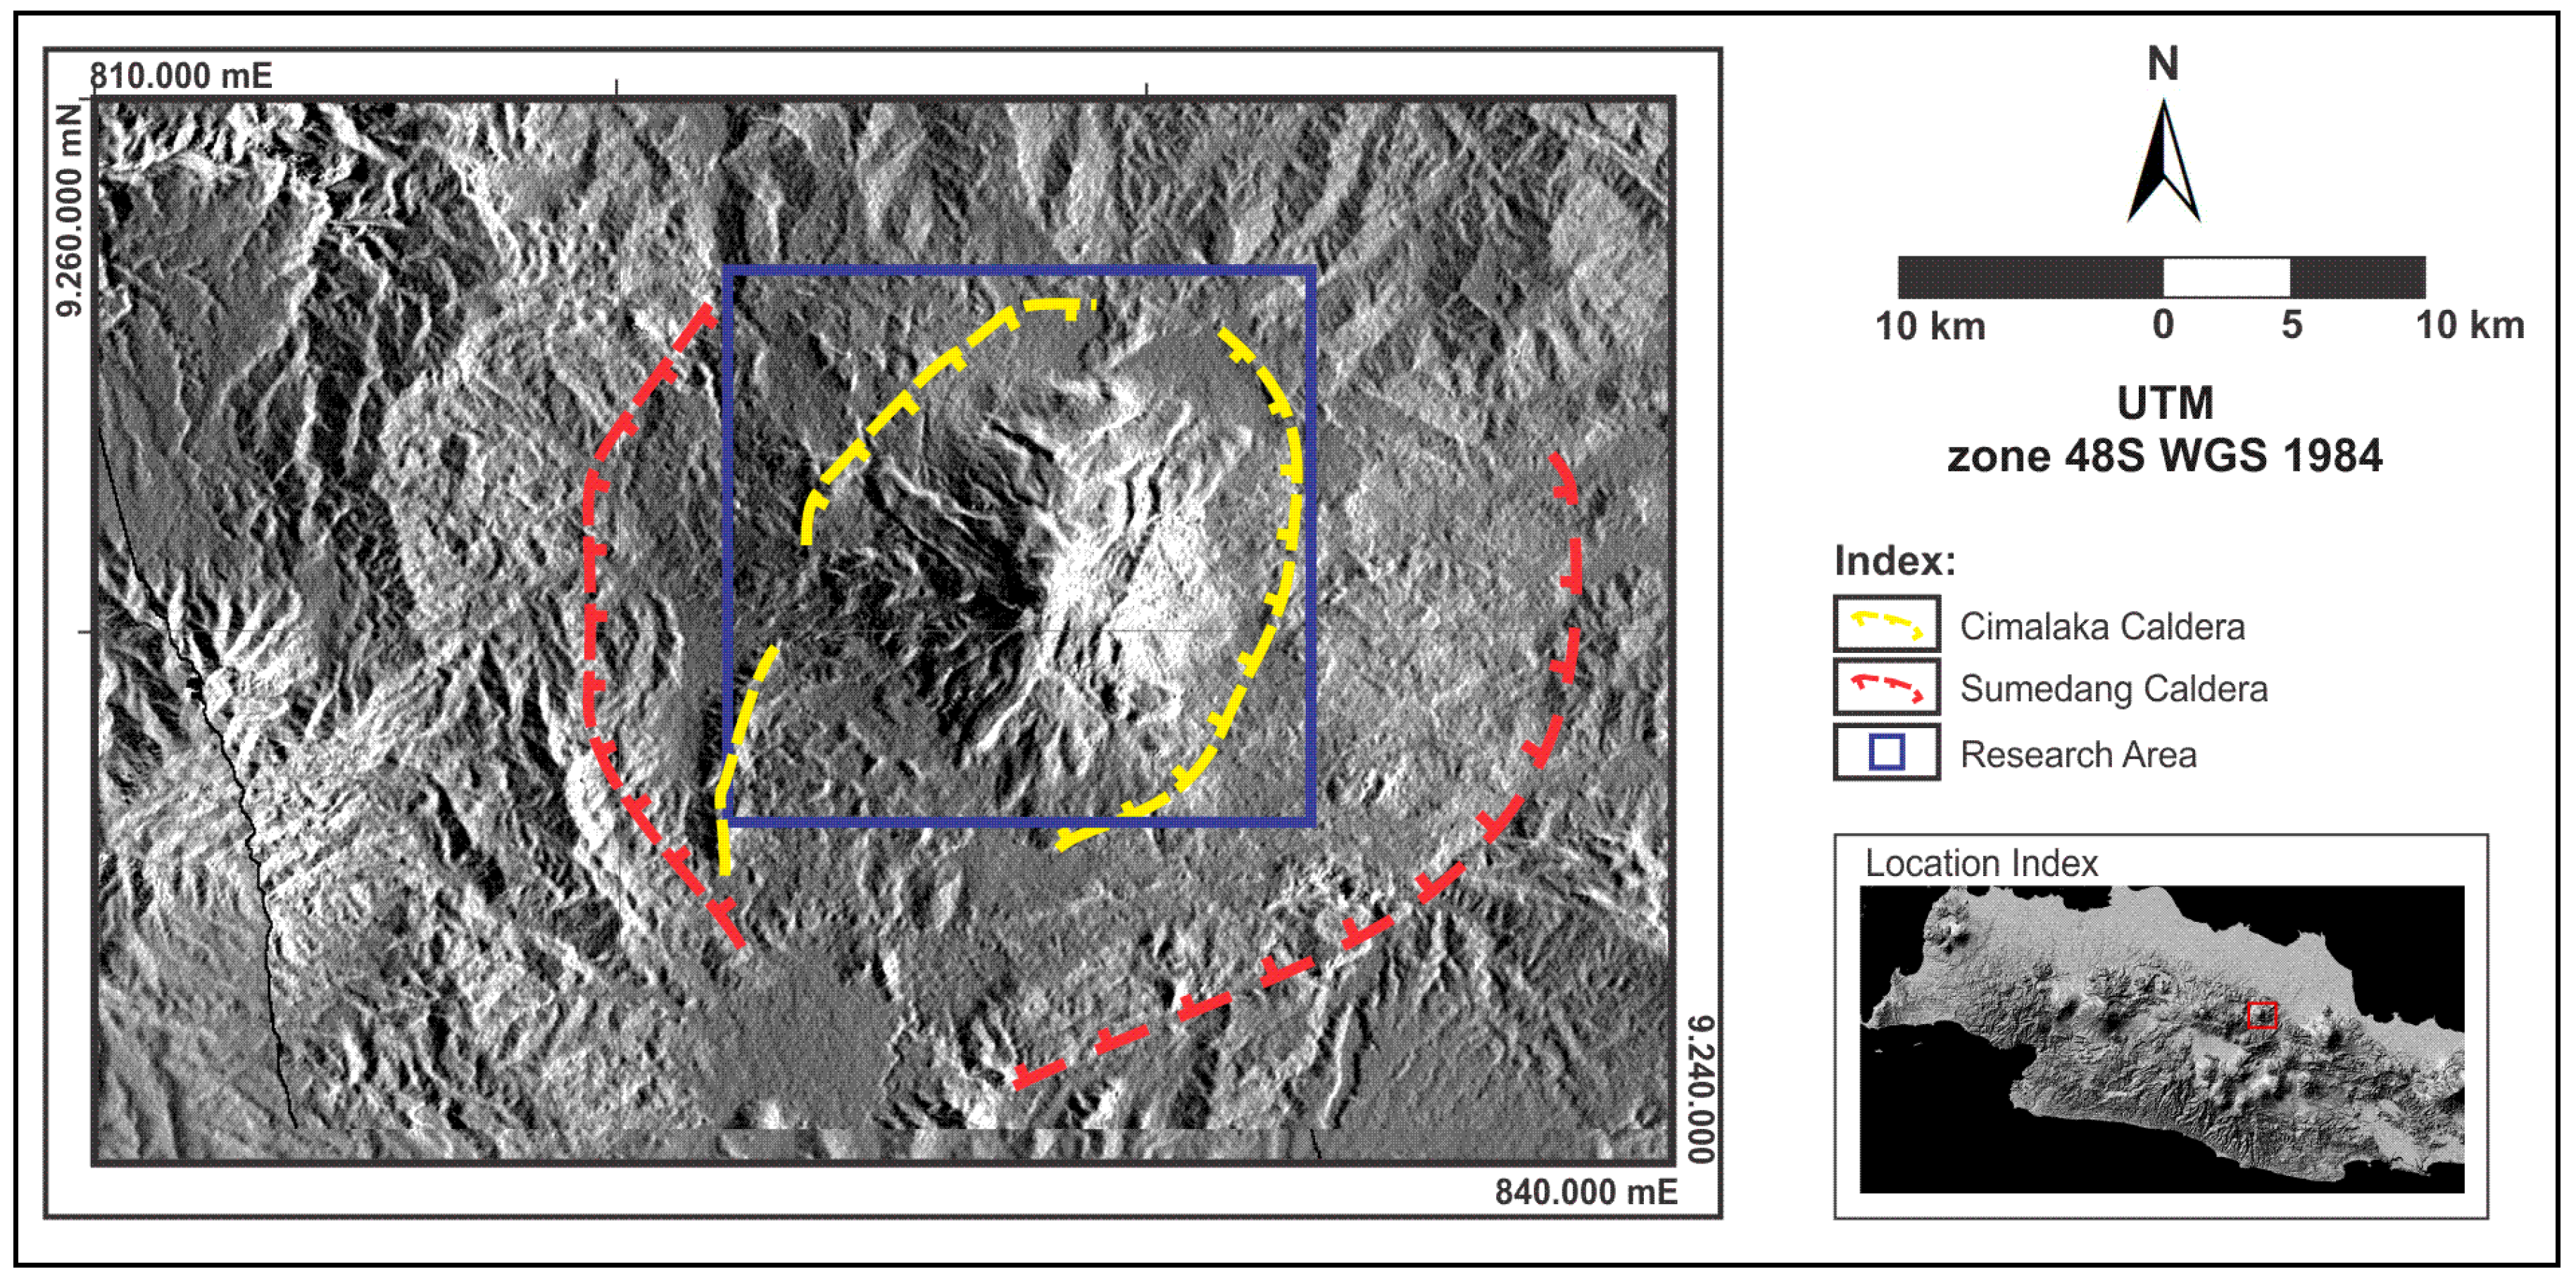
Evolution of the Tampomas Volcano started after the Tertiary basement sediment formed [
17] and occurred more than two times [
21]. Furthermore, remote sensing analysis and field work were conducted to define the volcanostratigraphy of Tampomas. Based on those analyses, the evolution of the Tampomas Volcano was determined. The first phase is the formation of Sumedang Volcano; this is the construction phase of early volcanic activity. The second phase is the destruction phase of the Sumedang Volcano and formation of the Sumedang Caldera. In the third phase, the Old Tampomas Volcano was formed as the new volcano within the Sumedang Caldera. The Old Tampomas Volcano entered the destruction phase and formed the Cimalaka Caldera, with the Young Tampomas Volcano within the caldera.
Figure 3 shows the caldera features resulting from the Young Tampomas Volcano evolution. The manifestations around the Tampomas area are associated with the existence of the Young Tampomas Volcano, with the Cimalaka Caldera rim as the boundary.
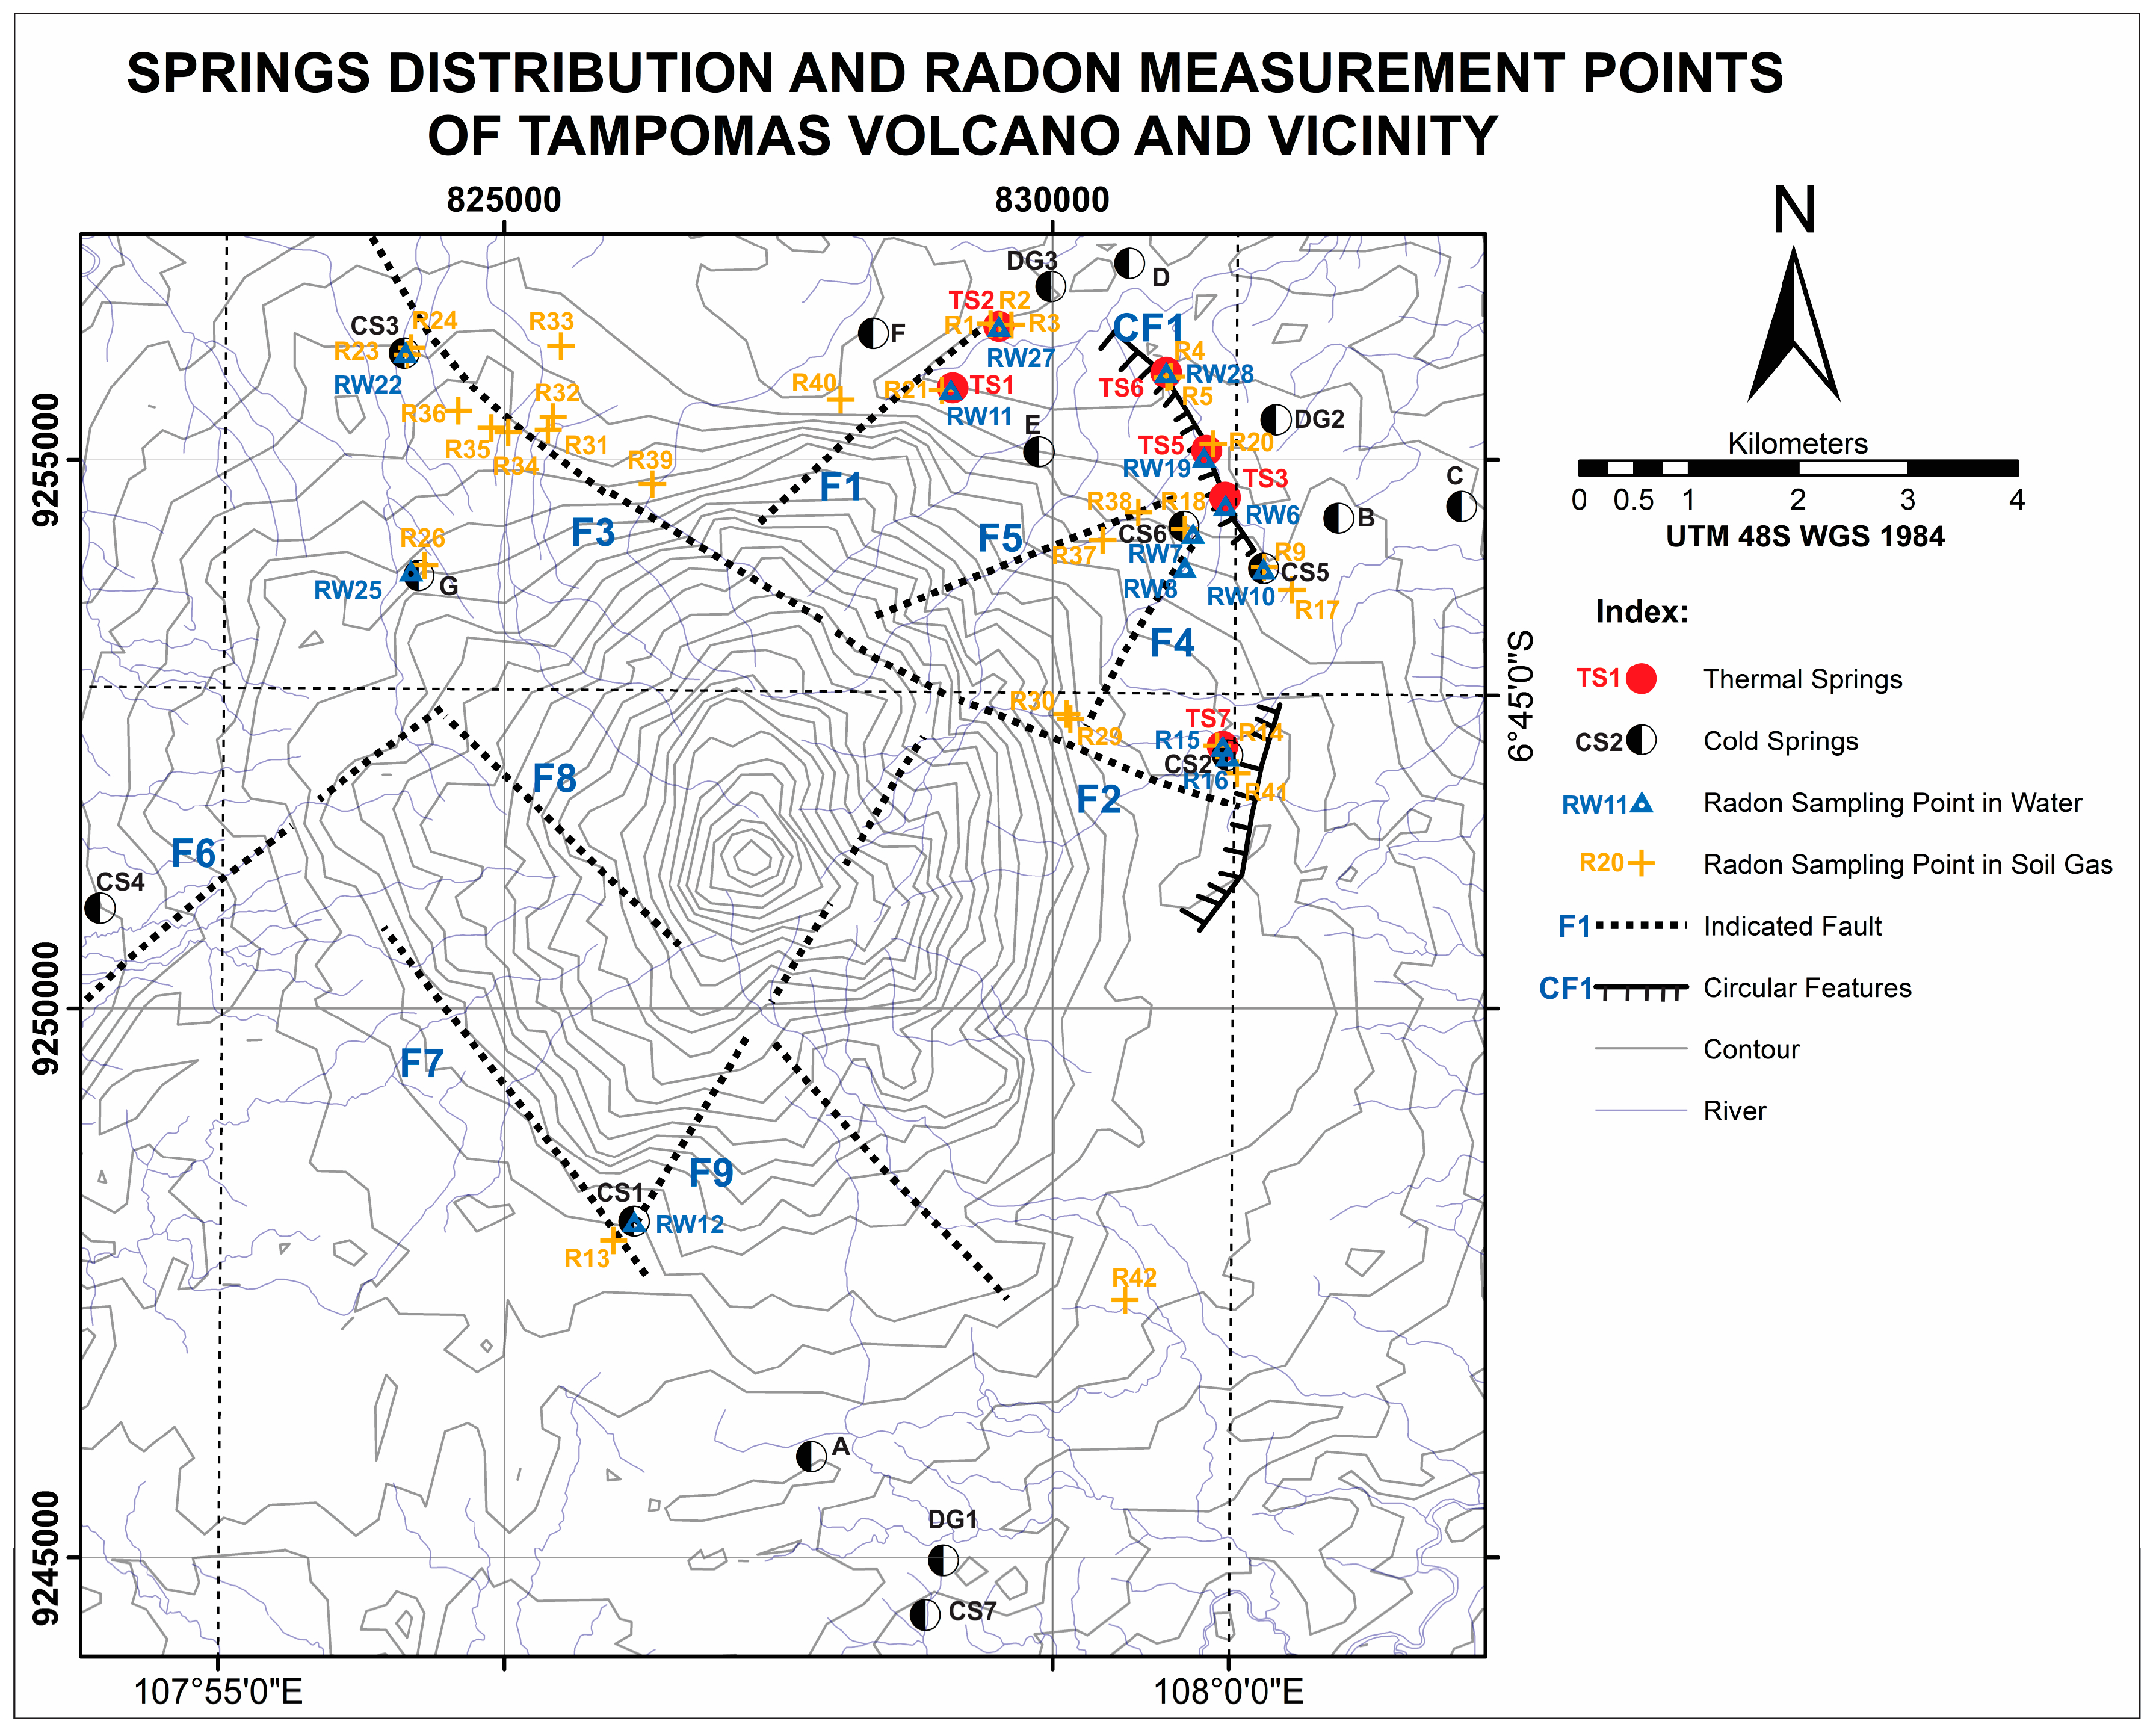
In this research, local geological structure analysis at the Tampomas Volcano was focused on lineament analysis based on the interpretation of satellite images, drainage patterns and fault indicators such as waterfalls, rock alteration and the lineament of springs. Based on those analyses, some fault lineament (F) and circular features (CF) were interpreted. The presence of the structures can act as a fluid path or boundary of the flow system. Furthermore, those interpreted geological features were used to determine the location of
222Rn measurement and water sampling (
Figure 4).
2.3. Collection and Analysis of Samples
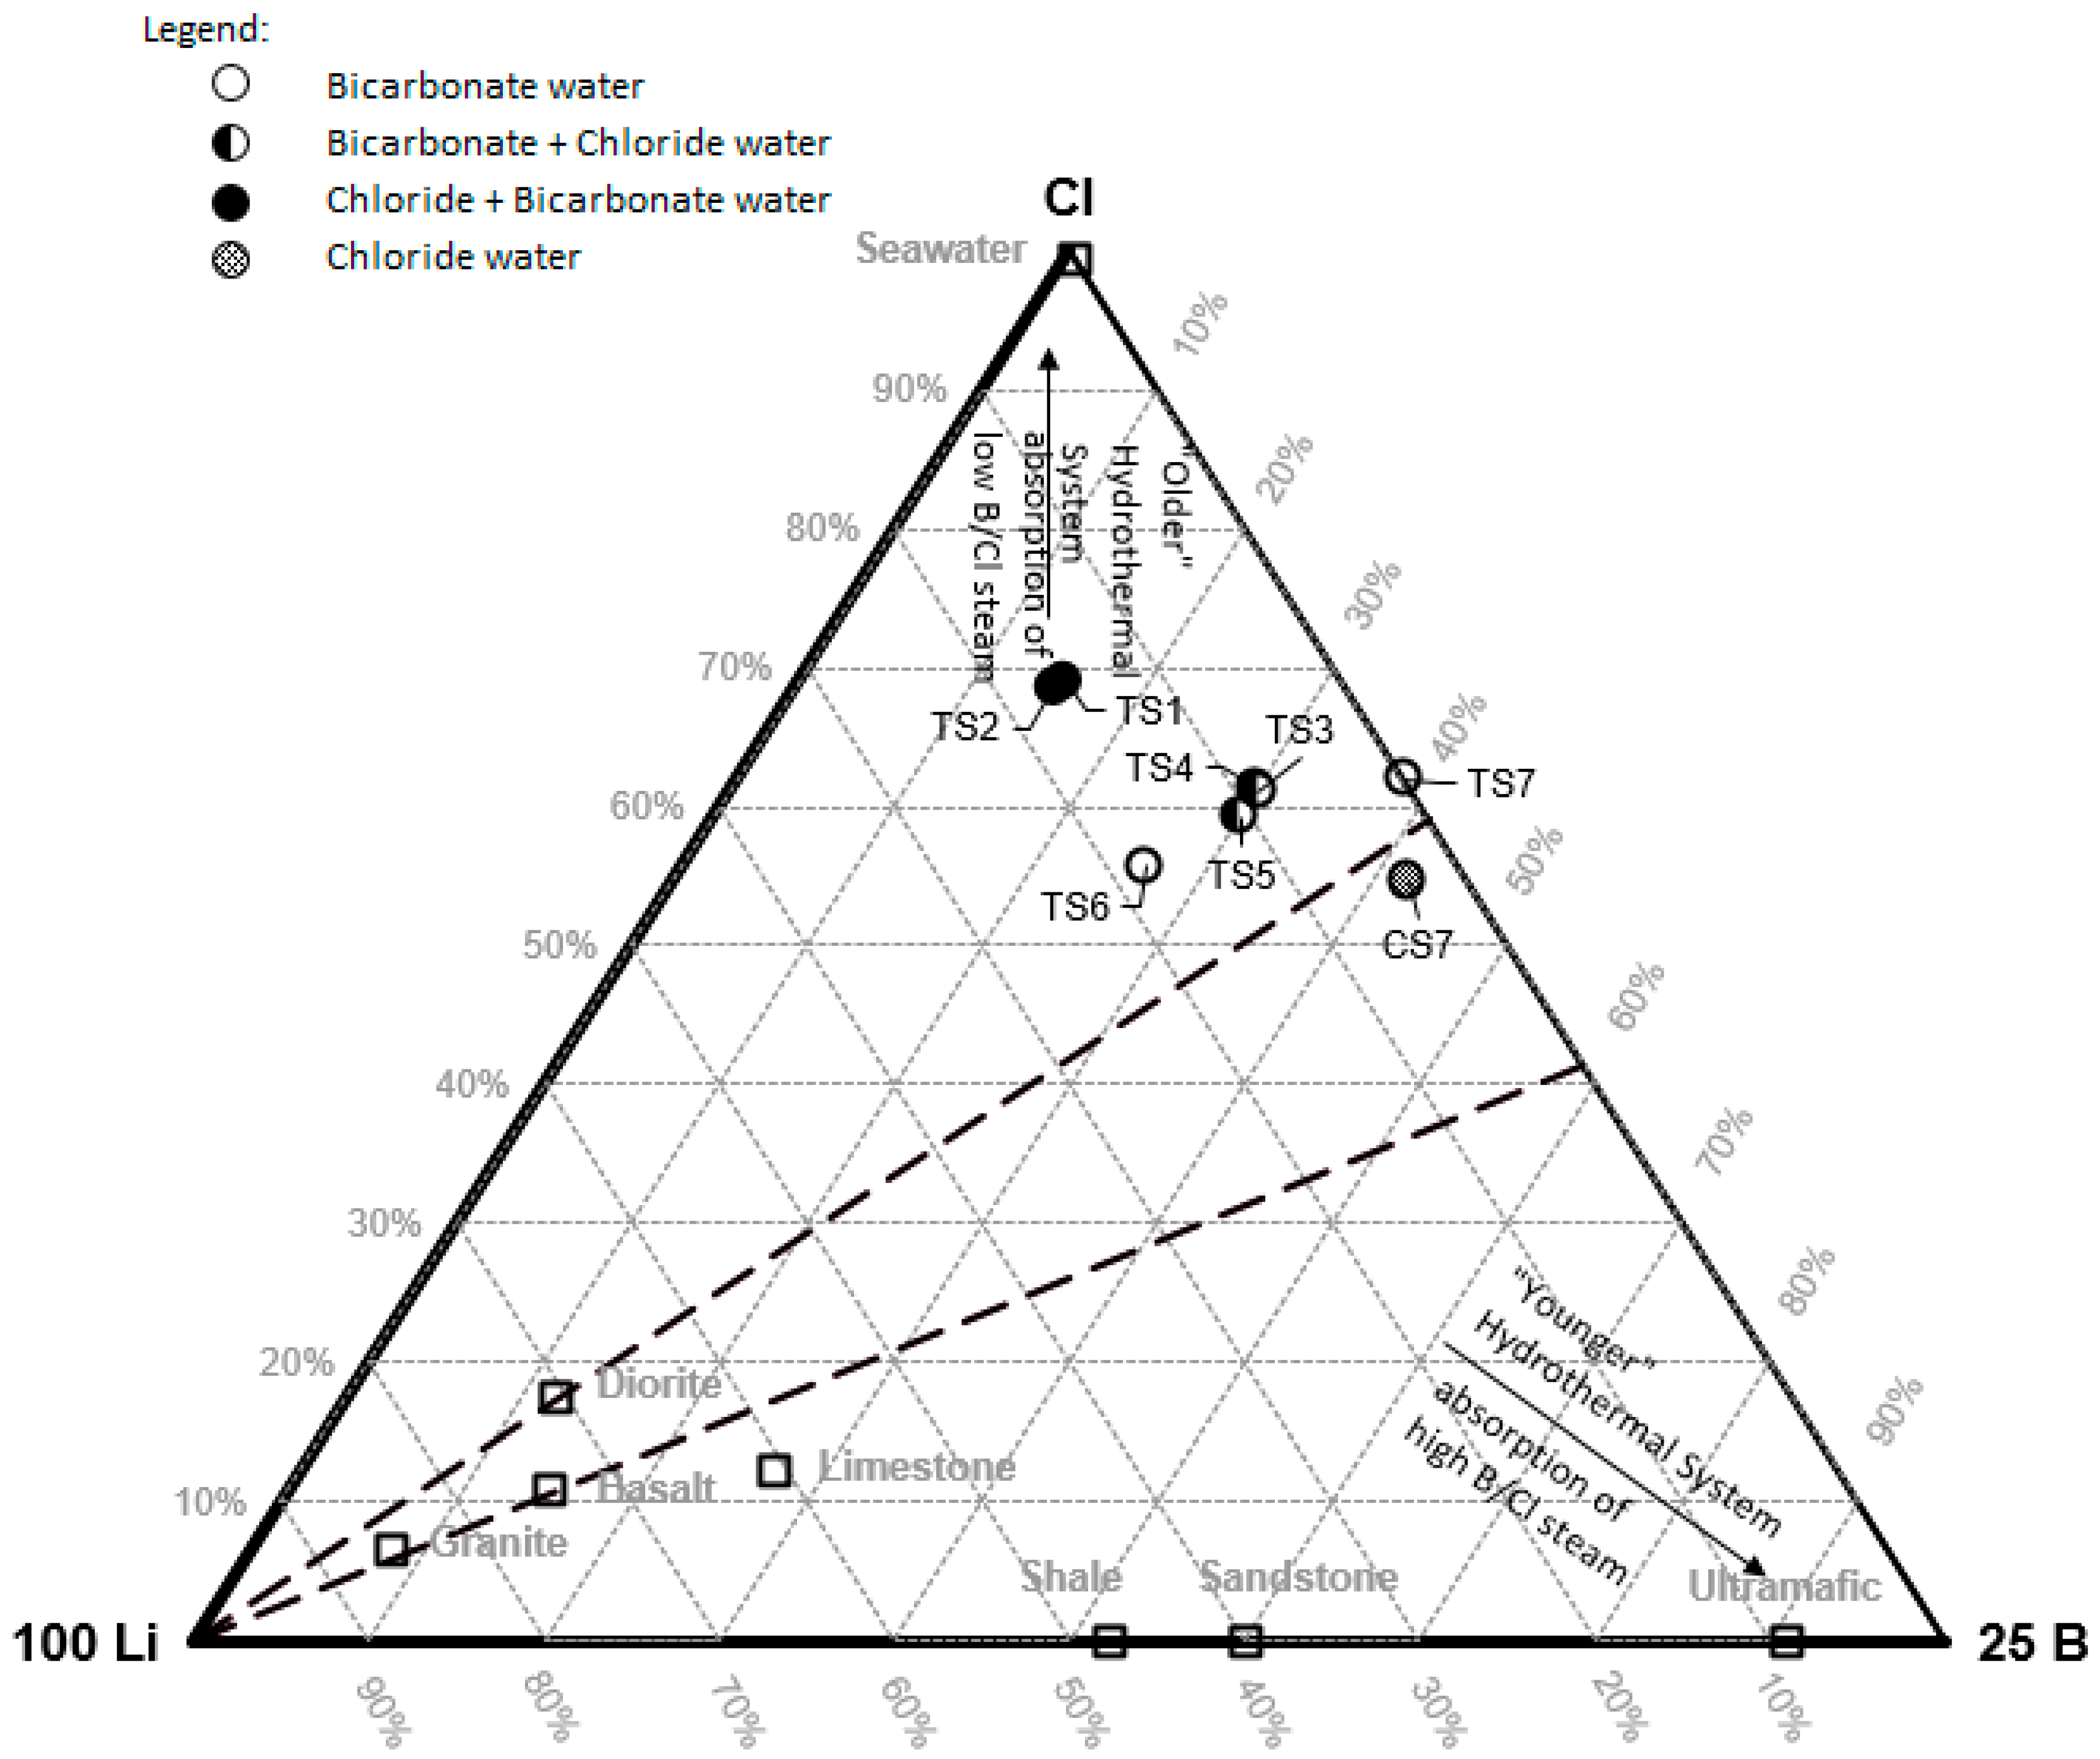
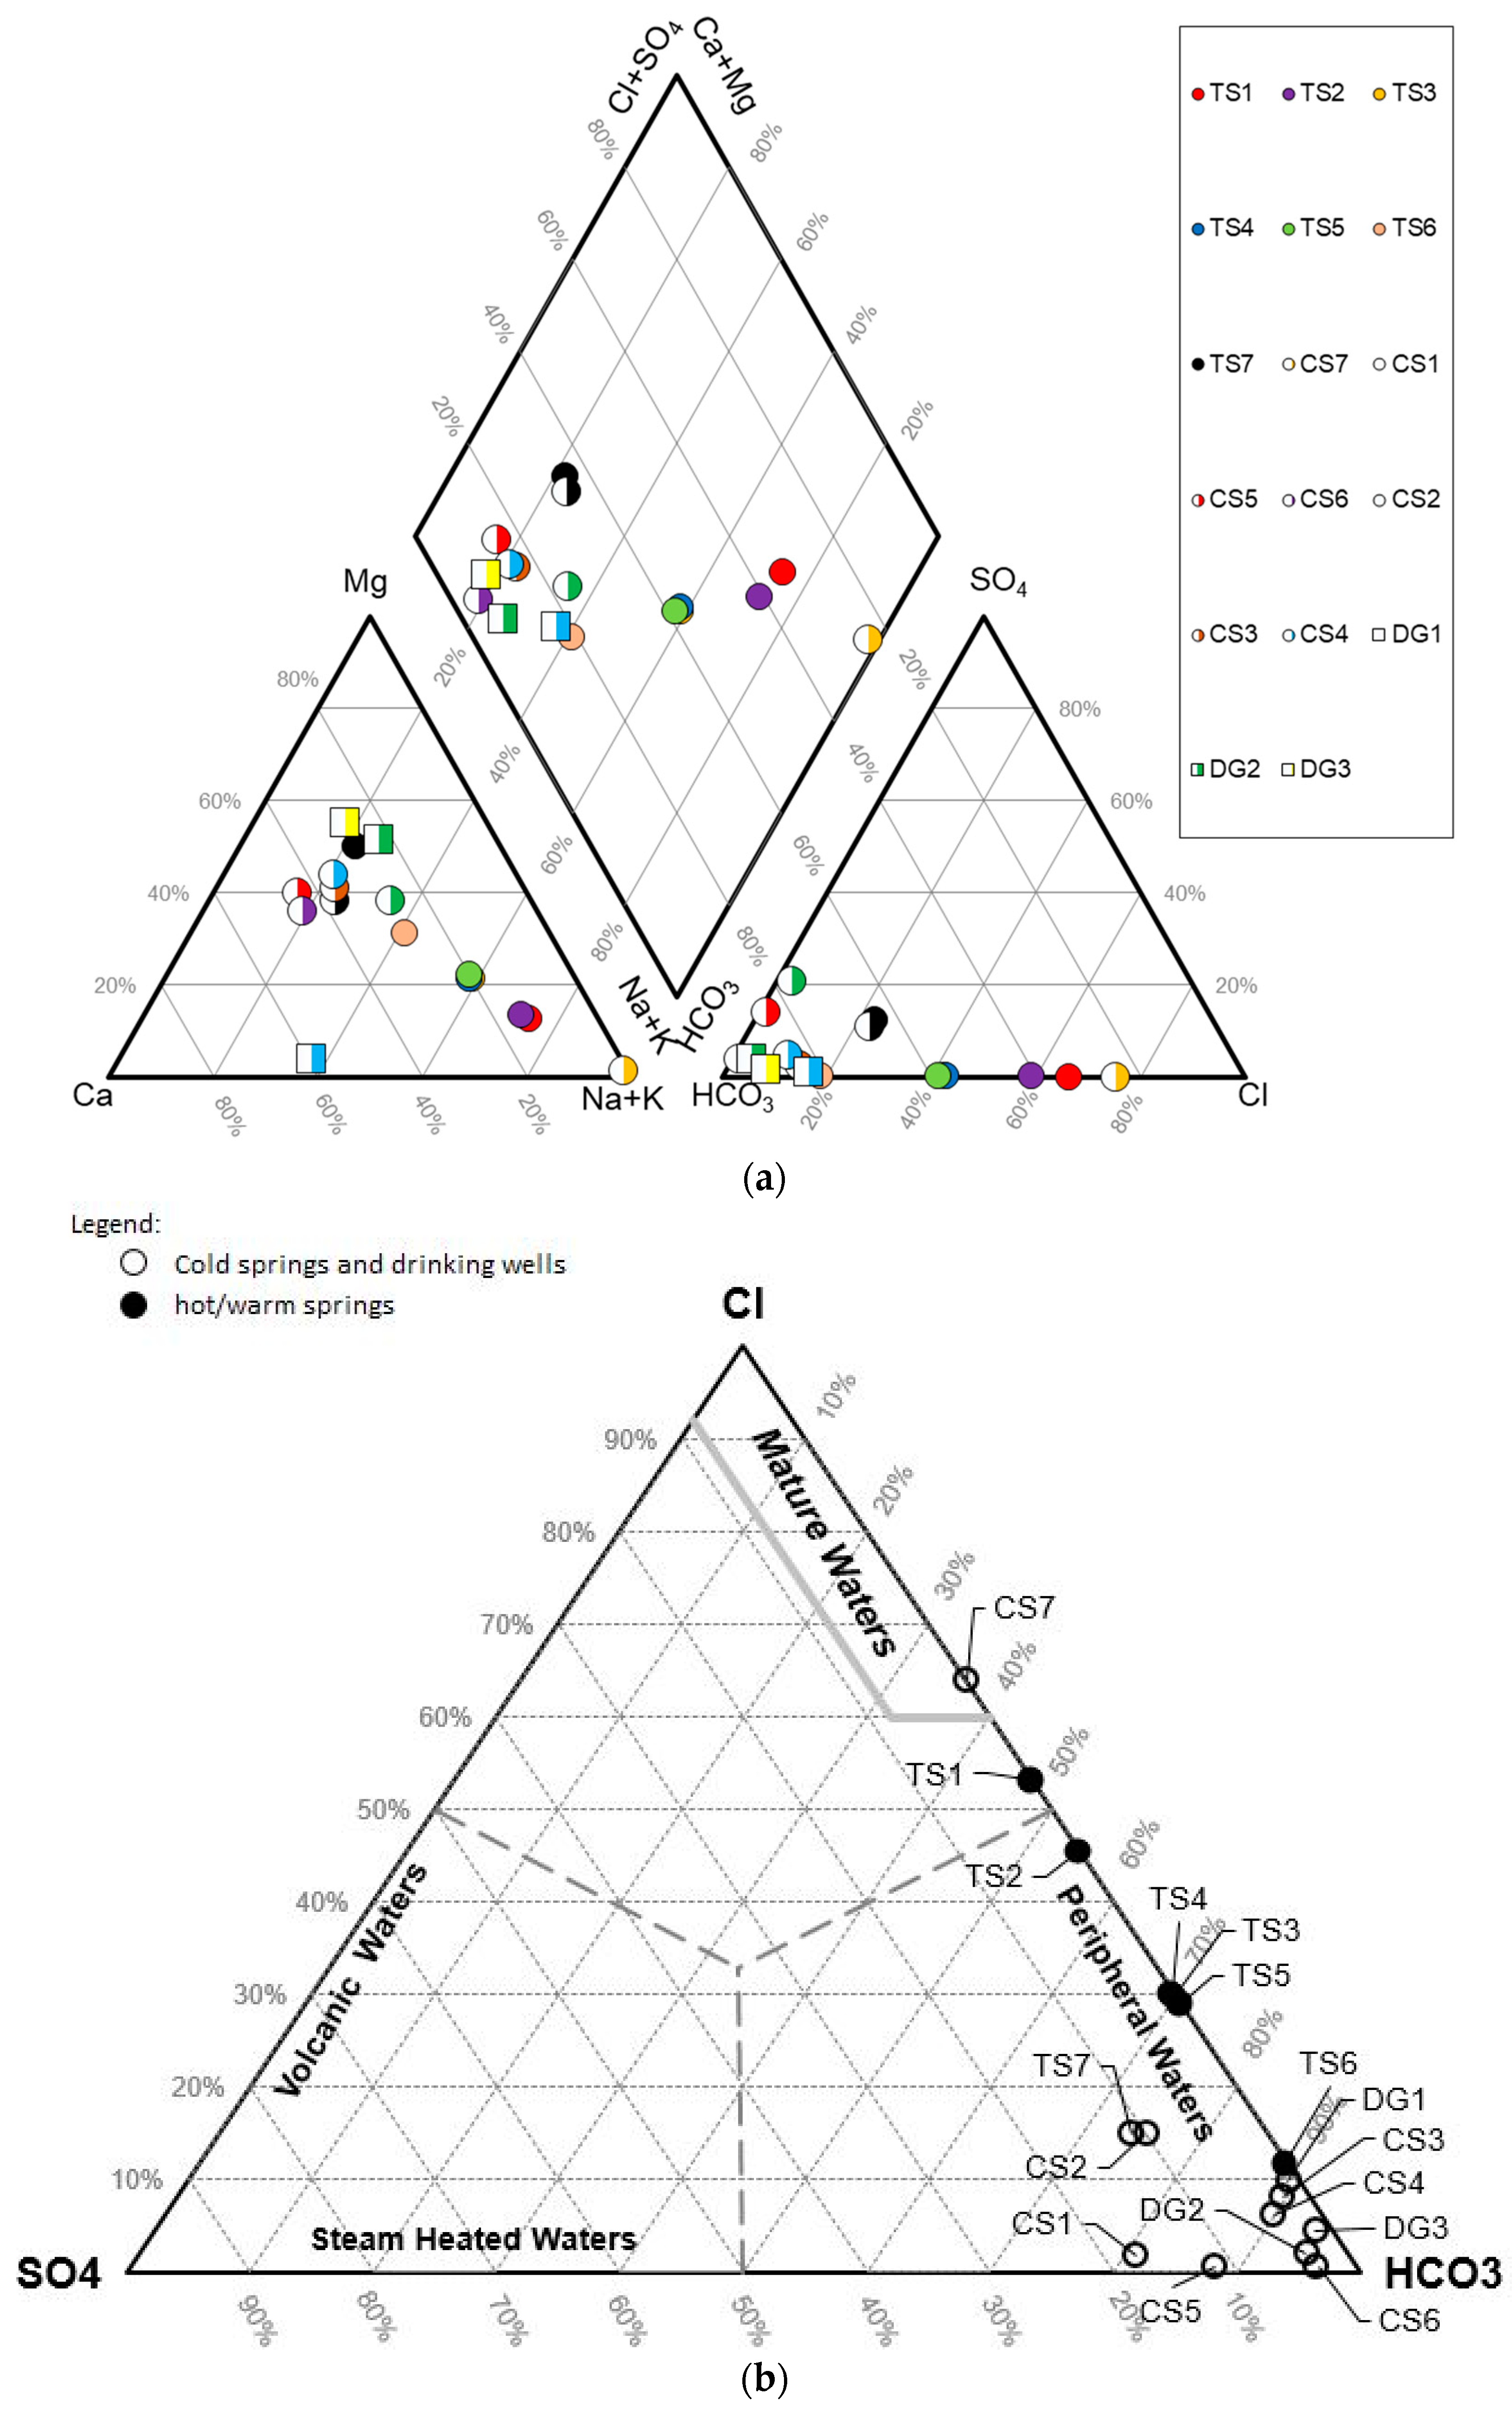
Hydrogeochemical characteristics such as major ion composition, minor and trace ions and water isotope compositions can be used to explain the genesis, sources of water and sub-surface geological conditions. Some trace elements (e.g., Li, F, B, Cl, As and Hg) are related to geothermal sources [
25]. In this research, water geochemistry from 17 water samples from 7 thermal springs, 7 cold springs and 3 dug wells were analyzed (
Table 1,
Figure 4). To strengthen the interpretation,
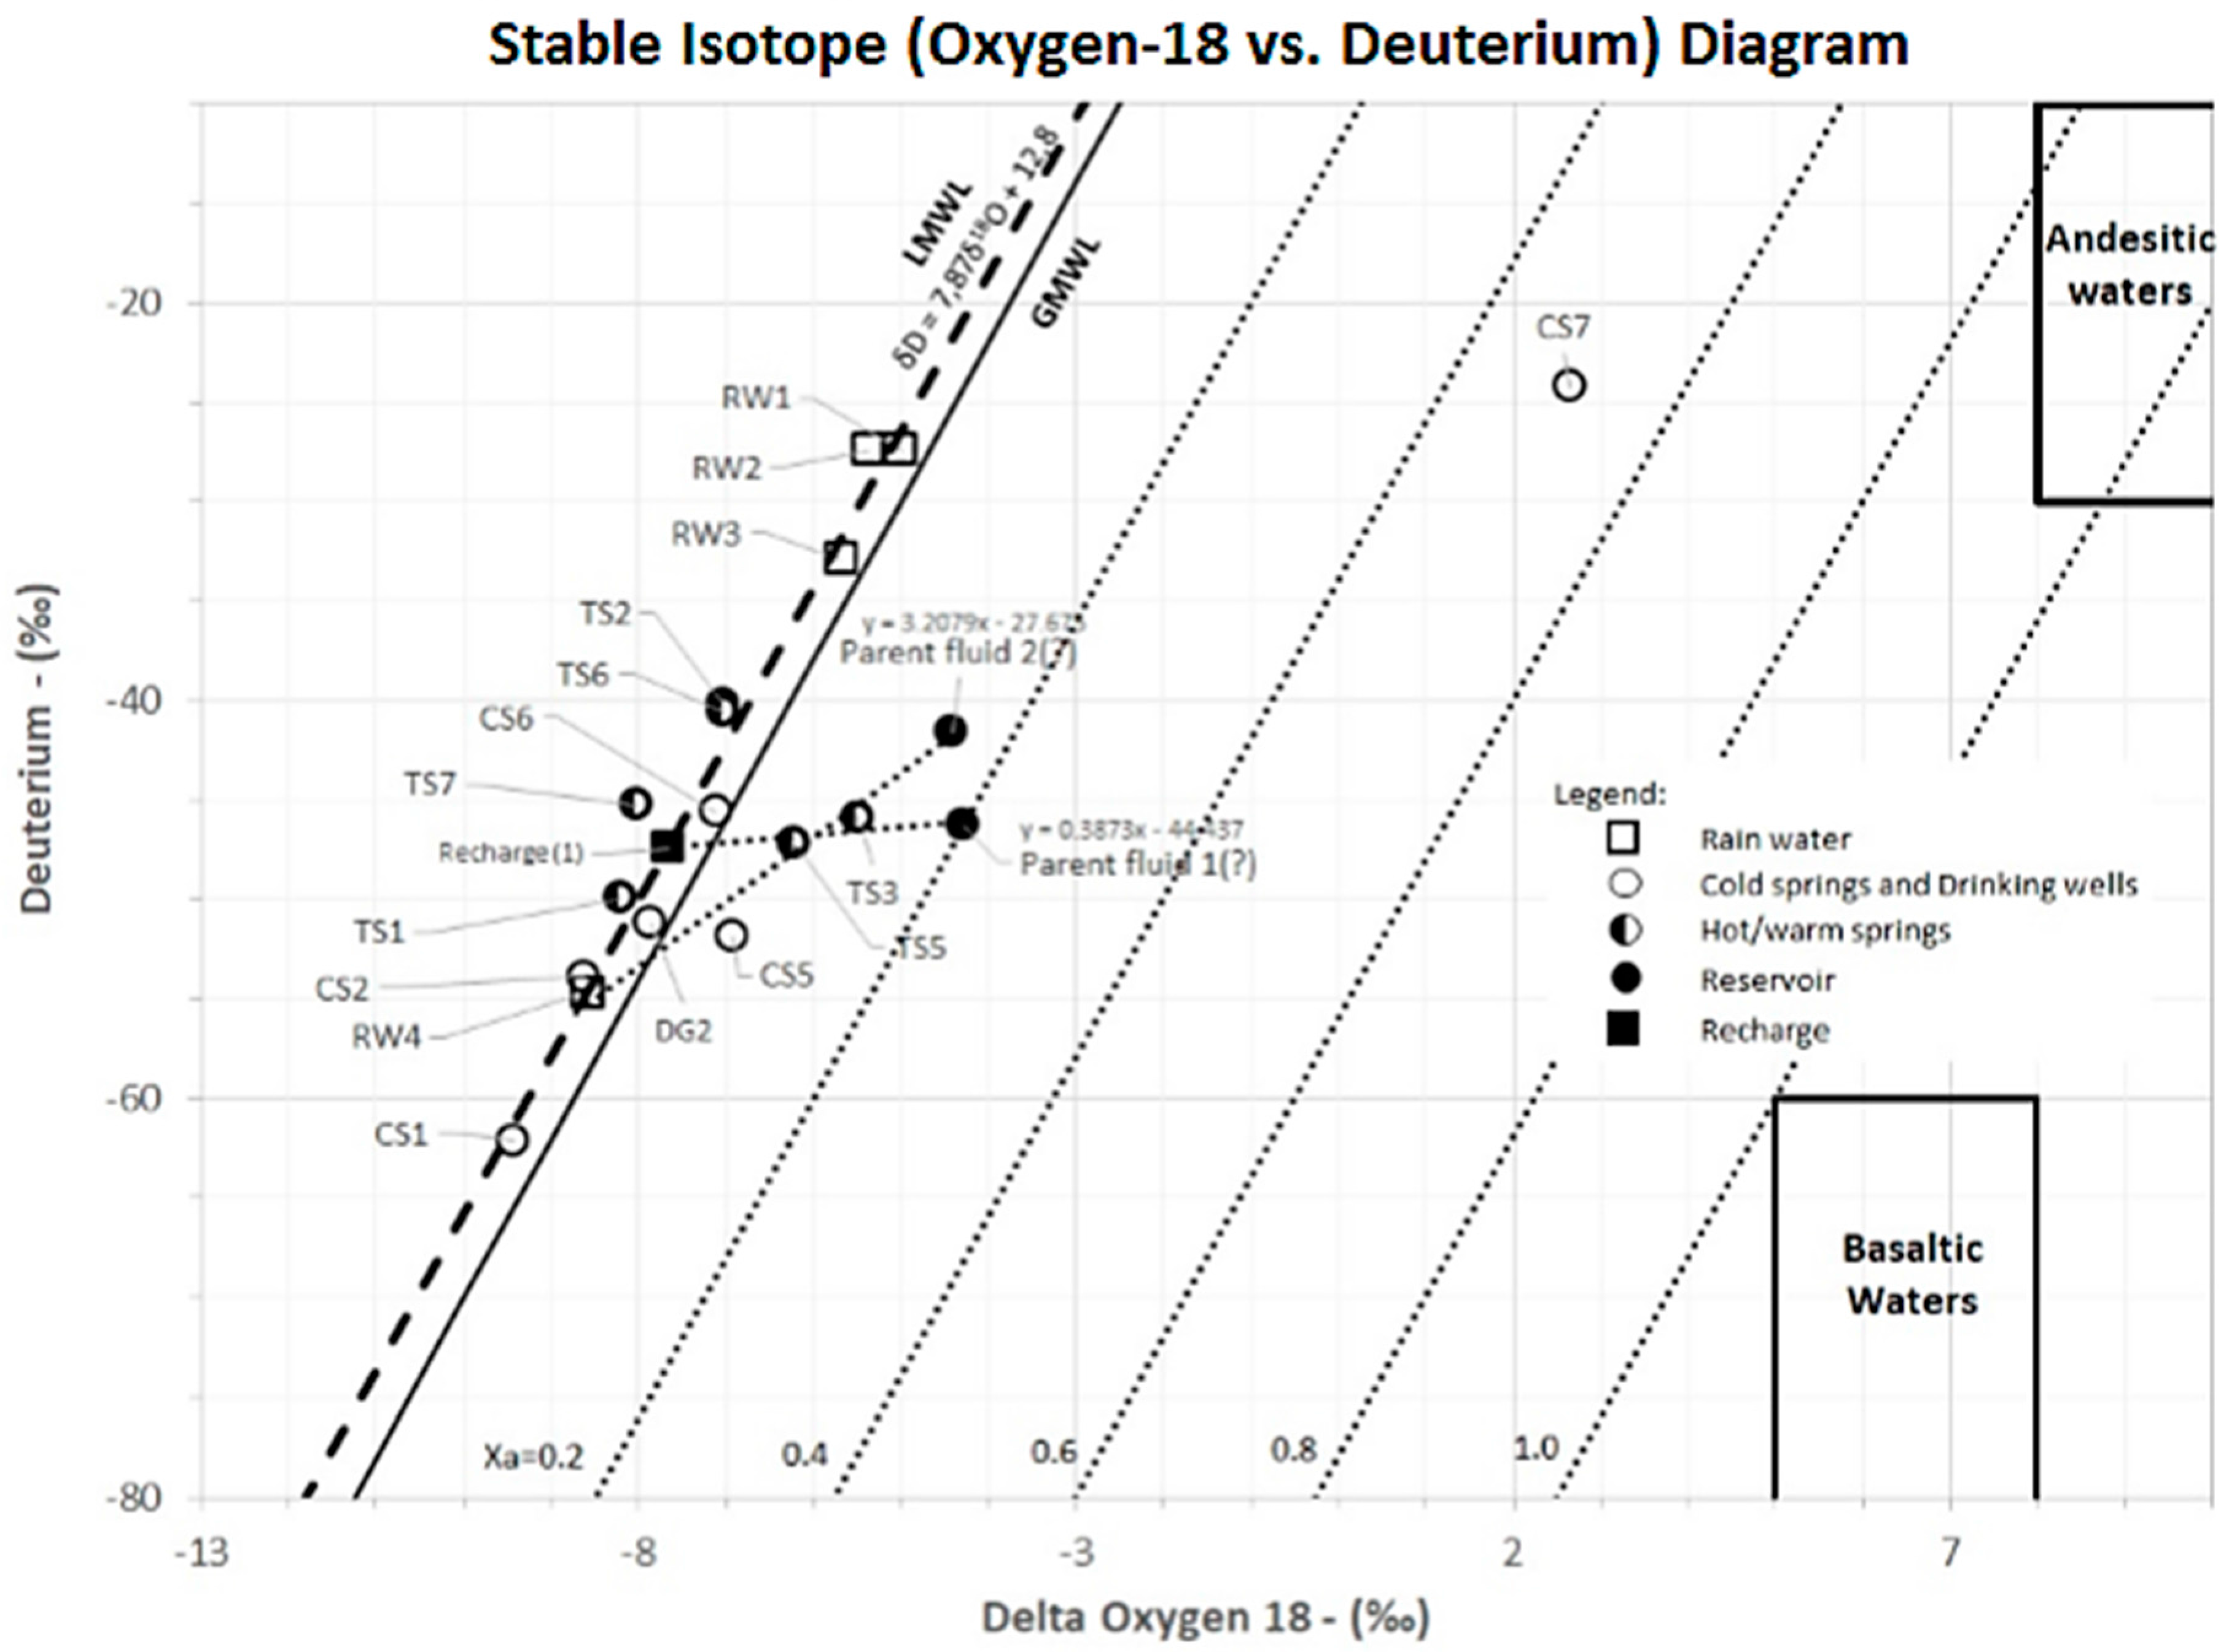
2H and
18O analysis for 16 samples and
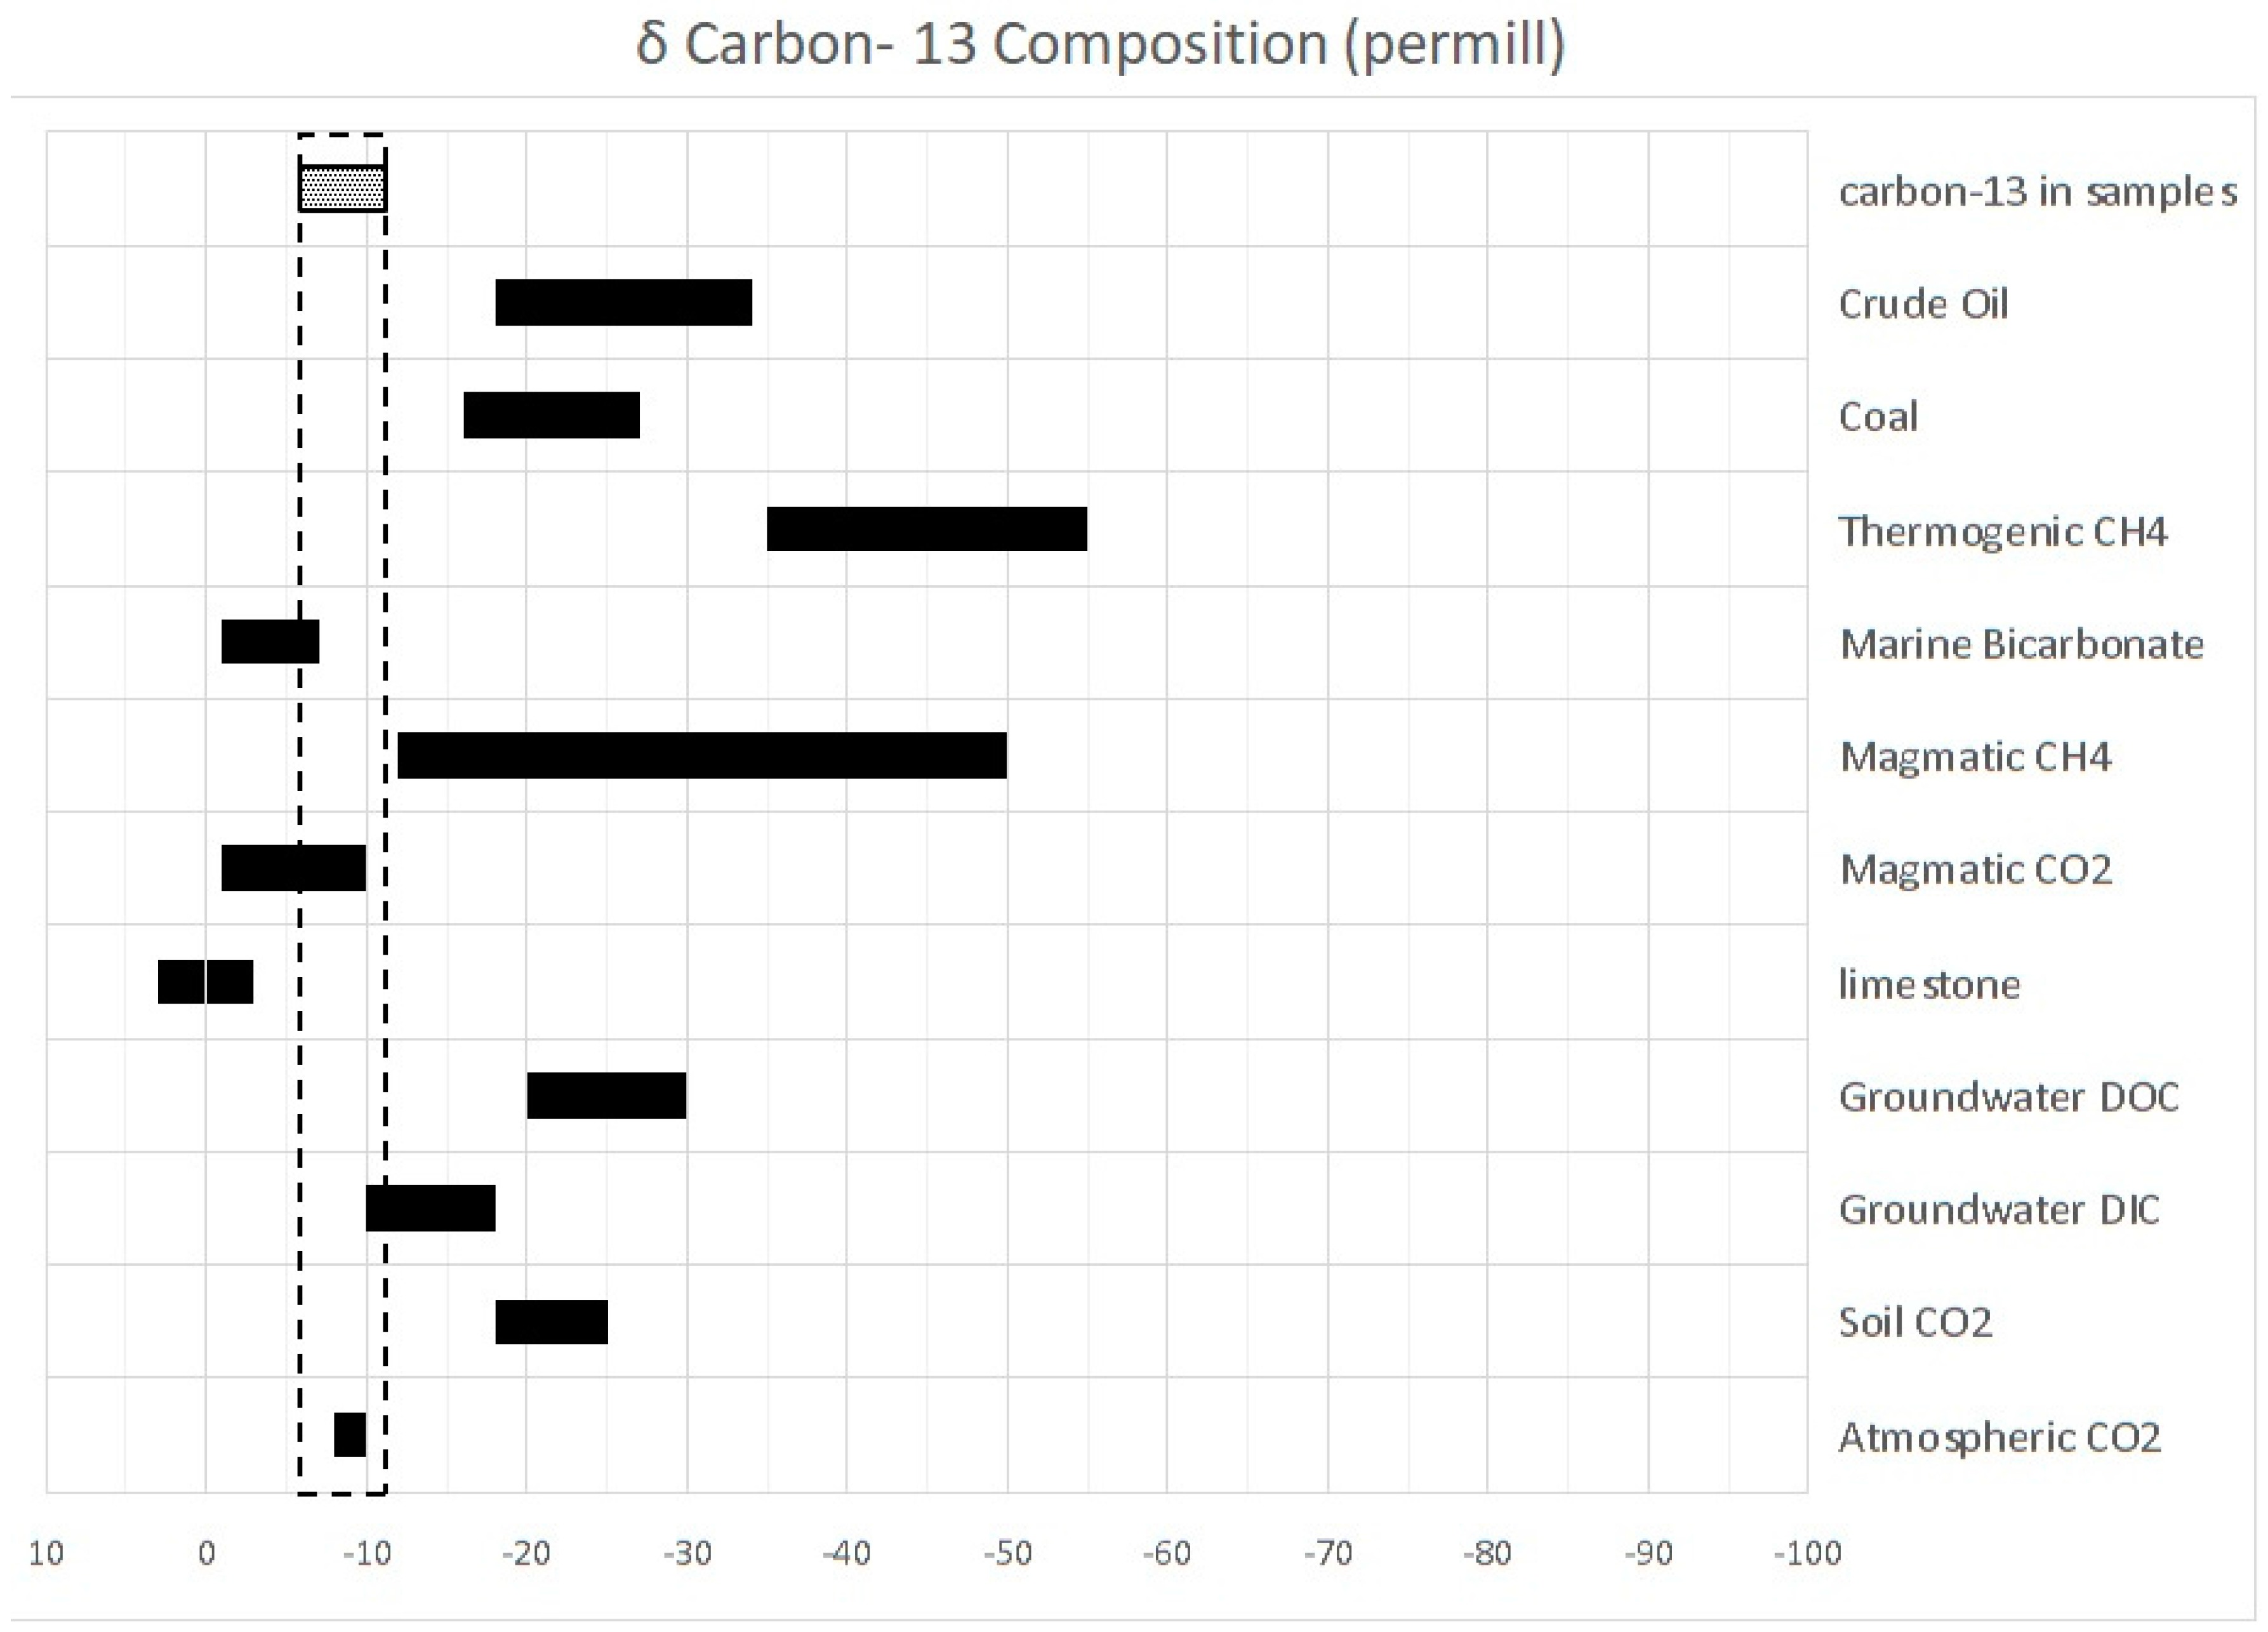
13C analysis for 5 samples of water from thermal springs, cold springs and rain water were performed to explore subsurface fluid conditions and the mixing mechanism of geothermal fluids with shallow groundwater.
The collection of water samples for chemical analysis is the first activity in a long process, which eventually yields significant information about a geothermal system. Sampling activities were performed within several months (April–August 2017) during the dry season in Indonesia. Water sampling occurred in April 2017; soil-gas sampling was carried out from June–August 2017; and dissolved 222Rn in water was sampled for from July–August 2017. The physical properties of thermal and cold springs, such as temperature, total dissolved solids (TDS), conductivity and pH, were determined in the field during sampling activities.
Water sampling techniques follow the international standard, which refers to “Geothermal Fluids” by [
3], “Geothermal Sampling and Analysis” by [
26] and “Groundwater Geochemistry and Isotopes” by [
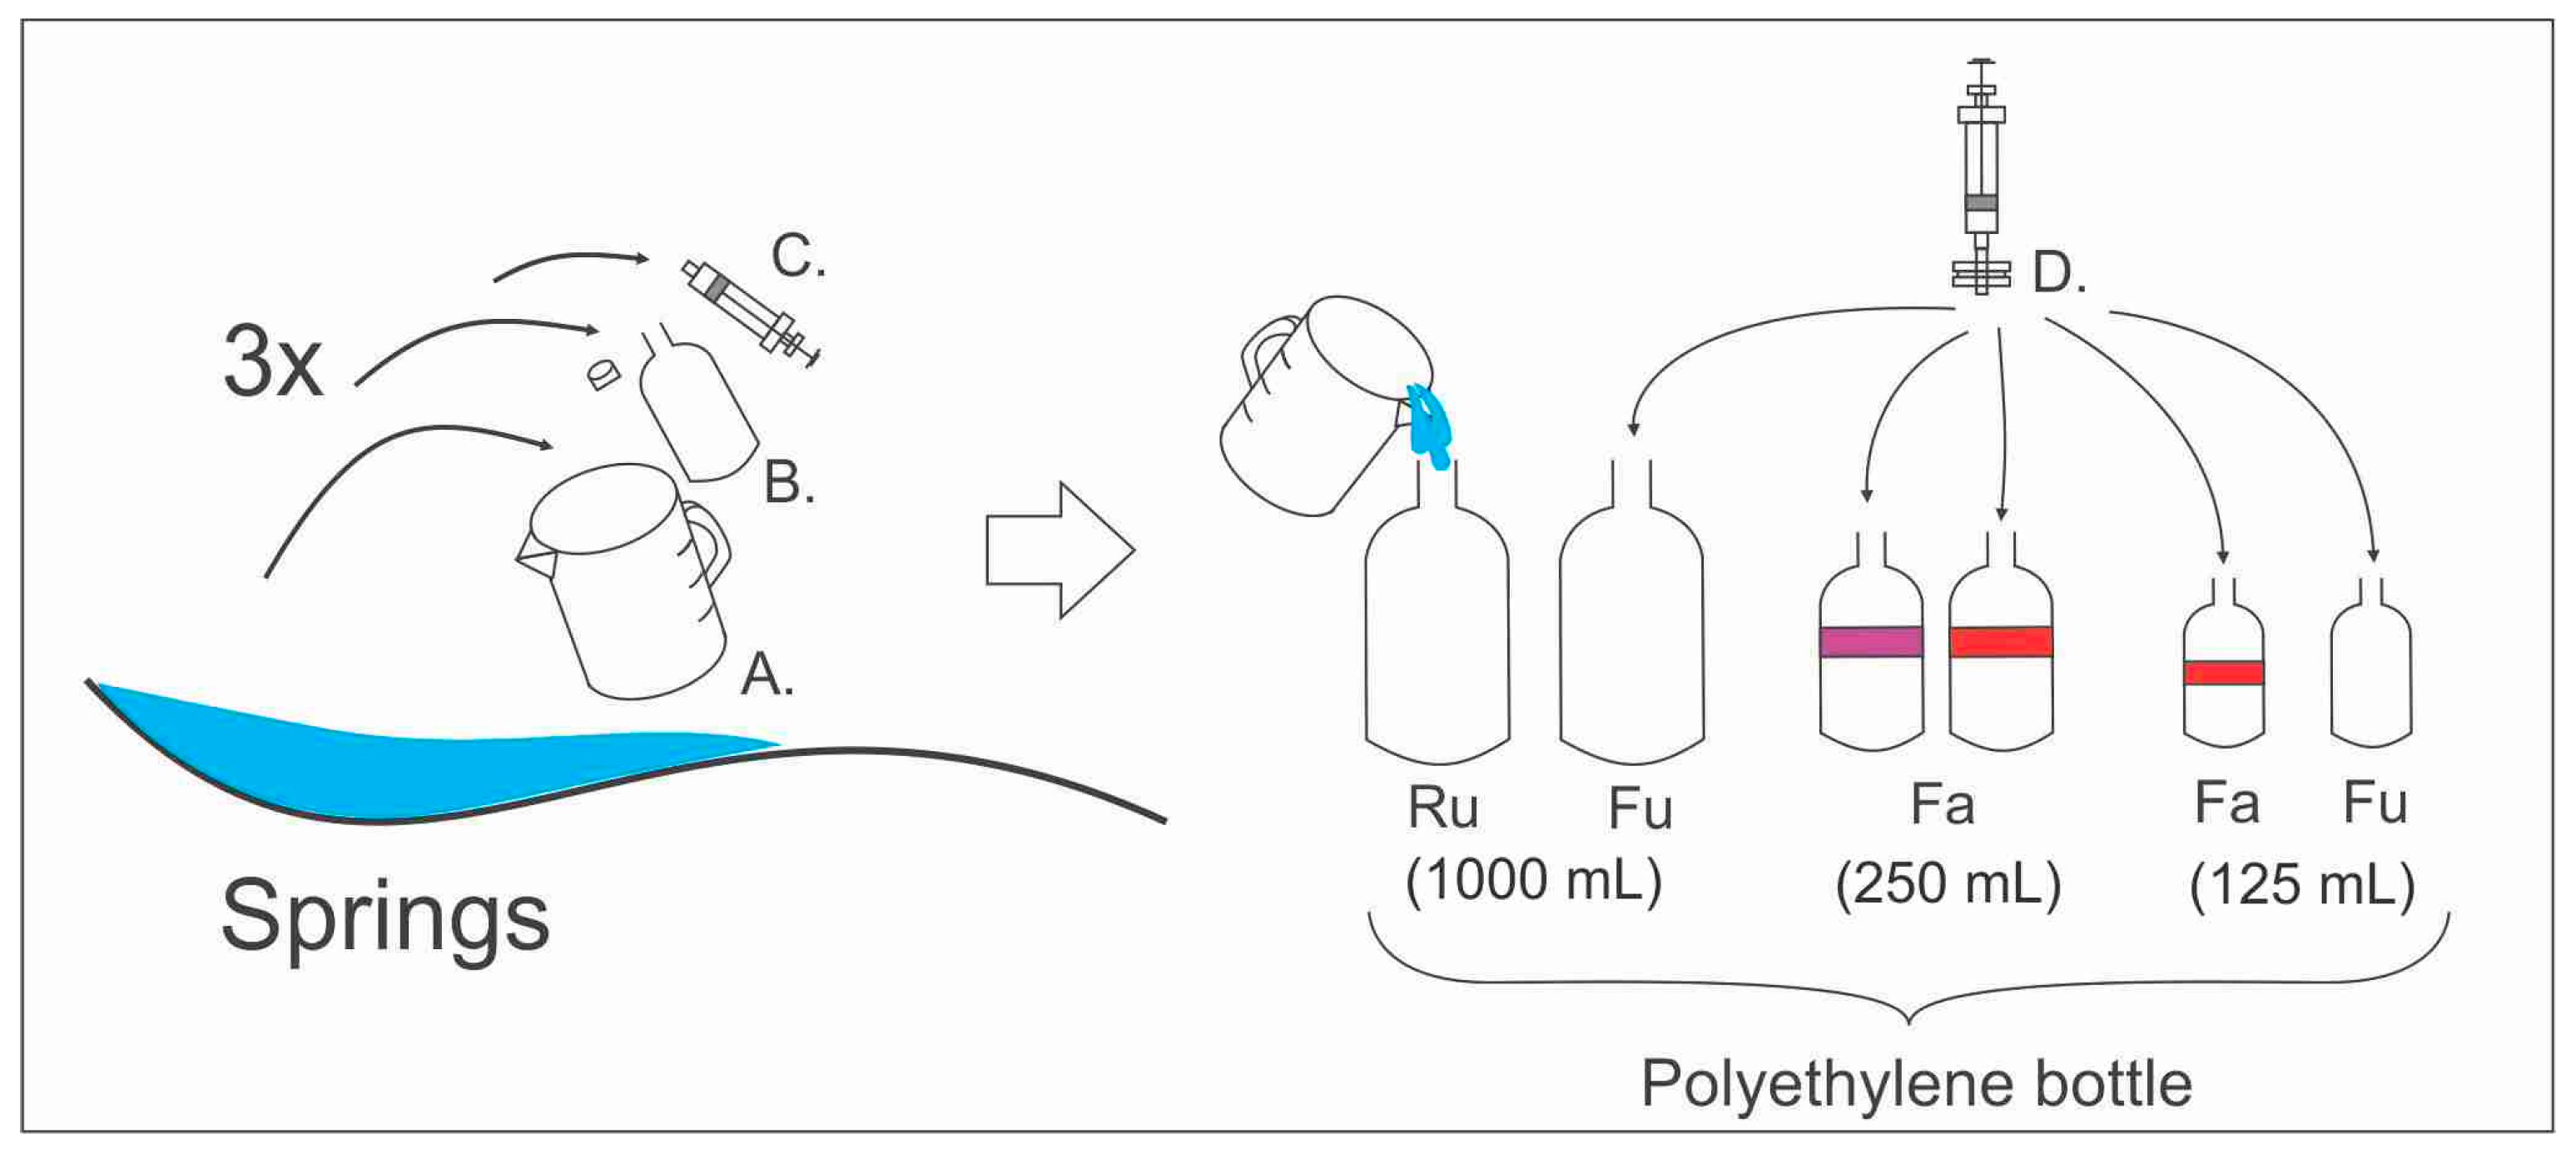
4]. Before sampling activity was conducted, all the bottles were rinsed with water from each manifestation point in order to eliminate any contamination (
Figure 5). Water sampling treatment for anion elements was raw-unacidified, while it was filtered for cation elements and SiO
2 (using a 0.45-µm filter) and acidified with nitric acid until the pH was less than 2. When the SiO
2 concentration is very high, the dilution process was done directly on site. For the ammonia sample, fluid preservation was performed using H
2SO
4. A sample of stable isotopes and δ
13C were filtered, but no acidification process was needed. For isotope sampling, there should be no bubble or a minor head-space (less than 50% of the sample volume) in a tightly-capped bottle [
1].
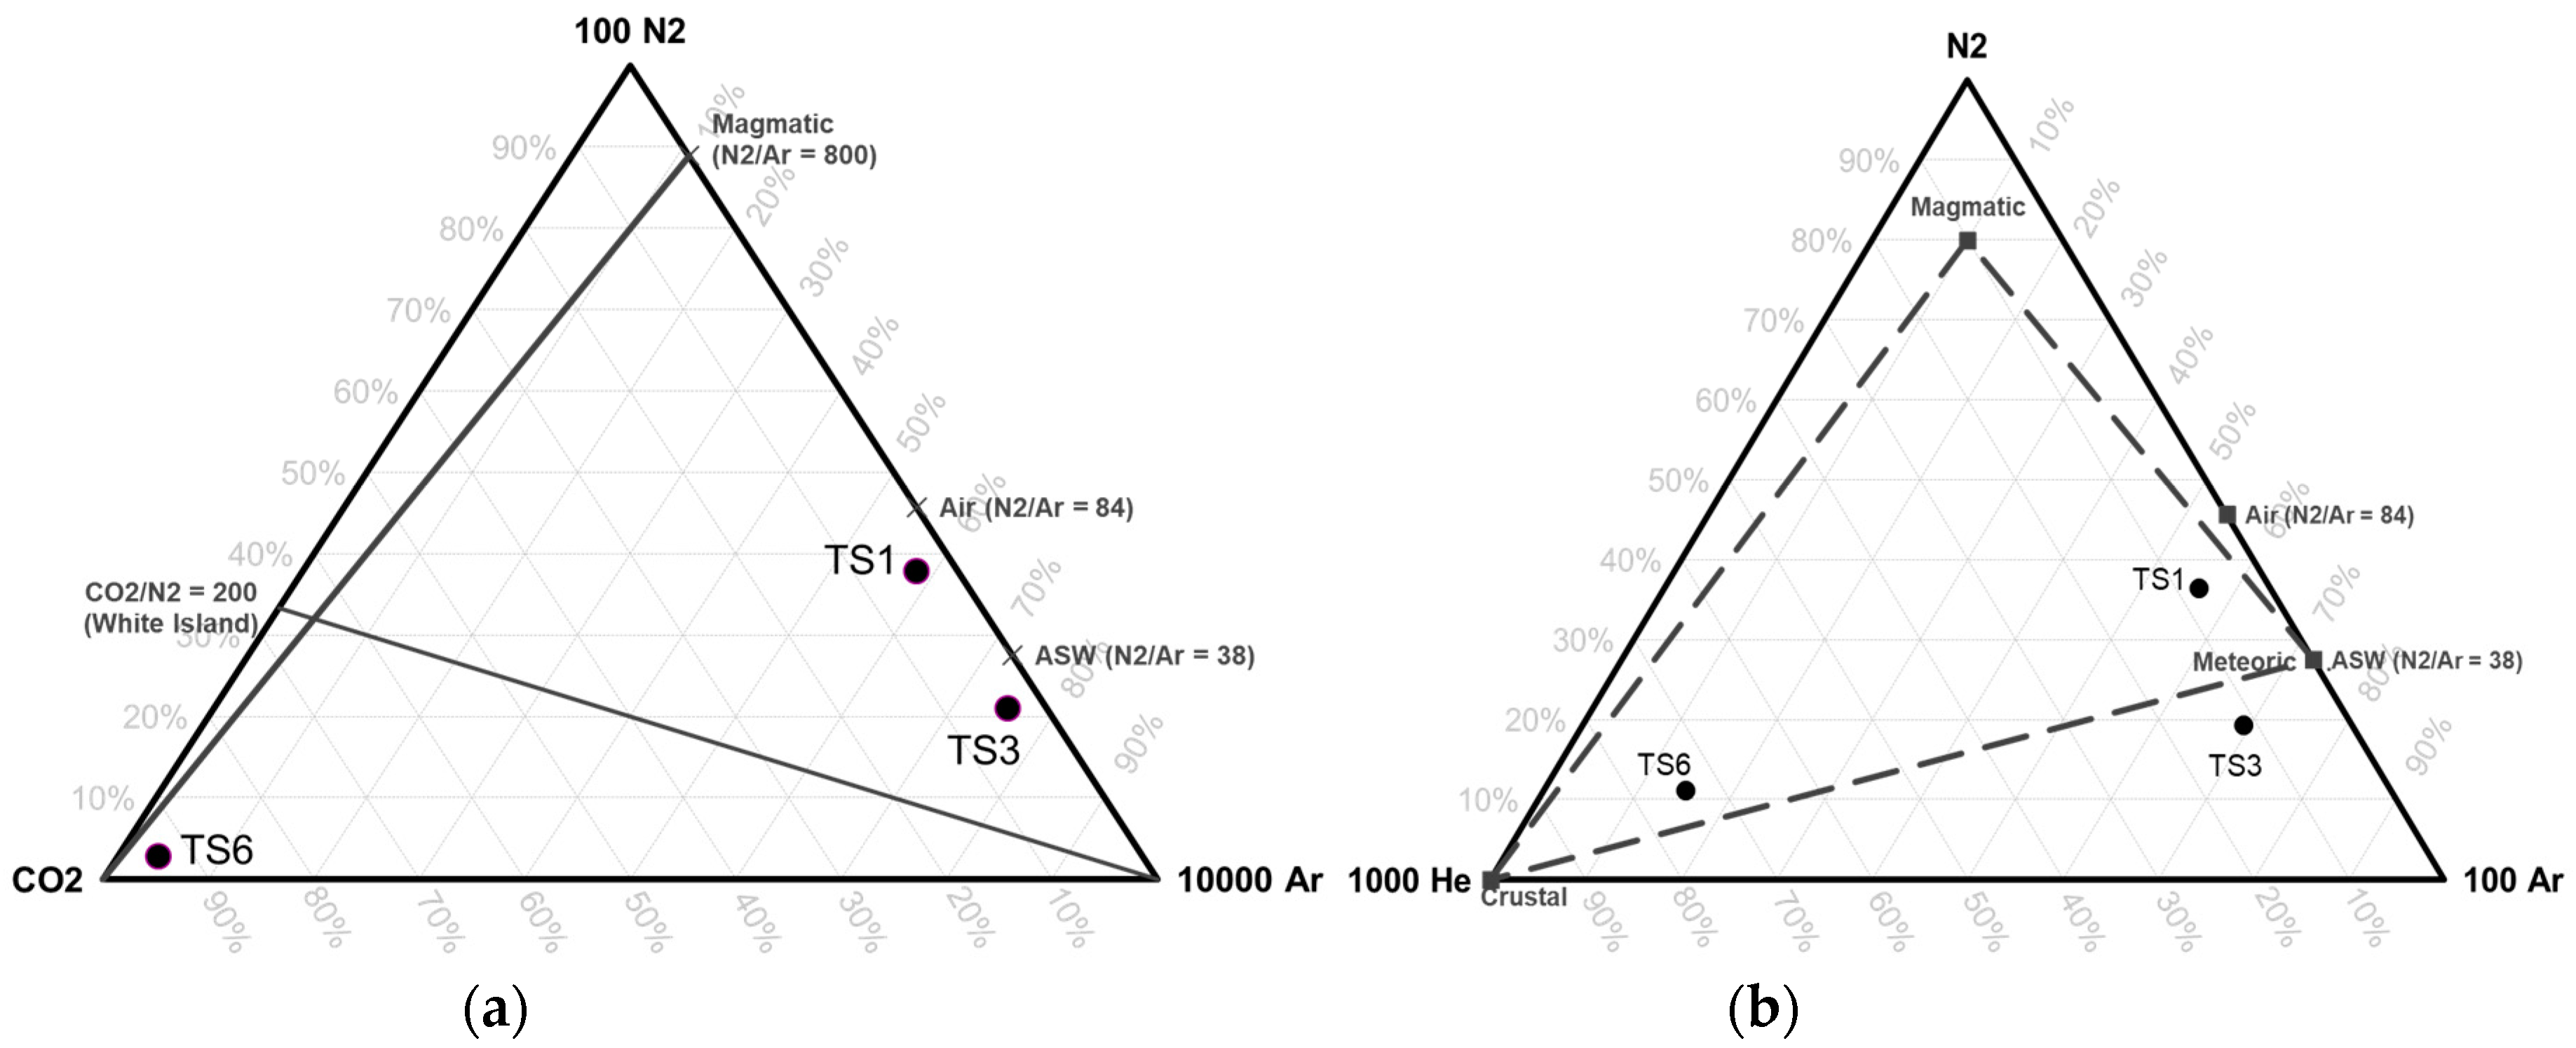
Ion chromatography (930 Compact IC Flex (Metrohm, Herisau, Switzerland)) was performed to analyze for Na+, K+, Ca2+, Mg2+, SO42− and Cl−, while a titration method was performed to analyze total HCO3− and CO32−. Inductively-coupled plasma mass spectrometry (Agilent 7800 series (Agilent, Santa Clara, CA, USA)) was used to analyze minor and trace elements in the water samples. There is no direct gas discharge manifestation found at Tampomas. However, at some thermal springs, ebullient characteristics were found.
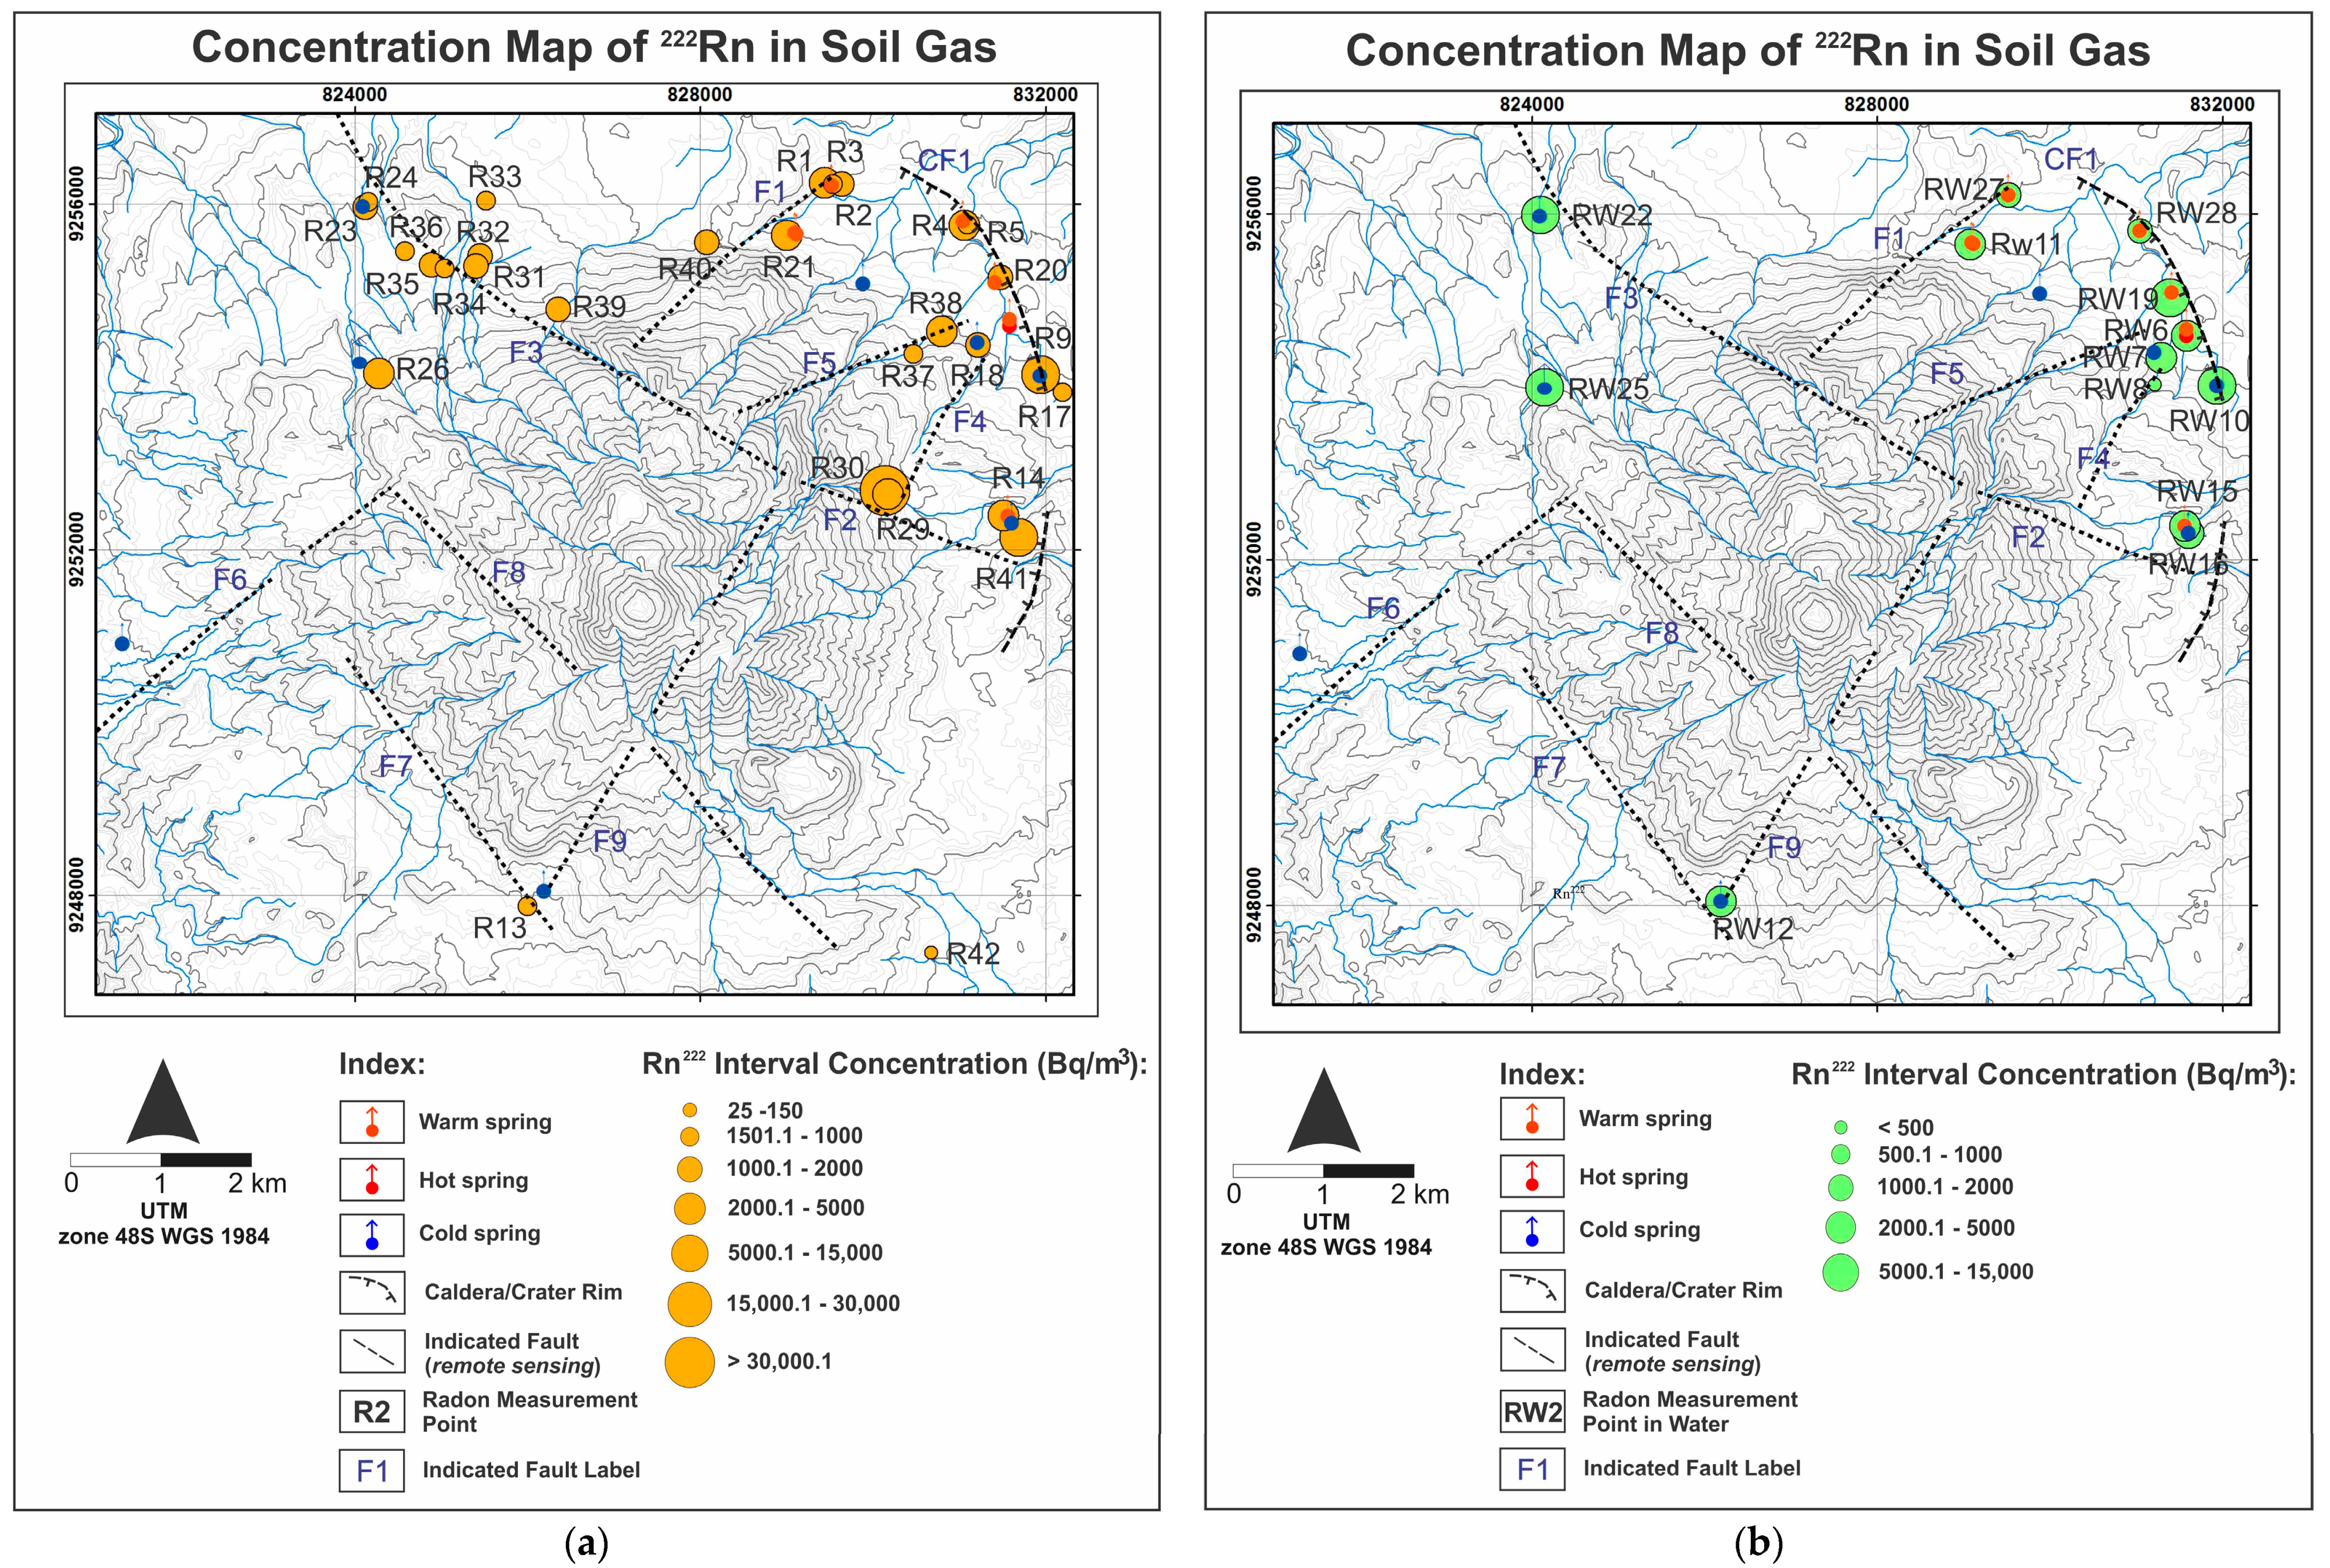
In addition to the hydrogeochemistry method, soil-gas and dissolved
222Rn measurements were performed at 42 points to interpret geological structures that control the fluid chemistry (
Figure 4). Faults, as the secondary permeability, control the primary fluid path of the system; each fault and/or fracture can produce different discharged fluid types and characteristics. This condition may be affected by the shallow and deep process during the lateral flow of deep thermal fluid into the surface. This can be found from several geochemical and isotope analyses of the water samples. In this research, soil-gas and dissolved
222Rn analyses were performed to find and analyze subsurface permeable structures that may act as an effective conduit for ascending geothermal fluids. This method is a powerful technique for discovering permeable fractures for the deep fluid path to the surface and the path of recharged meteoric water into the deep system. This is because radon is an inert gas and not related to atmospheric gasses [
27].
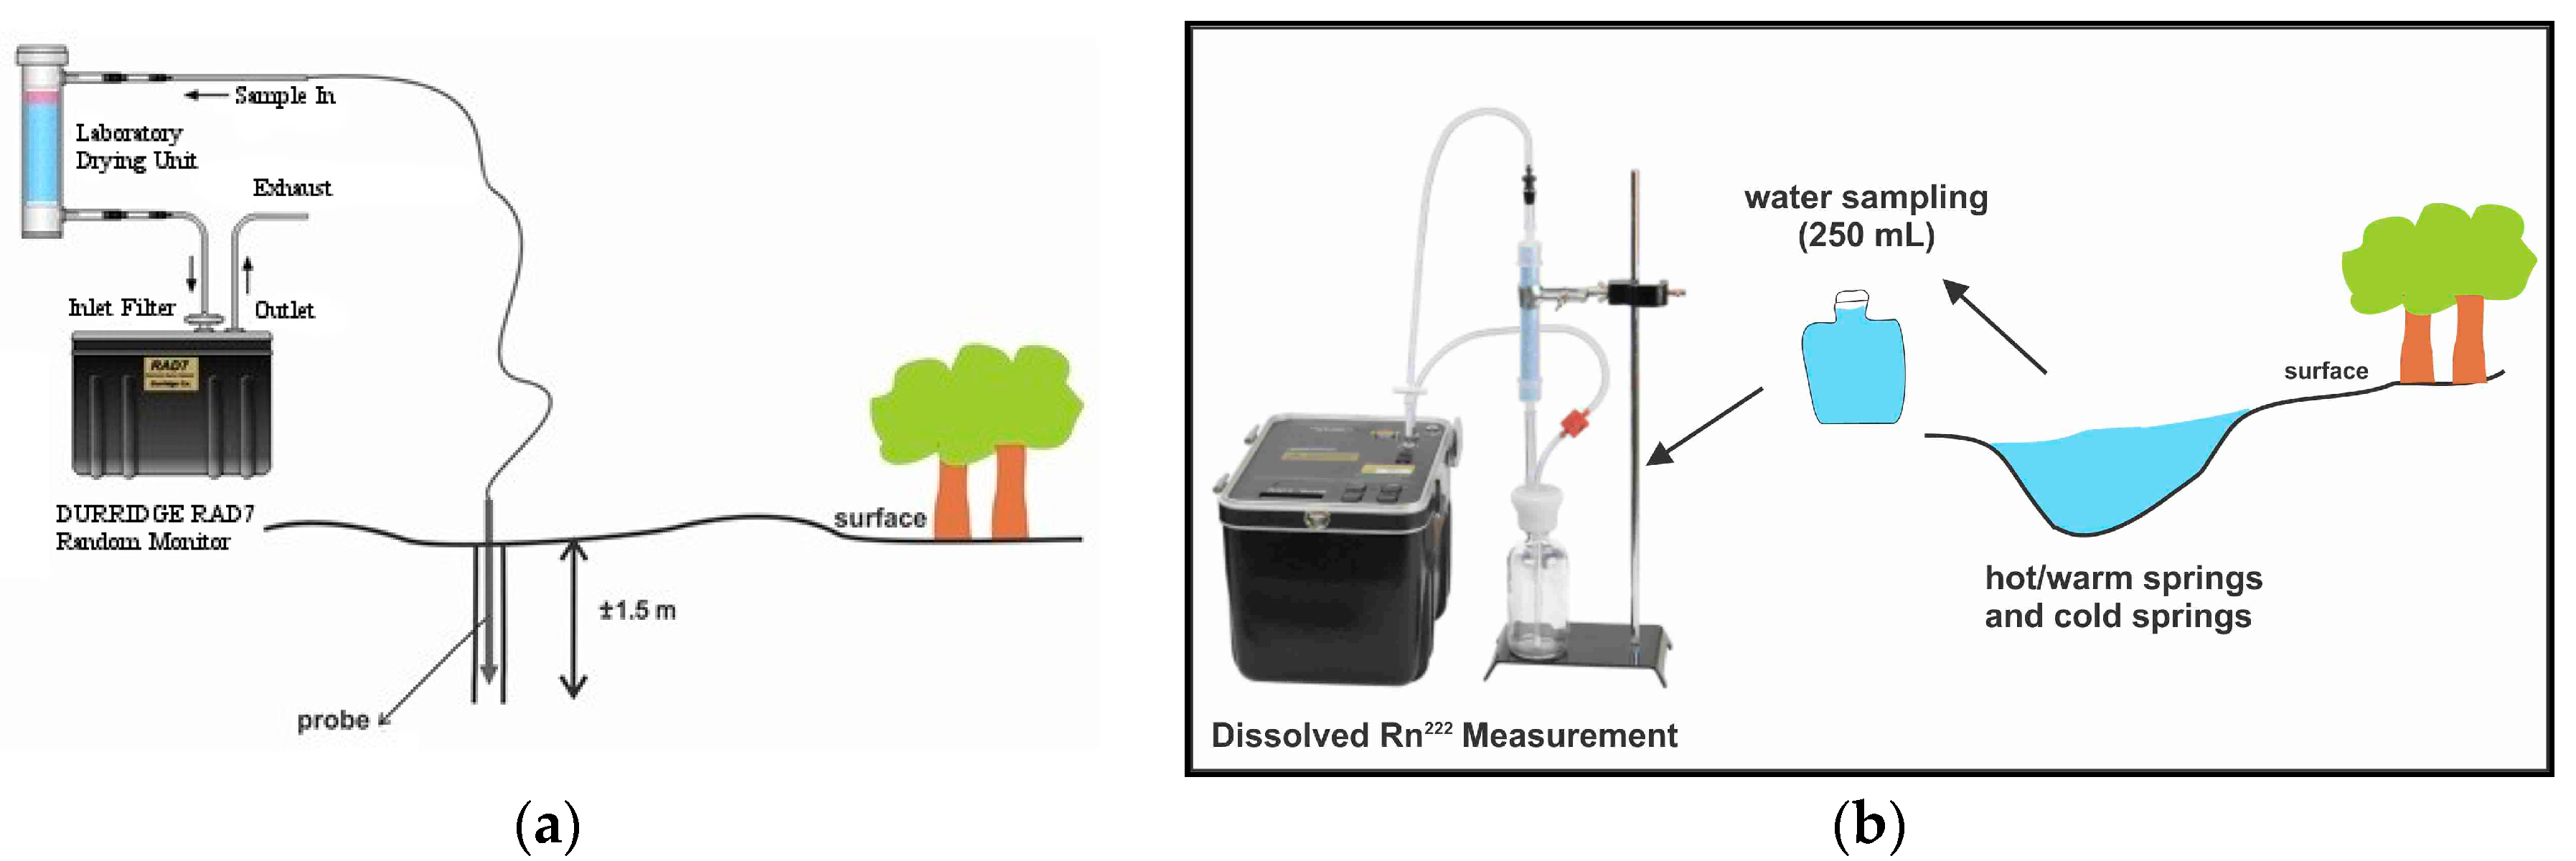
In this research, soil-gas and dissolved
222Rn concentration measurements were performed at the Tampomas Volcano and in some cold and thermal springs using RAD7. When analyzing dissolved
222Rn, RADH20 was attached to the machine. There were 29 measurement points for
222Rn concentration in soil-gas (
Figure 4). Each point has a hole of 1.5 m in depth. Every measurement was run for 5 cycles, and each cycle was 5 minutes long. Prior to measurement, RAD7 was run in purge mode until the radon concentration was less than <100 Bq/m
3. After the purging process, the measurement was run in normal mode for
222Rn and
220Rn measurements (
Figure 6a).
The measurement of dissolved
222Rn concentration in water was conducted for 13 water samples. This consisted of 6 samples from thermal springs, 6 samples from cold springs and 1 sample from river water. Each sample contained 250 mL of water in the absence of a bubble. The purging procedure was performed before normal WAT250 mode was run for measuring the dissolved
222Rn. The measurements were also run for 5 cycles for each sample. This was conducted directly after the water was sampled in a glass bottle (
Figure 6b).

 ,
, 


