Assessing Flood Hazard at River Basin Scale with an Index-Based Approach: The Case of Mouriki, Greece

 , , and
Abstract
:1. Introduction
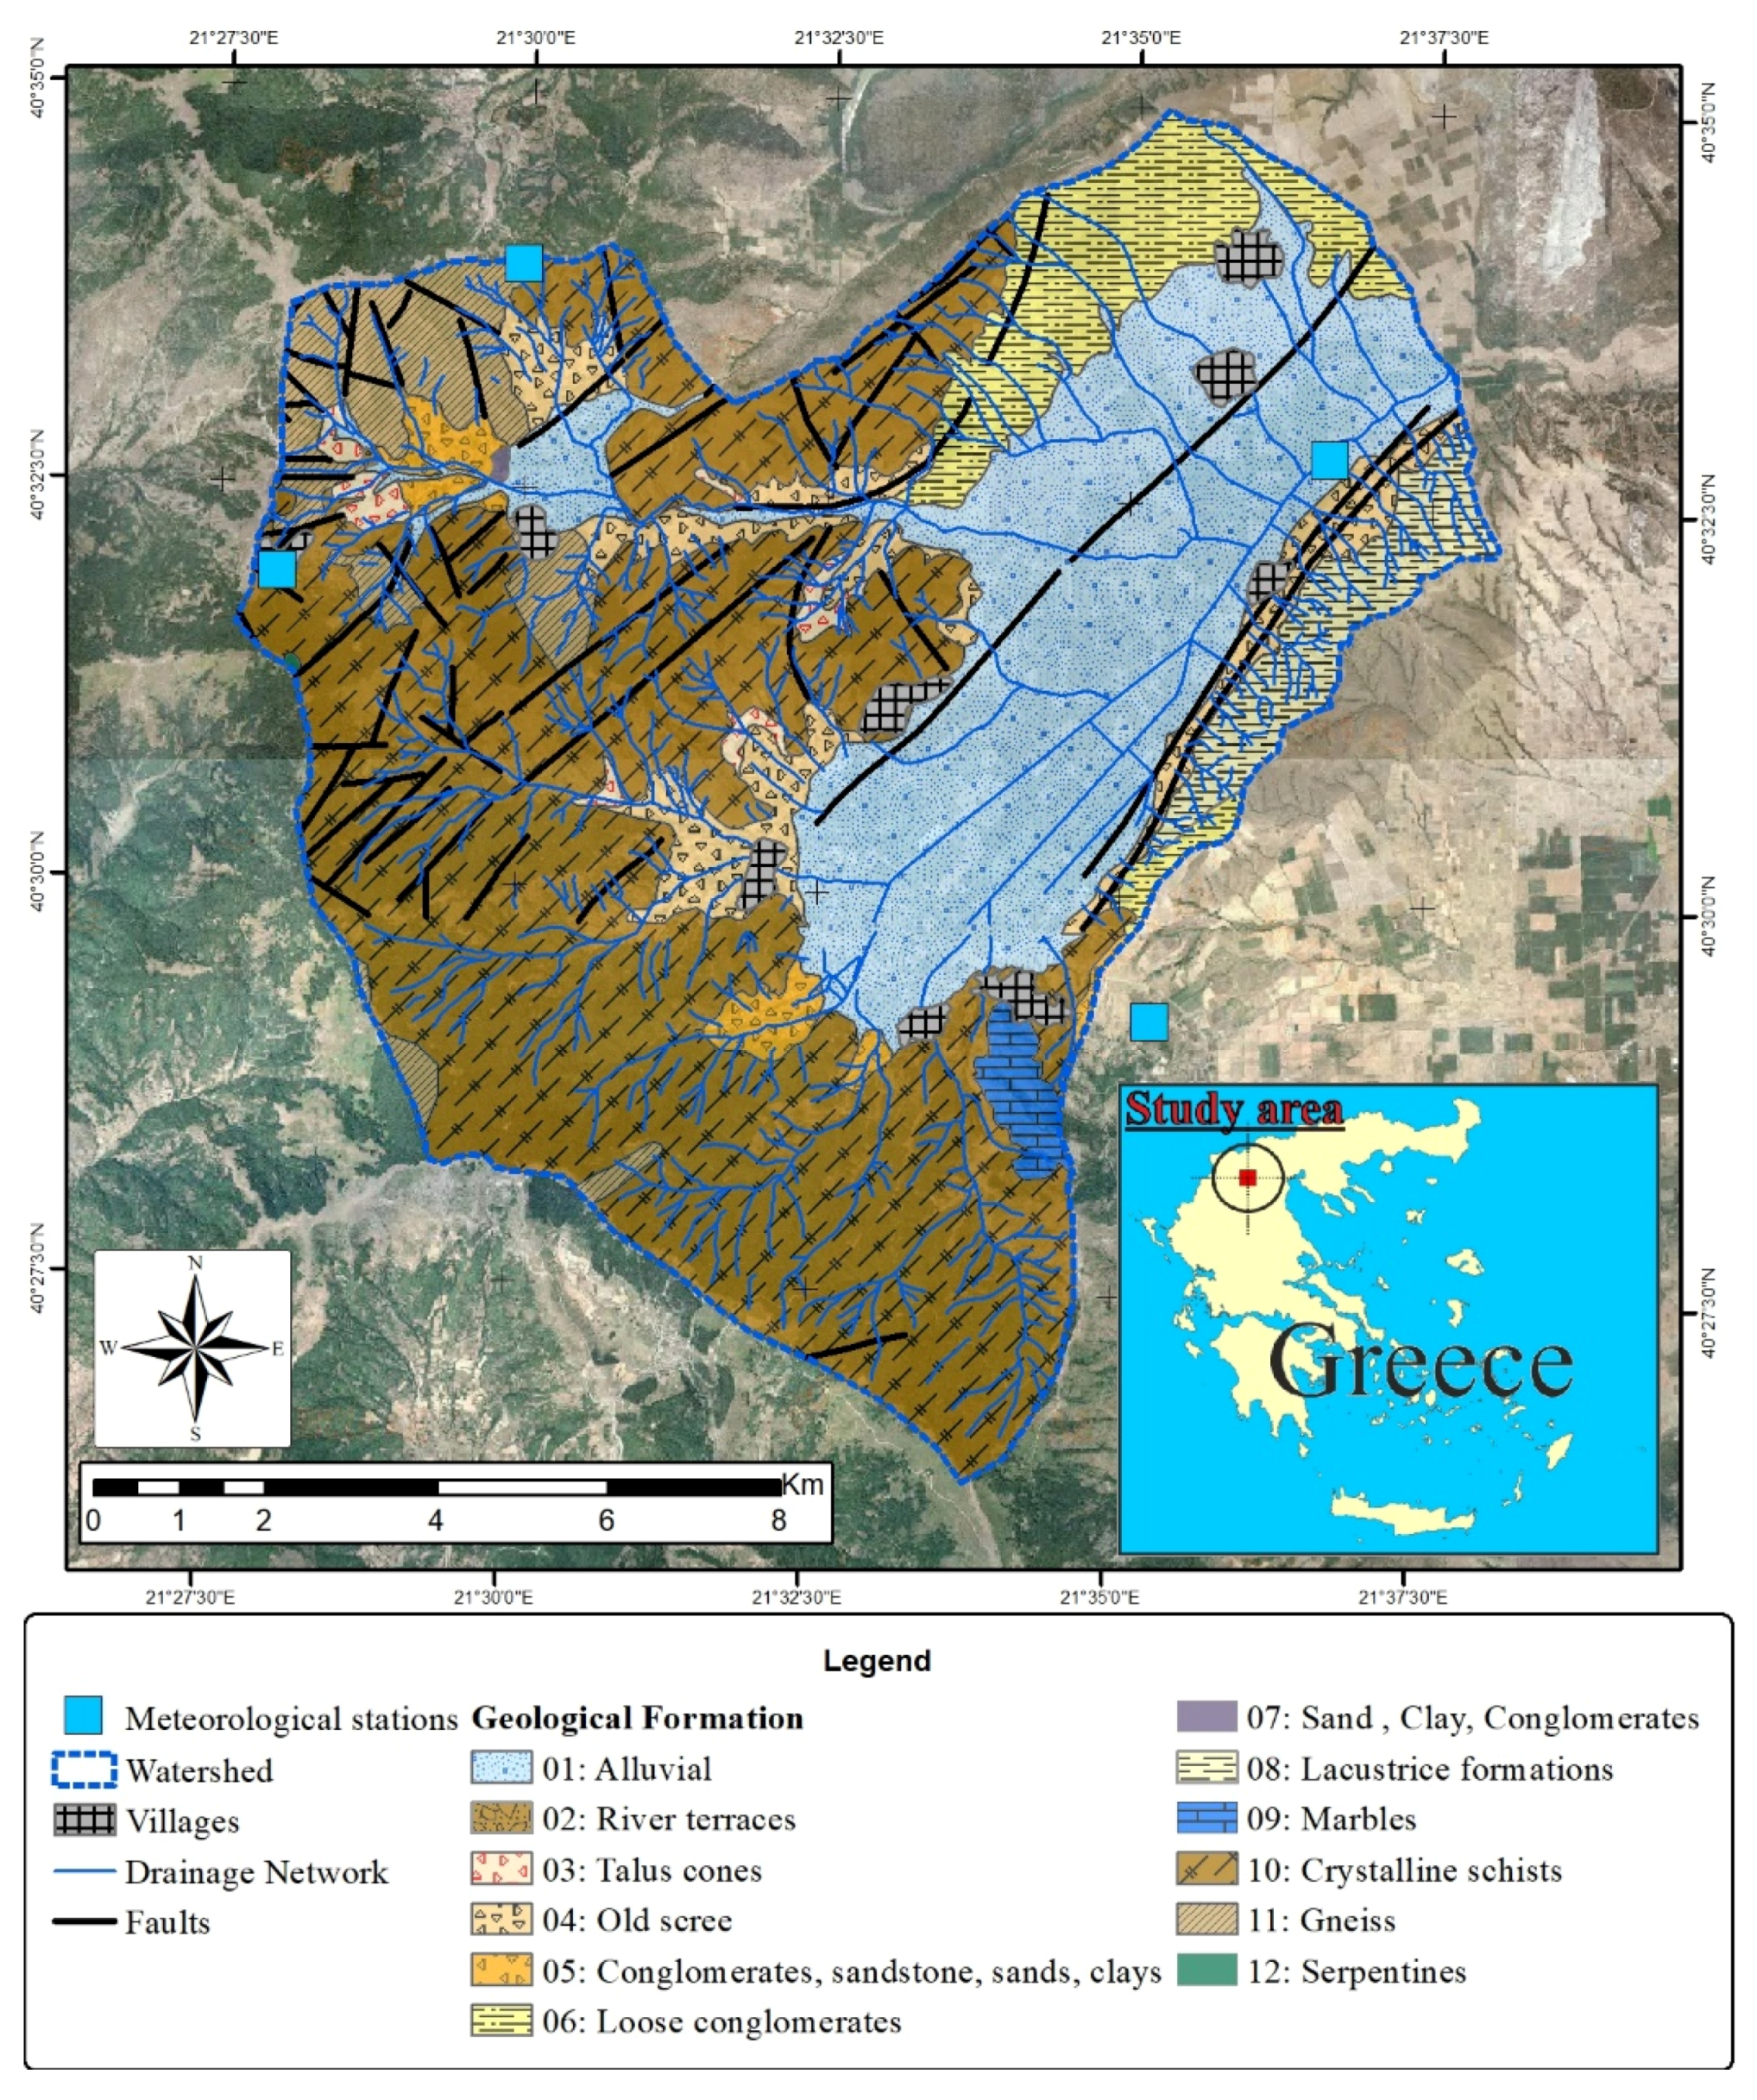
2. Study Area
3. Materials and Methods
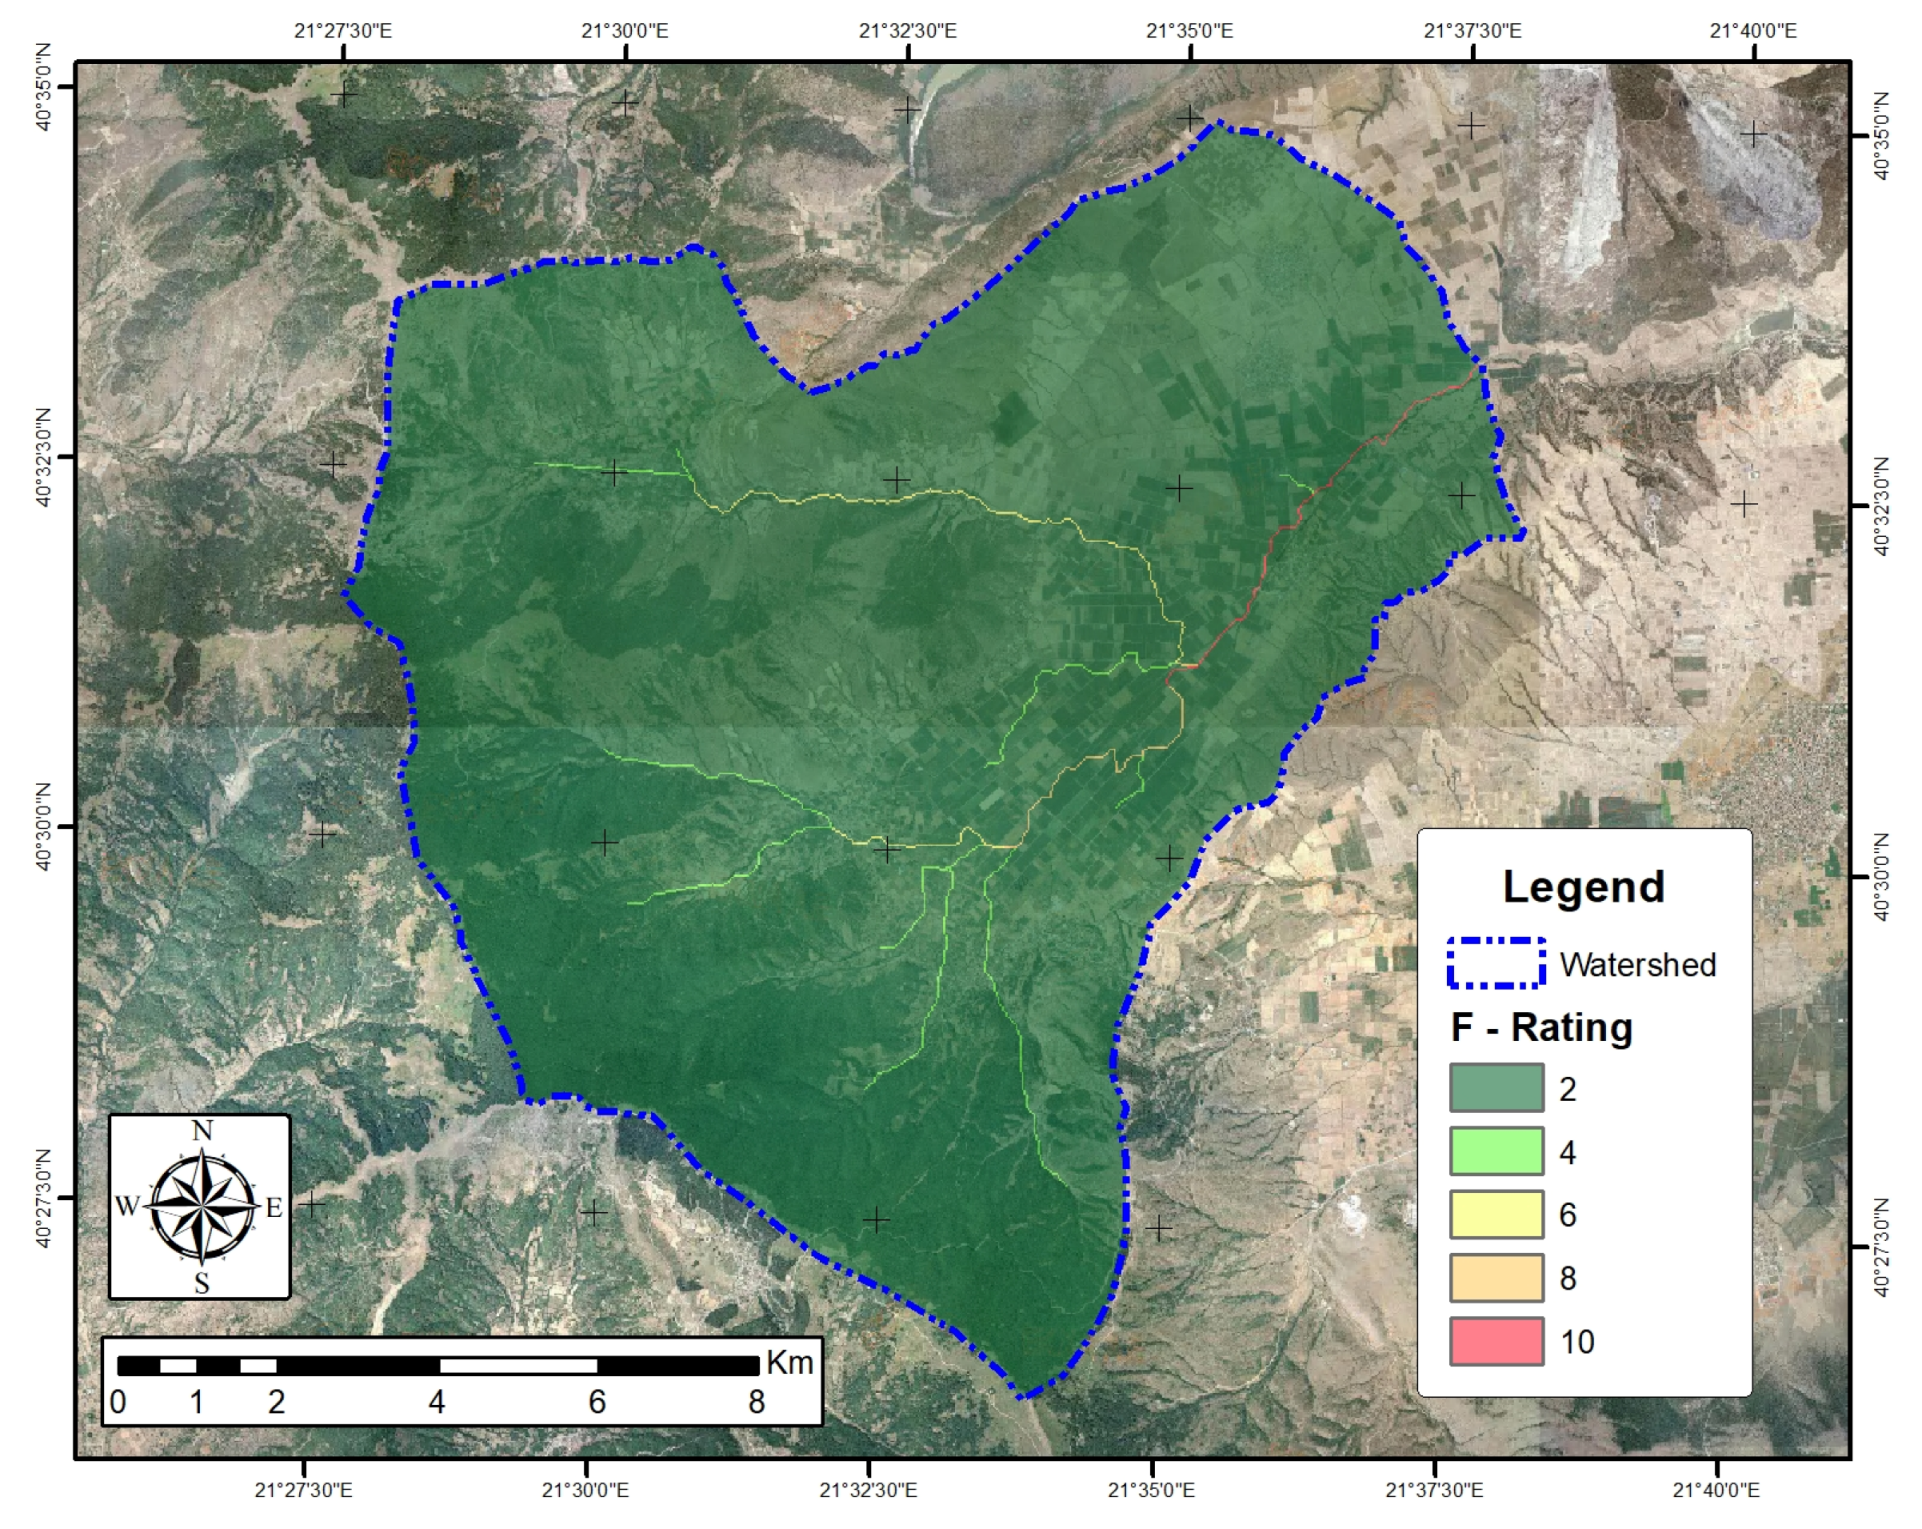
3.1. Flow Accumulation (F)
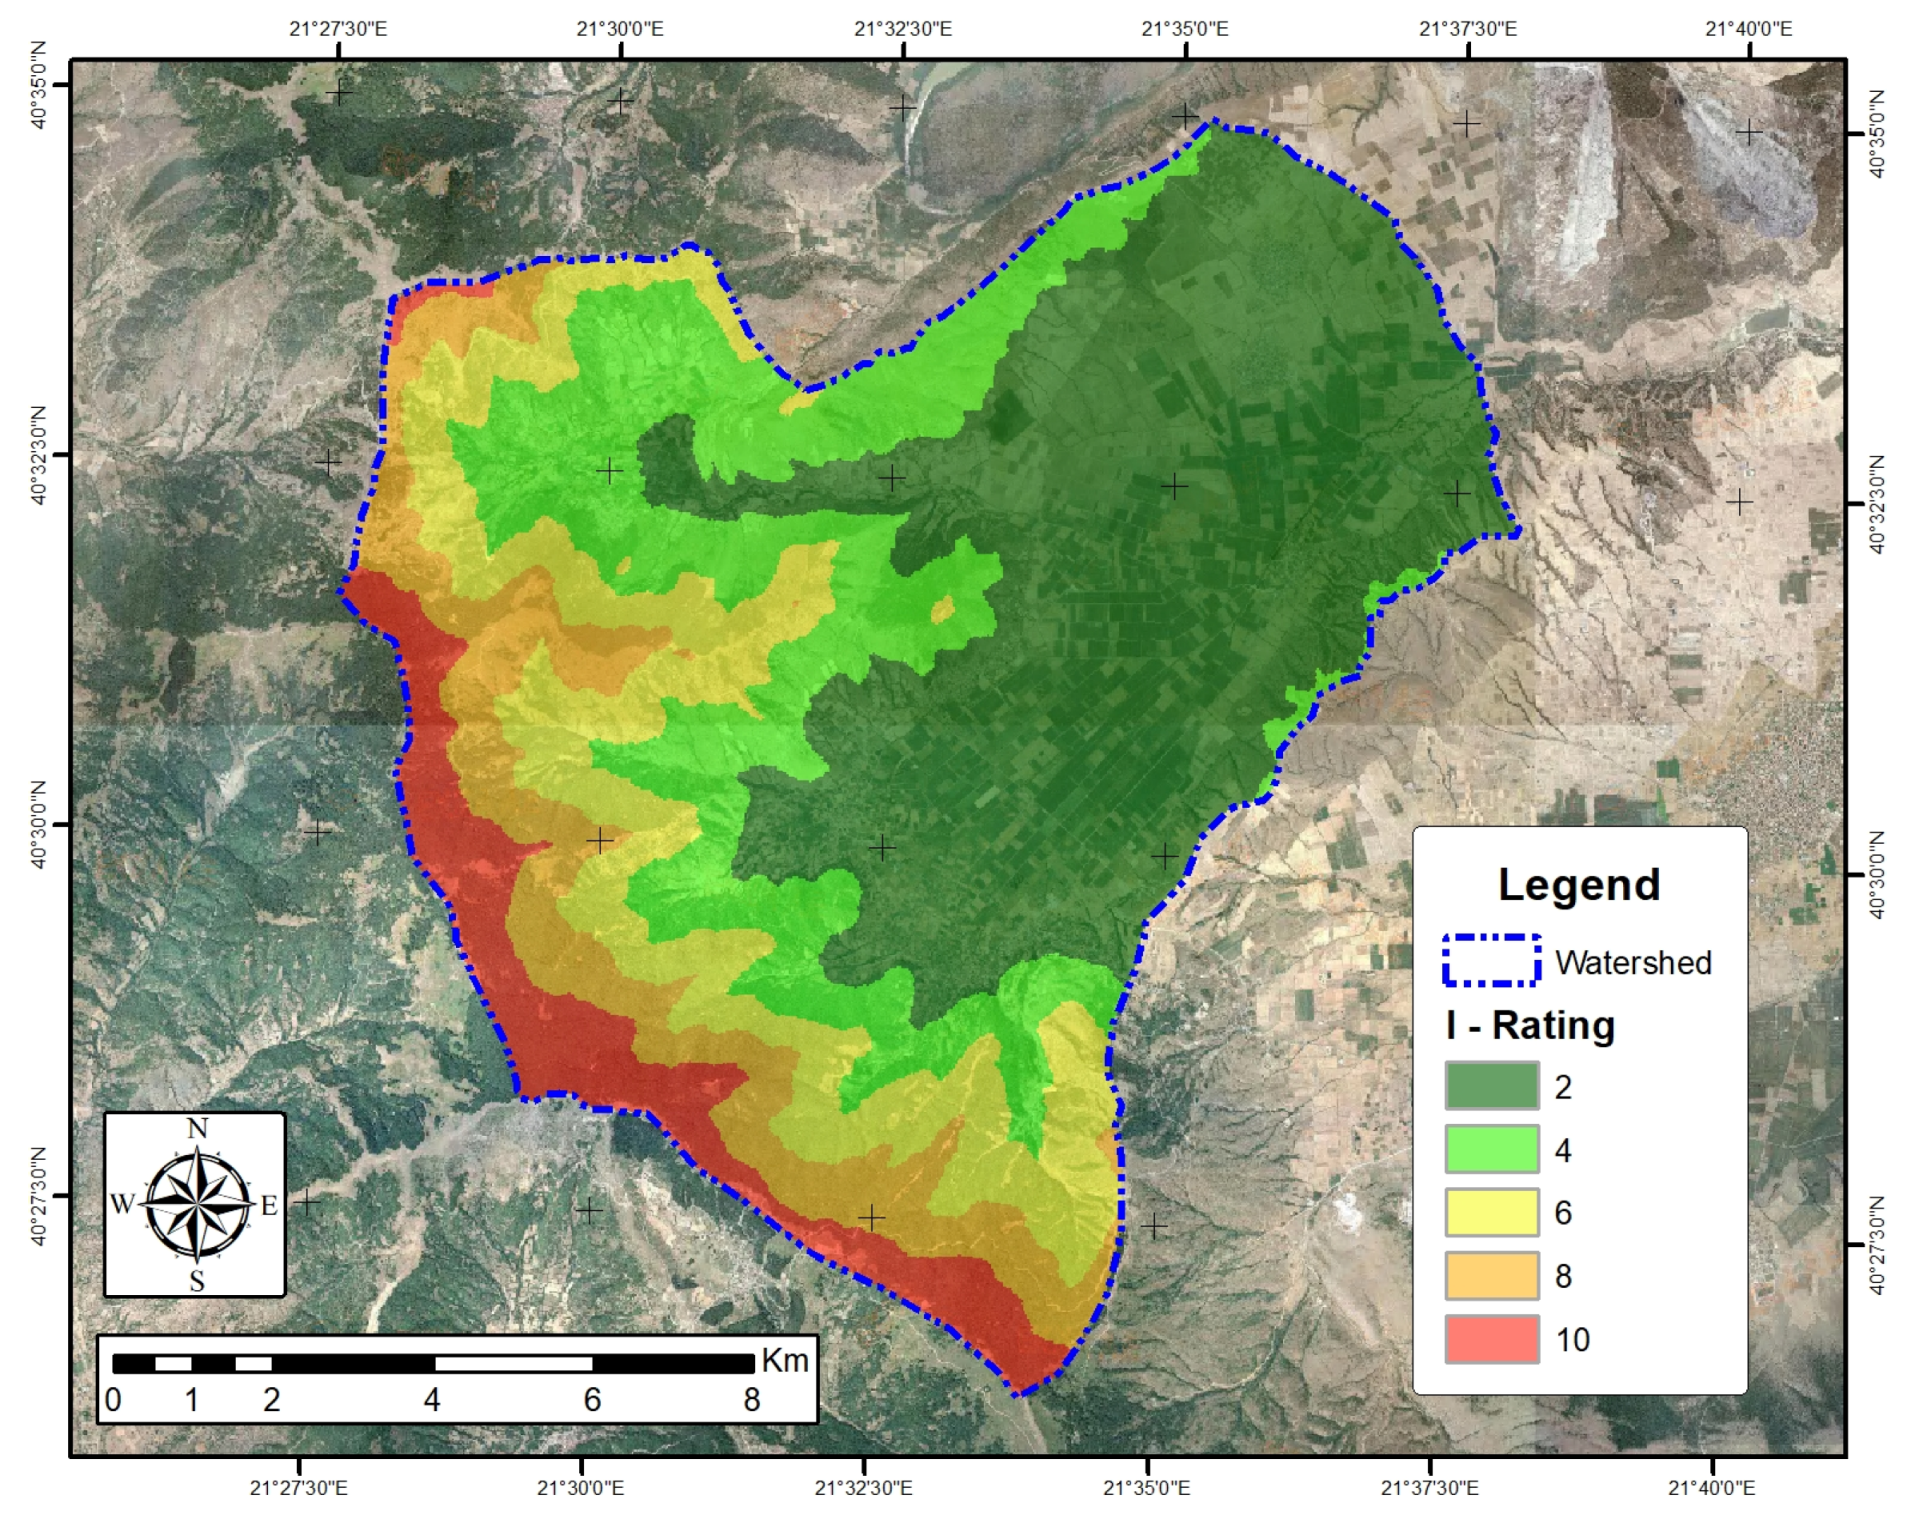
3.2. Rainfall Intensity (I)
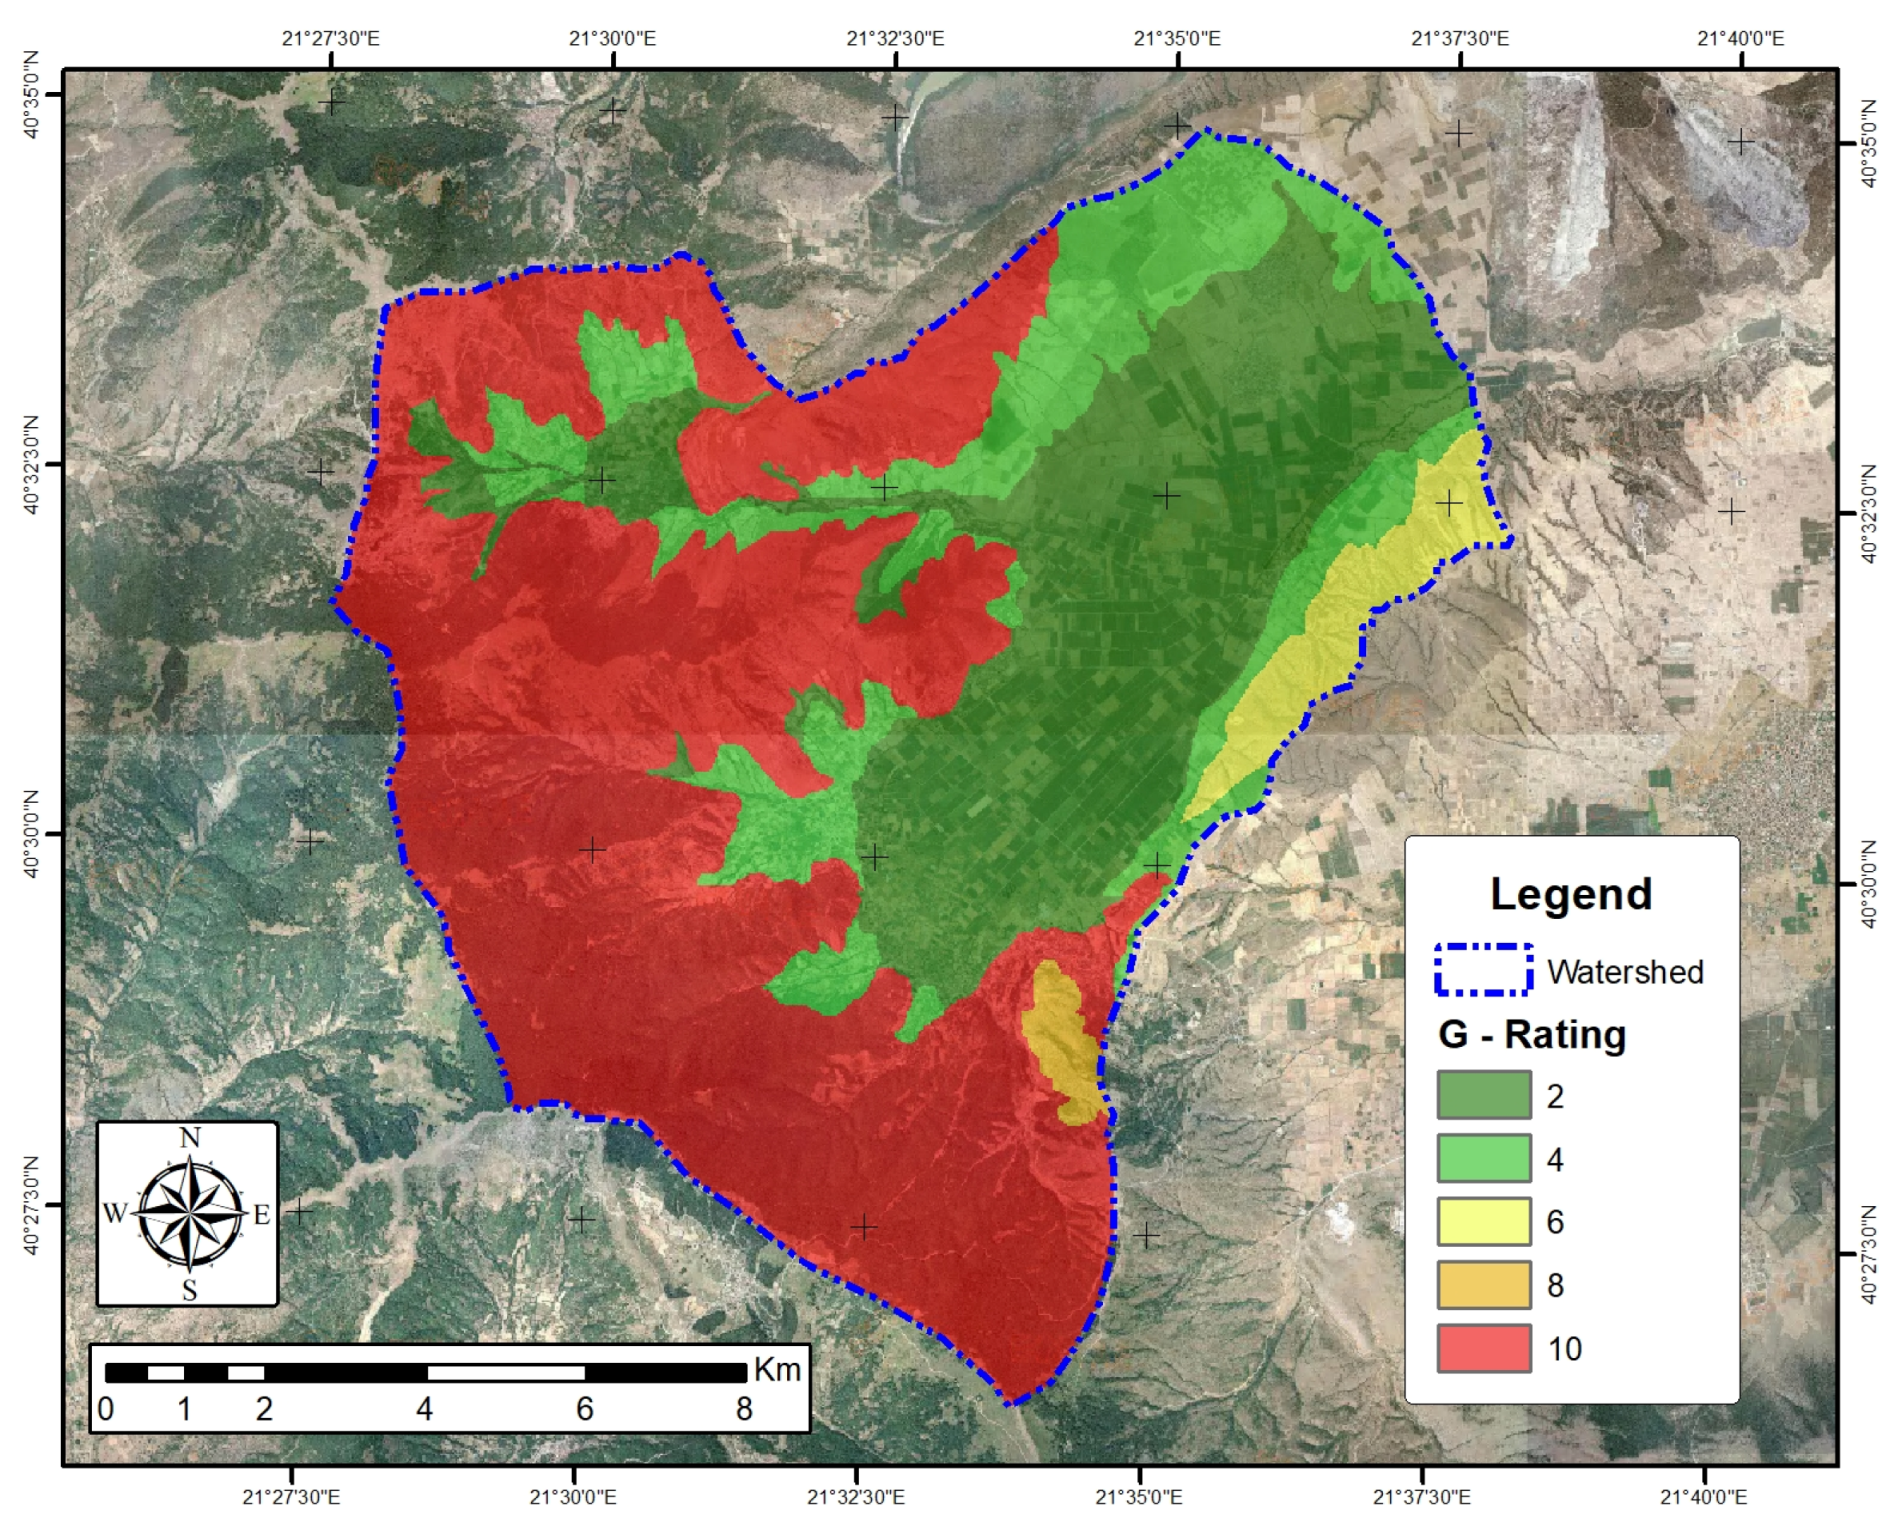
3.3. Geology (G)
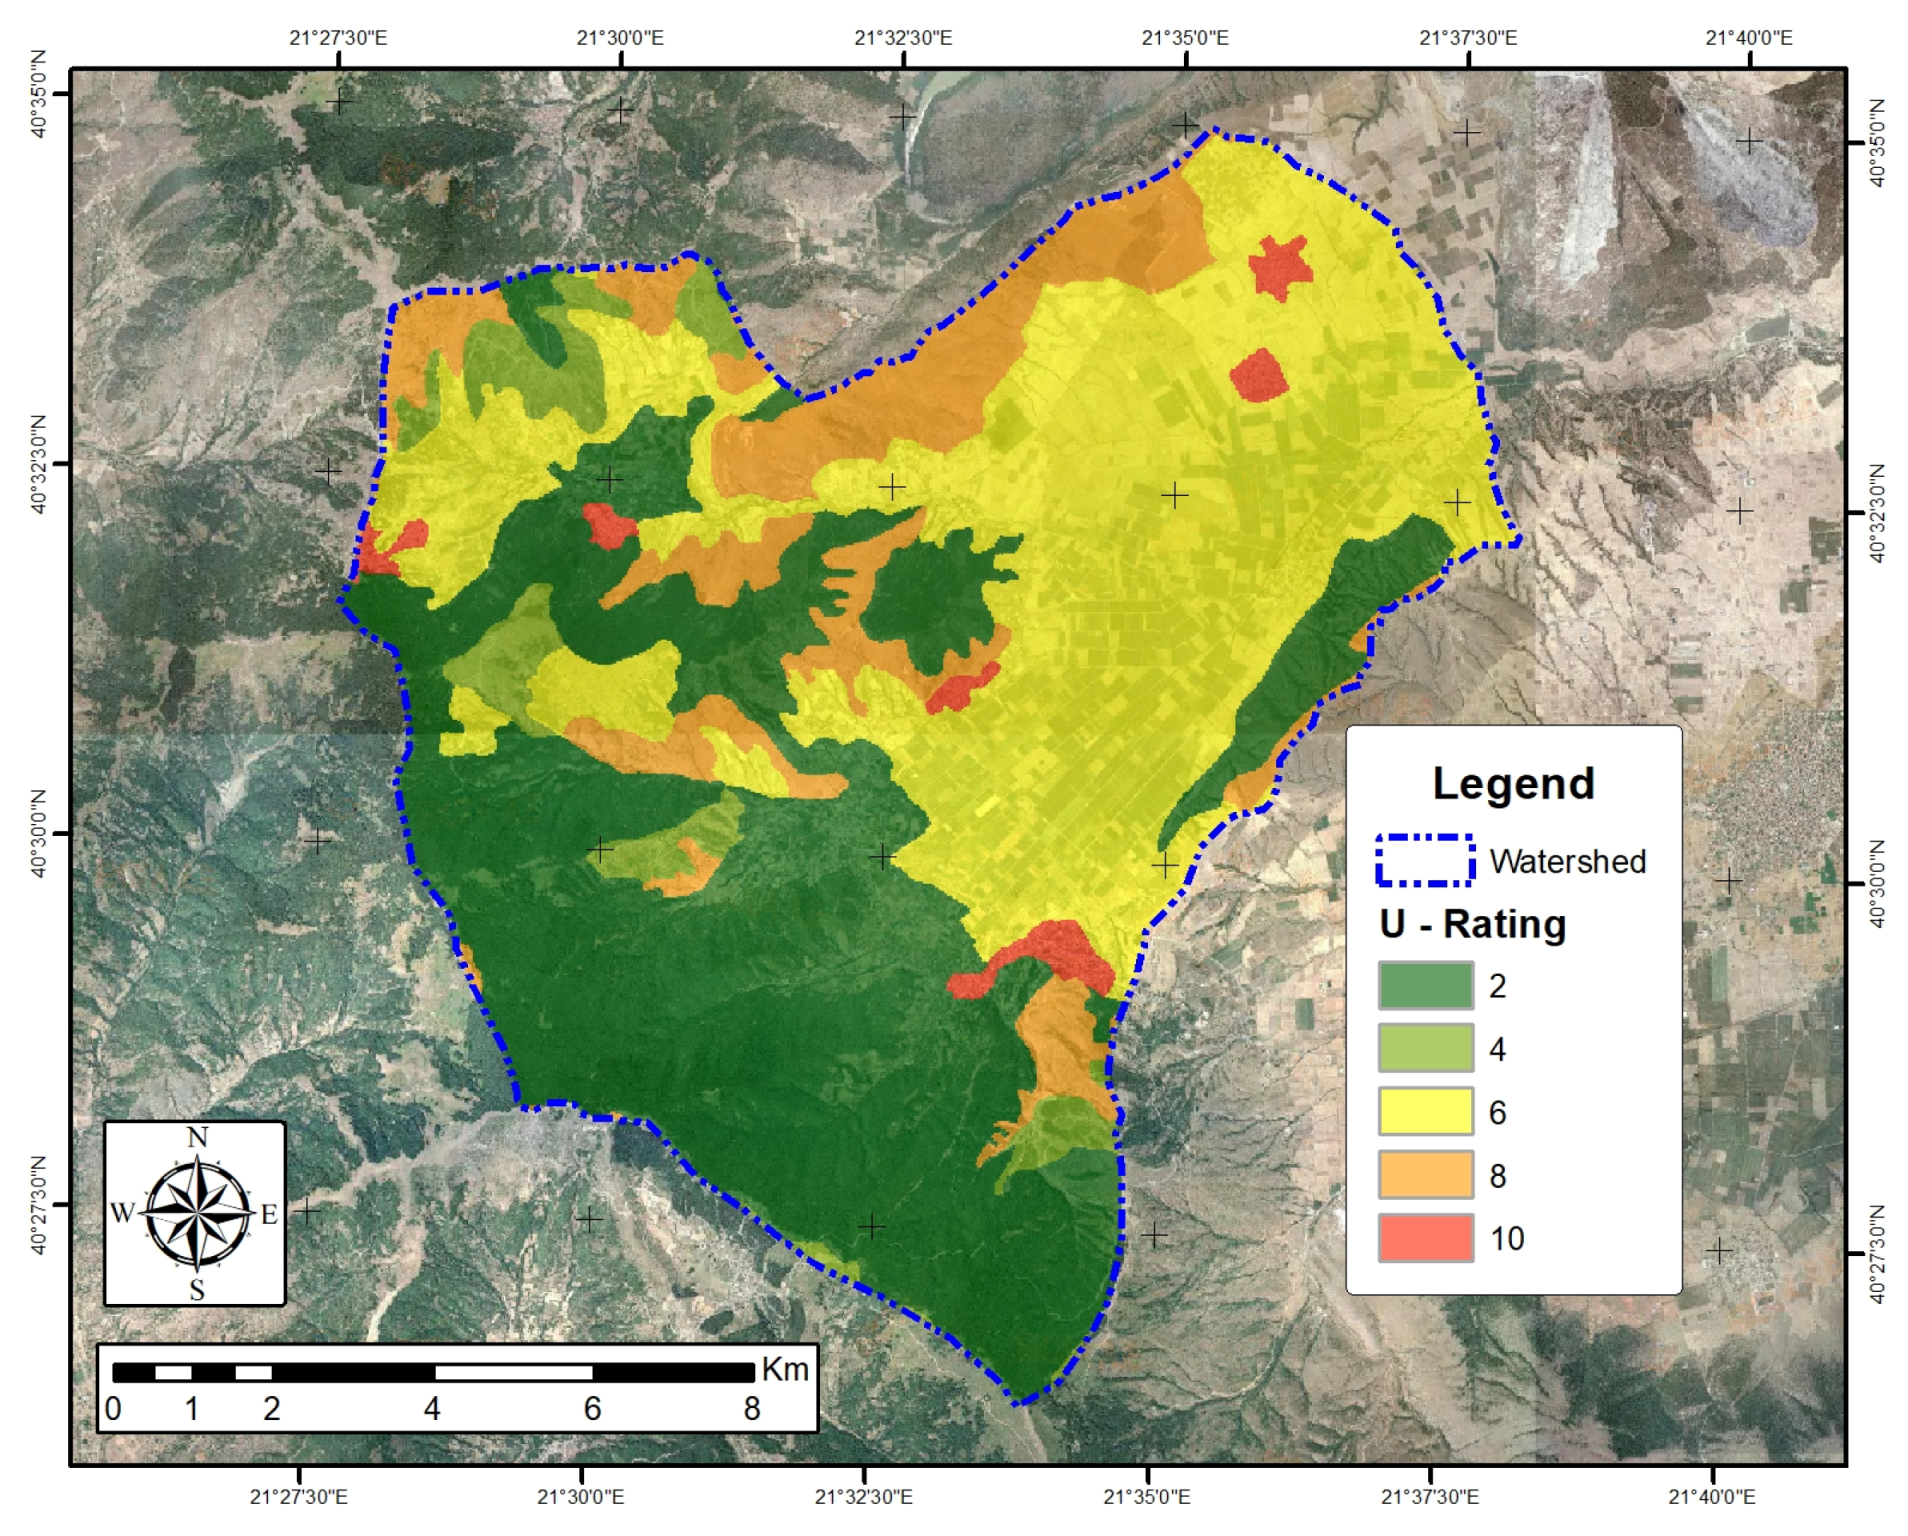
3.4. Land Use (U)
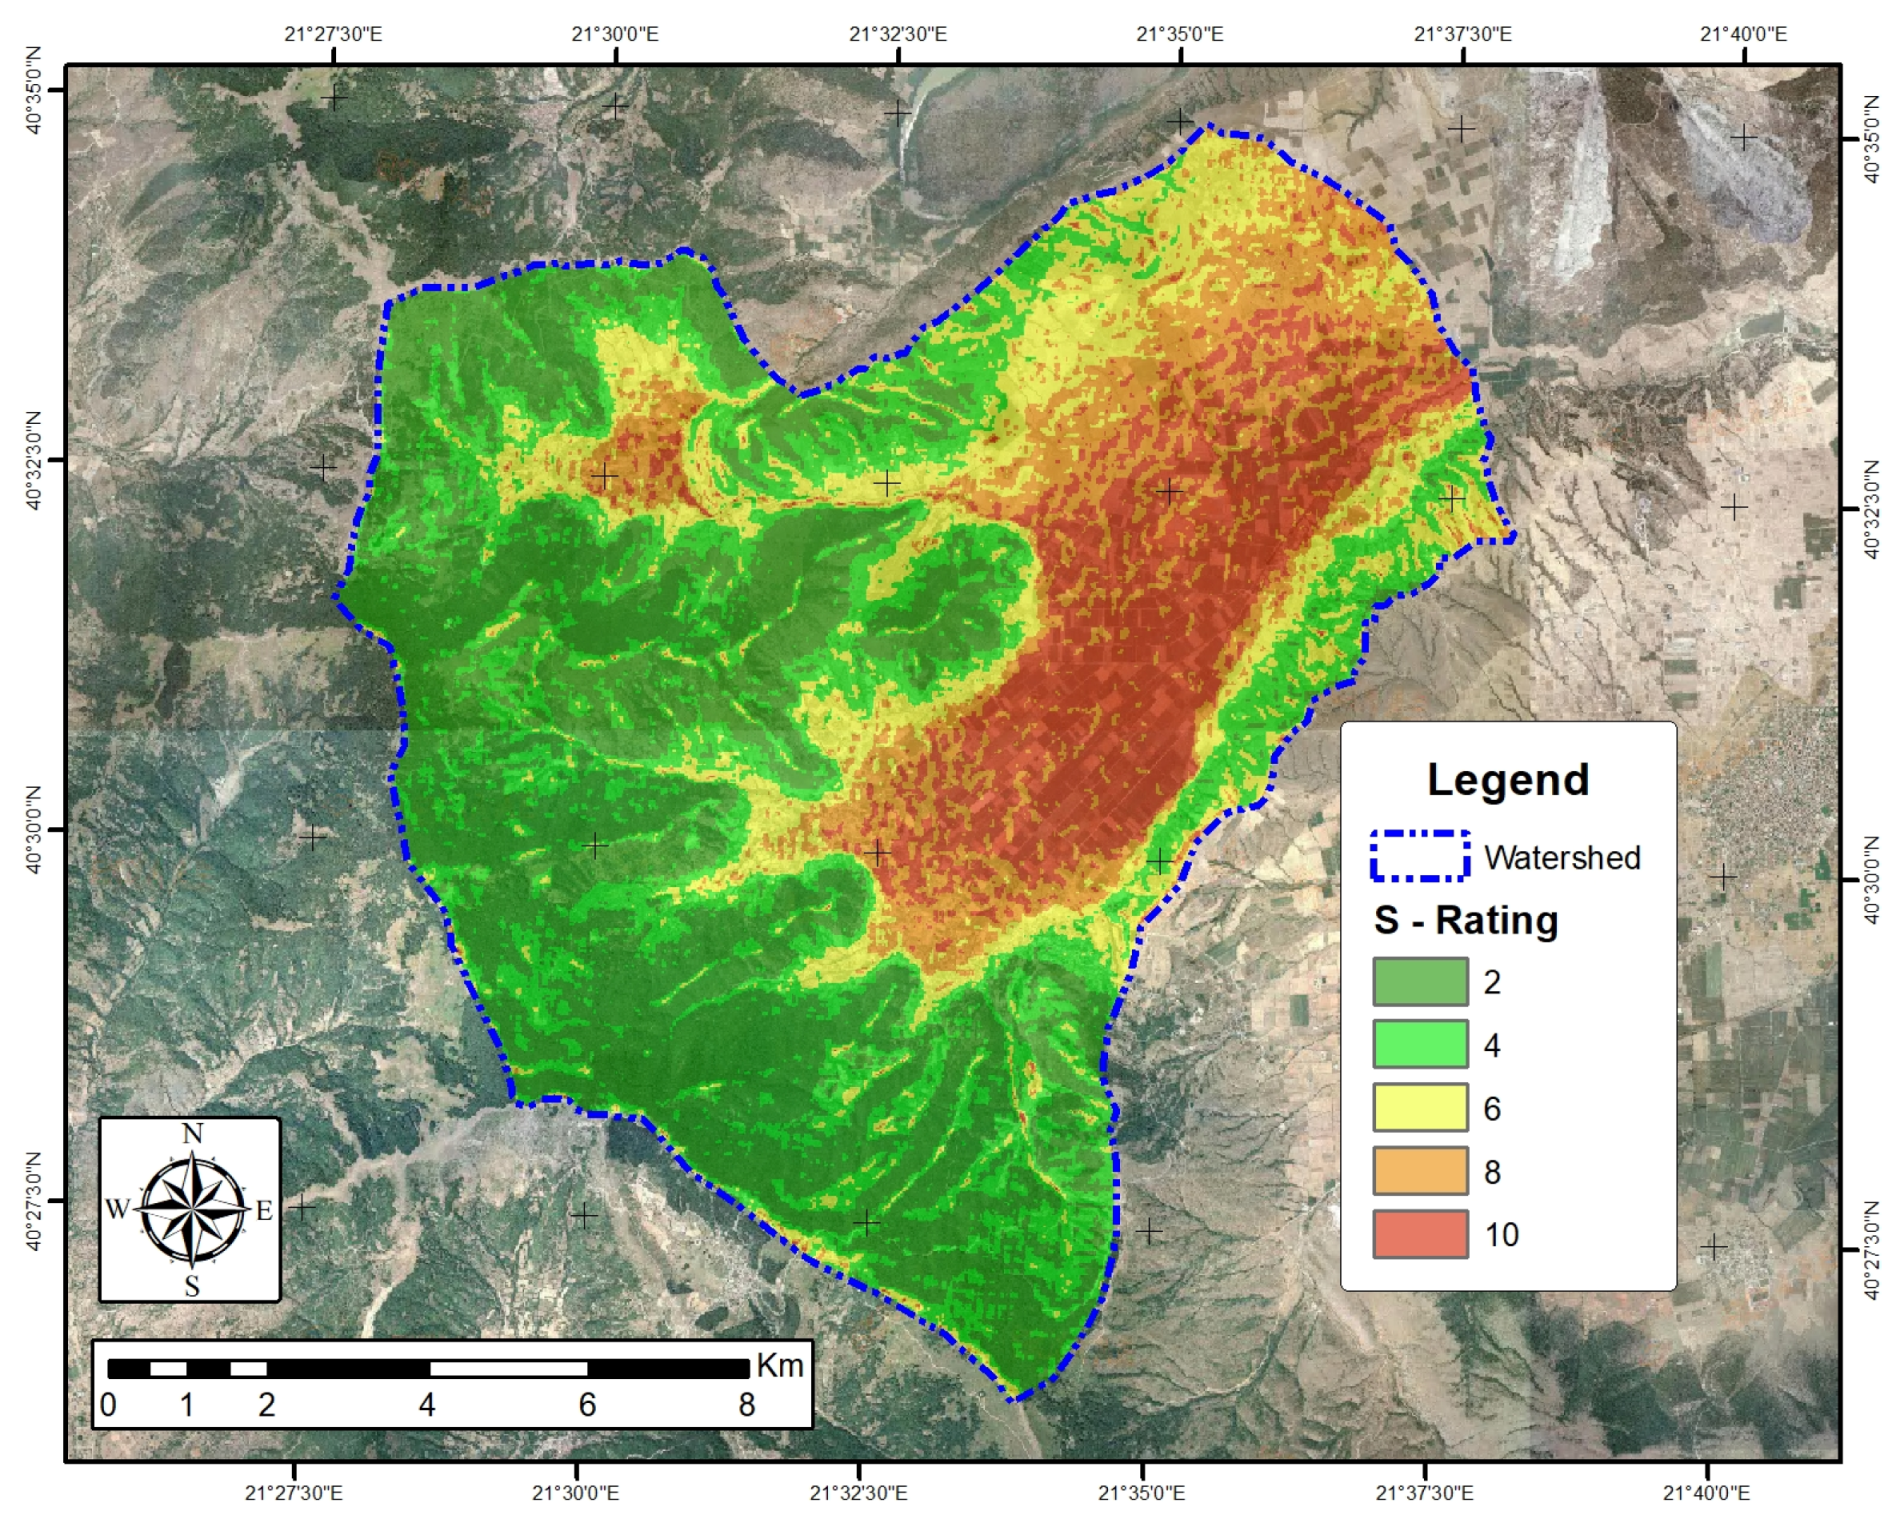
3.5. Slope (S)
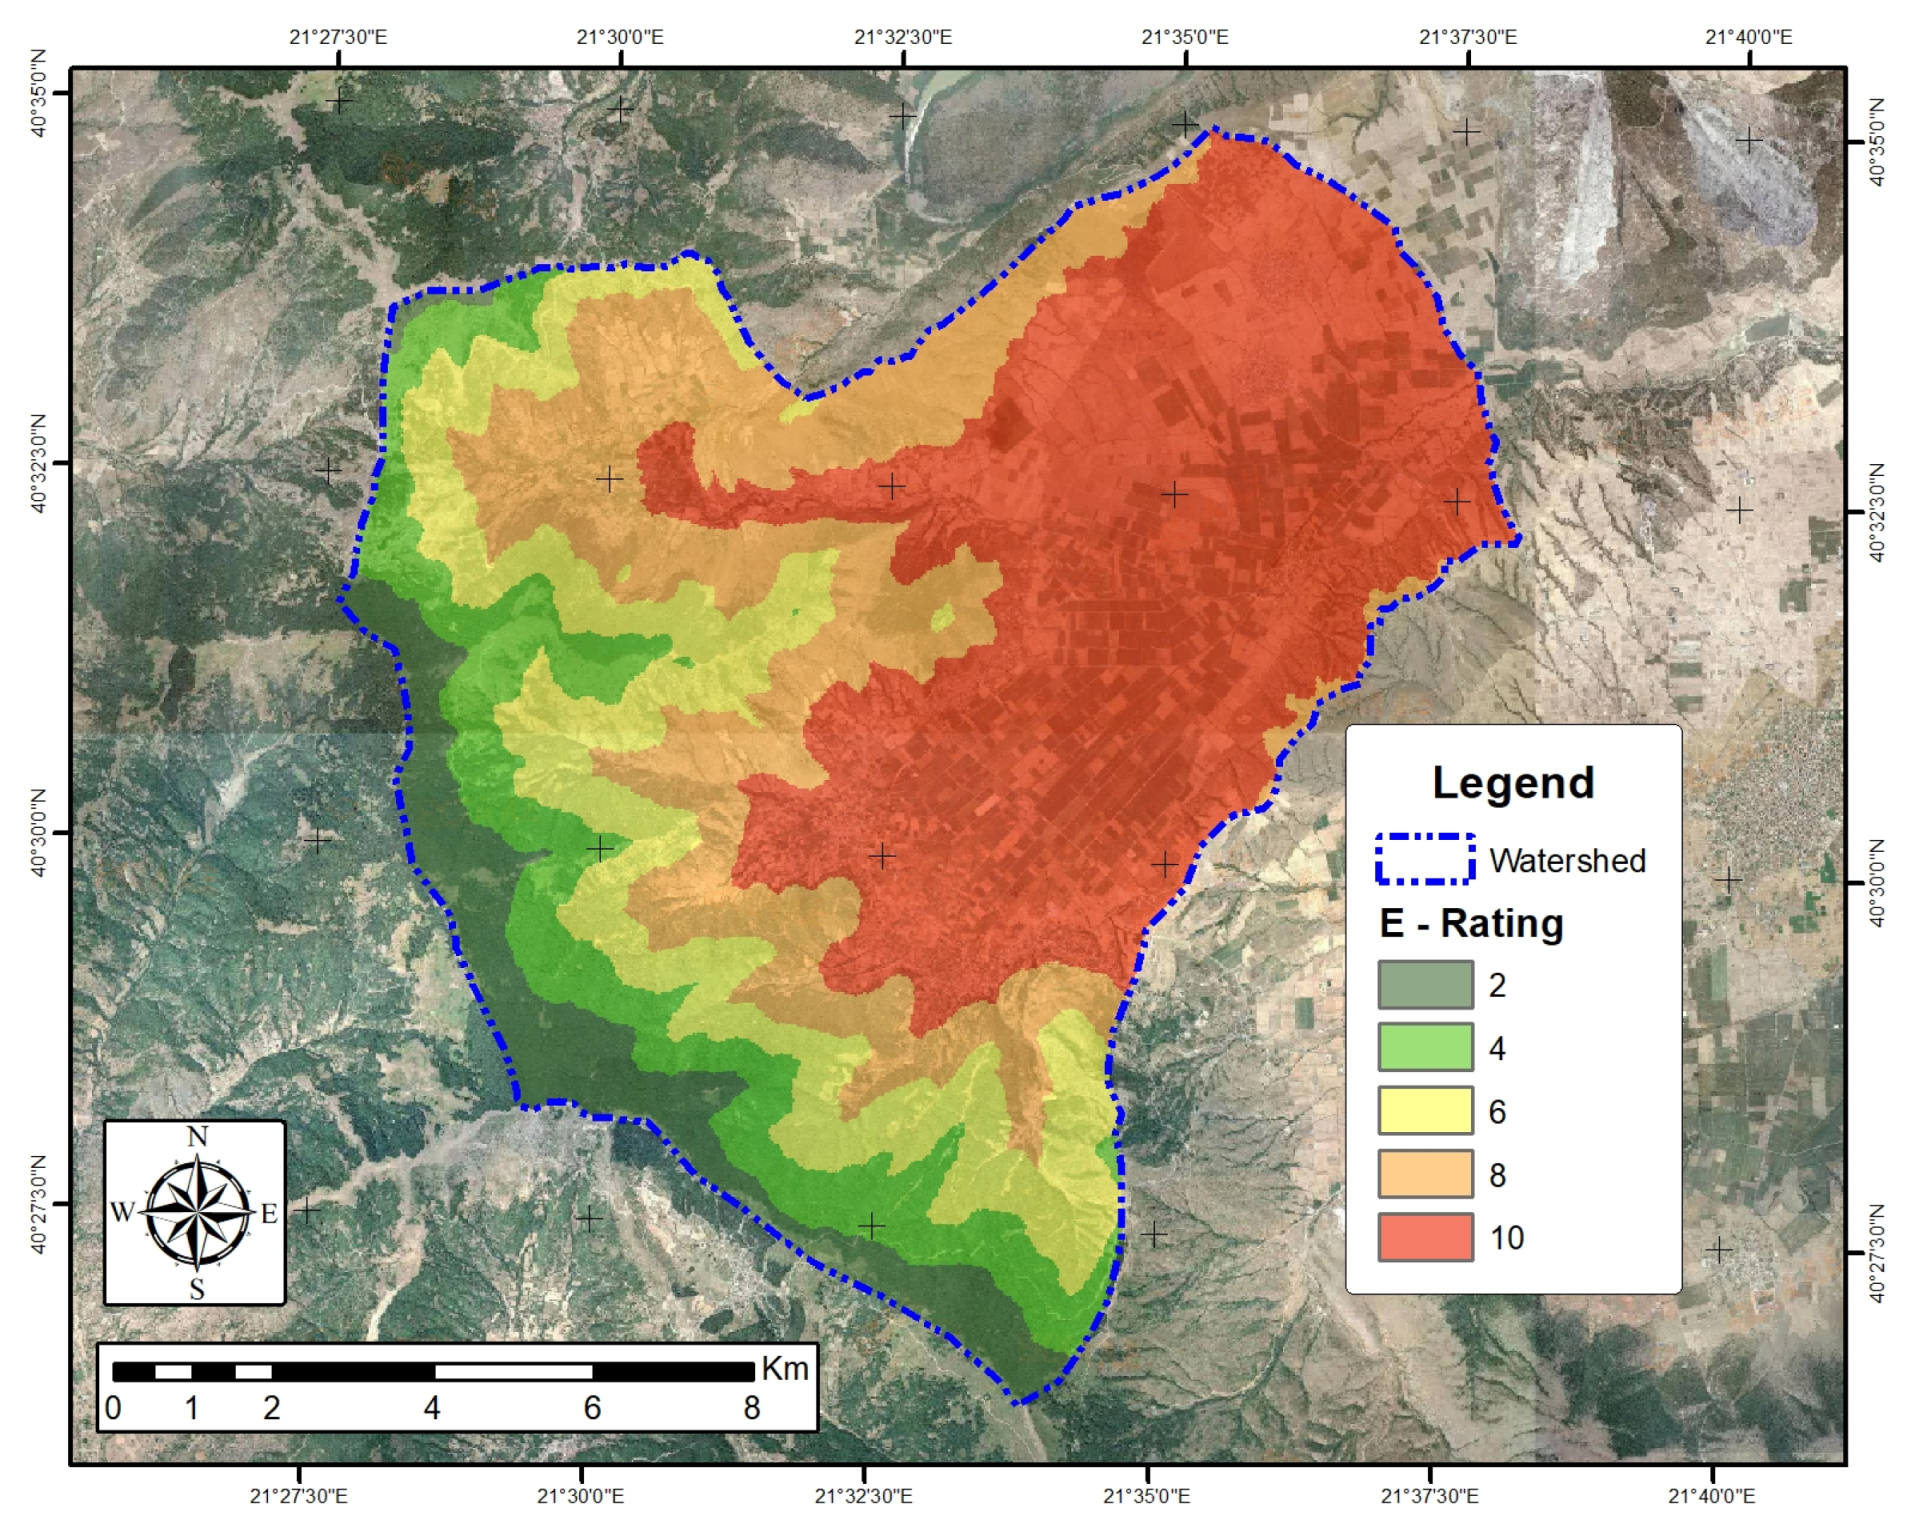
3.6. Elevation (E)
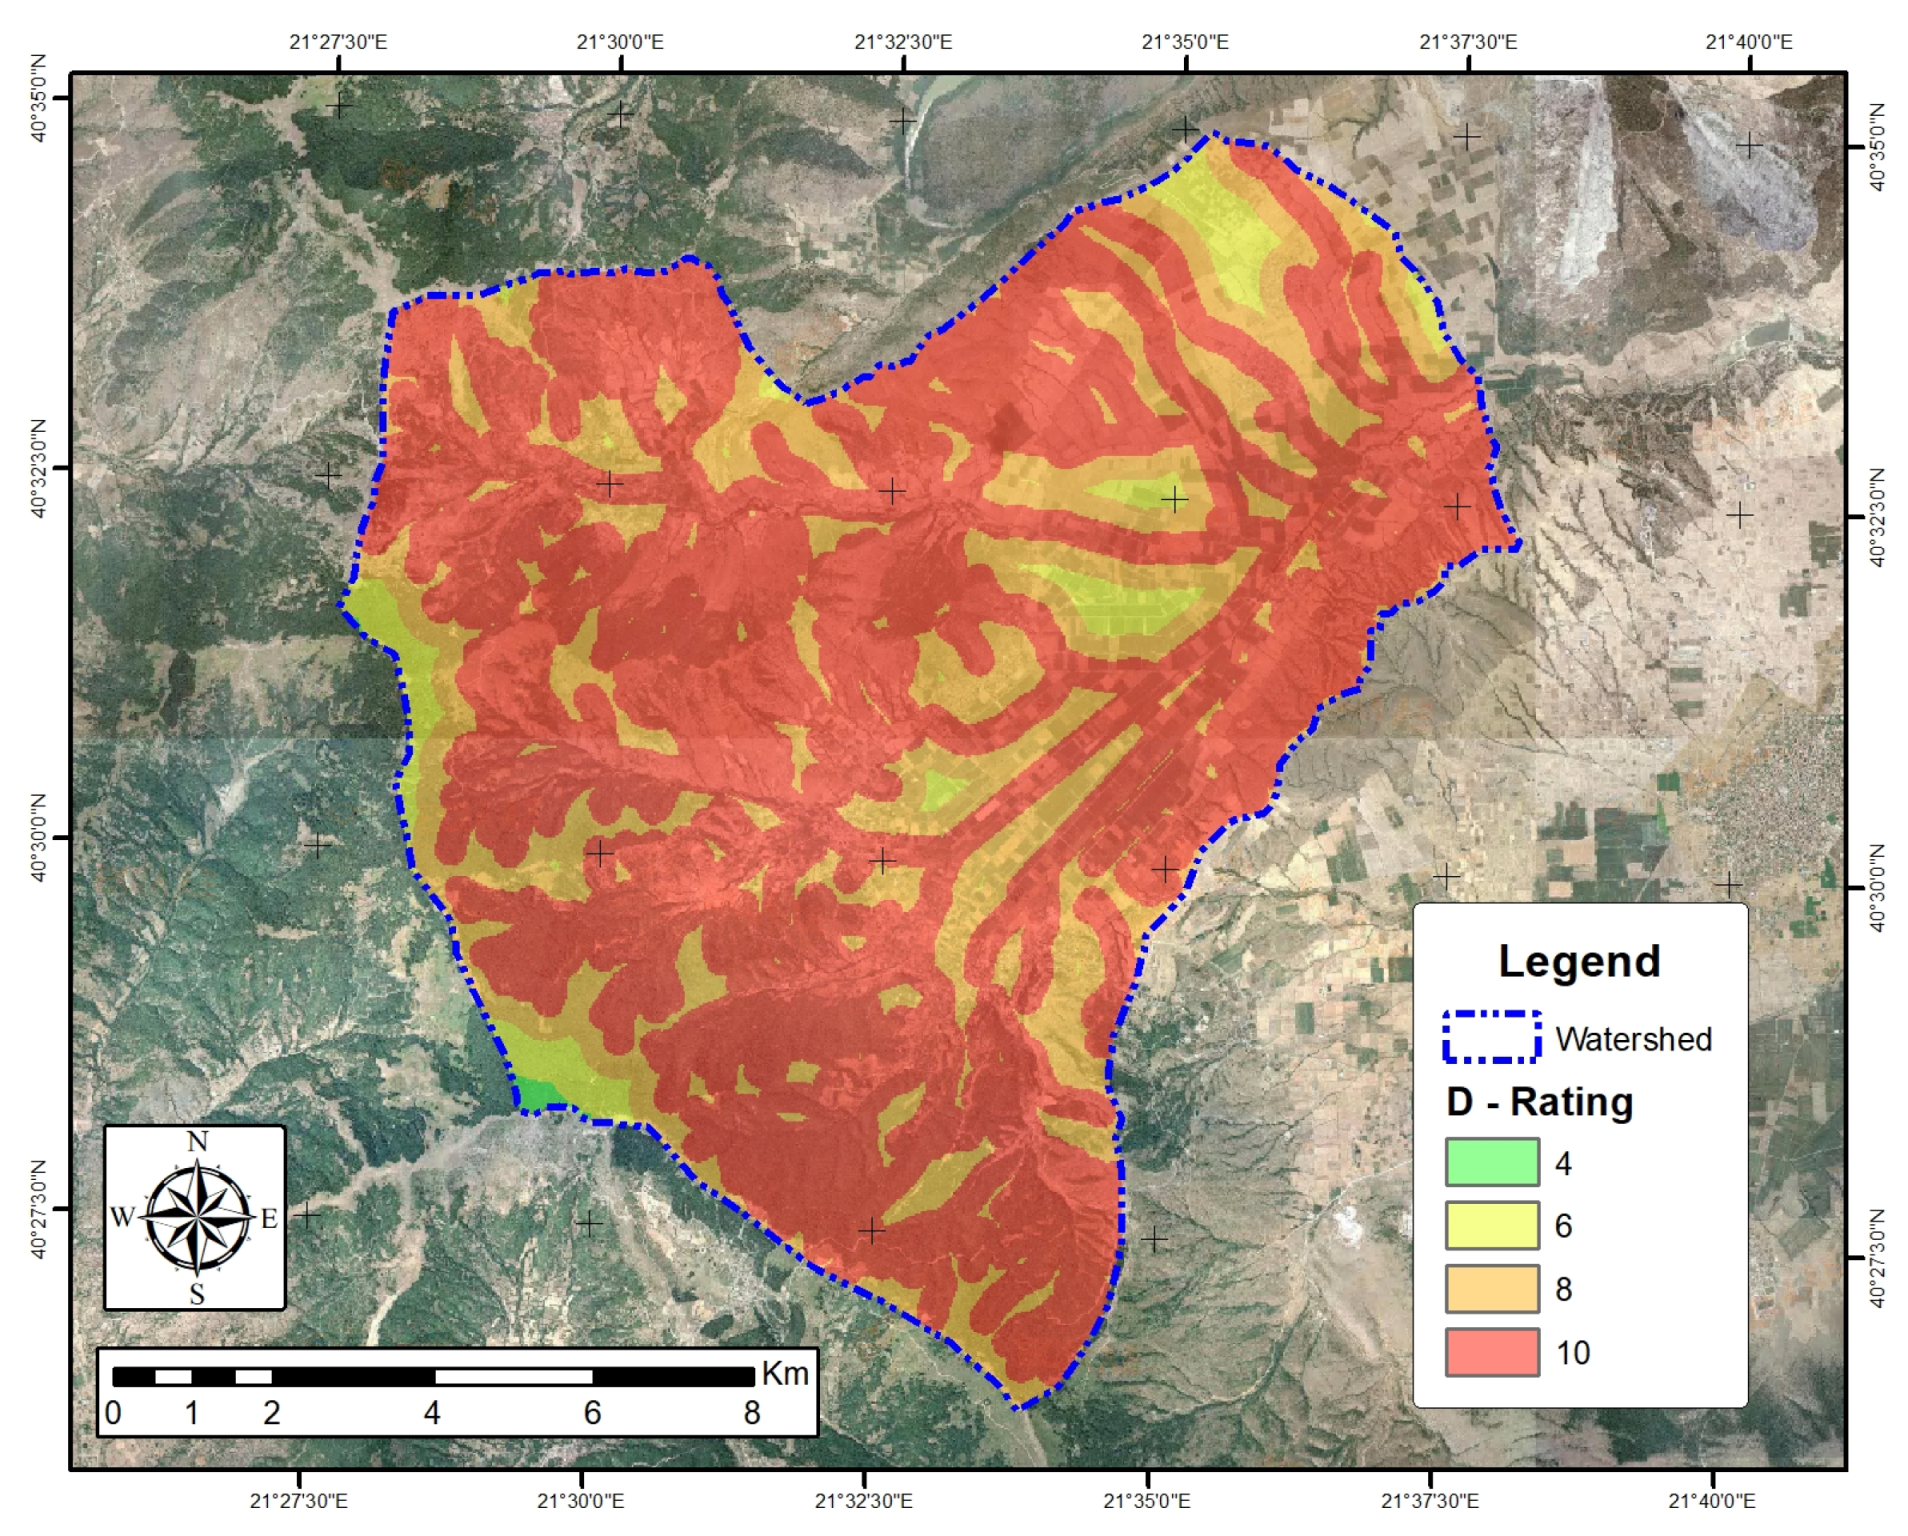
3.7. Distance from Drainage Network (D)
4. Results and Discussion
5. Conclusions
Author Contributions
Conflicts of Interest
Abbreviations
| AHP | Analytical hierarchy process |
| AI | Artificial intelligence |
| DEM | Digital elevation model |
| FHI | Flood hazard index |
| GIS | Geographic information system |
| MFI | Modified fournier index |
| OECD | Organisation for Economic Co-operation and Development |
| RF | Random forest |
| WLC | Weighted linear combination |
References
- Kowalzig, J. Climate, Poverty, and Justice: What the Poznan UN climate conference needs to deliver for a fair and effective global deal. Oxfam Policy Pract. Clim. Chang. Resil. 2008, 4, 117–148. [Google Scholar]
- Intergovernmental Panel on Climate Change. Climate Change 2014—Impacts, Adaptation and Vulnerability: Regional Aspects; Cambridge University Press: Cambridge, UK, 2014. [Google Scholar]
- Voudouris, K. Engineering Hydrogeology; Tziolas Publ.: Thessaloniki, Greece, 2017. (In Greek) [Google Scholar]
- Diakakis, M. Flood seasonality in Greece and its comparison to seasonal distribution of flooding in selected areas across southern Europe. J. Flood Risk Manag. 2017, 10, 30–41. [Google Scholar] [CrossRef]
- Kourgialas, N.N.; Karatzas, G.P. Flood management and a GIS modelling method to assess flood-hazard areas—A case study. Hydrol. Sci. J. 2011, 56, 212–225. [Google Scholar] [CrossRef]
- Kourgialas, N.N.; Karatzas, G.P. A national scale flood hazard mapping methodology: The case of Greece–Protection and adaptation policy approaches. Sci. Total Environ. 2017, 601, 441–452. [Google Scholar] [CrossRef] [PubMed]
- Papaioannou, G.; Loukas, A.; Vasiliades, L.; Aronica, G. Flood inundation mapping sensitivity to riverine spatial resolution and modelling approach. Nat. Hazards 2016, 83, 117–132. [Google Scholar] [CrossRef]
- Angelidis, P.; Kotsikas, M.; Kotsovinos, N. Management of upstream dams and flood protection of the transboundary river Evros/Maritza. Water Resour. Manag. 2010, 24, 2467–2484. [Google Scholar] [CrossRef]
- Nasiri, H.; Yusof, M.J.M.; Ali, T.A.M. An overview to flood vulnerability assessment methods. Sustain. Water Resour. Manag. 2016, 2, 331–336. [Google Scholar] [CrossRef]
- Domakinis, C.; Oikonomdis, D.; Voudouris, K.; Astaras, T. Using geographic information systems (GIS) and remote sensing to map flood extent and to assess flood hazard in erythropotamos river basin (Evros, Greece). In Proceedings of the 10th International Congress of the Hellenic Geographical Society, Thessaloniki, Greece, 22–24 October 2014; pp. 689–709. [Google Scholar]
- Kazakis, N.; Kougias, I.; Patsialis, T. Assessment of flood hazard areas at a regional scale using an index-based approach and Analytical Hierarchy Process: Application in Rhodope—Evros region, Greece. Sci. Total Environ. 2015, 538, 555–563. [Google Scholar] [CrossRef] [PubMed]
- Tsitroulis, I.; Voudouris, K.; Vasileiou, A.; Mattas, C.; Sapountzis, M.; Maris, F. Flood hazard assessment and delimitation of the likely flood hazard zones of the upper part in Gallikos River Basin. In Proceedings of the 14th International Conference, Thessaloniki, Greece, 25–27 May 2016; pp. 995–1004. [Google Scholar]
- Correia, F.N.; Da Silva, F.N.; Ramos, I. Floodplain management in urban developing areas. Part I. Urban growth scenarios and land-use controls. Water Resour. Manag. 1999, 13, 1–21. [Google Scholar] [CrossRef]
- Organisation for Economic Co-operation and Development (OECD). Global Modelling of Natural Hazard Risks: Enhancing Existing Capabilities to Address New Challenges; Report; Organisation for Economic Co-operation and Development: Paris, France, 2012. [Google Scholar]
- Chapi, K.; Singh, V.P.; Shirzadi, A.; Shahabi, H.; Bui, D.T.; Pham, B.T.; Khosravi, K. A novel hybrid artificial intelligence approach for flood susceptibility assessment. Environ. Model. Softw. 2017, 95, 229–245. [Google Scholar] [CrossRef]
- Kaur, H.; Gupta, S.; Parkash, S.; Thapa, R.; Mandal, R. Geospatial modelling of flood susceptibility pattern in a subtropical area of West Bengal, India. Environ. Earth Sci. 2017, 76, 339. [Google Scholar] [CrossRef]
- Termeh, S.V.R.; Kornejady, A.; Pourghasemi, H.R.; Keesstra, S. Flood susceptibility mapping using novel ensembles of adaptive neuro fuzzy inference system and metaheuristic algorithms. Sci. Total Environ. 2018, 615, 438–451. [Google Scholar] [CrossRef] [PubMed]
- Hong, H.; Panahi, M.; Shirzadi, A.; Ma, T.; Liu, J.; Zhu, A.X.; Chen, W.; Kougias, I.; Kazakis, N. Flood susceptibility assessment in Hengfeng area coupling adaptive neuro-fuzzy inference system with genetic algorithm and differential evolution. Sci. Total Environ. 2017, 621, 1124–1141. [Google Scholar] [CrossRef] [PubMed]
- Zhao, G.; Pang, B.; Xu, Z.; Yue, J.; Tu, T. Mapping flood susceptibility in mountainous areas on a national scale in China. Sci. Total Environ. 2018, 615, 1133–1142. [Google Scholar] [CrossRef]
- Patrikaki, O.; Kazakis, N.; Voudouris, K. Vulnerability map: A useful tool for groundwater protection: An example from Mouriki Basin, North Greece. Fresenius Environ. Bull. 2012, 21, 2516–2521. [Google Scholar]
- Patrikaki, O. Hydrogeological Research of Potamia Basin, in Kozani Prefecture, in Northern Greece. Ph.D. Thesis, Department of Geology, Aristotle University of Thessaloniki, Thessaloniki, Greece, 2009. (In Greek). [Google Scholar]
- Bossard, M.; Feranec, J.; Otahel, J.; Steenmans, C. The Revised and Supplemented Corine Land Cover Nomenclature; European Environment Agency: Copenhagen, Denmark, 2000. [Google Scholar]
- Demek, J. Manual of Detailed Geomorphological Mapping; Academia: San Francisco, CA, USA, 1972. [Google Scholar]
- Liu, R.; Chen, Y.; Wu, J.; Gao, L.; Barrett, D.; Xu, T.; Li, X.; Li, L.; Huang, C.; Yu, J. Integrating Entropy-Based Naïve Bayes and GIS for Spatial Evaluation of Flood Hazard. Risk Anal. 2017, 37, 756–773. [Google Scholar] [CrossRef] [PubMed]
- Gao, L.; Hailu, A. Ranking management strategies with complex outcomes: An AHP-fuzzy evaluation of recreational fishing using an integrated agent-based model of a coral reef ecosystem. Environ. Model. Softw. 2012, 31, 3–18. [Google Scholar] [CrossRef]
- Gao, L.; Hailu, A. Identifying preferred management options: An integrated agent-based recreational fishing simulation model with an AHP-TOPSIS evaluation method. Ecol. Model. 2013, 249, 75–83. [Google Scholar] [CrossRef]
- Zhang, X.; Gao, L.; Barrett, D.; Chen, Y. Evaluating water management practice for sustainable mining. Water 2014, 6, 414–433. [Google Scholar] [CrossRef]
- Bhattacharjee, K.; Behera, B. Forest cover change and flood hazards in India. Land Use Policy 2017, 67, 436–448. [Google Scholar] [CrossRef]
- Clark, G.E.; Moser, S.C.; Ratick, S.J.; Dow, K.; Meyer, W.B.; Emani, S.; Jin, W.; Kasperson, J.X.; Kasperson, R.E.; Schwarz, H.E. Assessing the vulnerability of coastal communities to extreme storms: the case of Revere, MA., USA. Mitig. Adapt. Strateg. Glob. Chang. 1998, 3, 59–82. [Google Scholar] [CrossRef]
- Ratick, S.J.; Morehouse, H.; Klimberg, R.K. Creating an index of vulnerability to severe coastal storms along the North Shore of Boston. In Financial Modeling Applications and Data Envelopment Applications; Emerald Group Publishing Limited: Bingley, UK, 2009; pp. 143–178. [Google Scholar]
- Runfola, D.M.; Ratick, S.; Blue, J.; Machado, E.A.; Hiremath, N.; Giner, N.; White, K.; Arnold, J. A multi-criteria geographic information systems approach for the measurement of vulnerability to climate change. Mitig. Adapt. Strateg. Glob. Chang 2017, 22, 349–368. [Google Scholar] [CrossRef]
- Malczewski, J. On the use of weighted linear combination method in GIS: Common and best practice approaches. Trans. GIS 2000, 4, 5–22. [Google Scholar] [CrossRef]
- Xiao, Y.; Yi, S.; Tang, Z. Integrated flood hazard assessment based on spatial ordered weighted averaging method considering spatial heterogeneity of risk preference. Sci. Total Environ. 2017, 599, 1034. [Google Scholar] [CrossRef] [PubMed]
- Dahri, N.; Abida, H. Monte Carlo simulation-aided analytical hierarchy process (AHP) for flood susceptibility mapping in Gabes Basin (southeastern Tunisia). Environ. Earth Sci. 2017, 76, 302. [Google Scholar] [CrossRef]
- Chen, Y.; Liu, R.; Barrett, D.; Gao, L.; Zhou, M.; Renzullo, L.; Emelyanova, I. A spatial assessment framework for evaluating flood risk under extreme climates. Sci. Total Environ. 2015, 538, 512–523. [Google Scholar] [CrossRef] [PubMed]
- Liu, R.; Chen, Y.; Wu, J.; Gao, L.; Barrett, D.; Xu, T.; Li, L.; Huang, C.; Yu, J. Assessing spatial likelihood of flooding hazard using naïve Bayes and GIS: A case study in Bowen Basin, Australia. Stoch. Environ. Res. Risk Assess. 2016, 30, 1575–1590. [Google Scholar] [CrossRef]
- Vu, T.T.; Ranzi, R. Flood risk assessment and coping capacity of floods in central Vietnam. J. Hydro-Environ. Res. 2017, 14, 44–60. [Google Scholar] [CrossRef]
- Kabenge, M.; Elaru, J.; Wang, H.; Li, F. Characterizing flood hazard risk in data-scarce areas, using a remote sensing and GIS-based flood hazard index. Nat. Hazards 2017, 89, 1369–1387. [Google Scholar] [CrossRef]
- Kougias, I.; Karakatsanis, D.; Malatras, A.; Monforti-Ferrario, F.; Theodossiou, N. Renewable energy production management with a new harmony search optimization toolkit. Clean Technol. Environ. Policy 2016, 18, 2603–2612. [Google Scholar] [CrossRef]
- Patsialis, T.; Kougias, I.; Kazakis, N.; Theodossiou, N.; Droege, P. Supporting Renewables’ Penetration in Remote Areas through the Transformation of Non-Powered Dams. Energies 2016, 9, 1054. [Google Scholar] [CrossRef]


| Parameters | Class | Rating | Area (km) | Share (%) |
|---|---|---|---|---|
| F: Flow Accumulation | 0–5821 | 2 | 132.7 | 99.2 |
| 5822–24,947 | 4 | 0.5 | 0.4 | |
| 24,948–59,041 | 6 | 0.2 | 0.2 | |
| 59,042–90,641 | 8 | 0.1 | 0.1 | |
| 90,642–212,049 | 10 | 0.1 | 0.1 | |
| I: Rainfall Intensity | 45–50 | 2 | 57.4 | 43.0 |
| 51–58 | 4 | 29.1 | 21.8 | |
| 59–66 | 6 | 21.4 | 16.0 | |
| 66–76 | 8 | 15.1 | 11.3 | |
| 77–93 | 10 | 10.7 | 8.0 | |
| G: Geology | Alluvial | 2 | 36.2 | 27.1 |
| Terrace | 4 | 20.7 | 15.5 | |
| Neogene | 6 | 4.5 | 3.3 | |
| Marbles | 8 | 1.3 | 1.0 | |
| Crystalline rocks | 10 | 71.0 | 53.1 | |
| U: Land use | Mixed Forest | 2 | 55.1 | 41.2 |
| Sparsely vegetated | 4 | 6.5 | 4.9 | |
| Agricultural | 6 | 52.9 | 39.6 | |
| Pastures | 8 | 16.8 | 12.5 | |
| Urban | 10 | 2.5 | 1.9 | |
| S: Slope | 0–2 | 10 | 46.2 | 34.5 |
| 2–5 | 8 | 31.6 | 23.6 | |
| 5–15 | 6 | 20.5 | 15.3 | |
| 15–35 | 4 | 17.5 | 13.1 | |
| >35 | 2 | 17.9 | 13.4 | |
| E: Elevation | 627–738 | 2 | 11.0 | 8.2 |
| 739–903 | 4 | 15.1 | 11.3 | |
| 904–1089 | 6 | 21.4 | 16.0 | |
| 1090–1300 | 8 | 29.1 | 21.8 | |
| 1301–1680 | 10 | 57.1 | 42.7 | |
| D: Distance from drainage | >2000 | 2 | 0.0 | 0.0 |
| 1000–2000 | 4 | 0.2 | 0.2 | |
| 500–1000 | 6 | 5.6 | 4.2 | |
| 200–500 | 8 | 31.7 | 23.7 | |
| <200 | 10 | 96.2 | 71.9 | |
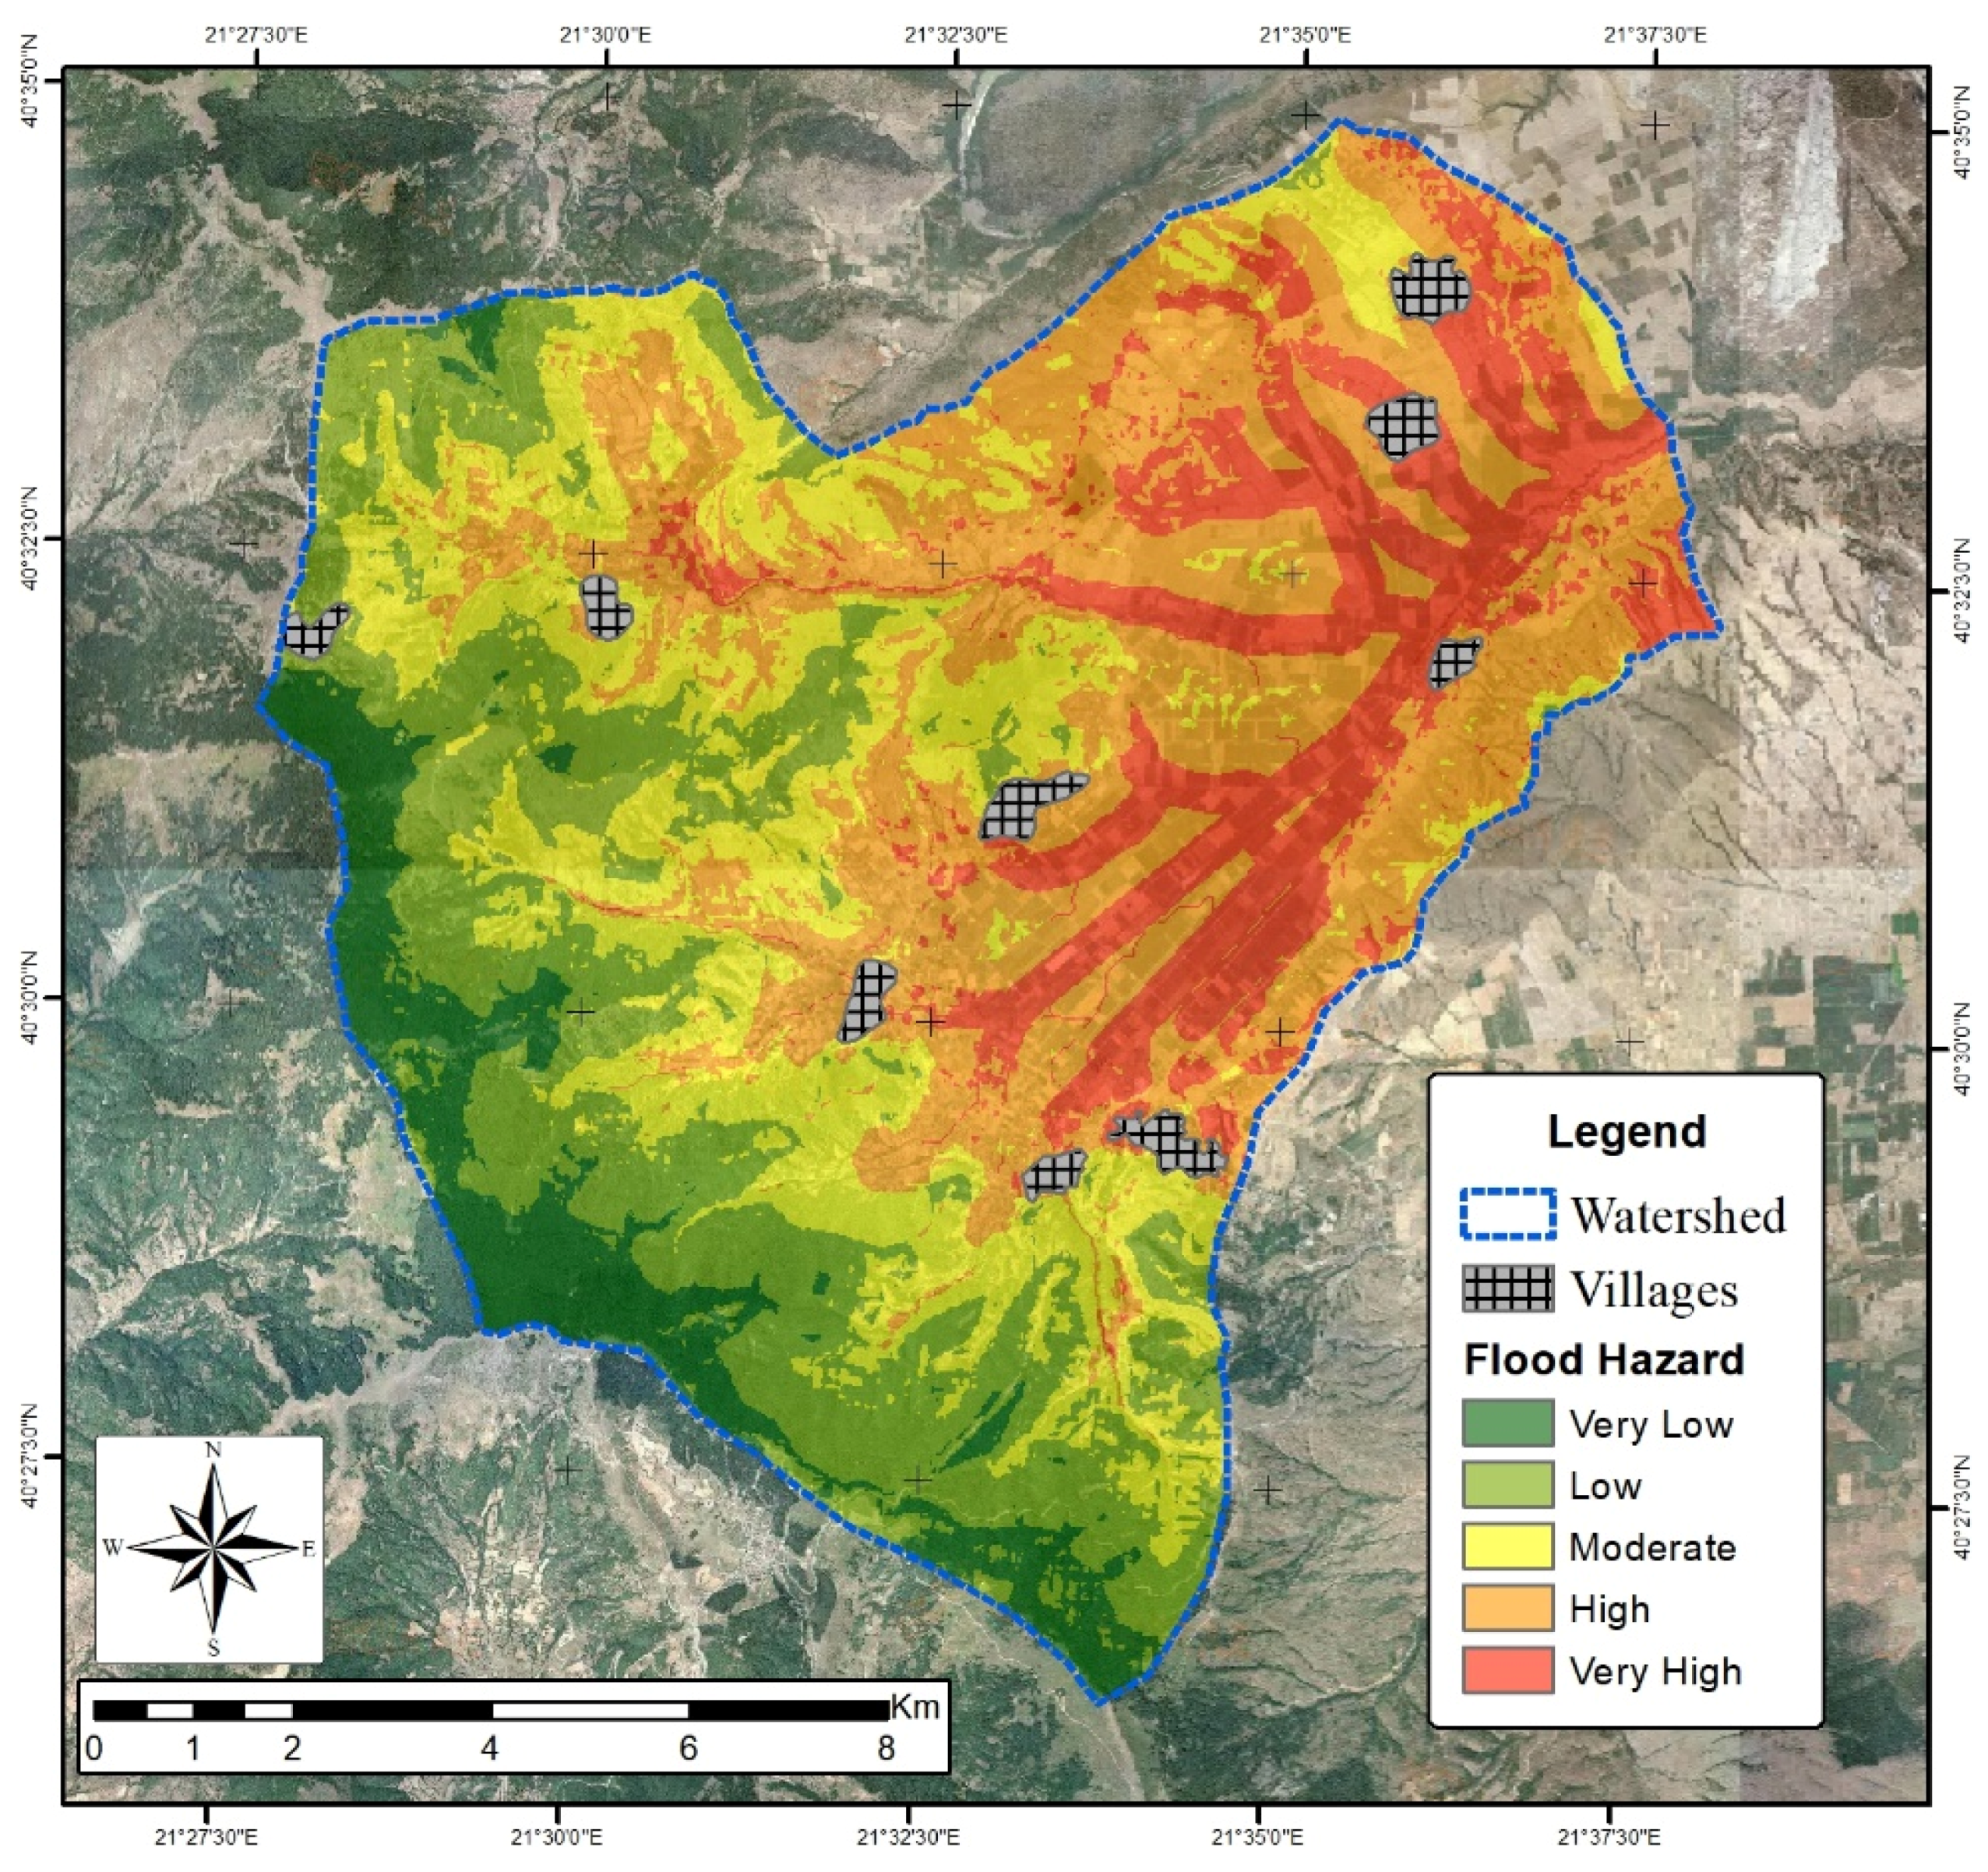
| FIGUSED: Flood hazard | 32–49 | Very low | 10.6 | 7.9 |
| 50–59 | Low | 28.8 | 21.6 | |
| 60–67 | Moderate | 30.5 | 22.8 | |
| 68–74 | High | 42.3 | 31.6 | |
| 75–89 | Very high | 21.6 | 16.1 |
© 2018 by the authors. Licensee MDPI, Basel, Switzerland. This article is an open access article distributed under the terms and conditions of the Creative Commons Attribution (CC BY) license (http://creativecommons.org/licenses/by/4.0/).
Share and Cite
Patrikaki, O.; Kazakis, N.; Kougias, I.; Patsialis, T.; Theodossiou, N.; Voudouris, K. Assessing Flood Hazard at River Basin Scale with an Index-Based Approach: The Case of Mouriki, Greece. Geosciences 2018, 8, 50. https://doi.org/10.3390/geosciences8020050
Patrikaki O, Kazakis N, Kougias I, Patsialis T, Theodossiou N, Voudouris K. Assessing Flood Hazard at River Basin Scale with an Index-Based Approach: The Case of Mouriki, Greece. Geosciences. 2018; 8(2):50. https://doi.org/10.3390/geosciences8020050
Chicago/Turabian StylePatrikaki, Olga, Nerantzis Kazakis, Ioannis Kougias, Thomas Patsialis, Nicolaos Theodossiou, and Konstantinos Voudouris. 2018. "Assessing Flood Hazard at River Basin Scale with an Index-Based Approach: The Case of Mouriki, Greece" Geosciences 8, no. 2: 50. https://doi.org/10.3390/geosciences8020050