Estimators of the Impact of Climate Change in Salt Weathering of Cultural Heritage


Géosciences et Environnement Cergy—Université de Cergy-Pontoise, 95000 Neuville sur Oise, France
Geosciences 2018, 8(11), 401; https://doi.org/10.3390/geosciences8110401
Submission received: 28 September 2018
/
Revised: 29 October 2018
/
Accepted: 31 October 2018
/
Published: 3 November 2018
(This article belongs to the Special Issue Preservation of Cultural Heritage and Resources Threatened by Climate Change)
Abstract
:Changes induced by climate change in salt weathering of built cultural heritage are estimated in different ways, but generally as a function of phase changes phenomena of two common salts, sodium chloride and sodium sulfate. We propose to use not only these salts, but also other common salts as calcium sulfate, or mixtures of chlorides, sulfates, and nitrates of sodium, calcium, magnesium, and potassium. Comparisons between the predicted changes in salt weathering obtained for single salts and for combinations of different salts are presented. We applied the proposed methodology to 41 locations uniformly distributed in France. The results show that estimations of actual and evolution of future weathering depend on the selected salt or combination of salts. According to our results, when using a combination of different salts, weathering evolution is less favorable (more damage in the future) than when using a single salt.
1. Introduction
Salts are almost omnipresent in built cultural heritage. Their nature (chemical composition and “mineralogical” phase), abundance and location in the building depend on the stone composition, wall orientation, and environmental parameters. Most of these salts are the result of the interaction between building stones and external agents (sea salt, atmospheric pollution, and underground water) or other construction materials: (mortars, plasters). In very specific cases, the building is made of evaporite rocks, as in the Old Shali town in Egypt [1]. In such a case, the environmental conditions will strongly control the durability of the cultural building. Salt weathering mechanisms are very complex and are not completely understood. Several papers describing salt weathering mechanisms have been published, as, for example, the paper of Steiger (2003) [2]. Pollutants deposition takes place by two different mechanism, dry deposition, and wet deposition. [3]. These pollutants, dissolved in water, will react with the stone minerals to form soluble salts [2]. Salt get into the masonry dissolved in water by two principal ways, capillarity rise and infiltration of rainwater [4].
Depending on the environmental conditions, mainly temperature and relative humidity, different salts may crystallize and they will do it at different locations inside the stone or at the surface of the wall. Arnold and Zehnder [5] propose a model of salt distribution in the masonry wall as a function of the height. In the lower area (A), weathering is less important than in the next upper zone (B) where a group of weakly to moderate soluble salts is responsible of an important weathering. Next upper area (C) is generally damp and dark and shows an accumulation of more soluble salt than those of the (B) zone. Above this zone, walls are sound (D). Ruiz-Agudo et al. [6] measured moisture and salt distribution inside the San Jeronimo Monastery (Granada, Spain) at two different periods, September 2004 and October 2005. They found that, at the same location, salt distribution is quite different between the two periods. In September 2004, highly soluble salts were located in the wall upper area (~200 cm height) and less soluble salts in the wall lower zone (<150 cm). At this period, there was a salt concentration gradient between the upper (lower amount) and lower (higher amount) parts of the wall. In October 2005, the total salt amount distribution was reversed, higher in the upper part than in the lower area. At this period, least soluble salts were uniformly distributed and some very soluble salts presented a maximum concentration in the middle height of the wall (100–150 cm).
Concerning salt composition, many different combinations of different salts can be found in historic buildings [7]. Sometimes, only few anions and cations are present, but in other cases a high number of chemical elements can be found in the same wall. Most common anions in buildings are sulfate, chloride, nitrate, and cations sodium, calcium, magnesium, but a great number of other cations and anions have been reported. To increase complexity, depending on the environmental conditions, different hydrated phase with the same chemical composition can be found.
All previous factors cause different decay forms in building stones that can show different development degrees. Some attempts have been done to classify these weathering forms [8,9] and to a establish damage index to quantify their intensity and extension [8].
The term “building climatology”, as introduced in the seventies, deals with concepts as comfort, indoor environments, energy-saving, and sustainable building techniques. Heritage climatology deals with the long term weathering of monuments. P. Brimblecombe in 2010 [10] set down the basis of Heritage climatology, based on work that was done in the Noah’s Ark project.
Knowing the behavior of building materials, especially stones, in future environments may have a great important for curators and conservators in order to select the best restauration treatments in future climate conditions. It is important to point out that this evolution will not be the same for “similar” historical buildings, depending on their geographical position (latitude and longitude, altitude, distance to the sea, etc.). In this paper, we treat only the weathering of the outside part of monuments because transfer function between outdoor meteorological data and indoor climate, will increase the complexity of the problem.
We consider the differences between past and future weathering in metropolitan France area. This evolution does not take into account particular buildings, sites, or materials. We compare the salt weathering in different locations and at different periods (past and future) without any consideration of lithology, orientation, or any other particular aspect of the stone nor the building. These locations have just been selected to represent the different climate conditions existing in France, with a spatial distribution as regular as possible. It is well known that systematic sampling is the more efficient method to obtain statistically representative results. As meteorological stations are not uniformly distributed in space, we used a nearly systematic sampling procedure while taking into account other aspects as altitude and proximity to the sea.
Salt weathering is a very complex problem that does not depend only on the climate condition, but also on the characteristics of the stone (its mineralogy, cementation degree, grain size, microstructure), on its pore system (size, connectivity), on the possible sources of salts (underground water, surrounding mortars, atmospheric pollution), and on the position of the stone in the building (orientation of the façade, height) [11]. Other important factors are local meteorological conditions as insolation or wind directions. When studying a specific monument, all of these factors should be taken into account. In our case, the goal of the study is just to obtain general tendencies.
In order to predict the evolution of salt weathering with climate change several methods have been proposed. We compared results that were obtained when applying some of these different estimation methods. Salt weathering has been estimated for single salt and salt mixture for past climate data and also for future “data” obtained by the MeteoFrance model Aladin under 4.5 scenario. The procedure, detailed in the next chapter, was applied to 41 locations in France, representative of the different climates of France.
To quantify salt weathering degradation some simplifications need to be done. Some authors use only halite salt to quantify salt weathering evolution. This is the case in the Noah’s Ark project. The reason of this choice is that NaCl is a very common salt, which is present in more of weathering material and also that has only a single stable phase, which makes calculations very simple. Due to its high solubility, sodium chloride is a good salt to test salt migration, but, as shown by experimental tests, it does not produce important damage to the stone but efflorescences at the surface. It is well known that NaCl has a deliquescence relative humidity of 75.3% at 25 °C and that it does not vary very much with temperature. To quantify damage, the number of times NaCl can precipitate by a decrease of the relative humidity, is counted [12].
Another salt that was employed in the estimation of salt weathering is sodium sulfate, which is considered as one of the most dangerous salt for buildings stones. Sodium sulfate has a more complex phase diagram that sodium chloride as it can present two different stable phases at different environmental conditions, mirabilite (decahydrated) and thenardite (anhydrous) but also some metastable phases. Traditionally, it has been considered that sodium sulfate generates damage only during the transition thenardite/mirabilite but recent laboratory studies of Yu and Oguchi [13] showed that thenardite precipitation could also induce damage into the samples without any mirabilite generation during the test. In climate change studies, damage generated by sodium sulfate is estimated by the number of times thenardite is transformed into mirabilite as a consequence of temperature and relative humidity changes.
Calcium sulfate is found in most of the weathered materials in monumental stone and its weathering effect is generally recognized [14]. The kinetic of formation of this salt is very slow and it is difficult to propose estimations based on its phase diagram. Only few laboratory studies have been done to understand the weathering mechanisms of gypsum: it has been shown that under high relative humidity conditions, sulfur in the air can react very fast with limestones to form gypsum crystals in the surface of the samples [15]. Janvier-Badosa et al., 2015 [16] succeeded to form gypsum inside the samples in laboratory tests by injecting SO2 gas in a dry sample and then allowing for water to get into the sample by capillarity. Both procedures need a high relative humidity to allow the reaction between calcite and SO2 to precipitate gypsum. Menéndez and David [17] showed that, in wetting/drying tests with a CaSO4 solution, damage is only registered under high relative humidity conditions. In previous studies, gypsum damage has been estimated by the number of days with relative humidity higher than 80%.
In natural and building environments, a combination of different salts is responsible of the weathering of stone more than a single salt. Several authors showed that wetting/drying tests that were performed with a combination of salts produce less damage than tests performed with single salt brines. Menéndez and Petráňová (2016) [18] showed using a combination of NaCl, Na2SO4 and CaSO4 that Na2SO4 is much more “efficient” than a salt mixture containing the same amount of Na2SO4 but with NaCl and CaSO4. Lindström et al. (2016) [19] have performed wetting/drying tests with Na2SO4, MgSO4 and a mixture of both and they arrive to the same conclusion, single salts generate much more damage than the combination of them. Lopez-Arce et al. (2008) [20] found that during relative humidity cycles (30–95% and 30–50%) samples that were contaminated by MgSO4 suffer less damage than samples contaminated by a salt mixture of NaCl, MgSO4, and CaSO4. This difference is mainly due to the weathering mechanisms: formation of a thick crust with MgSO4 and a fine and powdered crust that has been peeled during the cycles, with the mixture. Establishing a single estimator of weathering for complex salt mixture is not simple. To estimate salt mixture weathering as a function of environmental parameters, Menéndez (2017) [21], developed a methodology based in salt volume changes that were produced by temperature and relative humidity variations using the thermodynamic model ECOS-RUNSALT [22,23] for salt crystallization. Climate for culture project use a combination of halite and mirabilite to establish the risk of salt weathering in indoor environments [24].
2. Materials and Methods
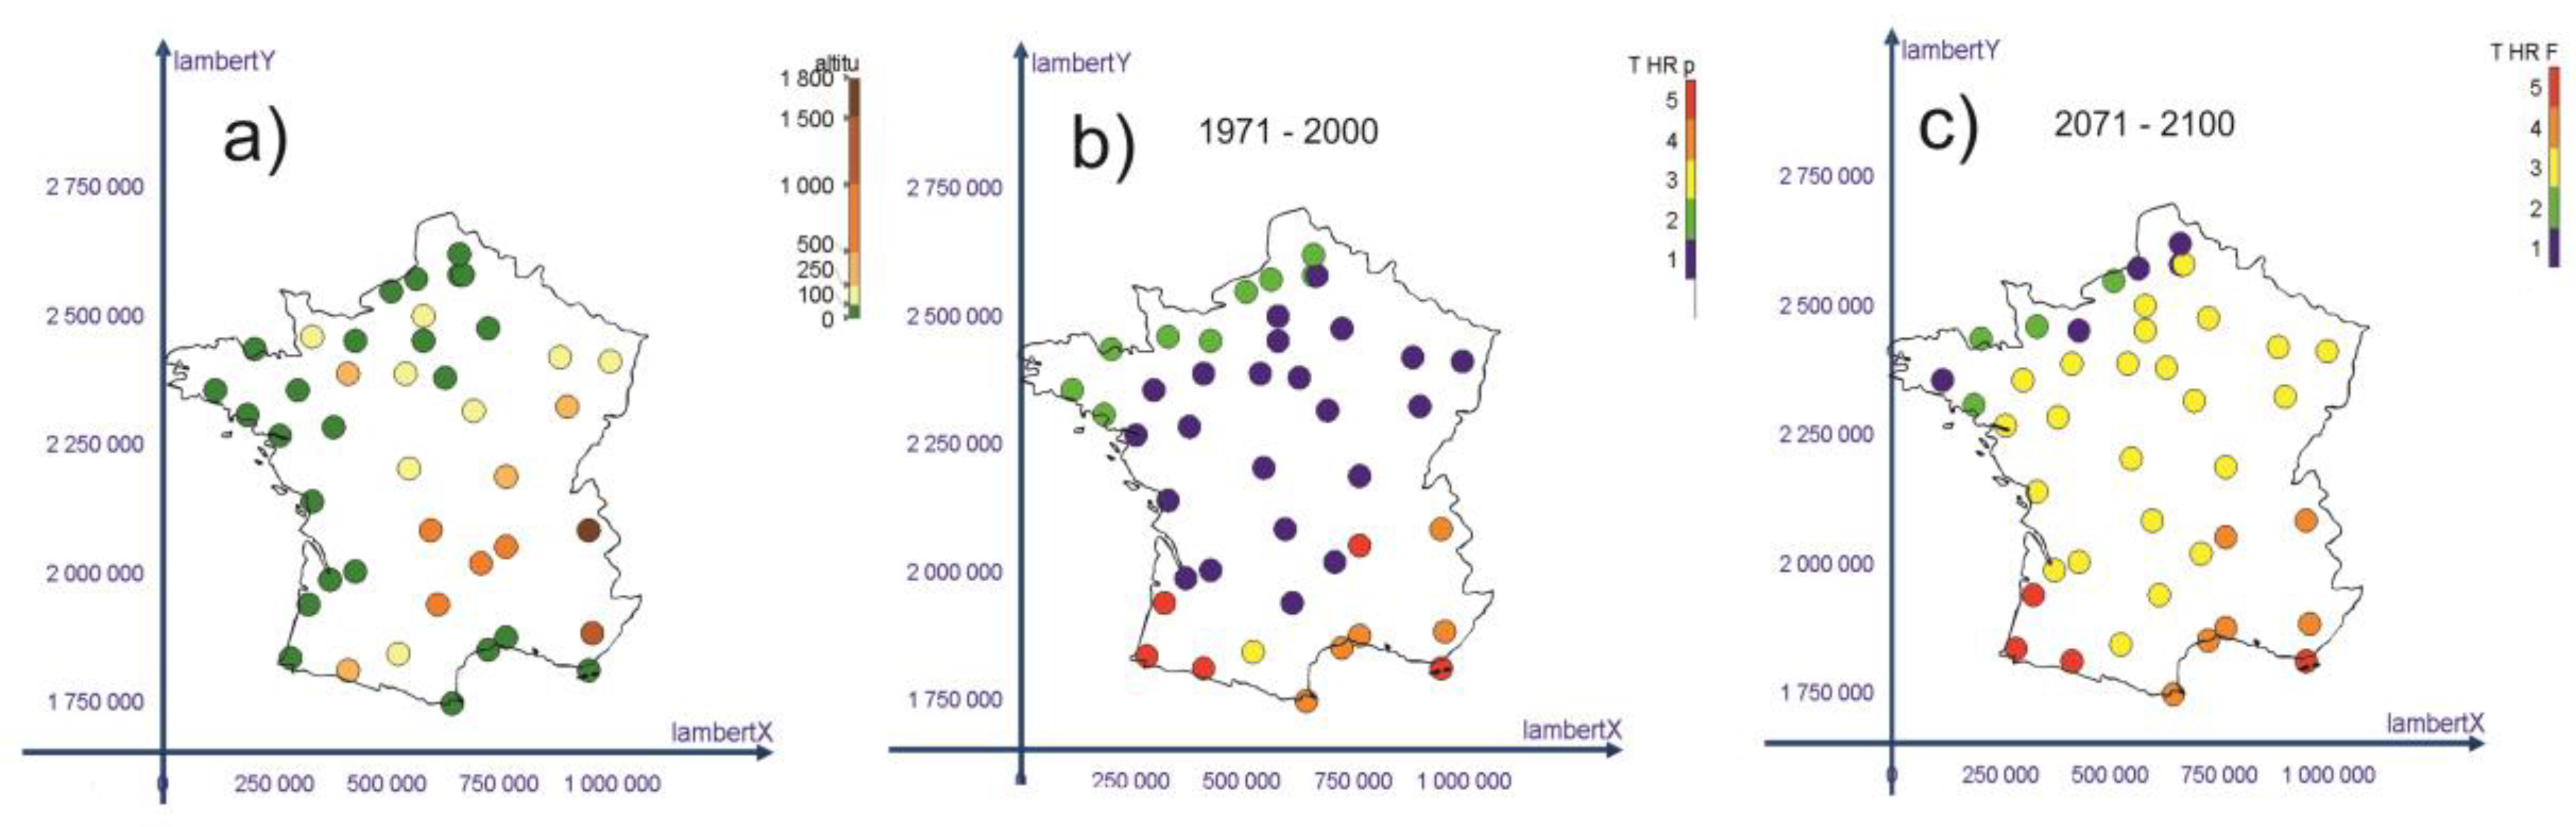
Five different ways of quantifying salt weathering in future climate have been applied to 41 locations in Continental Metropolitan France. The localization of the selected places as well as their altitude can be seen in Figure 1a. Three of the quantification methods deal with single salts, sodium chloride, sodium sulfate, and calcium sulfate; and, two with a combination of salts, one for a combination of the three previously cited salts and the second one for a combination of three anions (Cl−, SO42−, and NO3−) and 4 cations (Na+, K+, Mg2+ and Ca2+).
In order to obtain the future climate data, the employed methodology is quite similar to that used in previous research [12]. A simple description of the procedure is shown here but more detailed information can be found in [12]. Data from climate models, in our case, the Aladin model from MétéoFrance (France), have been generated for past and future periods. In this study, we used the temperature and relative humidity considered as the most important environmental parameters in salt crystallization. Model “past” simulations have been compared to real data of the same period at the same location in order to establish a downscaling protocol while taking into account specificities of each local area. A function allowing to fit past model data to real one is established. For future data, we have selected a RCP 4.5 scenario, which is an intermediate solution between optimistic and pessimistic possibilities. For each location, the downscaling function obtained for past data have been applied to future simulations. In our case the past period corresponds to 1971–2000 and future data go from 2071 to 2100. Same scenario has been used in the climate for culture project to establish future salt weathering risk for indoor environments [24]. Our results concern only outdoor environment.
For each location, we have calculated the mean, minimum, maximum, and standard deviation of the daily temperature and relative humidity over 30 years. For some meteorological stations, the real data is not available for the whole 30 years period (some years were missed). When choosing the locations, we looked for meteorological stations with as much data as possible. With past real data and future model data, we performed a k-mean clustering of the set of data (Tmean, Tmax, Tmin, and Tsd; RHmean, RHmax, RHmin, and RHsd) for the 41 locations (past and future data). We used the XLSTAT program, which runs under Excel. We gave the same weight to all variables with the determinant criterion that allows for avoiding the scale effect for the different variables. In this way, locations have been classified in five different classes (Figure 1b,c). The characteristics of the barycenter of each class is presented in Table 1.
Looking at Figure 1 we can observe that most of the locations are not very high, only two points are located at more than 1000 m high and most of them are under 100 m. If we consider climate change, the clearest variation is located in the central region with points that change from class 1 to class 3, with an increase of mean temperature and a decrease of relative humidity.
Next, we will explain how salt weathering has been calculated. For NaCl we just consider the number of times relative humidity change in two consecutive days between higher than 73.3% and lower than this deliquescence relative humidity. To do the calculations in all locations and for all the salts and salt combinations we used a scilab program that reads the data, performs the calculations and writes a file with the results. Even if we did not use it in this paper, the seasonality of the transitions has also be calculated (distribution of the different parameters from January to December).
For Na2SO4, we consider the number of times that thenardite (anhydrous phase) will convert into mirability (decahydrated phase) [25]. This occurs when environmental conditions cross the line with arrows in Figure 2. This line can be fitted by a straight line of equation RH (%) = 0.72 × T (°C) + 60.4. More details about the method can be found in [26].
To quantify the damage produced by calcium sulfate, gypsum, we just counted the number of days relative humidity is higher than 80%. The choice of this threshold has been done based on bibliographic review, even if no many experimental studies exist about the environmental conditions that control gypsum formation in stones.
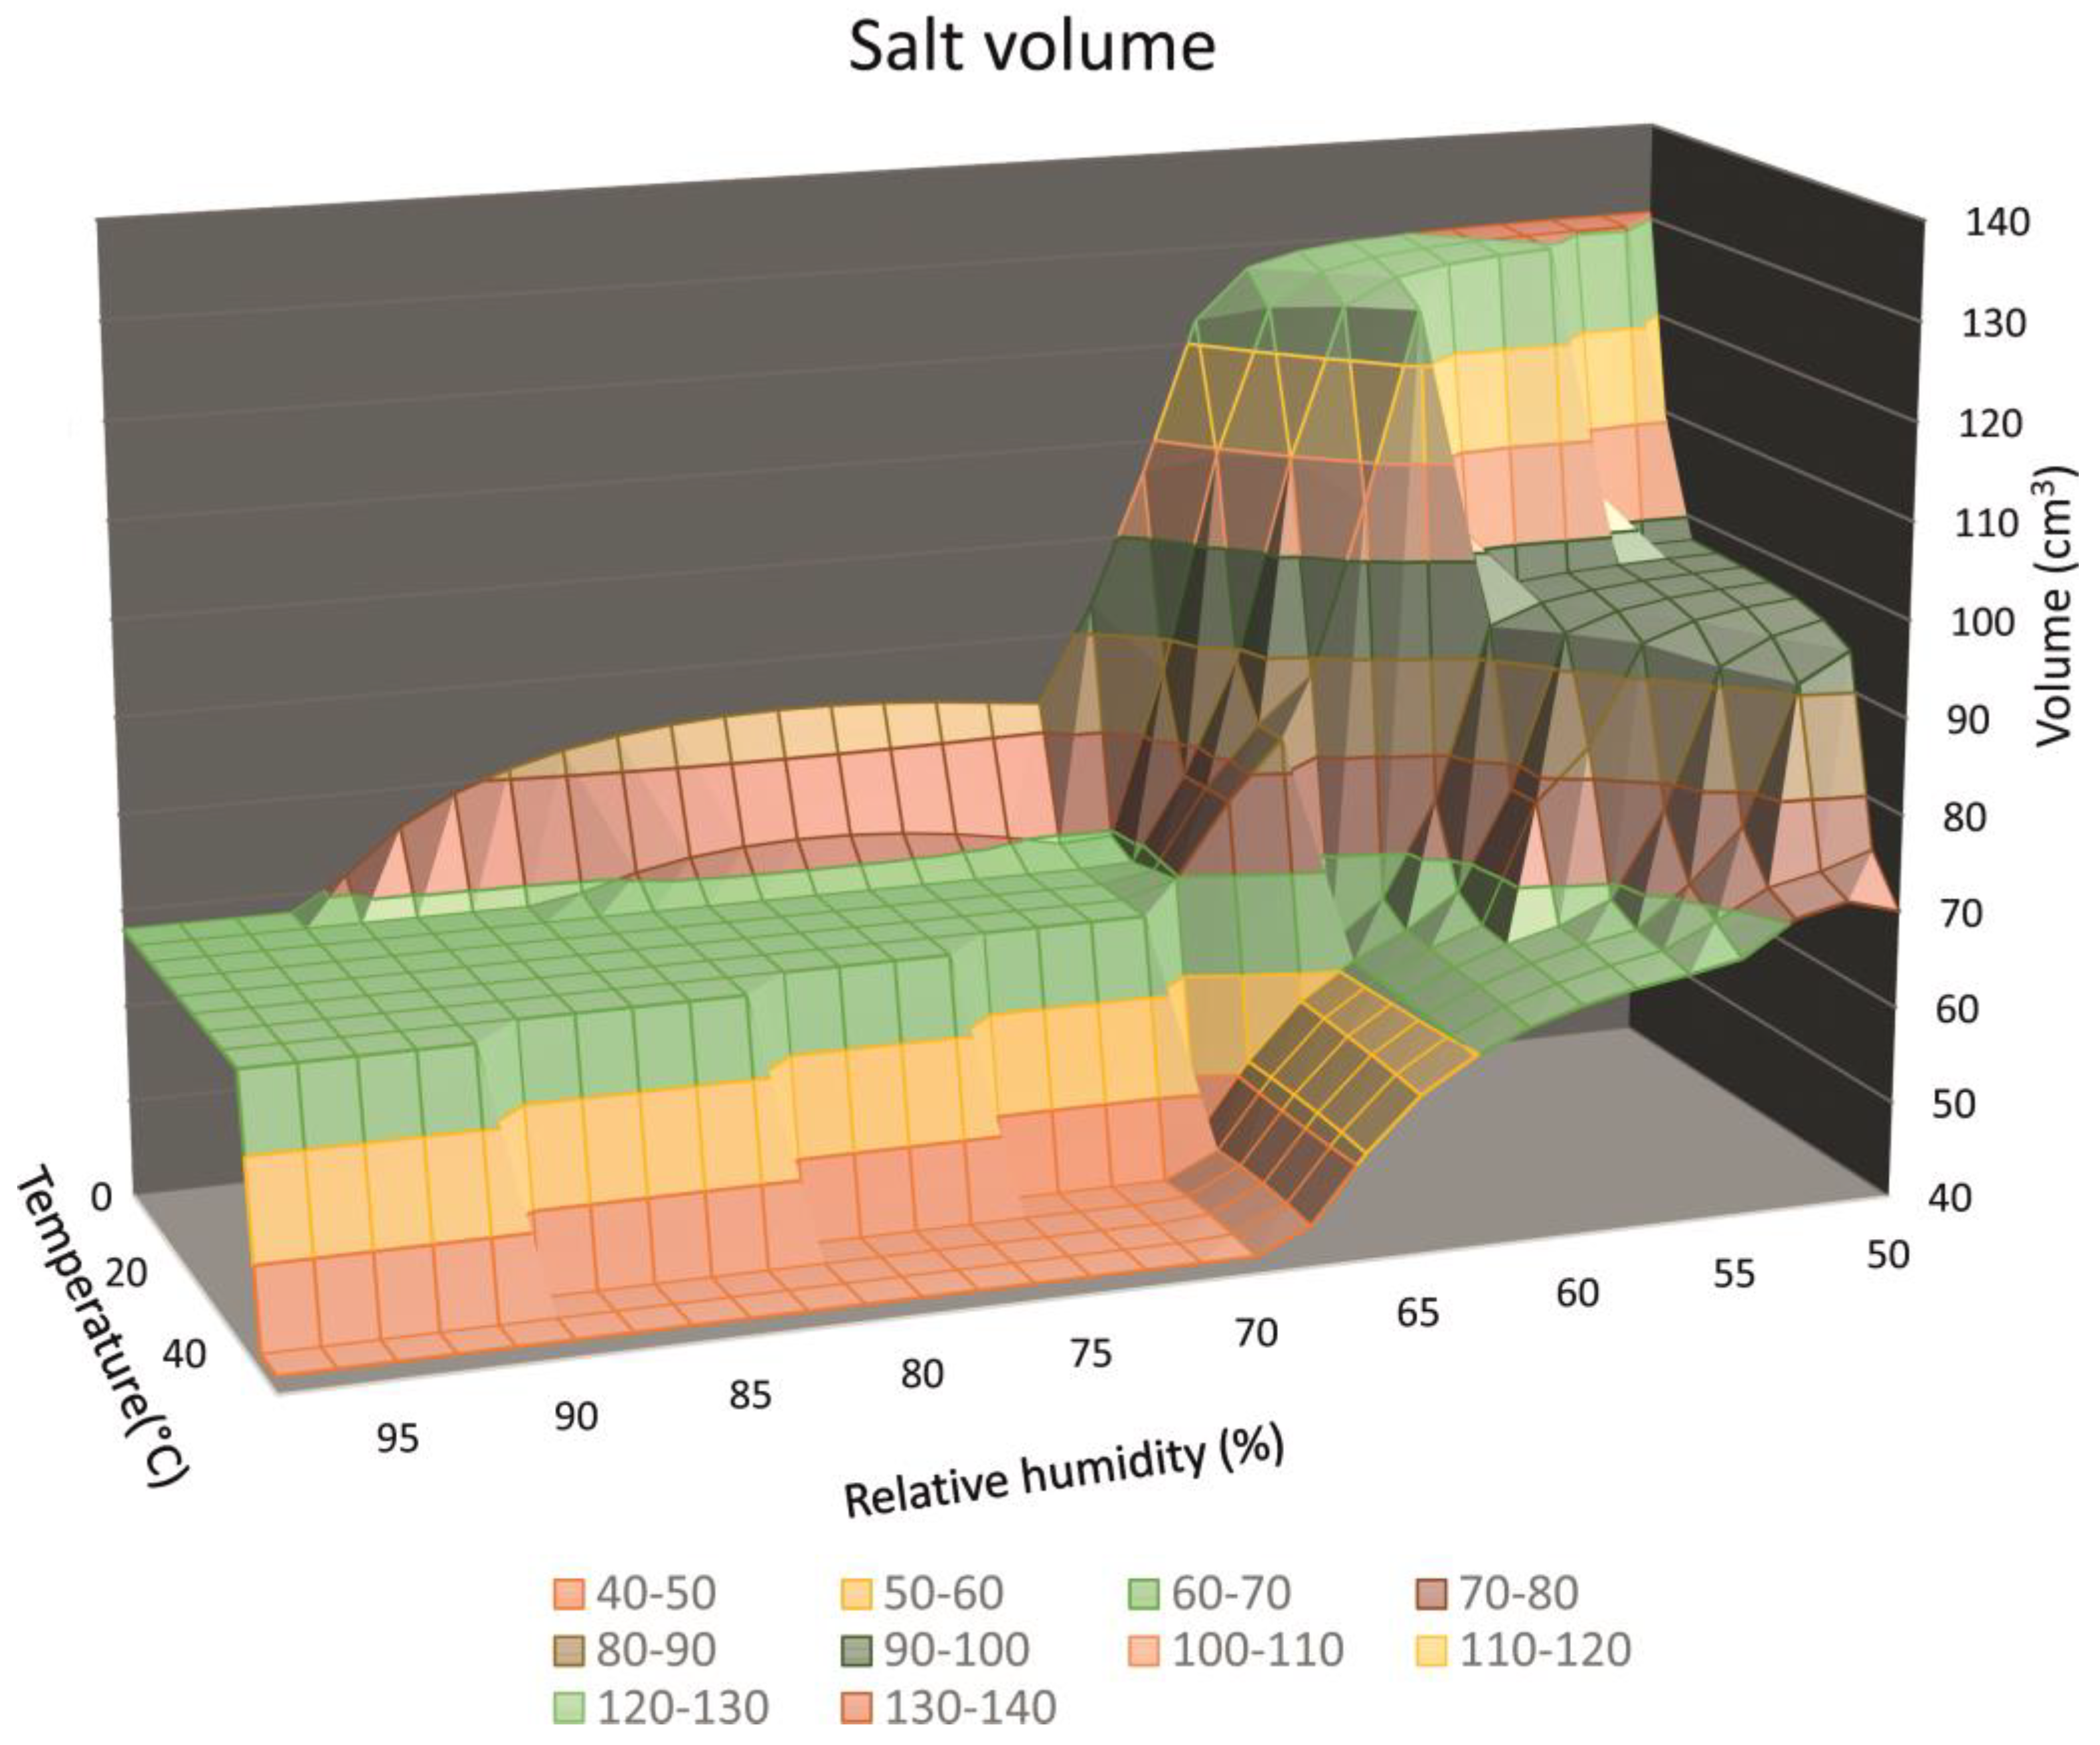
The last method used to quantify salt damage concerns the volume evolution during crystallization and phase transitions produced by environmental changes. These changes have been calculated by the ECOS-RUNSALT model and a detailed description of the procedure can be found in [21]. This method is a little bit more complex than the previous ones, but it can take into account complex salt composition. In our case, we considered a salt mixture containing a mixture of three anions (Cl−, SO42−, and NO3−) and four cations (Na+, K+, Mg2+, and Ca2+). It extracts the different environmental conditions corresponding to a volume increase of the generated salts from a standard solution. Figure 3 shows the volume of salt as a function of temperature and relative humidity. We can observe that most of damage will be produced when temperature and relative humidity decrease, mainly at low temperature and relative humidity.
Once all of the “damaging conditions” have been selected, we will compare the results to past and future data for the selected locations. The same clustering procedure that was previously used for temperature and relative humidity data has been followed for salts damage. In this way, for single salt, we consider the mean, max, min, and standard deviation of the salts transition (NaCl and Na2SO4) or the number of days with relative humidity higher than 80% (CaSO4) for all of the locations and for both real past and model future data. With all these data, we proceed to a k-mean cluster that will classify each location in one of five classes. For the three salts procedure, we consider the same data than for single salts but the k-mean cluster procedure used the data from the three salts. In the quantification via the salt volume, we considered the number of times that volume increases between two consecutive days (mean, max, min, and standard deviation) in the k-mean clustering procedure.
3. Results
The main goal of this study is to compare the salt weathering previsions that were obtained by different ways of estimation. Next, we will show the results that were obtained for each procedure and we will compare them.
3.1. Salt Weathering Prevision Using Sodium Chloride
Figure 4 shows the differences in NaCl weathering in the selected locations between past (1971–2000) and future (2071–2100). Table 2 gives the statistics of the number of transitions for the barycenter of each class obtained for sodium chloride weathering.
If we consider only halite weathering, most of the locations will rest in the same class (22) or show higher salt weathering in future as compared to past period (17), only two locations show lower susceptibility to NaCl in the future than in the past. The increase in salt weathering follows a S–E to N–W direction. The number of points with the lower number of transitions (class 1) decreases from 12 in past to five in future; four of them become class 2 and three become class 3. The number of points of class 5 with the maximum of transitions, increases from 2 to 7 points.
3.2. Salt Weathering Prevision Using Sodium Sulfate
For sodium sulfate results are presented in Figure 5. In this case we observe very little variation, with in general a decrease of salt weathering by sodium sulfate with time. Only in 3 places in the center NE of France the salt risk increases (from green to yellow), in most of the locations it remains constant or decreases. In 26 locations, the class does not change, in 12 it decreases of one level, and only in four it increases of one level. Table 3 shows the statistics of the number of Na2SO4 transitions for each class.
3.3. Salt Weathering Prevision Using Calcium Sulfate
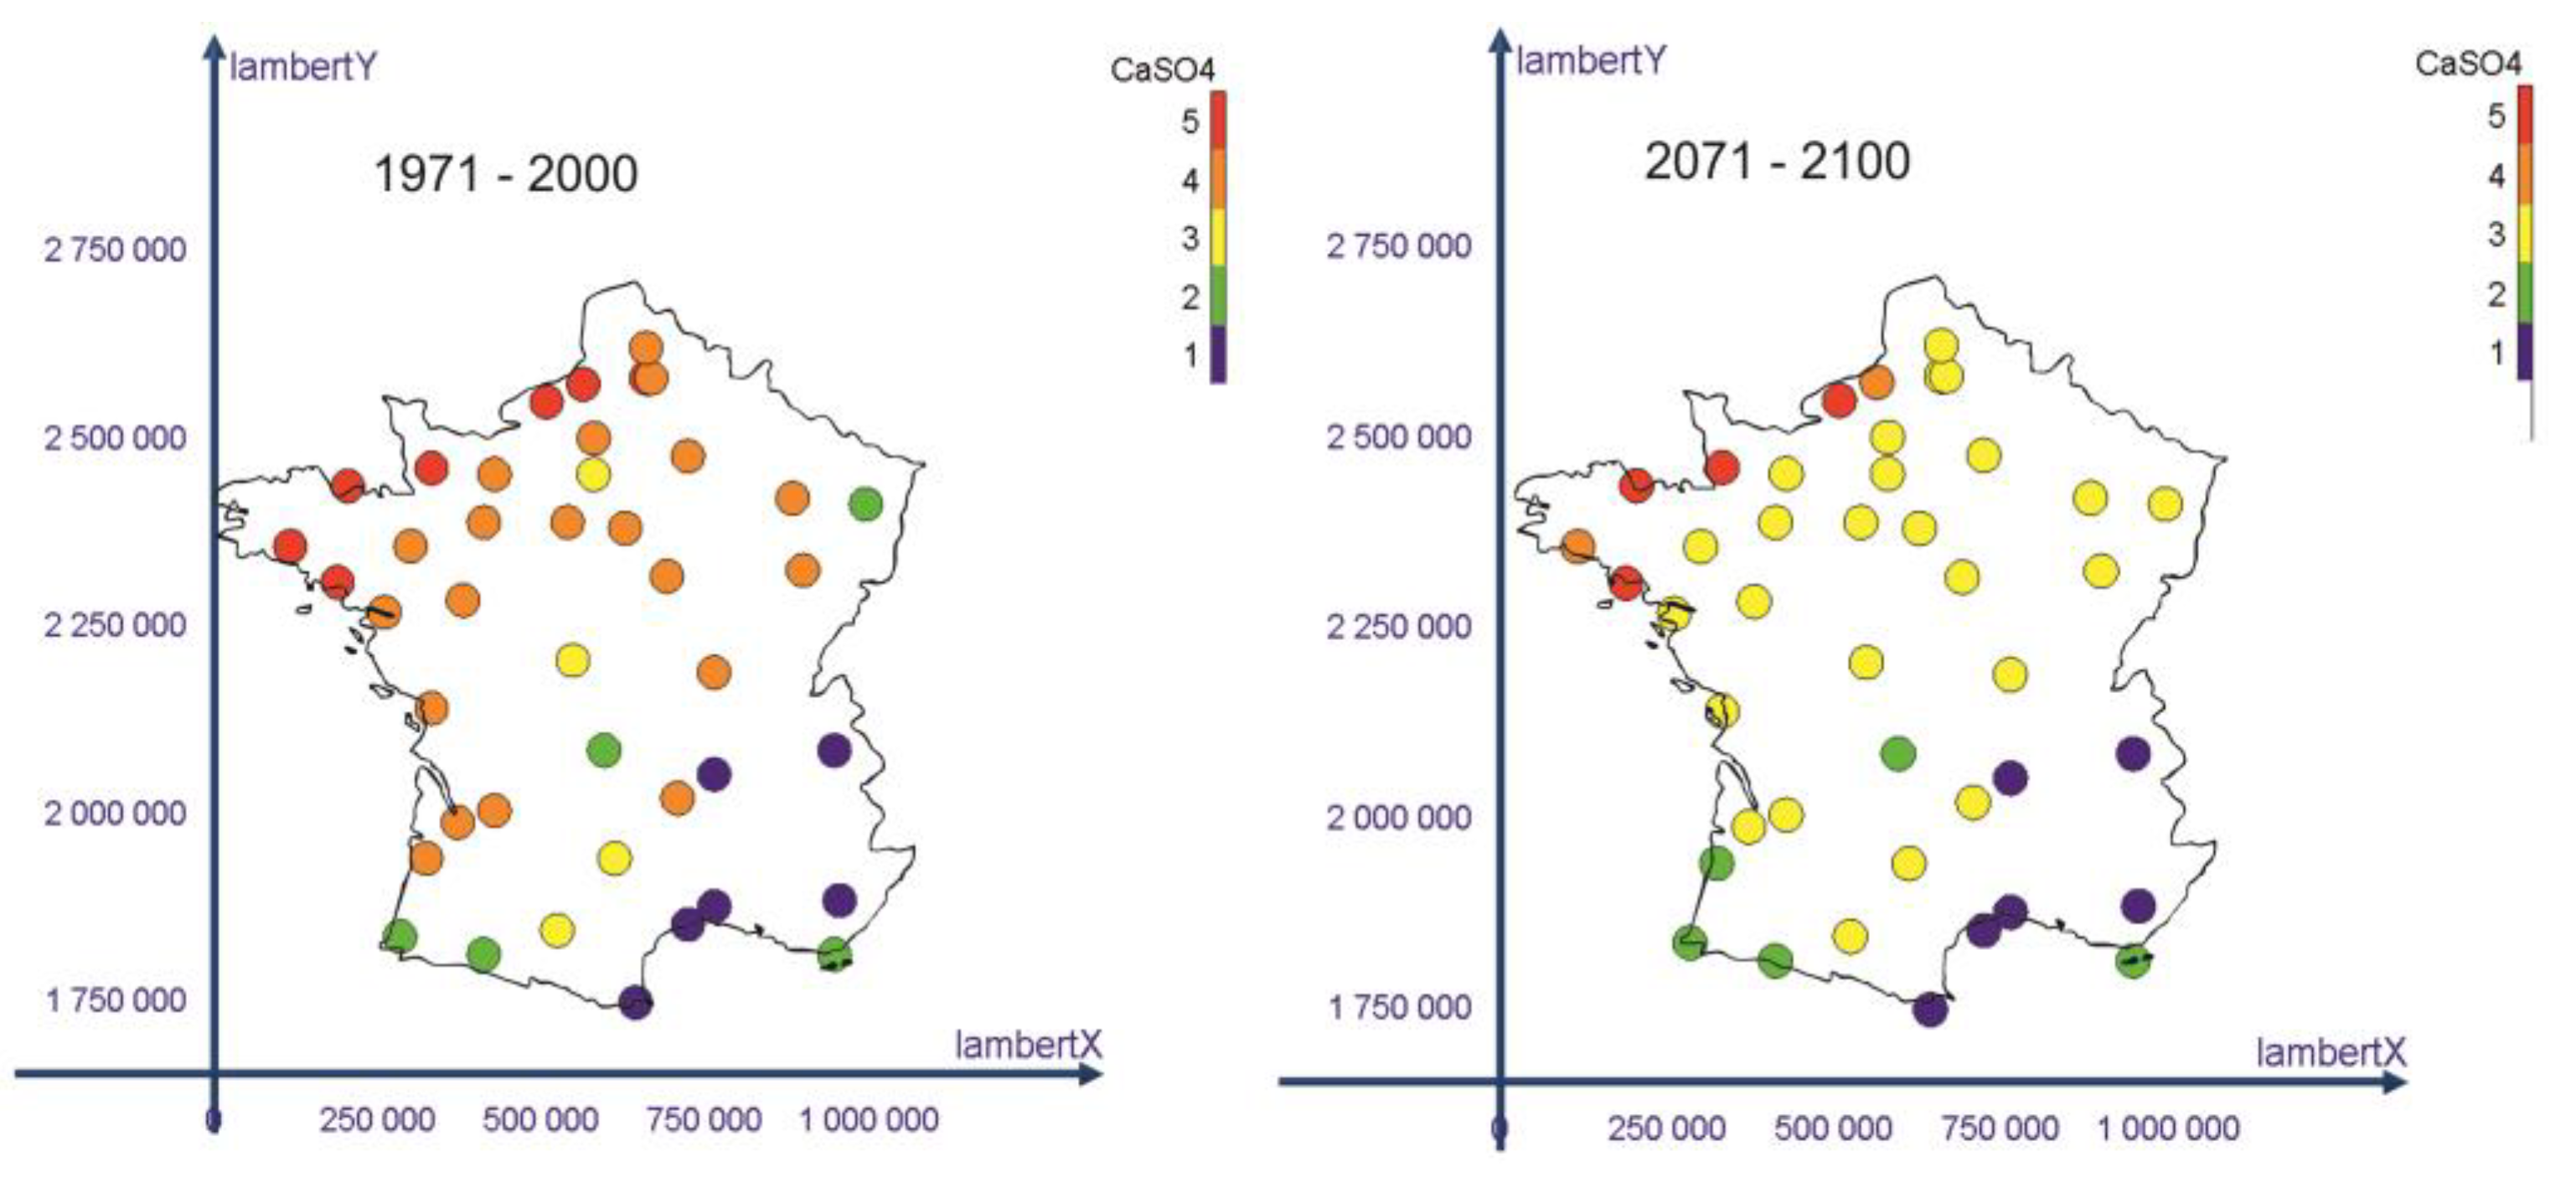
For calcium sulfate, we do not use the number of transitions, but the number of days with high relative humidity, which can allow the penetration of water into the pore system and then the precipitation of gypsum inside the stones. The results in Figure 6 show more variation between the past and the future than with NaCl and Na2SO4. We can observe a decrease of the risk in the central part of France, which is mainly due to the reduction of the relative humidity in these regions, from a mean of 78% to 69%, as shown of Figure 1 and Table 1. Concerning the spatial distribution of risk, it is opposite to the previous two cases, with more vulnerable regions in the NW coast and the least ones in the Mediterranean coast. In this case, 18 locations do not change of risk class, 21 decrease in one level, two in two levels, and only in one location the risk due to gypsum increases of one level. Table 4 gives the statistics of the number of the number of days with RH>80% for the barycenter of each class obtained for sodium sulfate weathering.
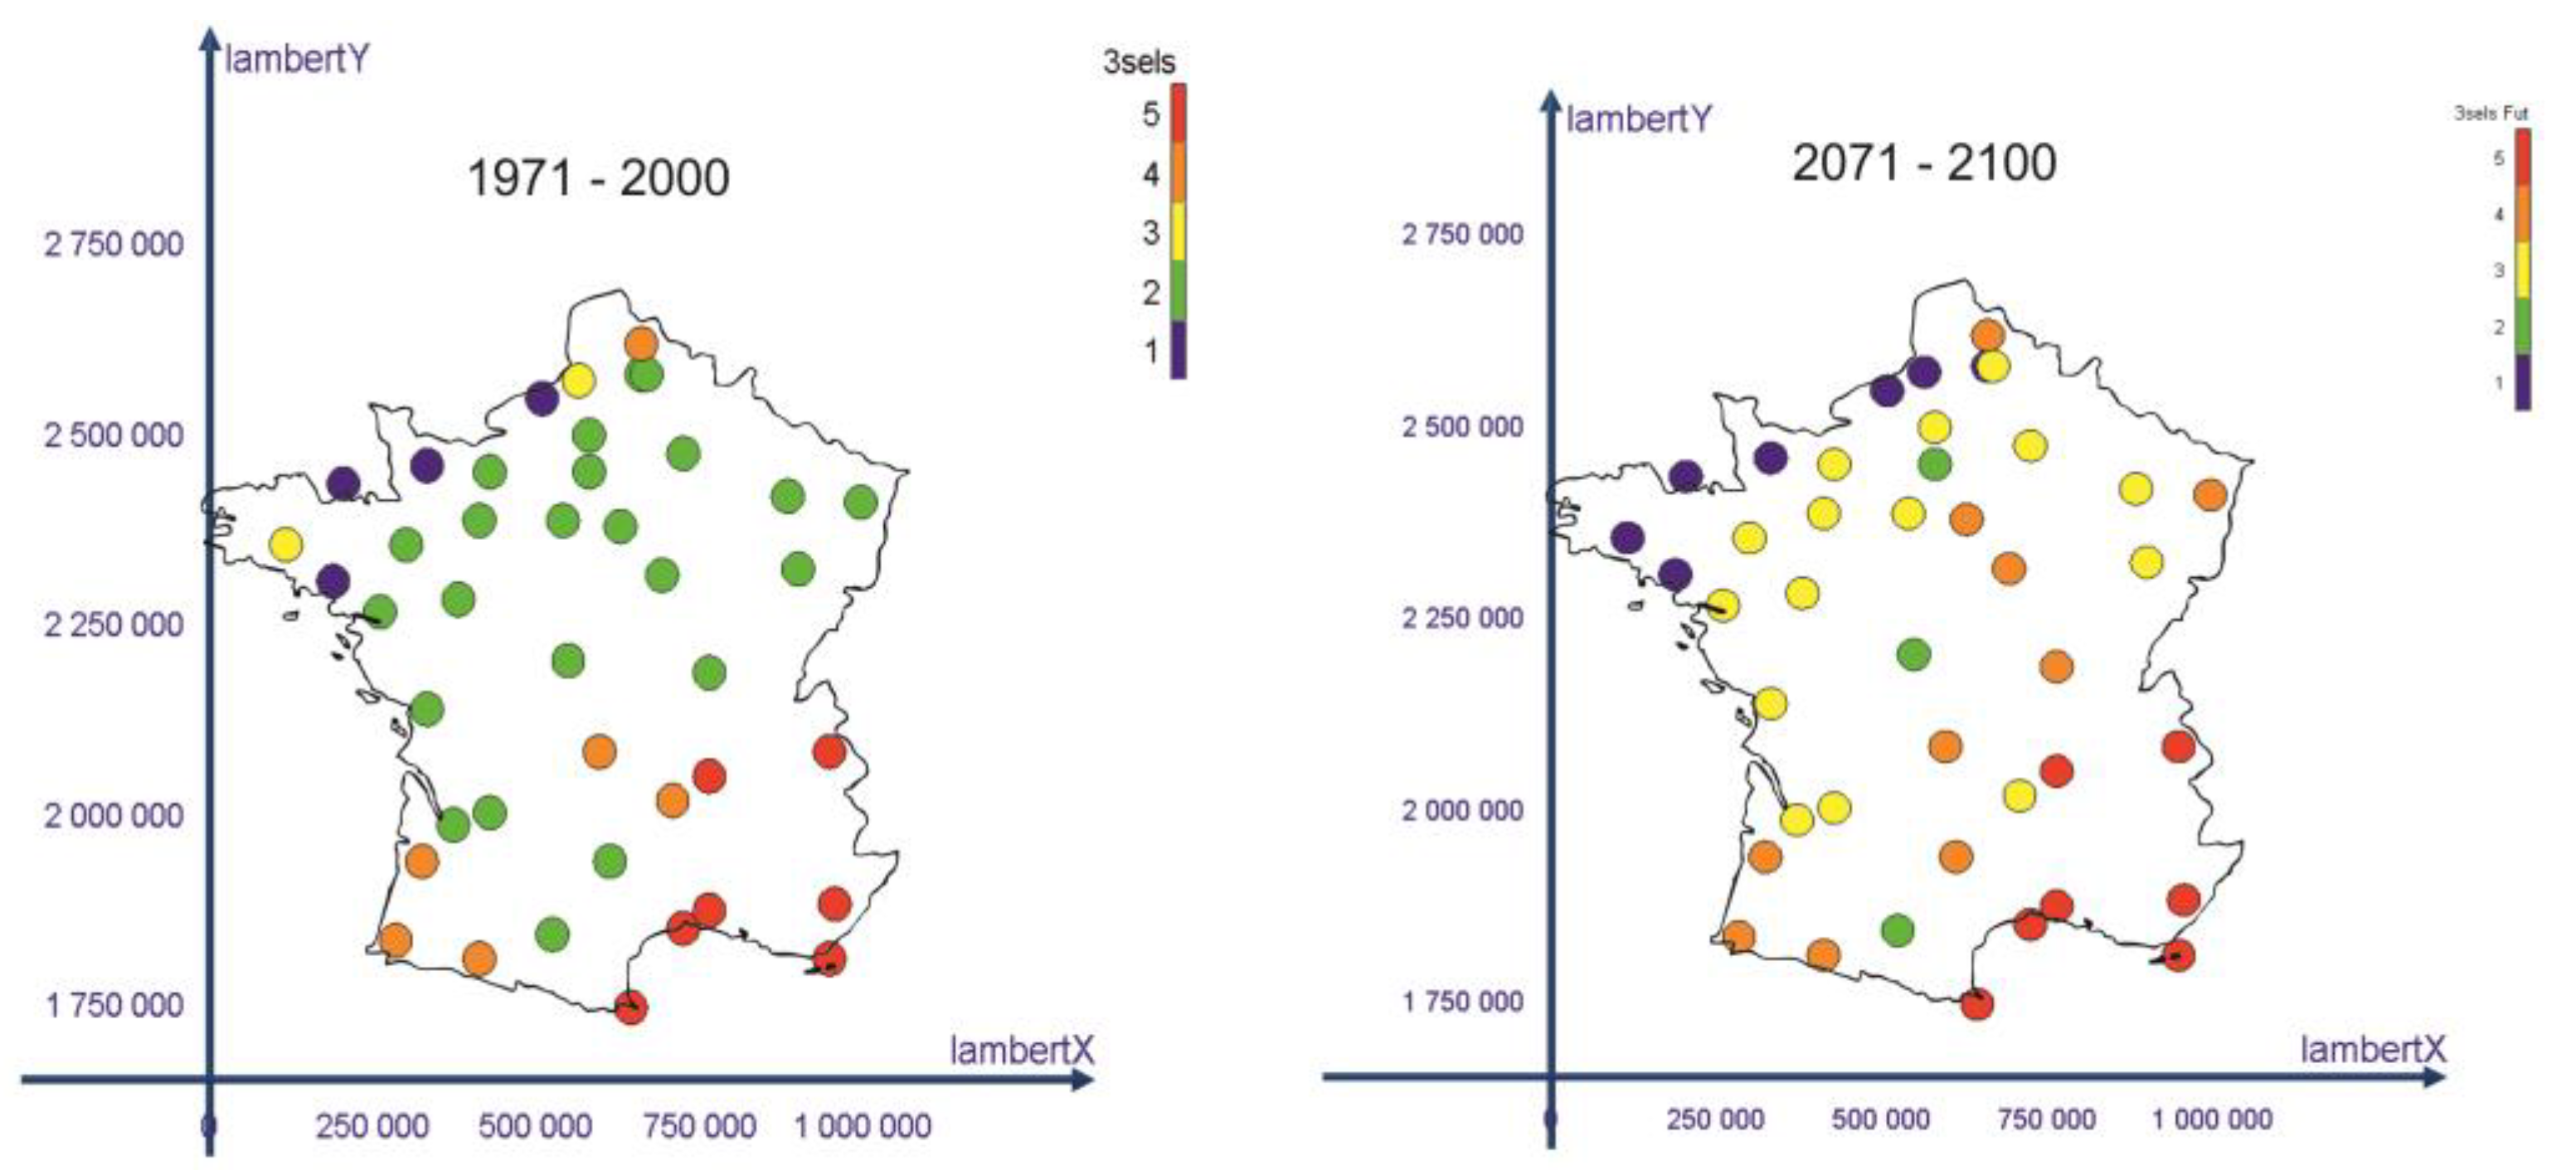
3.4. Salt Weathering Prevision Using a Combination of Sodium Chloride, Sodium Sulfate and Calcium Sulfate
If we apply the clustering procedure to a combination of previous three salts data, we obtain different results. We can say that in the NW (lowest risk), and SW coasts and in the Mediterranean (highest risk) area, between past and future, weathering risk stays constant or decreases but in central France the risk mainly increases. In general we can say that in 19 places salt weathering risk does not change, in four locations it decreases and in 19 locations it increases.
Looking at Table 5, we can see how NaCl and Na2SO4 number of transitions increases from least risk zones to highest one but CaSO4 risk decreases.
3.5. Salt Weathering Prediction Using the Volume Increase of Precipitated Salts
In this case, we use several different salts, as can be seen in [21]. The involved salts are sodium, magnesium, and calcium sulfates, magnesium, sodium, and potassium nitrates, sodium chloride, a double salt of sodium sulfate and nitrate and another of sodium and magnesium sulfate. Results are shown in Figure 8. In general salt risk will increase with time. At the end of 21th century as compared to end of 20th century, in 14 locations salt weathering risk remains constant and in the other 24 it increases. These increases are higher than in the previous cases. It increases of one level in 13 locations, of two levels in eight locations, of three levels in six locations and in one location it increases of four levels. The results show that salt weathering risk is lower in all the west coast than in the rest of France. SE part of France presents the most vulnerable area.
4. Discussion
We have shown that when estimating salt weathering from climate data, the use of different methods may conduct to different results. For example, if we consider the estimations of NaCl or Na2SO4 salt weathering, the spatial distribution for past period is quite similar with three SW–NE bands dividing the country and with a NW to SE gradient; when using CaSO4, the gradient has the same orientation but in the opposite direction. If we look at the evolution of salt weathering with time, for different salts the evolution is not the same. For NaCl the general trend is a slight increase of the weathering but for Na2SO4 the tendency is not so clear. We found a diminution of salt weathering in the West coast but weathering remains constant in the S–E, with maybe a slight decrease of the number of transitions. In a small central-East part, future weathering may be more important than in the past. These results are not in agreement with previous works [12] for two cities in the NW coast of France. Previous research found that halite weathering may remain constant during the 21th century, but the number of thenardite/mirabilte transitions will increase. In our case we found that the total number of transition increases for sodium chloride and decreases for sodium sulfate.
If we look at the results for calcium sulfate, the spatial distribution of damage is also organized in three areas similar to the previous one, with a gradient from South–East to North–West. We consider that zones with high relative humidity are more propitious to gypsum generation than dryer ones. The main change with future climate is a decrease of gypsum weathering risk in the central regions. N–W and S coast do not present major changes.
In the third clustering process, we took into account data of the three salts (NaCl, Na2SO4, and CaSO4). The obtained results also show a geographical distribution with a NW to SE gradient. In this case, we observe slight differences between past and future in the N–W coast, not evident for individual salts. The most important changes take place in the central region, going from class 2 to 3 or 4. As in previous cases, southern locations do not show changes in salt weathering in the future.
The last estimation of salt weathering, based on the volume change, gives different results from the previous ones. The N–W coast, as in most of the previous cases, presents the lowest weathering susceptibility. The most important weathering takes place in the Mediterranean coast and locations with high altitude. The distribution in the central part of France is not as regular as before. Concerning changes in future weathering, a general increase of weathering is observed between the end of XX century and the end of XXI century. We can consider that this estimator is the one with predicting the highest changes between past and future.
5. Conclusions
We have shown in this paper that different estimators that are used to quantify salt weathering can lead to significantly different results. Results that were obtained for gypsum are quite different from those obtained for halite or thenardite/mirabilite. The gypsum weathering mainly depends on relative humidity, as it will precipitate inside the stone, causing damage when RH is high. This result is in accord with recent research showing that gypsum will precipitate inside the pores when SO2 from the atmosphere reacts with water inside the pores. This water can come from capillarity suction or by condensation due to an increase in the RH. In our estimations, we did not take into account rain in a direct way but via relative humidity. We can consider that, in rainy days, relative humidity will increase.
Experimental studies [18] have shown that weathering by sodium chloride and sodium sulfate is more important when relative humidity decreases under the 80% threshold. When comparing Figure 1 to Figure 4, Figure 5 and Figure 6, it is clear that salt weathering distributions is highly dependent on temperature and relative humidity.
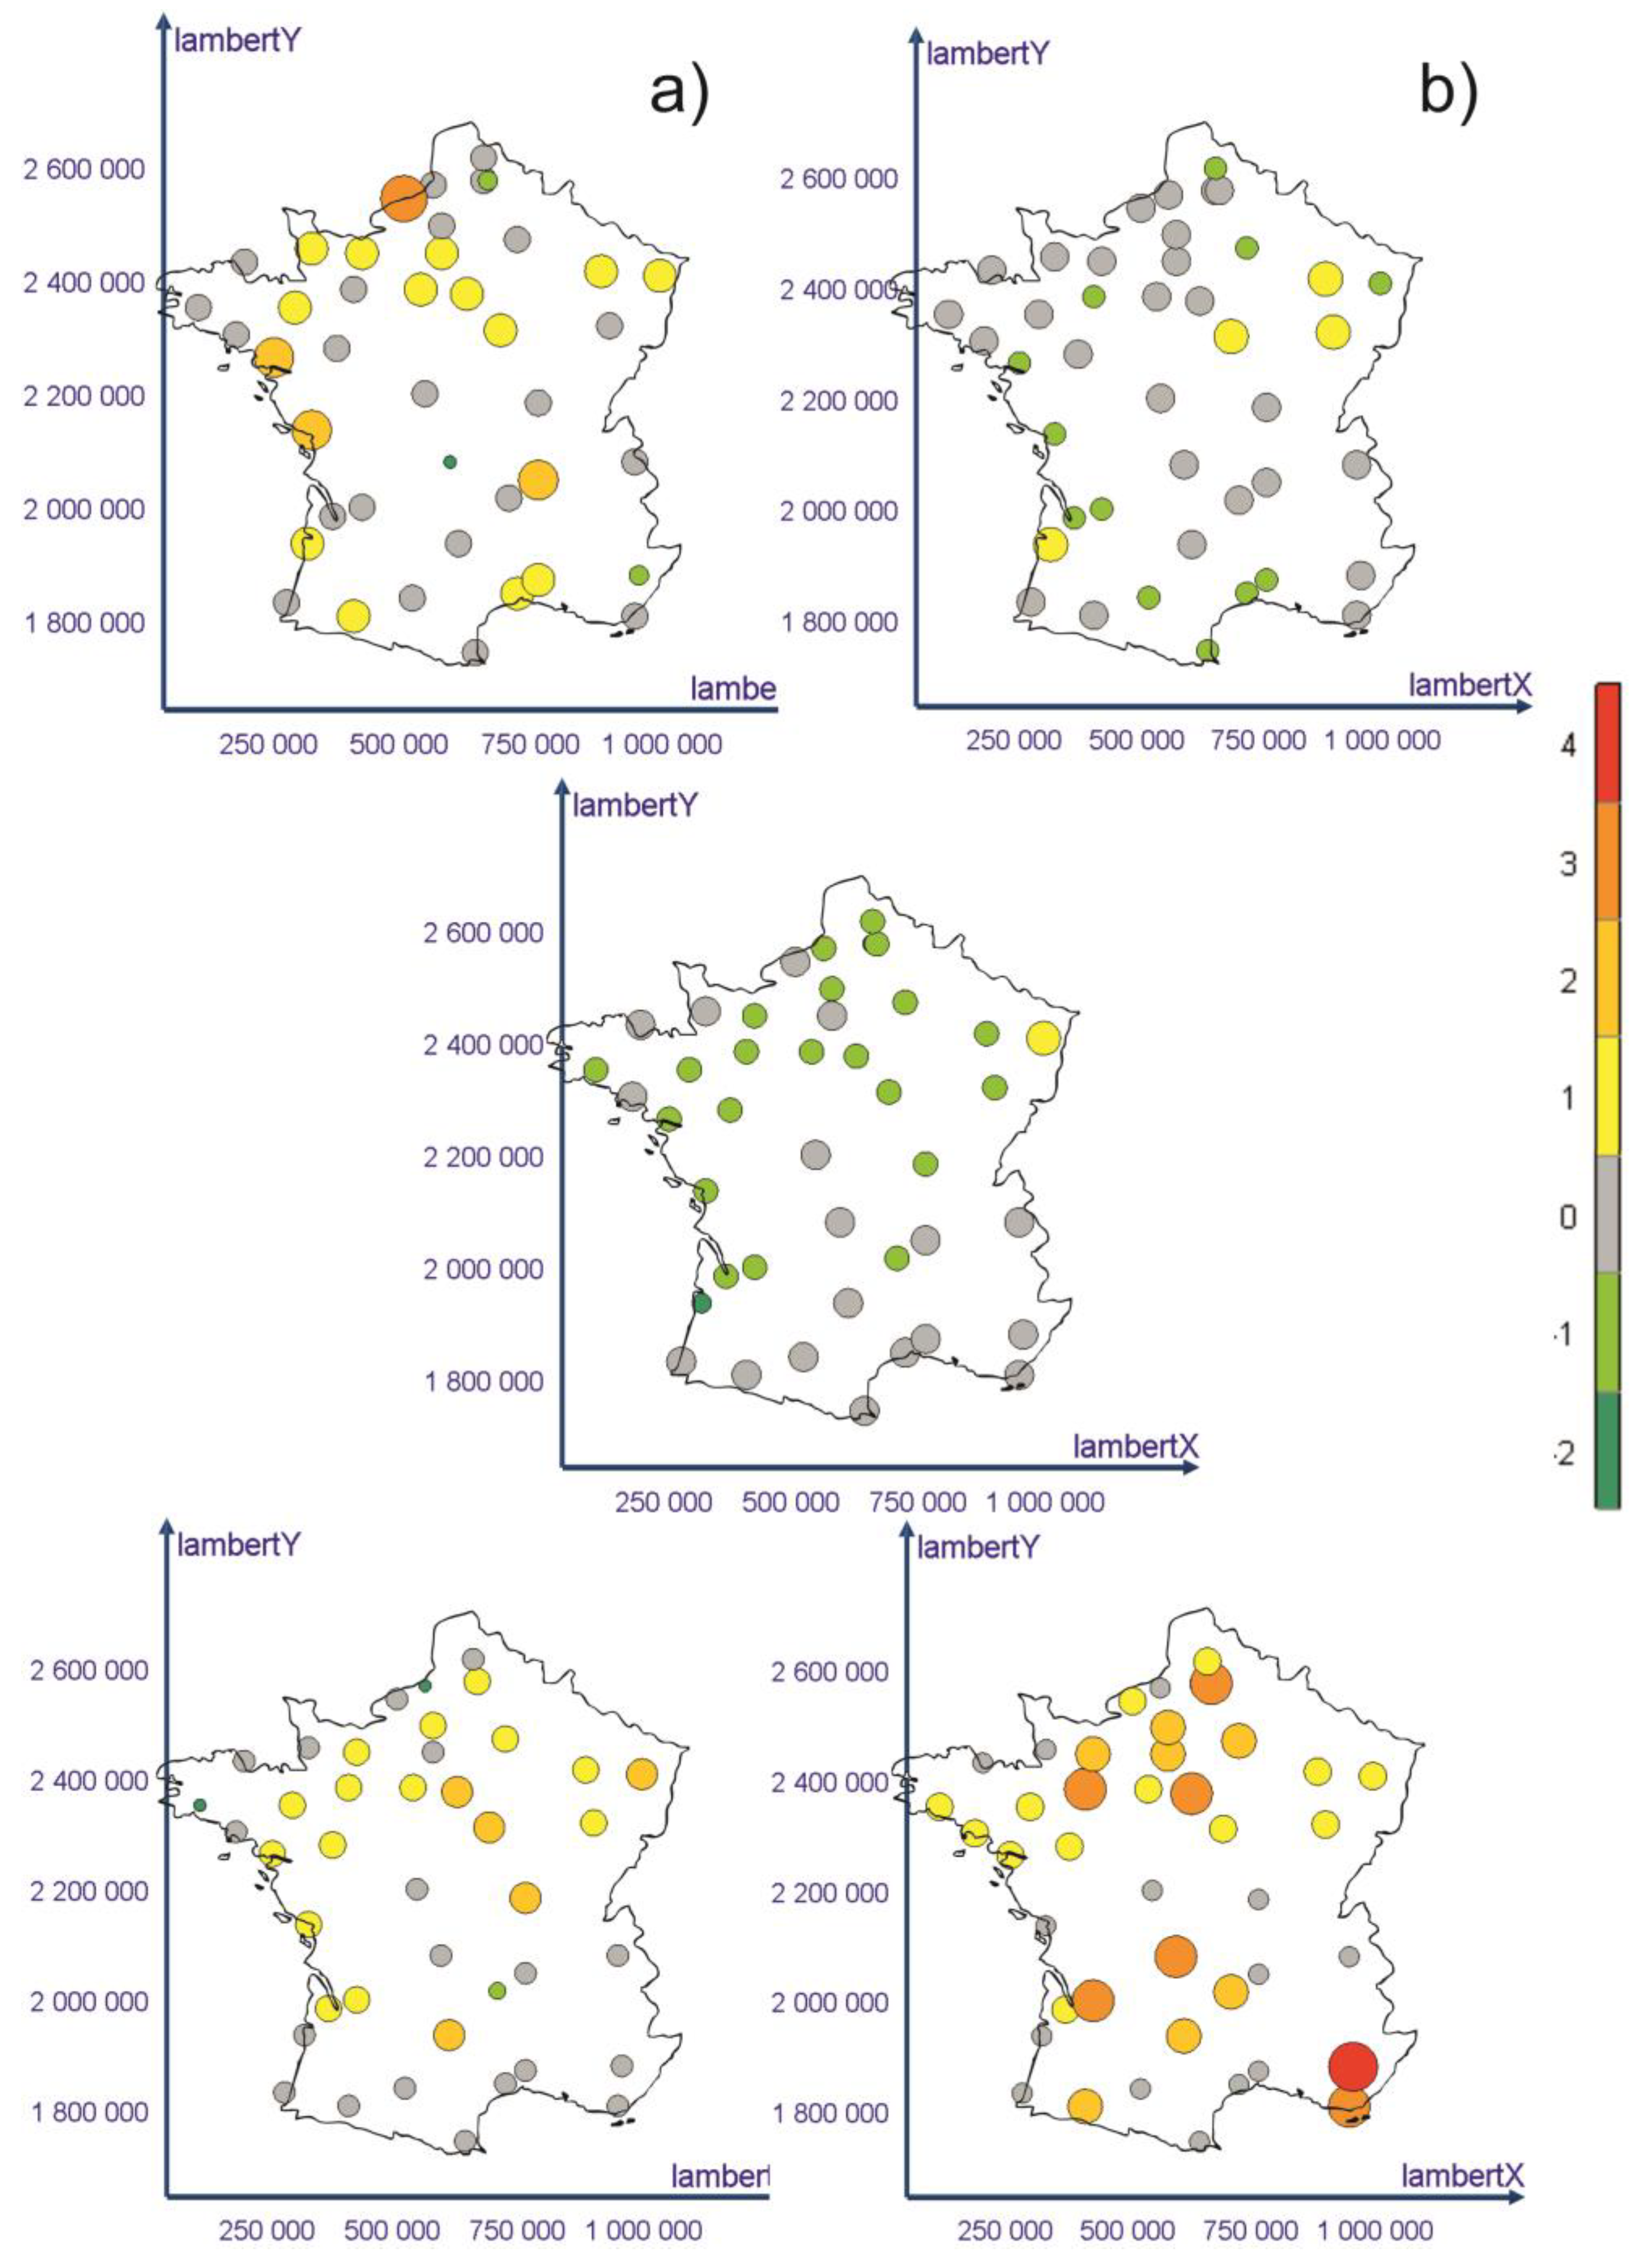
Figure 9 shows the increase (positive) or decrease (negative) of salt weathering between the future and the past. “Predicting” salt weathering change in future, basing the study in only one salt, may conduct to over or more probably, under estimations. We consider that taking into account as much salts as possible is the better way to quantify general salt weathering, because most of the time. In cultural heritage buildings, we do not find a single salt but a combination of them. Differences observed between the results that were obtained with three salts and volume changes may be explained by the fact that in the volume calculations we took into account other salt compositions with nitrates and magnesium and potassium. As can be seen in Figure 10, at 25 °C, and if we do not consider gypsum, the maximum volume increase takes place when relative humidity decreases between 70% and 55%. This fact explains why maximum salt damage takes place in dryer climates. Climate for culture project found [24] a general decrease of salt weathering for most of France during the same period.
It is important to remember that the obtained results do not concern specific buildings nor materials. The main interest of the presented results consists in determining how weathering can change from one region to another and from past time to future, if we consider a same material being exposed to the same exposition, with the same pollutant concentration, etc. In real case studies, many other parameters need to be considered as the nature of the stone and the surrounding materials, nature and concentration of salts, actual and past pollution, orientation of the façade, underground water nature and conditions, and many others.
Computational facilities can help when doing the estimations. A small program, in scilab in our case, can considerably reduce the calculation time of transitions number and avoid the use of other approximations based on mean temperature or relative humidity, as proposed before [12].
Funding
This research received no external funding.
Acknowledgments
We thank Météo-France for the provided data especially Michel Déqué for the climate model realizations. We thank also Christian David (University of Cergy-Pontoise) for his help in writing the article.
Conflicts of Interest
The authors declare no conflict of interest.
References
- Sallam, E.S.; El-Aal, A.K.; Fedorov, Y.A.; Bobrysheva, O.R.; Ruban, D.A. Geological heritage as a new kind of natural resource in the Siwa Oasis, Egypt: The first assessment, comparison to the Russian South, and sustainable development issues. J. Afr. Earth Sci. 2018, 144, 151–160. [Google Scholar] [CrossRef]
- Steiger, M. Salts and crusts. In The Effects of Air Pollution on the Built Environment; Imperial College Press: London, UK, 2003; pp. 133–181. [Google Scholar]
- Charola, A.E.; Ware, R. Acid deposition and the deterioration of stone: A brief review of a board topic. In Natural Stone, Weathering Phenomena, Conservation Strategies and Case Studies; Special Publication; Geological Society: London, UK, 2002; pp. 393–406. [Google Scholar]
- Charola, A.E. Salts in the deterioration of porous materials: An overview. J. Am. Inst. Conserv. 2000, 39, 327–343. [Google Scholar] [CrossRef]
- Arnold, A.; Zehnder, K. Monitoring wall paintings affected by soluble salts. In The Conservation of Wall Paintings; Getty Conservation Institute: Los Angeles, CA, USA, 1991; pp. 103–135. ISBN 0-89236-162-X. [Google Scholar]
- Ruiz-Agudo, E.; Lubelli, B.; Sawdy, A.; van Hees, R.; Price, C.; Rodriguez-Navarro, C. An integrated methodology for salt damage assessment and remediation: The case of San Jeronimo Monastery (Granada, Spain). Environ. Earth Sci. 2011, 63, 1475–1486. [Google Scholar] [CrossRef]
- Goudie, A.; Viles, H.A. Nature of salt involved in salt weathering and sources of moisture. In Salt Weathering Hazards; Wiley: Hoboken, NJ, USA, 1997; 256p, ISBN 978-0-471-95842-0. [Google Scholar]
- Fitzner, B.; Heinrichs, K. Damage diagnosis on stone monuments—Weathering forms, damage categories and damage index. In Abstracts of the International Conference “Stone Weathering and Atmospheric Pollution Network (SWAPNET)”; Prikryl, R., Viles, H.A., Eds.; Prachov Rocks: Jicin, Czech Republic, 2001. [Google Scholar]
- ICOMOS-ISCS. Illustrated Glossary on Stone Deterioration Patterns; Belmin, V., Ed.; ICOMOS: Paris, France, 2008; ISBN 978-2-918086-00-0. [Google Scholar]
- Brimblecombe, P. Heritage climatology. In Climatechange and Cultural Heritage; Lefevre, R.A., Sabbioni, C., Eds.; Edipuglia: Bari, Italy, 2010; pp. 57–64. [Google Scholar]
- Sanjurjo-Sanchez, J.; Alves, C. Decay effects of pollutants on stony materials in the built environment. Environ. Chem. Lett. 2012, 10, 131–143. [Google Scholar] [CrossRef]
- Grossi, C.M.; Brimblecombe, P.; Menéndez, B.; Benavente, D.; Harris, I.; Deque, M. Climatology of salt transitions and implications for stone weathering. Sci. Total Environ. 2011, 409, 2577–2585. [Google Scholar] [CrossRef] [PubMed]
- Yu, S.; Oguchi, C.T. Is sheer thenardite attack impotent compared with cyclic conversion of thenardite–mirabilite mechanism in laboratory simulation tests? Eng. Geol. 2013, 152, 148–154. [Google Scholar] [CrossRef]
- Charola, A.E.; Puehringer, J.; Steiger, M. Gypsum: A review of its role in the deterioration of building materials. Environ. Geol. 2007, 52, 339–352. [Google Scholar] [CrossRef]
- Gibeaux, S.; Thomachot-Schneider, C.; Eyssautier-Chuine, S.; Marin, B.; Vazquez, P. Simulation of acid weathering on natural and artificial building stones according to the current atmospheric SO2/NOxrate. Environ. Earth Sci. 2018, 77, 327. [Google Scholar] [CrossRef]
- Janvier-Badosa, S.; Beck, K.; Brunetaud, X.; Guirimand-Dufour, A.; Al-Mukhtar, M. Gypsum and spalling decay mechanism of tuffeau limestone. Environ. Earth Sci. 2015, 74, 2209–2221. [Google Scholar] [CrossRef]
- Menéndez, B.; David, C. The influence of environmental conditions on weathering of porous rocks by gypsum: A non-destructive study using acoustic emissions. Environ. Earth Sci. 2013, 68, 1691–1706. [Google Scholar] [CrossRef]
- Menéndez, B.; Petráňová, V. Effect of mixed vs. single brine composition on salt weathering in porous carbonate building stones for different environmental conditions. Eng. Geol. 2016, 210, 124–139. [Google Scholar] [CrossRef]
- Lindström, N.; Heitmann, N.; Linnow, K.; Steiger, M. Crystallization behaviour of NaNO3—Na2SO4 salt mixtures in sandstone and comparison to single salt behavior. Appl. Geochem. 2015, 63, 116–132. [Google Scholar] [CrossRef]
- Lopez-Arce, P.; Doehne, E.; Martin, W.; Pinchin, S. Magnesium sulfate salts and historic building materials: Experimental simulation of limestone flaking by relative humidity cycling and crystallization of salts. Mater. Constr. 2008, 58, 289–290. [Google Scholar] [CrossRef]
- Menéndez, B. Estimation of salt mixture damage on built cultural heritage from environmental conditions using ECOS-RUNSALT model. J. Cult. Herit. 2017, 24, 22–30. [Google Scholar] [CrossRef]
- Price, C. An Expert Chemical Model for Determining the Environmental Conditions Needed to Prevent Salt Damage in Porous Materials; Archetype: London, UK, 2000; p. 136. ISBN 1873132522. [Google Scholar]
- Bionda, D. Runsalt Computer Program. 2002–2005. Available online: http://science.sdf-eu.org/runsalt/ (accessed on 2 November 2018).
- Leissner, J.; Kilian, R.; Kotova, L.; Jacob, D.; Mikolajewicz, U.; Broström, T.; Ashley-Smith, J.; Schellen, H.L.; Martens, M.; van Schijndel, J.; et al. Climate for Culture: Assessing the impact of climate change on the future indoor climate in historic buildings using simulations. Herit. Sci. 2015, 3, 38. [Google Scholar] [CrossRef]
- Benavente, D.; Brimblecombe, P.; Grossi, C.M. Salt weathering and climate change. In New Trends in Analytical, Environmental and Cultural Heritage Chemistry, Transworld Research Network; Colombini: London, UK, 2008; Chapter 10; pp. 277–286. [Google Scholar]
- Menendez, B. Salt climatology applied to built Cultural Heritage. In Cultural Heritage from Climate Change to Global Change; Lefevre, R.A., Sabbioni, C., Eds.; Edipuglia: Bari, Italy, 2016; pp. 35–50. [Google Scholar]
Figure 1.
Position of the studied locations. (a) Altitude of the different points. (b) Classification as a function of the temperature and relative humidity for the past and (c) idem for future climate.
Figure 1.
Position of the studied locations. (a) Altitude of the different points. (b) Classification as a function of the temperature and relative humidity for the past and (c) idem for future climate.

Figure 2.
Phase diagram of sodium sulfate. Red arrows indicate the environmental conditions for thenardite/mirabilite transformation.
Figure 2.
Phase diagram of sodium sulfate. Red arrows indicate the environmental conditions for thenardite/mirabilite transformation.
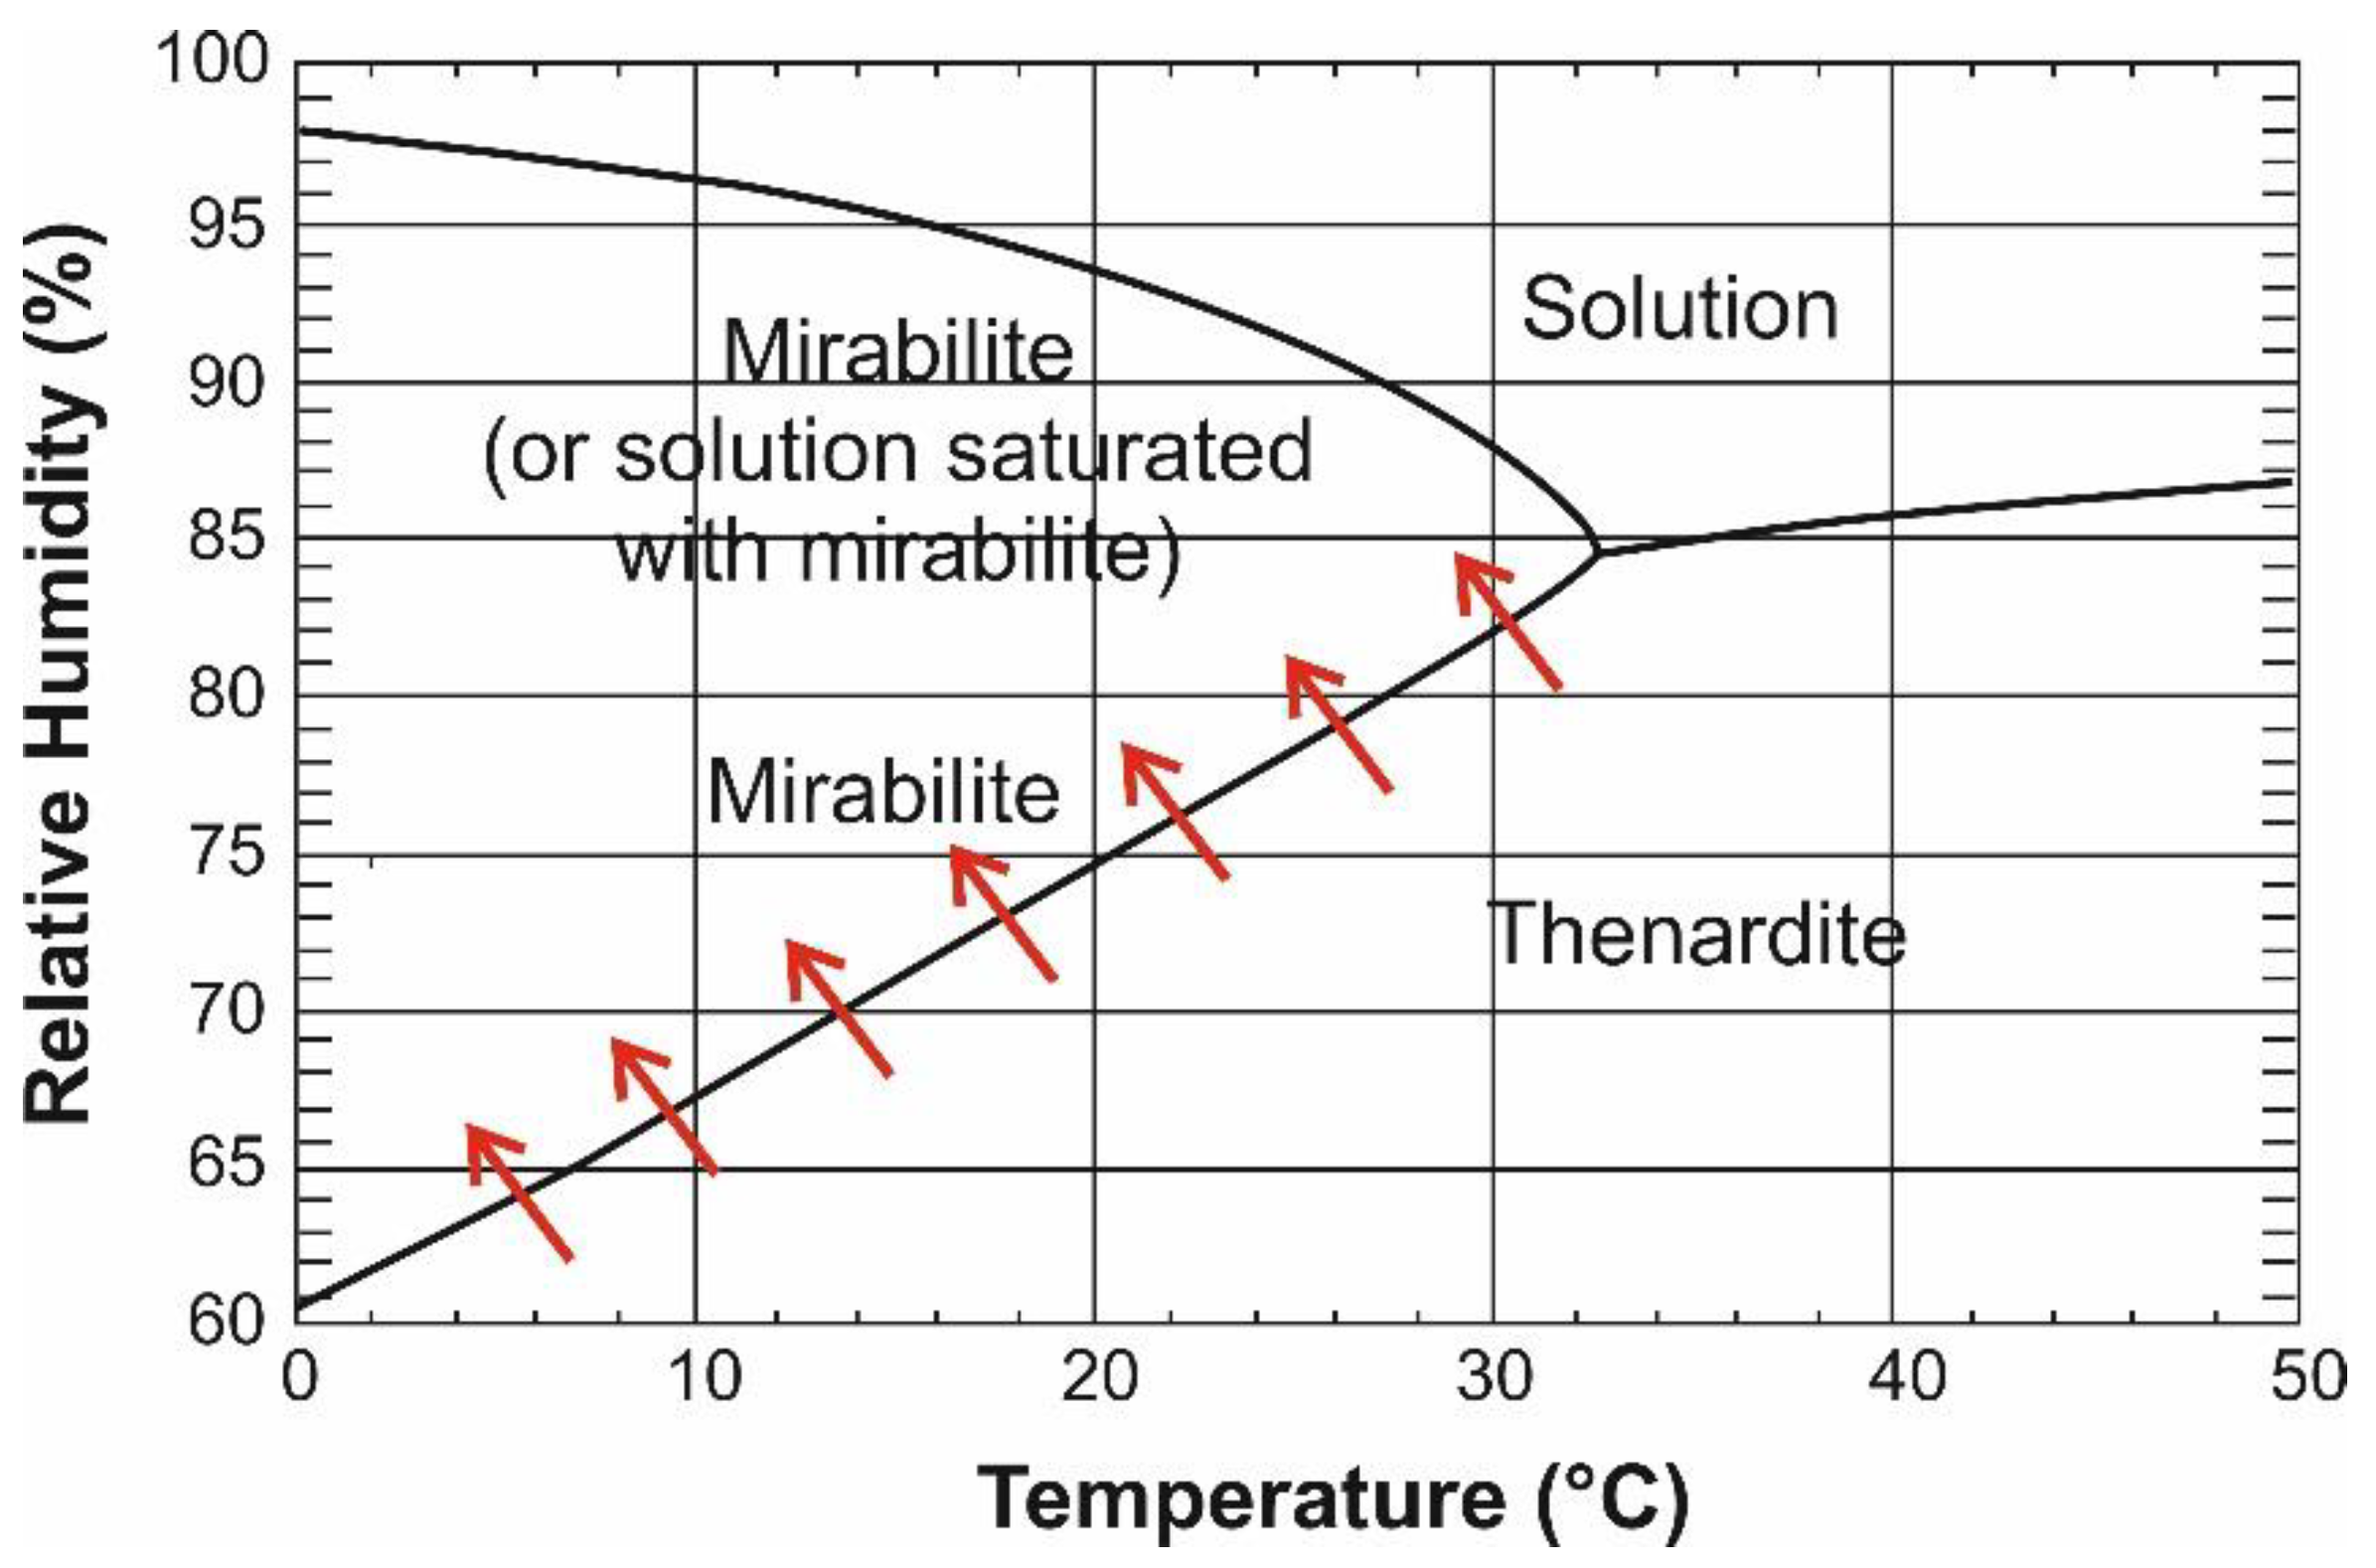
Figure 3.
Salt volume as a function of temperature and relative humidity for the selected salt mixture composition.
Figure 3.
Salt volume as a function of temperature and relative humidity for the selected salt mixture composition.

Figure 4.
NaCl salt weathering estimation for past and future data.

Figure 5.
Na2SO4 salt weathering estimation for past and future data.

Figure 6.
CaSO4 salt weathering estimation for past and future data.

Figure 7.
Salt weathering estimation for past and future data taking into account NaCl, Na2SO4, and CaSO4 at the same time.
Figure 7.
Salt weathering estimation for past and future data taking into account NaCl, Na2SO4, and CaSO4 at the same time.

Figure 8.
Salt weathering estimation for past and future data taking into account the volume change of salts during environmental conditions changes.
Figure 8.
Salt weathering estimation for past and future data taking into account the volume change of salts during environmental conditions changes.

Figure 9.
Salt weathering variation between past and future data taking into account: (a) NaCl, (b) Na2SO4, (c) CaSO4, (d) Three previous salts, and (e) global volume change.
Figure 9.
Salt weathering variation between past and future data taking into account: (a) NaCl, (b) Na2SO4, (c) CaSO4, (d) Three previous salts, and (e) global volume change.

Figure 10.
Salt volume variation for the selected composition without gypsum, calculated with ECO-RUNSALT model.
Figure 10.
Salt volume variation for the selected composition without gypsum, calculated with ECO-RUNSALT model.


Table 1.
Temperature and Relative Humidity values of the barycenter of the classes represented in Figure 1.
Table 1.
Temperature and Relative Humidity values of the barycenter of the classes represented in Figure 1.
| Classe | Tmean | Tsd | Tmin | Tmax | RHmean | RHsd | RHmin | RHmax |
|---|---|---|---|---|---|---|---|---|
| 1 | 11,101 | 5532 | 4096 | 19,067 | 81,000 | 5927 | 72,950 | 89,006 |
| 2 | 11,550 | 4455 | 6064 | 18,080 | 84,020 | 2656 | 79,914 | 87,913 |
| 3 | 13,118 | 6156 | 5693 | 22,680 | 78,117 | 8368 | 62,111 | 87,934 |
| 4 | 13,486 | 6426 | 5444 | 23,026 | 69,031 | 5492 | 59,152 | 75,913 |
| 5 | 14,383 | 5262 | 7883 | 22,232 | 76,860 | 2964 | 72,030 | 81,035 |
Table 2.
Number of transitions of NaCl statistical values for each class of Figure 4.
Table 2.
Number of transitions of NaCl statistical values for each class of Figure 4.
| Class | Mean | Standard Deviation | Min | Max |
|---|---|---|---|---|
| 1 | 60 | 30 | 17 | 106 |
| 2 | 76 | 47 | 13 | 148 |
| 3 | 91 | 39 | 33 | 144 |
| 4 | 102 | 26 | 60 | 144 |
| 5 | 119 | 15 | 93 | 142 |
Table 3.
Number of transitions of Na2SO4 statistical values for each class of Figure 5.
Table 3.
Number of transitions of Na2SO4 statistical values for each class of Figure 5.
| Class | Mean | Standard Deviation | Min | Max |
|---|---|---|---|---|
| 1 | 31 | 26 | 2 | 76 |
| 2 | 50 | 40 | 3 | 111 |
| 3 | 67 | 49 | 5 | 140 |
| 4 | 78 | 27 | 34 | 113 |
| 5 | 100 | 24 | 64 | 136 |
Table 4.
Number of days with RH higher than 80% used to estimate CaSO4 weathering. Statistical values for each class of Figure 6.
Table 4.
Number of days with RH higher than 80% used to estimate CaSO4 weathering. Statistical values for each class of Figure 6.
| Class | Mean | Standard Deviation | Min | Max |
|---|---|---|---|---|
| 1 | 219 | 100 | 71 | 383 |
| 2 | 388 | 95 | 231 | 529 |
| 3 | 446 | 228 | 69 | 759 |
| 4 | 497 | 173 | 267 | 765 |
| 5 | 636 | 94 | 483 | 777 |
Table 5.
Number of NaCl and Na2SO4 transitions and number of days with RH > 80% (CaSO4) for each class of Figure 7.
Table 5.
Number of NaCl and Na2SO4 transitions and number of days with RH > 80% (CaSO4) for each class of Figure 7.
| Classe | NaCl Mean | Na2SO4 Mean | CaSO4 Mean |
|---|---|---|---|
| 1 | 64 | 28 | 636 |
| 2 | 76 | 50 | 448 |
| 3 | 79 | 51 | 512 |
| 4 | 103 | 73 | 418 |
| 5 | 105 | 97 | 238 |
© 2018 by the author. Licensee MDPI, Basel, Switzerland. This article is an open access article distributed under the terms and conditions of the Creative Commons Attribution (CC BY) license (http://creativecommons.org/licenses/by/4.0/).
Share and Cite
MDPI and ACS Style
Menéndez, B. Estimators of the Impact of Climate Change in Salt Weathering of Cultural Heritage. Geosciences 2018, 8, 401. https://doi.org/10.3390/geosciences8110401
AMA Style
Menéndez B. Estimators of the Impact of Climate Change in Salt Weathering of Cultural Heritage. Geosciences. 2018; 8(11):401. https://doi.org/10.3390/geosciences8110401
Chicago/Turabian StyleMenéndez, Beatriz. 2018. "Estimators of the Impact of Climate Change in Salt Weathering of Cultural Heritage" Geosciences 8, no. 11: 401. https://doi.org/10.3390/geosciences8110401
Note that from the first issue of 2016, this journal uses article numbers instead of page numbers. See further details here.