
Intrinsic Evaporative Cooling by Hygroscopic Earth Materials

1
Environmental Studies Program, University of Oregon, 1585 E. 13th Ave, Eugene, OR 97403, USA
2
Department of Geological Sciences, University of Oregon, 1275 E. 13th Ave, Eugene, OR 97403, USA
*
Author to whom correspondence should be addressed.
Geosciences 2016, 6(3), 38; https://doi.org/10.3390/geosciences6030038
Submission received: 30 June 2016
/
Revised: 6 August 2016
/
Accepted: 23 August 2016
/
Published: 31 August 2016
(This article belongs to the Special Issue Geoscience of the Built Environment 2016 Edition)
Abstract
:The phase change of water from liquid to vapor is one of the most energy-intensive physical processes in nature, giving it immense potential for cooling. Diverse evaporative cooling strategies have resulted worldwide, including roof ponds and sprinklers, courtyard fountains, wind catchers with qanats, irrigated green roofs, and fan-assisted evaporative coolers. These methods all require water in bulk liquid form. The evaporation of moisture that has been sorbed from the atmosphere by hygroscopic materials is equally energy-intensive, however, yet has not been examined for its cooling potential. In arid and semi-arid climates, hygroscopic earth buildings occur widely and are known to maintain comfortable indoor temperatures, but evaporation of moisture from their walls and roofs has been regarded as unimportant since water scarcity limits irrigation and rainfall; instead, their cool interiors are attributed to well-established mass effects in delaying the transmission of sensible gains. Here, we investigate the cooling accomplished by daily cycles of moisture sorption and evaporation which, requiring only ambient humidity, we designate as “intrinsic” evaporative cooling. Connecting recent soil science to heat and moisture transport studies in building materials, we use soils, adobe, cob, unfired earth bricks, rammed earth, and limestone to reveal the effects of numerous parameters (temperature and relative humidity, material orientation, thickness, moisture retention properties, vapor diffusion resistance, and liquid transport properties) on the magnitude of intrinsic evaporative cooling and the stabilization of indoor relative humidity. We further synthesize these effects into concrete design guidance. Together, these results show that earth buildings in diverse climates have significant potential to cool themselves evaporatively through sorption of moisture from humid night air and evaporation during the following day’s heat. This finding challenges the perception of limited evaporative cooling resources in arid climates and greatly expands the applicability of evaporative cooling in contemporary buildings to water-stressed regions.
1. Introduction
The energy used to cool buildings worldwide is expected to increase dramatically in the coming decades, continuing a trend that is already apparent. Driven by rising incomes in developing nations, saturation of buildings with electric air conditioning is growing rapidly and is predicted to expand throughout the century. In developed regions, rising temperatures are expected to increase use of air conditioners that already exist [1,2]. Under their combined effects, total air-conditioning energy consumption is projected to increase from about 300 TWh in 2000 to about 4000 TWh in 2050, and to surpass 10,000 TWh by 2100, causing associated carbon emissions to rise nearly forty-fold. While space heating energy use should decline simultaneously, cooling demand is predicted to dominate, propelling combined heating and air conditioning emissions from ∼0.8 Gt in 2000 to ∼2.2 Gt in 2100, accounting for 12% of the global total, unless cooling methods change significantly [2].
In pursuit of such change, those who design, build, and govern the codes of buildings are now keenly interested in “passive” cooling techniques that rely primarily on site resources (wind, water, earth) and unassisted physical processes (natural convection, shading, evaporation, conduction) to remove heat from indoor spaces [3,4,5,6]. Within this pursuit, evaporative cooling is particularly intriguing because liquid water consumes considerable energy in its transition to vapor (2260 kJ/kg), cooling the air into which it evaporates. Strategies for evaporative cooling have proliferated accordingly; in vernacular architectures, these include Spanish courtyard fountains, Iranian wind catchers that funnel air over qanats, and wild Mexican green roofs [7,8,9], while contemporary buildings use roof sprinklers, misters, roof ponds, evaporative cooling towers, or lushly planted, irrigated green roofs [10,11,12]. At the same time, evaporative cooling is commonly understood to require a liquid water supply, and numerous warm climates in the world are either anticipating water stress or are water-stressed already [13,14].
New evidence suggests, however, that a supply of liquid water may not in fact be necessary for evaporative cooling to occur. Over the past decades, building scientists have devoted substantial effort to understanding vapor-driven heat and moisture transfer in building materials, with the central goal of diminishing unintended heat loss through vapor-permeable roof and wall assemblies [15]. As a result, the enthalpy changes accompanying sorption of water vapor from air, evaporation into air, and internal vapor and liquid-phase transport are now well-characterized among materials representing diverse hygroscopic properties (moisture-dependent vapor diffusivities, moisture retention isotherms, moisture redistribution functions, and moisture-dependent thermal conductivities; see Section 2, below) [16]. Contributing to the plausibility of vapor-driven evaporative cooling is the tendency of many climates to experience greater humidity at night, in absolute as well as relative terms, due respectively to diurnal variation in atmospheric mixing patterns and the temperature dependence of the saturation vapor pressure [17].
In related work, soil scientists have clarified a number of relationships between intrinsic soil properties (texture, porosity, specific surface area, hygroscopicity, wettability, capillarity, hydraulic conductivity, and vapor-diffusion resistance) and evaporation dynamics, with particular attention to the controlling influences of moisture saturation, temperature, and relative humidity [18]. Since unfired earth materials tend to resemble their parent materials hygroscopically (unless significant plant matter or stabilizing agents are added), parent behavior can provide useful insight into the properties of the derived materials. Together, fortuitously, these fields have provided the groundwork to support the investigation of evaporative cooling by hygroscopic earth materials in the absence of rain or irrigation, when the only source of moisture is humid air.
An estimated one-third to one-half of the world’s people currently live in buildings made of earth [19]. Concentrated in warm areas, and especially warm dry areas, adobe, “puddled” mud, rammed earth, wattle-and-daub, cob, ash, and stone dwellings define the vernacular architectures of the American Southwest, Mexico, Central America, and parts of Europe, Asia, Africa, and Australia [20]. While humble in appearance, these buildings are widely reported to maintain comfortable indoor temperatures through extremely hot days, often remaining many degrees Celsius (ten or more degrees Fahrenheit) cooler than the outside air [21,22,23,24]. Their comfort is primarily attributed to the well-established ability of massive walls and roofs (“thermal mass”) to delay solar heat gains and to store nighttime “coolth” [21,22,23,24,25,26,27,28,29,30], however, in addition to shading and/or natural ventilation in some instances [30]). Intrinsic evaporative cooling has only been suggested by two intriguing reports from the American Southwest, focusing on adobe buildings, that cite elevated nighttime humidity in semi-arid climates as an important but often-overlooked factor [31,32].
Here, capitalizing on the diversity of materials and climatic regions found in earth building practices, as well as recent progress in understanding the evaporative behavior of earth materials, we investigate the relationships between hygroscopic properties and intrinsic evaporative cooling capabilities of soils, adobe, cob, rammed earth, unfired earth bricks, and limestones under diverse climatic conditions, revealing characteristic patterns of performance that may now inform climate-responsive evaporative cooling design.
2. Materials and Methods
The prediction of intrinsic evaporative cooling behavior depends on physical relationships among a number of factors that control moisture content and transport through earth building materials, reviewed below together with a brief description of modeling procedures. Nomenclature is summarized in Table 1, and material properties and sources are compiled in Table 2.
2.1. Hygroscopic Properties of Geological Materials
The pore size distribution and matrix surface properties control the dependence of the moisture content W on relative humidity φ, often referred to as the moisture isotherm, soil water retention curve, or soil characteristic curve. At a fixed temperature T (above 0 °C) and ambient air pressure (i.e., 101.3 kPa), the pore space is completely dry when . The introduction of water vapor leads to adsorption of the condensed phase onto those mineral surfaces with the strongest liquid affinity [33,34]. The large specific surface areas of clays (particularly those with the 2:1 structure comprised of octahedral aluminum hydroxide sheets sandwiched between tetrahedral silicate sheets) results in correlations between clay content and water content at relatively low values of φ, with the hydration of different interlayer cation species playing a secondary role and contributing towards differences in water adsorption on different clays [35,36,37,38]. As the vapor pressure is increased, the patchy liquid network coalesces into thickening films. Intermolecular forces between the mineral, liquid, and vapor constituents control the film growth [39], commonly leading to a power-law dependence of film thickness on the water potential (defined below) [38,39], though logarithmic film growth and more complicated dependencies are also predicted and observed [35,36,37,39]. Surface tension controls the curvature of liquid menisci that bound capillary reservoirs in pore corners [40], which become volumetrically more important than the film liquid at higher water contents. The approach to bulk coexistence at the saturation vapor pressure is met with reductions to the menisci curvature and continued swelling of the liquid films, so that W progressively increases, with smaller pores filling first. Complete liquid saturation (i.e., , for porosity n and liquid density ) is achieved at a finite offset below . Although surface tension and adsorption properties can themselves be temperature dependent, we neglect such complications here and treat W as a unique function of φ.
A primary motivation for understanding the hygroscopic behavior of soils originates in the importance of changes in moisture content to agriculture. Above the water table, the ability of plant roots to access the moisture held by capillarity and surface adsorption can be gauged in terms of the water potential Ψ. This is defined such that Ψ is zero at the water table, where the liquid pressure is atmospheric and therefore equal to the ambient air pressure in the overlying vapor phase. As the gravitational potential increases with height in the unsaturated zone above, the liquid pressure drops below so Ψ—which is equivalent to the liquid pressure minus —decreases, and it becomes increasingly difficult to liberate the residual moisture for plant use. For practical purposes, the “field capacity” under well-irrigated conditions is typically defined by a water potential of kPa. Plant maintenance is severely compromised below the “permanent wilting point”, which by convention is assigned a value of MPa. The relative humidity and water potential are related through the thermodynamic relationship
where R is the gas constant, is the partial molar volume of water, and the temperature T (expressed here in Kelvin) exerts a relatively minor influence over the range typically encountered. For intuition, Equation (1) implies that at the permanent wilting point when the temperature is 20 °C ( at 50 °C with MPa). Studies motivated by agricultural applications typically concentrate on the moisture content at more modest , implying values of φ that are very close to unity; in contrast, changes in W that are important for energy balances, both in climate models and in earthen building materials, occur over a broad range that extends to much lower φ.
The potential affects of moisture changes on the energy balance can be illustrated by comparing the sensible heat that accompanies changes in temperature with the latent heat that is associated with evaporation and condensation. Solar heating of exposed building materials can raise surface temperatures to daily highs exceeding 50 °C, after which night-time cooling may bring them to 20 °C or lower. As shown in Figure 1, the saturation vapor pressure (uppermost curve) changes by nearly a factor of six over this temperature range (i.e., from 12.4 kPa at 50 °C to 2.4 kPa at 20 °C). Because of the dependence of W on φ (or Ψ) in porous materials, this implies that appreciable evaporation and condensation can be driven by the daily temperature cycle. Indeed, neglecting moisture transport, such dramatic temperature swings would be expected to raise φ enough to produce night-time condensation (i.e., dew), even if the relative humidity at a peak surface temperature of 50 °C were as low as 17% (the same in adjacent air at 35 °C would be at ). Within confined pores, where capillarity and adsorption produce gradual changes in W with variations in φ, the daily exchange of moisture across the phase boundary can have a significant affect on the energy balance. For example, assuming a 30 °C temperature change , for a material with density kg/m3 and heat capacity J/(kg·°C), this implies a change in sensible heat of MJ/m3. The change in moisture content required for the affects of latent heat L to match this value is kg/m3. For perspective, this represents only an 8.5% change in the liquid saturation level (volume fraction of the pore space occupied by liquid) in a material with porosity . The constitutive behaviors of many of the geological materials summarized in Section 2.3 and described in further detail in Section 3 imply changes in moisture content that exceed this small amount in response to the change in φ implied by this simple scenario. Consequently, evaporation and condensation are expected to strongly influence the thermal response of such constructions to diurnal forcing, damping the magnitude of temperature swings by an amount that is modulated by the associated transport of moisture and heat, which are described next.
2.2. Coupled Heat and Moisture Transport
At relatively high φ (i.e., modest ), liquid transport through unsaturated porous media is commonly described using Richard’s equation [42], which is based on mass conservation arguments and Darcy’s law for liquid flow. As φ is reduced, the accompanying drop in W causes a decrease in the hydraulic conductivity of the liquid network so that the gradients in that drive transport through the vapor phase must eventually become comparatively more effective. Accordingly, over the broad range of conditions to which building materials are subjected, both liquid and vapor transport can be important. Moreover, the latent heat transfers that accompany evaporation and condensation can significantly influence the energy balance, and the dependence of the saturation vapor pressure on temperature (Figure 1) acts to further couple heat and moisture transport.
It is convenient to cast the conservation of mass and energy in terms of the evolution of φ and T. To facilitate this, the moisture-dependent storage capacity S of the building material is defined as the rate of change in W with φ (see Table 1). Following Darcy’s law, liquid transport can be expressed as proportional to the gradient in φ by employing a liquid transport coefficient D that is proportional to the moisture-dependent hydraulic conductivity K. Transport down gradients in vapor pressure is proportional to the ratio of the temperature-dependent vapor diffusion coefficient in air δ to a moisture-dependent vapor diffusion resistance factor μ that increases as connected vapor flow paths become more tortuous and restricted with higher W. Taken together, spatial variations in the rates of liquid and vapor transport produce an evolution of the local relative humidity that satisfies [15,16]:
where and the small ratio of thickness to lateral dimensions of building elements ensures that a one-dimensional treatment is generally sufficient, with x defined here as the distance from the exterior surface.
Moisture transport through the liquid and vapor phases produce slightly different outcomes. The first term on the right side of Equation (2), describing the effects of liquid transport, acts to smooth variations in relative humidity φ and water content . The second term on the right side of Equation (2), describing the effects of vapor transport, acts to smooth variations in vapor pressure , which track variations in in isothermal materials that have uniform saturation vapor pressure . When large temperature gradients are present (e.g., near exterior surfaces subject to direct solar gain), however, by acting to smooth variations in , vapor transport can actually enhance spatial variations in relative humidity φ and water content .
Accurate measurements of the liquid transport coefficient are difficult to obtain, particularly at low W. Moreover, differences that arise between the moisture distribution during drying and wetting can cause to be multivalued [15,16], with differences becoming more pronounced when capillarity dominates the moisture storage at higher W. Such effects (i.e., hysteresis) can be particularly important for distinguishing between the redistribution of liquid within a comparatively dry porous medium, and the suction into a porous medium of liquid water that impinges upon an exterior surface (i.e., resulting from precipitation or irrigation). With our focus on intrinsic evaporative cooling, in the current work we are justified in assigning a single, unique function for in each of the model simulations that follow. As noted above, under sufficiently dry conditions, moisture transport is primarily accomplished through the vapor phase, so precise knowledge of the liquid transport coefficient is not always necessary. Considering the limit where gradients in the saturation vapor pressure that accompany temperature gradients are less important for driving vapor transport than gradients in the relative humidity (i.e., ), the ratio of the first and second terms on the right side of Equation (2) scales with
This scaling argument suggests that liquid transport is more effective than vapor transport when , whereas the effects of liquid transport should be negligible when . For example, at 20 °C and a relative humidity of , Equation (3) indicates that liquid transport is negligible if m/s; when this condition holds, inaccuracies in should not affect model performance.
The overall heat content evolves due to spatial variations in the heat transport by conduction, with moisture-dependent thermal conductivity k, and the latent heat that is associated with gradients in vapor transport. Note that the transport of sensible heat by moisture migration is assumed to be negligible (i.e., the Peclet number is very small). These considerations result in a temperature evolution that is scaled by the change in heat content with the temperature of the dry material , augmented by that required to heat the local liquid content , so that [15,16]:
2.3. Procedures Followed for Assigning Controlling Parameters
To solve Equations (2) and (4) and describe how φ and T evolve within particular building materials, the constitutive behavior must first be specified. Of central importance are the moisture storage function (which is differentiated to obtain ), the vapor diffusion resistance factor , the liquid transport coefficient (also referred to as the redistribution function), and the thermal conductivity . The dry density , heat capacity C, and porosity n (which determines when peak saturation occurs) must also be assigned. The vapor diffusion coefficient in air can be calculated from the empirical fit [15]:
where the ambient air pressure is kPa and T is measured in Kelvin; note that the effective vapor diffusivity in the pore space is . Values for the physical constants and L are given in Table 1.
Material-specific constitutive parameters (see Table 2, [43,44,45,46,47,48,49,50,51,52,53,54,55,56]) were assigned in two different ways: (1) for the soils considered in Section 3.1, we assigned 12 specific textures and followed the published correlations described further below in Section 2.3.1 to obtain moisture content , hydraulic conductivity , and thermal conductivity , with all other controlling parameters either derived in part from these or taken entirely from representative values in the published literature; (2) for the adobe, cob, unfired earth bricks, rammed earth, and stone considered in Section 3.2, Section 3.3, Section 3.4, Section 3.5 and Section 3.6, we based our parameter choices on measured characteristics from a series of published studies on materials used in earth buildings. Our primary goals are to assess the potential of intrinsic evaporative cooling in earth buildings and reveal the dominant controls on the general patterns of behavior that result. It should be recognized that the controlling parameters that we adopt are illustrative of natural behavior that has a wider range than we are able to explore here.
2.3.1. Textural Controls on Soil Properties
Numerous “pedotransfer function” models with different functional forms have been developed based on regression analyses that relate hygroscopic properties to measured soil textural characteristics [57,58]. Recognizing that adsorption on clay surfaces tends to govern the water content at low φ, much recent effort has been devoted to specialized treatments focused on describing observed changes in W at low moisture contents [35,36,37,38]. In parallel efforts, more elaborate functional relationships have been proposed that approximate W over the entire moisture range, from the wetter conditions under which capillarity (and liquid transport) dominates to the dryer conditions under which surface adsorption is more volumetrically significant [59,60,61]. Though they have so far been validated against only relatively small data sets, these ongoing developments hold promise for refining a priori estimates of when measurements of moisture content in a particular soil are not available.
To illustrate how the patterns of hygroscopic behavior can be expected to vary with soil texture, we adopt the simple and venerable Brooks–Corey [62] relationship employed by Saxton et al. [45], who used data from some 2500 samples [63] to constrain the parameters A and B such that
where the dependence on φ can be obtained by substituting for Ψ using Equation (1). Over the range in which kPa the regression is optimized with
where and are the percentages of sand and clay, with silt-sized particles assumed to constitute the remaining fraction. Note that the water content predicted by Equation (6) reaches zero only if the relative humidity (i.e., ), whereas liquid adsorption on any particular mineral surface is expected to stop at a finite relativehumidity threshold that is controlled by its liquid affinity. Such a de-wetting transition and other more subtle changes in adsorption behavior can produce deviations from the simple power law described by Equation (6). The most important consequence is expected to be a steepening in the slope of the moisture retention curves at low φ, with the implication that the hygroscopic behavior predicted by Equation (6) should yield conservative estimates of the evaporative cooling potential.
We use representative porosities and dry densities [43] for the 12 different textures we consider (see Section 3.1.1), and follow Moldrup et al. [46] in estimating the vapor diffusion resistance factor from
we follow Saxton et al. [45] in estimating the hydraulic conductivity K used to define the liquid transport coefficient D (Table 1) from
the dependence of thermal conductivity k on texture and water content is taken from [43,44].
2.4. Simulation of Intrinsic Evaporative Cooling in Buildings
To reveal heat and moisture storage and release patterns characteristic of each material and configuration, the performance of each representative building was simulated with EnergyPlus 8.4, an open-source building energy simulation program [64]. Hygroscopic surfaces of interest were simulated with the EnergyPlus Heat and Moisture Transfer (HAMT) algorithm to solve Equations (2) and (4), while all other surfaces were simulated with the Conductive Finite Difference (CFD) algorithm, which has and omits the second term on the ride side of Equation (4), effectively eliminating hygroscopic behavior [65]. To ensure that moisture equilibration was achieved in hygroscopically active surfaces, a minimum of 25 warmup days were used, and run periods began six months before each data set of interest.
For simplicity of data interpretation, windows and doors were excluded from all models, and floors were simulated as non-massive insulating ( W/m2K) materials in contact with ground temperatures estimated by the EnergyPlus Auxiliary program Slab for each climate [66]. Infiltration was assumed to be moderate at 1.0 air changes per hour (ACH). Building geometries were defined with Legacy OpenStudio 1.0.14, a Trimble SketchUp 15 extension for EnergyPlus [67]; all other objects (materials, constructions, infiltration) were specified directly with the EnergyPlus IDF Editor. Rain indicators (where present) were removed from weather files to preserve the focus on intrinsic hygroscopic behavior.
The EnergyPlus HAMT algorithm defines twelve nodes spanning the thickness of a building element, with Node 1 located on the outer (exterior) surface and Node 12 on the inner (interior) surface [65]. Heat and moisture transfer to and from building element surfaces take place across boundary layers that are accounted for using convective transfer coefficients to relate the temperature and vapor pressure at surface nodes to their counterparts in the surrounding air. The contributions of conductive transfer of sensible heat and latent heat transfer resulting from evaporation and condensation (i.e., the two terms whose gradients appear on the right side of Equation (4)) can be approximated using model-reported temperature and relative humidity data from the innermost and outermost pairs of nodes. Using subscripts to refer to Node indices, the conductive heat fluxes at inner and outer surfaces are calculated from temperature differences and distances between the two innermost and two outermost cells, respectively, using the corresponding average of moisture-dependent thermal conductivity values , so that
Similarly, latent heat fluxes at inner and outer surfaces are calculated from the relative humidities , saturation vapor pressures , and averaged vapor diffusion resistance factor of the inner and outermost pairs of cells, respectively, leading to
where L is the latent heat of vaporization, and averages the adjacent temperature-dependent vapor diffusivities (i.e., calculated using Equation (5)). Setting , for example, Equations (10) and (11) are used to compare the modeled sensible and latent heat fluxes at the exterior surface.
The total latent heat flux from each building element , encompassing evaporation and condensation at both inner and outer surfaces, as well as the more minor contributions of phase changes within the interior of the building element, can be calculated from model-reported temporal changes in the surface average water mass ratio for the entire wall, scaled by the dry density , latent heat of vaporization L, and thickness X to give
where the j indices are used to denote values at successive timesteps. Note that latent heat exchange within the interior of the building element can be evaluated as the difference between from Equation (12) and the sum of the values of calculated from Equation (11) at both the interior () and exterior () surfaces.
3. Results and Discussion
To understand ways in which intrinsic evaporative cooling behavior responds to material properties and to climate characteristics—and thus to provide evidence with which to inform contemporary design—we first selected a set of earth building types and elements representing a range of hygroscopic properties and climate regimes (Table 3). Using hygroscopic properties derived from experimental data and established physical relationships (Table 2), we then simulated their mid-summer behavior in their native climates to reveal the patterns discussed below.
3.1. Soils
Soil roofs without intentional vegetation preceded contemporary planted roofs by several centuries (particularly in semi-arid regions of northern Mexico and the southwestern US), and they still occur widely throughout the area. These “Mexican green roofs”, contained by parapets on flat adobe roofs, are typically comprised of local surface soils without intentional vegetation, though seasonal colonization by wildflowers and grasses is common. Controlled experiments have suggested intrinsic evaporative cooling behavior of these soil roofs, in the absence of plants, though the evidence is not conclusive [68]. The widespread reliance on such roof assemblies for summer cooling, the apparent lack of preference for particular soils, and the diversity of soil textures found throughout the region raise two questions: first, whether intrinsic evaporative cooling plays a significant role in the observed cooling, and second, whether soil texture influences the magnitude or timing of this process. To clarify these effects, therefore, we begin with a survey of Mexican green roofs composed of soils representing the recognized range of textures.
3.1.1. Soil Hygroscopic Properties
The Unified Soil Classification System defines twelve reference soil textural groups according to proportions of sand, silt, and clay (Figure 2). Because of the control that the particle size distribution has on pore geometry and surface area, these twelve textures, in turn, are related to the moisture storage function W and other properties of interest for hygrothermal calculations (see Section 2.2): vapor diffusion resistance factor μ (or VDRF), liquid transport coefficient or diffusivity D, thermal conductivity k, porosity n, dry density , and dry specific heat capacity C. We followed Kehrer et al. [43] in choosing the particular compositions marked by the points on Figure 2 as representative of each of these textural classes.
Here, our primary interest is in examining how texture affects the general patterns and magnitudes of intrinsic evaporative cooling. Though variations in moisture content for any particular soil are sensitive to further details of the particle size distribution, packing arrangement, mineralogy, and surface properties that are not captured by the simple pedotransfer function we use to define , the curves displayed in Figure 3a provide a useful illustration of the general patterns of behavior that prevail. The moisture content changes most dramatically as complete saturation is approached at high relative humidities, with W rising by more than 50 kg/m3 for each model soil as φ is increased above 95%. At fixed φ under drier conditions, both the moisture content W and the slope of the moisture retention curve tend to be larger for soils with higher clay fractions and correspondingly larger surface areas available to host adsorbed liquid layers, consistent with a range of empirical data that also reveals differences between the adsorptive properties of different clays (not accounted for here) [37,38,59,60,61].
The vapor diffusion resistance factor increases as vapor pathways become more restricted when the liquid content W approaches complete saturation (Figure 3b). The exponential decrease in hydraulic conductivity K predicted by Equation (9) as water content W is reduced dominates changes in the liquid transport coefficient so that D drops rapidly as the relative humidity φ is lowered, particularly for textures with modest clay contents (Figure 3c). The dependence of thermal conductivity k on water content can be approximated as linear over modest ranges in moisture content (Figure 3d).
3.1.2. Intrinsic Evaporative Cooling by Mexican Green Roofs: Effect of Soil Texture
Each of the twelve soils was simulated as a 10 cm thick hygroscopically-active Mexican green roof atop a compact 4 m × 3 m × 2.5 m adobe building facing south that was not, itself, allowed to be hygroscopically active (see Section 2.4 for modeling details). Simulations were conducted with the Laredo, TX TMY3 weather file (Table 3), representing a semi-arid steppe climate.
Throughout June, July, August, and September, the roofs’ latent heat fluxes (associated with evaporation and condensation; Equation (11)) directly opposed the sensible heat fluxes associated with solar radiation and convection (Equation (10)) for all soil textures, as expected. Those of clay, sand, sandy clay loam, and silty clay loam show the range of results obtained for several representative hot summer days (Figure 4). Across the range of soil textures, evaporation counteracted 11%–22% of daytime sensible gains to each roof in August (the hottest month), peaking in rate when the solar gain to the surface was greatest (near noon) rather than when the outside air temperature was greatest (approx. 5 p.m.), suggesting that the orientation of an evaporative cooling material may be an important design consideration. Condensation from cooler, more humid nighttime air, in turn, diminished nighttime heat loss from each roof by 18%–37%, with peak condensation typically occurring after midnight following substantial cooling.
The thermal conductivity of a soil increases with moisture [43,44], and although precipitation was excluded from all simulations, several of the soils absorbed sufficient moisture from the air to substantially raise their thermal conductivities. These relationships are evident in Figure 3: since the soils stabilized at moisture contents corresponding to the median Laredo July value of (Figure 8b, ranging from 25 to 250 kg/m3) , their thermal conductivity values increased accordingly (Figure 3d), affecting not only latent but also sensible heat flux predictions significantly in the higher-clay soils, which had greater surface areas on which to sorb liquid films.
This result shows that moisture-dependent thermal conductivity values are essential to the simulation of passive evaporative cooling by porous media (see Figure 5). In addition, however, it provides an important caution for building envelope heat-flux modeling in general: such modeling is routinely carried out with single dry values for envelope materials. If these materials can hold moisture and exhibit moisture-dependent thermal conductivity, the true heat fluxes may be much greater than predicted.
As expected, intrinsic evaporative cooling varied with soil texture in a clear pattern. Total heat losses due to evaporation were greatest from soils with the most even distributions of particle sizes (e.g., silty clay loam, loam, and clay loam, in that order), with monthly losses exceeding 5.7 kWh/m2, and least from the most uniformly coarse (sand) and uniformly fine (clay) textures, although even the lowest-performing soils were more than half as effective as the best (Figure 6a). Examined from another perspective, however, silty soils showed the most promising performance. Because of their lower thermal conductivities in the moisture ranges they experienced, the silt, silt loam, loam, and silty clay loam textures admitted less sensible thermal energy from solar radiation and natural convection than did the loamier soils; though their evaporative heat losses were lower, these textures experienced the lowest total thermal gains (Figure 6b).
These trends in performance can be interpreted in light of the hygrothermal properties that are displayed in Figure 3. The latent heat flux that causes evaporative cooling is influenced both by changes in phase that alter the local moisture content W and by moisture migration. Changes in W in response to changes in relative humidity are particularly dramatic at high φ (i.e., the moisture storage is large), but remain significant under the drier conditions that are most prevalent under typical summer conditions in Laredo, TX, USA. A closer examination reveals that for φ below approximately 80%, each of the lowermost six curves in Figure 3a—which characterize soil textures with clay contents below 20%—adsorb less than 0.5 kg/m3 of liquid water for each percentage change in φ. Larger changes in W with φ (higher S), suggesting the potential for larger evaporative fluxes, are expected for the more clay-rich textures represented by the uppermost six curves, with values closer to 1 kg/m3 for each percentage change, even when φ is below 80%.
Moisture migration through both the liquid and vapor phases acts to smooth spatial variations in water content, but only the vapor phase transport leads directly to evaporative cooling (see Equation (11)); enhanced liquid transport tends to diminish gradients in water content and relative humidity, thereby reducing vapor phase transport and lowering the amount of evaporative cooling. Vapor transport depends inversely upon the vapor diffusion resistance factor μ (Figure 3b), and liquid transport depends directly upon the liquid transport coefficient D (Figure 3c). Because of the increases in μ and D with φ, under relatively dry conditions, liquid transport is insignificant in comparison with vapor transport for most textures; consequently, evaporative cooling tends to correlate with moisture storage S. Over the entire range with , Figure 3c indicates that D remains highest for the clay, followed by sandy clay, silty clay, and sandy clay loam; further examination of the liquid–vapor transport ratio defined by Equation (3) indicates that Γ exceeds or is close to unity for these four textures, even with , whereas Γ∼10−5 or lower at 80% relative humidity for each of the other soils. In the textures with higher Γ, transport through the liquid remains sufficiently vigorous to reduce gradients in water content, and by extension vapor pressure, enough that evaporative cooling is relatively low despite high values of S (i.e., large changes in W with φ). The relative vigor of evaporative cooling exhibited for the different textures in Figure 6a reflects these physical balances, while the net sensible gain shown in Figure 6b is further modified by the enhanced thermal conduction associated with the high water contents of more clay-rich textures.
3.2. Adobe
Adobe structures are typically made from local soils that are moistened into mud, pressed into forms, and dried in the sun [20,69]. The resulting bricks are set into mud mortars, creating walls that are often covered with mud plasters to reduce erosion and facilitate repairs; both mortars and plasters typically originate from the same soils as the bricks themselves [20,70]. One of the earliest known earth building materials, adobe construction is found in numerous forms throughout warm arid and semi-arid parts of Asia, the Middle East, Africa, Australia, and Central, South, and North America, reviewed extensively in [9,20,71]. The primary textural requirement of adobe soils is the presence of sufficient clay to bind larger silt and sand particles, but high-clay muds tend to crack upon drying; the optimal clay content is estimated to fall in the range of 15%–25%, depending on the expandability of the clay in question [70,72]. Soils with excess clay are typically amended with sand, gravel, straw, rice husk, or other matter [72,73]. In climates that receive frequent or strong rainfall, roofs are typically thatched; in drier climates, roofs are made of additional adobe bricks corbeled into domes or supported on timber frames [20].
Adobe walls are traditionally quite thick (35–60 cm or more) [9,20,71], and investigations of adobe vernacular in Yemen, Iran, Egypt, Syria, China, and the Southwestern USA have consistently reported far cooler daytime temperatures and warmer nighttime temperatures than found outdoors, particularly in desert climates with wide diurnal temperature swings [24,26,71]. As noted above, this thermal stability is typically attributed to the thermal inertia of the massive earth material, but careful experimentation near Laredo, TX, USA has suggested that intrinsic evaporative cooling contributes significantly to the thermal comfort of adobe dwellings [31,32].
Contemporary interest in adobe construction is growing as architects and builders seek to lower the embodied energies, greenhouse gas emissions, and life-cycle costs of their projects, as well as to lower operational energies associated with heating and cooling [74,75,76]. Working within contemporary structural codes, thermally effective adobe projects have recently been completed in Phoenix, AZ, USA; San Fernando, Chile; Ojinaga, Chihuahua, Mexico; Shey, Ladakh, India; and even humid Mason’s Bend, AL, USA [19]. Indoor air quality concerns are promoting further interest in adobe, as well as other earth building types, as its hygroscopic nature allows it to buffer the relative humidity of indoor air within ranges considered favorable to respiratory health [69,75].
The widespread occurrence of adobe buildings in warm- and hot-summer climates across a range of moisture regimes raises the question of whether intrinsic evaporative cooling is equally effective in each of these climates. To address this question, a series of simulations in tropical, desert, steppe, humid subtropical, and marine climates (Table 3) were conducted using a single well-characterized adobe (also known as “raw-soil”) from Xi’an, Shaanxi, China [26,77] that most closely resembles the sandy loam soil above with respect to its hygroscopic properties. Simulated buildings possessed the geometry characteristic of adobe buildings in Shaanxi, with 20 cm thick walls, footprints of 4 m × 3 m (long axis east–west), wall heights of 2 m, and gabled clay-tile roofs. Only the adobe walls were allowed to be hygroscopically active, and precipitation values were removed from each weather file to ensure that ambient humidity was the only source of moisture.
3.2.1. Adobe Hygroscopic Properties
The water retention curve of the Shaanxi adobe is taken from Yan et al. [47], and Equation (8) is used to describe the vapor diffusion resistance factor (Figure 7b; see Table 2). The measured hygroscopic characteristics (Figure 7a) are comparable with the sandy loam described above, suggesting that the liquid transport network may also be similar. Using Equation (9) to approximate for this texture (65% sand, 10% clay), the liquid–vapor transport ratio from Equation (3) is always less than Γ∼10−17 for the water contents W measured in this particular adobe with . This implies that liquid transport should have a negligible influence on intrinsic hygroscopic behavior; for simulation purposes, we base on predictions for sandy loam.
3.2.2. Intrinsic Evaporative Cooling by Adobe: Effects of Climate
Simulation results predicted a pronounced effect of climate on intrinsic evaporative cooling performance, with evident interactions among ambient temperature, relative humidity, and solar radiation intensity controlling the extent of latent heat flux at adobe surfaces. All values represent daily averages for the month of July—typically the warmest month in each climate—and latent heat flux values combine results obtained from Equation (12) for moisture changes within north, south, east, and west-facing vertical walls. As a result, solar radiation intensities were lower on adobe surfaces than on previously discussed soil roofs, yielding somewhat lower latent heat fluxes.
Intrinsic evaporative cooling in the tropical monsoon climate of Trivandrum, Kerala, India (Table 3) was surprisingly high, with evaporative heat flux from vertical walls averaging 38 Wh/m2 per day in July despite high ambient humidity, significant cloud cover, and only moderate solar radiation intensity (Figure 8a, Table 4). The explanation for this can be traced to the consistently high ambient relative humidity (∼75%–95%), which maintained the adobe walls at a relatively high moisture content (approx. 32 kg/m3, averaged over the wall thickness). In this region of the adobe moisture retention curve (Figure 7a, [47]), small changes in relative humidity correspond to comparatively large changes in moisture content (i.e., S is large), resulting in large latent heat fluxes.
The daily latent heat flux pattern in Kerala, with morning and afternoon peaks separated by a mid-day valley, highlights the importance of surface orientation and solar radiation intensity independent of air temperature and relative humidity (Figure 8a). Although global horizontal and direct normal radiation are typically greatest near solar noon, sun angles are also highest at mid-day, causing beam solar radiation to encounter vertical surfaces at steep angles and diminishing its intensity on walls at noon relative to morning and evening hours when sun angles are lower. The reflection of this solar intensity pattern in latent heat flux patterns, which also appeared in Laredo, Yuma, Izmir, and Kunming, support the previous indication (Section 3.1.2, Figure 4) that the orientation of a material intended for intrinsic evaporative cooling strongly influences the timing of its cooling performance.
In Kerala, the morning peak exceeded that of the afternoon because the factors driving evaporation (i.e., high adobe moisture content, diminishing relative humidity, and increasing air temperature, combined with low-altitude beam solar radiation striking the eastern wall) were greatest at that time; in the other climates, however, morning and afternoon peaks were either comparable or the afternoon peak was greater, coinciding with the lowest ambient relative humidity of the day (Figure 8a).
The semi-arid steppe climate of Laredo, TX, USA promoted the greatest intrinsic evaporative cooling among the climates investigated, with daily evaporative heat fluxes averaging 53.3 Wh/m2 in July (Figure 8b, Table 4). This result was expected, because Laredo experiences broad diurnal variations in relative humidity, with summer nighttime values exceeding 80% and daytime values dropping below 40%. This range maintained adobe moisture near 28 kg/m3. Daily temperature variations of ∼10 °C then drove a daily variation in adobe moisture content (averaged over the wall thickness) exceeding 0.4 kg/m3 in July—about 40% more than observed in Kerala, and the greatest among the six climates. Despite the high nighttime humidity, Laredo’s summer climate is quite clear (Table 4), and the combination of high solar intensity, high air temperature, and appreciable residual moisture in the adobe walls even after several morning hours of evaporation created a strong afternoon peak in latent heat flux (Figure 8b).
The hot desert climate of Yuma, AZ, USA provided a second surprising result (Figure 8c). With extremely low summer relative humidity values (≈25%–50%), little hygroscopic activity was anticipated, but this humidity kept adobe moisture contents near 21 kg/m3—another highly humidity-sensitive region of the adobe moisture retention curve (Figure 7a). In this moisture range, high air temperatures and intense solar radiation were able to drive average daily evaporative heat fluxes of approximately 32 Wh/m2 (Table 4), corresponding to diurnal moisture variations of nearly 0.3 kg/m3. The afternoon heat and dryness were also consistent with the afternoon occurrence of the evaporative cooling peak.
Izmir, Turkey, with a Mediterranean climate of hot, dry, clear summer days, intense solar radiation, and moderate relative humidity (Figure 8d, Table 4), was expected to promote intrinsic evaporative cooling on par with Laredo, but in fact it performed only about half as well, with average daily evaporative heat fluxes near 29 Wh/m2. Although Izmir’s daily July temperature and humidity variations are pronounced, the lower air temperatures and lower range of nighttime relative humidities (≈35%–60%), despite comparable solar radiation intensity, maintained the adobe walls within a moisture range (26–26.3 kg/m3) much less sensitive to changes in φ (Figure 7a), limiting moisture variations to only about 0.24 kg/m3.
The humid subtropical climate of Xi’an, Shaanxi, China was of particular interest as the native climate of the reference adobe (Figure 8e). Although Xi’an is substantially more humid than Izmir, with significant cloud cover and much lower solar radiation intensity, intrinsic evaporative cooling activity equaled that of the sunnier Turkish city, with an average July daily value of 29.5 Wh/m2. In Xi’an, the daily variation in relative humidity (≈55%–85%) and cooler temperatures maintained a somewhat higher average adobe moisture content than that found in Izmir (29.5 kg/m3), but remained in a region of hygroscopic behavior where small changes in relative humidity result in relatively small evaporative heat fluxes. With only slightly less daily variation in relative humidity, the Xi’an adobe walls varied in daily moisture by nearly the same quantity as in Izmir (0.22 kg/m3). The comparable intrinsic evaporative cooling performance of an identical adobe in these two extremely different climates is remarkable, illustrating the sensitivity of this process not only to absolute values of air temperature, solar radiation, and relative humidity, but to patterns of daily variation and to the specific regions of material hygroscopic behavior occupied.
The highland subtropical (Cwb) climate of Kunming, Yunnan, China is a cooler, cloudier, more humid variant of the dry-winter subtropical (Cwa) climate represented by Xi’an (Figure 8f; Table 4). As expected, this coolness and cloudiness suppressed intrinsic evaporative cooling behavior, and daily evaporative heat fluxes averaged only 24.5 Wh/m2, even though walls were maintained in a favorable range (30–31 kg/m3) from the perspective of the moisture retention curve (Figure 7a). Kunming’s daily relative humidity patterns were similar to those of Kerala, but air temperatures and solar radiation were substantially lower (Table 4), showing that even in a favorable region of a material’s moisture retention curve, sufficient energy is nevertheless required to drive evaporation.
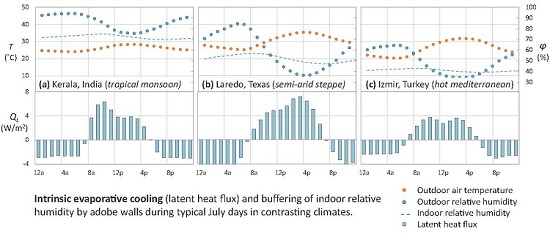
Throughout these investigations, indoor relative humidity levels were maintained at lower and more constant levels than those observed outdoors (Figure 8), consistent with numerous independent reports [50]. Although these values depend strongly on outdoor air exchange rates and indoor latent heat sources, they suggest that intrinsic evaporative cooling and indoor air quality design may both benefit from judicious use of unsealed surfaces in earth wall construction.
Together, these results show that the primary influence of the climate on intrinsic evaporative cooling lies in its interaction with a material’s hygroscopic properties to establish the moisture range within which the material fluctuates. If the material is able to sorb and release water vapor readily as relative humidity changes (i.e., if is large and μ is not too great), then daily variations in relative humidity can support active cycles of condensation and evaporation, especially if incident solar radiation is intense. This factor was shown to be particularly important in driving evaporation, consistent with its direct influence on wall surface temperatures and vapor pressures, causing surface orientation to emerge as another important consideration in humidity-based evaporative cooling.
3.3. Cob
Cob is a hand-formed, fiber-reinforced earth material most frequently found in the mild oceanic climates (Köppen Cfb) of southwestern Britain, particularly Devon, and northwestern France, including Brittany [20,71,78]. Because of the high rainfall and soil moisture in these climates, cob is traditionally assembled onto stone foundation walls and protected with overhanging thatch roofs. Although cob is considered a “vernacular” building material, cob homes and churches were built up until the mid-nineteenth century, and thousands of them are still inhabited in the region [20,78].
Diverse soils have been used in cob and related construction (puddled clay, shuttered earth), often requiring textural amendment to minimize cracking: where local clay content is high, practices advise addition of chalk or “road grit”, and in all cases, substantial pulverized straw or other plant fibers are included. In the pre-industrial “slow” cob construction process, parent soils were excavated in the autumn and fragmented by freeze–thaw cycles through the winter. In spring, soils were spread out into a large thick layer, well-moistened, covered with straw, and trodden by donkeys or cattle to shred the fibers and create a uniform mixture. During construction, people worked in pairs: one gathered the cob into rounded lumps and tossed each up to their partner on the wall, who caught it with a pitchfork, dropped it onto the wall, and pressed it into place with his feet before catching the next lump. When a course was complete, it was allowed to dry until it could support construction of the next course; after an entire building was complete, it was typically allowed to dry for many further months before earth plastering occurred [78,79]. In contemporary form, cob tends to incorporate small amounts of cement, to be mixed mechanically, and to be pre-formed into blocks, but its composition is otherwise consistent with traditional cob [48,79].
Interest in cob construction, particularly in its traditional regions, is growing due to environmental concerns: its local availability and minimal processing requirements result in low embodied energies, greenhouse gas emissions, and life-cycle costs, and its thermal performance is highly regarded [80,81]. Indeed, cob’s thermal performance has given rise to an intriguing debate about UK building regulations, which specify minimum assembly U-values under steady-state conditions. Demonstrating that massive cob and other walls with higher U-values can nevertheless provide excellent thermal stability by delaying heat gains and losses, researchers in Devon, UK have advanced a persuasive argument that the U-value requirement should be revised or abandoned for earth buildings in favor of time-dependent evaluation methods [81].
Traditional cob walls are often thick, for both mechanical and thermal performance, with reported values ranging from 20 cm to over 300 cm [48,79]; however, interest is growing in thinner versions for contemporary construction [82]. Cob is also known to be hygroscopic, and its ability to maintain stable indoor relative humidity values is well-documented [49].
The observation that cob buildings tend to remain cool in summer, combined with cob’s known hygroscopic nature, suggest that intrinsic evaporative cooling may contribute to cooling performance. The range of cob thicknesses of current interest, in turn, and the emphasis in published discussions of cob wall performance on thermal mass effects (i.e., conductive heat transfer across the material) raise the question of relative contributions of latent vs. sensible effects and their variation with wall thickness. To investigate these questions, walls of varying thicknesses (5–50 cm) were incorporated into a contemporary multi-family cob building, using a contemporary cob material [48], for simulation under the summer climate conditions of Nantes, FR (Table 3, Figure 9).
3.3.1. Cob Hygroscopic Properties
Moisture retention data reported by Collet et al. [49] were used to obtain (Figure 7a) for a cob from the Rennes basin in Brittany, France that incorporates straw and 3% added cement; Equation (8) was used to calculate the vapor diffusion resistance factor (Figure 7b; Table 2). Based on the close similarities between their curves and reported specific surface areas, the liquid transport network might be expected to share similar characteristics to the loam model soil described above. With the moisture content kg/m3 reported for (Figure 7a), the hydraulic conductivity estimated from Equation (9) for loam (with 42% sand and 18% clay) implies that at this and lower relative humidities relevant for intrinsic evaporative cooling. This suggests that the effects of liquid transport are negligible; is assigned by interpolation from the properties for the loam model soil described above.
3.3.2. Intrinsic Evaporative Cooling by Cob: Effect of Thickness
In the following discussion, “surface sensible heat flux” represents heat transfer between the outermost node and the next node (Section 2.4) at each time step, based on their temperature differences and moisture-dependent thermal conductivities, following Equation (10). “Surface latent heat flux”, in turn, quantifies heat transfer associated with evaporation or condensation based on the relative humidities and saturation vapor pressures in the pore spaces of the same surface nodes, following Equation (11). As defined here, therefore, evaporation from a surface removes energy that the material has already absorbed. For each entire wall, the “intrinsic evaporative cooling effect” represents the sum of daily evaporation from each wall, including both exterior and interior surfaces, while the “thermal mass cooling effect” represents the difference between daily exterior heat gain and heat delivery to the interior surface.
As observed with Mexican roof soils and adobe, latent heat fluxes opposed sensible fluxes at the exterior surfaces at all hours, with mid-day solar radiation and warmer, drier air promoting evaporation, and nighttime cooler air and higher relative humidity promoting condensation. The magnitudes of exterior surface sensible gains were comparable for all thicknesses tested (5–50 cm at 5 cm intervals), at approximately 490 Wh/m2 per day, reflecting the constancy of material hygrothermal properties. Results from three thicknesses are shown in Figure 10. Exterior surface evaporation was significant but diminished somewhat with thickness, from approx. 85 Wh/m2 for the 5 cm wall to 60 Wh/m2 for the 50 cm wall.
At interior surfaces, however, the effects of wall thickness were more pronounced. The thinnest wall (5 cm) conducted about 50% of the residual sensible gains (i.e., those not removed by evaporation at the outer surface) to the interior over the course of an average day, or about 200 Wh/m2, but also showed appreciable evaporation at the inner surface (approx. 25 Wh/m2). As a result, intrinsic evaporative cooling offset daily sensible gains by a striking 21%, effectively providing slightly over 100 Wh/m2 of cooling to the wall as a whole, while thermal mass provided effective cooling of 200 Wh/m2 (offsetting sensible gains by about 40%) by preventing externally absorbed heat from reaching the interior (Figure 10).
In the thicker walls, the intrinsic evaporative cooling contribution diminished somewhat, while the influence of thermal mass increased. In the 10 cm wall, sensible gains of approx. 500 Wh/m2 were reduced by about 70 Wh/m2 by evaporative cooling at the exterior, and only 33% of the residual gains were conducted to the interior over the course of a day; the inner surface showed only about 14 Wh/m2 of evaporation. In total, intrinsic evaporative cooling offset daily sensible gains by 15%, while thermal mass effects offset them by about 58%. The 50 cm wall furthered this trend, with intrinsic evaporative and thermal mass cooling effects offsetting approx. 12 and 75% of daily sensible gains, respectively.
The thermal effects of evaporation and condensation within the interior of the wall are shown by the central blue bars in each panel of Figure 10 (obtained as the difference between from Equation (12) and the interior and exterior surface fluxes from Equation (11)). Immediately following sunrise, evaporation from the exterior wall surface begins, but the interior pores are still cool, and condensation results in a small amount of heating that peaks in midmorning at about 3–5 W/m2. By early afternoon, the exterior warmth has propagated inwards sufficiently to produce net evaporation at interior nodes. The patterns and magnitudes of interior evaporation and condensation in the different wall thicknesses are similar because these phase changes are concentrated close to the exterior surface, where conditions are not strongly dependent on wall thickness. Nevertheless, it is worth emphasizing that the magnitudes of interior latent fluxes are much smaller than at the exterior surface, providing justification for use of the latter to gauge intrinsic evaporative performance.
The average July exterior air conditions of Nantes, France (Figure 9) maintained the 5 cm, 10 cm, and 50 cm walls at moisture contents of 14.5–18 kg/m3—a region of the moisture retention curve in which small changes in ambient humidity result in comparatively large changes in moisture content (Figure 7). Consistent with the above observations, the thinnest (5 cm) wall experienced the greatest daily changes in moisture content of over 3 kg/m3 per day (or 0.15 kg per m2 of wall area per day) in part because it also experienced the greatest daily changes in temperature. The 10 cm wall showed less than half of that variability, at 1.25 kg/m3 per day (0.125 kg/m2 of wall area), while the 50 cm wall showed daily changes of only about 0.2 kg/m3 (0.10 kg/m2 of wall area).
The message for design is straightforward: thinner materials facilitate intrinsic evaporative cooling at the expense of delays in conductive heat transfer, while thicker materials prioritize thermal mass effects over latent fluxes. Since buildings are required to maintain comfortable conditions throughout the year in their native climates, however, and since sizeable thermal mass can create problematic thermal inertia in cool and cold winter climates [83], an optimum thickness that capitalizes on both latent and conductive summer cooling effects may well exist for any given material in any given climate.
3.4. Unfired Earth Bricks
Bricks have been manufactured from clay-rich soils for thousands of years. This has led to the development of a variety of techniques that enable the rapid production of large quantities of homogeneous bricks in sizes and shapes that are convenient for construction [50]. Typically, a parent soil with clay content ranging from 15% to 60% [50,84,85] is ground or crushed and mixed with water to reach its plastic limit, prior to being pushed through a machined die under vacuum; this produces a column that is subsequently cut into single bricks of the desired dimensions [50,85]. After drying for two or more days, most bricks manufactured today are fired in a kiln to achieve their final, hardened form. However, the firing process is extremely energy-intensive, increasing production CO2 emissions by seven-fold over those of unfired bricks [86]. Consequently, contemporary concerns over the environmental footprint of construction materials has led to renewed interest in unfired earth bricks, particularly in western Europe.
Recognizing that much knowledge of traditional manufacturing techniques has been lost, several recent empirical studies have focused upon characterizing unfired earth bricks and promoting their use in contemporary buildings [50,84,85,86,87]. In addition to their low embodied energy, as with many other geological building materials, the potential for the hygroscopic properties of earth bricks to help control interior relative humidity has also been championed as a key material advantage [86]. This demonstrated hygroscopic behavior raises the question of whether they might also offer insight into intrinsic evaporative cooling. Since the importance of the moisture retention curve has become clear, and since the textures of parent soils used to manufacture unfired earth bricks have an appreciable range, we here investigate the effects of varying this parameter on intrinsic evaporative cooling. Simulations below employed the geometry of a small cottage (4 m × 3 m footprint, oriented south, with 20 cm thick walls 2.5 m in height and a non-hygroscopically active tile roof) in Clermont-Ferrand, France (Köppen Cfb; Figure 9), near several brickworks that manufacture unfired earth bricks commercially [50].
3.4.1. Earth Brick Hygroscopic Properties
The directional extrusion process during brick manufacture can produce an alignment of clay platelets, leading to anisotropic properties. For example, vapor diffusion resistance factors have been reported to be nearly twice as high, and thermal conductivities nearly twice as low, in the direction parallel to platelet axes as perpendicular [85]. We neglect such complications in the current work and treat all material properties as isotropic (Table 2), noting that anisotropy might be used to advantage in advanced design strategies. Our nominal moisture retention curve for earth bricks (Figure 7a) is based on measurements by Cagnon et al. [50] for their “Brick 1”, which was formed from a clay loam soil, sourced to a brickworks near Toulouse, France. Equation (8) is used to define (Figure 7b) for a porosity of 22%, estimated from the reported density kg/m3. The estimated liquid–vapor transport ratio for the range of water contents measured in this brick is very small (i.e., ) for materials with a liquid transport network similar to the parent clay loam soil; this implies that liquid transport is unimportant.
To reveal the importance of the moisture retention curve, independent of other properties, to a material’s intrinsic evaporative cooling behavior, the moisture retention curves were varied in two ways: first, the original slope was increased by increasing intervals (Figure 11a), and second, the original curve was offset by increasing intervals (Figure 11b). For each of the other properties (i.e., μ, D, k), no change in their dependence on relative humidity was imposed during these sensitivity tests.
3.4.2. Intrinsic Evaporative Cooling by Earth Bricks: Effect of Varying the Moisture Retention Curve
Increasing the slope of the moisture retention curve dramatically increased the diurnal latent heat flux of the unfired brick walls, simulated under mid-summer conditions of Clermont-Ferrand, France (Figure 12). This is a consequence of the increased change in moisture content for a given change in relative humidity that was defined in Section 2.2 as the moisture storage . The changes in evaporative cooling performance for Mexican green roofs constructed using different soil textures (Section 3.1.2) was also seen to correlate with S, but the simultaneous variation of other properties (i.e., D, k, μ) partially obscured mechanistic interpretations. Here, holding all else constant and only changing the slope of the moisture retention curve reveals that the sensitivity of a material’s moisture content to relative humidity is a strong predictor of its evaporative cooling behavior (Figure 12a).
Comparable changes to the average wall moisture content can be obtained by leaving the slope of the moisture retention curve unchanged, but simply offsetting the curve by a fixed constant (i.e., compare M in Figure 12b and Figure 13b). However, merely offsetting the moisture retention curves does not affect the sensitivity of water content to changes in relative humidity. As a consequence, the latent heat fluxes, and therefore evaporative cooling behaviors, are not affected by changes in offset that span several orders of magnitude (Figure 13a).
Together, the pronounced sensitivity of intrinsic evaporative cooling to the slope of the moisture retention curve and the lack of response to fixed offsets provide insight into the consequences of changes in moisture retention behavior. As noted in Section 2.3.1, recent progress in characterizing the moisture contents of hygroscopic materials at low relative humidities has emphasized the importance of surface adsorption. The dominant intermolecular forces that control adsorption can change in nature and functional dependence as the liquid films vary in thickness, even when the surface composition is kept constant [35,39,60]. Combined with the effects of spatial variations in surface properties within a single building element, this can lead to complicated changes in moisture content with relative humidity. The results shown here support interpretations in Section 3.2.2 for the cause of variations in adobe performance, where different climates placed the building walls at different average relative humidities, and hence at different ranges on the moisture retention curve. Evaporative cooling performance is enhanced where the slope of the moisture retention curve is high; on its own, the average wall moisture content itself does not exert a strong control.
3.5. Rammed Earth
Among the earth building materials, rammed earth is currently experiencing the greatest revival in both architectural and scientific interest [19,51]. It is also one of the most ancient and widespread, having arisen in numerous arid, semi-arid, and other wood-scarce climates independently and as early as the first century [20,71]. Now, however, its low environmental impact, compressive strength, structural reinforceability, and visual warmth and beauty have inspired numerous contemporary projects, including several in non-traditional climates [19].
Rammed earth differs from adobe, cob, and earth bricks in that it is formed in thin layers, usually shaped in place by formwork. In this regard, it resembles poured-in-place concrete, and indeed the formwork and resulting impressions of the forms on the final product are similar. As in adobe and cob, however, soil composition is critical to the wall’s final strength and durability, and traditional builders chose and mixed local soils to achieve a near-ideal composition: 15%–18% clay, with the remainder divided evenly among silt, sand, and coarser particles, amended with plant fibers, water, lime, etc. as necessary [19,69,71].
To minimize “rising damp”, both traditional and contemporary walls are typically built on a stone foundation, onto which a pair of workers first installs the parallel faces of the formwork; these are usually made of wood and are sometimes oiled for easy release. Several practices begin with L-shaped formwork at the corners to avoid joints in those vulnerable positions. In a manner reminiscent of cob building, one partner delivers a moist soil mixture to the other, the “tamper”, who stands inside the formwork and compresses the mixture to approximately half of its original volume with a manual or, more recently, a pneumatic tamper. After a section has been completed, the formwork is removed, small pits and holes are filled with additional earth pounded in with a mallet, and work proceeds on the next adjacent section. Window and door openings are shaped with additional wood forms as they are reached, and in areas with earthquake codes, rebar is cast into the foundation, projecting upward, and earth is rammed around it. A full course is usually allowed to dry somewhat before a second course is built on top of it, offsetting vertical joints, and in this manner the wall is completed [19,69,71].
Rammed earth walls are typically quite thick: not only is it easier for a tamper to maneuver inside wide formwork, but thicker walls bear greater loads, allowing even traditional rammed earth buildings to reach greater heights than their adobe or cob counterparts [71]. In addition, massive walls provide significant thermal inertia, and their abilities to maintain cool interiors in hot summer climates has been well-documented [53,88,89].
Rammed earth walls, like all earth materials, are able to take up both vapor and liquid water. While the former property is viewed as desirable, allowing walls to buffer indoor humidity [51], the latter is viewed with great concern, particularly in rainy climates, because of its potential to promote wall deterioration [90]. These concerns have led to the development of “stabilized rammed earth”, or SRE, which incorporates 5%–9% Portland cement to diminish capillary suction while maintaining vapor diffusion properties [91].
Despite significant interest in rammed earth hygroscopicity, and the development of excellent models to simulate combined heat and moisture transport in this material [51,52,92], intrinsic evaporative cooling has not yet been examined. In addition, the interest in the modification of rammed earth’s liquid transport properties through additives raises the question of whether this factor might itself affect intrinsic evaporative cooling to the extent that it may be varied independently. To address these questions, here we investigate the effect of varying the liquid transport coefficient D on the intrinsic evaporative cooling performance of rammed earth walls of uniform (20 cm) thickness, incorporated into a south-facing, tile-roofed cottage of 4 m × 3 m, within a rainy climate (Birmingham, UK; Figure 9) in which significant rammed earth research is now underway.
3.5.1. Rammed Earth Hygroscopic Properties
The data reported in ([51], Figure 4) are used to obtain (Figure 14a). Over most of the moisture range, we calculate μ using Equation (8), imposing a maximum of at high W based on the value reported in [51] (Figure 14b).The liquid transport coefficient is assigned based upon a reported exponential dependence on W that is scaled using an adsorption coefficient determined for a range of similar stabilized rammed earths [53]. Since the adsorption coefficient was not reported for the particular rammed earth specimen upon which our curve was based, is assumed to be similar to that for the other samples examined by Hall and Allinson [53]. In the calculations described below, we define a nominal “Maximum” curve for that corresponds with the values measured by Hall and Allinson [53] on their sample with the highest . To explore the influence of uncertainties in moisture transport, we compare changes in the hygroscopic response, as D is reduced by a series of scaling factors, as shown in Figure 15.
3.5.2. Intrinsic Evaporative Cooling by Rammed Earth: Effects of Liquid Transport Properties
Simulation of rammed earth walls under Birmingham UK warm humid summer conditions (Figure 9c) showed simply that liquid transport plays a minor role in the magnitude and pattern of intrinsic evaporative cooling. While the imposed changes to D did affect total wall moisture content slightly (Figure 16b), extremely slight effects were observed in total latent heat flux (Figure 16a). Contrasting simulation in the hot desert climate of Yuma, Arizona confirmed these results (not shown).
Examining the changes shown in Figure 16a) for the predicted latent heat flux more closely, the largest incremental change takes place between calculations performed with the Maximum D and the Maximum scaled by a factor of . A more subtle observation is that the difference in behavior during early morning condensation (i.e., when ) is larger than the difference in behavior during the midday evaporative peak. The reason for this can be traced to the liquid–vapor transport ratio Γ defined by Equation (3) that gauges the relative importance of liquid and vapor phase transport. Both the liquid transport coefficient (Figure 15) and the vapor diffusion resistance factor (Figure 14b) increase with relative humidity, and this causes Γ to become larger. The implication is that in the early-morning hours as the relative humidity peaks, the importance of liquid transport in comparison to vapor transport is at its highest. For the temperatures encountered during the modeled Brimingham UK summer day ( Figure 9c) with the Maximum D curve, Γ can reach values as high as 10 in the early morning when the relative humidity approaches 90%, whereas Γ drops by two orders of magnitude to 0.1 with a reduction to during the midday temperature high. As condensation takes place at the exterior surface, liquid transport transmits some moisture to the wall interior, enabling a slight increase in the rate of condensation during early morning hours. Under the drier midday conditions that drive evaporative cooling, liquid transport is less effective, so the dependence on D is less pronounced.
Scaling the liquid transport coefficients alters Γ by the scaling factor, producing reductions by factors of 100.5, 10, 100, etc. for the different cases examined in Figure 16. The near coincidence of the curves for smaller liquid transport coefficients with is consistent with expectations, since liquid transport is unimportant.
3.6. Stone
Our investigation of building stones was inspired by the Trullo houses of Apulia, in southeastern Italy, traditionally built of dry-stacked local limestone. In efforts to clear their fields of these “stones of Fasano”, farmers endeavored to use as much material as possible, and exterior walls frequently reached 1–3 m in thickness. Wood scarcity demanded that roofs be constructed of stone as well, giving rise to a corbelling technique in which individual slabs spiraled inward from wall tops, forming characteristic domes. Since rooms were often square rather than round, and since multiple rooms often adjoined, roof engineering became a specialized craft. Roofs too were traditionally dry-stacked, a practice traced to a seventeenth-century Duke who encouraged his people to dismantle their roofs before tax inspectors visited and to reassemble them afterward so the structures would not be counted as buildings for tax purposes. Sturdily built nonetheless, medieval trulli have endured across the region, and in the town of Alberobello, hundreds of them are still inhabited [20,93,94,95].
Southern Italy is a subtropical region with hot humid summers (Köppen Cfa, Figure 9), yet cool, stable temperatures within the trulli have been well-documented. This performance has been understandably attributed to the thermal inertia provided by the massive walls in both direct measurement and in modeling studies [21,96]. The Apulian limestones exhibit pronounced hygroscopic behavior as well, however [55], and the trulli have been found to buffer indoor relative humidity quite effectively [96]. Additionally, the hygroscopic nature of building stones is gaining general appreciation as architects seek local, thermally effective, recyclable, and low-greenhouse-gas-emitting materials [97,98], and as preservationists strive to protect and restore historic buildings [56,99].
Despite the massive walls of the trulli, therefore, investigation of intrinsic evaporative cooling in these structures is supported by several considerations: the skyward tilt of a hygroscopic material in a hot-humid climate; the comparative thinness of the roof construction; and the general renewed interest in the hygroscopic behavior of building stones. At this point, we have examined the relative influences of texture, climate, and solar orientation, material thickness, moisture retention properties, and liquid transport coefficients on intrinsic evaporative cooling, in materials for which those variations are relevant to designers. We now turn to the influence of the vapor diffusion resistance factor μ (VDRF) in stones, given the substantial differences in this parameter found among building stones [100] and the limited applicability of the sediment-based Moldrup et al. [46] Equation (8). We use the Apulian fine-textured limestone and geometry of a traditional single-room Trullo house [94] as our base case, simulated under the climate of Gioia del Colle, Italy (Table 3, Figure 9).
3.6.1. Apulian Limestone Hygroscopic Properties
The Apulian limestones are composed almost entirely of carbonate that is assembled in a self-supporting network of shell fragments—many of which contain internal micropores—from former marine organisms [54,55]. For the relatively low water contents encountered during intrinsic evaporative cooling, the wetting properties of pore surfaces exert the dominant control on . Accordingly, limestone moisture retention curves were based upon measured values for a similar limestone from the Loire valley [56] (Figure 7). To account for differences in pore geometry, pore size distributions reported by Beck et al. [56] were used to estimate specific surface areas and to infer the dependences of film thickness on relative humidity for each of the three Apulian limestones. Following the same procedure, specific surface areas were estimated, assuming the same film thickness dependence to calculate W (Figure 14a).
Andriani and Walsh [55] report saturated hydraulic conductivities of 7 × 10⁻⁵ m/s, 5 × 10⁻⁵ m/s, and 2 × 10⁻⁴ m/s for the fine, medium, and coarse-textured Apulian limestones, respectively. To estimate for use in calculating , the Van Genuchten [101] water retention model was fit to the curve for each of the three limestones, thereby constraining the exponents m in a hydraulic conductivity model that follows
where m = 0.378, 0.405, and 0.414 for the fine, medium, and coarse textures, respectively. A comparison of the relative importance of liquid and vapor transport using the liquid–vapor transport ratio defined by Equation (3) suggests that when , so that has a negligible effect on simulation results.
To obtain nominal values for the vapor diffusion resistance factor μ (Figure 14b), we again followed Moldrup et al. [46] in using Equation (8). However, recognizing that the limestone microporous structure may lead to a functional dependence that is different from the remolded soils examined to derive this relationship, we also conducted sensitivity tests in which μ was adjusted by different scaling factors, as shown in Figure 17. Noting the similarities between constitutive parameters for the three limestone textures (Figure 14), only results obtained for the fine-textured case are shown below.
3.6.2. Intrinsic Evaporative Cooling by Apulian Limestone: Effect of Vapor Diffusion Resistance
Given the reliance of condensation and evaporation on the movement of water vapor, the importance of the vapor diffusion resistance factor to evaporative cooling may appear self-evident. To quantify its importance in the context of limestone, with a fairly low original value, μ was varied several-fold (Figure 17) for simulations in the Apulian climate of Gioia del Colle. Results showed that evaporation and condensation and the associated latent heat flux patterns (Figure 18a) were significantly affected by changes in μ. Lower (higher) vapor diffusion resistance leads to larger (smaller) amplitude changes, reflecting the effects of enhanced vapor transport. Although the average wall moisture content ratio M was not much affected by changing μ (Figure 18b), the amplitude of variations in M throughout the day was enhanced in the calculations that used lower values of μ.
The evolving magnitudes of changes to the latent heat flux shown in Figure 18a are not linearly related to the imposed changes in μ. To further illuminate the mechanisms involved, a comparison of the rates of vapor diffusion and thermal conduction is helpful. As is easily verified in a scaling analysis that balances the left side of Equation (11) with the first term on the right, conduction causes changes in temperature to propagate a distance in time . Since for the limestone under consideration, liquid transport is negligible, and a balance between the left side of Equation (10) and the second term on the right indicates that changes in relative humidity propagate by vapor diffusion a distance in time . For the limestone model parameters and Apulian climate (Figure 9d) considered here, ranges from 10 at low φ (early morning) to 103 at high φ (midday), when the nominal vapor diffusion resistance function is used. Hence, conduction is expected to change the temperature in the wall interior much more rapidly than vapor diffusion can transmit moisture. This enables changes to the vapor diffusion resistance factor to affect the total moisture transport into the wall interior during daily temperature changes, giving rise to the observed differences between the latent heat flux curves in Figure 18a.
4. Conclusions
Water vapor is a free, renewable, and widely available resource, even in arid and semi-arid climates (Figure 8 and Figure 9). Earth building materials, in turn, are broadly hygroscopic, sorbing and releasing moisture and transferring associated heat according to their physical properties and environments; they are also among the lowest available in environmental impact. In a world facing increasing pressure from climate change both to reduce fossil fuel consumption and to provide effective cooling for a growing and economically-developing population, passive and renewable strategies are needed urgently.
In the above investigation of diverse earth buildings in diverse climates, we have shown that the intrinsic evaporative cooling behavior of earth materials can offset useful and predictable portions of sensible heat gain; here, we propose several specific design recommendations that emerge.
4.1. Choose Materials with Broad Particle Size Distributions
A broad and relatively even distribution of particle sizes, such as those found in loam and silty clay loam soils, best facilitates intrinsic evaporative cooling (Figure 6); since unfired earth materials tend to retain the hygroscopic properties of their parent soils, these results are expected to lend insight to the behavior of adobes, cobs, and other soil-derived materials. Loams, silty clay loams, and related soils include sufficient clay to provide high surface area for moisture sorption, as well as sufficient sand and silt to create pores and channels large enough to facilitate vapor diffusion, even at relatively high moisture contents. The influence of clay content is evident in a markedly sloped moisture retention curve, showing large changes in water content W with relative humidity φ (i.e., high moisture storage S; Figure 3a). Sand and silt, in turn, tend to reduce ambient water contents compared to more clay-rich textures (i.e., translating the entire moisture retention curve downward); they also reduce the vapor diffusion resistance factor μ (Figure 3b) and decrease the hydraulic conductivity, lowering the liquid transport coefficient D as well (Figure 3c). Together, these influences enhance latent heat flux by allowing most moisture transport to occur in the vapor phase (i.e., the liquid–vapor transport ratio ). In addition, the moisture dependence of thermal conductivity (Figure 3d) causes materials with lower moisture contents to experience lower net sensible gains (Figure 6b), giving siltier loams a further net cooling advantage.
These results were supported by systematic variations of moisture retention curves in unfired brick materials from Clermont-Ferrand, France, showing that increasing the slope of the moisture retention curve (i.e., ) greatly increased diurnal latent heat flux, while adjusting the original curve upward or downward without changing the slope altered the moisture content of the material but had negligible effects on latent fluxes (Figure 12 and Figure 13). The importance of the vapor diffusion resistance factor μ was further elucidated through investigation of Apulian limestone in Gioia del Colle, Italy, which displayed greater daily changes in moisture content and more intense evaporative cooling when μ was diminished (Figure 17 and Figure 18). The relative insensitivity of evaporative cooling to the liquid transport coefficient D under the conditions investigated was emphasized in simulations of a rammed earth cottage in Birmingham, UK, which exhibited very little change in latent heat flux, even across vastly different values of D (Figure 15 and Figure 16).
4.2. Match Materials to the Climate of Interest
Although evaporative cooling is typically associated with arid climates, climatic humidity (or lack thereof) does not directly determine a building’s potential for intrinsic evaporative cooling. Instead, the climate’s importance lies in determining the moisture range through which a material will fluctuate through daily and seasonal patterns of relative humidity, solar radiation, and air temperature (Figure 8 and Figure 9), and their interactions with the material’s hygroscopic properties W and μ. If a climate maintains a material in a relatively steep region of its moisture retention curve (Figure 3a, Figure 7a, and Figure 14a), and if that moisture range is not so great that vapor diffusion is compromised (e.g., leading to values of μ that are too large, see Figure 3b, Figure 7b, and Figure 14b), small changes in relative humidity will result in large changes in moisture content, allowing the material to sorb more water vapor at night and, in turn, to evaporate more moisture the following day. The primary influence of the local climate is therefore to establish the region of the moisture retention curve (and vapor diffusion resistance curve) that a material occupies. As a result, intrinsic evaporative cooling can be effective in a broad range of climates, including the humid subtropics, provided the hygroscopic material is a good match for the climate.
4.3. Orient Surfaces to Cool During Desired Hours
In virtually all materials, building configurations, and climates investigated, the timing and amplitude of intrinsic evaporative cooling mirrored incident solar radiation on the evaporative surface. Outside air temperature and relative humidity influenced cooling magnitude as well, by governing the average moisture content of the material, but patterns of incident solar radiation drove patterns of evaporative cooling directly (Figure 8). The only exception to this was found in the hot desert climate of Yuma, Arizona, in which intense solar radiation depleted wall moisture by mid-day, lessening afternoon evaporation (Figure 8c). In general, therefore, the orientation of the evaporative surface controls the timing of the cooling effect: those facing east provide greatest cooling in the morning; those facing west, in the afternoon; and those tilted upward and facing south, near mid-day.
4.4. Dedicate Individual Elements to Either Evaporative or Conductive Cooling
Earth buildings are traditionally thick-walled for both structural and thermal reasons, but contemporary earth-building design has recently explored thinner alternatives. An element’s thickness affects its intrinsic evaporative cooling ability, most prominently by affecting its exterior wall temperature: as shown in the investigation of cob, a thicker wall can absorb a given quantity of energy while maintaining a comparatively cooler exterior temperature, diminishing one of the driving forces for evaporation. As a result, thinner elements promote greater intrinsic evaporative cooling, while thicker elements more effectively delay conduction of heat to interior surfaces (Figure 10). Such mass-based cooling effects are also fairly independent of incident solar radiation, suggesting a separation of the two strategies; for example, thinner tilted roof elements could be dedicated to intrinsic evaporative cooling, while thicker vertical elements provide thermal inertia.
4.5. Allow Indoor Buffering of Relative Humidity
In all investigations, earth materials routinely stabilized indoor relative humidity values below mean outdoor levels (Figure 8 and Figure 9), consistent with numerous independent reports [50]. This was expected, as the same hygroscopic properties that promote intrinsic evaporative cooling also enable earth materials to exchange moisture with indoor air, helping to maintain relative humidity within ranges too low to support microbial growth but sufficiently high to promote respiratory health. Given contemporary concerns about indoor air quality, and the ability of earth materials to buffer indoor humidity while cooling evaporatively, intrinsic evaporative cooling designs could profitably maintain a proportion of indoor surfaces unsealed by paint or vapor barriers.
4.6. Extend Theoretical and Experimental Efforts
The results above document the potential of intrinsic evaporative cooling, completely independent of rain, irrigation, or other liquid water supply, to counteract meaningful proportions of sensible heat gain in earth and stone buildings. This independence extends its applicability to water-stressed regions, many of which are expected to experience rapidly growing cooling needs in the near future, as well as to water-conserving buildings in any climate.
Based on well-established physical principles and reliable laboratory measurements cited throughout, the results presented here rigorously reflect the current understanding of coupled heat and moisture transfer in porous materials. At the same time, intrinsic evaporative cooling is a new and unexplored realm. Strategies for harnessing its potential would benefit from further efforts to constrain key input parameters (e.g., and μ) for many additional materials; to examine model predictions with field data; and to examine implications for whole-building life-cycle impacts and indoor air quality, involving interactions not only between climates and material properties but also among occupant activities, thermal comfort, and material production and delivery methods.
Current evidence is more than sufficient to support preliminary design, however. Now that this presumably ancient technique has been revealed by contemporary earth and building science, and basic guidelines have been established for contemporary designers, experimentation can begin to develop this new passive cooling strategy and to integrate it with its natural partners: low-embodied-energy building materials, thermal mass, and indoor humidity buffering.
Acknowledgments
The authors gratefully acknowledge the rigorous critique of their three anonymous reviewers; productive discussions with Ning Lu (Colorado School of Mines), Dani Or (ETH Zurich), and other participants in the 2016 workshop, “Quantifying the Role of Biophysical Process in Soil Structure Dynamics”; and the insightful design observations and suggestions of Christopher Letchford (Rensselaer Polytechnic Institute), Walter Grondzik (Ball State University), and John Reynolds (University of Oregon).
Author Contributions
Alexandra R. Rempel and Alan W. Rempel jointly conceived the study and assembled constitutive data. Alexandra R. Rempel conducted model simulations. Both authors interpreted simulation results and prepared the manuscript.
Conflicts of Interest
The authors declare no conflicts of interest.
References
- Davis, L.W.; Gertler, P.J. Contribution of air conditioning adoption to future energy use under global warming. Proc. Natl. Acad. Sci. USA 2015, 112, 5962–5967. [Google Scholar] [CrossRef] [PubMed]
- Isaac, M.; Van Vuuren, D.P. Modeling global residential sector energy demand for heating and air conditioning in the context of climate change. Energy Policy 2009, 37, 507–521. [Google Scholar] [CrossRef]
- Samuel, D.L.; Nagendra, S.S.; Maiya, M. Passive alternatives to mechanical air conditioning of building: A review. Build. Environ. 2013, 66, 54–64. [Google Scholar] [CrossRef]
- Santamouris, M.; Kolokotsa, D. Passive cooling dissipation techniques for buildings and other structures: The state of the art. Energy Build. 2013, 57, 74–94. [Google Scholar] [CrossRef]
- Reference Guide for Building Design and Construction v4; U.S. Green Building Council: Washington, DC, USA, 2013.
- Standard 55-2004, Thermal Environmental Conditions for Human Occupancy; ASHRAE American Society of Heating, Refrigerating, and Air-Conditioning Engineers: Atlanta, GA, USA, 2013.
- Weber, W.; Yannas, S. Lessons from Vernacular Architecture; Routledge: Abingdon-on-Thames, UK, 2013. [Google Scholar]
- Oliver, P. Encyclopedia of Vernacular Architecture of the World; Cambridge University Press: Cambridge, UK, 1997. [Google Scholar]
- May, J. Buildings Without Architects: A Global Guide to Everyday Architecture; Rizzoli: New York, NY, USA, 2010. [Google Scholar]
- Sadineni, S.B.; Madala, S.; Boehm, R.F. Passive building energy savings: A review of building envelope components. Renew. Sustain. Energy Rev. 2011, 15, 3617–3631. [Google Scholar] [CrossRef]
- Kang, D.; Strand, R.K. Modeling of simultaneous heat and mass transfer within passive down-draft evaporative cooling (PDEC) towers with spray in FLUENT. Energy Build. 2013, 62, 196–209. [Google Scholar] [CrossRef]
- Qiu, J.; Li, B.F.; Qiu, Y. Review of passive downdraught evaporative cooling technique and its application. Appl. Mech. Mater. 2013, 390, 691–695. [Google Scholar] [CrossRef]
- McDonald, R.I.; Weber, K.; Padowski, J.; Flörke, M.; Schneider, C.; Green, P.A.; Gleeson, T.; Eckman, S.; Lehner, B.; Balk, D.; et al. Water on an urban planet: Urbanization and the reach of urban water infrastructure. Glob. Environ. Chang. 2014, 27, 96–105. [Google Scholar] [CrossRef]
- Coutts, A.M.; Tapper, N.J.; Beringer, J.; Loughnan, M.; Demuzere, M. Watering our cities: The capacity for water sensitive urban design to support urban cooling and improve human thermal comfort in the Australian context. Prog. Phys. Geogr. 2012, 37, 2–28. [Google Scholar] [CrossRef]
- Kunzel, H.M. Simultaneous Heat and Moisture Transport in Building Components. Ph.D. Thesis, Fraunhofer Institute of Building Physics, Stuttgart, Germany, 1995. [Google Scholar]
- Künzel, H.M.; Kiessl, K. Calculation of heat and moisture transfer in exposed building components. Int. J. Heat Mass Transf. 1996, 40, 159–167. [Google Scholar] [CrossRef]
- Barry, R.G.; Chorley, R.J. Atmosphere, Weather and Climate; Routledge: Abingdon-on-Thames, UK, 2009. [Google Scholar]
- Or, D.; Lehmann, P.; Shahraeeni, E.; Shokri, N. Advances in soil evaporation physics—A review. Vadose Zone J. 2013, 12, 2011–2022. [Google Scholar] [CrossRef]
- Rael, R. Earth Architecture; Princeton Architectural Press: New York, NY, USA, 2009. [Google Scholar]
- Oliver, P. Dwellings: The Vernacular House World Wide; Phaidon: London, UK, 2003. [Google Scholar]
- Cardinale, N.; Rospi, G.; Stefanizzi, P.; Augenti, V. Thermal properties of the vernacular buildings envelopes: The case of the “Sassi di Matera” and Trulli di Alberobello. Int. J. Energy Environ. 2011, 2, 605–614. [Google Scholar]
- Priya, R.S.; Sundarraja, M.; Radhakrishnan, S.; Vijayalakshmi, L. Solar passive techniques in the vernacular buildings of coastal regions in Nagapattinam, TamilNadu-India–A qualitative and quantitative analysis. Energy Build. 2012, 49, 50–61. [Google Scholar] [CrossRef]
- Gagliano, A.; Patania, F.; Nocera, F.; Signorello, C. Assessment of the dynamic thermal performance of massive buildings. Energy Build 2014, 72, 361–370. [Google Scholar] [CrossRef]
- Algifri, A.; Gadhi, S.B.; Nijaguna, B. Thermal behaviour of adobe and concrete houses in Yemen. Renew. Energy 1992, 2, 597–602. [Google Scholar] [CrossRef]
- Rempel, A.R.; Rempel, A.W. Rocks, clays, water, and salts: Highly durable, infinitely rechargeable, eminently controllable thermal batteries for buildings. Geosciences 2013, 3, 63–101. [Google Scholar] [CrossRef]
- Tan, L.B. Study on sustainable use of raw soil material in rural houses design in Western China. Adv. Mater. Res. 2012, 476, 1714–1717. [Google Scholar] [CrossRef]
- Duffin, R.; Knowles, G. Temperature control of buildings by adobe wall design. Sol. Energy 1981, 27, 241–249. [Google Scholar] [CrossRef]
- Bahadori, M.N.; Haghighat, F. Weekly storage of coolness in heavy brick and adobe walls. Energy Build. 1985, 8, 259–270. [Google Scholar] [CrossRef]
- Zhai, Z.J.; Previtali, J.M. Ancient vernacular architecture: Characteristics categorization and energy performance evaluation. Energy Build. 2010, 42, 357–365. [Google Scholar] [CrossRef]
- Singh, M.K.; Mahapatra, S.; Atreya, S. Solar passive features in vernacular architecture of North-East India. Sol. Energy 2011, 85, 2011–2022. [Google Scholar] [CrossRef]
- Morony, J.J. Adobe and latent heat: A critical connection. In Proceedings of the Second Annual Conference of the Adobe Association of the Southwest, El Rito, NM, USA, 18–21 May 2005.
- Morony, J.J. Adobe as phase-change material (PCM): Concerning a proper classification for an earthen building material. In Proceedings of the Fourth Annual Conference of the Adobe Association of the Southwest, El Rito, NM, USA, 18–20 May 2007.
- Pandit, R.; Schick, M.; Wortis, M. Systematics of multilayer adsorption phenomena on attractive substrates. Phys. Rev. B 1982, 26, 5112–5140. [Google Scholar] [CrossRef]
- Van Oss, C.; Giese, R. The hydrophilicity and hydrophobicity of clay minerals. Clays Clay Miner. 1995, 43, 474–477. [Google Scholar] [CrossRef]
- Lu, N.; Khorshidi, M. Mechanisms for soil-water retention and hysteresis at high suction range. J. Geotech. Geoenviron. Eng. 2015, 141, 04015032. [Google Scholar] [CrossRef]
- Resurreccion, A.C.; Moldrup, P.; Tuller, M.; Ferre, T.; Kawamoto, K.; Komatsu, T.; De Jonge, L.W. Relationship between specific surface area and the dry end of the water retention curve for soils with varying clay and organic carbon contents. Water Resour. Res. 2011, 47, W06522. [Google Scholar] [CrossRef]
- Schneider, M.; Goss, K.U. Prediction of the water sorption isotherm in air dry soils. Geoderma 2012, 170, 64–69. [Google Scholar] [CrossRef]
- Tuller, M.; Or, D. Water films and scaling of soil characteristic curves at low water contents. Water Resour. Res. 2005, 41, W09403. [Google Scholar] [CrossRef]
- Israelachvili, J.N. Intermolecular and Surface Forces, 3rd ed.; Academic Press: Cambridge, MA, USA, 2011. [Google Scholar]
- Tuller, M.; Or, D.; Dudley, L.M. Adsorption and capillary condensation in porous media: Liquid retention and interfacial configurations in angular pores. Water Resour. Res. 1999, 35, 1949–1964. [Google Scholar] [CrossRef]
- Buck, A.L. New equations for computing vapor pressure and enhancement factor. J. Appl. Meteorol. 1981, 20, 1527–1532. [Google Scholar] [CrossRef]
- Richards, L.A. Capillary conduction of liquids through porous mediums. J. Appl. Phys. 1931, 1, 318–333. [Google Scholar] [CrossRef]
- Kehrer, M.; Pallin, S.; Harmon, A.; Goldberg, L.F. Hygrothermal Simulation of Foundations: Part 1 Soil Material Properties; Technical Report; Oak Ridge National Laboratory (ORNL): Oak Ridge, TN, USA, 2012. [Google Scholar]
- Becker, B.; Fricke, B. Effects of saturation and dry density on soil thermal conductivity. In Proceedings of the 3rd International Conference on Heat Pumps in Cold Climates, Wolfville, NS, Canada, 11–12 August 1997; pp. 121–136.
- Saxton, K.; Rawls, W.; Romberger, J.; Papendick, R. Estimating generalized soil-water characteristics from texture. Soil Sci. Soc. Am. J. 1986, 50, 1031–1036. [Google Scholar] [CrossRef]
- Moldrup, P.; Olesen, T.; Gamst, J.; Schjønning, P.; Yamaguchi, T.; Rolston, D. Predicting the gas diffusion coefficient in repacked soil water-induced linear reduction model. Soil Sci. Soc. Am. J. 2000, 64, 1588–1594. [Google Scholar] [CrossRef]
- Yan, Z.; Lam, J.C.; Liu, J. Experimental studies on the thermal and moisture properties of rammed earth used in adobe buildings in China. Archit. Sci. Rev. 2005, 48, 55–60. [Google Scholar] [CrossRef]
- Collet, F.; Serres, L.; Miriel, J.; Bart, M. Study of thermal behaviour of clay wall facing south. Build. Environ. 2006, 41, 307–315. [Google Scholar] [CrossRef]
- Collet, F.; Bart, M.; Serres, L.; Miriel, J. Porous structure and hydric properties of cob. J. Porous Media 2010, 13, 111–124. [Google Scholar] [CrossRef]
- Cagnon, H.; Aubert, J.; Coutand, M.; Magniont, C. Hygrothermal properties of earth bricks. Energy Build. 2014, 80, 208–217. [Google Scholar] [CrossRef]
- Allinson, D.; Hall, M. Hygrothermal analysis of a stabilised rammed earth test building in the UK. Energy Build. 2010, 42, 845–852. [Google Scholar] [CrossRef]
- Hall, M.; Allinson, D. Assessing the effects of soil grading on the moisture content-dependent thermal conductivity of stabilised rammed earth materials. Appl. Therm. Eng. 2009, 29, 740–747. [Google Scholar] [CrossRef]
- Hall, M.; Allinson, D. Analysis of the hygrothermal functional properties of stabilised rammed earth materials. Build. Environ. 2009, 44, 1935–1942. [Google Scholar] [CrossRef] [Green Version]
- Andriani, G.F.; Walsh, N. Petrophysical and mechanical properties of soft and porous building rocks used in Apulian monuments (south Italy). Geol. Soc. Lond. Spec. Publ. 2010, 333, 129–141. [Google Scholar] [CrossRef]
- Andriani, G.; Walsh, N. Fabric, porosity and water permeability of calcarenites from Apulia (SE Italy) used as building and ornamental stone. Bull. Eng. Geol. Environ. 2003, 62, 77–84. [Google Scholar]
- Beck, K.; Al-Mukhtar, M.; Rozenbaum, O.; Rautureau, M. Characterization, water transfer properties and deterioration in tuffeau: Building material in the Loire Valley–France. Build. Environ. 2003, 38, 1151–1162. [Google Scholar] [CrossRef]
- Reynolds, C.; Jackson, T.; Rawls, W. Estimating soil water-holding capacities by linking the Food and Agriculture Organization soil map of the world with global pedon databases and continuous pedotransfer functions. Water Resour. Res. 2000, 36, 3653–3662. [Google Scholar] [CrossRef]
- Schaap, M.G.; Leij, F.J.; Van Genuchten, M.T. Rosetta: A computer program for estimating soil hydraulic parameters with hierarchical pedotransfer functions. J. Hydrol. 2001, 251, 163–176. [Google Scholar] [CrossRef]
- Jensen, D.K.; Tuller, M.; de Jonge, L.W.; Arthur, E.; Moldrup, P. A new two-stage approach to predicting the soil water characteristic from saturation to oven-dryness. J. Hydrol. 2015, 521, 498–507. [Google Scholar] [CrossRef]
- Lu, N. Generalized soil water retention equation for adsorption and capillarity. J. Geotech. Geoenviron. Eng. 2016, 04016051. [Google Scholar] [CrossRef]
- Peters, A. Simple consistent models for water retention and hydraulic conductivity in the complete moisture range. Water Resour. Res. 2013, 49, 6765–6780. [Google Scholar] [CrossRef]
- Brooks, R.H.; Corey, A.T. Hydraulic properties of porous media and their relation to drainage design. Trans. ASAE 1964, 7, 26–0028. [Google Scholar]
- Rawls, W.; Brakensiek, D.; Saxtonn, K. Estimation of soil water properties. Trans. ASAE 1982, 25, 1316–1320. [Google Scholar] [CrossRef]
- U.S. Department of Energy. EnergyPlus 8.4. 2015. Available online: http://energyplus.net (accessed on 27 August 2016). [Google Scholar]
- EnergyPlus Engineering Reference; U.S. Department of Energy: Washington, DC, USA, 2015.
- U.S. Department of Energy. Auxiliary Programs for EnergyPlus. 2015. Available online: http://energyplus.net (accessed on 27 August 2016). [Google Scholar]
- Legacy OpenStudio 1.0.14; National Renewable Energy Laboratory, U.S. Department of Energy: Golden, CO, USA, 2015.
- Morony, J.J. The Mexican green roof. In Proceedings of the Fifth International Conference on Earth Architecture, El Rito, NM, USA, 15 May 2009.
- Minke, G. Building with Earth: Design and Technology of a Sustainable Architecture, 3rd ed.; Walter de Gruyter: Berlin, Germany, 2012. [Google Scholar]
- Austin, G.S. Adobe as a building material. N. M. Geol. 1984, 69–71. [Google Scholar]
- Van Beek, G.W.; Van Beek, O. Glorious Mud!: Ancient and Contemporary Earthen Design and Construction in North Africa, Western Europe, the Near East, and Southwest Asia; Smithsonian Institution: Washington, DC, USA, 2013. [Google Scholar]
- McHenry, P.G. Adobe and Rammed Earth Buildings: Design and Construction; University of Arizona Press: Tucson, AZ, USA, 1984. [Google Scholar]
- Lertwattanaruk, P.; Choksiriwanna, J. The physical and thermal properties of adobe brick containing bagasse for earth construction. J. Archit. Plan. Res. Stud. 2011, 5, 187–199. [Google Scholar]
- Hadjri, K.; Osmani, M.; Baiche, B.; Chifunda, C. Attitudes towards earth building for Zambian housing provision. In Proceedings of the Institution of Civil Engineers: Engineering Sustainability; Thomas Telford Publishing: London, UK, 2007; Volume 160, pp. 141–149. [Google Scholar]
- Pacheco-Torgal, F.; Jalali, S. Earth construction: Lessons from the past for future eco-efficient construction. Constr. Build. Mater. 2012, 29, 512–519. [Google Scholar] [CrossRef] [Green Version]
- Revuelta-Acosta, J.; Garcia-Diaz, A.; Soto-Zarazua, G.; Rico-Garcia, E. Adobe as a sustainable material: A thermal performance. J. Appl. Sci. 2010, 10, 2211–2216. [Google Scholar]
- Yan, Z.; Liu, J.; Wang, R. Experimental study of moisture absorption isotherms of adobe building materials. J. Xian Univ. Archit. Technol. 2003, 35, 327–353. [Google Scholar]
- McCann, J. Clay and Cob Buildings; Shire Publications: London, UK, 2004. [Google Scholar]
- Miccoli, L.; Müller, U.; Fontana, P. Mechanical behaviour of earthen materials: A comparison between earth block masonry, rammed earth and cob. Constr. Build. Mater. 2014, 61, 327–339. [Google Scholar] [CrossRef]
- Hamard, E.; Cazacliu, B.; Razakamanantsoa, A.; Morel, J.C. Cob, a vernacular earth construction process in the context of modern sustainable building. Build. Environ. 2016, 106, 103–119. [Google Scholar] [CrossRef]
- Goodhew, S.; Griffiths, R. Sustainable earth walls to meet the building regulations. Energy Build. 2005, 37, 451–459. [Google Scholar] [CrossRef]
- Lawrence, M.; Heath, A.; Walker, P. Mortars for thin unfired clay masonry walls. In Proceedings of the LEHM 5th International Conference on Building with Earth, Koblenz, Germany, 9–12 October 2008; pp. 66–73.
- Rempel, A.R.; Rempel, A.W.; Gates, K.R.; Shaw, B. Climate-responsive thermal mass design for Pacific Northwest sunspaces. Renew. Energy 2016, 85, 981–993. [Google Scholar] [CrossRef]
- McGregor, F.; Heath, A.; Shea, A.; Lawrence, M. The moisture buffering capacity of unfired clay masonry. Build. Environ. 2014, 82, 599–607. [Google Scholar] [CrossRef] [Green Version]
- Maillard, P.; Aubert, J. Effects of the anisotropy of extruded earth bricks on their hygrothermal properties. Constr. Build. Mater. 2014, 63, 56–61. [Google Scholar] [CrossRef]
- Morton, T. Feat of clay. Mater. World 2006, 14, 23–24. [Google Scholar]
- El Fgaier, F.; Lafhaj, Z.; Brachelet, F.; Antczak, E.; Chapiseau, C. Thermal performance of unfired clay bricks used in construction in the north of France: Case study. Case Stud. Constr. Mater. 2015, 3, 102–111. [Google Scholar] [CrossRef]
- Soebarto, V. Analysis of indoor performance of houses using rammed earth walls. In Proceedings of the 11th International IBPSA Conference, Glasgow, Scotland, 27–30 July 2009; pp. 1530–1537.
- Rincón, L.; Serrano, S.; Cabeza, L.; González, B.; Navarro, A.; Bosch, M. Experimental rammed earth prototypes in Mediterranean climate. In Proceedings of the International Conference on Vernacular Heritage, Sustainability and Earthen Architecture—Earthen Architecture: Past, Present and Future, Valencia, Spain, 11–13 September 2014; pp. 311–316.
- Hall, M.; Djerbib, Y. Moisture ingress in rammed earth: Part 1—The effect of soil particle-size distribution on the rate of capillary suction. Constr. Build. Mater. 2004, 18, 269–280. [Google Scholar] [CrossRef]
- Hall, M.; Djerbib, Y. Moisture ingress in rammed earth: Part 2—The effect of soil particle-size distribution on the absorption of static pressure-driven water. Constr. Build. Mater. 2006, 20, 374–383. [Google Scholar] [CrossRef]
- Hall, M.; Allinson, D. Transient numerical and physical modelling of temperature profile evolution in stabilised rammed earth walls. Appl. Therm. Eng. 2010, 30, 433–441. [Google Scholar] [CrossRef]
- Bark, L.G. Bee-hive dwellings of Apulia. Antiquity 1932, 6, 407–410. [Google Scholar] [CrossRef]
- Ruggiero, G.; Dal Sasso, S.; Loisi, R.V.; Verdiani, G. Characteristics and distribution of trulli constructions in the area of the site of community importance Murgia of Trulli. J. Agric. Eng. 2013, 44, 13. [Google Scholar] [CrossRef]
- Dipasquale, L.; Silva, N.J. Corbelled domes of Apulia (Italy). In Earthen Domes and Habitats; Mecca, S., Dipasquale, L., Eds.; Editorial ETS: Pisa, Italy, 2009; pp. 123–142. [Google Scholar]
- Cardinale, N.; Rospi, G.; Stefanizzi, P. Energy and microclimatic performance of Mediterranean vernacular buildings: The Sassi district of Matera and the Trulli district of Alberobello. Buil. Environ. 2013, 59, 590–598. [Google Scholar] [CrossRef]
- Cabeza, L.F.; Barreneche, C.; Miró, L.; Morera, J.M.; Bartolí, E.; Fernández, A.I. Low carbon and low embodied energy materials in buildings: A review. Renew. Sustain. Energy Rev. 2013, 23, 536–542. [Google Scholar] [CrossRef]
- Reddy, B.V.; Jagadish, K. Embodied energy of common and alternative building materials and technologies. Energy Build. 2003, 35, 129–137. [Google Scholar] [CrossRef]
- Franzen, C.; Mirwald, P. Moisture content of natural stone: Static and dynamic equilibrium with atmospheric humidity. Environ. Geol. 2004, 46, 391–401. [Google Scholar] [CrossRef]
- Krus, M. Moisture Transport and Storage Coefficients of Porous Mineral Building Baterials: Theoretical Principles and New Test Methods; Fraunhofer IRB Verlag: Stuttgart, Germany, 1996. [Google Scholar]
- Van Genuchten, M.T. A closed-form equation for predicting the hydraulic conductivity of unsaturated soils. Soil Sci. Soc. Am. J. 1980, 44, 892–898. [Google Scholar] [CrossRef]
Figure 1.
Vapor pressure as a function of temperature at a range of relative humidities, using the empirical formula , where T is measured in °C [41]. The horizontal dashed line illustrates the progressive increase in φ along an idealized cooling pathway with constant vapor content.
Figure 1.
Vapor pressure as a function of temperature at a range of relative humidities, using the empirical formula , where T is measured in °C [41]. The horizontal dashed line illustrates the progressive increase in φ along an idealized cooling pathway with constant vapor content.
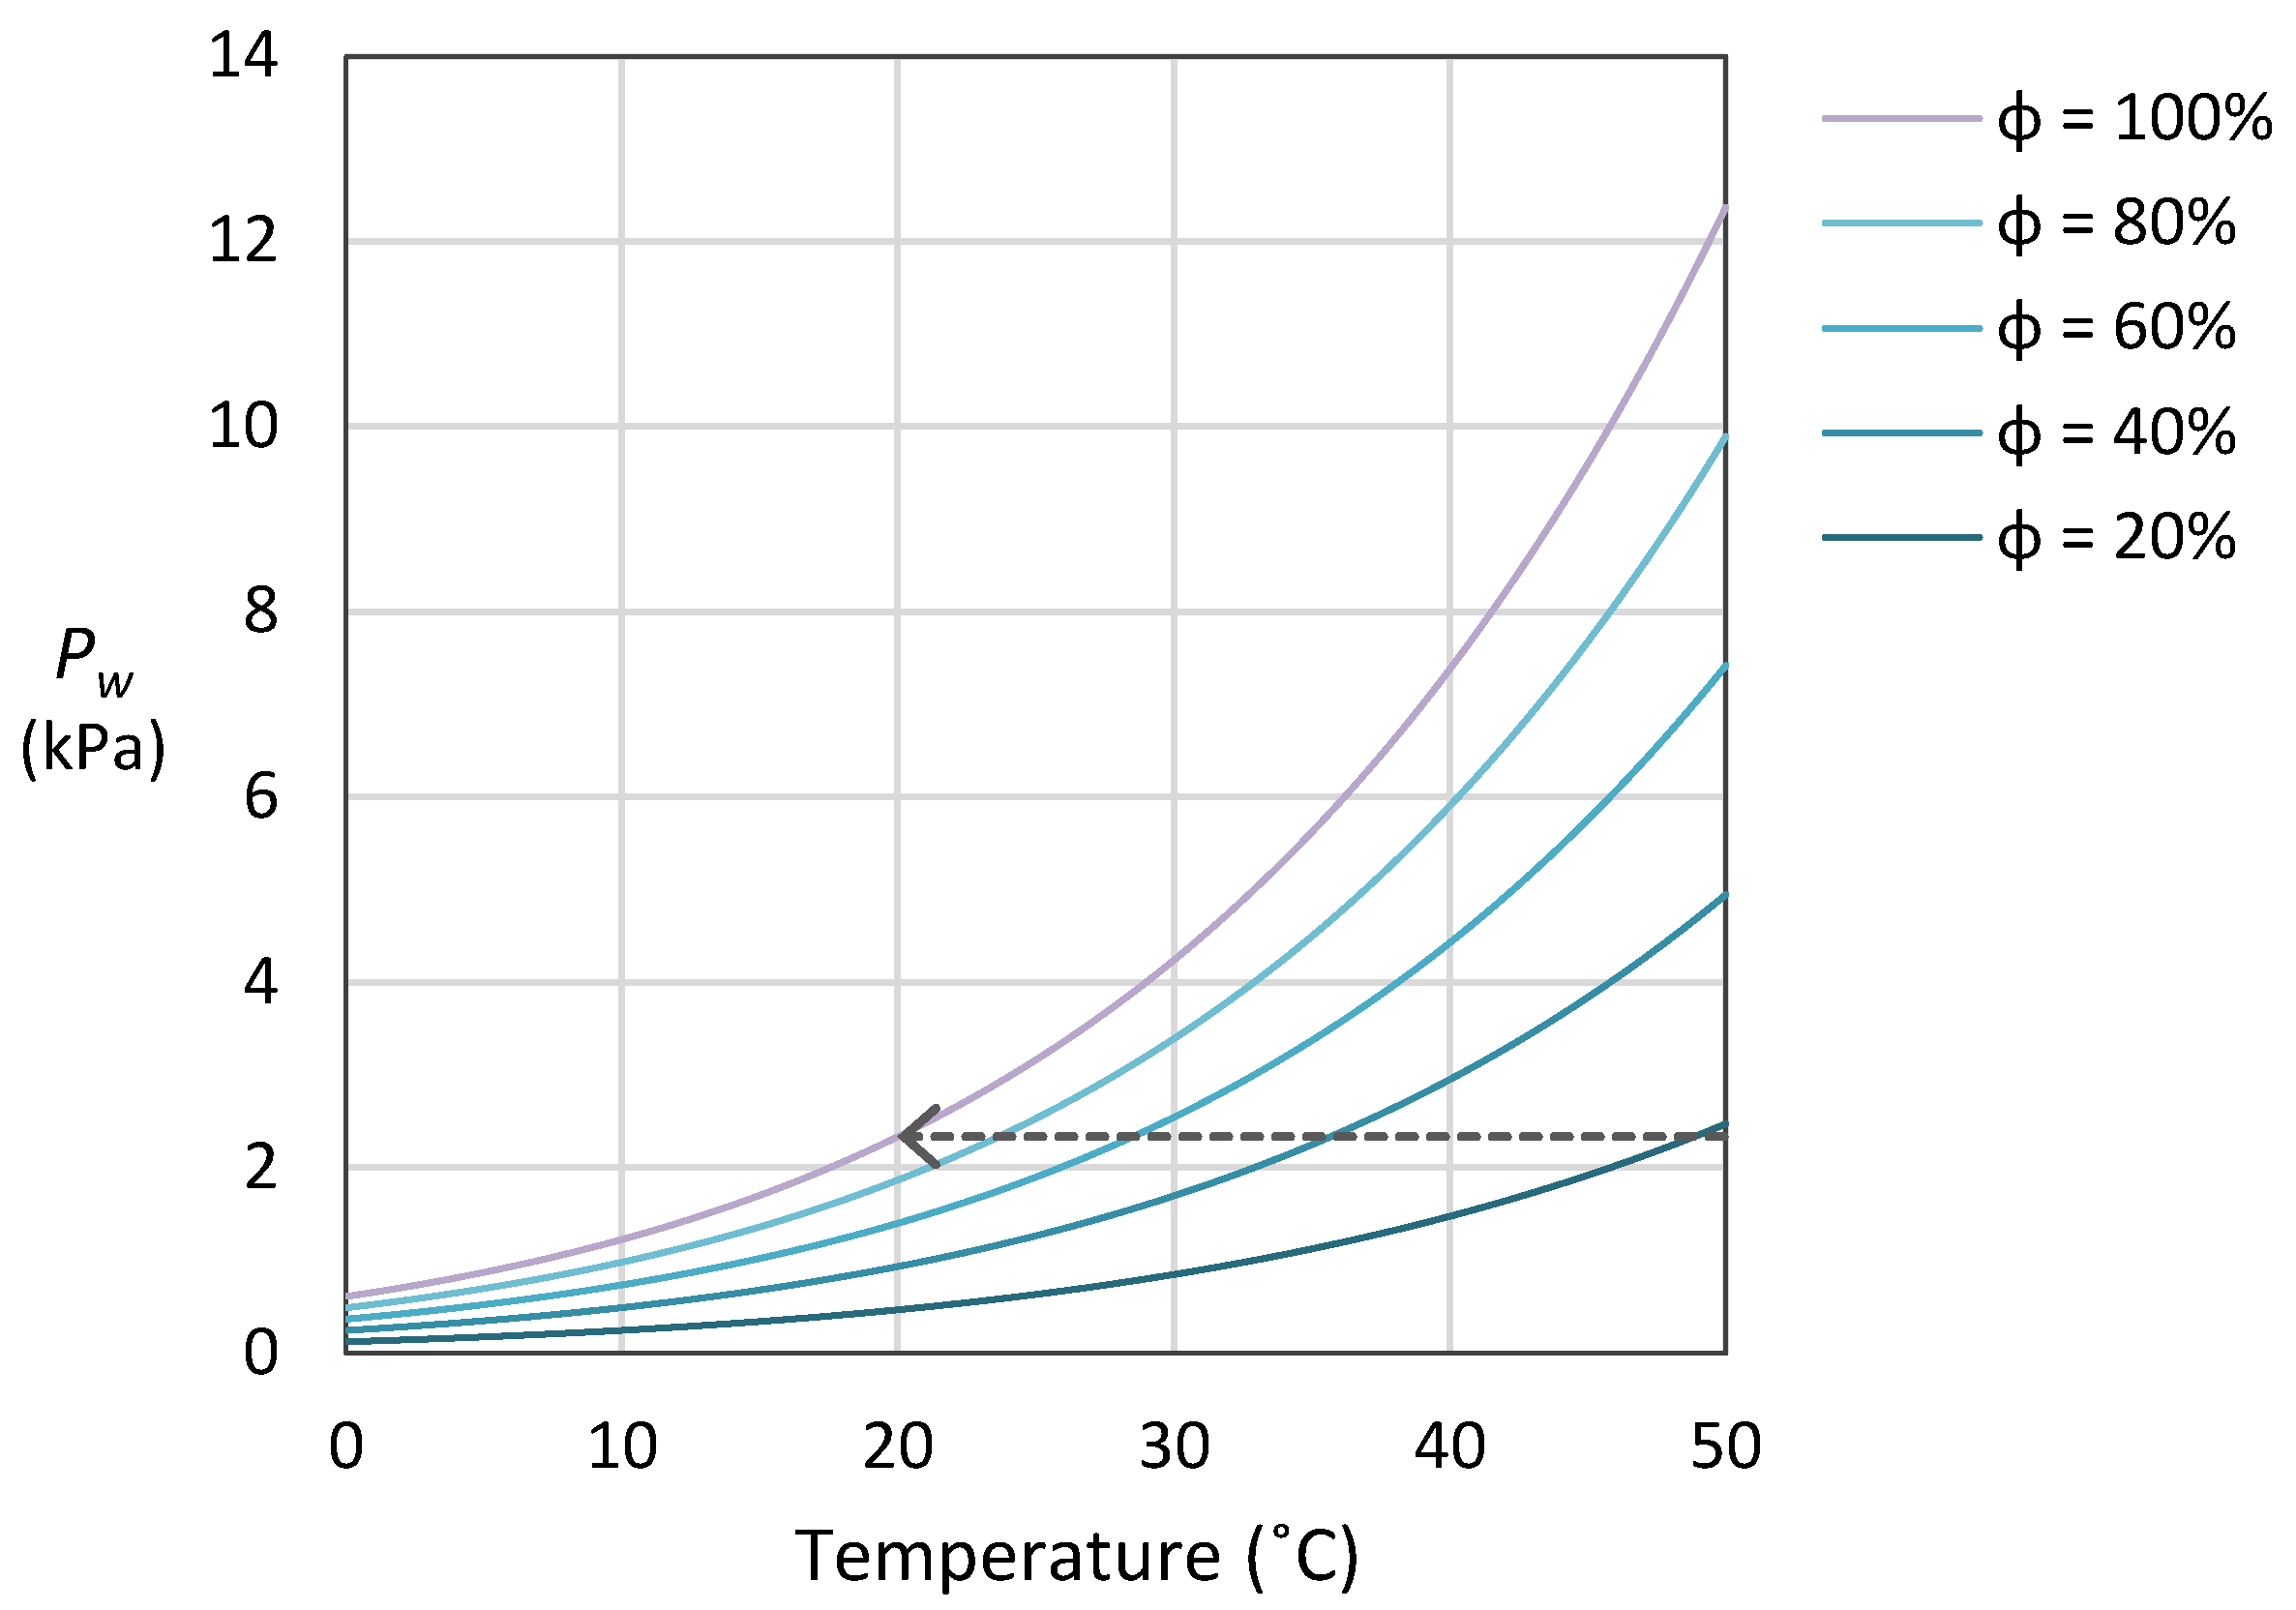
Figure 2.
Soil triangle showing the twelve soil classes of the Unified Soil Classification System and their respective proportions of sand, silt, and clay. Points indicate the specific compositions used to estimate hygric properties W, D, μ and k, shown in Figure 3, for prediction of evaporative cooling behavior.

Figure 3.
Soil properties used in estimating intrinsic evaporative cooling behavior: (a) moisture retention curves W; (b) vapor diffusion resistance factors μ; (c) liquid transport coefficients D; and (d) moisture-dependent thermal conductivities k, grouped by color to reflect clay-like (red-orange), silt-like (purple), and sand-like (turquoise) soils. Sand and clay contents for each textural class follow [43] (Figure 2), with W obtained from Equation (6), μ from Equation (8) using n from [43], Equation (9) used in calculating D, and k from [43,44].
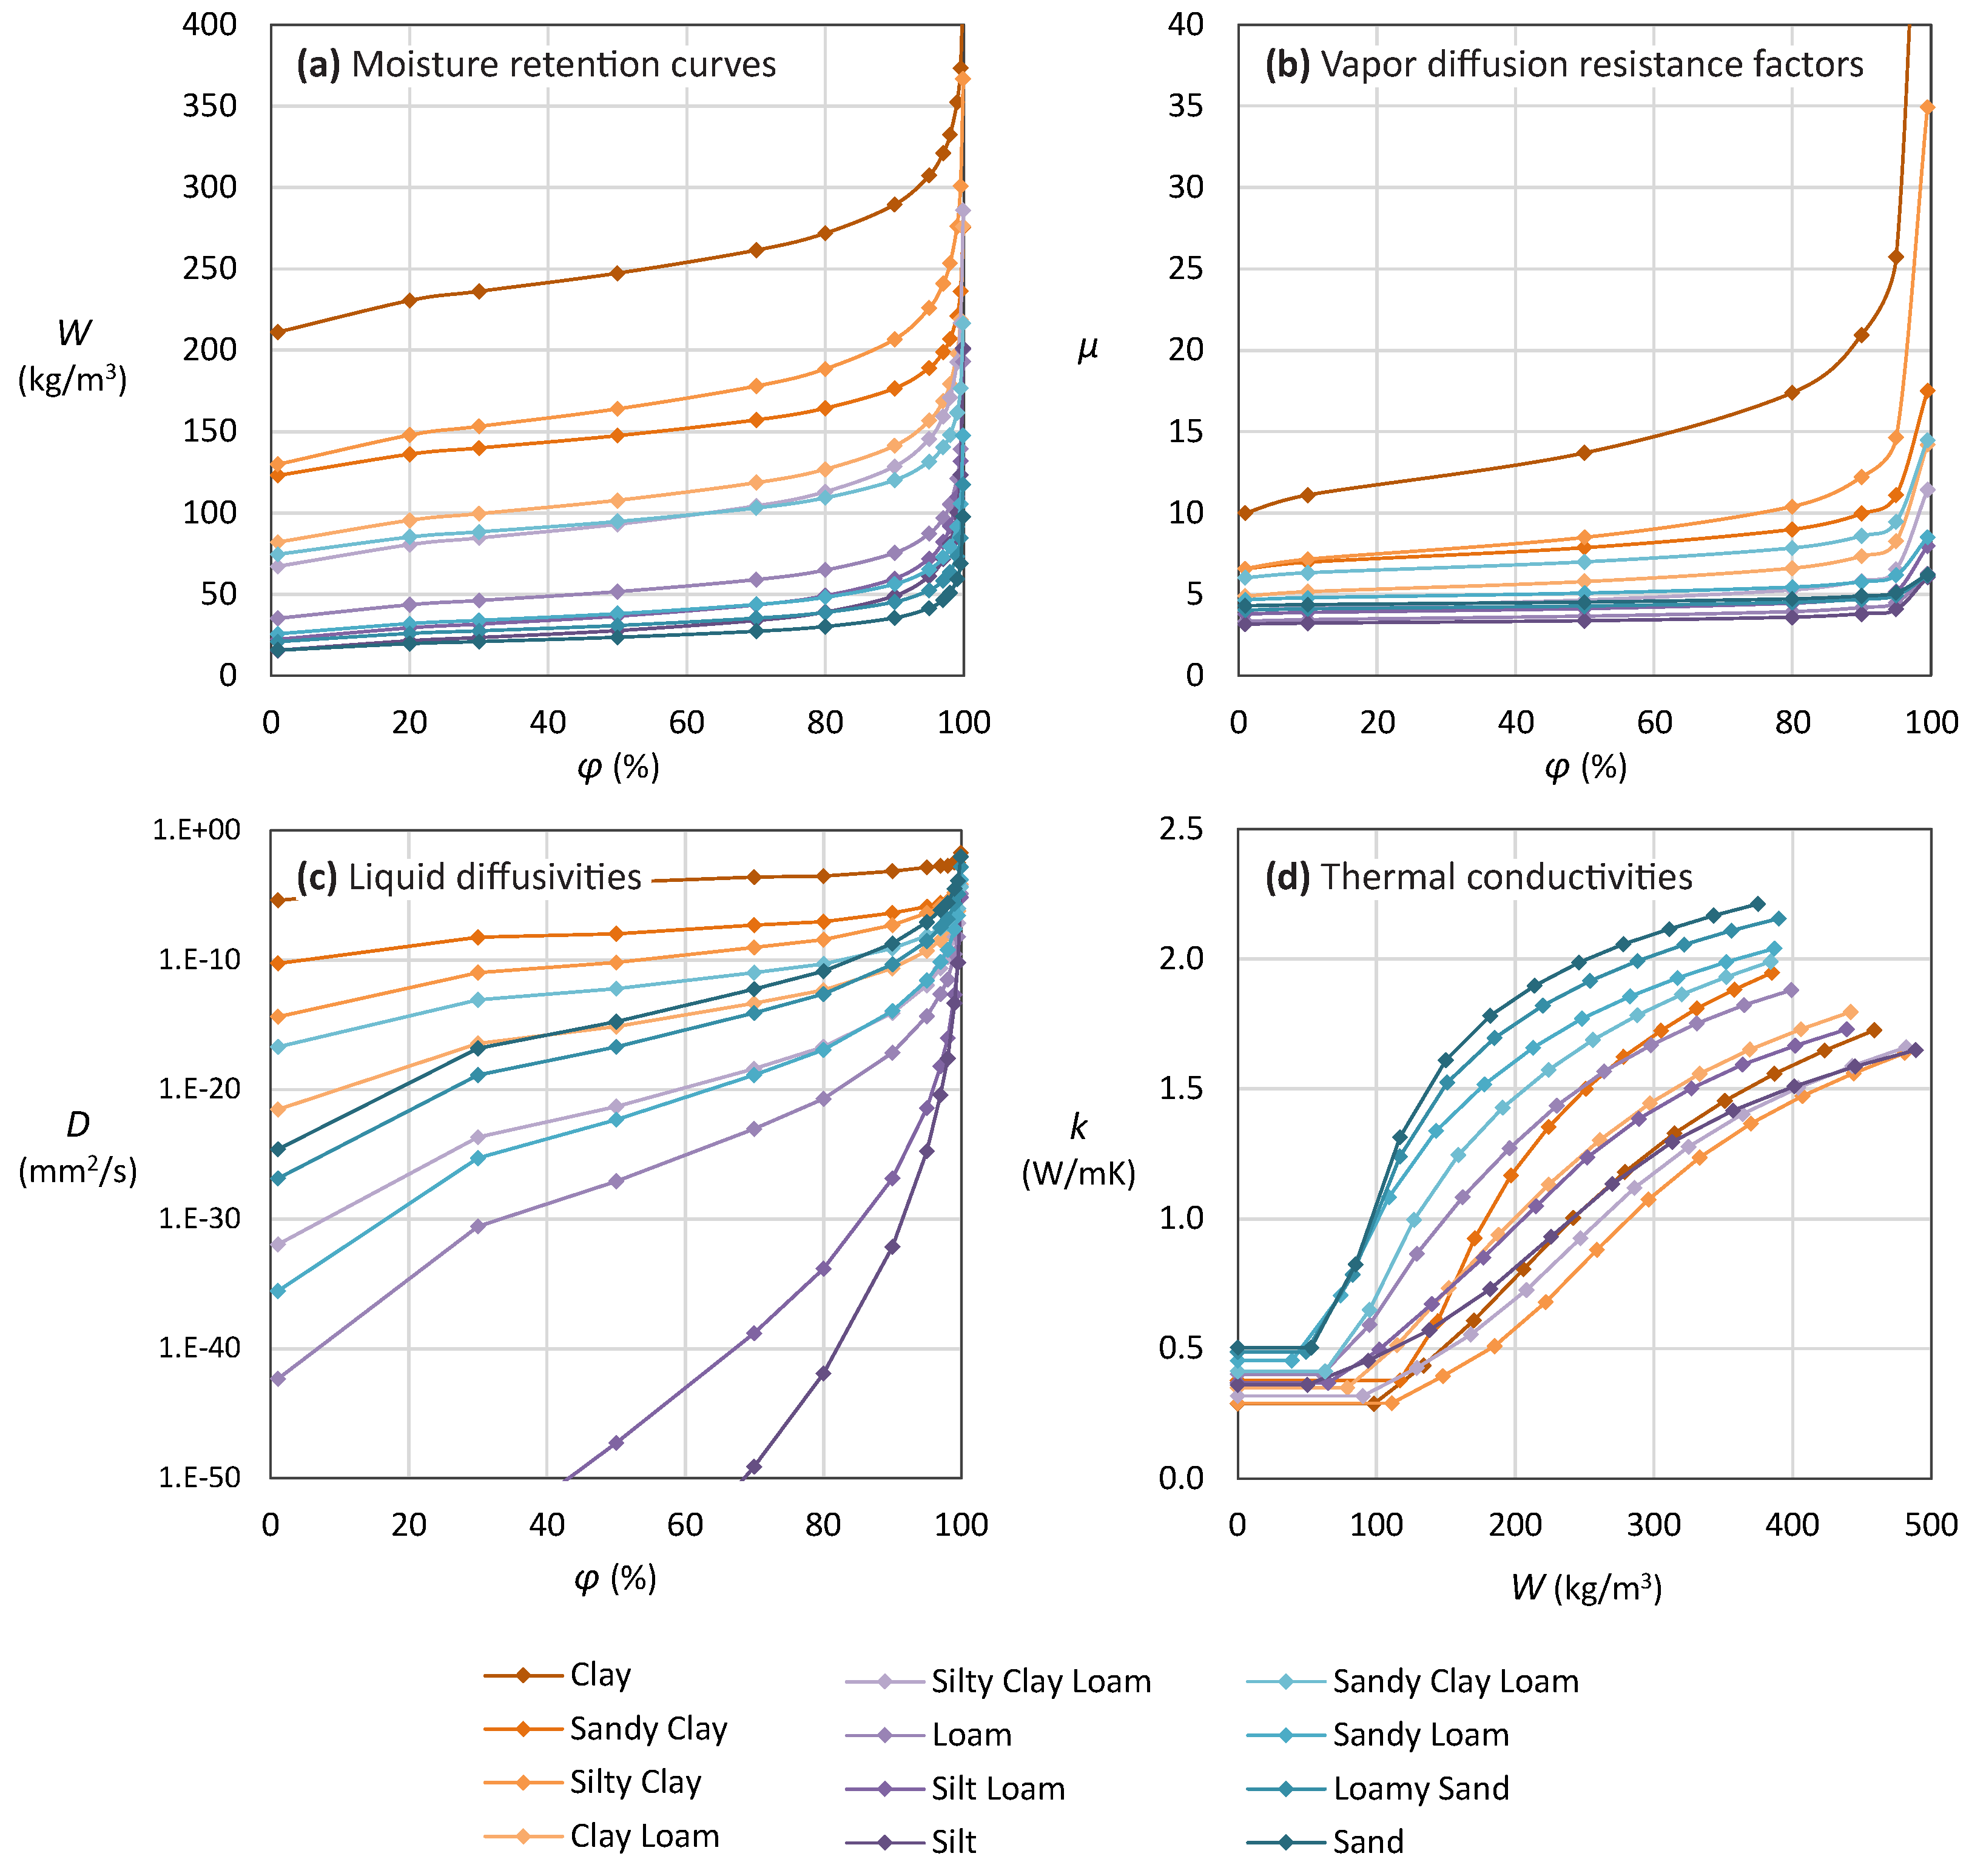
Figure 4.
Effect of soil texture on patterns of latent heat flux (dashed lines) and sensible heat flux (solid lines) at the outer surfaces of horizontal Mexican green roofs, 10 cm in thickness, in the semi-arid steppe climate of Laredo, TX, USA (Köppen BSh, Table 3; Figure 8). Data show hourly values for four of the twelve soils described above (Figure 2) that spanned the range of performance, illustrating the ability of intrinsic evaporative cooling to counteract solar gain. Ambient humidity was the only source of moisture.

Figure 5.
Effect of soil moisture on sensible heat flux, shown by comparison of fluxes predicted using moisture-dependent thermal conductivity values (solid lines) with those predicted using dry thermal conductivity values (dashed lines), illustrating a difference of up to ten-fold during daytime sensible gain as well as nighttime heat loss. Data show hourly values at the outer surfaces of Mexican green roof soils, each 10 cm in thickness, in the semi-arid steppe climate of Laredo, TX, USA (Köppen BSh, Table 3; Figure 8); ambient humidity was the only source of moisture.

Figure 6.
Effects of soil texture on intrinsic evaporative cooling as measured by (a) evaporative heat losses and (b) net thermal gains by Mexican green roof soils, illustrating the greater evaporative activity of soils with fairly even distributions of particle sizes, as well as the potential for moisture-enhanced thermal conductivity—particularly in higher-clay soils—to counteract some of that benefit through greater sensible gains. Data show cumulative monthly values over the warmest summer month (15 July–15 August) in the semi-arid steppe climate of Laredo, TX, USA (Köppen BSh, Figure 8). Ambient humidity was the only source of moisture.

Figure 7.
Adobe properties, as well as those of cob and unfired earth bricks discussed below, used in estimating intrinsic evaporative cooling behavior: (a) moisture retention curves W and (b) vapor diffusion resistance factors μ calculated using Equation (8) [46]. Adobe properties follow [26,47,77], with W obtained from Yan et al. ([47], Figure 6), and μ calculated with . Cob properties follow [48,49], with W obtained from (Collet et al. [49], Figure 6), and μ calculated with . Brick properties follow [50] with W based upon “Brick 1” in ([50], Figure 6), and μ calculated using .

Figure 8.
Variation of latent heat flux (; lower panels) and indoor relative humidity (φ; upper panels) with climate in adobe walls. Dots show average hourly July values of outdoor air temperature T (orange) and relative humidity φ (blue) in each climate (Table 3; (a) Kerela, India; (b) Laredo, Texas; (c) Yuma, Arizona; (d) Izmir, Turkey; (e) Xi’an, China; (f) Kunming, China), dashed lines show indoor relative humidity, and bars show hourly values of averaged among all orientations (N, S, E, W) in simulations of 20 cm-thick walls of a well-characterized Chinese adobe ([26,77]; Section 3.2.1). Ambient humidity was the only source of moisture.
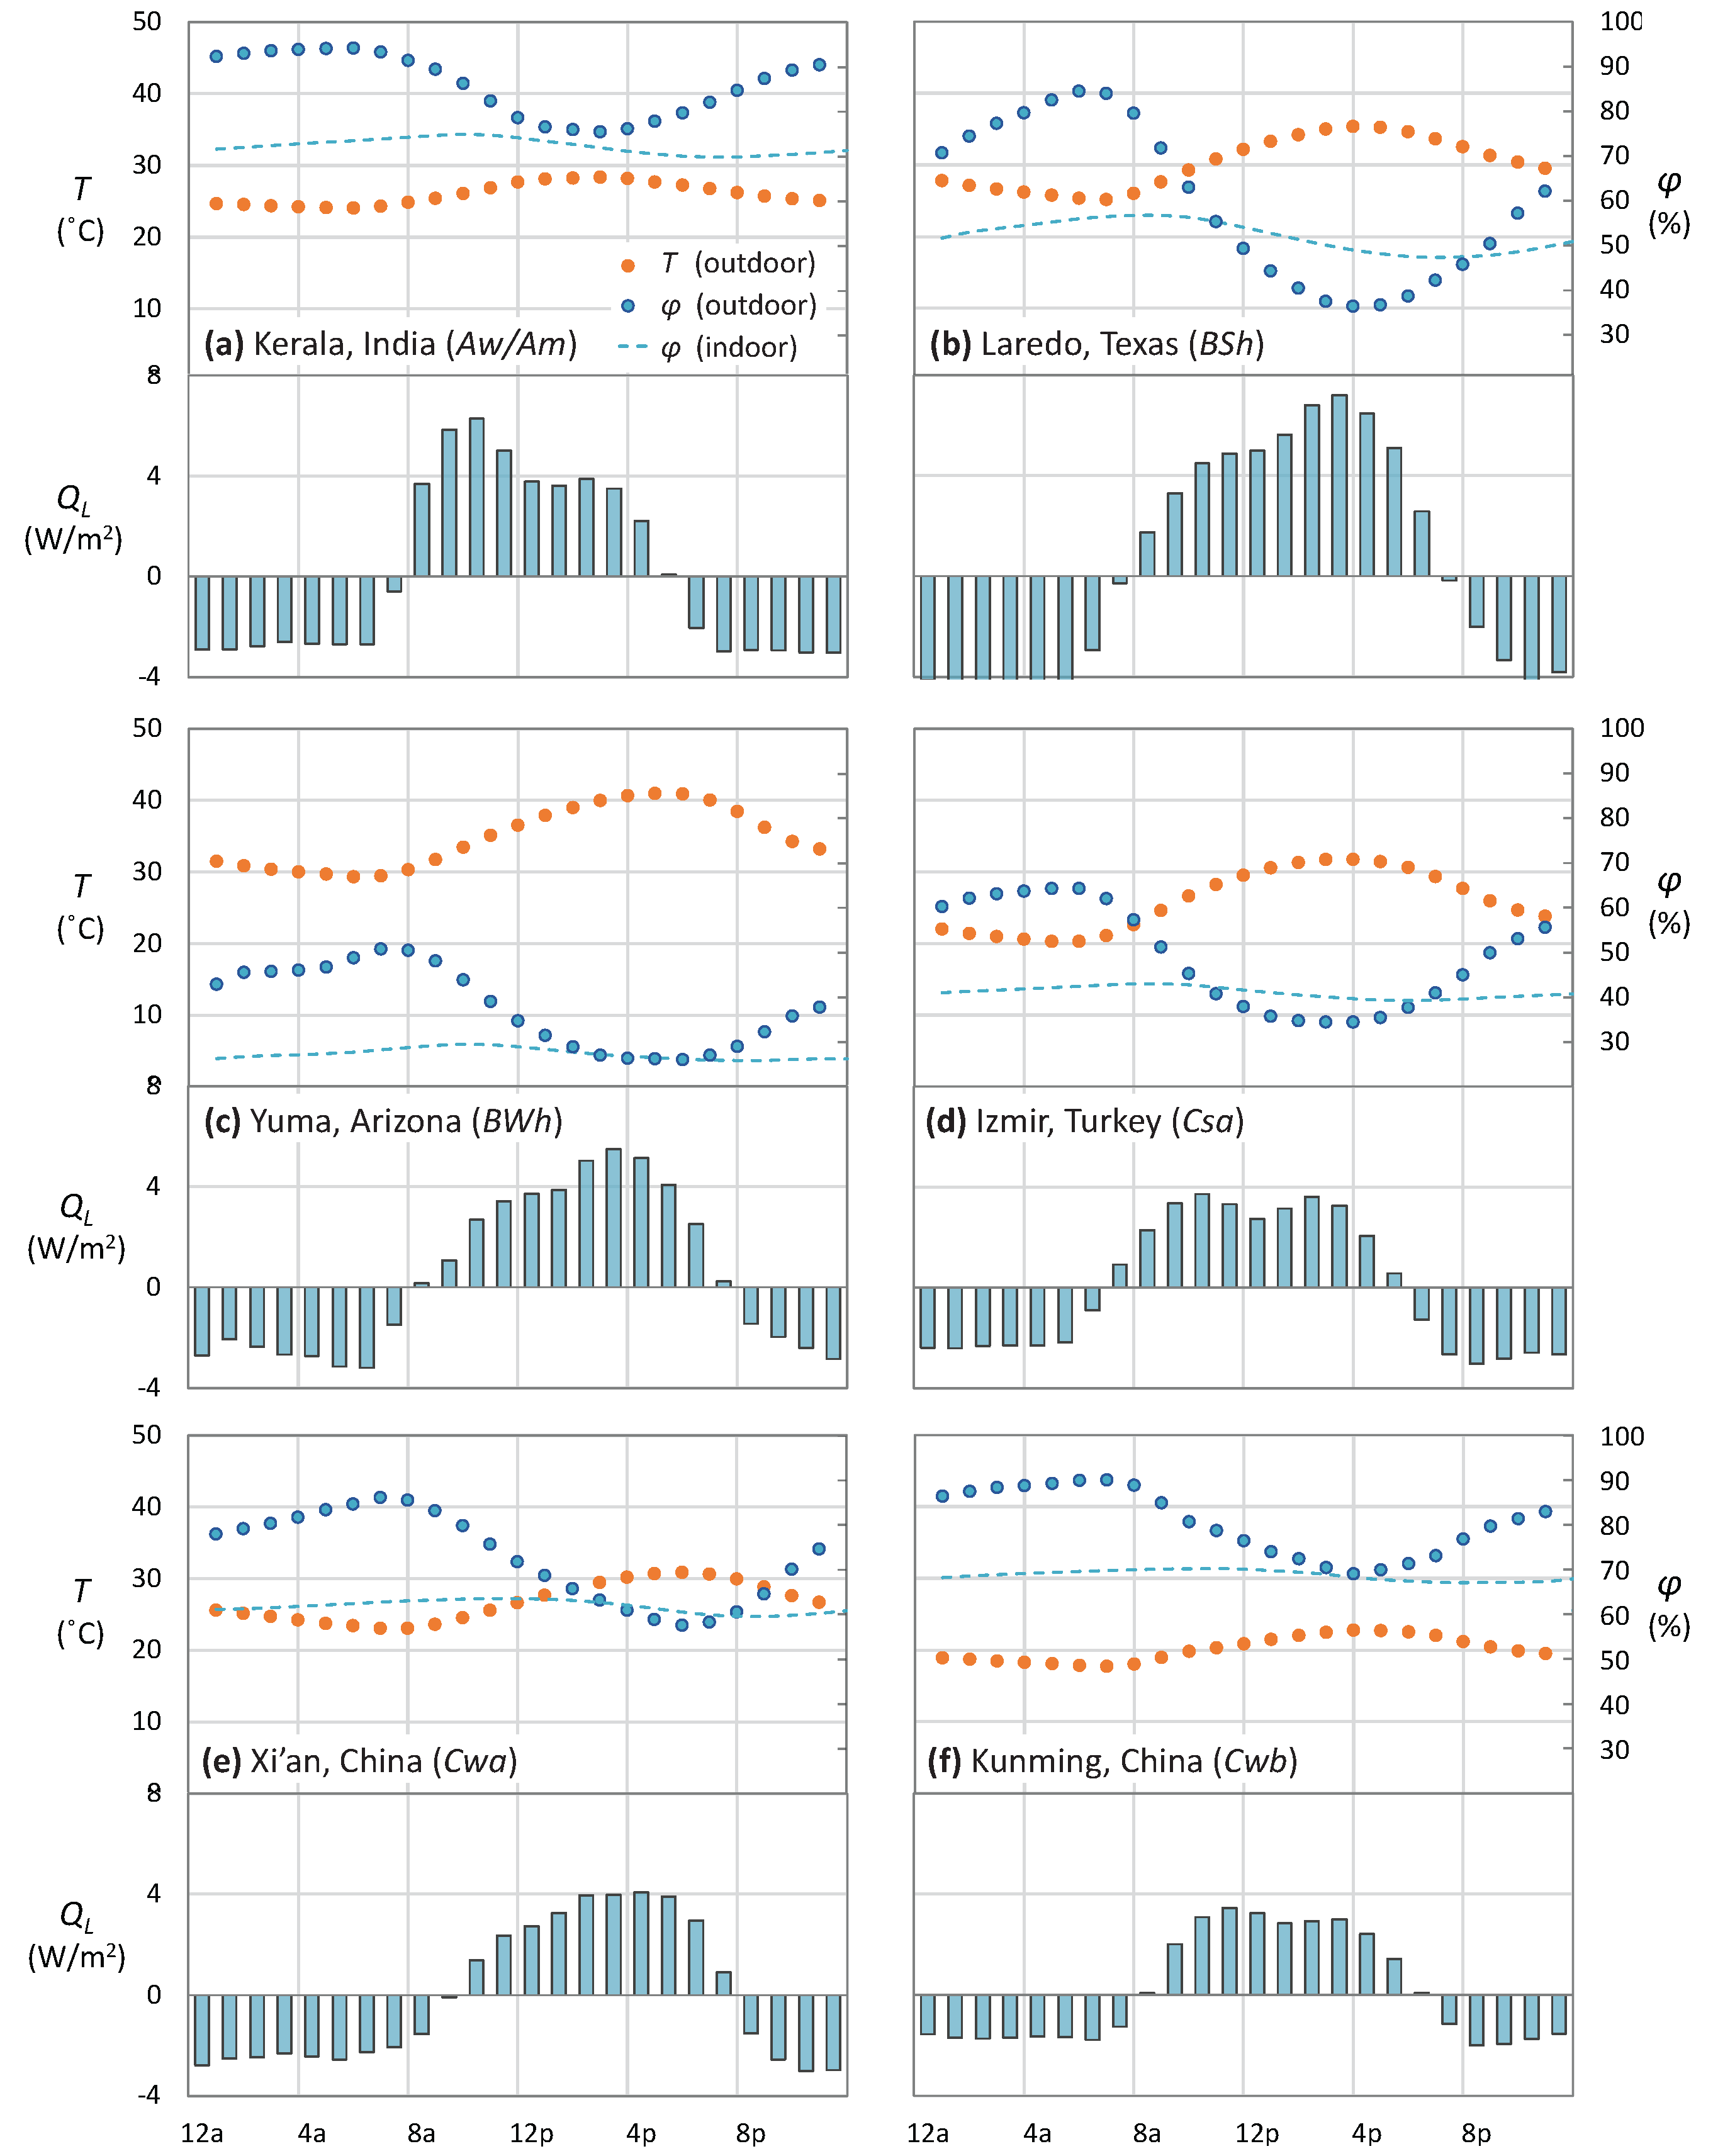
Figure 9.
Climates used in simulations of intrinsic evaporative cooling, and indoor relative humidity levels maintained, by (a) cob (Nantes, France); (b) unfired earth bricks (Clermont-Ferrand, France); (c) rammed earth (Birmingham, UK); and (d) limestone (Gioia del Colle, Italy). Dots show average hourly July values of dry-bulb air temperature (orange) and relative humidity (blue) in each climate; weather files are given in Table 3. Dashed lines show values for indoor relative humidity corresponding to walls or roofs of cob (10 cm thick, Figure 10), unfired earth bricks (Cagnon Earth Brick 1, Figure 11), rammed earth (of maximum D, Figure 15 and Figure 16), and fine Apulian limestone (original, Figure 17 and Figure 18). Note that simulations excluded interior latent heat sources (Section 2.4).

Figure 10.
Effect of varying thickness on latent (blue) and sensible (yellow) heat fluxes across exterior and interior surfaces of (a) 5 cm; (b) 10 cm; and (c) 50 cm cob walls, as well as evaporation and condensation within each wall itself, illustrating relative contributions of intrinsic evaporative cooling and thermal mass effects to the delay of heat delivery to interior spaces; note the respective scales. Data show average hourly July values in the west coast marine climate of Nantes, France (Köppen Cfb, Table 3, Figure 9) for south-facing walls of a well-characterized cob [48,49]; ambient humidity was the only source of moisture.

Figure 11.
Variation of moisture retention curve (a) slope and (b) offset in unfired earth bricks, based on the original curve of Cagnon’s Unfired Earth Brick 1 [50]. Effects of these variations on intrinsic evaporative cooling performance are examined in Section 3.4.2 (Figure 12 and Figure 13).
Figure 11.
Variation of moisture retention curve (a) slope and (b) offset in unfired earth bricks, based on the original curve of Cagnon’s Unfired Earth Brick 1 [50]. Effects of these variations on intrinsic evaporative cooling performance are examined in Section 3.4.2 (Figure 12 and Figure 13).

Figure 12.
Effect of varying the slope of the moisture retention curve (Figure 11a) on (a) latent heat flux and (b) moisture content M of unfired earth brick walls, illustrating the impact of on both parameters and its evident importance to intrinsic evaporative cooling. Data show average hourly July values in the marine west coast climate of Clermont-Ferrand, France (Köppen Cfb, Table 3; Figure 9) for south-facing vertical walls; the Original is Cagnon’s Unfired Earth Brick 1 [50]. Ambient humidity was the only source of moisture.

Figure 13.
Effect of varying the absolute value (keeping slope constant) of the moisture retention curve W (Figure 11b) on (a) latent heat flux and (b) moisture content M in unfired earth brick walls, illustrating the relative unimportance of the absolute value of W for , as well as the independence of from M. Data show average hourly July values in the marine west coast climate of Clermont-Ferrand, FR (Köppen Cfb, Table 3; Figure 9) for south-facing walls; the Original is Cagnon’s Unfired Earth Brick 1 [50]. Ambient humidity was the only source of moisture.

Figure 14.
Rammed earth properties, as well as those of the three different Apulian limestones discussed below, used in the estimation of intrinsic evaporative cooling behavior: (a) moisture retention curves W and (b) vapor diffusion resistance factors μ. Rammed earth properties follow [51,52,53], with W obtained from (Allinson and Hall [51], Figure 4), and μ from Equation (8) using . Limestone properties follow [54,55,56] with W for each sample obtained by scaling data for tuffeau limestone reported in [56] (Figure 7) using the estimated ratio of specific surface areas obtained using the pore size distributions for Apulian limestone reported by Andriani and Walsh [55] (Figure 8), and μ calculated from Equation (8) using n = 48%, 49%, and 44%, for the fine, medium, and coarse limestones, respectively.

Figure 15.
Liquid transport coefficient D used in Equation (2), plotted as a function of moisture content W. Effects of varying these liquid transport properties are examined in Section 3.5.2 (Figure 16).
Figure 15.
Liquid transport coefficient D used in Equation (2), plotted as a function of moisture content W. Effects of varying these liquid transport properties are examined in Section 3.5.2 (Figure 16).

Figure 16.
Effect of varying the liquid transport coefficient D (Figure 15) on (a) latent heat flux and (b) wall moisture content M in rammed earth walls, illustrating the relative unimportance of D to both and M under the conditions investigated, and its resulting apparent insignificance for intrinsic evaporative cooling. Data show average hourly July values in the marine west-coast climate of Birmingham, UK (Köppen Cfb, Figure 9, Table 3) for south-facing walls of well-characterized rammed earth [51,52,53]. Ambient humidity was the only source of moisture.

Figure 17.
Vapor diffusion resistance factors μ estimated for Apulian limestone, as a function of relative humidity, examined in Section 3.6.2 for effects on intrinsic evaporative cooling (Figure 18).
Figure 17.
Vapor diffusion resistance factors μ estimated for Apulian limestone, as a function of relative humidity, examined in Section 3.6.2 for effects on intrinsic evaporative cooling (Figure 18).

Figure 18.
Effect of varying the vapor diffusion resistance factor μ (Figure 17) on (a) latent heat flux and (b) moisture content M in Apulian limestone, illustrating the marked effect of μ on , but relative lack of consequence for M. Data show average hourly July values in the humid subtropical climate of Gioia del Colle, Italy (Köppen Cfa, Table 3; Figure 9) for the south-facing panels of beehive-shaped roofs; the Original is the fine-grained Apulian limestone of Andriani and Walsh [55]. Ambient humidity was the only source of moisture.


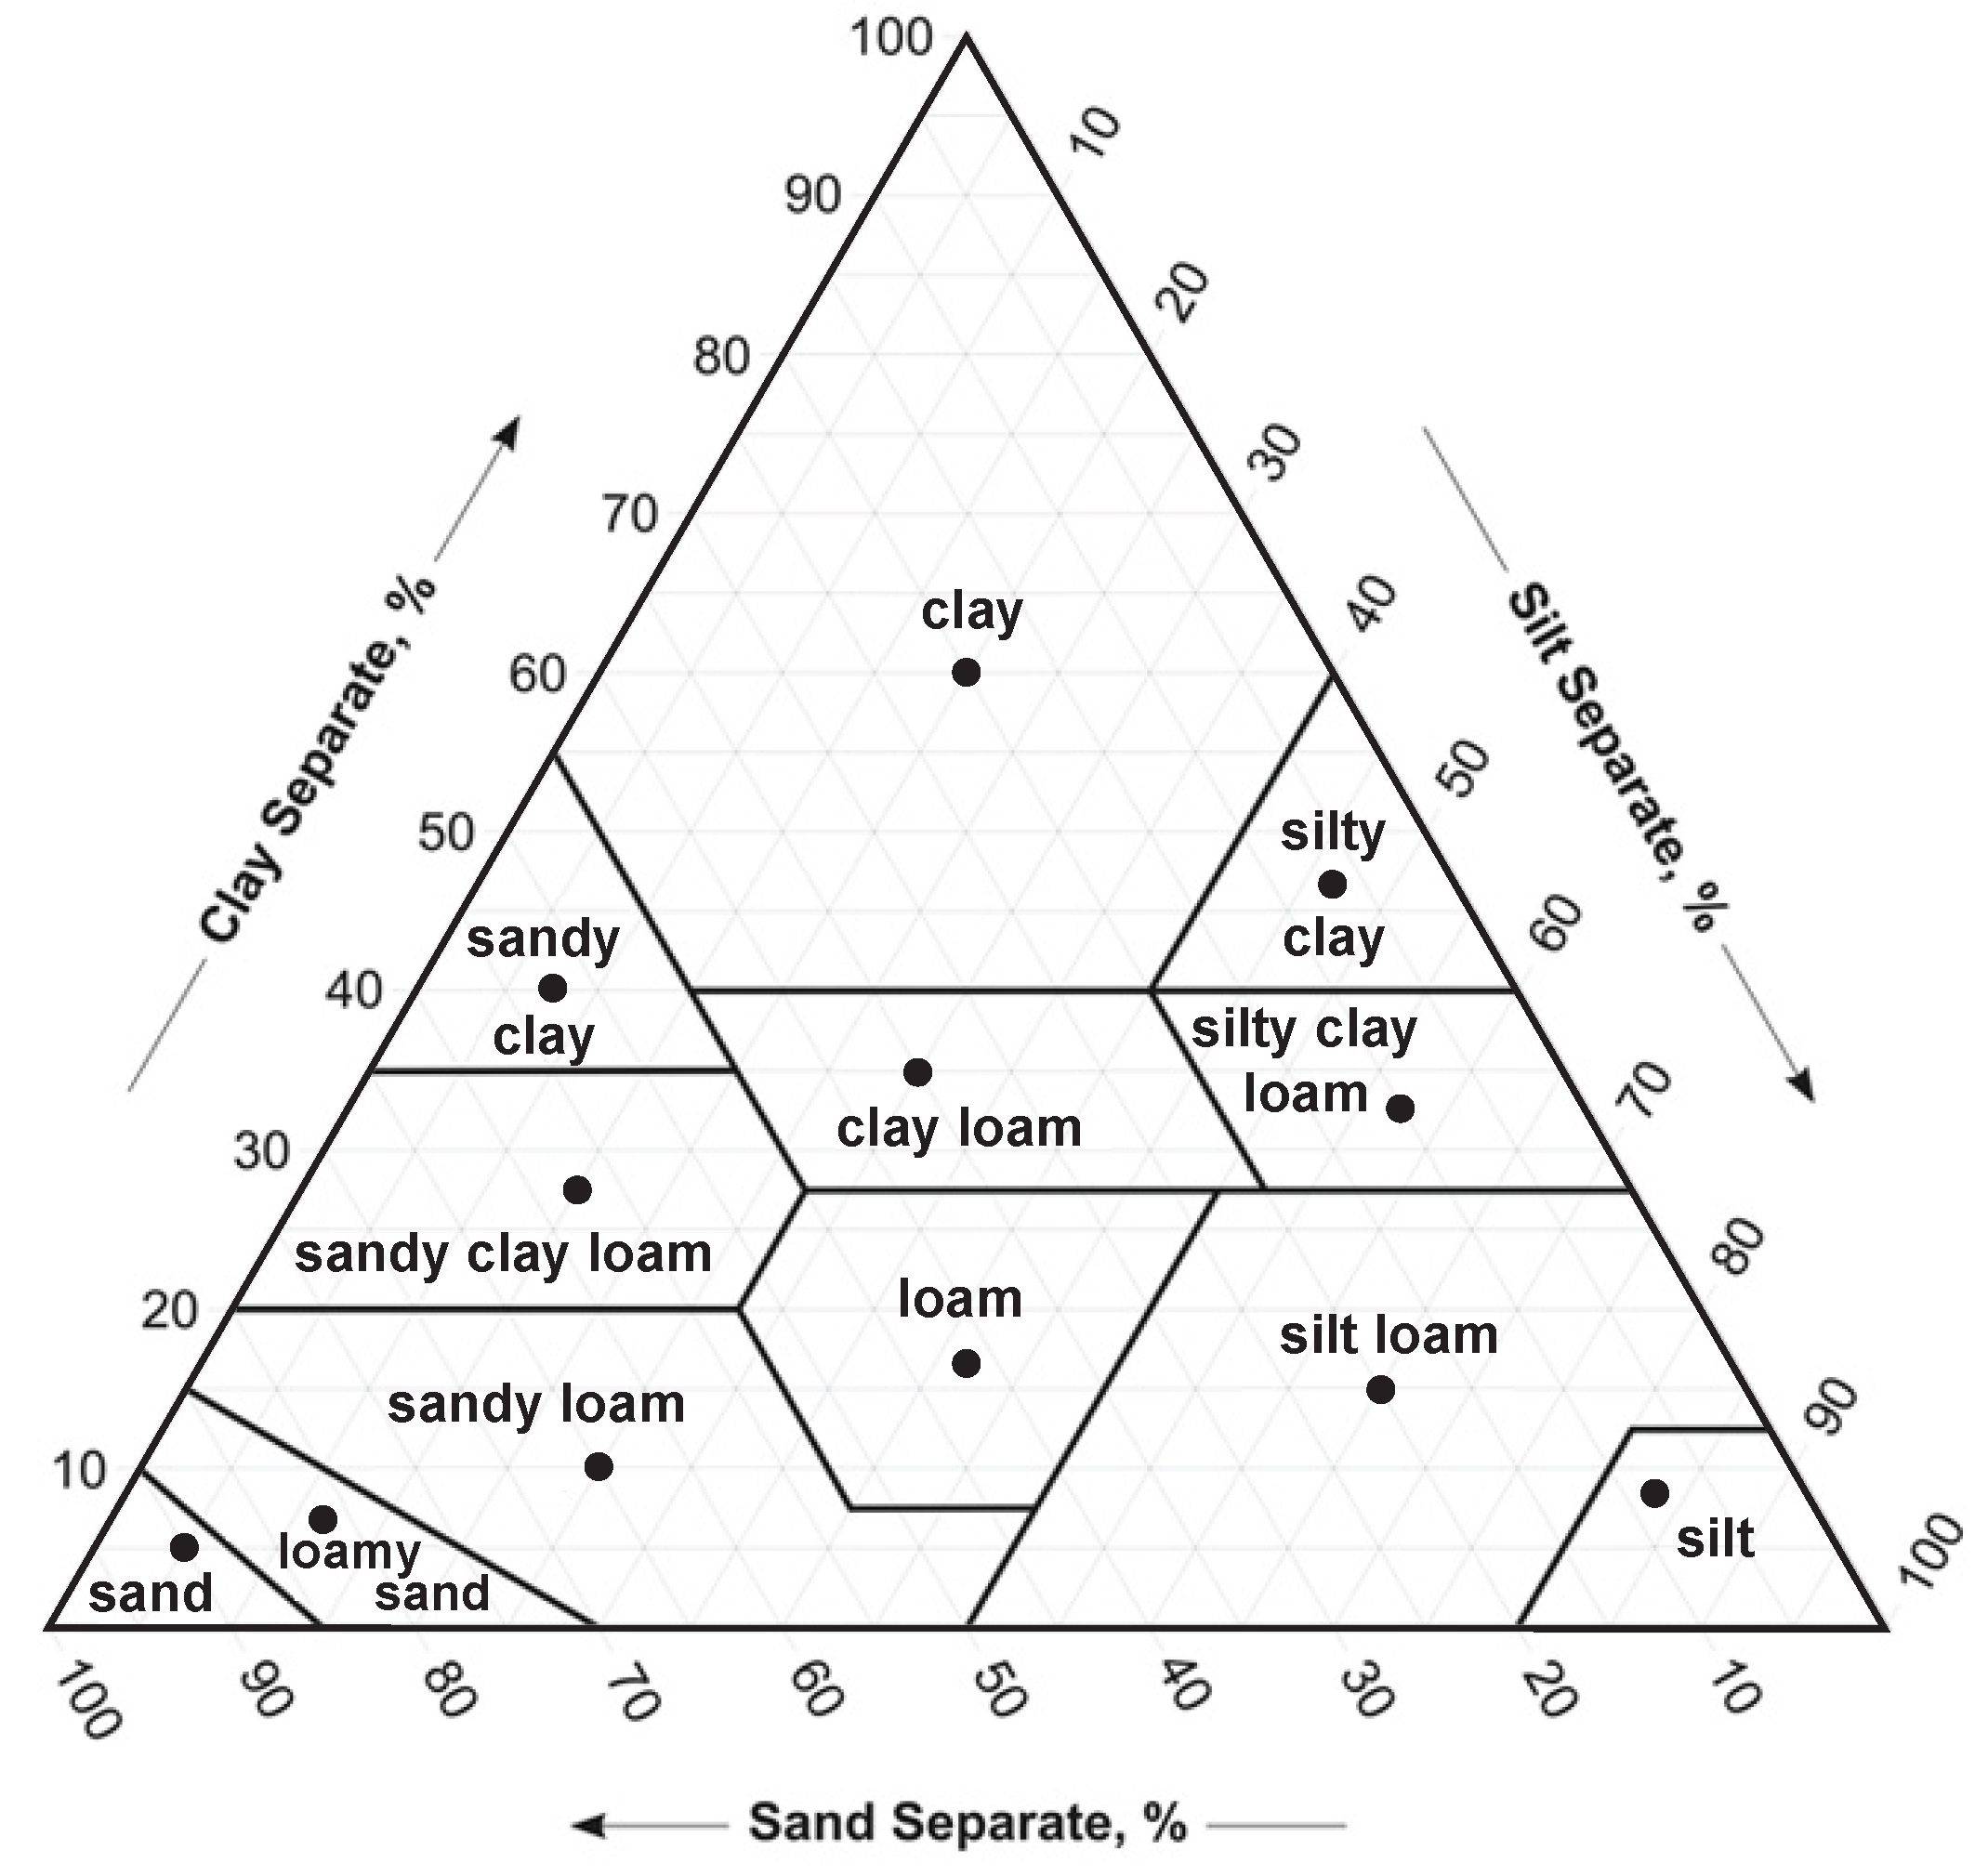
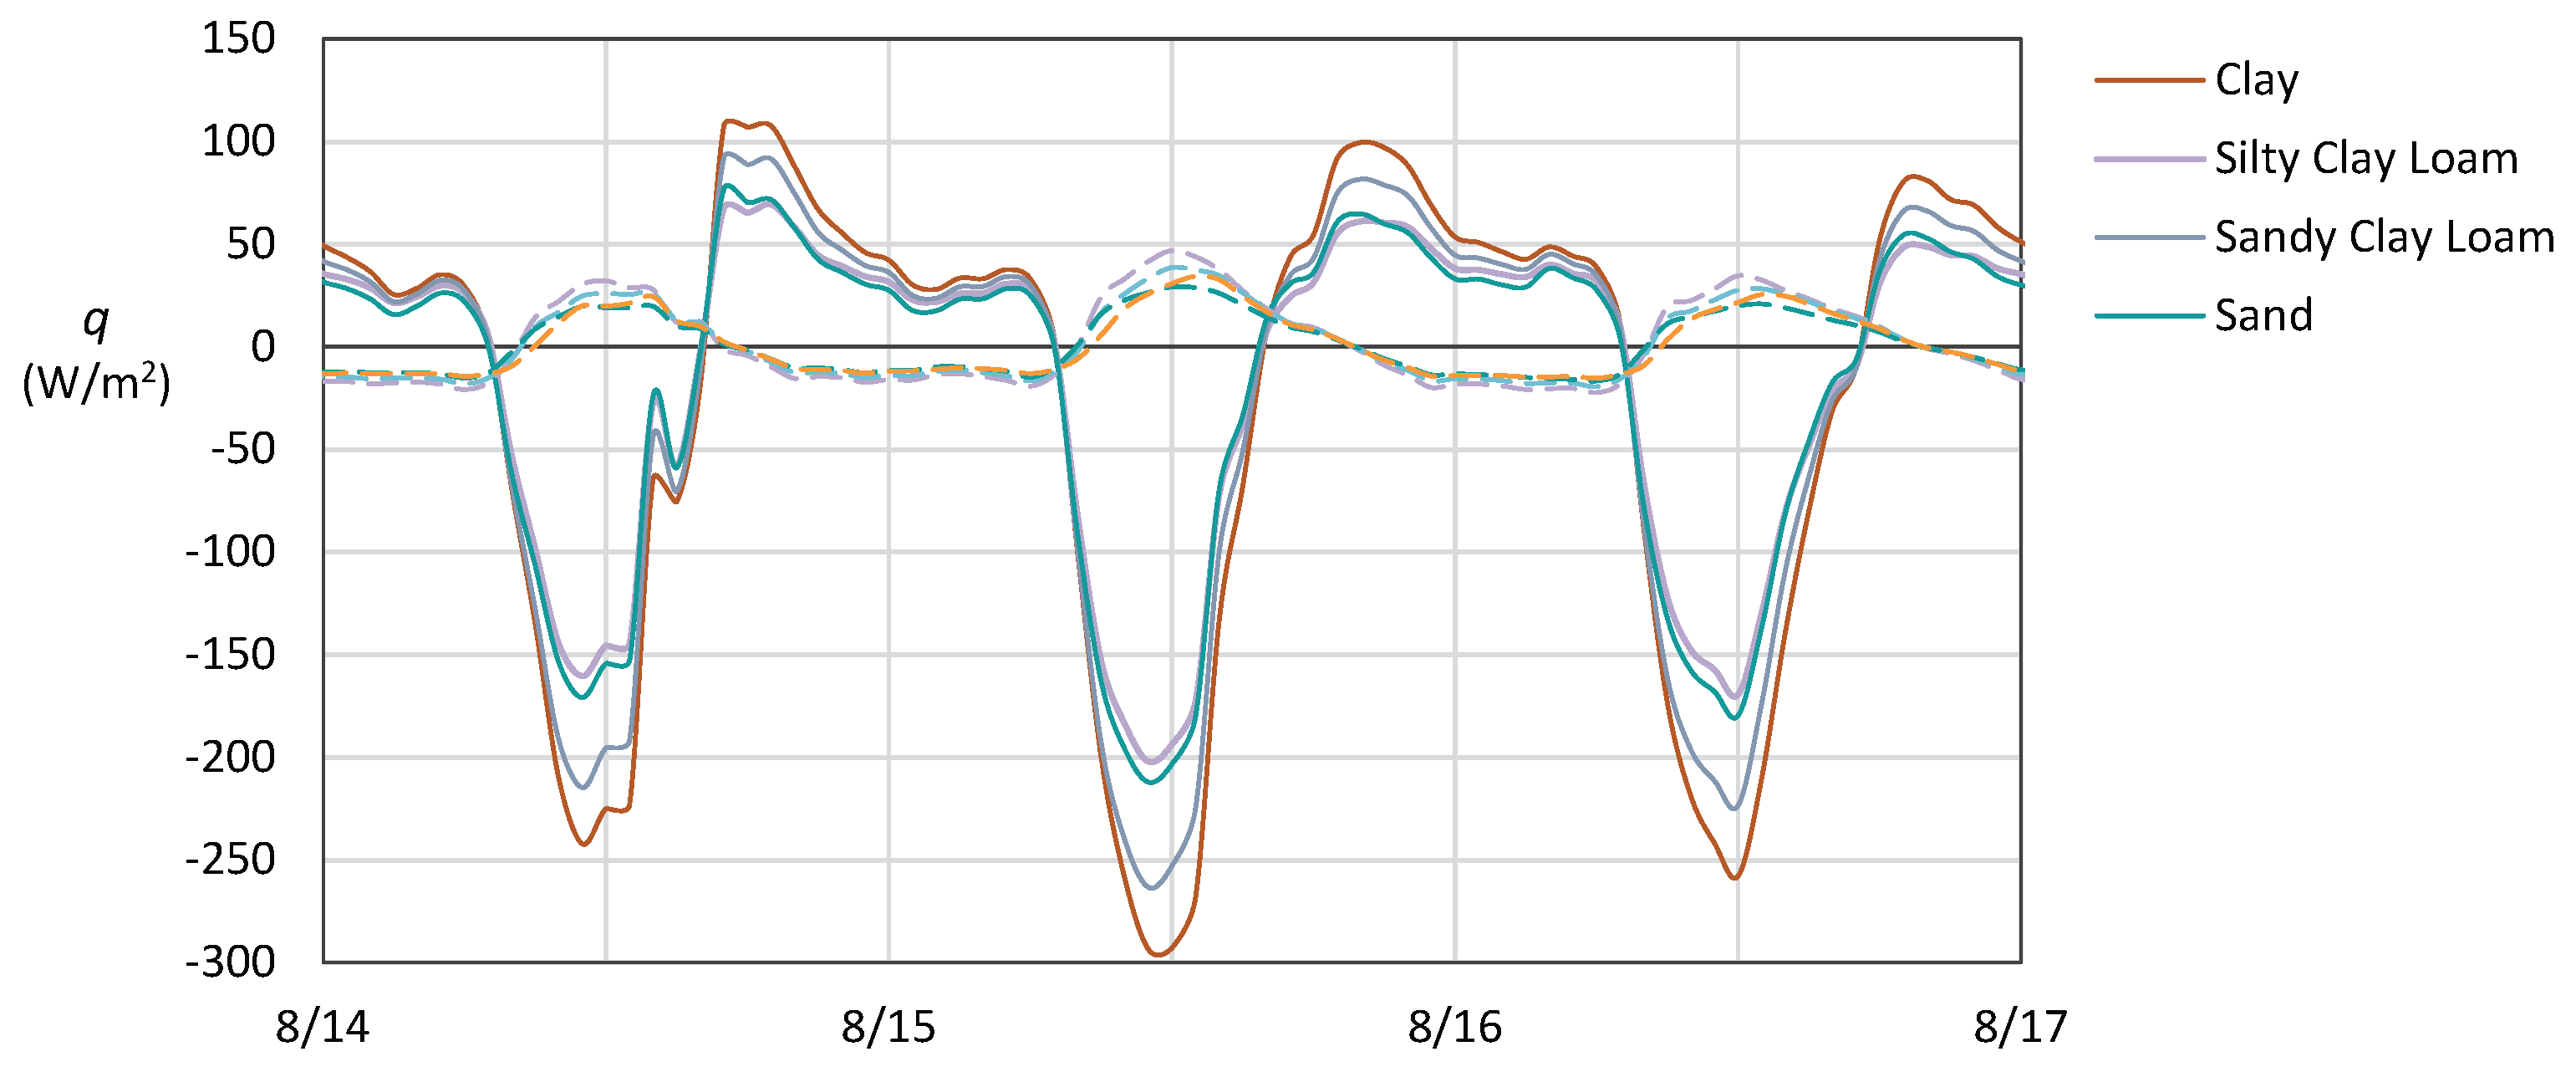
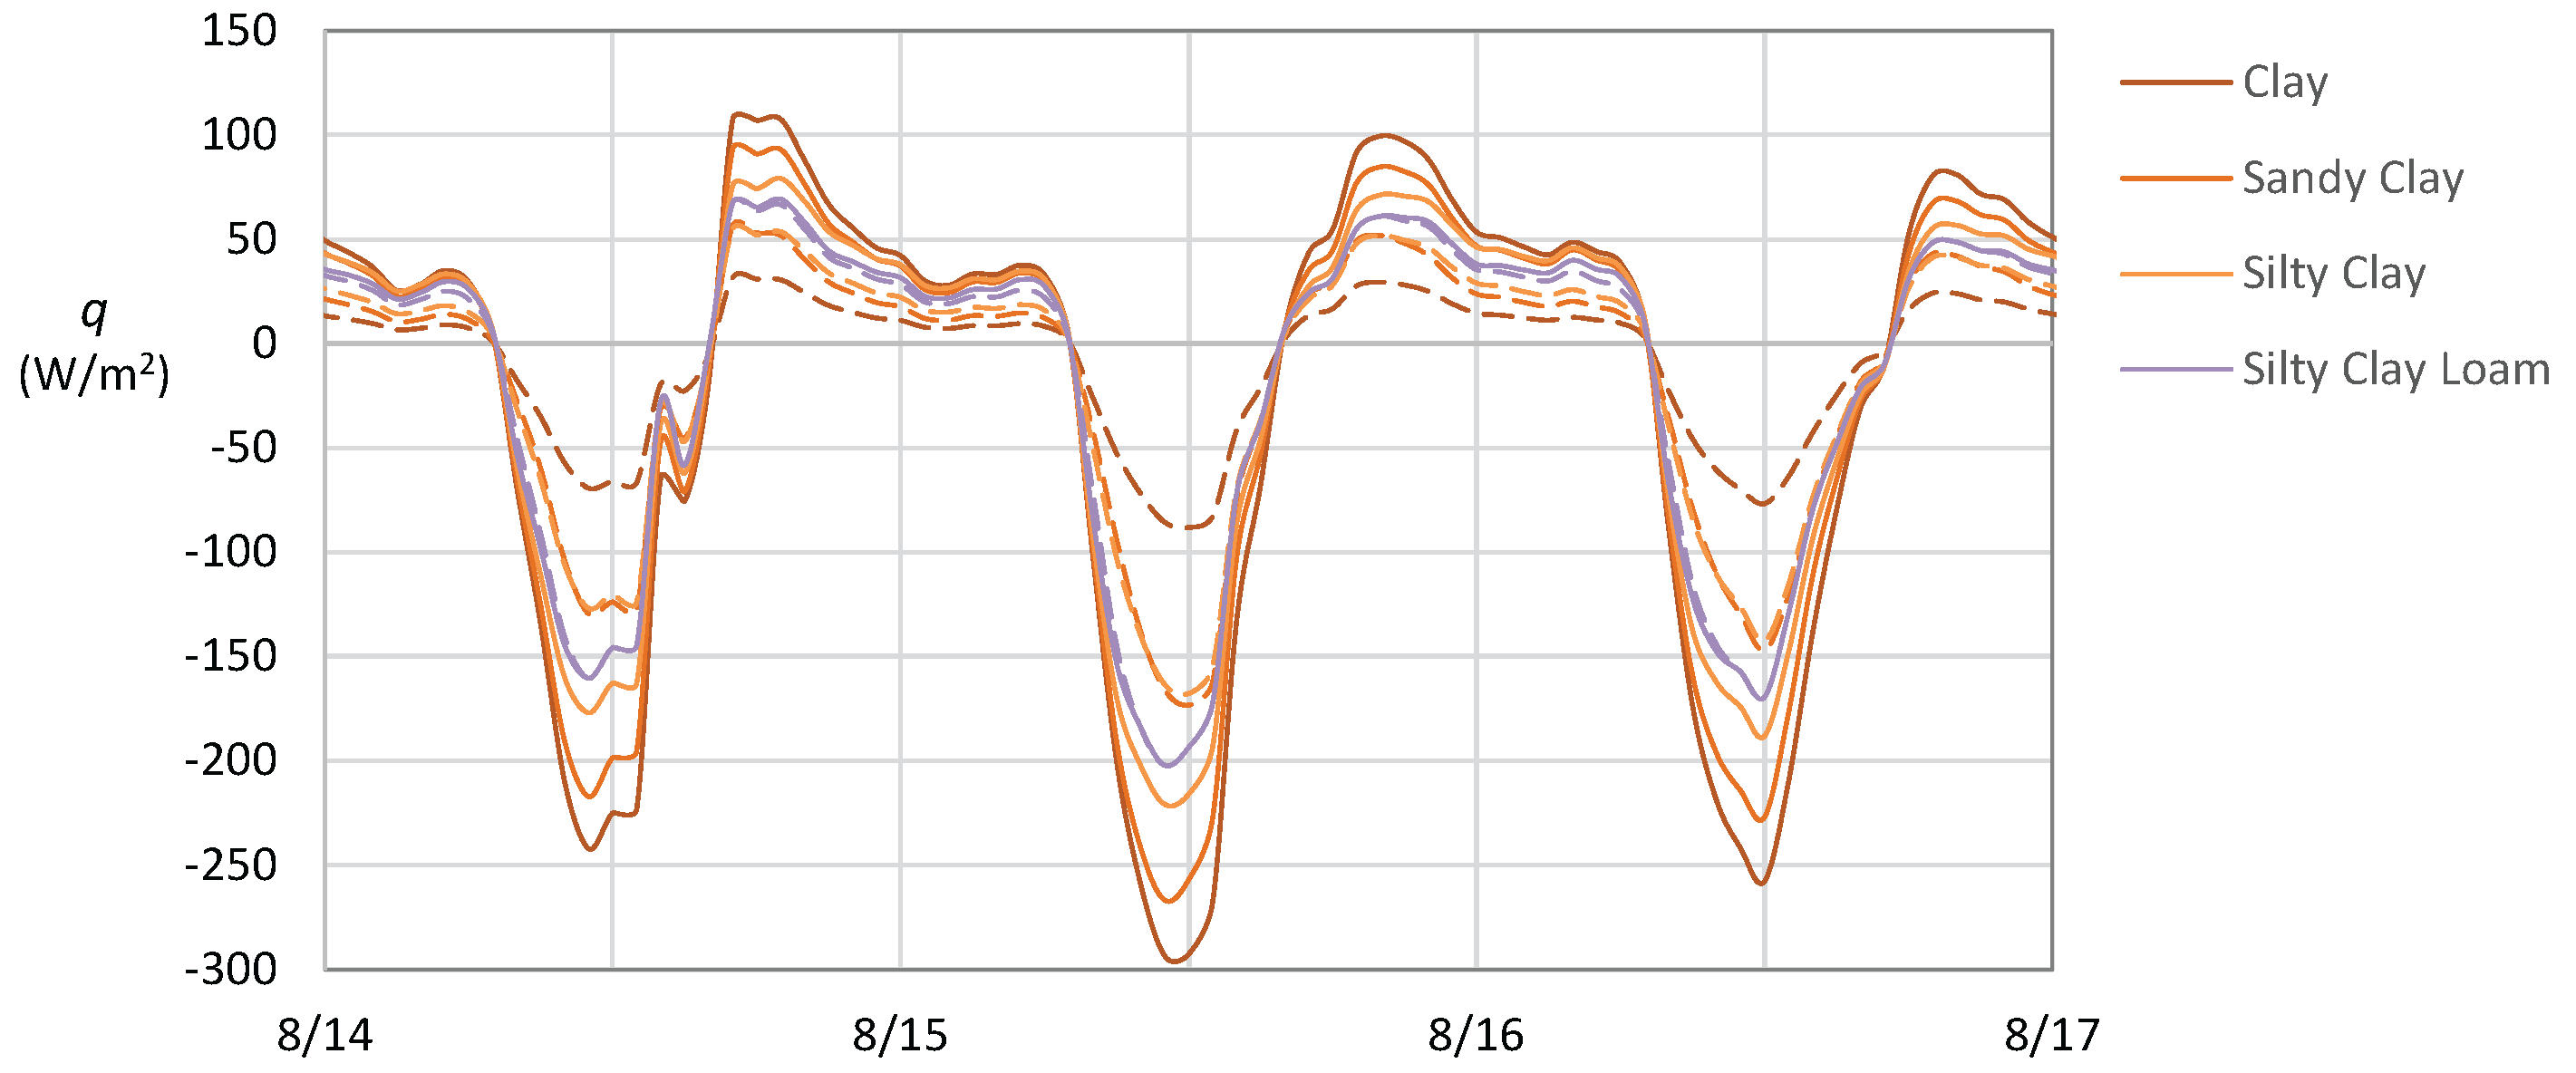
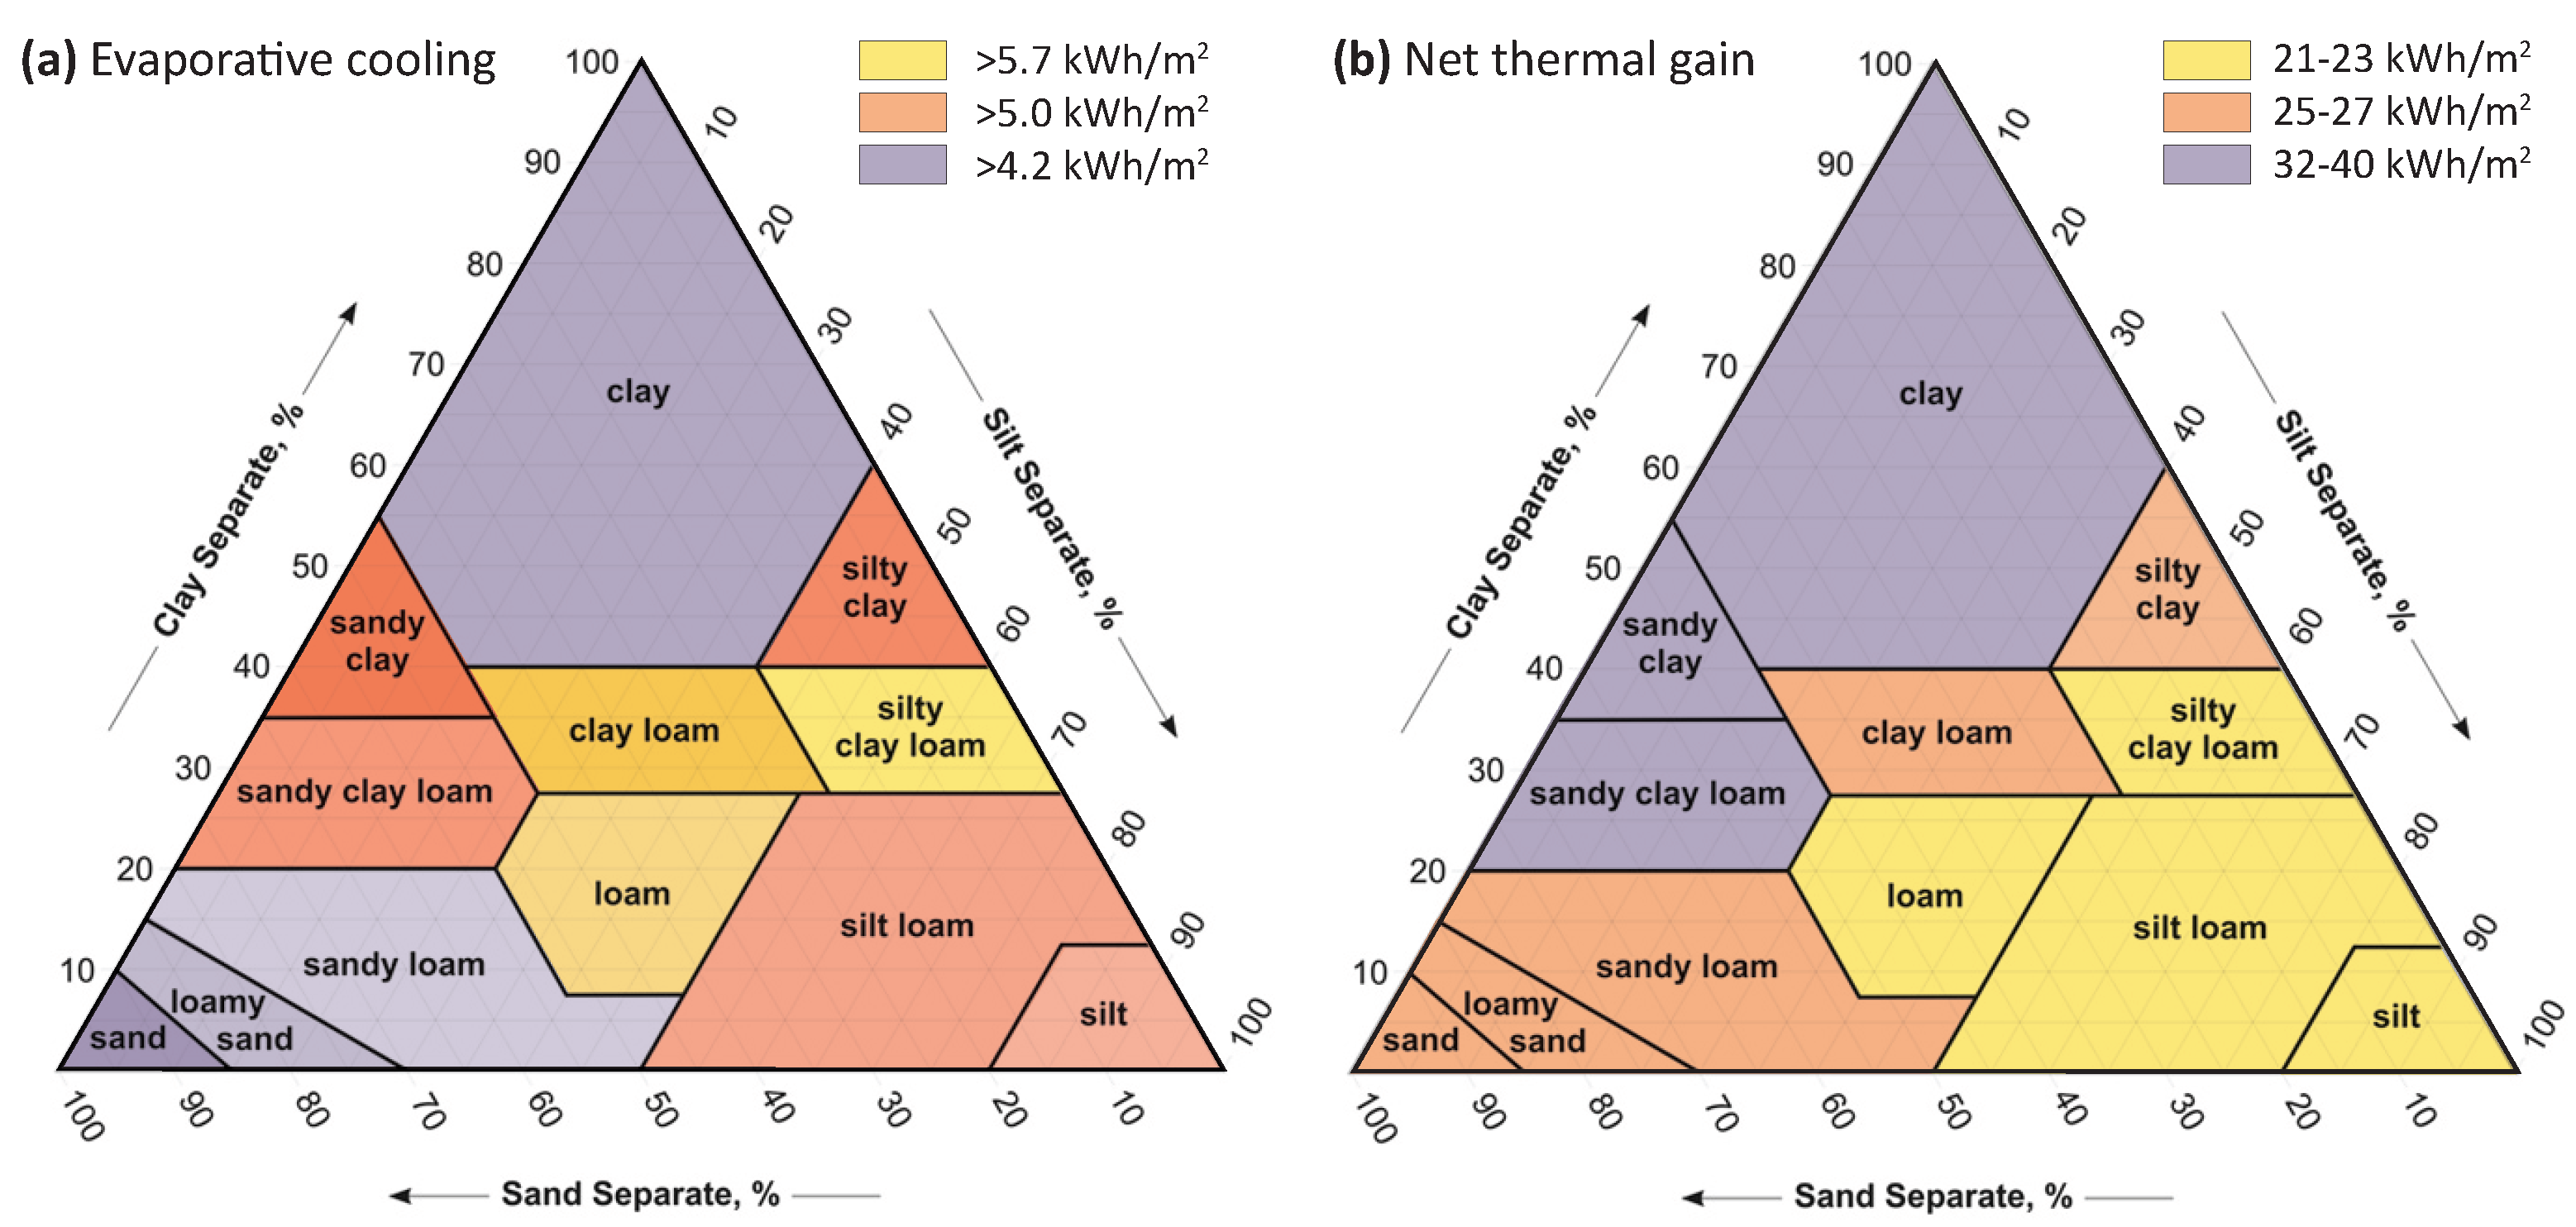
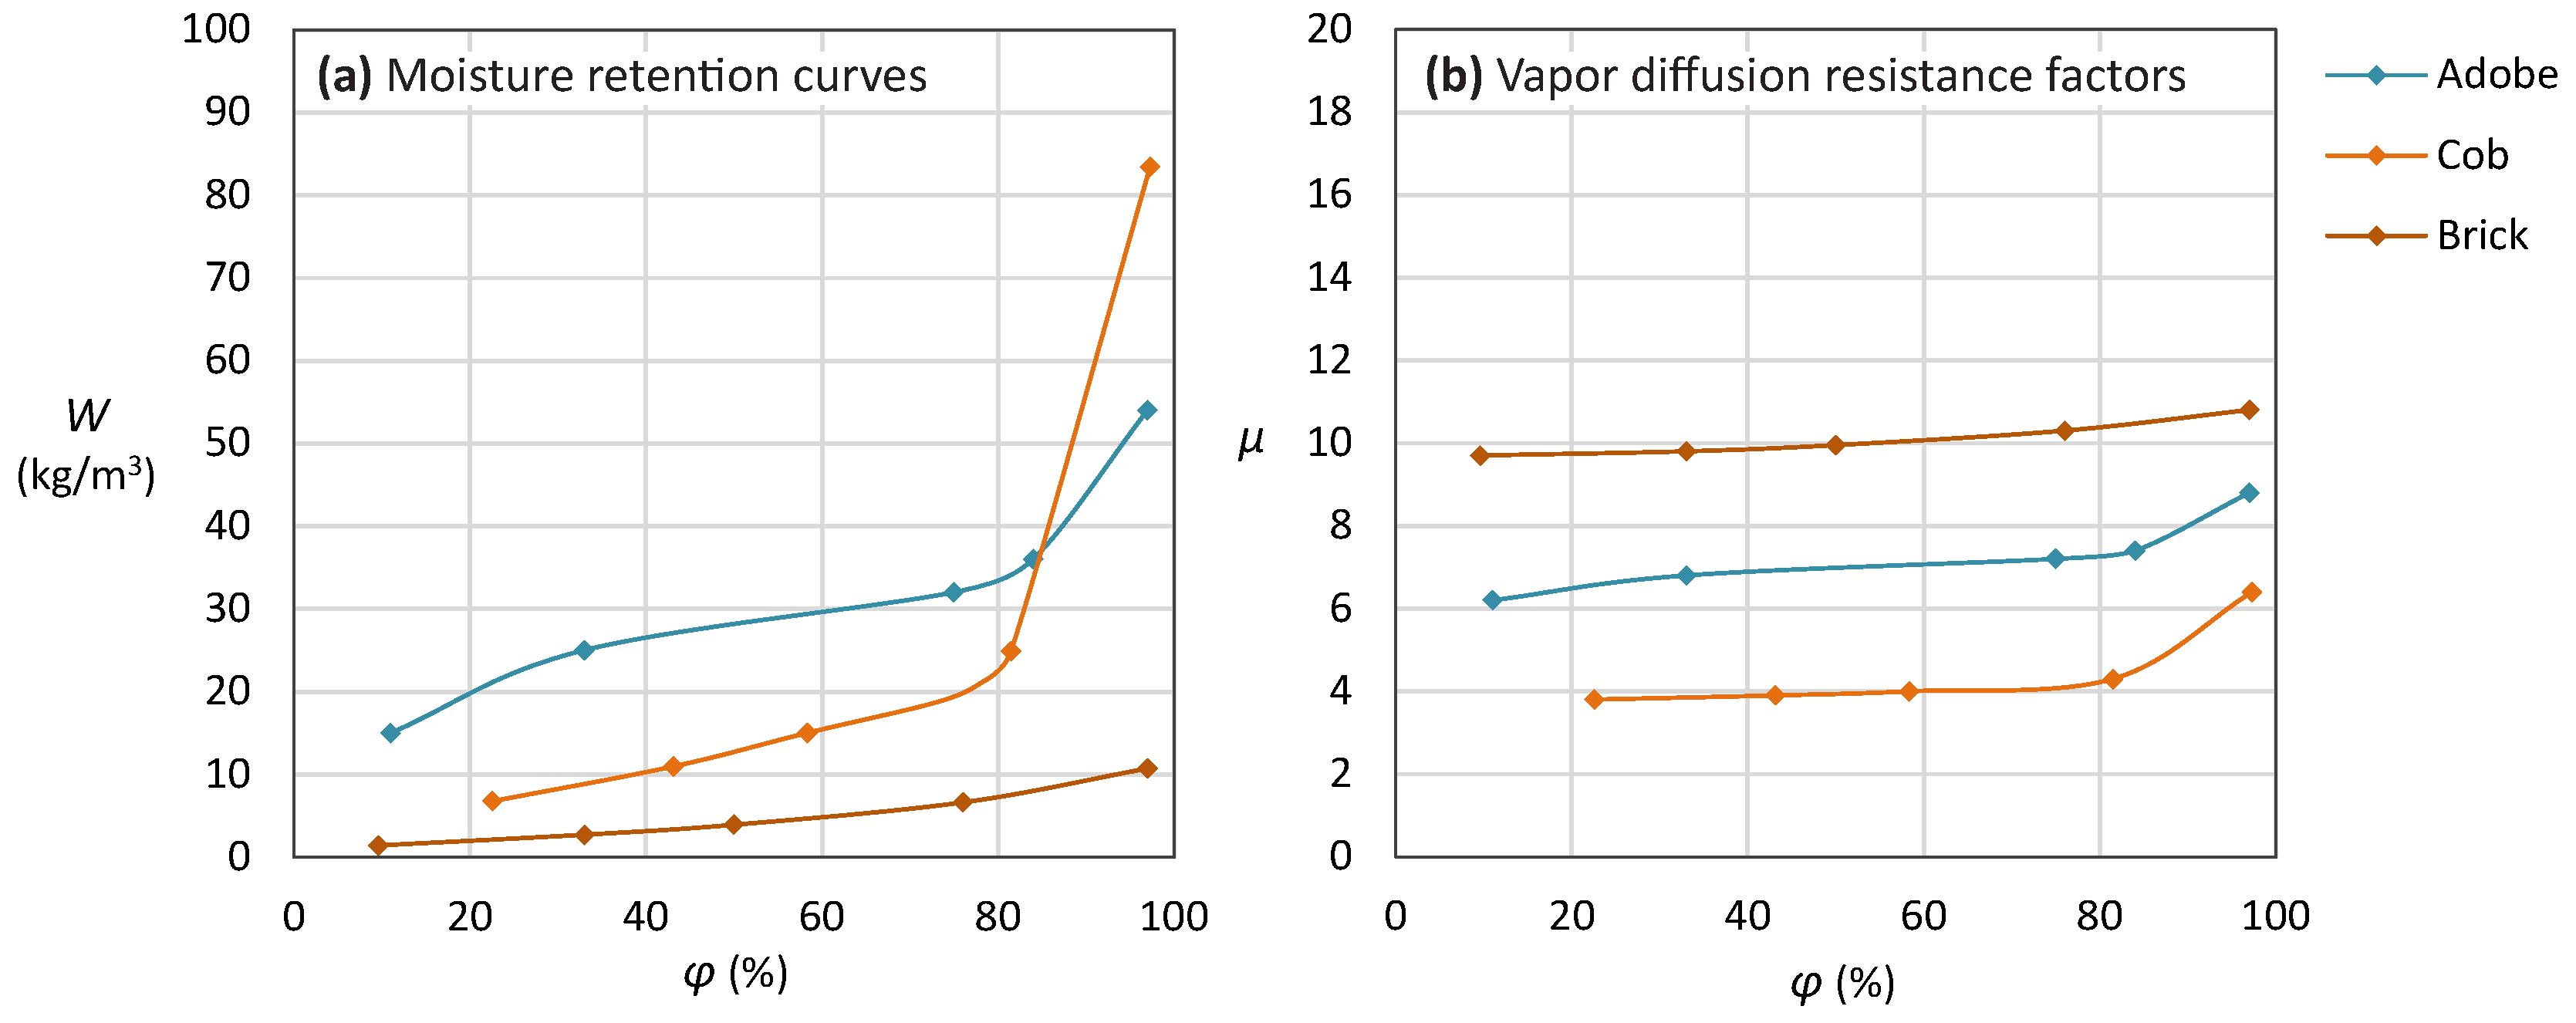
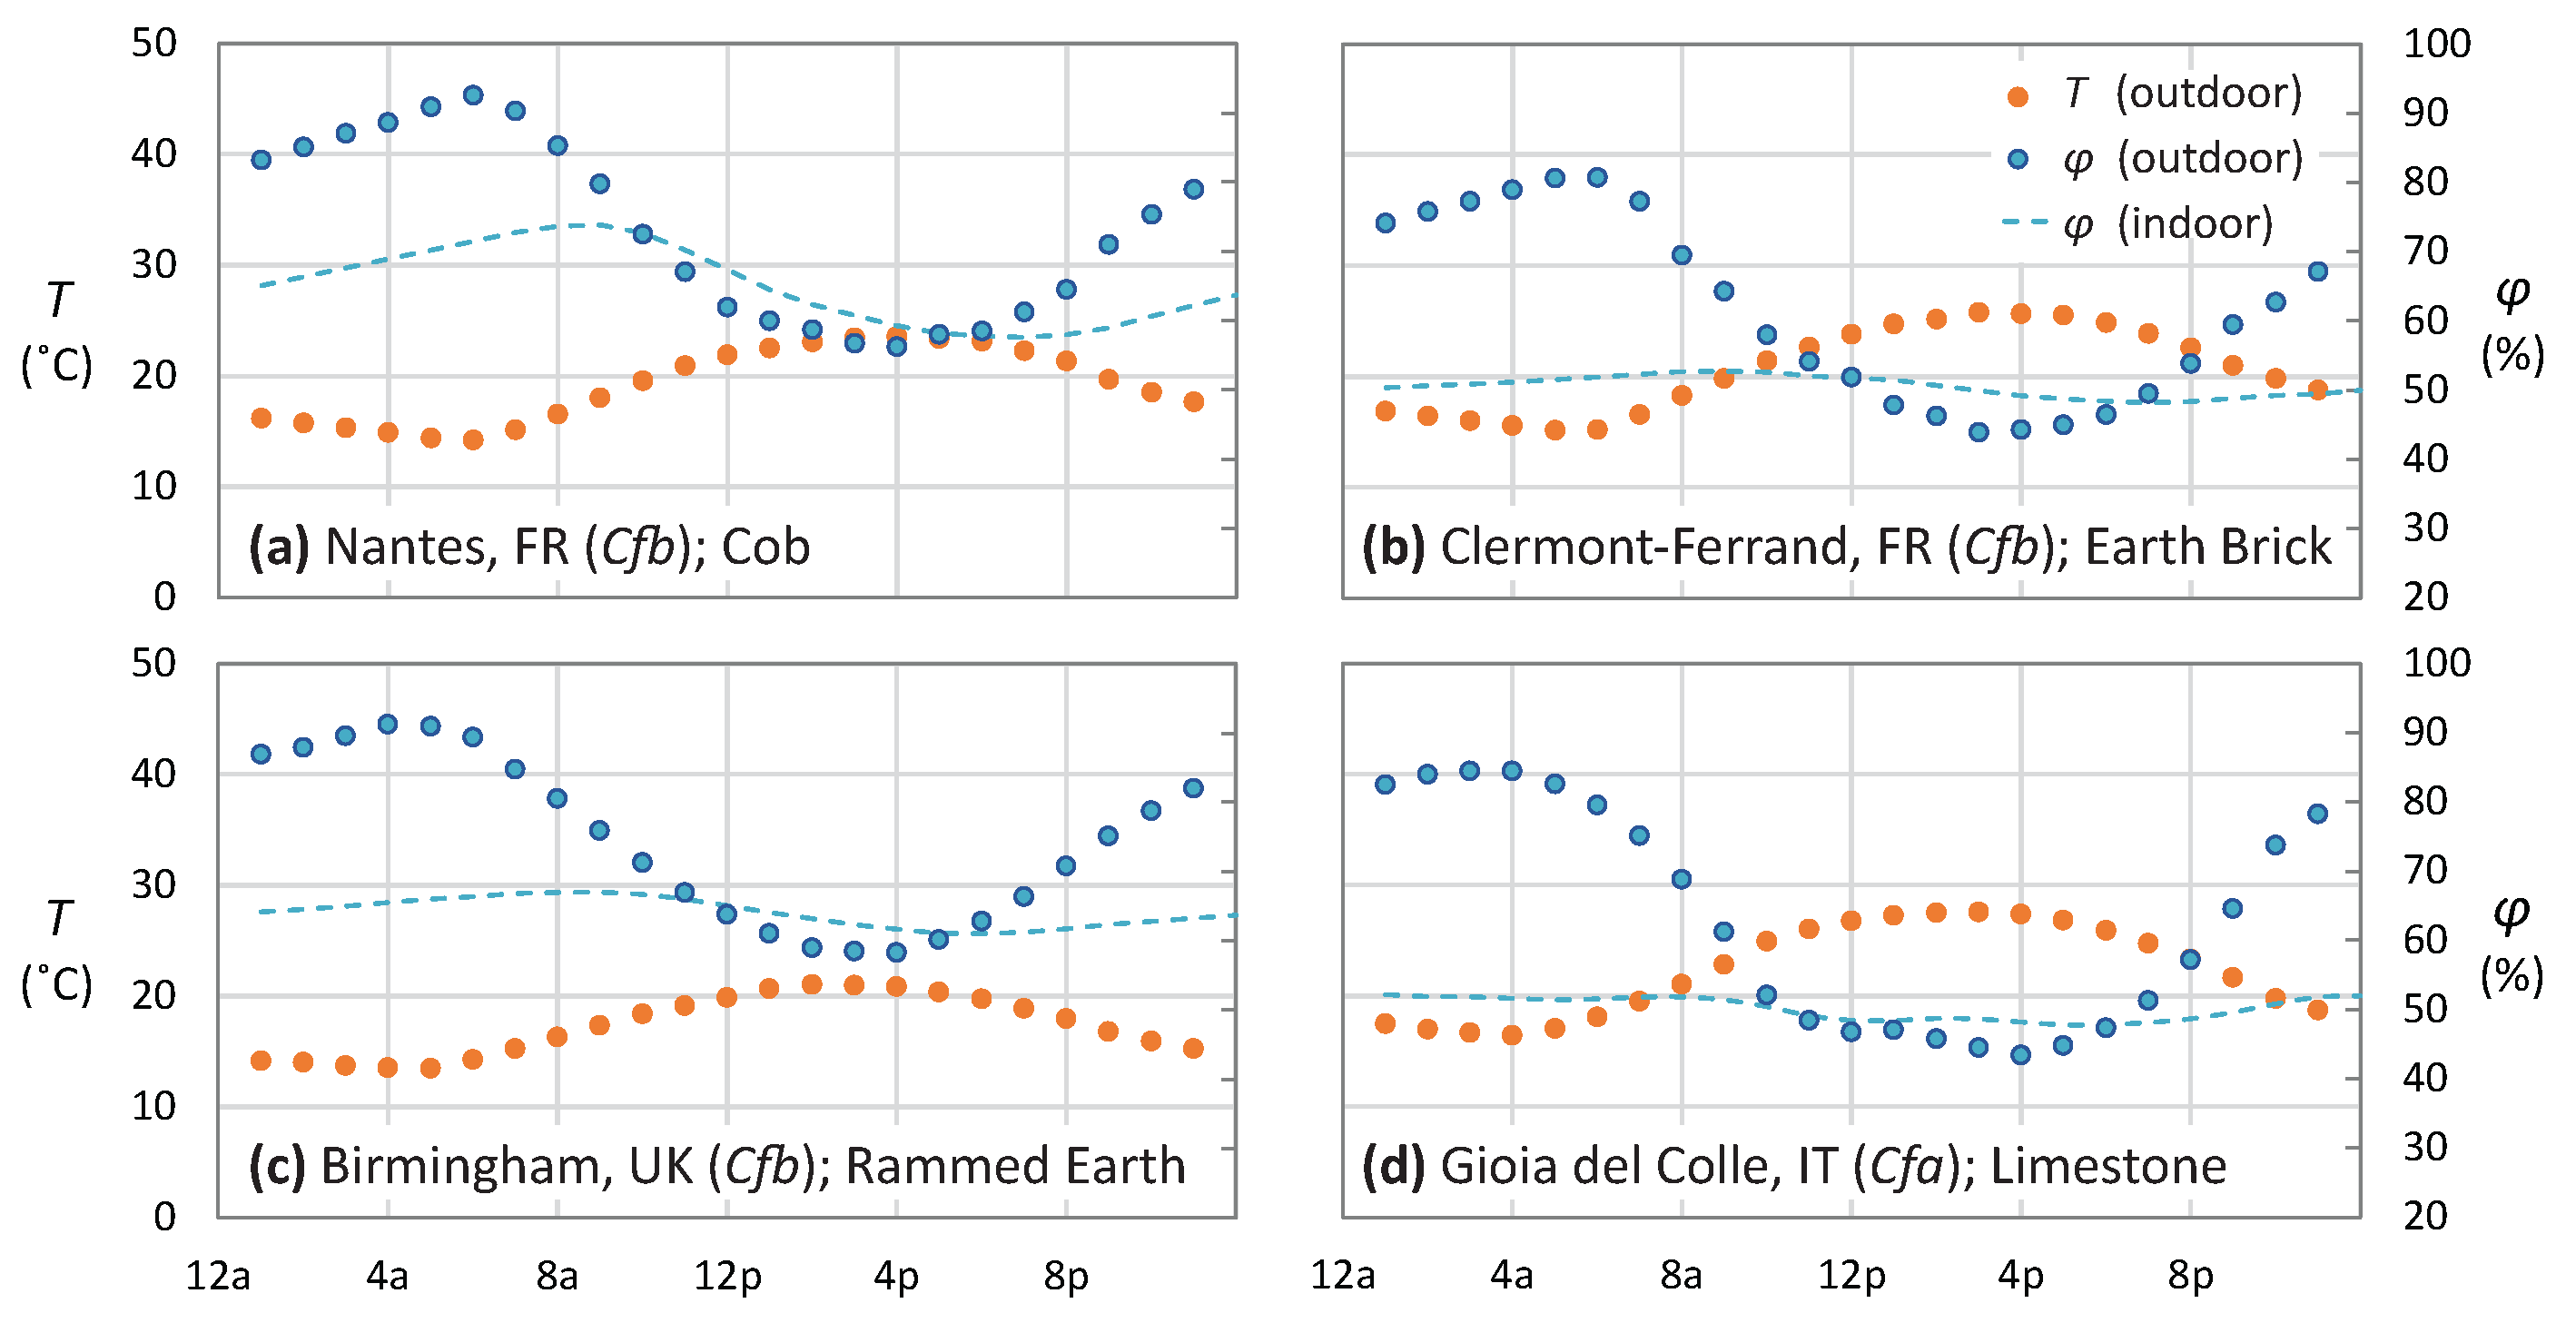
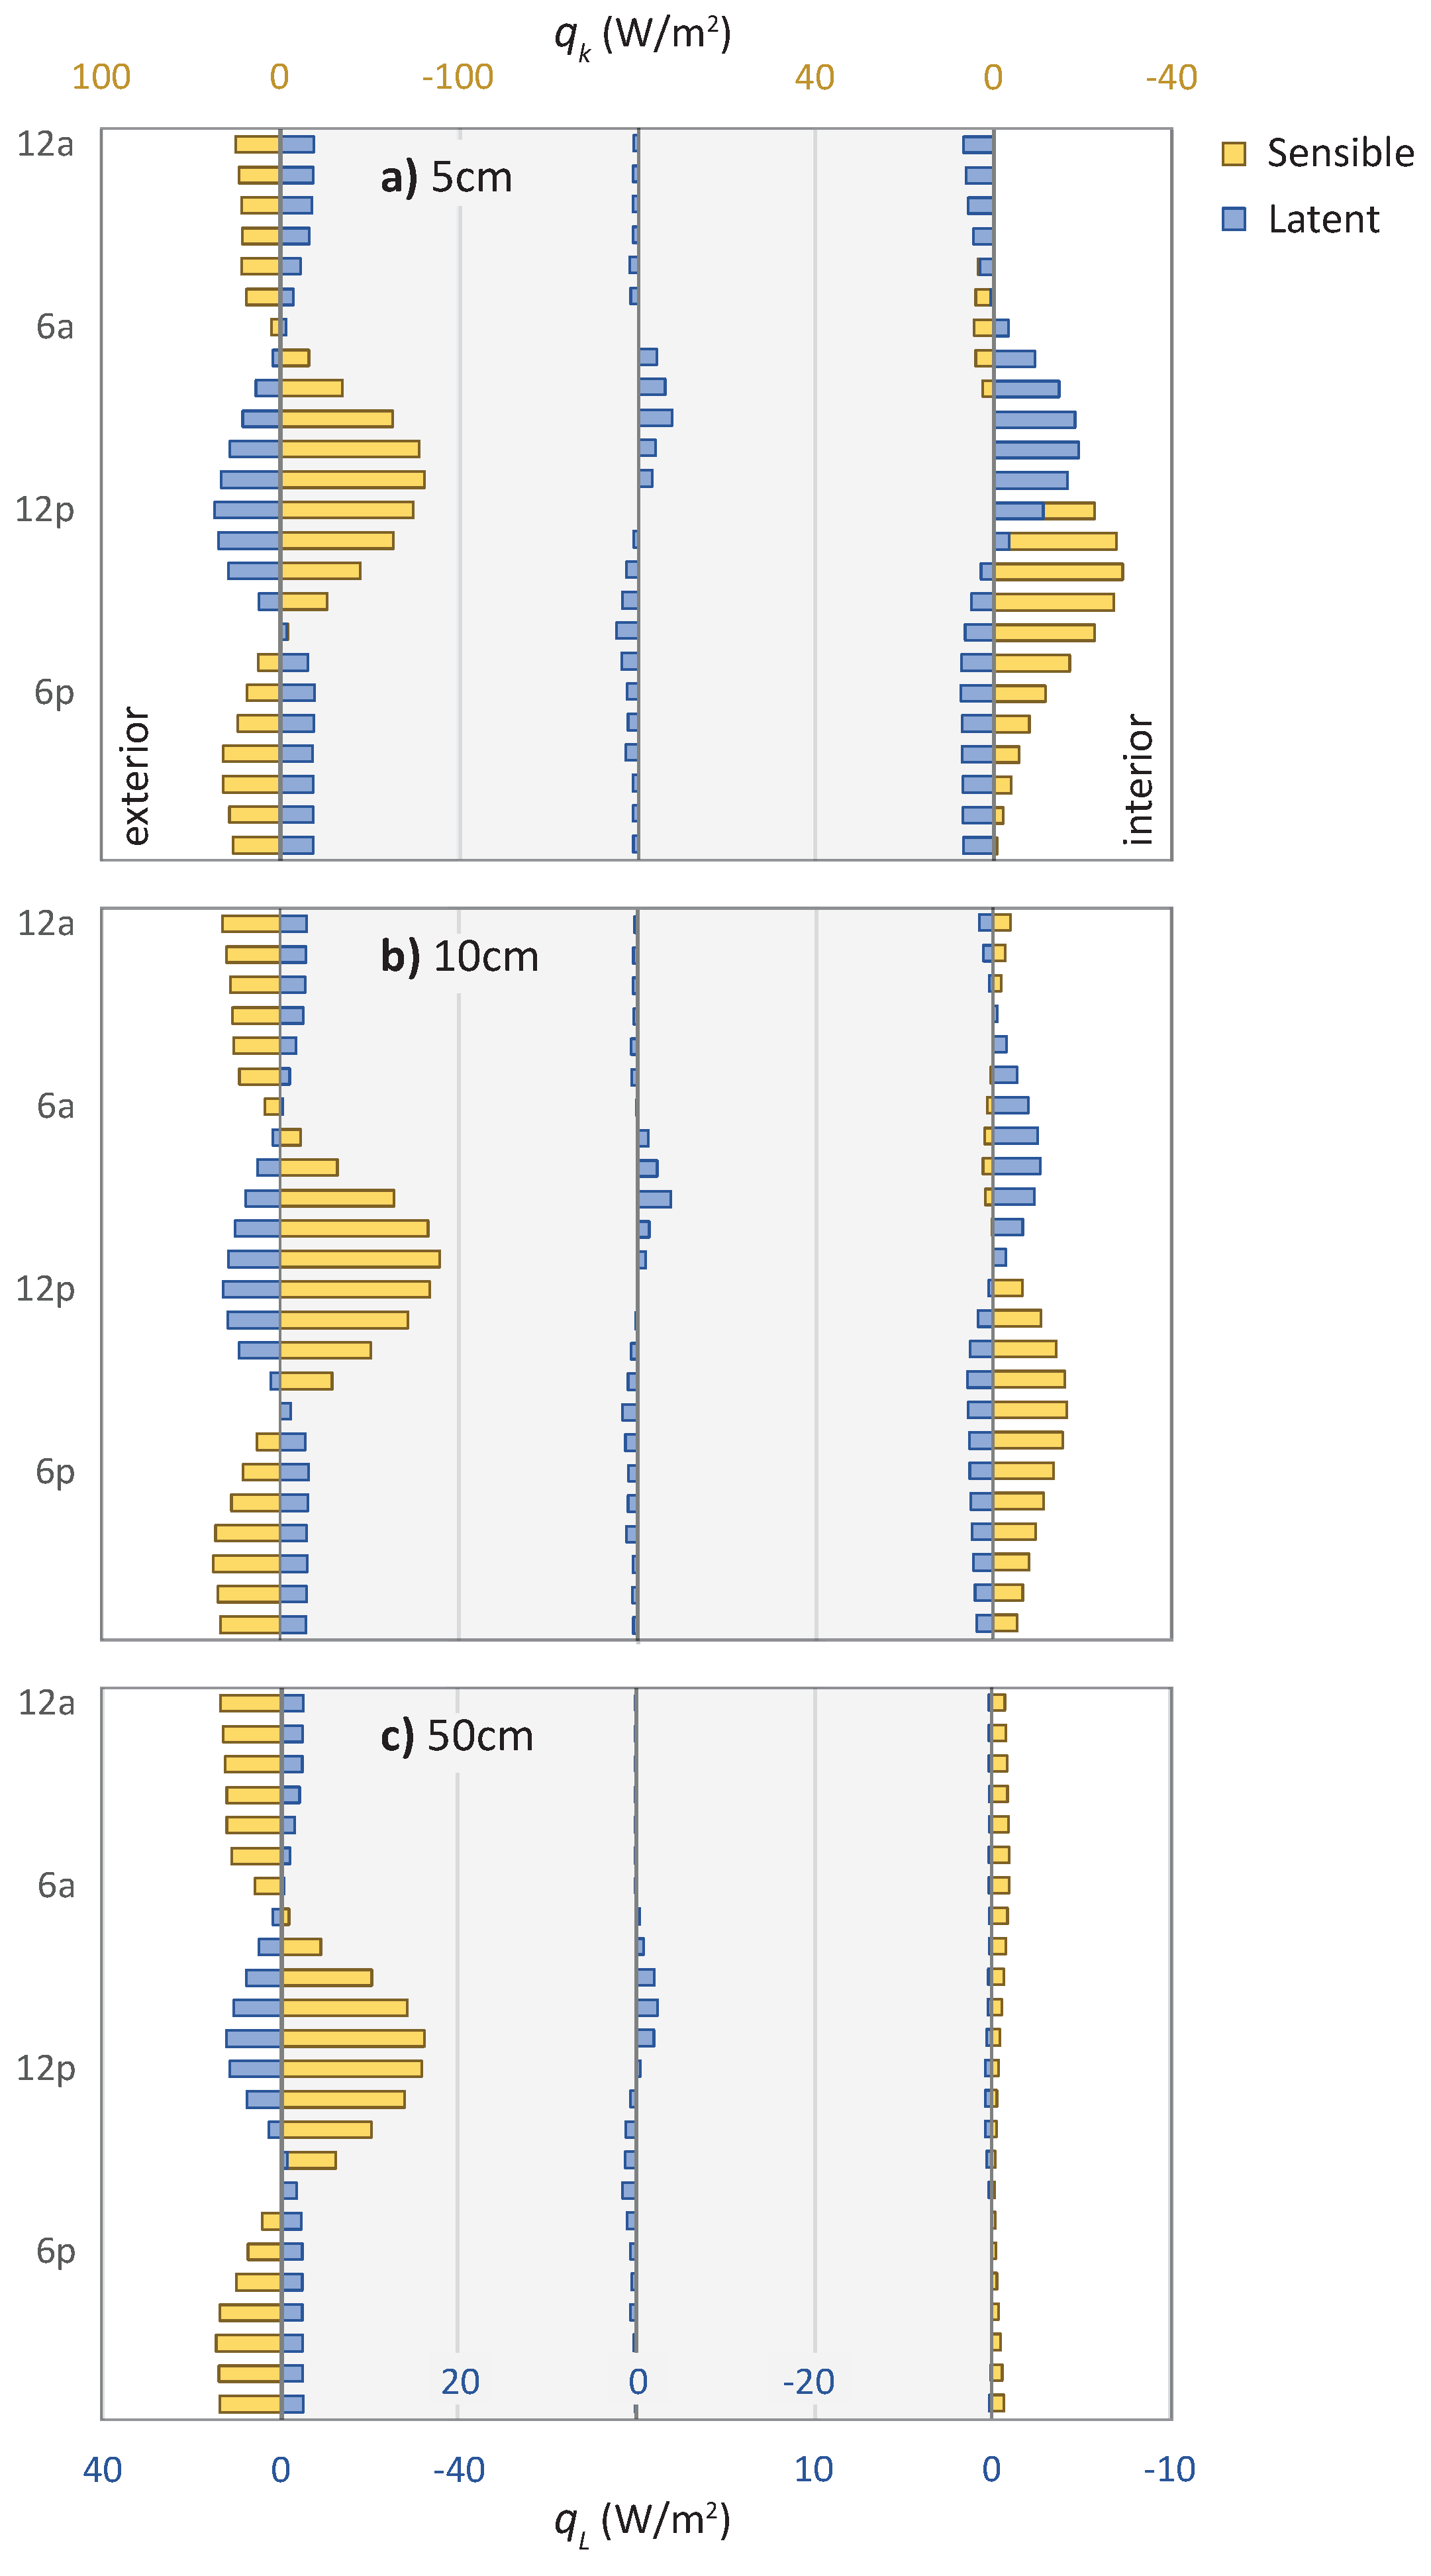
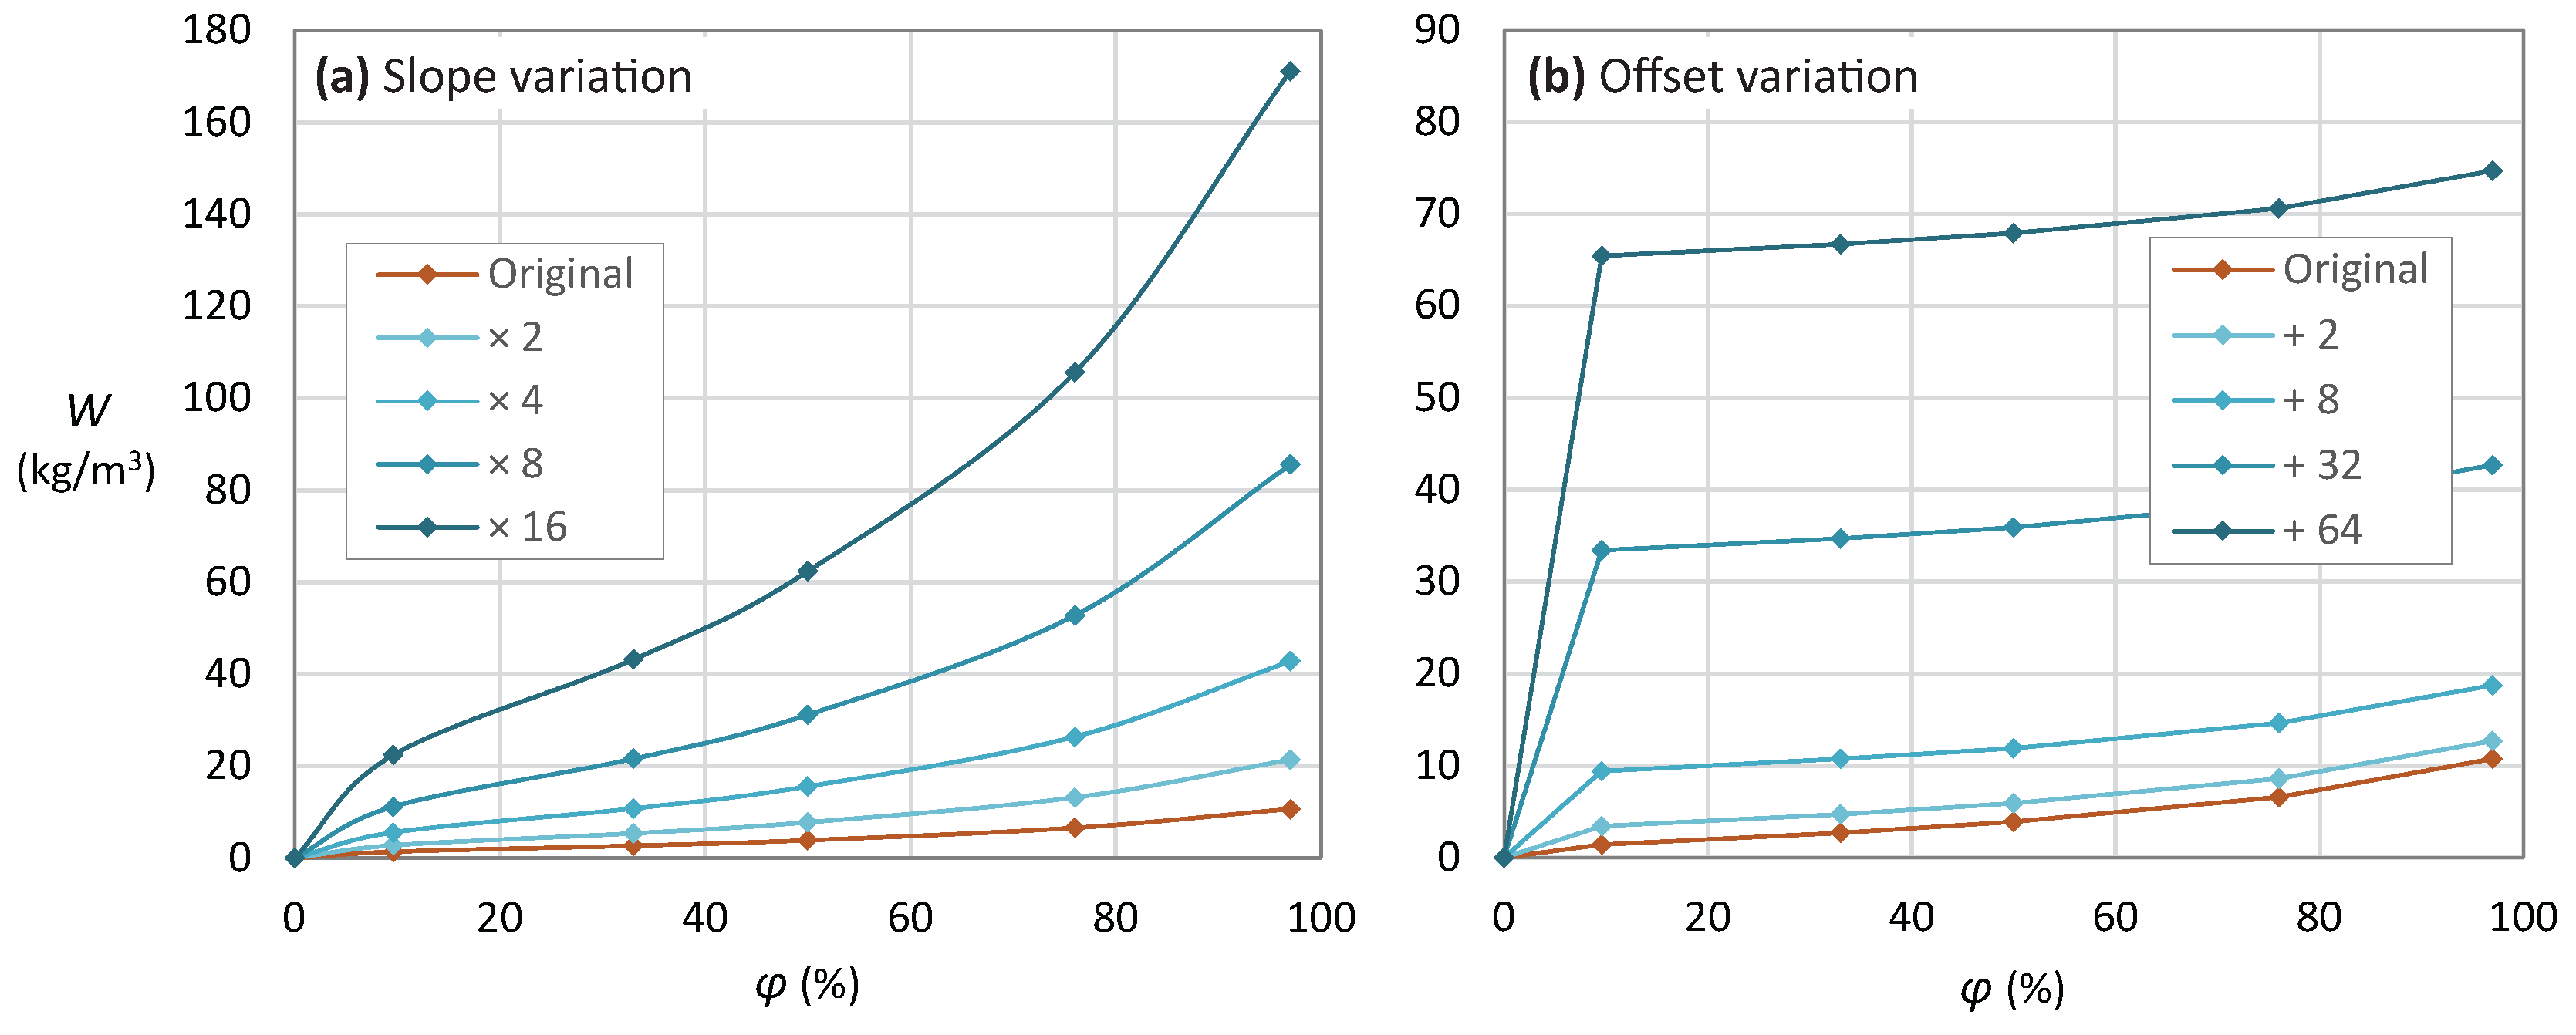
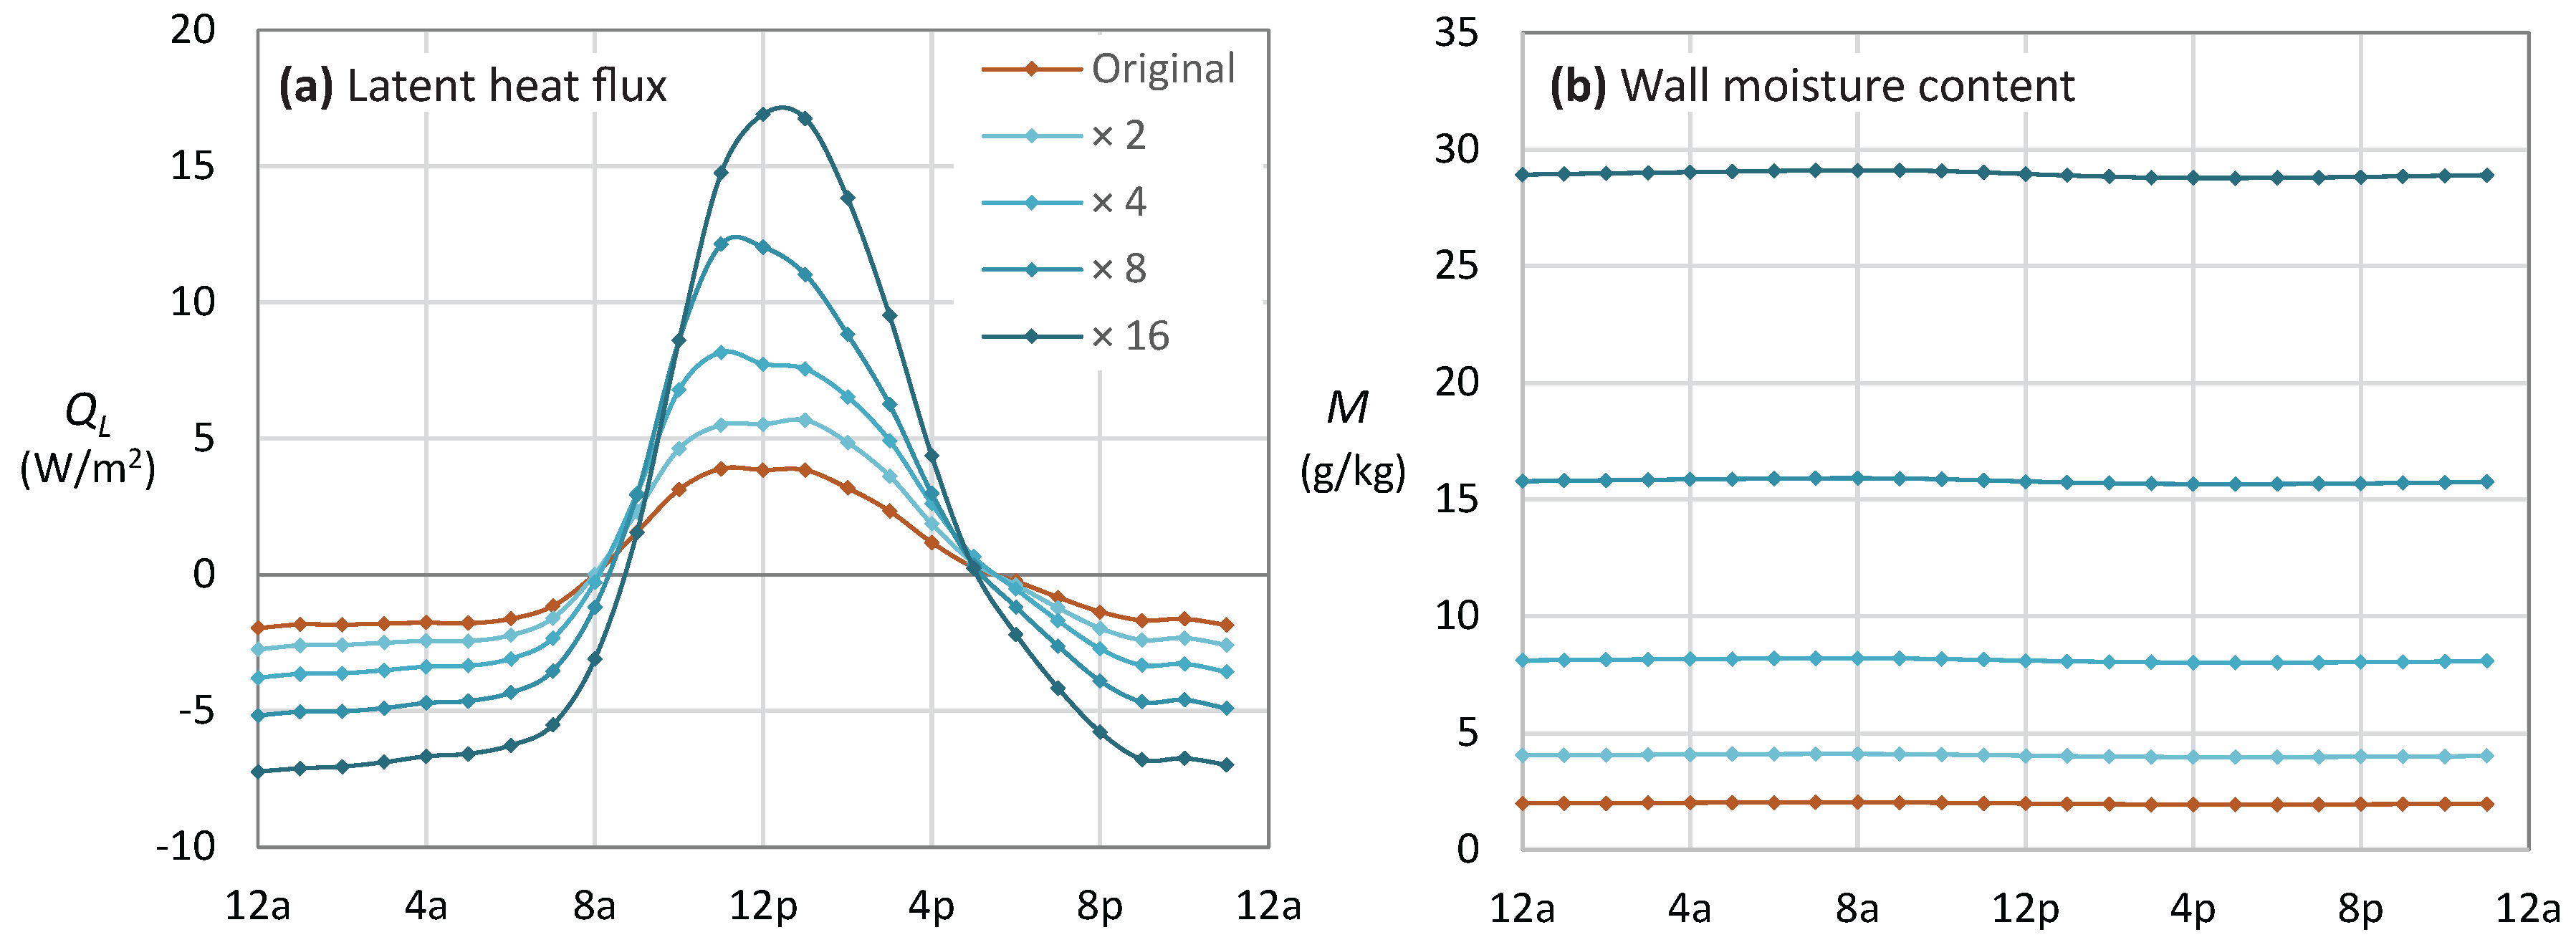
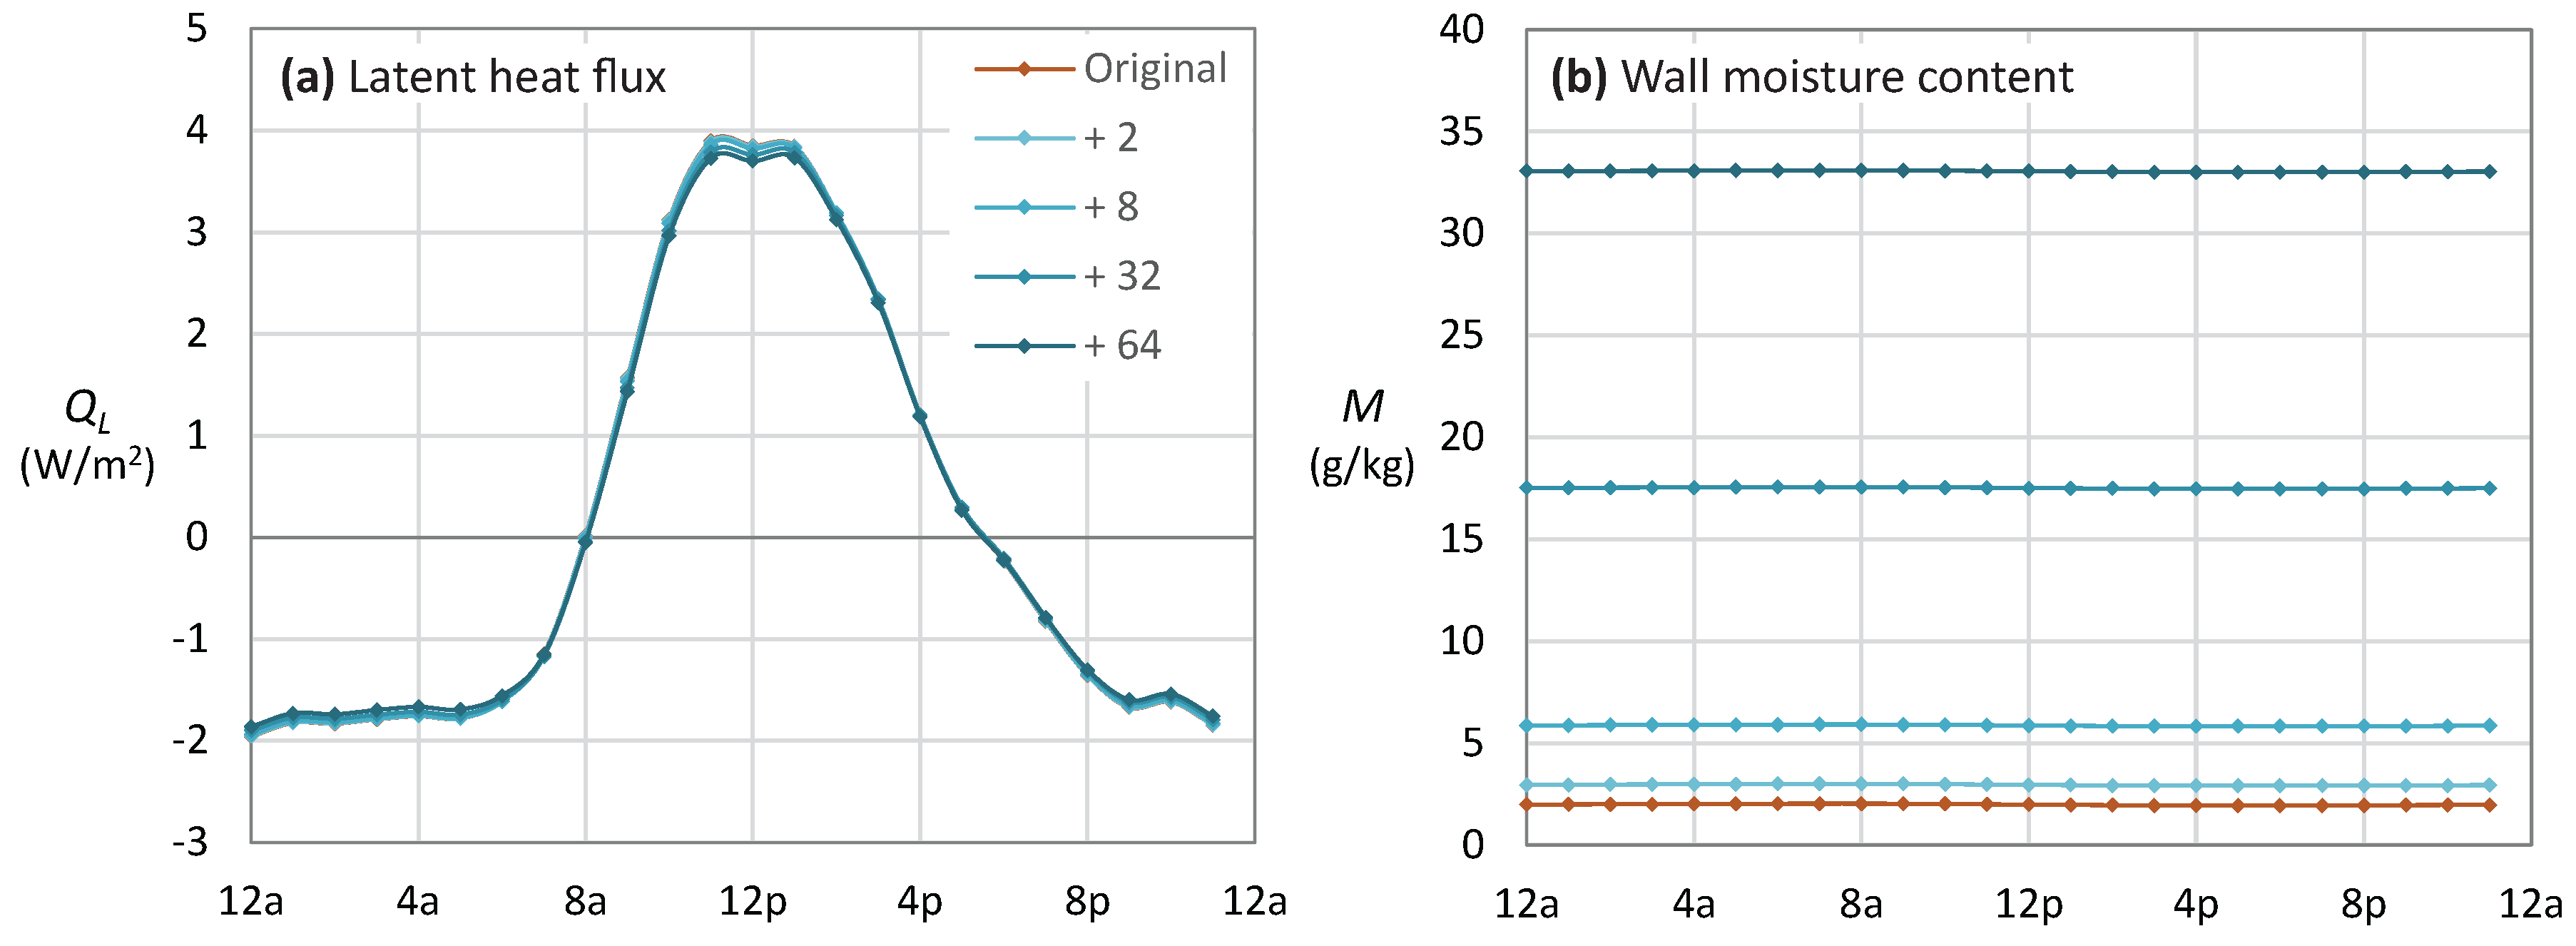
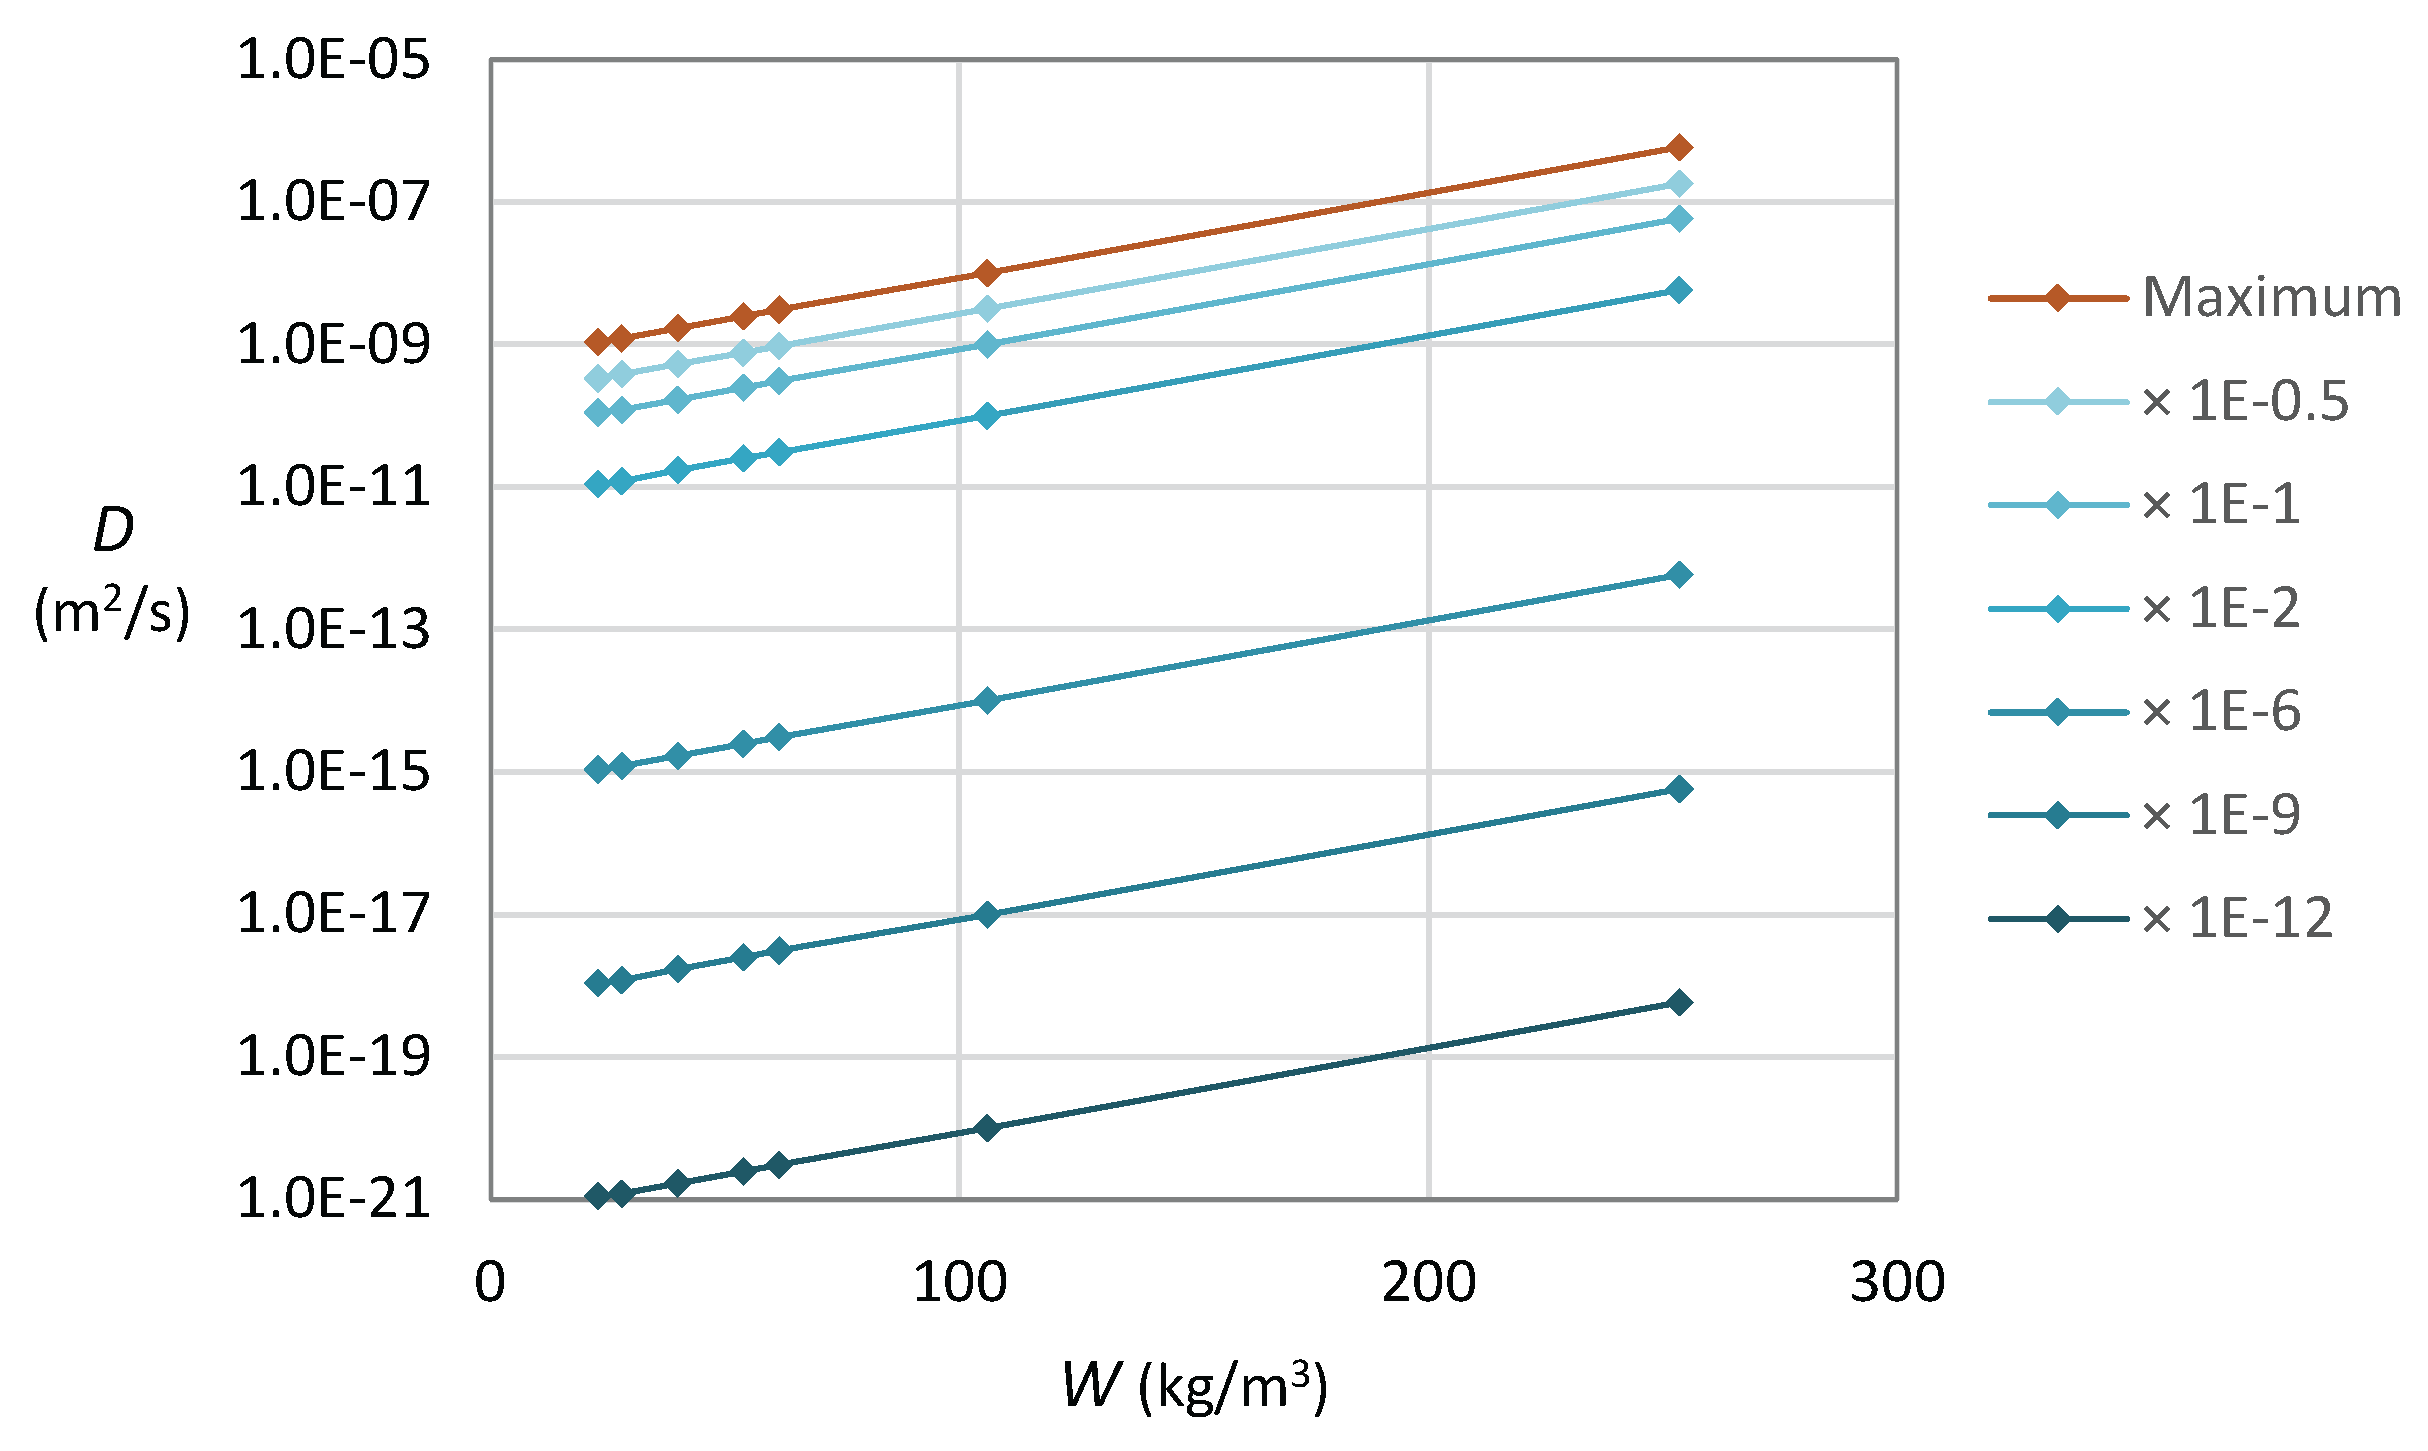
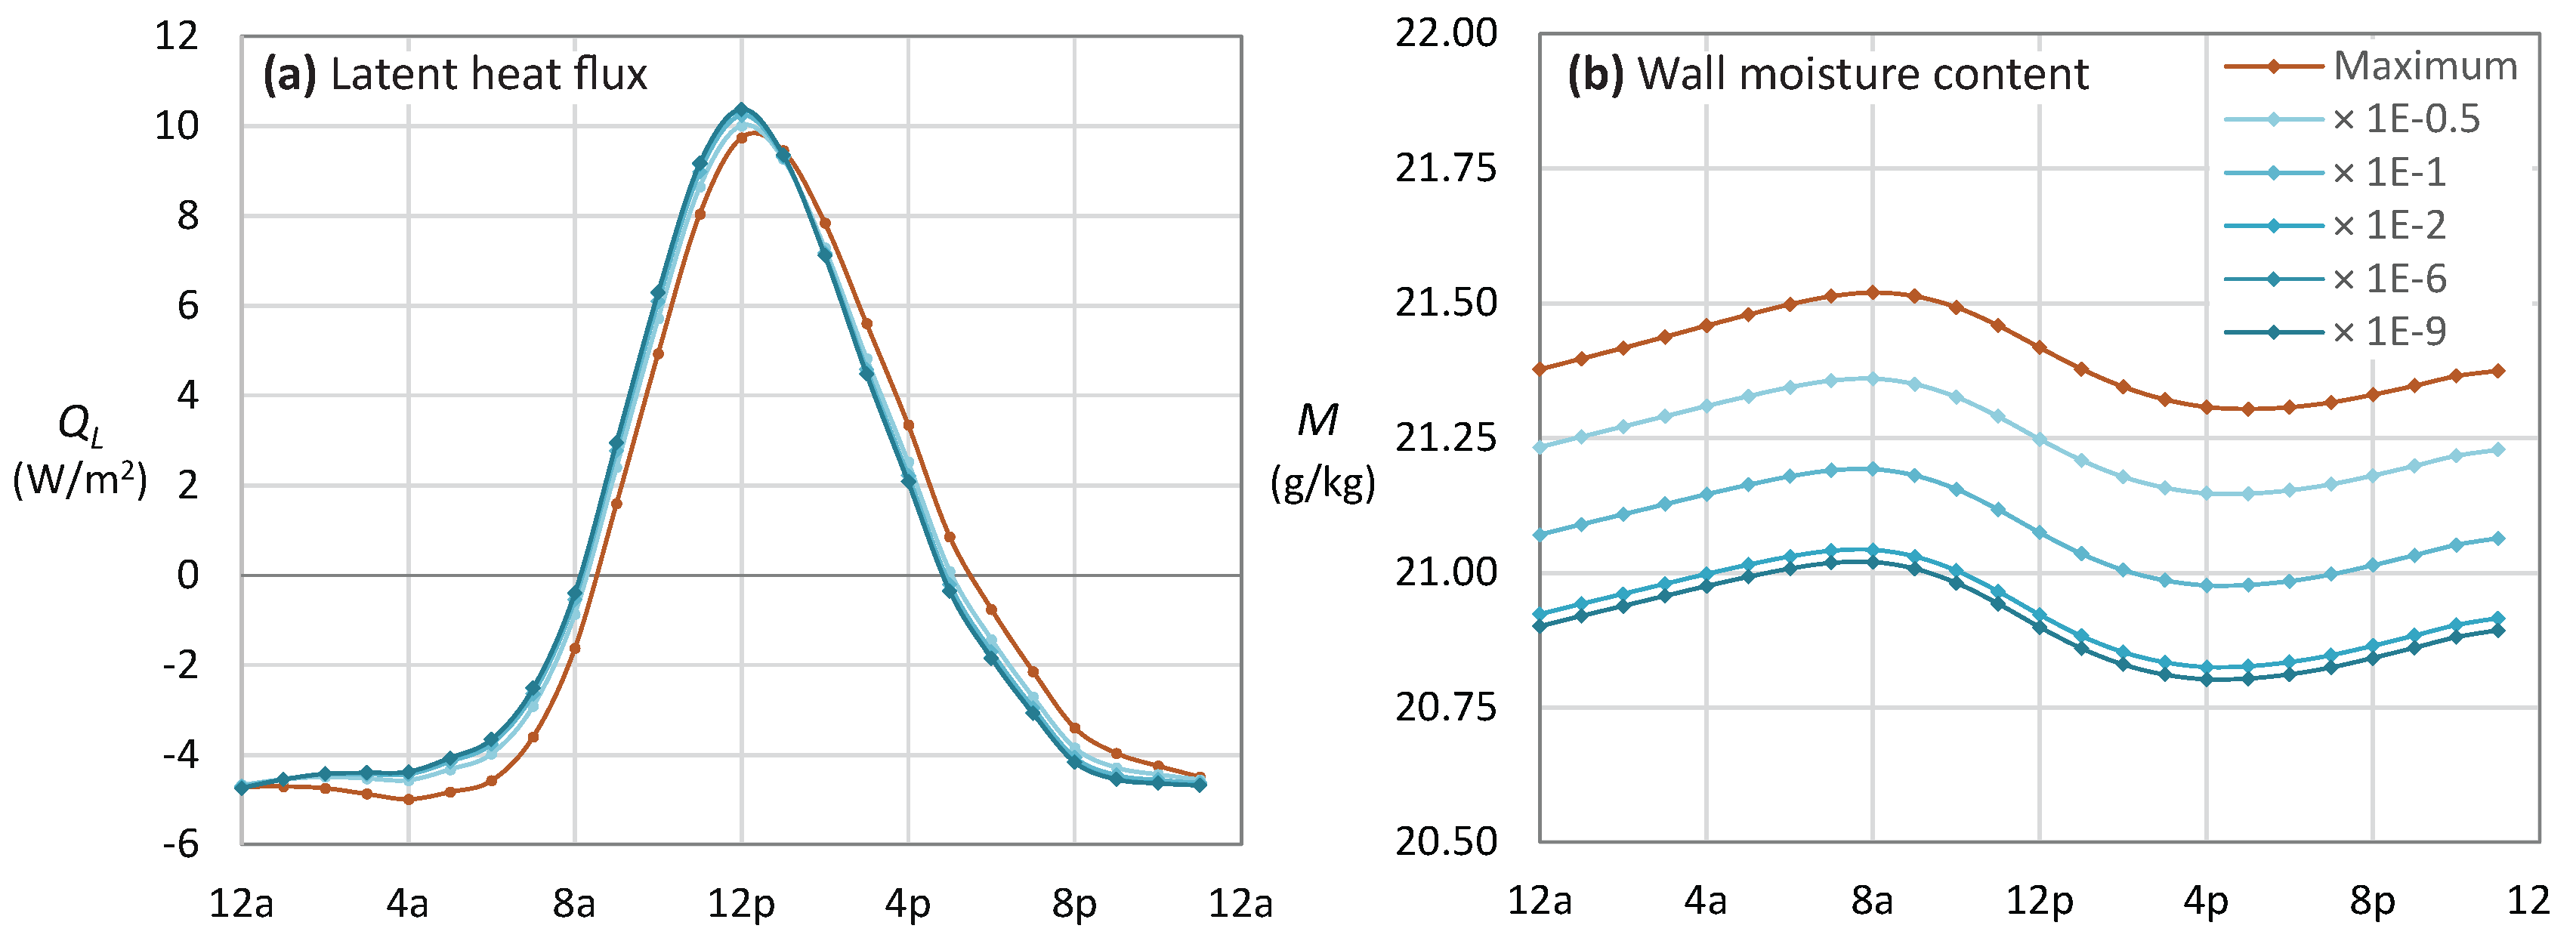
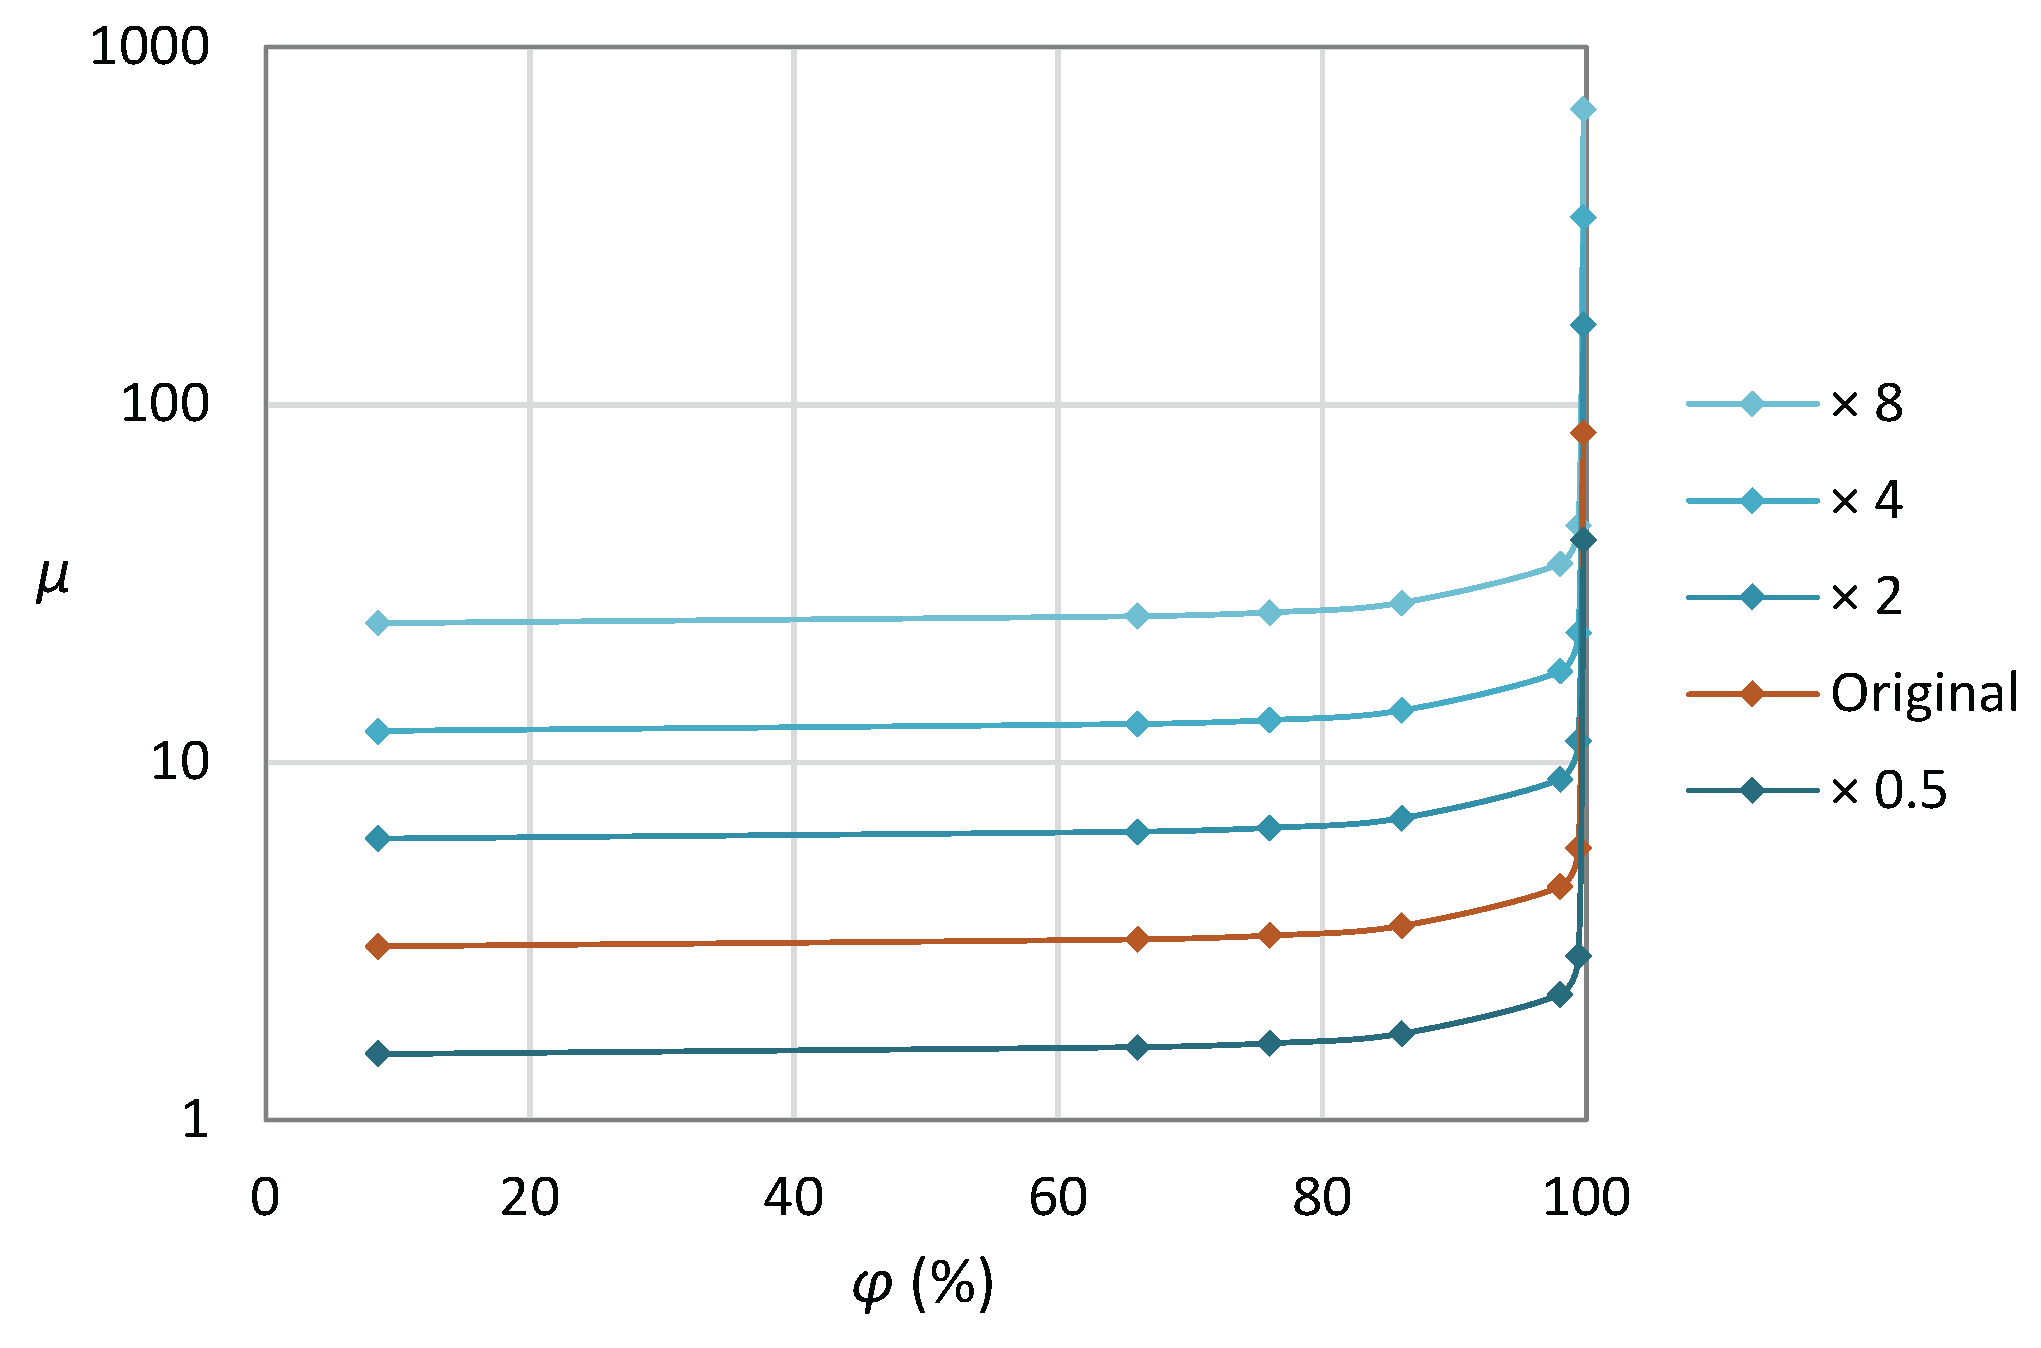
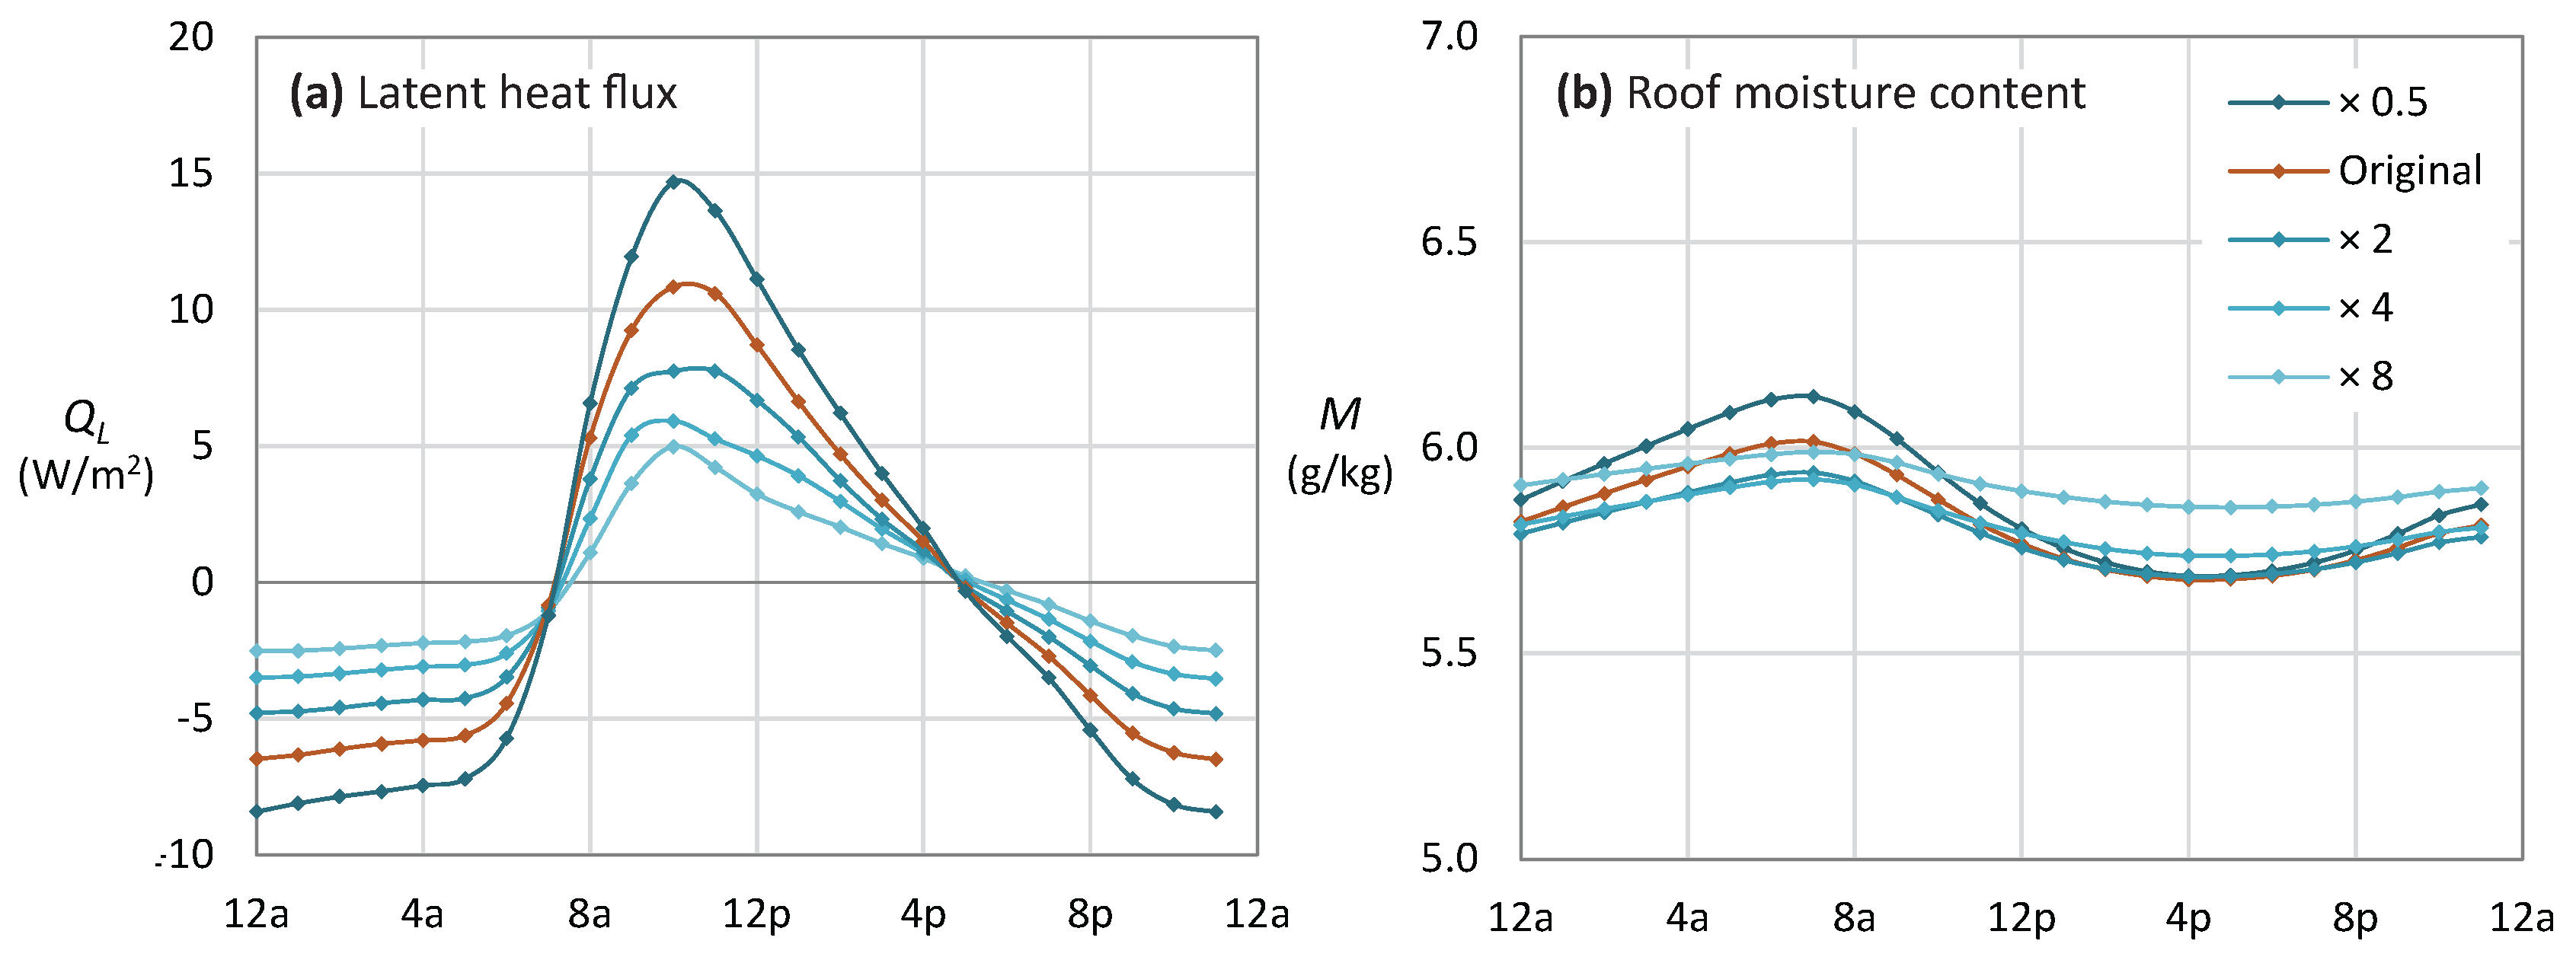
| Symbol | (Units) | Definition | Comment |
|---|---|---|---|
| C | (J/(kg·K)) | dry specific heat capacity | typical range: 700–2500 J/(kg·K) |
| (J/(kg·K)) | liquid specific heat capacity | 4200 J/(kg·K) | |
| D | (m2/s) | liquid transport coefficient | |
| g | (m/s2) | acceleration of gravity | 9.8 m/s2 |
| i | index for spatial discretization | 12 nodes span each building element | |
| j | index for temporal discretization | typically reported in hourly increments | |
| k | (W/(m·K)) | thermal conductivity | function of moisture content |
| K | (m/s) | hydraulic conductivity | approximated for soils using Equation (9) |
| L | (J/kg) | latent heat of vaporization | 2.265 × 10⁶ J/kg |
| M | (kg/kg) | average water mass ratio | averaged across building element |
| n | porosity | pore volume divided by total volume | |
| (Pa) | ambient air pressure | taken as 101.3 kPa | |
| (Pa) | vapor pressure | ||
| (Pa) | saturation vapor pressure | function of temperature; see Figure 1 | |
| (W/m2) | conductive heat flux | evaluated between nodes with Equation (10) | |
| (W/m2) | latent heat flux | evaluated between nodes with Equation (11) | |
| (W/m2) | total latent heat flux | evaluated across timesteps with Equation (12) | |
| R | (J/(mol·K)) | gas constant | 8.314 J/(mol·K) |
| S | (kg/m3) | moisture storage capacity | |
| t | (s) | time | |
| T | (K) | temperature | given in °C where noted |
| (m3/mol) | partial molar volume of water | 18 × 10−6 m3/mol | |
| W | (kg/m3) | moisture content | function of relative humidity |
| x | (m) | distance | measured relative to exterior surface |
| X | (m) | building element thickness | either wall or roof |
| δ | (kg/(m·s·Pa)) | vapor diffusion coefficient in air | related to T through Equation (5) |
| (s) | conduction time scale | ; see Section 3.6.2 | |
| (s) | vapor diffusion time scale | ; see Section 3.6.2 | |
| (m) | incremental distance | used in scaling arguments for and | |
| Γ | liquid–vapor transport ratio | defined by Equation (3) | |
| μ | vapor diffusion resistance factor | function of relative humidity | |
| φ | relative humidity | ||
| (kg/m3) | dry density | times density of matrix material | |
| (kg/m3) | liquid density | 1000 kg/m3 | |
| Ψ | (Pa) | water potential | related to φ through Equation (1) |
Table 2.
Parameter values and sources; Section 3.1, Section 3.2, Section 3.3, Section 3.4, Section 3.5 and Section 3.6 contain further discussion.
| Material | Parameter | Value | Source/Comments |
|---|---|---|---|
| C | 850 J/(kg·K) | [43] | |
| 1270–1580 kg/m3 | ([43], Table 2) | ||
| n | 40%–52% | ([43], Table 2) | |
| Soils | k | see Figure 3d | [43,44] |
| W | see Figure 3a | Equation (6) [45] | |
| μ | see Figure 3b | Equation (8) [46] | |
| D | see Figure 3c | Equation (9) [45] | |
| C, | 900 J/(kg·K), 1800 kg/m3 | [47] | |
| n | 32% | [47] | |
| Adobe | k | dry 0.683 W/(m·K) | ([47], Table 3) |
| W | see Figure 7a | ([47], Figure 6) | |
| μ | see Figure 7b | Equation (8) | |
| D | sandy loam, Equation (9) | , vapor transport dominates | |
| C, | 815 J/(kg·K), 1550 kg/m3 | [48] | |
| n | 42% | [49] | |
| Cob | k | dry 0.4 W/(m·K) [49] | loam [43,44] |
| W | see Figure 7a | ([49], Figure 6) | |
| μ | see Figure 7b | Equation (8) | |
| D | loam, Equation (9) | , vapor transport dominates | |
| C, | 990 J/(kg·K), 2060 kg/m3 | [50] | |
| n | 22% | estimate from | |
| Unfired | k | dry 0.6 W/(m·K) | ([50], Figure 10) |
| earth brick | W | see Figure 7a) | “Brick 1” ([50], Figure 6) |
| μ | see Figure 7b | Equation (8) | |
| D | clay loam, Equation (9) | , vapor transport dominates | |
| C, | 868 J/(kg·K), 1900 kg/m3 | [51] | |
| n | 29.5% | [51] | |
| Rammed | k | dry 0.643 W/(m·K) [51] | linear to 1.158 W/(m·K) [52] |
| earth | W | see Figure 14a | ([51], Figure 4) |
| μ | see Figure 14b | Equation (8) to [51] | |
| D | see Figure 15 | “Maximum” from [53] | |
| C | 1200, 1200, 900 J/(kg·K) | ([54], Table 3) | |
| 1440, 1392, 1540 kg/m3 | ([54], Table 2) | ||
| Limestone | n | 48%, 49%, 44% | [54,55] |
| (fine, medium, coarse) | k | dry 0.9, 0.8, 0.7 W/(m·K) | ([54], Table 3) |
| W | see Figure 14a | modified from ([56], Figure 7) | |
| μ | see Figure 17 | “Original” Equation (8); see Figure 14b | |
| D | from Equation (13) | , vapor transport dominates |
| Material | Location | Köppen Climate | Description | Weather File |
|---|---|---|---|---|
| Soils, adobe | Laredo, TX, USA | BSh | Hot semi-arid grassland | USA_TX_Laredo.Intl. AP.722520_TMY3 |
| Adobe | Kerala, India | Aw/Am | Tropical monsoon/savanna | IND_Trivandrum. 433710_IWEC |
| Adobe | Yuma, AZ, USA | BWh | Hot desert | USA_AZ_Yuma.Intl. AP.722800_TMY3 |
| Adobe | Izmir, Turkey | Csa | Dry-summer Mediterranean | TUR_Izmir. 172180 _IWEC |
| Adobe | Xi’an, Shaanxi, China | Cwa | Humid-summer subtropical | CHN_Shaanxi.Xian. 570360 _CSWD |
| Adobe | Kunming, Yunnan, China | Cwb | Cooler humid subtropical | CHN_Yunnan.Kun- ming. 567780_IWEC |
| Cob | Nantes, France | Cfb | Marine west coast | FRA_Nantes. 072220 _IWEC |
| Extruded brick | Clermont-Ferrand, France | Cfb | Marine west coast | FRA_Clermont-Fer- rand. 074600_IWEC |
| Rammed earth | Birmingham, UK | Cfb | Marine west coast | GBR_Birmingham. 035340_IWEC |
| Limestone | Gioia del Colle, Italy | Cfa | Fully humid subtropical | ITA_Gioia.del.Colle. 163120_IGDG |
| Location | Latitude | Global Horizontal Radiation (Wh/m2 Day) | Direct Normal Radiation (Wh/m2 Day) | Cloud Cover (%) | Evaporative Heat Flux (Wh/m2 Day) |
|---|---|---|---|---|---|
| Kerala, India | 10.8° N | 215 | 125 | 76 | 44.2 |
| Laredo, TX, USA | 27.5° N | 280 | 255 | 38 | 55.6 |
| Yuma, AZ, USA | 32.7° N | 295 | 310 | 50 | 32.5 |
| Izmir, Turkey | 38.4° N | 310 | 290 | 8 | 30.5 |
| Xi’an, Shaanxi, China | 34.3° N | 190 | 95 | 45 | 30.8 |
| Kunming, Yunnan, China | 24.9° N | 150 | 25 | 82 | 26.0 |
© 2016 by the authors; licensee MDPI, Basel, Switzerland. This article is an open access article distributed under the terms and conditions of the Creative Commons Attribution (CC-BY) license (http://creativecommons.org/licenses/by/4.0/).
Share and Cite
MDPI and ACS Style
Rempel, A.R.; Rempel, A.W. Intrinsic Evaporative Cooling by Hygroscopic Earth Materials. Geosciences 2016, 6, 38. https://doi.org/10.3390/geosciences6030038
AMA Style
Rempel AR, Rempel AW. Intrinsic Evaporative Cooling by Hygroscopic Earth Materials. Geosciences. 2016; 6(3):38. https://doi.org/10.3390/geosciences6030038
Chicago/Turabian StyleRempel, Alexandra R., and Alan W. Rempel. 2016. "Intrinsic Evaporative Cooling by Hygroscopic Earth Materials" Geosciences 6, no. 3: 38. https://doi.org/10.3390/geosciences6030038
Note that from the first issue of 2016, this journal uses article numbers instead of page numbers. See further details here.