Review

Getting Ahead of the Wildfire Problem: Quantifying and Mapping Management Challenges and Opportunities

by
Christopher D. O’Connor
1,*,
Matthew P. Thompson
1 and
Francisco Rodríguez y Silva
2
1
U.S. Department of Agriculture (USDA) Forest Service Rocky Mountain Research Station, Missoula, MT 59801, USA
2
Departamento de Ingeniería Forestal, Universidad de Córdoba, Laboratorio de Defensa contra Incendios Forestales E.T.S.de Ingeniería Agronómica y de Montes Edificio Leonardo da Vinci, Campus de Rabanales, Córdoba 14071, Spain
*
Author to whom correspondence should be addressed.
Geosciences 2016, 6(3), 35; https://doi.org/10.3390/geosciences6030035
Submission received: 1 June 2016 / Revised: 12 July 2016 / Accepted: 19 July 2016 / Published: 29 July 2016
(This article belongs to the Special Issue Mapping and Assessing Natural Disasters Using Geospatial Technologies)

Abstract

:
Wildfire is a global phenomenon that plays a vital role in regulating and maintaining many natural and human-influenced ecosystems but that also poses considerable risks to human populations and infrastructure. Fire managers are charged with balancing the short-term protection of human assets sensitive to fire exposure against the potential long-term benefits that wildfires can provide to natural systems and wildlife populations. The compressed decision timeframes imposed on fire managers during an incident are often insufficient to fully assess a range of fire management options and their respective implications for public and fire responder safety, attainment of land and resource objectives, and future trajectories of hazard and risk. This paper reviews the role of GIS-based assessment and planning to support operational wildfire management decisions, with a focus on recent and emerging research that pre-identifies anthropogenic and biophysical landscape features that can be leveraged to increase the safety and effectiveness of wildfire management operations. We use a case study from the United States to illustrate the development and application of tools that draw from research generated by the global fire management community.

Graphical Abstract

1. Introduction

The size and complexity of wildfire management challenges have grown significantly over the past several decades as changes to fuel density and composition, spurred by altered fire regimes, interact with changing climate conditions [1,2,3] and rapid expansion of the Wildland Urban Interface (WUI) [4,5,6]. This complexity has contributed to trends of increasing damage to infrastructure and ecosystem function [7,8], continued loss of civilian and fire responder lives [9], and rapidly escalating fire suppression costs [10].
Part of the solution to dealing with the increase in fire complexity is to reduce uncertainties inherent within active fire management, where time-sensitive decisions often rely upon incomplete information. Conditions that vary on short time scales such as fire weather, fuel moisture, current fire extent, and available suppression resources are framed by more static landscape features such as physical landscape attributes, values at risk, built infrastructure, and ecological systems that can be assessed prior to fire ignition. To meet the growing demand for real-time spatial information for effective fire management, there has been a push to develop fire management decision support systems (FMDSS) that use geospatial technologies to provide critical information for wildfire responders to facilitate effective resource allocation, monitoring of conditions, and short-term fire forecasting to improve fire management decisions. The development of FMDSS has been implemented across the global fire management community on a country by country basis in North America [11,12], South America [13], much of western Europe [14,15,16], northern Asia [17] and Australia [18] as well as at regional scales for specific management objectives such as management of alpine forests [19] and timber protection in Europe [20,21]. The scale and complexity of each FMDSS is variable, thought there has been a general trend toward increasing the amount of available information and ease of access for fire planners and fire responders with each successive generation of support system. Some of the common tools available within the most recent generation of FMDSSs allow for pre-fire assessments of vulnerability, fire ignition detection, and real-time support of fire management actions.
The structure of FMDSS throughout the international fire management community emphasize fast, efficient, and effective suppression response based on the principle that small fires are easier to control than large fires [22]. However, as fire seasons continue to lengthen under warming climate conditions [3], the incidence of extreme fire weather conditions responsible for the majority of large, high-severity fires is also increasing [1], bringing the continued success of suppression-based fire management systems into doubt. One of the lessons learned from decades of successful fire suppression in the United States and Canada is that short-term fire suppression objectives designed to protect lives and property can undermine long-term forest management tenets that promote resilient, fire-adapted landscapes and communities [23,24]. Shifting the emphasis of FMDSS of the global fire community toward managing fires in the context of landscape-scale fire planning has potential to break out of the cycle of fire suppression, fuel accumulation, and continued exposure of human and natural systems to extreme fire conditions [25]. Integrated FMDSS that allow fire managers to weight the potential risks of allowing a fire to burn under appropriate weather conditions, against potential benefits such as fuel reductions, ecosystem restoration, and social acceptance of wildfire as an essential ecosystem process are not yet available, however many of the pieces are already in place. An important caveat to any potential changes to wildfire management is alignment with the policy environment. For example, on many lands owned by state or private timber interests, or in areas near human settlements, fire suppression is often the only accepted policy. Incorporating a full range of potential outcomes into FMDSS can help to illuminate tradeoffs and opportunity costs associated with policies that support fire suppression or managed fire options.
In this review, we provide an overview of some of the geospatial technologies used in FMDSS of the global fire management community to support decision making before and during a wildfire. We recognize that there a many additional considerations in a forest and fire management context, including enhancing forest resiliency (e.g., [26,27]) and reducing hazardous fuel loads (e.g., [28,29]), but our focus here is on the role of geospatial information in planning for incident response. We emphasize the components of wildfire response that could help transition incident-based FMDSS into landscape planning and adaptation-based FMDSS. We link these technologies to an example spatial fire planning framework that provides broader context for fire management decisions, and introduce a series of newly developed tools to further integrate spatial fire planning and incident management, with specific emphasis on planning for strategic fire use and pre-identification of potential fire control locations and hazardous operational environments for fire responders. These new tools draw from technologies developed by the global fire management community and can be adapted to a variety of management objectives and conditions. The example of an integrated assessment, planning, and response system demonstrated here is designed to better align individual fire management objectives with site-specific, long-term planning goals while improving responder safety and resource use efficiency.

2. Overview of Geospatial Tools in Wildfire Management Decision Support

The primary role of FMDSS has been the efficient and effective deployment of fire suppression resources to protect public safety, property and forest resources [30,31]. Geospatial tools used in management of active wildfires share several of the components used for pre-fire planning, with the added complexity of time constraints and potential shortages of available suppression resources.
In the United States, the wildland fire decision support system (WFDSS) [11,32], a web-based geospatial fire management portal, is currently used by federal and state fire agencies for management and documentation of large fires. WFDSS provides a flexible risk-based framework for spatial fire management to meet both predefined and evolving management objectives. Within WFDSS, a spatial fire mapping and modeling framework is used to record daily fire progression and to simulate potential fire spread using real-time and short-term forecasts of local weather collected from a cluster of nearby remote access weather stations (RAWS) [11]. WFDSS can incorporate a variety of spatial data such as historical fire perimeters and burn severities (Figure 1a), fuel treatments and other “fire prevention silviculture” (Figure 1b), and spatial records of public and private infrastructure, known as highly valued resources and assets (HVRAs) (Figure 1c). These spatial data can be incorporated into the probabilistic spatial fire spread model FSpro [33] (Figure 1d), to identify locations vulnerable to an advancing fire hours to days prior to fire spread. Information on how past fires and fuel treatments may affect the evolution of the present fire can be very influential in determining appropriate response strategies [26,28,29,34] and also increases situational awareness for incident managers, promoting opportunities for safe engagement and use of locations where fire behavior might be mitigated. Within the WFDSS framework, broad management objectives are drawn from a central forest plan while short-term incident objectives are determined from expert judgment informed by spatial fire modeling. The spatial analysis tools within WFDSS are designed to support flexible informed decision-making by fire managers and not to suggest fire-fighting tactics or limit possible management options. A new spatial fire planning directive in 2016 for federal lands in the United States incorporates locally-determined strategic management zones into a national WFDSS database to provide additional information to fire incident managers.
A similar decision support system that builds on the efficiencies of WFDSS is the newly implemented Greek wildfire prevention and management information system (AEGIS) [16]. AEGIS is also a web-based fire management platform that takes advantage of complementary web-based technologies such as real-time route mapping, travel time calculation, resource tracking for emergency vehicles, and access to remote web cameras. Fire mapping is implemented in the minimum travel time-based deterministic fire behavior model FlamMap5 [35], producing a map of potential fire behavior (flame lengths, rate of spread, and heat intensities) given user-determined weather inputs.
The European Forest Fire Information System (EFFIS) is an online central data repository providing real-time and forecast fire weather, fuel conditions, and fire information for current and historical fires [21]. The system is administered by the Joint Research Centre (JRC) of the European Commission and provides data support for forest protection and fire management for 38 participating countries. In addition to providing fire updates and weather information, the JRC is capable of supporting active fire management with custom assessments of major fire incidents on an ad hoc basis. EFFIS fuels data and fire assessment capabilities are flexible and can accommodate local and regional-scale information, however the type, quality, and spatial scale of available information varies considerably across the EU and north African spatial domain.
In Australia, PHOENIX RapidFire is a workstation-based, operator-driven flexible fire characterization model that combines several of the features of vector-based fire spread simulations with continuously variable fire weather and reliance on previous time step conditions to simulate fire progression with spotting [18]. A unique feature in PHOENIX RapidFire is the ability to incorporate fine scale spatial features and short time steps for weather inputs that allow it to be applied to the WUI and other situations where spatial scales on the order of 5–20 m are an important component of risk-based fire management decisions [36].
A similarly complex fire simulation system used for short time frame (hourly) decision support to manage individual incidents is the Canadian Prometheus fire simulation modeling system [12]. Similar to PHOENIX Rapidfire, Prometheus is a deterministic, empirically-based fire spread modeling system that is operated by expert analysts in a high-powered work station environment. Weather inputs and simulation of fire spread rates are input from hourly updated values generated from the Canadian Fire Behavior Prediction System of the Canadian Fire Danger Rating System [37]. The spatial interpretation of fire perimeter growth uses two-dimensional surface attributes much like PHOENIX Rapidfire, FSPro, and FlamMap5. Fire perimeter growth is represented in vector format where each vertex is tied to a table of fire behavior characteristics. These point values can then be interpolated to generate a raster surface of fire behavior over the progression of the fire simulation [12].
An independent fire management system developed in Spain has been supported through the economic valuation and optimization FMDSS SINAMI [14] in a partnership with the University of Cordoba. The modeling system incorporates simulation of spatial fire spread from the BEHAVE model [38] adapted to a GUI interface, with additional GIS functionality and flexibility (Visual CARDIN, [39]). The system is workstation-based and relies on custom fuel beds and average weather inputs from the nearest available stations that are held constant through a fire simulation.
While significant improvements have been made in the ability to manage large, resource-demanding wildfires with dynamic GIS-based tools, constraints on time, resources, and expertise necessary to use spatial fire management tools effectively continue to limit the widespread adoption of spatial fire planning, even in the most advanced wildfire management organizations. Two key knowledge gaps are a lack of explicit characterization of spatial and conditional variation in consequences given fire exposure, and resultant lack of spatially-explicit, risk-informed strategic fire management objectives [25,32,40]. Further, FMDSS typically lack geospatial information depicting areas on the landscape where suppression activities would be desirable, safe, and effective. Thus, even in contexts where a high density of loss-prone assets or management policy would dictate aggressive suppression response (i.e., the questions of why to engage and whether to engage are answered), questions of how, where, and when to safely and effectively engage are left to the discretion of local fire managers operating in uncertain and time-compressed decision environments. In the next section, we illustrate how advancements in geospatial fire assessment and planning can provide useful decision support to address these gaps.

3. Toward Risk-Informed, Safe, and Effective Incident Response: Framework and Examples

Figure 2 depicts a workflow for integrating geospatial analyses relating to wildfire risk assessment, spatial fire planning, and responder safety. The basic framework and its components are flexible, can be implemented in a number of ways, and are premised on the utility of linking evaluation of incident-level consequences with opportunities for incident-level operational management. The ultimate endpoint is providing actionable information so incident managers can make risk-informed decisions regarding questions of whether, why, how, where, and when to engage fires, and can implement decisions in a safe and effective manner. For purposes of illustration we largely focus our discussion on three key analytical products that fit into this broader framework: conditional net value change (cNVC), potential wildfire operational delineations (PODs), and terrestrial suppression difficulty index (tSDI). The cNVC layer is a measure of risk that spatially characterizes the magnitude of potential fire-related losses and benefits to HVRAs, given a fire occurs, and helps guide answers to questions of why and whether to engage. Note that in some contexts there is little decision space regarding the question of whether to engage; nevertheless estimation of consequences is critical for evaluating risk-risk tradeoffs, e.g., is it worth risking responder lives to protect low value timber or low quality habitat? PODs are spatial units of analysis that integrate cNVC results with operationally relevant potential control locations, so that the landscape can be zoned according to predominant strategic response objectives. Analyzing POD boundaries and evolving incident conditions can help determine questions of how, where, and when to engage the fire along predetermined potential control locations, but should not be taken to restrict other options for engaging the fire. tSDI provides complementary, more refined information on where it might be safe or unsafe to engage the fire, which can further help managers evaluate the safety and effectiveness of alternative courses of action. Below, we briefly review and offer examples relating to the three main components of this framework for risk-informed, safe, and effective incident response.

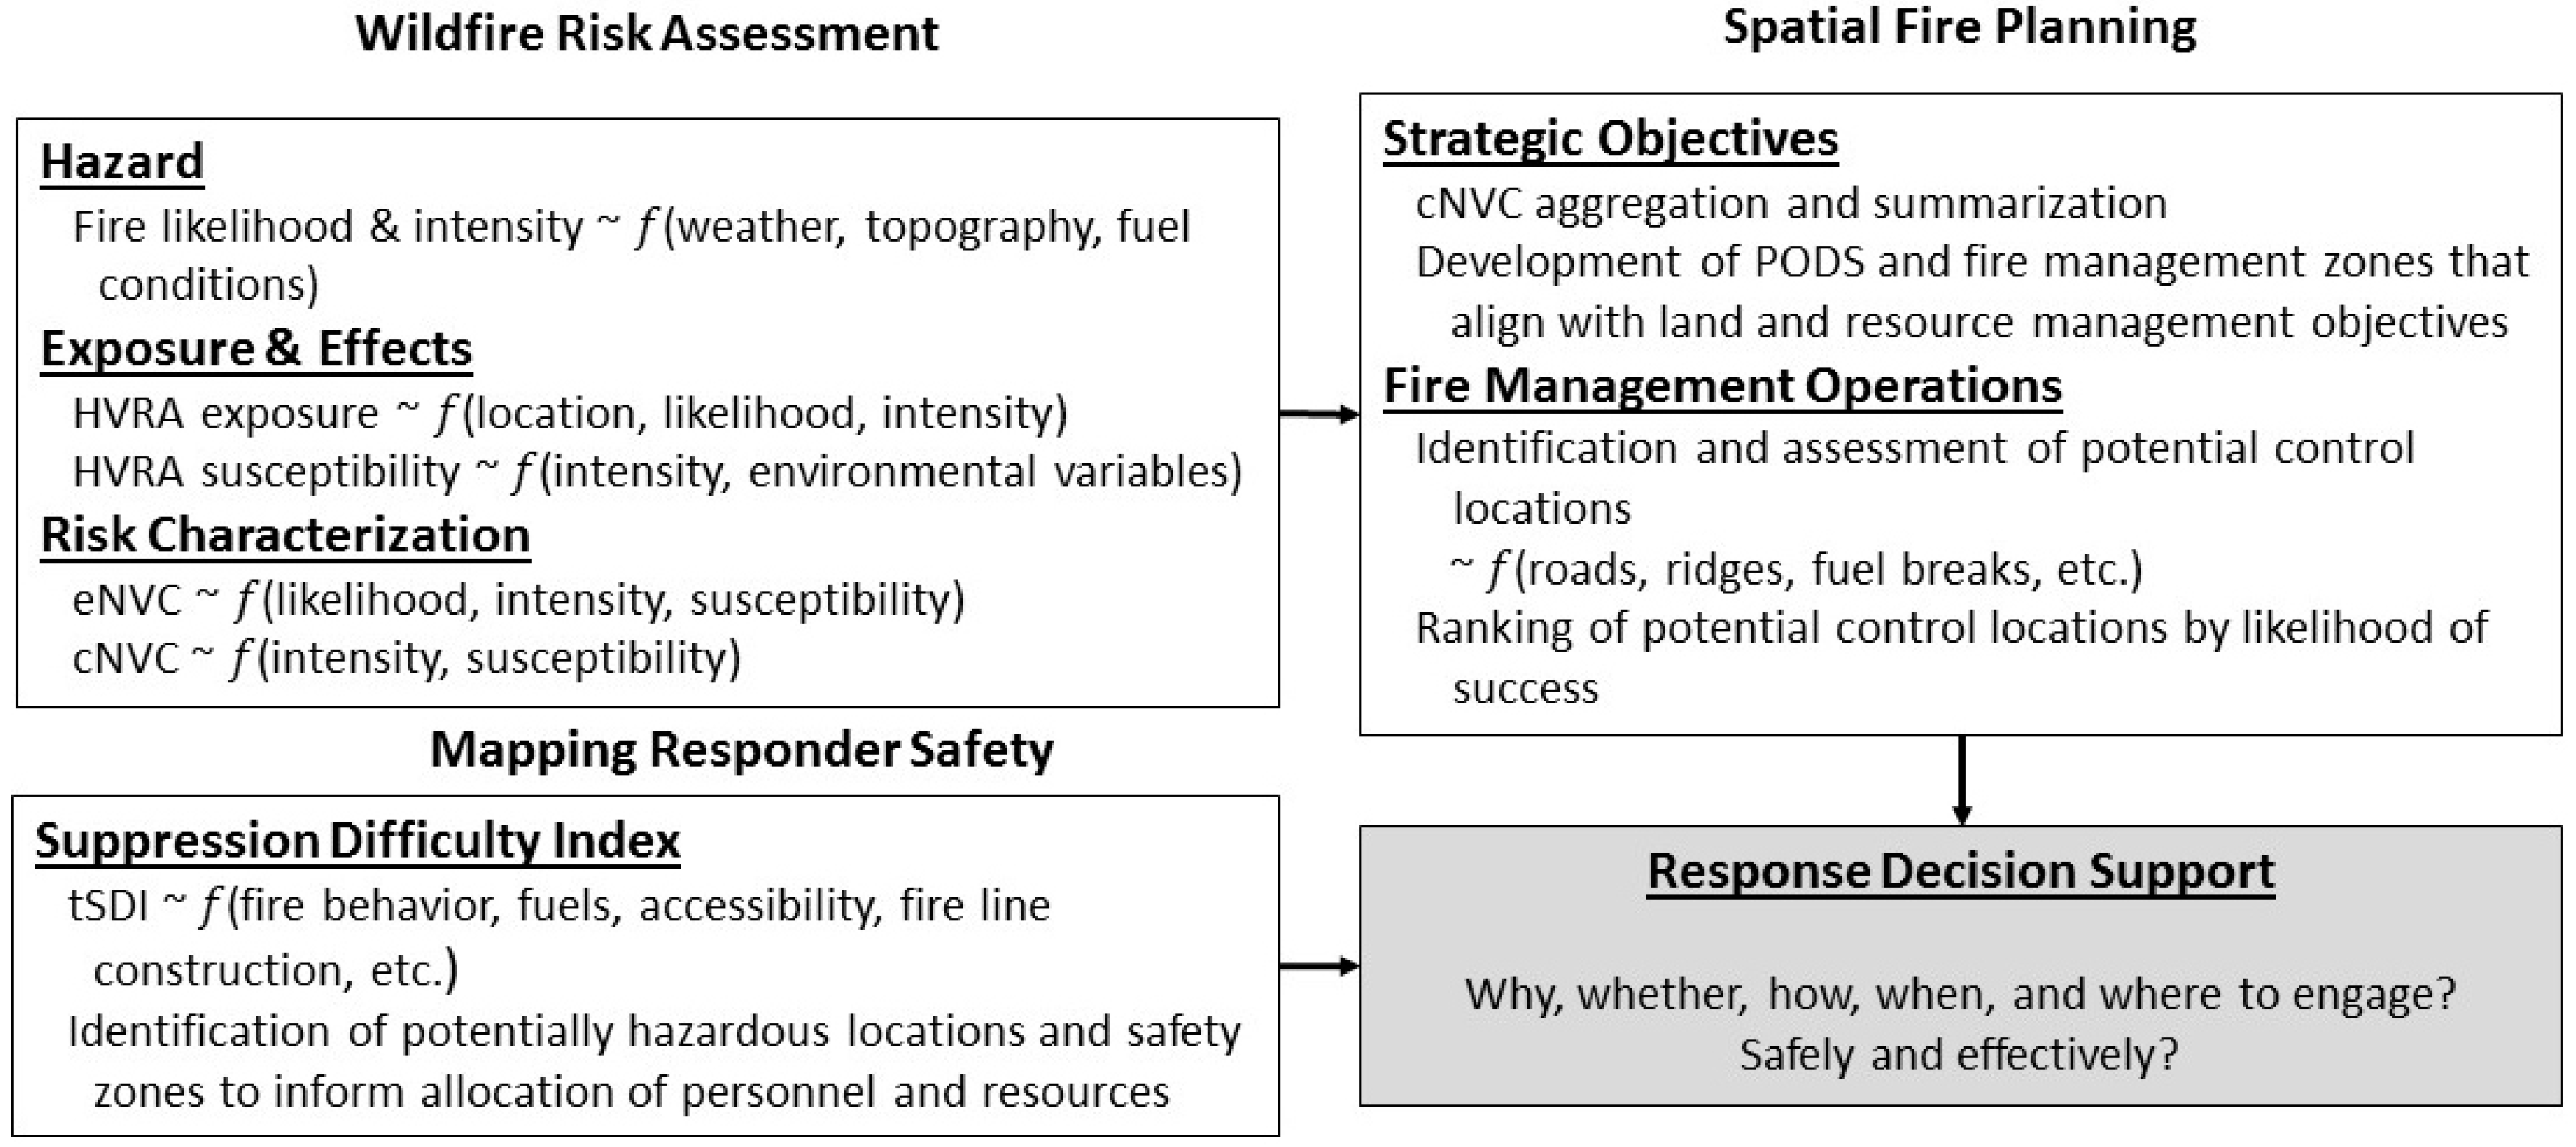
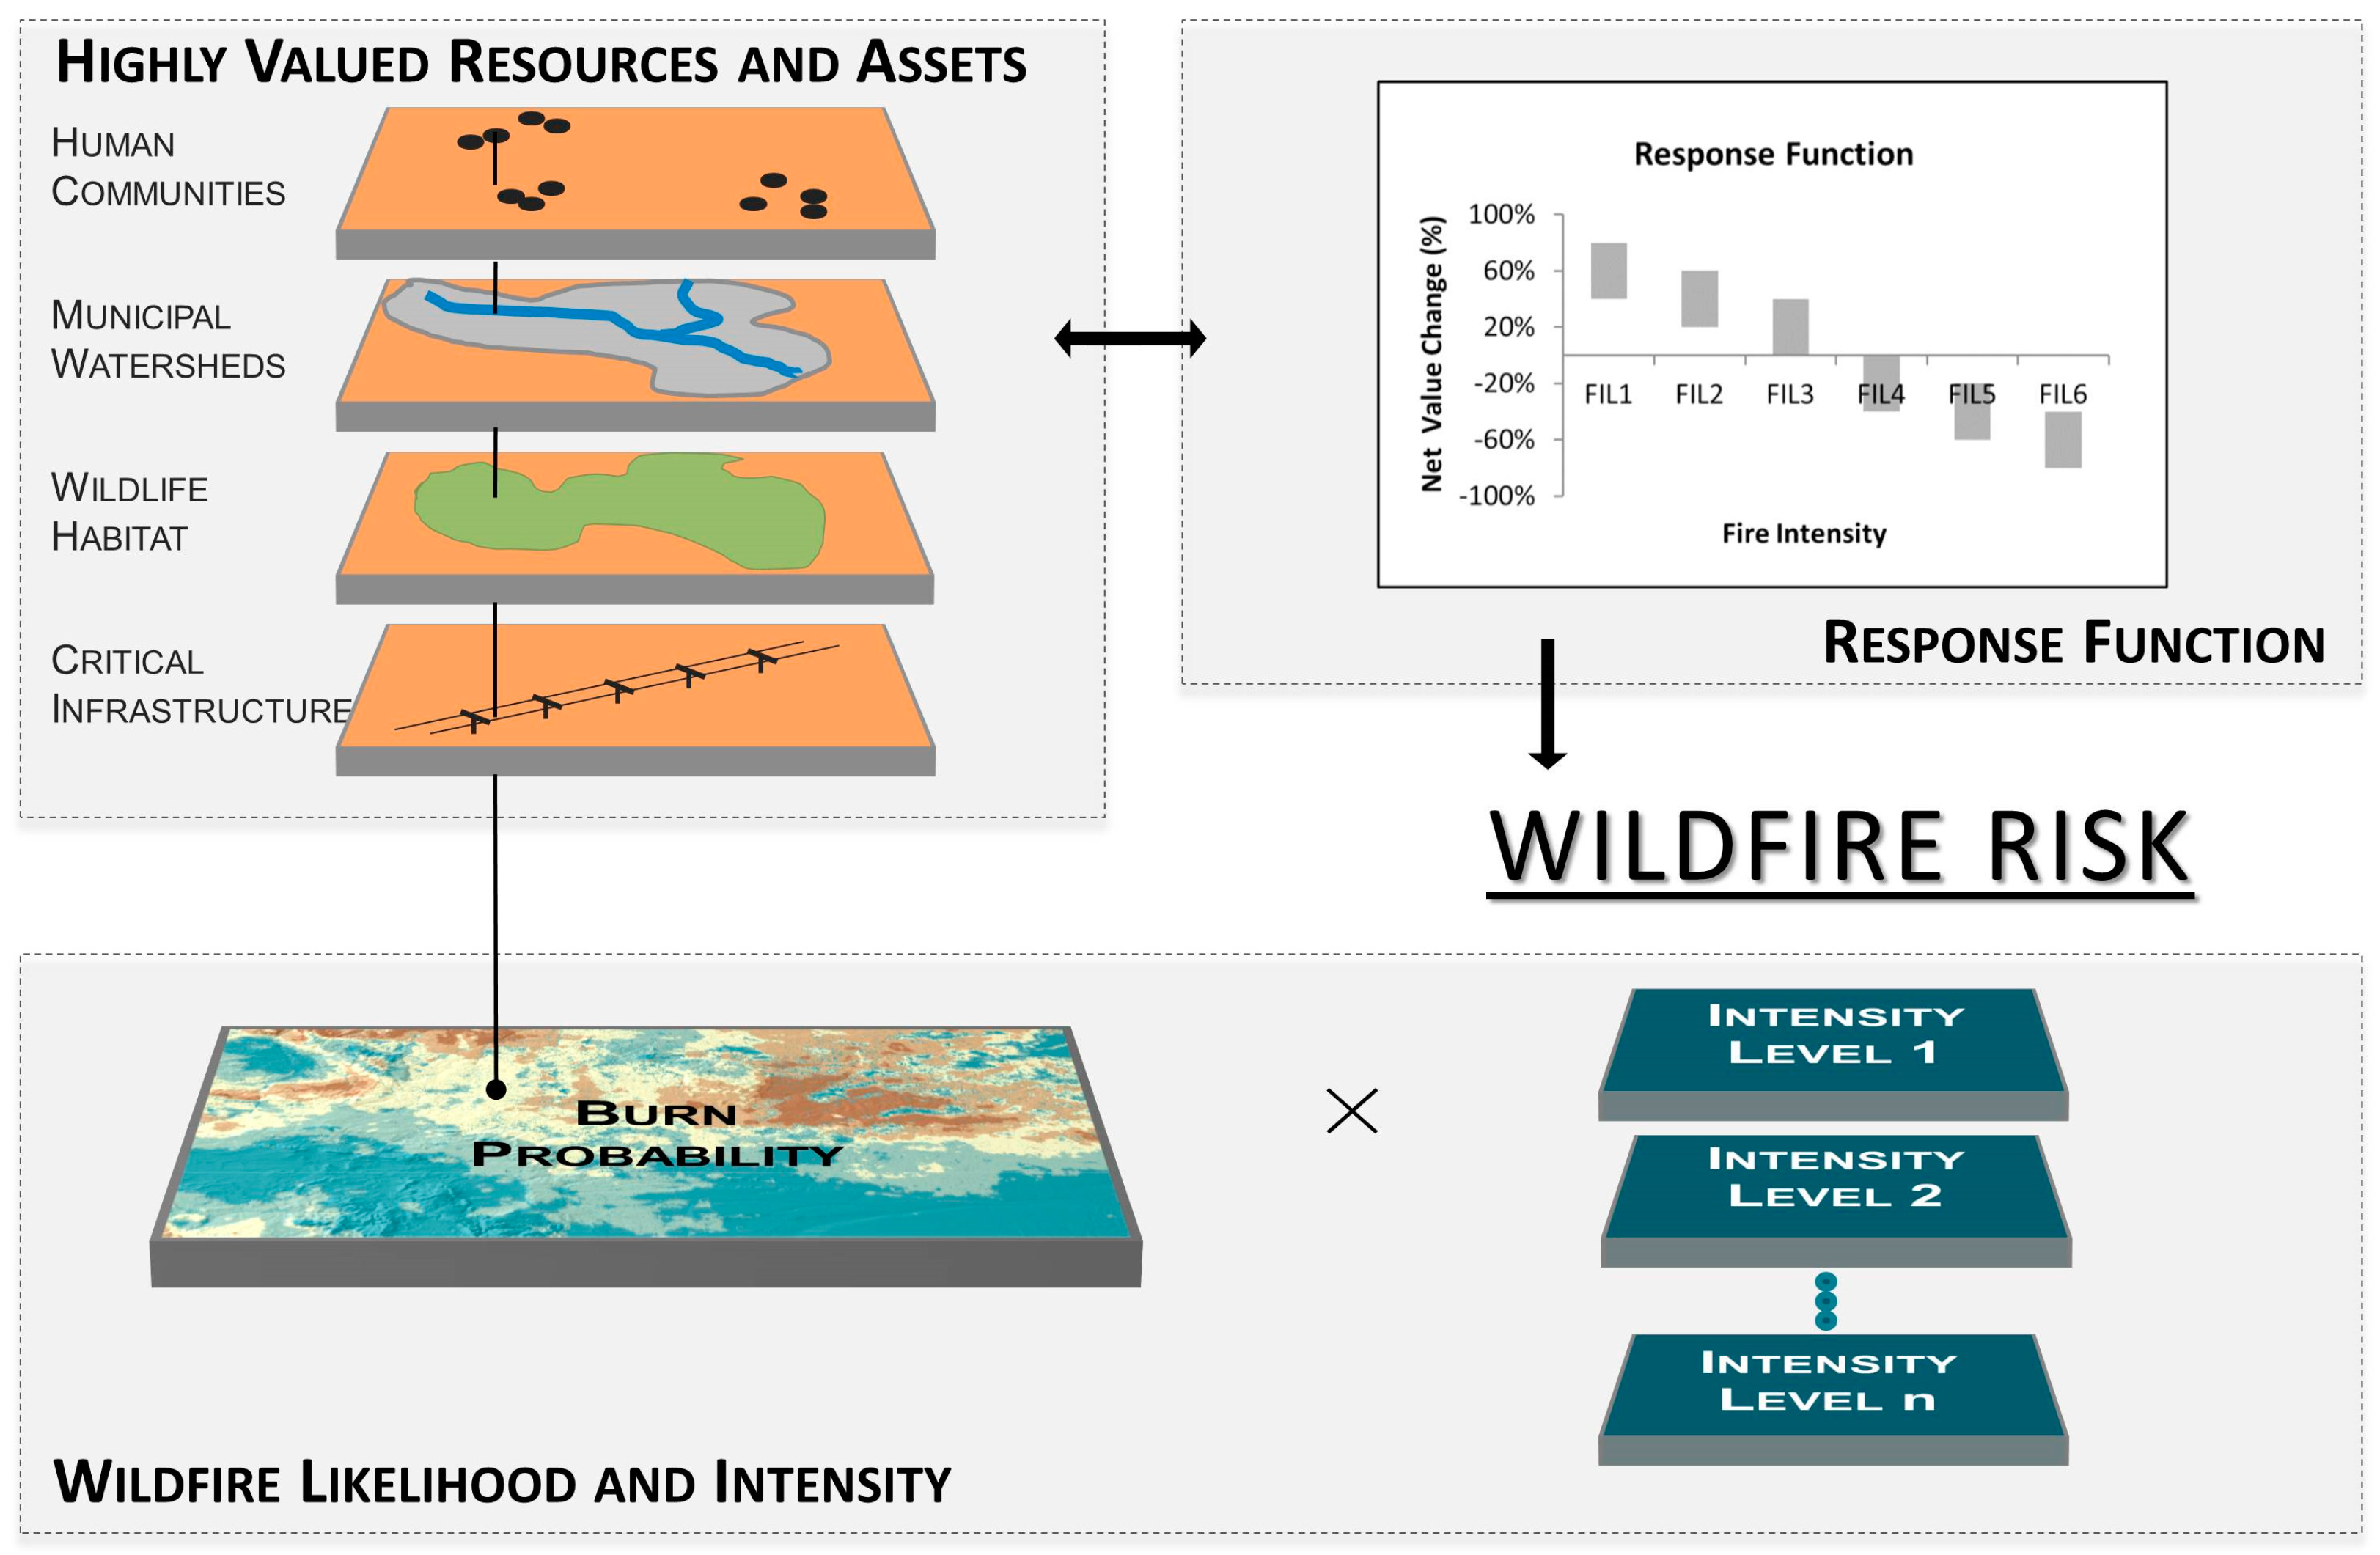
3.1. Wildfire Risk Assessment

Prior to a fire season, spatial representation of wildfire hazard and risk at local and regional scales can be used by fire management agencies to increase preparedness or take actions to reduce potential threats. A well-established and widely-adopted framework for risk assessment entails four primary stages: problem formulation, exposure analysis, effects analysis, and risk characterization [44,45]. Problem formulation includes identification of assessment objectives and endpoints, and how they will fit into subsequent decision processes. Exposure analysis quantifies the degree of potential interaction with the hazard, in this context typically a function of fire likelihood and/or intensity. Effects analysis determines potential consequences to HVRAs given exposure to fire, and lastly risk characterization synthesizes and interprets results to inform decisions.
Note that a wide range of modeling approaches can and have been used in a manner largely consistent with this overarching framework (see [46] for examples). The current generation of pre-fire risk assessments rely on spatial databases of mapped HVRAs, spatially explicit wildfire simulation modeling, and historical weather data to generate maps of potential extreme fire behavior [16,47,48] and have been used as the basis for prioritizing fuel modification treatments [6,49], allocating suppression resources and infrastructure e.g., Visual Cardin in Spain [14], and pre-fire season budget planning e.g., LEOPARDS in Canada [50], and the newly created Wildland Fire Investment Planning System (WFIPS) that is replacing the defunded Fire Analysis and Planning program [51] in the United States.
Perhaps the most fundamental building block of wildfire risk assessment is fire modeling. These approaches generally incorporate fuel conditions and topographic features to simulate fire spread and potential heat output as a function of constant or dynamic weather conditions. The majority of fire simulation models used in the US and Europe rely on empirically-derived physical fire spread equations originally developed by Rothermel [52,53], and applied to fire spread at scales ranging from individual stands, e.g., BehavePlus [54], to landscapes, e.g., FarSite [55], FlamMap [56], and Visual Cardin [39]. Though it should be noted that the limitations of the original Rothermel equations have spurred new research to develop a more complete understanding of fire spread behavior [57,58] with the intent to generate an improved series of physical equations for the next generation of fire spread models. In an effort to address the short-comings of physically based modelling systems, the Canadian Prometheus [12] and Australian PHOENIX Rapidfire [18,59] models rely on empirically observed fire spread relationships and thus are not easily transferrable to new fuel types. Flammable biomass used in fire spread models is characterized by type, volume, and structure and then classified into standard fuel models with similar burn characteristics [60,61].
Spatial data layers used to model potential fire behavior in both physically and empirically-derived fire modeling systems include fuel model (a standard classification of similar fuel attributes), vegetation attributes (canopy height, crown base height, crown bulk density, and percent canopy cover), and topographic features (slope, aspect, and elevation). National databases of all inputs necessary to run fire spread models are available from the LANDFIRE program in the United States [56,62,63], the Canadian Wildland Fire Information System [37], and Australian Fuel Classification System [64]. In much of Western Europe, spatial fuel maps are developed for individual forests or landscapes (e.g., [65]), however, there are plans for eventual fuels classifications at national and regional scales [21].
A fairly new direction with increasing adoption worldwide is burn probability modeling that provides the information on fire likelihood necessary for assessment of exposure and risk (e.g., [66,67,68,69,70,71]). Typically these approaches pair primarily deterministic fire spread models that provide detailed individual fire simulations under static weather and fuel conditions (e.g., FARSITE, Prometheus) with thousands of stochastically generated ignition and weather scenarios, e.g., RANDIG [56], FSim [72], and Burn-P3 [73]. This combination of modeling methods incorporates the realistic fire shapes generated from vector-based deterministic models with the heterogeneity of fuel distributions and weather conditions that can be incorporated into stochastic raster-based fire modeling systems [74]. Variants on this approach have been developed to assess fire risk through the use of custom fuel models and average seasonal weather conditions in southern Italy [75] and economic losses projected from fire exposure in Spain [48,76]. Calibrating model inputs, evaluating model uncertainty, and validating results (often on the basis of fire size distributions) remains a combination of art and science, although recent work is improving methods (e.g., [77,78]), and advances in fire spread theory might eventually lead to next-generation simulation models [57,58].
The large fire simulation model FSim, with which the authors are most familiar, incorporates thousands of simulations of a single fire season such that each fire is subject to weather conditions drawn from a database of historical fire weather, to develop a probability surface of potential flame lengths and mean fire intensities across a region. Fire ignition points are weighted by historical ignition density, developed from a database of documented fire ignitions from 1992 to 2013 [79], filtered by fire size (typically greater than 300 acres), and input into Fsim as an ignition density grid with relative values ranging from 0 to 1. Fire spread and intensity are a function of a fire danger rating index known as Energy Release Component (ERC) that can be calculated for the historical range of wind, temperature, and moisture conditions collected from local weather stations. ERC is dependent upon the range of fuel types present on a given landscape, so to make a continuous ERC surface in FSim, a standard fuel model that contains all size classes of live and dead woody and herbaceous fuels is used [80]. Fuel conditions (fuel volume, type, and structure) are summarized at 30 m pixel resolution in a series of standardized fuel models [61] updated at 2–3 year intervals in the US national LANDFIRE Database [63,81]. Physical fire behavior and spread in the FSim model is also influenced by interactions with topography, which is represented by a digital elevation model also available from LANDFIRE. Results of FSim simulations have been used for a number of applications, including revealing opportunities to manage unplanned ignitions in wilderness areas [82], mapping spatial variation in potential for post-fire debris flows [83], delineating firesheds [84], evaluating the effects of landscape-scale fuel treatment strategies [85], and quantifying municipal watershed exposure [86].
Development of accurate spatial wildfire risk assessments next relies on the creation of a spatial dataset of HVRAs susceptible to wildfire or that need to be considered during a fire response or fuel treatment [41]. Assets typically include areas classified as WUI, where groupings of private and public infrastructure and land holdings occur within or adjacent to flammable landscape fuels, such as permanent infrastructure, timber values, range values, and water conveyance or retention structures subject to heat damage during a fire as well as post-fire flooding or erosion damage [41,87]. Resource values typically refer to ecosystem function and a range of wildlife habitats, tribal values, recreation values, and water quality. In the United States, federal agencies developed a national database of critical infrastructure and private and public structures for use in disaster response that has been incorporated into federal fire planning and response systems [32]. Similar systems are being developed in Canada [37], Europe [20,21], and Australia [59].
Linking mapped HVRA features with fire simulation results enables quantification of exposure. Further combining exposure with analysis of fire effects enables quantification of risk. The emphasis of most of the previously discussed modeling approaches is to identify areas at greatest risk of loss to human and natural values in advance of a fire ignition. The common assumption in each of these models is that fire risk has an inherently negative value. This is juxtaposed with the acknowledgement by several fire management agencies around the world that restoration of low and mixed-severity fires to wildlands and ecosystems adapted to fire is likely to produce long-term benefits under appropriate weather conditions [30,41,88,89,90]. Thus the initiation of changes to the wildfire risk analysis method to allow for a full range of potential fire effects, including potential positive outcomes from fire under certain fire behavior conditions [91].
One example of this change is implemented in a series of new spatial wildfire risk assessments based on fire-derived expected net value change (eNVC) and conditional net value change (cNVC) that are being developed for all public lands across the continental United States. Details of the eNVC and cNVC calculation and spatial modeling framework are in [41]. The principal difference between expected and conditional net value change is that cNVC calculations incorporate probability distributions over fire intensity levels and subsequent fire effects, but do not include the underlying probability of experiencing large fire that enters into the calculation of the statistical expectation for eNVC. We largely focus on cNVC here due to its relevance for response given the occurrence of fire. Under the cNVC valuation model, a full range of potential fire effects can be weighted by management priority to determine a desired level of fire exposure depending on the relative fire response for human assets and ecological resources [41,43,87,92,93]. Results from these analyses can then be translated into place-specific operational objectives that provide decision support during an active fire incident.
Spatially explicit models of eNVC and cNVC are developed for each management unit using a three step process that involves: (1) simulation of large fire behavior using thousands of model runs of a single fire season under the historical range of weather conditions and current fuel loading and topography; (2) expert scoring of HVRA response to the range of possible simulated flame lengths (response function); and (3) weighting of HVRAs by importance to determine their relative contribution to a multi-criteria composite estimate of net value change. The third step is not absolutely necessary, and risk to individual HVRAs can be evaluated separately, but the weighting does facilitate integrated evaluation of all risks across the landscape in commensurate terms (non-market valuation techniques are employed for similar purposes). Figure 3 outlines the basic workflow in a geospatial context that incorporates the primary elements of burn probability, fire intensity, HVRA exposure, and HVRA susceptibility (response functions) (see also Figure 2).
The stylized response function depicted in Figure 3 indicates benefits at low intensity fire but increasing loss as fire intensity increases. While WUI and infrastructure typically have a negative response function to any level of fire exposure, resources such as wildlife habitat and ecosystem function often have a range of positive or negative responses to fire. Determining response functions for specific values subject to fire and relative weighting of each value in a given pixel require input from technical experts and local stakeholders and are subject to revision as new information becomes available or management priorities shift. As implemented to date, best practices for expert judgment elicitation and multi-criteria decision analysis have been used [45,92]. While the development of response functions should be a science-based objective exercise, the relative weighting of resources and assets for their contribution to the final cNVC is inherently subjective and requires careful consideration of long-term management objectives for a landscape. For federal agencies such as the US Forest Service, the Forest Plan provides some guidance for these long-term objectives; however, these too are subject to change. For example, in the 1980s, when most national forests underwent a planning revision cycle, timber production was still considered a major objective for the majority of national forest lands. With a shift over the past two decades toward ecosystem restoration and adaptation to changing climate conditions in western forests, timber values are now weighted lower than they would have been in the 1980s.

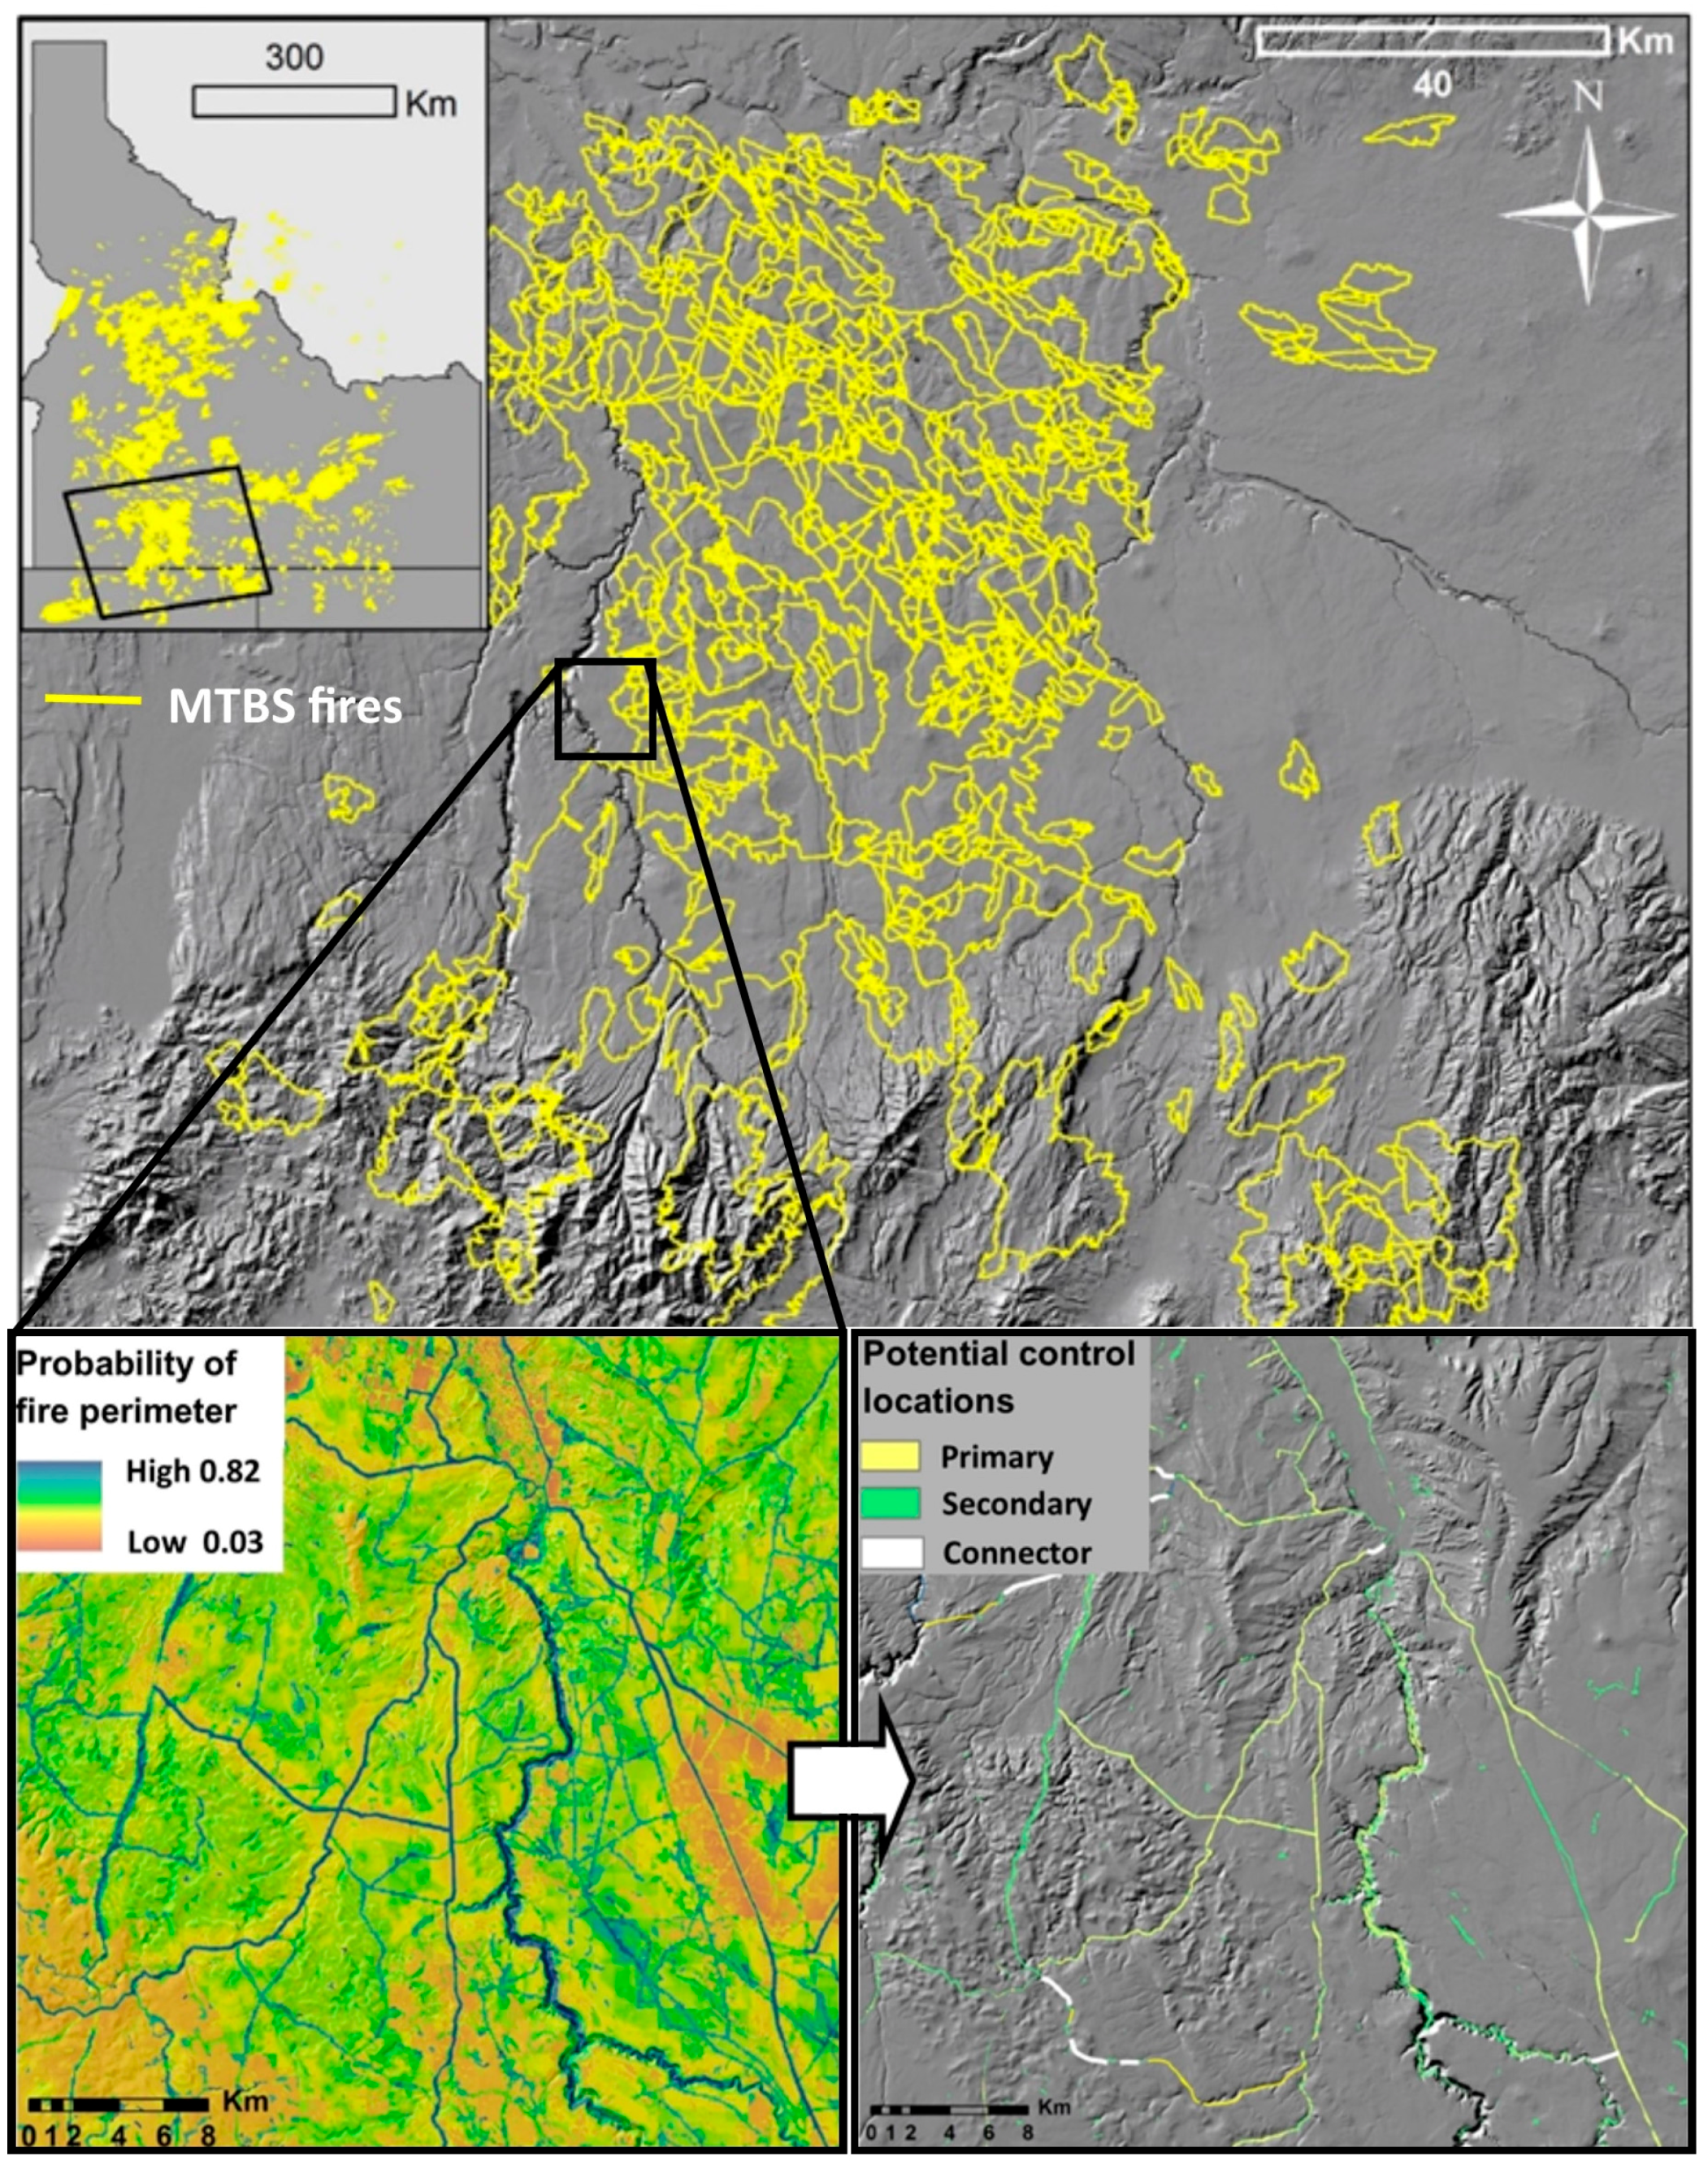
3.2. Spatial Fire Planning

Once a map of probabilistic fire effects on weighted landscape-scale natural resources and human assets is generated (assuming fire exposure), these net value change scores can be classified by fire management objectives. In a study of wildfire risk to a landscape in the southern Sierra Nevada Mountains in California, distinct fire management zones were established for: protection, given a high likelihood of strongly negative effects from fire exposure and need for suppression priority; restoration, if effects from fire exposure were mixed and the objective was to increase fire tolerance in the future, e.g., management priority was fluid based on conditions; or maintenance, given a high likelihood of net benefit from wildfire exposure and a management priority for managed wildfire [65]. Thresholds for each of these management zones are likely to vary depending upon risk to resources and assets on any given landscape.
To classify cNVC into strategic response zones appropriately scaled for fire management, pixel-level heterogeneity must be aggregated, either by spatial majority (cell count) or operational priority (e.g., fire-sensitive endangered species habitat). The scale of this aggregation is highly dependent upon the appropriate scale of wildfire response. A method proposed to address this scaling question is the development of PODs [43]. Delineating features of these operational fire management polygons should ideally be tied to locations that could be used to slow or stop the spread of fire between PODs. Using this rationale, PODs developed for fire maintenance objectives would tend to be larger than those developed for restoration or protection objectives, corresponding to the likelihood of the need to suppress or modify fire behavior within each strategic response zone.
The spatial scale of operational delineations is designed to serve fire planning and incident management purposes. Balancing these objectives requires optimizing a zonal statistic that maximizes homogeneity of POD contents while incorporating reliable fire control features as POD boundaries. The simplest form of automated POD creation is to overlay watershed boundaries at a scale appropriate for planning and fire response e.g., USGS hydrologic unit 12-digit (HUC12) watersheds. Watersheds are bounded by ridges that intuitively may function as limits to fire spread. Inclusion of detailed local knowledge of forest terrain, fuel distributions, road access and quality, and other know barriers to fire spread can be incorporated into a watershed overlay to develop a more informed series of possible POD boundaries [94].
Further refining the idea of potential control locations for use in POD creation, a study developed on a 34,000 km2 landscape along the Idaho/Nevada border in the Western United States used hundreds of historical fire perimeters to develop a predictive model of potential fire control locations (Figure 4). The study area spans an elevational gradient from 709 to 3295 m a.s.l., including shrub, riparian, conifer woodland, mixed-conifer forest, and subalpine vegetation types representing several of the common vegetation types of the western United States. The method used nationally available data products at 30 m spatial resolution to generate a continuous spatial overlay of potential control features and conditions ranked by their associations with past fire perimeters [95]. The machine learning approach in this example used stepwise boosted regression trees coupled with spatial logistic regression to develop a predictive model of potential fire control locations.
Significant spatial predictors of fire perimeters included intuitive physical landscape features such as roads, ridges, valleys, and steep slopes, as well as a series of landscape indices directly related to wildfire management response. Calculated wildfire management indices included Resistance to Control (RTC), a metric derived from fire line construction rates in different fuel types [49]; rate of fire spread (ROS), a fire behavior metric calculated from FLAMMAP model simulations using 90th percentile local weather conditions [56]; Suppression Difficulty Index (SDI) a compound weighted index accounting for potential fire behavior (flame length and intensity), density of roads and fire break features, and fire responder mobility [42]; and a travel cost surface originating from major roads. A 10-fold cross validation suggested a correct classification rate of 62% for a binomial model and 73% for a presence-only model of fire perimeter locations. The continuous likelihood surface generated by the model identified specific locations on the landscape with higher or lower probabilities of resulting in cessation of fire spread (Figure 4) [95]. As an example for potential operational use, locations with high probability of forming a fire perimeter were further classified into primary (p ≥ 60%) or secondary (60% > p ≥ 40%) control locations.
While variability in daily and seasonal weather is a significant contributor to fire spread and final fire size [96,97,98], emergent patterns of landscape features and conditions significantly associated with cessation of fire progression were robust to individual fire weather conditions. Mapped locations of these fire cessation conditions provide a useful network of locations for potential POD boundaries. A network of POD polygons for spatial fire planning or active incident management could leverage mapped potential fire control locations but would also require connecting these locations through fuel treatments or other pre-fire or during-fire management actions. The size, shape, and location of control location connectors could be informed by the continuous fire control probability surface. Thresholds used to identify potential control locations and connecting features during an active fire incident would be subject to weather conditions and available resources.
Reliance on nationally available data products to predict potential control locations allows the methodology to be directly transferred to other regions of the United States. The methods detailed in [95] can potentially be applied to any location with an accurate record of historical fire perimeters, the geospatial information necessary for spatial fire modeling, a detailed spatial transportation layer, and fuel-specific fire line construction rates. Inclusion of fine scale (5–20 m) fuel layers and detailed road and trail networks such as those used in fire modeling studies in Greece [16,69], and Spain [42,70] could further improve the predictive ability of a potential control location model.

3.3. Mapping Responder Safety

The number of active duty wildland fire responder fatalities each year has not declined significantly over the past two decades [101], even with technological advances in communications, weather tracking and forecasting; transportation; aviation suppression resources; and personal safety gear [102]. Effective pre-fire planning has potential to significantly reduce the number of fatalities associated with transportation (driving and aviation) by tailoring mobilization of fire suppression resources to pre-defined management objectives where an incident is taking place, thus limiting unnecessary or ineffective fire suppression actions [88,103]. Fatalities caused by fire responder entrapment and burn over can be directly addressed by pre-identifying areas of extreme risk to fire responder safety such as the explosive Arizona chaparral fuel complex that took 19 fire responder lives in 2013 [104]. Current efforts to inform fire responders about heightened safety risks rely on rules of thumb from field manuals [105] or direct communication from fire analysts to field crews to initiate evacuation protocols. Translating rules of thumb and additional information about fuel structures, mobility, and potential fire behavior into a spatially explicit index of risk to fire responder safety could serve as a useful tool for operations planning and provide important information about spatial fire risk to fire responders on the ground.
One promising method for developing spatial assessments of risk to fire responder safety is a slightly modified version of the spatially explicit SDI in which air support variables are excluded [42,95]. The terrestrial SDI (tSDI) can be used to determine locations where potential flame lengths and heat intensities are likely to render parts of a landscape unsafe for direct attack tactics, scouting, or ground transportation (Figure 5).
Supporting this effort outside of the US-based case study, studies of response planning and determining suppression capabilities using the SDI methodology have expanded since initial proof-of-concept on landscapes in Spain, Israel, and Chile (Figure 6). Particularly notable is use of the SDI in Spain, where more than 825,000 ha of forested landscapes have been analyzed. The annual rate of SDI evaluations on different landscapes using GIS tools is approximately 40,000 ha/year.
Other promising refinements to SDI include incorporation of additional fire behavior variables and their implications for responder safety. These insights stem in part from monitoring results and lessons learned on large fires (e.g., Fire Quesada 2015, Spain), and have led to proposed new functional forms for the SDI calculation algorithm. In this sense, the SDI could be modified to consider how fire behavior energy release varies not only with surface fire and crown fire propagation, but also factors like narrow canyons conducive to explosive fire behavior as well as fire propagation in WUI zones.
Along with the potential for promoting fire responder safety, these next-generation versions of SDI could also provide more accurate information to help decision making for strategic planning and response to wildland fires. Another possible advantage is the prospect of more accurately estimating suppression expenditures given likely suppression resource demands, facilitating more refined and informed decisions regarding large fire management.

4. Conclusions

While research and development activities continue to improve the use of GIS integration into wildfire incident management, planning, and monitoring, the greatest improvements still to be incorporated into wildland fire management exist in pre-fire risk assessment and planning. The use of spatial planning at regional scales can be used to inform short and long-term fire management strategies by identifying and quantifying specific risks to human assets, opportunities for fire-induced enhancement of natural resources, strategies to mitigate negative consequences of fire transmission from one land ownership to another, and pre-identification of landscape conditions hazardous to fire responders on the ground.
Some remaining challenges for fire managers will be to integrate these new methods into existing WFDSSs and to assure that the risk assessment and management objective formulation process is done at regular intervals that ensure results reflect current landscape conditions. Wildfire management is an evolving process comprised of a range of objectives and policies. Geospatial technologies and a rapid increase in information exchange within the global fire management community are contributing to more informed, science-based decision making that holds promise for both the human and ecological sides of the wildfire management problem.

Acknowledgments

The United States Forest Service Rocky Mountain Research Station and National Fire Decision Support Center supported this research. The authors would like to thank Jon Rieck for creating Figure 1 and David Calkin for thoughtful insights on the concepts discussed in this review. The authors would like to thank two anonymous reviewers for their comments that improved the clarity and scope of the manuscript.

Author Contributions

Christopher D. O’Connor, Matthew P. Thompson and Francisco Rodríguez y Silva conceived the structure and components of the review. Christopher D. O’Connor and Matthew P. Thompson wrote the paper with sections contributed by Francisco Rodríguez y Silva.

Conflicts of Interest

The authors declare no conflict of interest.

References

  1. Jolly, W.M.; Cochrane, M.A.; Freeborn, P.H.; Holden, Z.A.; Brown, T.J.; Williamson, G.J.; Bowman, D.M.J.S. Climate-induced variations in global wildfire danger from 1979 to 2013. Nat. Commun. 2015, 6. [Google Scholar] [CrossRef] [PubMed]
  2. National Climate Assessment (NCA). Climate Change Impacts in the United States: The Third National Climate Assessment; U.S. Global Change Research Program: Washington, DC, USA, 2014; pp. 418–440.
  3. IPCC. Part A: Global and Sectoral Aspects. Contribution of Working Group II to the Fifth Assessment Report of the Intergovernmental Panel on Climate Change. In Climate Change 2014: Impacts, Adaptation, and Vulnerability; Field, C.B., Barros, V.R., Dokken, D.J., Mach, K.J., Mastrandrea, M.D., Bilir, T.E., Chatterjee, M., Ebi, K.L., Estrada, Y.O., Genova, R.C., et al., Eds.; Cambridge University Press: Cambridge, UK; New York, NY, USA, 2014; p. 1132. [Google Scholar]
  4. Martinuzzi, S.; Stewart, S.I.; Helmers, D.P.; Mockrin, M.H.; Hammer, R.B.; Radeloff, V.C. The 2010 Wildland-Urban Interface of the Conterminous United States; U.S. Department of Agriculture, Forest Service, Northern Research Station: Newtown Square, PA, USA, 2015; p. 127.
  5. United Nations Economic Commission for Europe (UNECE). The Condition of Forests in Europe; United Nations Economic Commission for Europe: Geneva, Switzerland, 2004; p. 52. [Google Scholar]
  6. Lafortezza, R.; Tanentzap, A.J.; Elia, M.; John, R.; Sanesi, G.; Chen, J. Prioritizing fuel management in urban interfaces threatened by wildfires. Ecol. Indic. 2015, 48, 342–347. [Google Scholar] [CrossRef]
  7. Adams, M.A. Mega-fires, tipping points and ecosystem services: Managing forests and woodlands in an uncertain future. For. Ecol. Manag. 2013, 294, 250–261. [Google Scholar] [CrossRef]
  8. Stephens, S.L.; Burrows, N.; Buyantuyev, A.; Gray, R.W.; Keane, R.E.; Kubian, R.; Liu, S.; Seijo, F.; Shu, L.; Tolhurst, K.G.; et al. Temperate and boreal forest mega-fires: Characteristics and challenges. Front. Ecol. Environ. 2014, 12, 115–122. [Google Scholar] [CrossRef]
  9. Federal Emergency Management Agency (FEMA). Fire Death Rate Trends: An International Perspective; U.S. Department of Homeland Security; U.S. Fire Administration, and National Fire Data Center: Emmitsburg, MD, USA, 2011; pp. 1–8.
  10. National Interagency Fire Center (NIFC). Federal Fire Fighting Costs. Available online: https://www.nifc.gov/fireInfo/fireInfo_documents/SuppCosts.pdf (accessed on 22 July 2016).
  11. Noonan-Wright, E.K.; Opperman, T.S.; Finney, M.A.; Zimmerman, G.T.; Seli, R.C.; Elenz, L.M.; Calkin, D.E.; Fiedler, J.R. Developing the US wildland fire decision support system. J. Combust. 2011, 14. [Google Scholar] [CrossRef]
  12. Tymstra, C.; Bryce, R.; Wotton, B.; Taylor, S.; Armitage, O. Development and Structure of Prometheus: The Canadian Wildland Fire Growth Simulation Model; Northern Forestry Centre: Edmonton, AB, Canada, 2010; p. 102. [Google Scholar]
  13. Julio, G.; Pedernera, P.; Castillo, E. Diseño funcional de simulador de incendios forestales. In Actas Taller Internacional Proyecto; FONDEF FI-13: Santiago, Chile, 1995; pp. 182–204. (In Spanish) [Google Scholar]
  14. Rodríguez y Silva, F.; González-Cabán, A. ‘SINAMI’: A tool for the economic evaluation of forest fire management programs in Mediterranean ecosystems. Int. J. Wildland Fire 2010, 19, 927–936. [Google Scholar] [CrossRef]
  15. Jové, J.F.; Casas, P.F.I.; Petit, A.G.; Casanovas, J. FireFight: A decision support system for forest fire containment. In Improving Disaster Resilience and Mitigation-IT Means and Tools; Springer: Berlin, Germany, 2014; pp. 293–305. [Google Scholar]
  16. Kalabokidis, K.; Ager, A.; Finney, M.; Athanasis, N.; Palaiologou, P.; Vasilakos, C. AEGIS: A wildfire prevention and management information system. Nat. Hazards Earth Syst. Sci. 2016, 16, 643–661. [Google Scholar] [CrossRef]
  17. Khan, V. Long-range forecasting of forest fire danger based on the SLAV model seasonal ensemble forecasts. Russ. Meteorol. Hydrol. 2012, 37, 505–513. [Google Scholar] [CrossRef]
  18. Tolhurst, K.; Shields, B.; Chong, D. Phoenix: Development and application of a bushfire risk management tool. Aust. J. Emerg. Manag. 2008, 23, 47–54. [Google Scholar]
  19. Corgnati, L.; Gabella, M.; Perona, G. FIREcast System-Provisional Fire Danger Index Computation System for Alpine Regions. WIT Trans. Ecol. Environ. 2008, 19. [Google Scholar] [CrossRef]
  20. San-Miguel-Ayanz, J.; Barbosa, P.; Schmuck, G.; Liberta, G.; Schulte, E. Towards a Coherent Forest Fire Information System in Europe: The European Forest Fire Information System (EFFIS); Millpress Science Publishers: Rotterdam, The Netherlands, 2002. [Google Scholar]
  21. European Forest Fire Information System (EFFIS). Available online: http://forest.jrc.ec.europa.eu/effis/ (accessed on 22 July 2016).
  22. Calkin, D.E.; Gebert, K.M.; Jones, J.G.; Neilson, R.P. Forest Service large fire area burned and suppression expenditure trends, 1970–2002. J. For. 2005, 103, 179–183. [Google Scholar]
  23. Moritz, M.A.; Batllori, E.; Bradstock, R.A.; Gill, A.M.; Handmer, J.; Hessburg, P.F.; Leonard, J.; McCaffrey, S.; Odion, D.C.; Schoennagel, T.; et al. Learning to coexist with wildfire. Nature 2014, 515, 58–66. [Google Scholar] [CrossRef] [PubMed]
  24. North, M.; Stephens, S.; Collins, B.M.; Agee, J.K.; Aplet, G.; Franklin, J.F.; Fule, P.Z. Insights: Reform forest fire management. Science 2015, 349, 1280–1281. [Google Scholar] [CrossRef] [PubMed]
  25. Meyer, M.D.; Roberts, S.L.; Wills, R.; Brooks, M.; Winford, E.M. Principles of effective USA federal fire management plans. Fire Ecol. 2015, 11, 59–83. [Google Scholar]
  26. Corona, P.; Ascoli, D.; Barbati, A.; Bovio, G.; Colangelo, G.; Elia, M.; Garfì, V.; Iovino, F.; Lafortezza, R.; Leone, V. Integrated forest management to prevent wildfires under Mediterranean environments. Ann. Silvic. Res. 2015, 39, 1–22. [Google Scholar]
  27. Kolström, M.; Lindner, M.; Vilén, T.; Maroschek, M.; Seidl, R.; Lexer, M.J.; Netherer, S.; Kremer, A.; Delzon, S.; Barbati, A.; et al. Reviewing the science and implementation of climate change adaptation measures in European forestry. Forests 2011, 2, 961–982. [Google Scholar] [CrossRef] [Green Version]
  28. Oliveira, T.M.; Barros, A.M.; Ager, A.A.; Fernandes, P.M. Assessing the effect of a fuel break network to reduce burnt area and wildfire risk transmission. Int. J. Wildland Fire 2016, 25, 619–632. [Google Scholar] [CrossRef]
  29. Salis, M.; Laconi, M.; Ager, A.A.; Alcasena, F.J.; Arca, B.; Lozano, O.; de Oliveira, A.F.; Spano, D. Evaluating alternative fuel treatment strategies to reduce wildfire losses in a Mediterranean area. For. Ecol. Manag. 2016, 368, 207–221. [Google Scholar] [CrossRef]
  30. Martell, D.L. A Review of recent forest and wildland fire management decision support systems research. Curr. For. Rep. 2015, 1, 128–137. [Google Scholar] [CrossRef]
  31. Duff, T.J.; Tolhurst, K.G. Operational wildfire suppression modelling: A review evaluating development, state of the art and future directions. Int. J. Wildland Fire 2015, 24, 735–748. [Google Scholar] [CrossRef]
  32. Calkin, D.E.; Thompson, M.P.; Finney, M.A.; Hyde, K.D. A real-time risk assessment tool supporting wildland fire decisionmaking. J. For. 2011, 109, 274–280. [Google Scholar]
  33. Finney, M.A.; Grenfell, I.C.; McHugh, C.W.; Seli, R.C.; Trethewey, D.; Stratton, R.D.; Brittain, S. A method for ensemble wildland fire simulation. Environ. Model. Assess. 2011, 16, 153–167. [Google Scholar] [CrossRef]
  34. Syphard, A.D.; Keeley, J.E.; Brennan, T.J. Factors affecting fuel break effectiveness in the control of large fires on the Los Padres National Forest, California. Int. J. Wildland Fire 2011, 20, 764–775. [Google Scholar] [CrossRef]
  35. McHugh, C.W. Release Notes FlamMap, Version 5.0.0.; U.S. Forest Service Rocky Mountain Research Station Fire Sciences Lab. 2012. Available online: http://www.firelab.org/sites/default/files/images/downloads/ReleaseNotes_FMP5_0_0.pdf (accessed on 22 July 2016).
  36. Pugnet, L.; Chong, D.; Duff, T.; Tolhurst, K. Wildland–urban interface (WUI) fire modelling using PHOENIX Rapidfire: A case study in Cavaillon, France. In Proceedings of the 20th International Congress on Modelling and Simulation, Adelaide, Australia, 1–6 December 2013; pp. 228–234.
  37. Canadian Wildfire Information System (CWFIS). Available online: http://cwfis.cfs.nrcan.gc.ca/home (accessed on 22 July 2016).
  38. Andrews, P. BEHAVE: Fire Behavior Prediction and Fuel Modeling System-BURN Subsystem, Part 1. USDA Forest Service; General Technical Report INT-194; Intermountain Forest and Range Experiment Station: Ogden, UT, USA, 1986; p. 130. [Google Scholar]
  39. Rodríguez y Silva, F. Aplicaciones de la predicción y simulación del comportamiento d en la extinción de incendios forestales. Revista Incendios Forestales 2003, 8. (In Spanish) [Google Scholar]
  40. Scott, J.H.; Thompson, M.P. Emerging Concepts in Wildfire Risk Assessment and Management; Keane, R.E., Jolly, W.M., Parsons, R.A., Riley, K.L., Eds.; U.S. Department of Agriculture, Forest Service, Rocky Mountain Research Station: Missoula, MT, USA, 2014; pp. 196–206.
  41. Scott, J.H.; Thompson, M.P.; Calkin, D.E. A Wildfire Risk Assessment Framework for Land and Resource Management, 2013th ed.USDA Forest Service Rocky Mountain Research Station: Missoula, MT, USA, 2013; p. 83.
  42. Rodríguez y Silva, F.; Martínez, J.R.M.; González-Cabán, A. A methodology for determining operational priorities for prevention and suppression of wildland fires. Int. J. Wildland Fire 2014, 23, 544–554. [Google Scholar] [CrossRef]
  43. Thompson, M.P.; Bowden, P.; Brough, A.; Scott, J.H.; Gilbertson-Day, J.; Taylor, A.; Anderson, J.; Haas, J.R. Application of wildfire risk assessment results to wildfire response planning in the Southern Sierra Nevada, California, USA. Forests 2016, 7, 64. [Google Scholar] [CrossRef]
  44. Fairbrother, A.; Turnley, J.G. Predicting risks of uncharacteristic wildfires: Application of the risk assessment process. For. Ecol. Manag. 2005, 211, 28–35. [Google Scholar] [CrossRef]
  45. Thompson, M.P.; Haas, J.R.; Gilbertson-Day, J.W.; Scott, J.H.; Langowski, P.; Bowne, E.; Calkin, D.E. Development and application of a geospatial wildfire exposure and risk calculation tool. Environ. Model. Softw. 2015, 63, 61–72. [Google Scholar] [CrossRef]
  46. Thompson, M.P.; Calkin, D.E. Uncertainty and risk in wildland fire management: A review. J. Environ. Manag. 2011, 92, 1895–1909. [Google Scholar] [CrossRef] [PubMed]
  47. Dillon, G.; Morgan, P.; Holden, Z. Mapping the potential for high severity wildfire in the western United States. Fire Manag. Today 2011, 71, 25–28. [Google Scholar]
  48. Chuvieco, E.; Aguado, I.; Jurdao, S.; Pettinari, M.; Yebra, M.; Salas, J.; Hantson, S.; de la Riva, J.; Ibarra, P.; Rodrigues, M. Integrating geospatial information into fire risk assessment. Int. J. Wildland Fire 2014, 23, 606–619. [Google Scholar] [CrossRef]
  49. Dillon, G.K.; Menakis, J.; Fay, F. Wildland Fire Potential: A Tool for Assessing Wildfire Risk and Fuels Management Needs; Keane, R.E., Jolly, M., Parsons, R., Riley, K., Eds.; U.S. Department of Agriculture, Forest Service, Rocky Mountain Research Station: Fort Collins, CO, USA, 2014; pp. 60–76.
  50. McAlpine, R.S.; Hirsch, K.G. An overview of LEOPARDS: The level of protection analysis system. For. Chron. 1999, 75, 615–621. [Google Scholar] [CrossRef]
  51. Hand, M.S.; Gebert, K.M.; Liang, J.; Calkin, D.E.; Thompson, M.P.; Zhou, M. Economics of Wildfire Management: The Development and Application of Suppression Expenditure Models; Springer Science & Business Media: Berlin, Germany, 2014. [Google Scholar]
  52. Rothermel, R.C. A Mathematical Model for Predicting Fire Spread in Wildland Fuels; Research Paper INT-115; USDA Forest Service, Intermountain Forest and Range Experiment Station: Ogden, UT, USA, 1972; p. 47.
  53. Rothermel, R.C. How to Predict the Spread and Intensity of Forest and Range Fires; General Technical Report INT-143; USDA Forest Service, Intermountain Forest and Range Experiment Station: Ogden, UT, USA, 1983; p. 161.
  54. Andrews, P.L. Current status and future needs of the BehavePlus Fire Modeling System. Int. J. Wildland Fire 2014, 23, 21–33. [Google Scholar] [CrossRef]
  55. Finney, M.A. FARSITE: Fire Area Simulator: Model Development and Evaluation; U.S. Department of Agriculture, Forest Service, Rocky Mountain Research Station: Ogden, UT, USA, 2004; p. 52.
  56. Finney, M.A. An Overview of FlamMap Fire Modeling Capabilities; Andrews, P.L., Butler, B.W., Eds.; USDA Forest Service, Rocky Mountain Research Station: Fort Collins, CO, USA, 2006; pp. 28–30.
  57. Finney, M.A.; Cohen, J.D.; McAllister, S.S.; Jolly, W.M. On the need for a theory of wildland fire spread. Int. J. Wildland Fire 2013, 22, 25–36. [Google Scholar] [CrossRef]
  58. Finney, M.A.; Cohen, J.D.; Forthofer, J.M.; McAllister, S.S.; Gollner, M.J.; Gorham, D.J.; Saito, K.; Akafuah, N.K.; Adam, B.A.; English, J.D. Role of buoyant flame dynamics in wildfire spread. Proc. Natl. Acad. Sci. USA 2015, 112, 9833–9838. [Google Scholar] [CrossRef] [PubMed]
  59. Bushfires and Natural Hazards CRC (BNHCRC). Available online: http://www.bnhcrc.com.au/home (accessed on 22 July 2016).
  60. Anderson, H.E. Aids to Determining Fuel Models for Estimating Fire Behavior; General Technical Report INT-122; USDA Forest Service; Intermountain Forest and Range Experiment Station: Ogden, UT, USA, 1982; p. 22.
  61. Scott, J.H.; Burgan, R.E. Standard Fire Behavior Fuel Models: A Comprehensive Set for use with Rothermel’s Surface Fire Spread Model; RMRS-GTR-153; USDA Forest Service, Rocky Mountain Research Station: Fort Collins, CO, USA, 2005; p. 72.
  62. Rollins, M.G. LANDFIRE: A nationally consistent vegetation, wildland fire, and fuel assessment. Int. J. Wildland Fire 2009, 18, 235–249. [Google Scholar] [CrossRef]
  63. LANDFIRE. LANDFIRE LFDAT 2.6 National Fire Data Program; USDA Forest Service and U.S. Department of the Interior, Geological Survey. Available online: http://www.landfire.gov/ (accessed on 22 July 2016).
  64. Hollis, J.J.; Gould, J.S.; Cruz, M.G.; Lachlan McCaw, W. Framework for an Australian fuel classification to support bushfire management. Aust. For. 2015, 78, 1–17. [Google Scholar] [CrossRef]
  65. Rodriguez y Silva, F.; Molina-Martínez, J.R. Modeling Mediterranean forest fuels by integrating field data and mapping tools. Eur. J. For. Res. 2012, 131, 571–582. [Google Scholar] [CrossRef]
  66. Ager, A.A.; Day, M.A.; McHugh, C.W.; Short, K.; Gilbertson-Day, J.; Finney, M.A.; Calkin, D.E. Wildfire exposure and fuel management on western US national forests. J. Environ. Manag. 2014, 145, 54–70. [Google Scholar] [CrossRef] [PubMed]
  67. Mitsopoulos, I.; Mallinis, G.; Arianoutsou, M. Wildfire risk assessment in a typical Mediterranean wildland–urban interface of Greece. Environ. Manag. 2015, 55, 900–915. [Google Scholar] [CrossRef] [PubMed]
  68. Salis, M.; Ager, A.A.; Arca, B.; Finney, M.A.; Bacciu, V.; Duce, P.; Spano, D. Assessing exposure of human and ecological values to wildfire in Sardinia, Italy. Int. J. Wildland Fire 2013, 22, 549–565. [Google Scholar] [CrossRef]
  69. Mallinis, G.; Mitsopoulos, I.; Beltran, E.; Goldammer, J. Assessing wildfire risk in cultural heritage properties using high spatial and temporal resolution satellite imagery and spatially explicit fire simulations: The case of Holy Mount Athos, Greece. Forests 2016, 7, 46. [Google Scholar] [CrossRef]
  70. Alcasena, F.J.; Salis, M.; Vega-García, C. A fire modeling approach to assess wildfire exposure of valued resources in central Navarra, Spain. Eur. J. For. Res. 2016, 135, 87–107. [Google Scholar] [CrossRef]
  71. Carmel, Y.; Paz, S.; Jahashan, F.; Shoshany, M. Assessing fire risk using Monte Carlo simulations of fire spread. For. Ecol. Manag. 2009, 257, 370–377. [Google Scholar] [CrossRef]
  72. Finney, M.A.; McHugh, C.W.; Grenfell, I.C.; Riley, K.L.; Short, K.C. A simulation of probabilistic wildfire risk components for the continental United States. Stoch. Environ. Res. Risk Assess. 2011, 25, 973–1000. [Google Scholar] [CrossRef]
  73. Parisien, M.-A.; Miller, C.; Ager, A.A.; Finney, M.A. Use of artificial landscapes to isolate controls on burn probability. Landsc. Ecol. 2010, 25, 79–93. [Google Scholar] [CrossRef]
  74. Pacheco, A.P.; Claro, J.; Fernandes, P.M.; de Neufville, R.; Oliveira, T.M.; Borges, J.G.; Rodrigues, J.C. Cohesive fire management within an uncertain environment: A review of risk handling and decision support systems. For. Ecol. Manag. 2015, 347, 1–17. [Google Scholar] [CrossRef]
  75. Semeraro, T.; Mastroleo, G.; Aretano, R.; Facchinetti, G.; Zurlini, G.; Petrosillo, I. GIS Fuzzy Expert System for the assessment of ecosystems vulnerability to fire in managing Mediterranean natural protected areas. J. Environ. Manag. 2016, 168, 94–103. [Google Scholar] [CrossRef] [PubMed]
  76. Rodriguez y Silva, F.; Molina-Martínez, J.R.; Herrera Machuca, M.A.; Rodréguez Leal, J.M. VISUAL-SEVEIF, a tool for integrating fire behavior simulation and economic evaluation of the impact of Wildfires. In General Technical Report PSW-GTR-245, Proceedings of the Fourth International Symposium on Fire Economics, Planning, and Policy: Climate Change and Wildfires, Mexico City, Mexico, 5–11 November 2012; pp. 163–178.
  77. Ervilha, A.; Pereira, J.; Pereira, J. On the parametric uncertainty quantification of the Rothermel’s rate of spread model. Appl. Math. Model. 2016. [Google Scholar] [CrossRef]
  78. Duff, T.J.; Chong, D.M.; Tolhurst, K.G. Indices for the evaluation of wildfire spread simulations using contemporaneous predictions and observations of burnt area. Environ. Model. Softw. 2016, 83, 276–285. [Google Scholar] [CrossRef]
  79. Short, K. A spatial database of wildfires in the United States, 1992–2011. Earth Syst. Sci. Data 2014, 6, 1–27. [Google Scholar] [CrossRef]
  80. Energy Release Component (ERC) Fact Sheet. Texas Interagency Coordination Center (TICC): Lufkin, TX, USA, 2016; Available online: http://ticc.tamu.edu/Documents/PredictiveServices/Fuels/ERC_fact_sheet.pdf (accessed on 22 July 2016).
  81. Ryan, K.C.; Opperman, T.S. LANDFIRE–A national vegetation/fuels data base for use in fuels treatment, restoration, and suppression planning. For. Ecol. Manag. 2013, 294, 208–216. [Google Scholar] [CrossRef]
  82. Barnett, K.; Miller, C.; Venn, T.J. Using risk analysis to reveal opportunities for the management of unplanned ignitions in wilderness. J. For. 2016, 114, 1–9. [Google Scholar]
  83. Tillery, A.C.; Haas, J.R.; Miller, L.W.; Scott, J.H.; Thompson, M.P. Potential Postwildfire Debris-Flow Hazards: A Prewildfire Evaluation for the Sandia and Manzano Mountains and Surrounding Areas, Central New Mexico; U.S. Geological Survey Scientific Investigations Report 5161; U.S. Geological Survey: Reston, VA, USA, 2014; p. 24.
  84. Thompson, M.P.; Scott, J.; Kaiden, J.D.; Gilbertson-Day, J.W. A polygon-based modeling approach to assess exposure of resources and assets to wildfire. Nat. Hazards 2013, 67, 627–644. [Google Scholar] [CrossRef]
  85. Scott, J.H.; Thompson, M.P.; Gilbertson-Day, J.W. Examining alternative fuel management strategies and the relative contribution of National Forest System land to wildfire risk to adjacent homes—A pilot assessment on the Sierra National Forest, California, USA. For. Ecol. Manag. 2016, 362, 29–37. [Google Scholar] [CrossRef]
  86. Scott, J.; Helmbrecht, D.; Thompson, M.P.; Calkin, D.E.; Marcille, K. Probabilistic assessment of wildfire hazard and municipal watershed exposure. Nat. Hazards 2012, 64, 707–728. [Google Scholar] [CrossRef] [Green Version]
  87. Nicolet, T. Southwestern Wildfire Risk Assessment; USDA Forest Service: Albuquerque, NM, USA, 2015; p. 34.
  88. Calkin, D.E.; Thompson, M.P.; Finney, M.A. Negative consequences of positive feedbacks in U.S. wildfire management. For. Ecosyst. 2015, 2, 1–10. [Google Scholar] [CrossRef]
  89. Murphy, B.P.; Cochrane, M.A.; Russell-Smith, J. Prescribed burning protects endangered tropical heathlands of the Arnhem Plateau, northern Australia. J. Appl. Ecol. 2015, 52, 980–991. [Google Scholar] [CrossRef]
  90. McCaw, W.L. Managing forest fuels using prescribed fire—A perspective from southern Australia. For. Ecol. Manag. 2013, 294, 217–224. [Google Scholar] [CrossRef]
  91. Finney, M.A. The challenge of quantitative risk analysis for wildland fire. For. Ecol. Manag. 2005, 211, 97–108. [Google Scholar] [CrossRef]
  92. Thompson, M.P.; Scott, J.; Helmbrecht, D.; Calkin, D.E. Integrated wildfire risk assessment: Framework development and application on the Lewis and Clark National Forest in Montana, USA. Integr. Environ. Assess. Manag. 2013, 9, 329–342. [Google Scholar] [CrossRef] [PubMed]
  93. Scott, J.H.; Helmbrecht, D.J.; Thompson, M.P. Assessing the Expected Effects of Wildfire on Vegetation Condition on the Bridger-Teton National Forest, Wyoming, USA; Resarch Note: RMRS-RN-71; U.S. Department of Agriculture, Forest Service, Rocky Mountain Research Station: Fort Collins, CO, USA, 2014; p. 36.
  94. Dunn, C.J.; Thompson, M.P.; Calkin, D.E. A framework for developing safe and efficient large-fire incident response strategies and tactics for a new fire management paradigm. Int. J. Wildland Fire. (in press).
  95. O’Connor, C.D.; Calkin, D.E.; Thompson, M.P. An empirical machine learning method for predicting fire control locations for pre-fire planning and operational management. Int. J. Wildland Fire. (under review).
  96. Bradstock, R.A.; Hammill, K.A.; Collins, L.; Price, O. Effects of weather, fuel and terrain on fire severity in topographically diverse landscapes of south-eastern Australia. Landsc. Ecol. 2010, 25, 607–619. [Google Scholar] [CrossRef]
  97. Dillon, G.K.; Holden, Z.A.; Morgan, P.; Crimmins, M.A.; Heyerdahl, E.K.; Luce, C.H. Both topography and climate affected forest and woodland burn severity in two regions of the western U.S., 1984 to 2006. Ecosphere 2011, 2, 1–33. [Google Scholar] [CrossRef]
  98. Riley, K.L.; Abatzoglou, J.T.; Grenfell, I.C.; Klene, A.E.; Heinsch, F.A. The relationship of large fire occurrence with drought and fire danger indices in the western USA, 1984–2008: The role of temporal scale. Int. J. Wildland Fire 2013, 22, 894–909. [Google Scholar] [CrossRef]
  99. Monitoring Trends in Burn Severity (MTBS). Available online: http://www.mtbs.gov/dataaccess.html (accessed on 22 July 2016).
  100. DATA.GOV. USGS Datasets; Federal Government of the United States of America. Available online: https://catalog.data.gov/dataset?collection_package_id=d4f92d86-e9c0-4e45-a585-609722f2f398 (accessed on 22 July 2016).
  101. Doerr, S.H.; Santín, C. Global trends in wildfire and its impacts: Perceptions versus realities in a changing world. Philos. Trans. R. Soc. Lond. B Biol. Sci. 2016. [Google Scholar] [CrossRef] [PubMed]
  102. US Forest Service. Fire and Aviation Management Tools & Technology. Available online: http://fs.fed.us/fire/tools_tech/index.html (accessed on 22 July 2016).
  103. Katuwal, H.; Calkin, D.E.; Hand, M.S. Production and efficiency of large wildland fire suppression effort: A stochastic frontier analysis. J. Environ. Manag. 2016, 166, 227–236. [Google Scholar] [CrossRef] [PubMed]
  104. National Interagency Fire Center (NIFC). Serious Accident Investigations. Available online: https://www.nifc.gov/safety/safety_reprtsInvest.html (accessed on 22 July 2016).
  105. Taylor, S.W.; Alexander, M.E. Science, technology, and human factors in fire danger rating: The Canadian experience. Int. J. Wildland Fire 2006, 15, 121–135. [Google Scholar] [CrossRef]
Figure 1. Example wildland fire decision support system (WFDSS) analysis of the Observation Fire on 3 July 2016 from the Bitteroot Mountains of Western Montana USA. WFDSS fire analysis takes into account a range of spatial data including previous fire locations and burn severities (a); fuel treatments and other landscape modifications designed to alter future fire activity (b); locations of highly valued resources and assets (HVRAs) (c); and a range of modeled fire spread probability surfaces incorporating current and forecast weather conditions (d). WFDSS analysis outputs courtesy of Tonja Opperman. Figure layout and design courtesy of Jon Rieck.
Geosciences 06 00035 g001
Figure 2. Flow diagram of pre-fire planning components that can be used to inform fire response decision support. Highly valued resources and assets (HVRA) are landscape features potentially affected by fire [41]. Expected net value change (eNVC) is the expected net value change of a resource or asset including conditional fire probabilities. Conditional net value change (cNVC) is the conditional net value change of a resource or asset given fire occurrence. Terrestrial suppression difficulty index (tSDI) is the suppression difficulty index without air support [42]. Potential wildfire operational delineations (PODs) are potential operational delineations for planning and operational fire management [43].
Geosciences 06 00035 g002
Figure 3. Geospatial implementation of wildfire risk assessment framework (from [41]). FIL is the fire intensity level. Figure reproduced courtesy of Julie Gilbertson-Day.
Geosciences 06 00035 g003
Figure 4. Location and methods used to develop a predictive model of final fire perimeter locations. Continuous probability surface is developed from landscape features and operational fire management indices associated with historical fire perimeter locations. Training data fire perimeters are from the Monitoring Trends in Burn Severity database from 1984 to 2014 [99]. Fuel types and physical landscape attributes are from the LANDFIRE database [63]. Roads, rivers, and impervious surface data are from the United States federal data archive [100]. Modeled landscape is southwest of Twin Falls ID, USA.
Geosciences 06 00035 g004
Figure 5. Spatial modeling results quantifying the level of risk for ground-based suppression activities. Results are adapted from suppression difficulty index with air support variables excluded (tSDI) [42,95]. tSDI is a dimensionless composite index with values ranging from 0 (low) to 2.5 (extreme). Details of the tSDI model landscape are presented in in Figure 4.
Geosciences 06 00035 g005
Figure 6. Spatial modeling results quantifying the level of risk for ground-based suppression activities in Montes de Gamonosa, Castano y Ribera, Sierra de Rite and El Saltillo, Huelva Province, Spain [42]. Suppression difficulty index calculation is described above.
Geosciences 06 00035 g006

