1. Introduction
Floods are a natural phenomenon that causes an average of about $6 billion in damages annually (Sarmiento and Miller [
1]). In some cases, flooding is expected, while in many others the public is unaware of the risk and unprepared for the consequences. For decades, local, state and federal agencies have worked to develop tools to accurately identify flood risk and to quickly respond to flooding when it happens. Flood protection is one of the four major missions of the Southwest Florida Water Management District (SWFWMD). Toward this mission, the SWFWMD cooperates with federal and state entities, and local governments to develop Federal Emergency Management Agency (FEMA) Digital Flood Insurance Rate Maps (DFIRMs). During the development of the DFIRMs, the SWFWMD investigates: (1) the results of storm water models; (2) a database of historical photographs and high water elevations; and (3) information from local residents. One of the more important aspects of the storm water models (sometimes referred to as Hydrologic and Hydraulic (H & H) models), is the model verification simulation for a given model. During model verification, rainfall depths from an actual storm event are simulated to produce floodplain results, which are then compared to documented high water information associated with that same event. Results that reasonably match the high water information provide a high level of confidence in model quality thereby assuring a high level of accuracy when modeling design storms, such as the 100-year flood.
Singhofen [
2] gives an excellent background to storm water model verification focusing on empirical methodologies. Sawaya
et al. [
3] demonstrate applications of IKONOS-2 and QuickBird satellite imagery for mapping lake water levels and impervious surface determination. Although their focus is at the local scale, they [
3] do not apply the analysis to model verification. Miller
et al. [
4] used MODIS (Moderate Resolution Imaging Spectrometer) satellite data to verify sediment transport models and found that higher resolution imagery provide better verification results than lower resolution AVHRR (Advanced Very High Resolution Radiometer) or SeaWiFS (Sea-Viewing Wide Field-of-View Sensor) imagery. Haq
et al. [
5] used remotely-sensed satellite imagery to monitor flooding and provide damage assessments. Others (Jung
et al. [
6]) have used two-dimensional (2D) satellite imagery to validate surface water heights and slopes derived from 2D hydrodynamic models. Their results compared well to monitored surface water levels, however, they were limited to the response of a channelized tributary and have not been tested on the complex dynamics of an entire watershed that includes both above and below ground flowpaths. More recently, Tarpanelle
et al. [
7] used Synthetic Aperture Radar (SAR) imagery to verify Manning’s Roughness coefficients for a channel and floodplain, and Kunyeun
et al. [
8] used flood extent data for model verification of underground storm sewers in an urban area. Remote sensing has been used extensively for mapping purposes, however, its application to model verification is limited. This study uses remotely-sensed images from a recent flood event to test and verify floodplain model results for a watershed in west central Florida.
2. Study Area
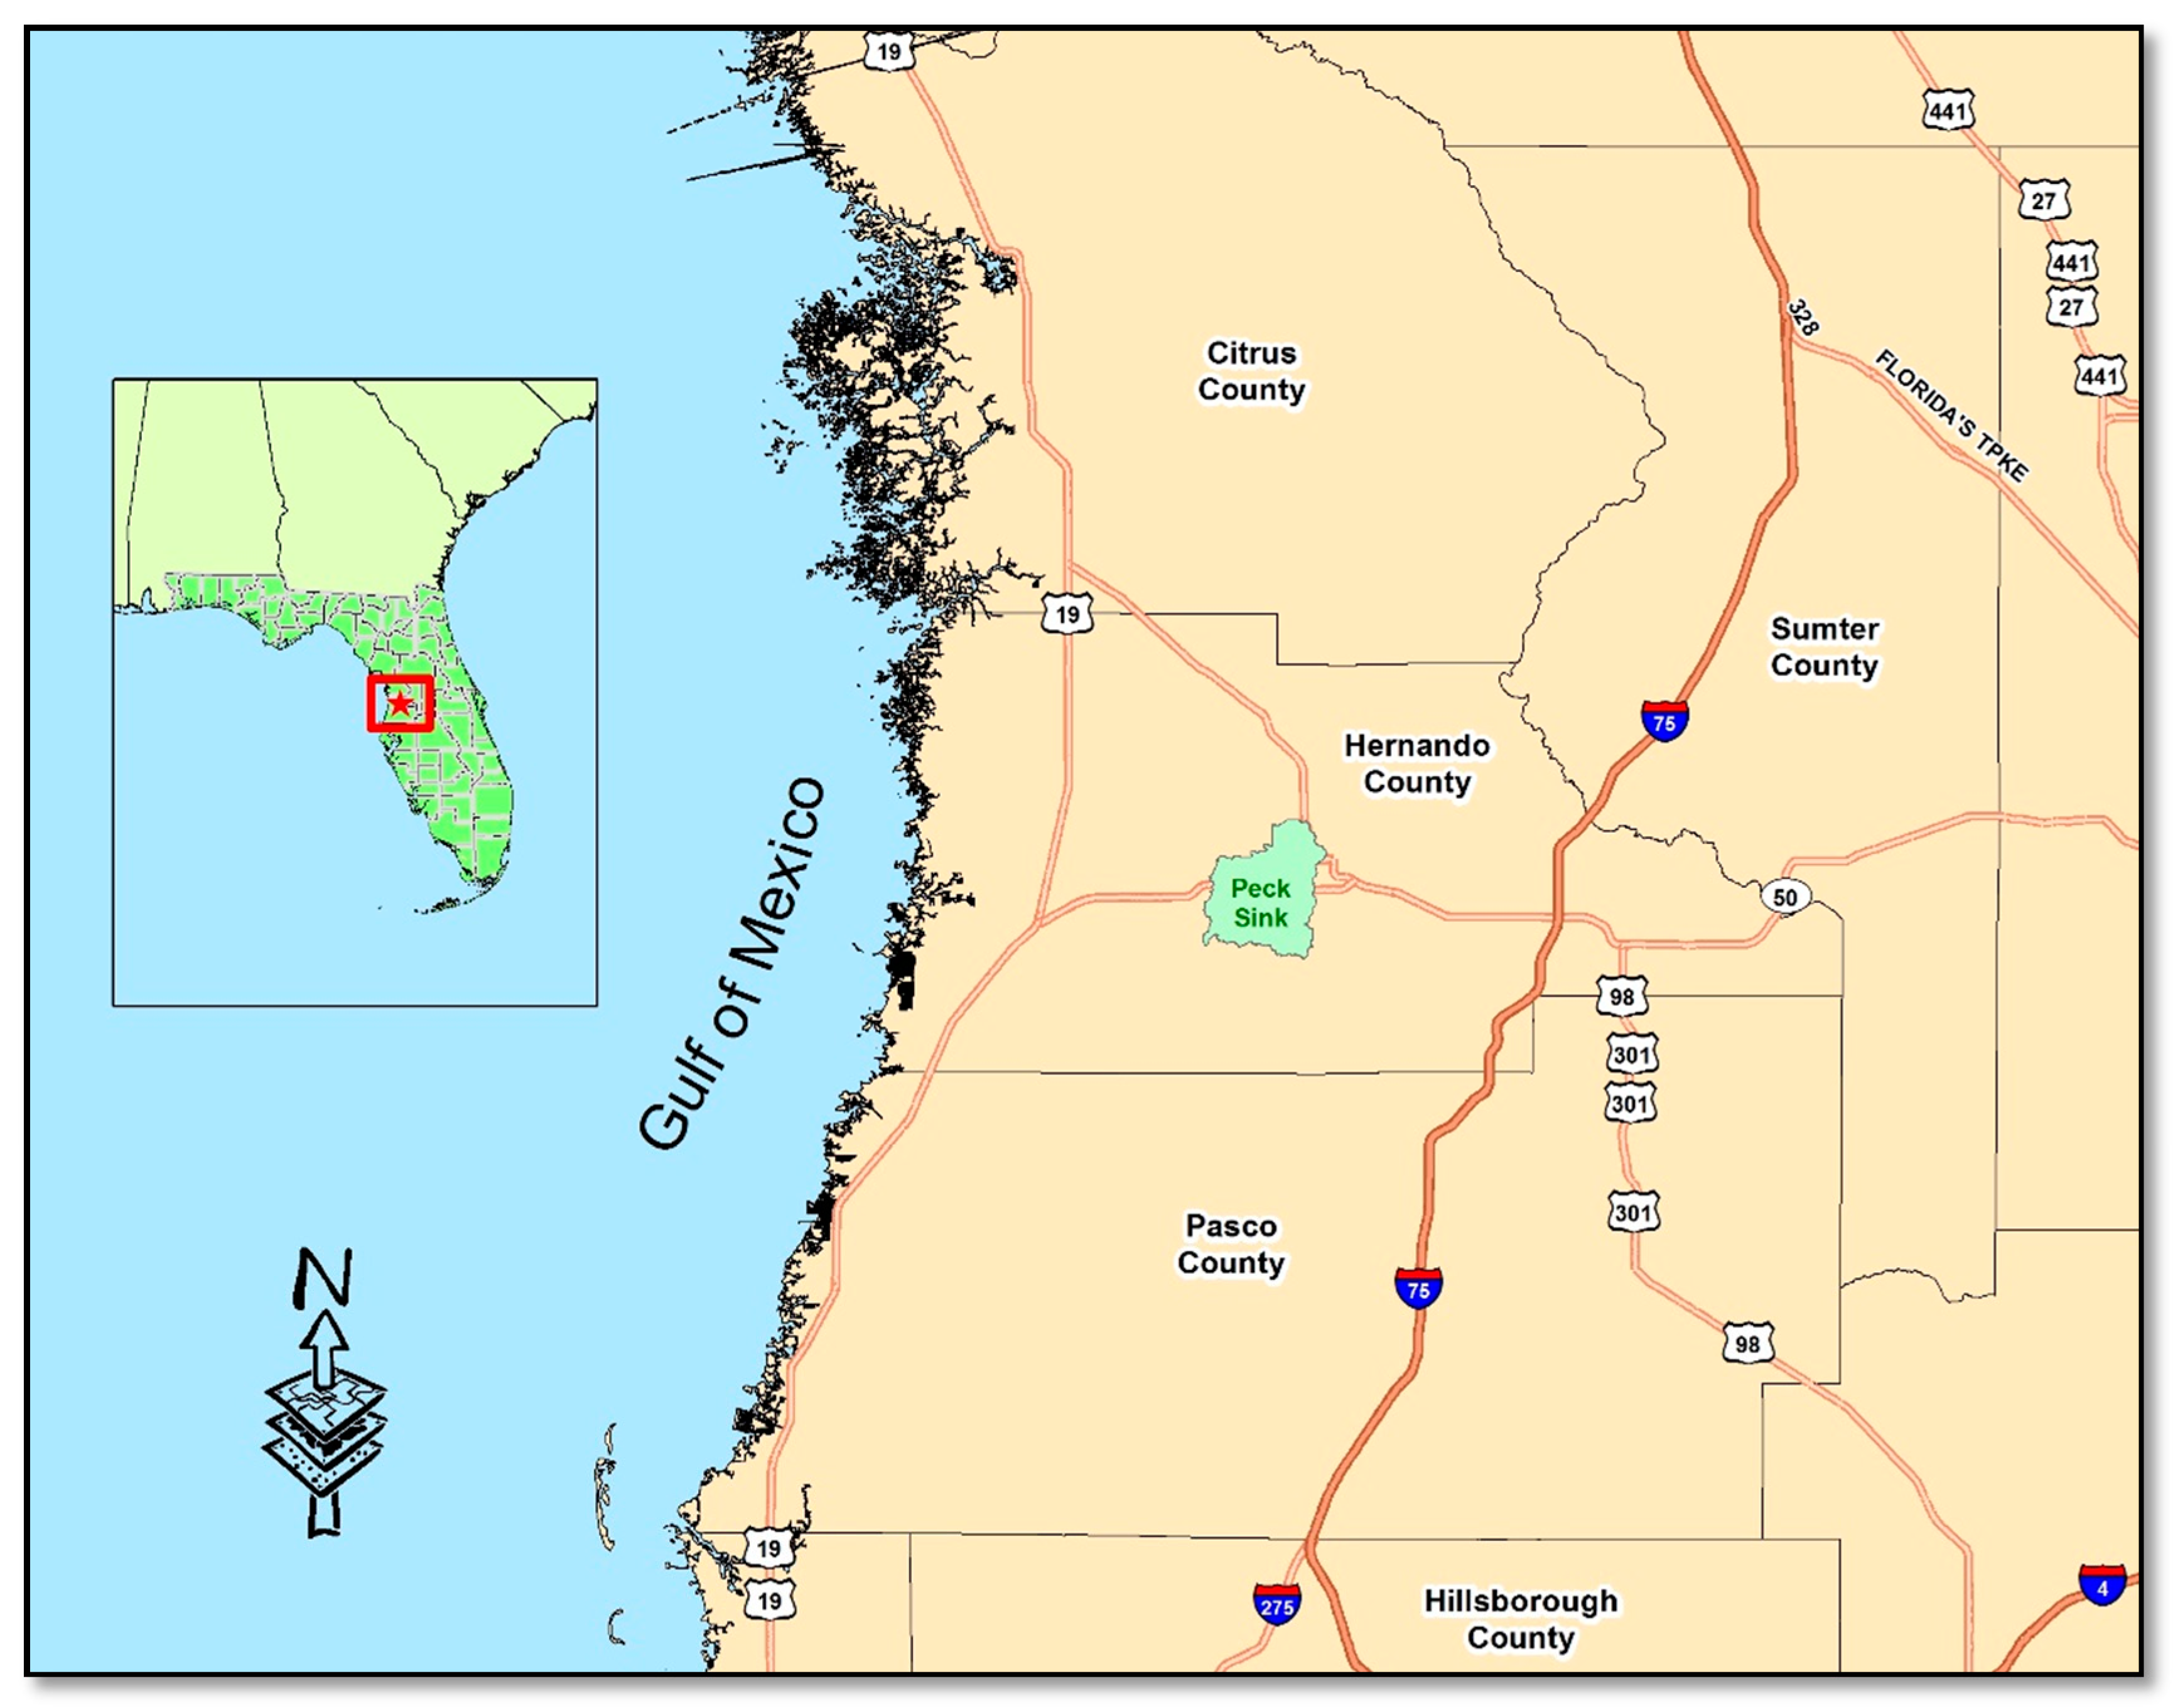
The Peck Sink Watershed is approximately 17 square miles in Hernando County, Florida (
Figure 1). Its topography ranges in elevation from 20 to 250 feet (NAVD88), which is unique when compared to the generally flat landscape of Florida. With a mix of hardwoods, cropland and low-density residential areas, this watershed is dominated by poorly drained soils and sinkhole features that drain the land. This combination of topographic relief and clay soils near land surface has led to a history of flooding.
3. Materials and Methods
During the summer of 2012, as the SWFWMD was conducting a study of the Peck Sink Watershed to better understand the watershed’s flood risk, record rainfall occurred from Tropical Storm Debby. This storm event developed in the central Gulf of Mexico on Saturday, 23 June 2012, approached and stalled over southwestern Florida on Sunday, 24 June 2012, before moving northwestward and making landfall over Steinhatchee, Florida on 26 June 2012. Although the maximum winds (95 km/h) and lowest pressures (990 mb) were recorded to the northwest of the SWFWMD, the storm delivered over 13 inches as it passed over parts of the 16-county area of the SWFWMD. Citrus, Hernando, and Pasco Counties experienced rainfall during this time period that would be expected only once in a 100-year period, i.e., a storm with a 1% chance of occurrence in any given year, and hence offered the SWFWMD an opportunity to test the floodplain model being developed for the Peck Sink Watershed. Remotely-sensed images were obtained and compared to modeled floodplains to validate the model results.
3.1. Storm Water Modelings
Storm water modeling and flood mapping for the Peck Sink Watershed, Hernando County, Florida was conducted by CH2M Hill Engineers, Inc. (Tampa, FL, USA) and presented to the SWFWMD in February 2016. The model was based on LiDAR-elevations and breaklines collected in 2007. The LiDAR data, 1 m postings with a fundamental vertical accuracy of 9.25 cm, was collected by Woolpert, Inc. (Dayton, OH, USA) and processed into hydro-enforced and hydro-flattened Digital Elevation Models (DEMs) with a 5-foot × 5-foot cell size. The DEMs were distributed to CH2M Hill Engineers, Inc., to assist in the development of the floodplain model. CH2M Hill Engineers, Inc. used the best “engineering judgement” and standards of practice to augment the “surface DEM” with below-surface features, such as pipes, drop structures, and weirs, to direct water flows. For the Peck Sink Watershed, the Interconnected Channel and Pond Routing model (ICPRv3; Streamline Technologies, Orlando, FL, USA) was used to simulate flooding for several design storms and actual events including Doppler rainfall from Tropical Storm Debby in June 2012. Results from the model were converted to Esri-shapefiles and subsequently stored in either an Esri file-geodatabase or the SWFWMD Enterprise geodatabase.
3.2. Image Acquisition
When a “state of emergency” for Florida was declared on 25 June 2012, the state qualified for Federal Emergency Management Agency (FEMA) assistance. A portion of that assistance included the acquisition of satellite images (SPOT, Satellite Pour l’Observation del la Terra) when the satellite passed overhead on 27 June 2012, approximately 48 h after the storm started moving northward and out of the SWFWMD. The SPOT multi-spectral image for the north-central portion of the SWFWMD (SP04N28_475187W082_3623332012062800000000MS00_GG003002001.tif) was of particular interest, as it focused on Hernando County, Florida, one of the areas significantly affected by flooding.
Although the SPOT data were obtained within a 48-h window of Tropical Storm Debby, there were concerns that the 20 m Ground Sample Distance (GSD) and the Infrared bandwidth frequency would be too coarse to accurately map the extent of flooding. The SWFWMD contracted with a local aerial firm (Aerial Cartographics of America, Orlando, FL, USA) to obtain a high resolution false-color infrared (fCIR) digital image in specific portions of Citrus, Hernando and Pasco Counties, Florida that received the highest rainfall depths. The image, acquired with a Vexcel UltraCamX digital aerial sensor using 60% forward and 40% sidelap produced a 9-inch raw pixel GSD. Flights were conducted between 2:00 p.m. and 4:00 p.m. on 27 June 2012, and concluded, the next day, 28 June 2012 between 10:00 a.m. and 1:00 p.m. Photography was taken during 30° sun angle and was free of smoke and clouds. Final project deliverables were referenced to Florida State Plane West, NAD83 (2007) U.S. Survey feet and tiled into 5000-foot × 5000-foot tiles. The SWFWMD supplied a 5-foot LiDAR-derived DEM referenced to the Florida State Plane West, NAD 2007, NAVD 1988, U.S. Survey feet for ortho-rectification. All work was performed under the supervision of a licensed Florida Professional Surveyor and Mapper. Orthophotos were certified to meet or exceed a verified horizontal accuracy of 9.12 foot at the 95% confidence interval (3.0 feet Root Mean Square Error), as specified in the American Society of Photogrammetry and Remote Sensing (ASPRS) standards. No correction for building lean was made.
3.3. Model Verification
The presence of water shown on the remotely-sensed images was directly compared to the simulated flooding from the model using a combination of visual inspection and image analysis methods. The 4-band (RGBi) image was first examined for trends in spectral response to determine threshold values for waterbodies. After threshold values were selected, an extract by mask was run on the Near-Infrared (NIR) band, using Digital Number (DN) values of 75 and below. The resulting extracted raster was then reclassified from 1 to 5, with 1 being almost certainly water, and 5 being more likely shadowed land. The reclassified image was used alongside the original to identify flooding within the study area. High water elevations and flood photos from Tropical Storm Debby were obtained from residents, local governments and SWFWMD staff to document the flooding and assist with model verification.
4. Results
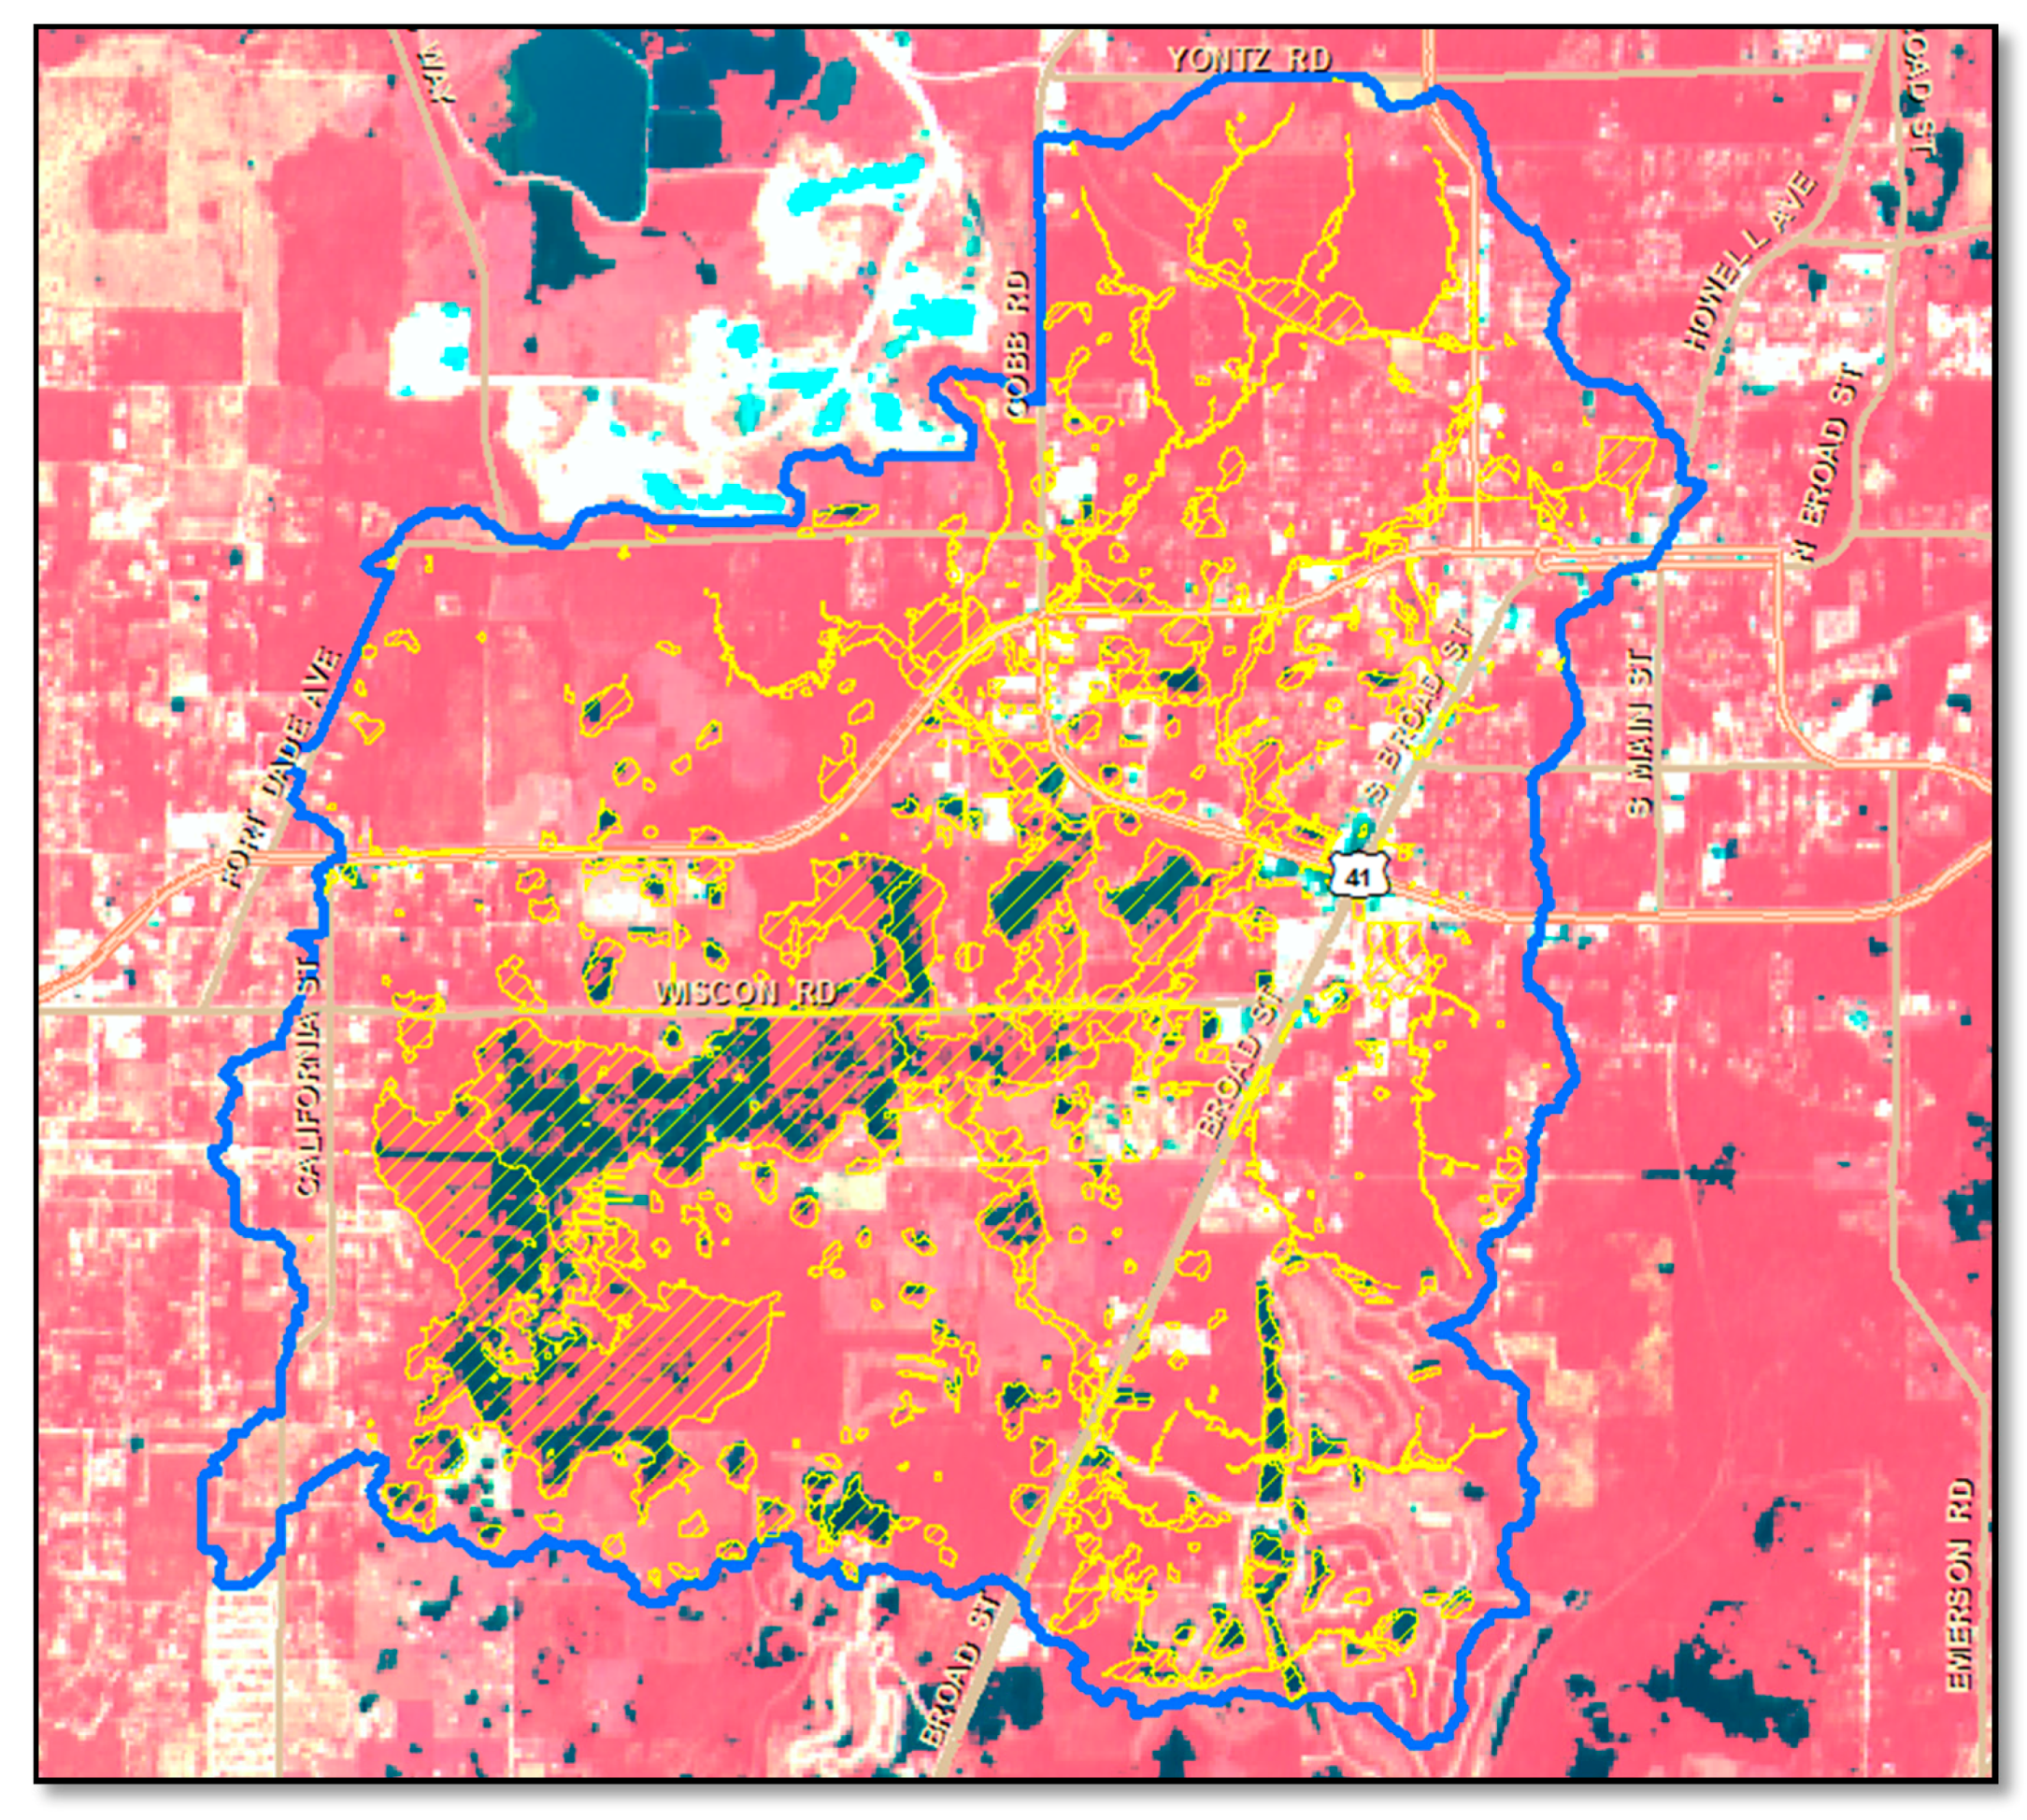
Modeled floodplain results show that 21 percent of the total Peck Sink Watershed was inundated during Tropical Storm Debby. Both SPOT and fCIR images were captured within two to three days of the storm and compared to the simulated floodplain.
Figure 2 shows the modeled Tropical Storm Debby floodplain overlaid onto the SPOT image with water accumulation depicted in black. A large-scale visual comparison of the entire watershed showed reasonable identification of flooding in the central and southern portions of the watershed, where the landscape is flatter and lower in elevation. In the northern portion of the watershed, where the terrain is steeper and higher in elevation, the SPOT imagery showed little or no evidence of the flooding that was simulated by the model.
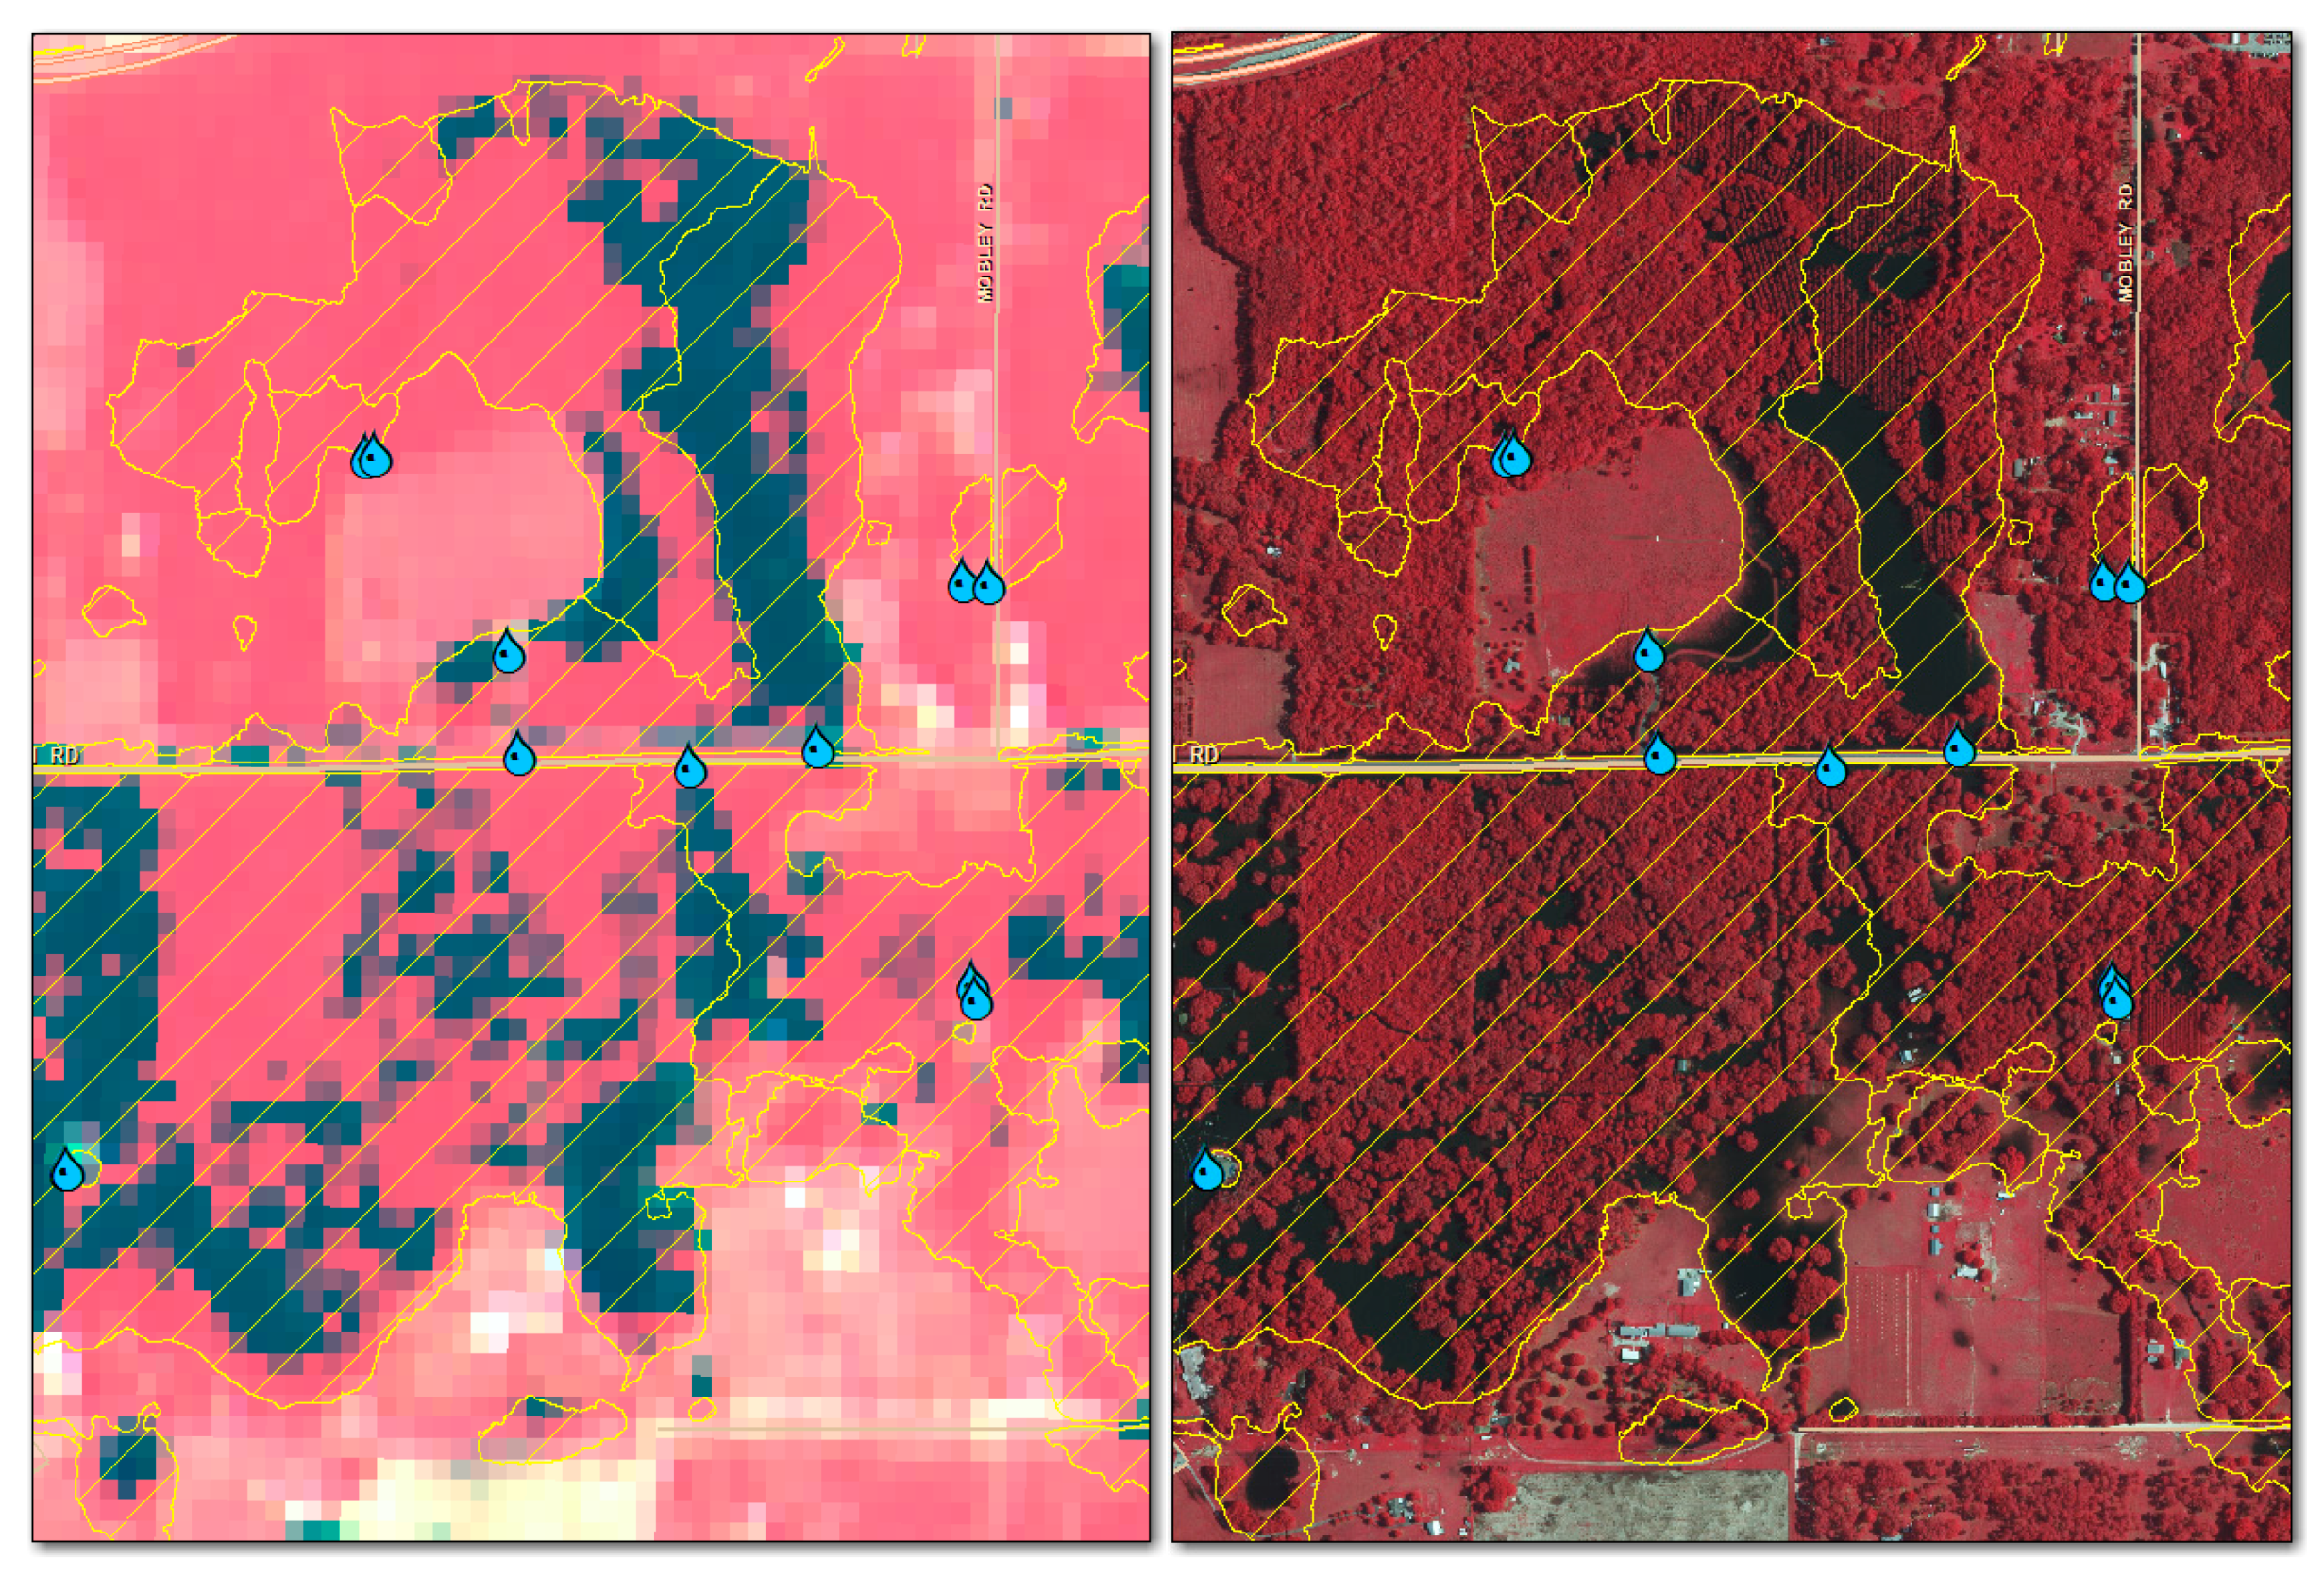
The fCIR aerial image captured approximately seven square miles of the central and southern portions of the Peck Sink Watershed, three days after Tropical Storm Debby. A comparison of the SPOT and fCIR images (
Figure 3) show an area in the central portion of the Peck Sink Watershed that experienced flooding. The deeper red signatures are interpreted to represent denser vegetation, and although the fCIR image more clearly identifies the flooding, neither image shows the entire presence of flooding in these obscured areas. Field-measured high water marks from Tropical Storm Debby were obtained at many locations, as shown in
Figure 3, verifying flooding in some areas that were not visible in the remotely-sensed images.
A closer examination of a house that was completely surrounded by water from Tropical Storm Debby is shown in
Figure 4. This figure compares the flood inundation visible in both the SPOT and fCIR imagery to the modeled floodplain. In the SPOT image, probably as a result of the 20 m GSD, the house is not visible, although there are dark pixels, indicating water, in the vicinity. Given that there may be a slight horizontal displacement as a result of the geo-rectification process, the SPOT image does place the house (the brightest pixel) within the yellow circle. This image does a reasonably good job at identifying the flooding extent, but the abundance of non-black pixels indicates upland areas that are not present. The higher resolution fCIR image more clearly shows the floodwaters surrounding the house, although the modeled floodplain (yellow hatching) indicates the water should have been closer to the house at the peak of the flood.
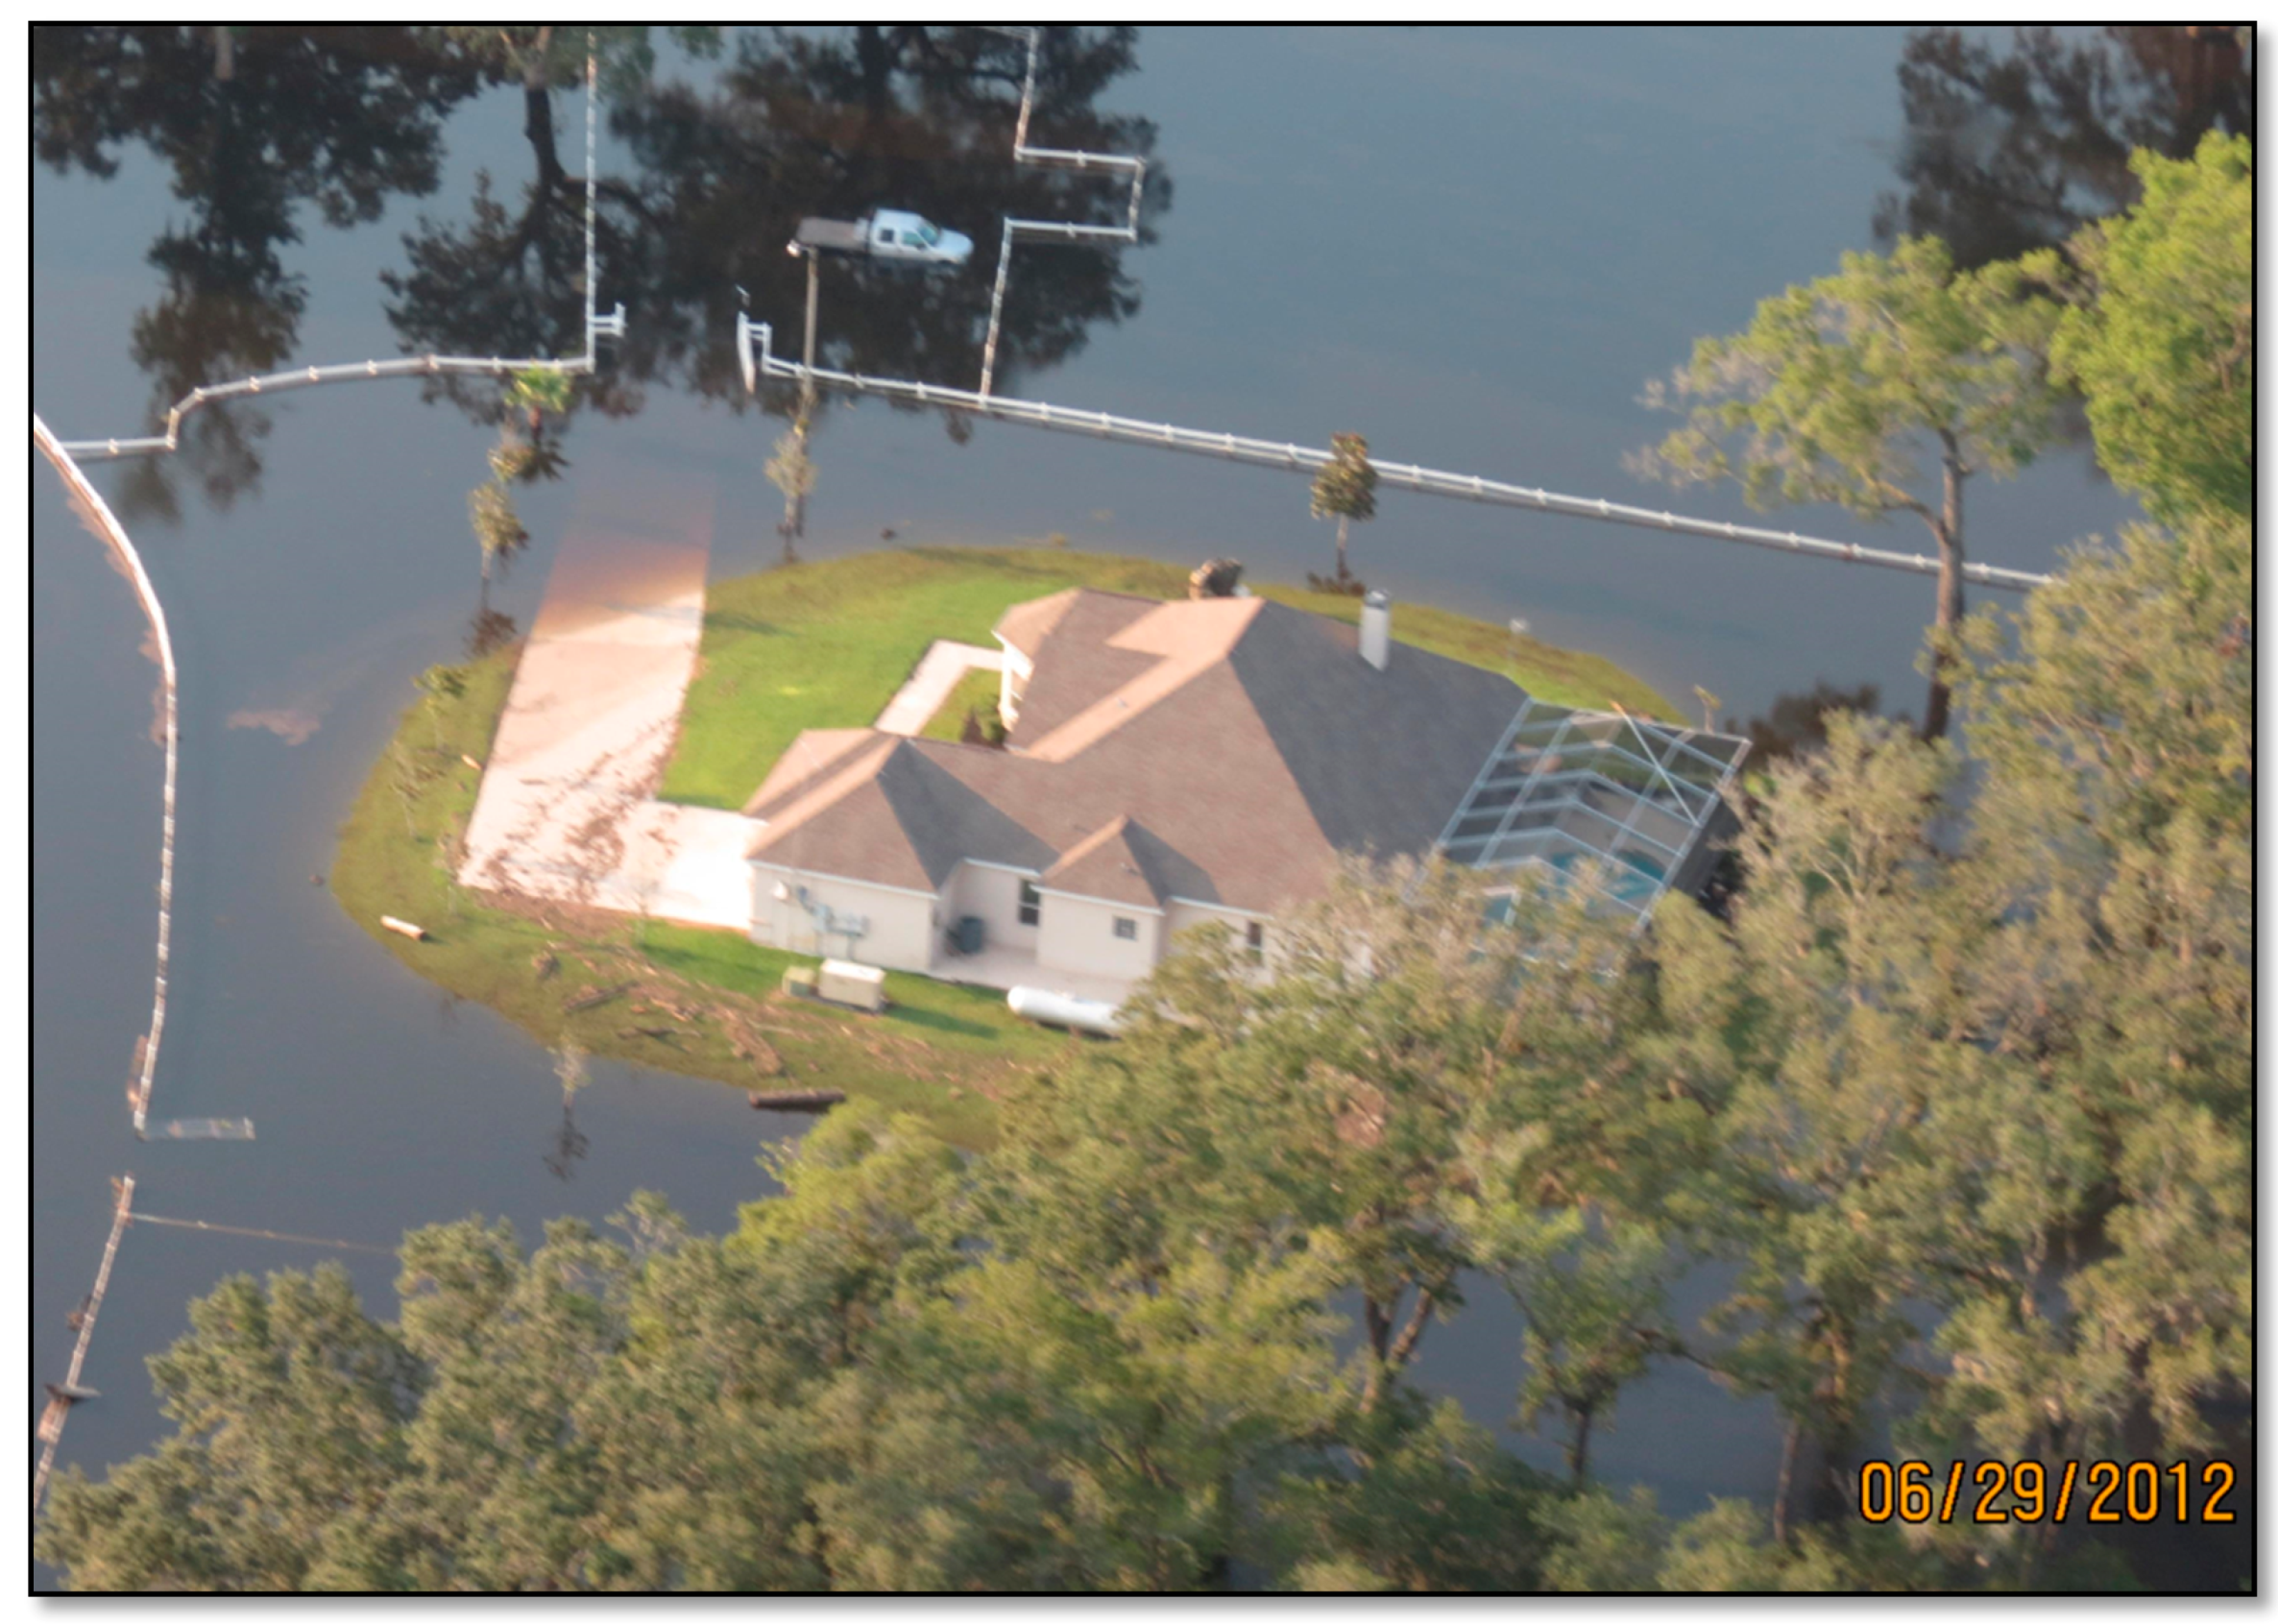
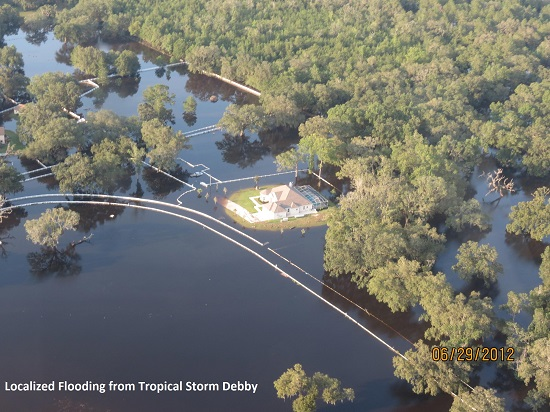
An oblique image captured by helicopter shortly after the fCIR aerial image, shows the same house surrounded by water on 29 June 2012 (
Figure 5). A debris line, clearly visible in the image, indicates the peak flood level was closer to the house immediately following the storm event but had receded by the time the remotely-sensed image was captured. High water elevations, surveyed using this debris line indicator from the oblique image, closely matched the modeled floodplain elevations for Tropical Storm Debby in this vicinity.
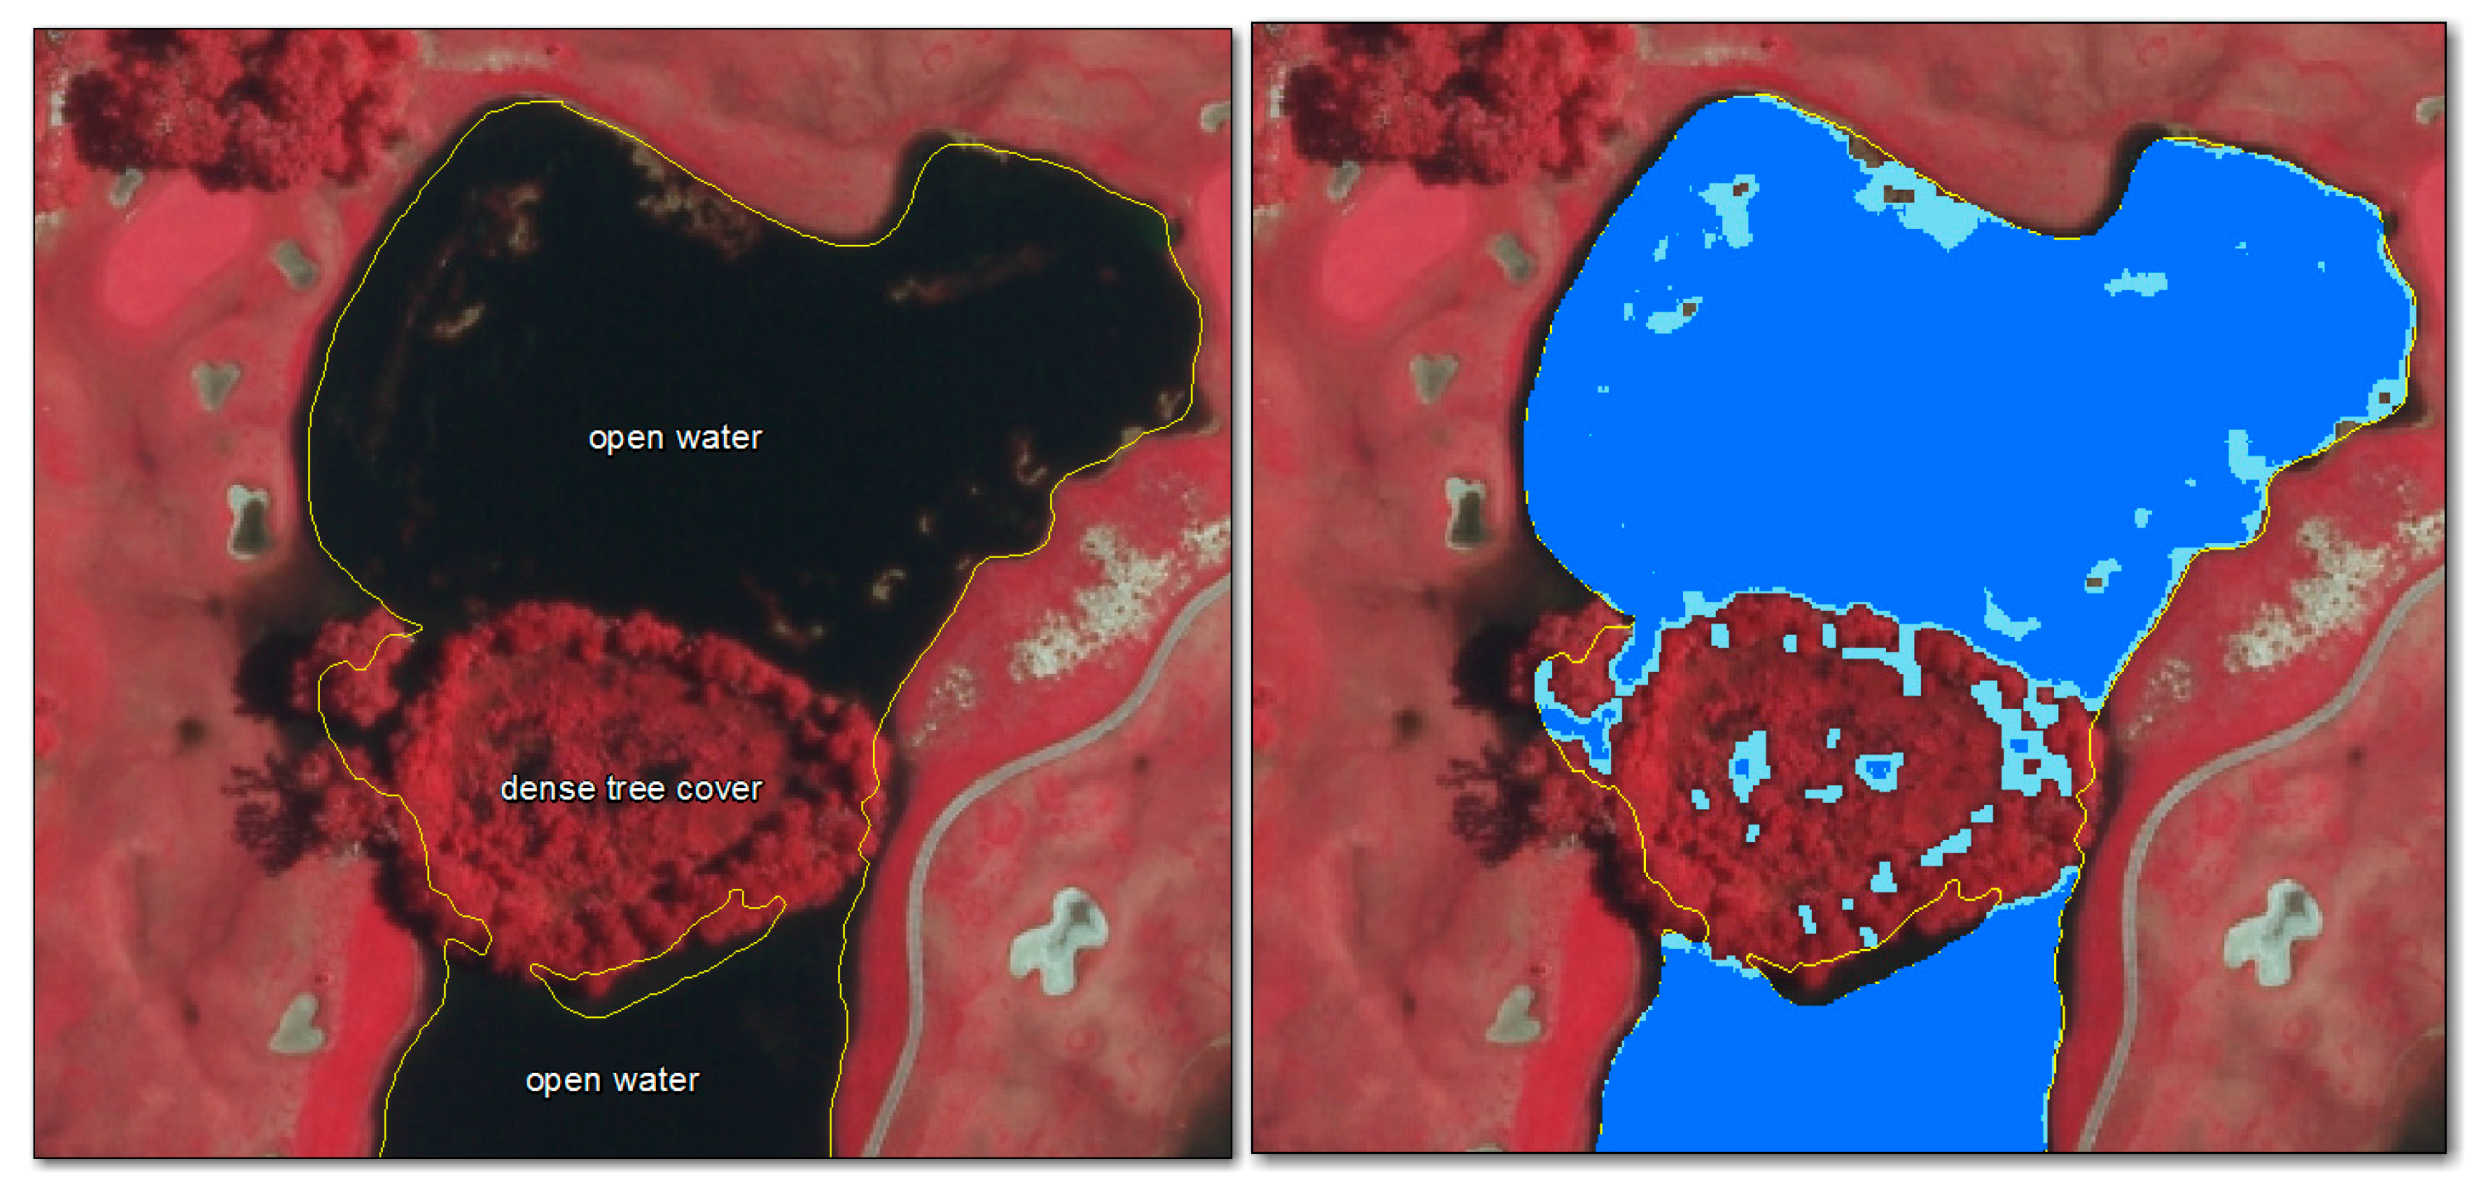
The results of the image analysis provide additional insight into the use of remote sensing to verify model results. As expected, this analysis clearly identified water in open areas, although it had a difficult time identifying water in areas obscured by dense vegetation (
Figure 6). In many cases, a visual inspection of the DEM was necessary to confirm the modeled floodplain results in these obscured areas.
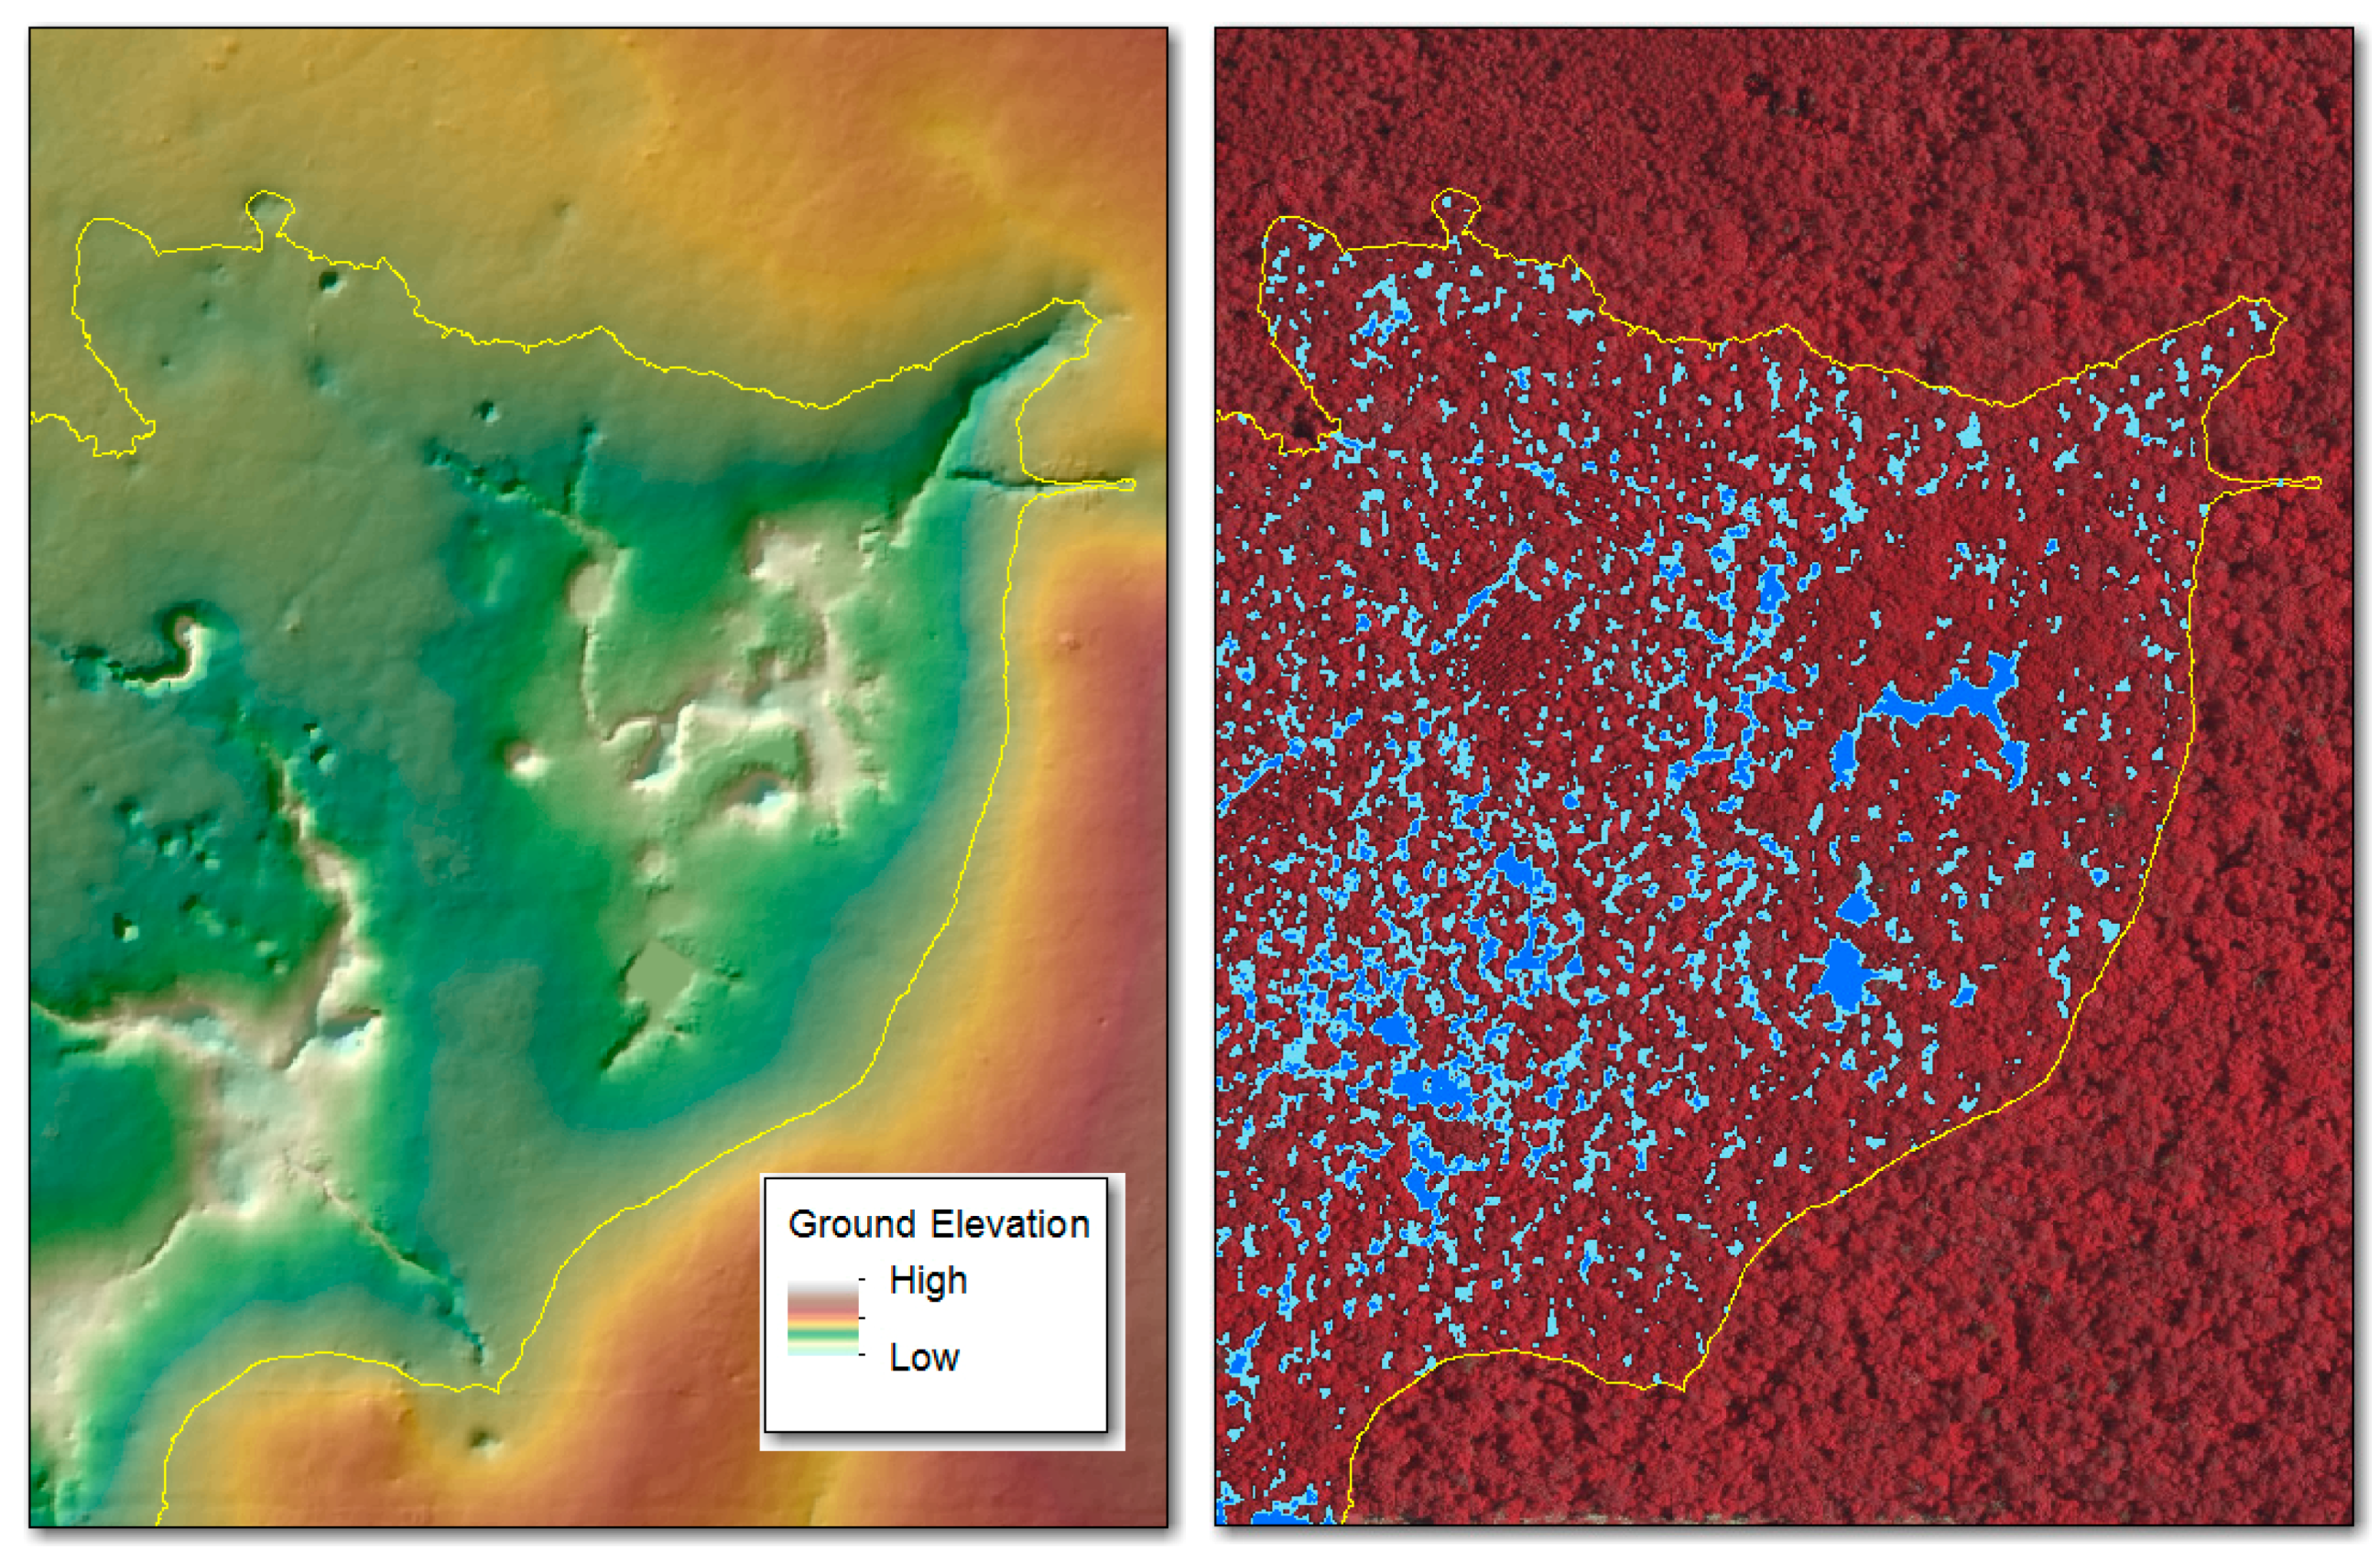
Figure 7 shows the modeled floodplain from Tropical Storm Debby as compared to both the DEM and the results of the image analysis. As expected, the floodplain matches well with the contour of the land surface elevation from the DEM. Although the entire floodplain was not identified by the image analysis, the resulting raster fragments extend to the modeled boundary indicating the overall extent of flooding.
5. Discussion and Conclusions
Since the early 2000s, the SWFWMD’s Watershed Management Program has been engaged in hydrologic and hydraulic modeling of watersheds throughout their 16 county service area. This program is designed to construct detailed floodplain models capable of identifying flood risk at the individual parcel level and to assist communities and local governments in the development of best management practices for flood protection. These goals require the floodplain models to include detailed information for both the conveyance ways above ground and complex pipe networks below ground.
The topology and hydrology of southwestern Florida are unlike many portions of the United States, where basins, sub-basins and catchments are clearly defined by flow ways, rivers, streams and creeks, forming dendritic drainage patterns. In contrast, the basins (catchments) in the SWFWMD are defined by a hierarchical nesting of sinks, low points in the terrain, and ridges, high points in the terrain, forming a deranged network of flow, where catchments fill and overflow, through spill points, low points along the ridges between catchments, into adjacent catchments. In such deranged terrains, elevation differences as small as 0.5 foot can result in changing overflow directions and different flooding patterns. This sensitivity requires a characterization of the terrain that is highly resolute, accurate, and detailed. DEMs used by the SWFWMD are LiDAR-derived (Light Detection and Ranging) DEMs with cell sizes typically ranging between 2.5 and five feet and elevation accuracies in the 0.2 to 0.3 foot range (NAVD88; North American Vertical Datum of 1988). In addition to surface flows, commercial- and residential-developed watersheds also include extensive below ground drainage networks to route stormwater in man-made flow patterns. Detailed measurements of outfall structures, underground pipe systems and discharge locations are also included into these floodplain models to accurately simulate the direction and quantity of storm water flows.
This detailed level of modeling is in sharp contrast to similar studies (Mason
et al. [
9], Khan
et al. [
10] and Karim
et al. [
11]) that used H & H modeling at smaller map scales with lower resolution imagery and topographic information. Mason
et al. [
9] compared flood inundation along the Thanes River (Oxford, UK) to remotely-sensed data, with a grid cell size of 50 m. Kahn
et al. [
10] used a similar methodology to construct a flood inundation model for the Nzoia River basin (a sub-basin of Lake Victoria in Africa). That model was constructed at a very small mapping scale using remotely sensed data with 250 m to 500 m resolution and SRTM (Shuttle Radar Topography Mission) 30 m post-spacing elevation data. More recently, Karim
et al. [
11] used 30 m SRTM data for elevation and MODIS (Moderate Resolution Image Spectrometer) to derive flood inundation maps for a riverine reach along the Fitzroy River in Australia. Hence, our study, conducted at a very large mapping scale, over deranged terrains with extensive below-surface, man-made alternations, provides new insights for the use of imagery for H & H model verification.
The development of accurate floodplain information for the Peck Sink Watershed required detailed topographic information coupled with a complete inventory of the below ground drainage network. The results of this study indicate that a combination of remotely-sensed imagery and field-measured high water marks can be used to verify floodplain model results for large-scale, highly-detailed, deranged watersheds. Although areas of flood inundation were reasonably identifiable in the SPOT imagery, the fine grained detail was obscured, limiting its ability to verify the modeled floodplain from Tropical Storm Debby. The detail obtained from the higher resolution imagery are in good agreement with the modeled floodplains, however, the overall extent of flooding was underestimated, as shown by the results of the image analysis. This limiting factor was mostly due to the inability of the fCIR image to clearly identify inundation in densely vegetated areas, which are highly characteristic of the Peck Sink Watershed. In addition, field data suggest that the floodwaters had receded in many areas before the remotely-sensed images were captured. These limitations required the use of additional tools including the DEM and field-measured high water marks to confirm the validity of the modeled floodplain results. This work shows how flood inundation can be inferred in areas not visible from remotely-sensed imagery. Future work might include developing a methodology to more accurately identify flood inundation in areas obscured by vegetation.
Flood events such as Tropical Storm Debby usually arrive unannounced. Having a plan in place to respond immediately is critical in order to adequately document the effects of the flooding. This includes collecting perishable high water marks and obtaining remotely-sensed aerial images as quickly as possible. These data are key to verifying the accuracy of flood prediction models and equipping local officials, residents and water managers with the information they need to better identify flood risk.
Acknowledgments
This project was funded through the Southwest Florida Water Management District’s Watershed Management Program. We thank the pilot and crew of Aerial Cartographics of America (Orlando, FL, USA) who captured the aerial imagery of Tropical Storm Debby. We thank Amor Elder, Graduate Student Intern, at the Southwest Florida Water Management District for her work with the high-resolution imagery. The Tropical Storm Debby aerial imagery is available upon request from the Southwest Florida Water Management District, Mapping & GIS Section, 2379 Broad Street Brooksville, FL 34604, USA.
Author Contributions
The authors made equal but different contributions to this article. Mark Fulkerson and Gene Altman, both from the Engineering & Watershed Management Section were responsible for constructing and managing the modeling efforts and coordinating the collection of high water marks, while Al Karlin was responsible for the aerial image acquisition and mapping.
Conflicts of Interest
The authors declare no conflict of interest.
Abbreviations
The following abbreviations are used in this manuscript:
| ASPRS | America Society of Photogrammetry and Remote Sensing |
| AVHRR | Advanced Very High Resolution Radiometer |
| DFIRM | Digital Flood Insurance Rate Map |
| DEM | Digital Elevation Model |
| DN | Digital Number |
| FEMA | Federal Emergency Management Agency |
| fCIR | false Color Infrared |
| GSD | Ground Sample Distance |
| H&H | Hydraulic and Hydrologic |
| ICPR | Interconnected Channel and Pond Routing |
| km/h | kilometers per hour |
| LiDAR | Light Detection and Ranging |
| mB | millibars of mercury |
| MODIS | Moderate Resolution Imaging Spectrometer |
| NAVD88 | North American Vertical Datum of 1988 |
| NIR | Near Infrared |
| PI | Photo-Interpreter |
| RGBi | Red-Green-Blue-infrared |
| SAR | Synthetic Aperture Radar |
| Sealifts | Sea-Viewing Wide Fiend-of-view Sensor |
| SPOT | Satellite Pour l’Observation del la Terra |
| SRTM | Shuttle Radar Topography Mission |
| SWFWMD | Southwest Florida Water Management District |
References
- Sarmiento, C.; Miller, T.R. Costs and Consequences of Flooding and the Impact to the National Flood Insurance Program; American Institutes for Research: Washington, DC, USA, 2006. [Google Scholar]
- Singhofen, P.J. Calibration and Verification of Storm Water Models. Available online: http://www.streamnologies.com/support/pdfs/Calibration.pdf (accessed on 28 December 2015).
- Sawaya, K.E.; Olmanson, L.G.; Heinert, N.J.; Brezonik, P.L.; Bauer, M.E. Satellite Remote Sensing to Local Scales: Land and Water Resource Monitoring using High-Resolution Imagery. Remote Sens. Environ. 2003, 88, 144–156. [Google Scholar] [CrossRef]
- Miller, R.L.; DelCastillo, C.E.; Chilmakuri, C.; McCorquodale, J.A.; Georgiou, I.; McKee, B.A.; D’Sa, E.J. Using multi-temporal MODIS 250 m data to calibrate and validate a sediment transport model for environmental monitoring of coastal waters. In Proceedings of the 2005 International Workshop on Analysis of Multi-Temporal Remote Sensing Images, Biloxi, MS, USA, 16–18 May 2005; pp. 2000–2004.
- Haq, M.; Akhtar, M.; Muhammad, S.; Paras, S.; Rahmatullah, J. Techniques of Remote Sensing and GIS for Flood Monitoring and Damage Assessment: A Case Study of Sindh Province, Pakistan. Egypt. J. Remote Sens. Space Sci. 2012, 15, 135–141. [Google Scholar] [CrossRef]
- Jung, H.C.; Jasinski, M.; Kim, J.W.; Shum, C.K.; Bates, P.; Neal, J.; Lee, H.; Alsdorf, D. Calibration of two-dimensional floodplain modeling in the central Atchafalaya Basin Floodway System using SAR interferometry. Water Resour. Res. 2012, 48. [Google Scholar] [CrossRef]
- Tarpanelli, A.; Brocca, L.; Melone, F.; Moramarco, T. Hydraulic Modelling Calibration in Small Rivers by Using Coarse Resolution Synthetic Aperture Radar Imagery. Hydrol. Process. 2013, 27, 1321–1330. [Google Scholar]
- Kunyeun, H.; Youngjoo, K.; Byunhyun, K.; Famigletti, J.S.; Sanders, B.F. Calibration of Storm Water Management Model Using Flood Extent Data. Available online: https://escholarship.org/uc/item/88c4g4j9#page-2 (accessed on 28 December 2015).
- Mason, D.C.; Bates, P.D.; Dall’Amico, J.T. Calibration of Uncertain Flood Inundation Models using Remotely Sensed Water Levels. J. Hydrol. 2009, 368, 224–236. [Google Scholar] [CrossRef]
- Kahn, S.I.; Hong, Y.; Wang, J.; Yilmaz, K.K.; Goiurley, J.J.; Adler, R.F.; Brakenridge, G.R.; Policelli, F.; Habib, S.; Irwin, D. Satellite Remote Sensing and Hydrological Modeling for Flood Inundation Mapping in Lake Victoria Basin: Implications for Hydrologic Prediction in Ungauged Basins. IEEE Trans. Geosci. Remote Sens. 2011, 49, 85–95. [Google Scholar] [CrossRef]
- Karin, F.; Petheram, C.; Marvanek, S.; Ticehurst, C.; Wallace, J.; Gouweleeuw, B. The use of hydrodynamic modelling and remote sensing to estimate floodplain inundation and flood discharge in a large tropical catchment. In Proceedings of the 19th International Congress on Modelling and Simulation, Perth, Australia, 12–16 December 2011.
© 2016 by the authors; licensee MDPI, Basel, Switzerland. This article is an open access article distributed under the terms and conditions of the Creative Commons Attribution (CC-BY) license (http://creativecommons.org/licenses/by/4.0/).


