
Magnitude-Frequency Distribution of Hummocks on Rockslide-Debris Avalanche Deposits and Its Geomorphological Significance

Abstract
:1. Introduction
2. Data and Methods


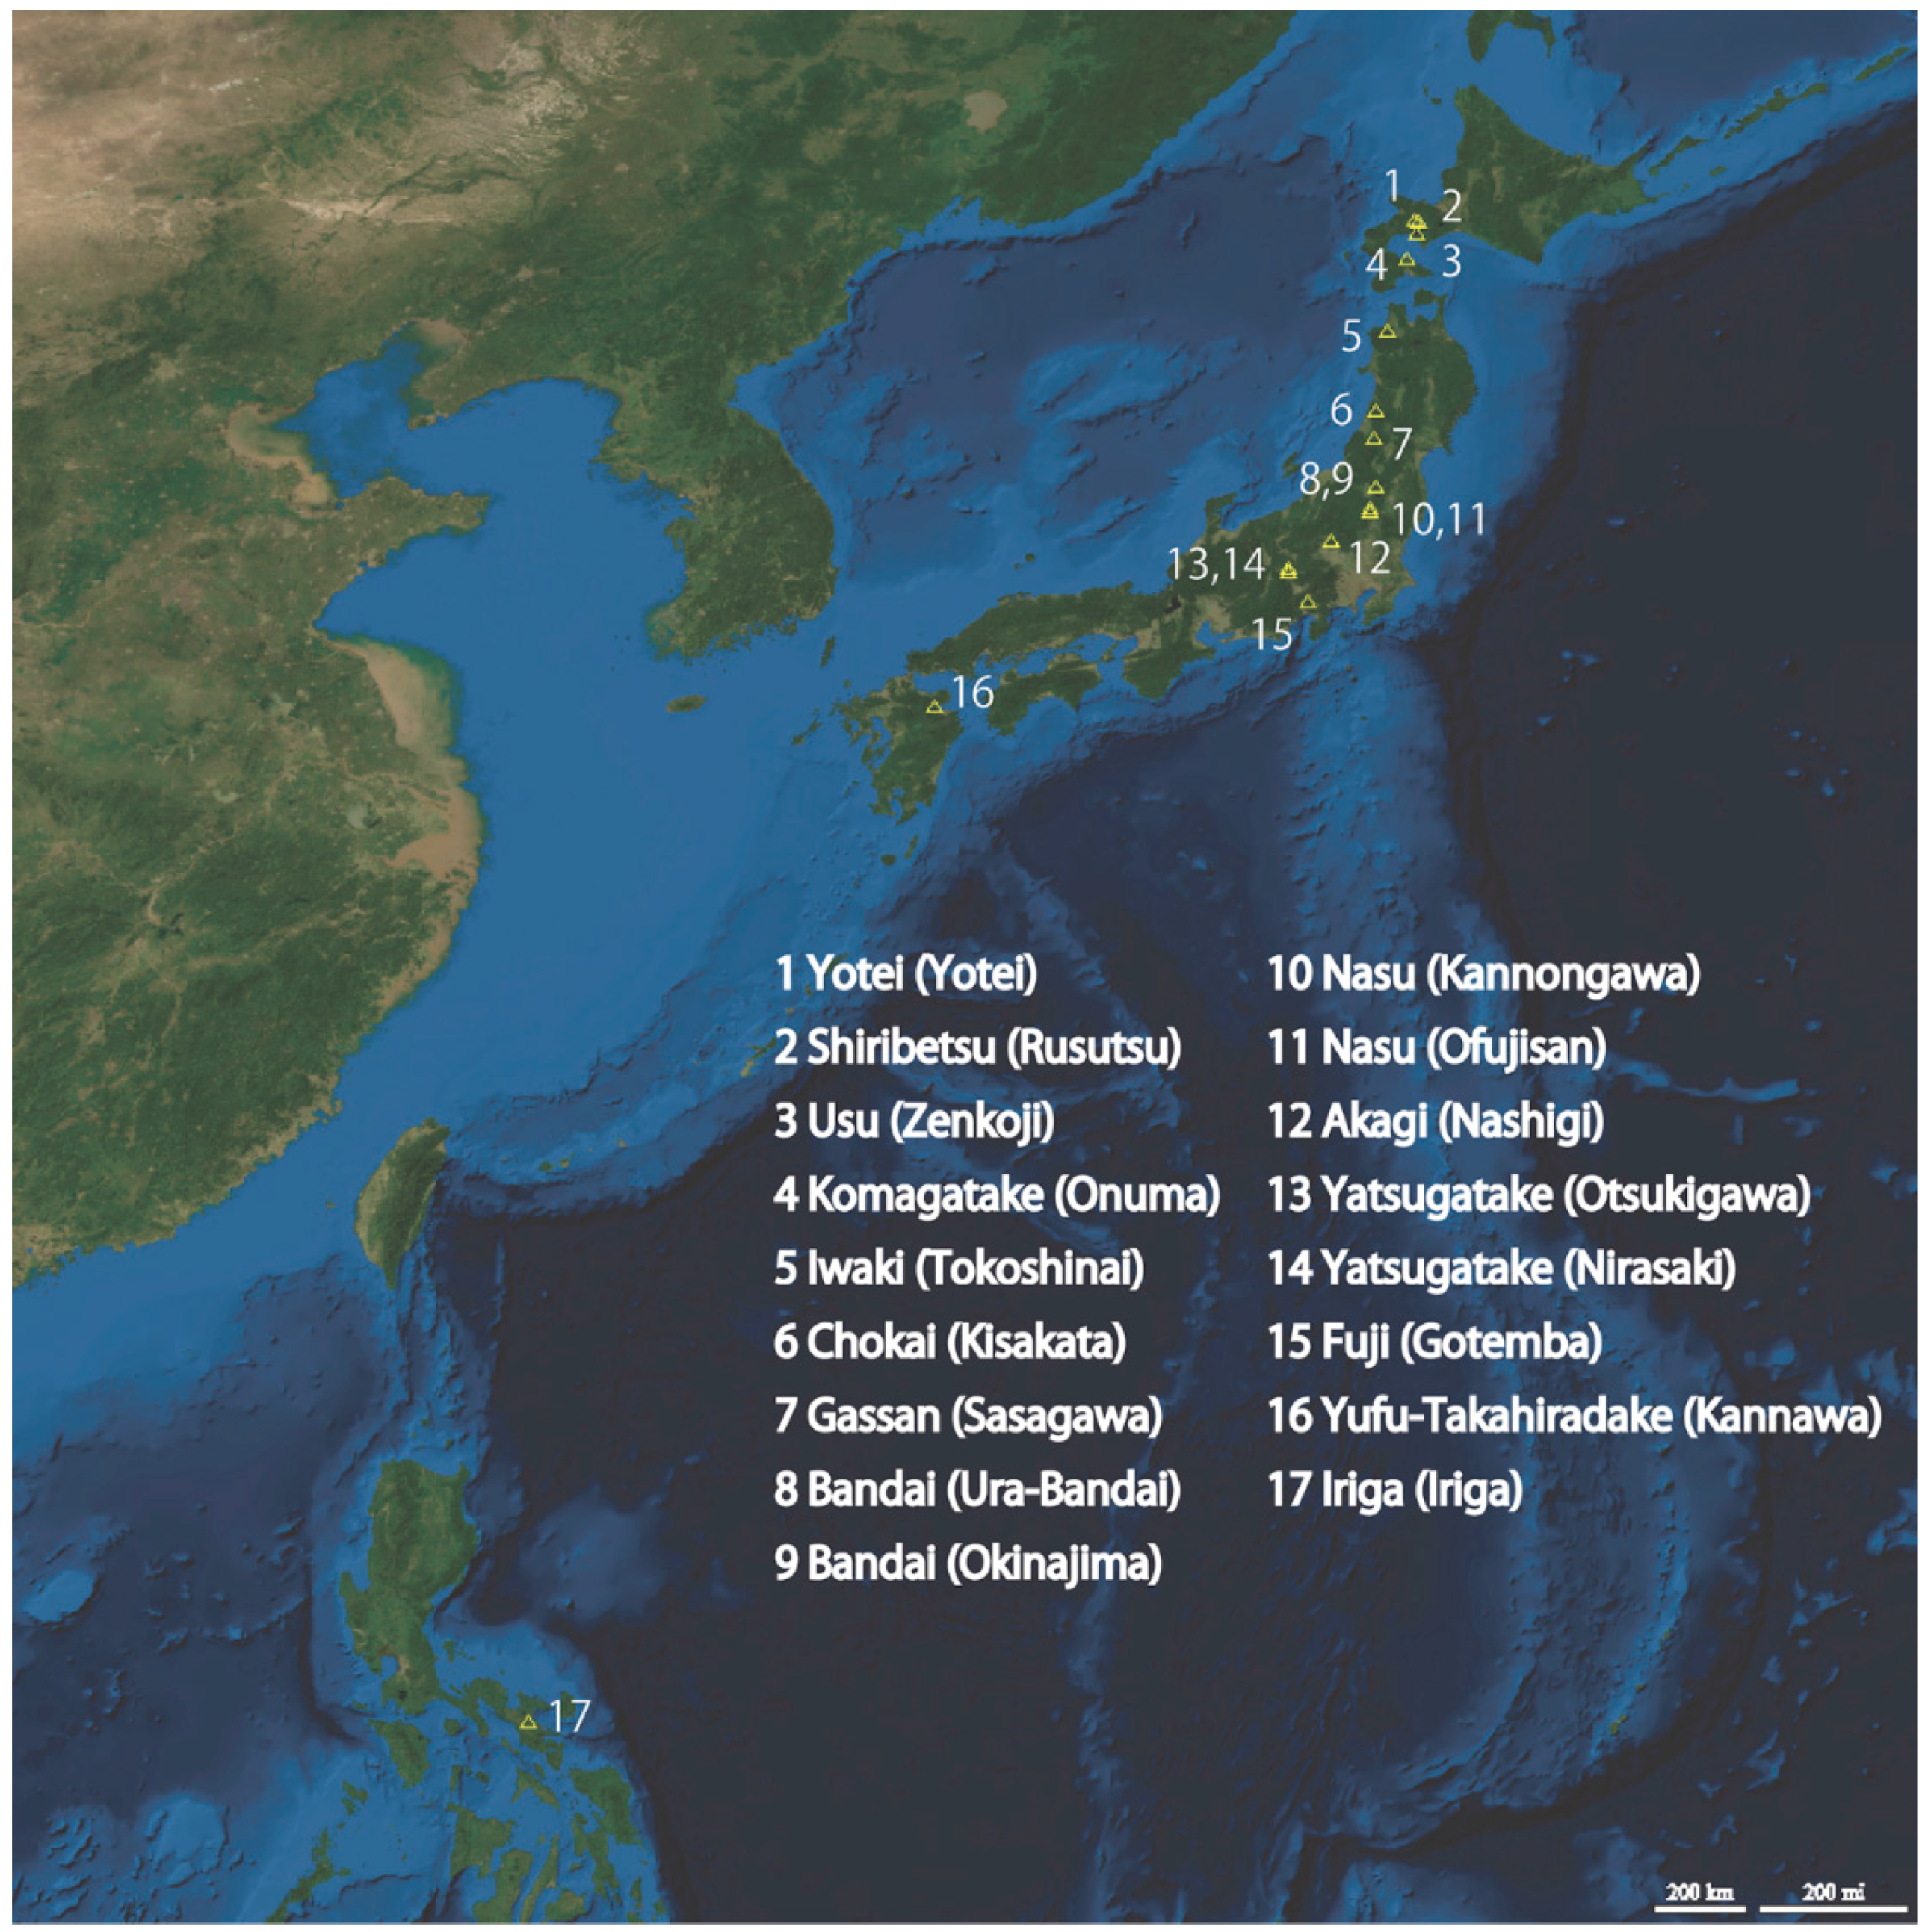
| ID | Volcano | Debris Avalanche | Region | Number of Hummocks | Data Source | Relative Height (H; km) | Runout Distance (L; km) | H/L |
|---|---|---|---|---|---|---|---|---|
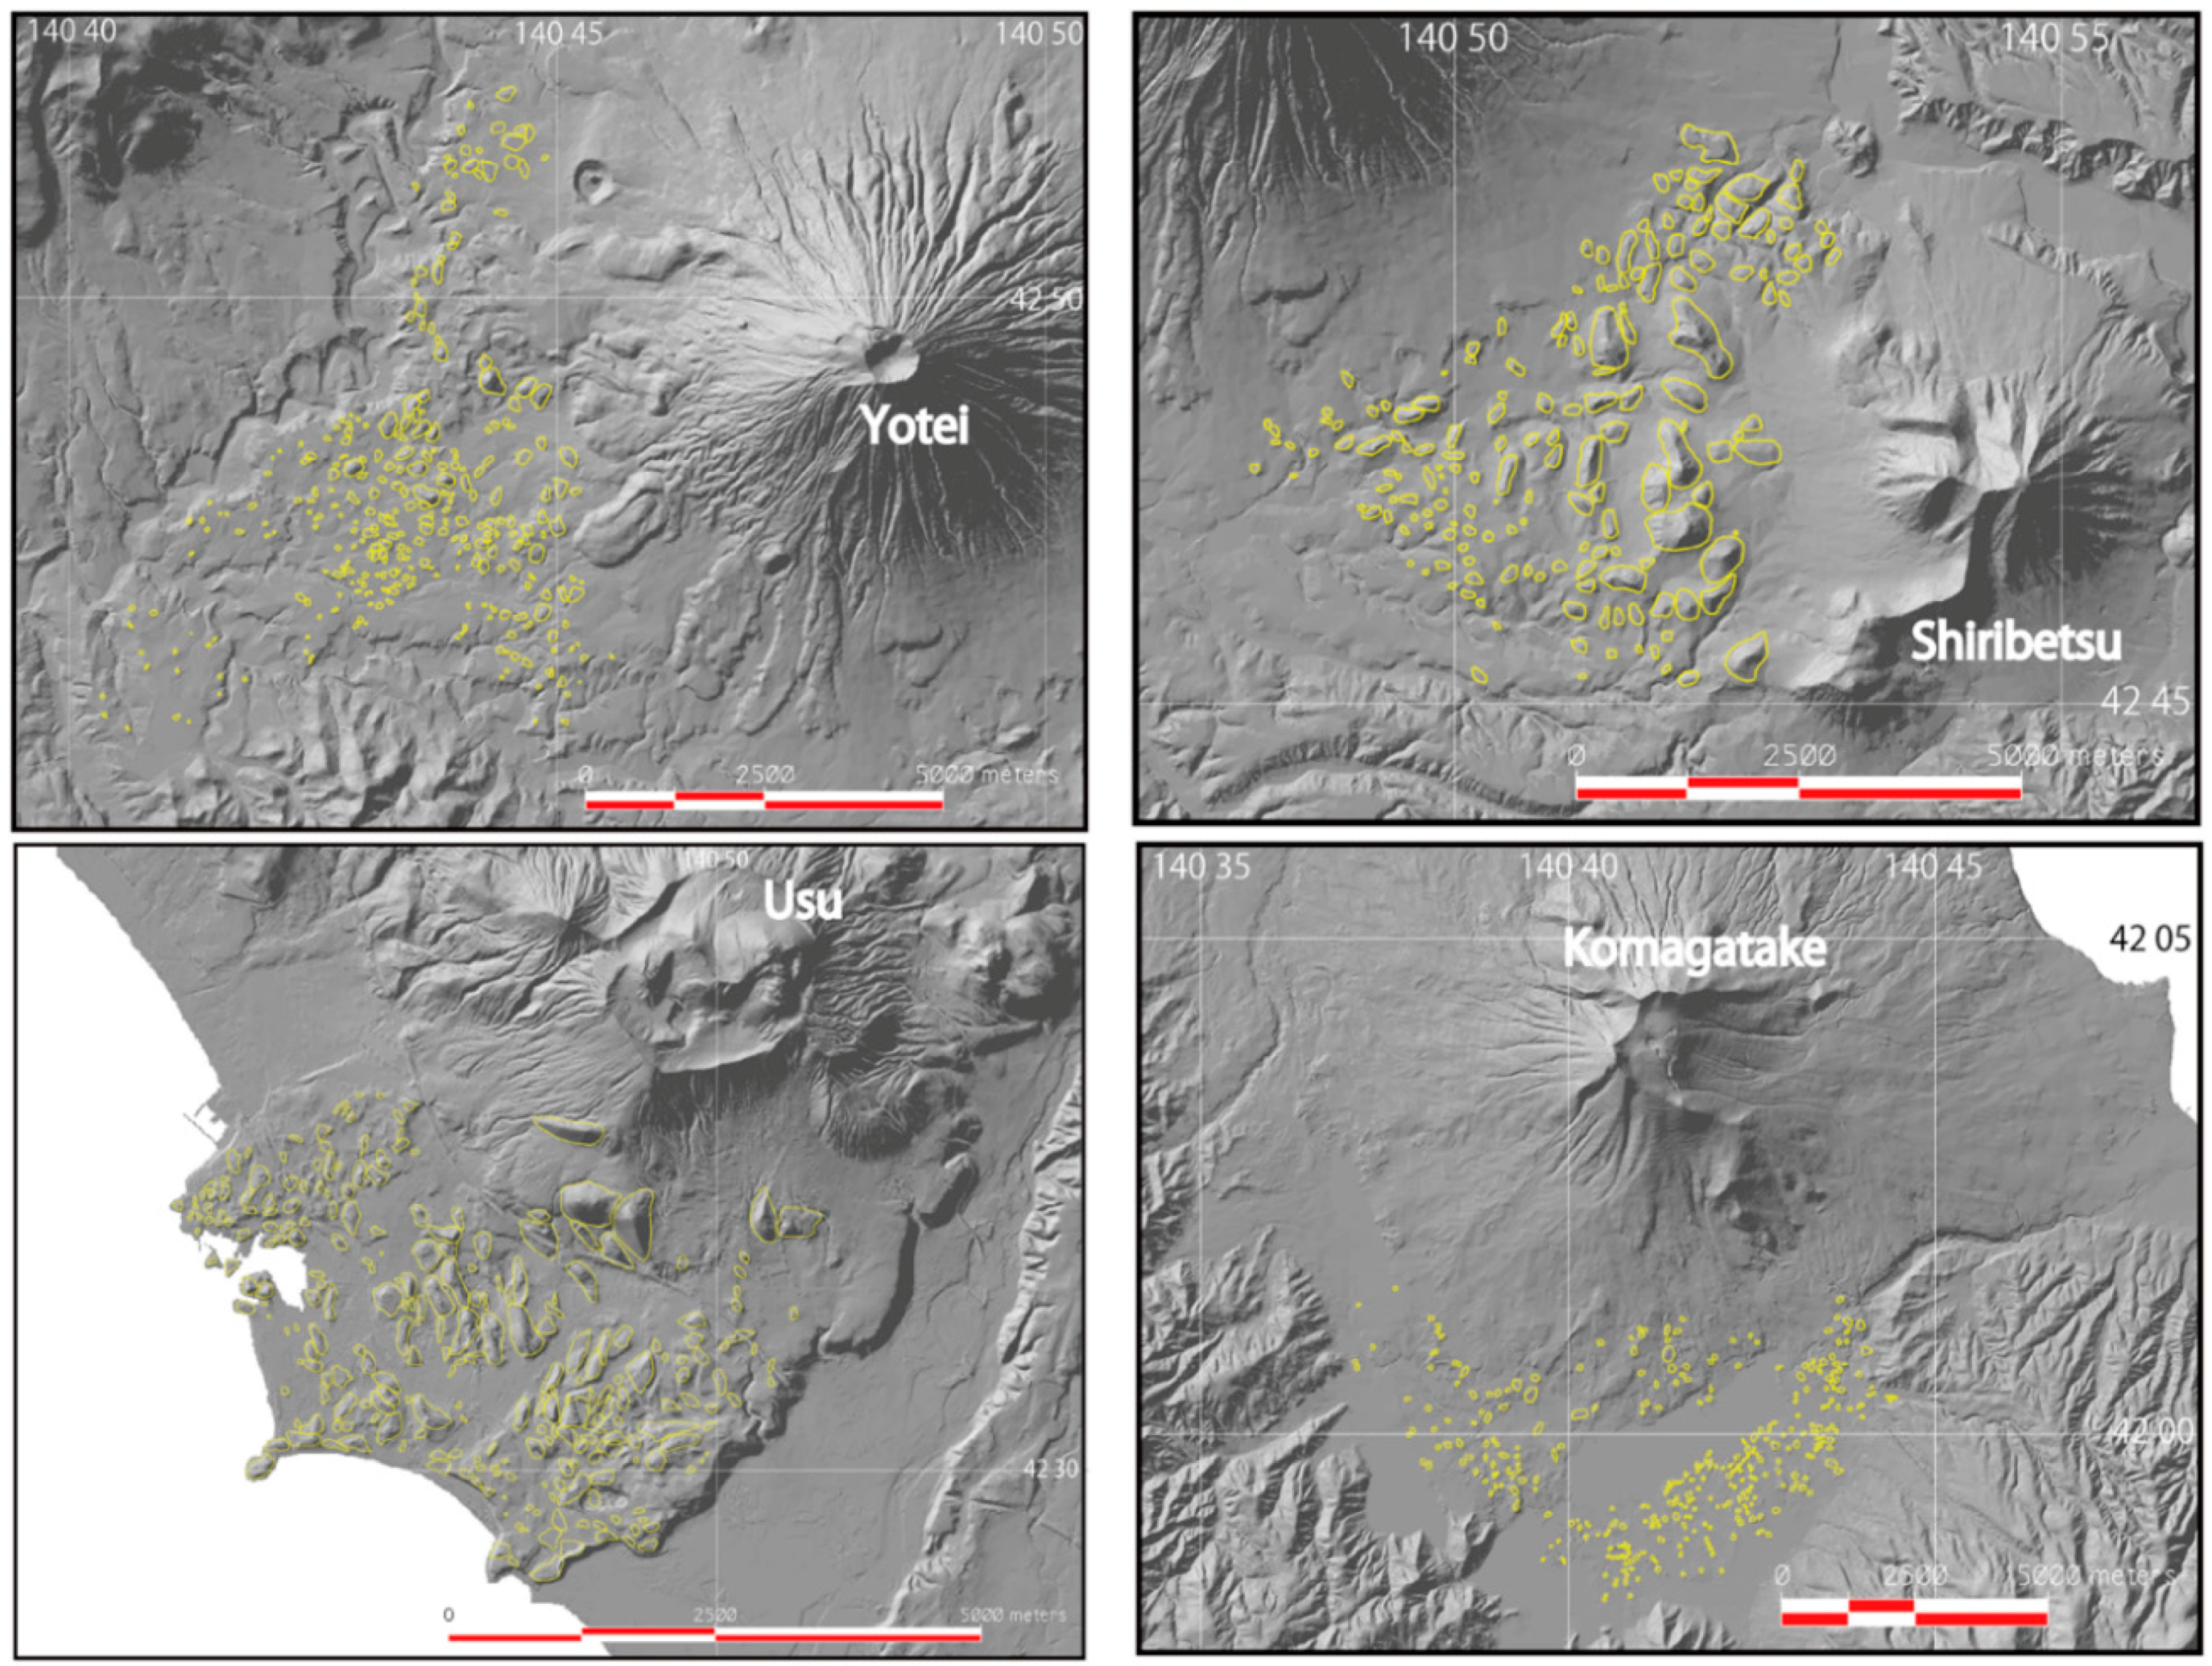
| 1 | Yotei | Yotei | Japan | 297 | Aerial photos | 1.55 | 12.0 | 0.129 |
| 2 | Shiribetsu | Rusutsu | Japan | 172 | Aerial photos | 1.00 | 7.5 | 0.133 |
| 3 | Usu | Zenkoji | Japan | 262 | Aerial photos | 1.05 | 7.0 | 0.150** |
| 4 | Komagatake | Onuma (Kurumizaka) | Japan | 329 | Land Condition Map (GSI) | 1.00 | 11.0 | 0.091 |
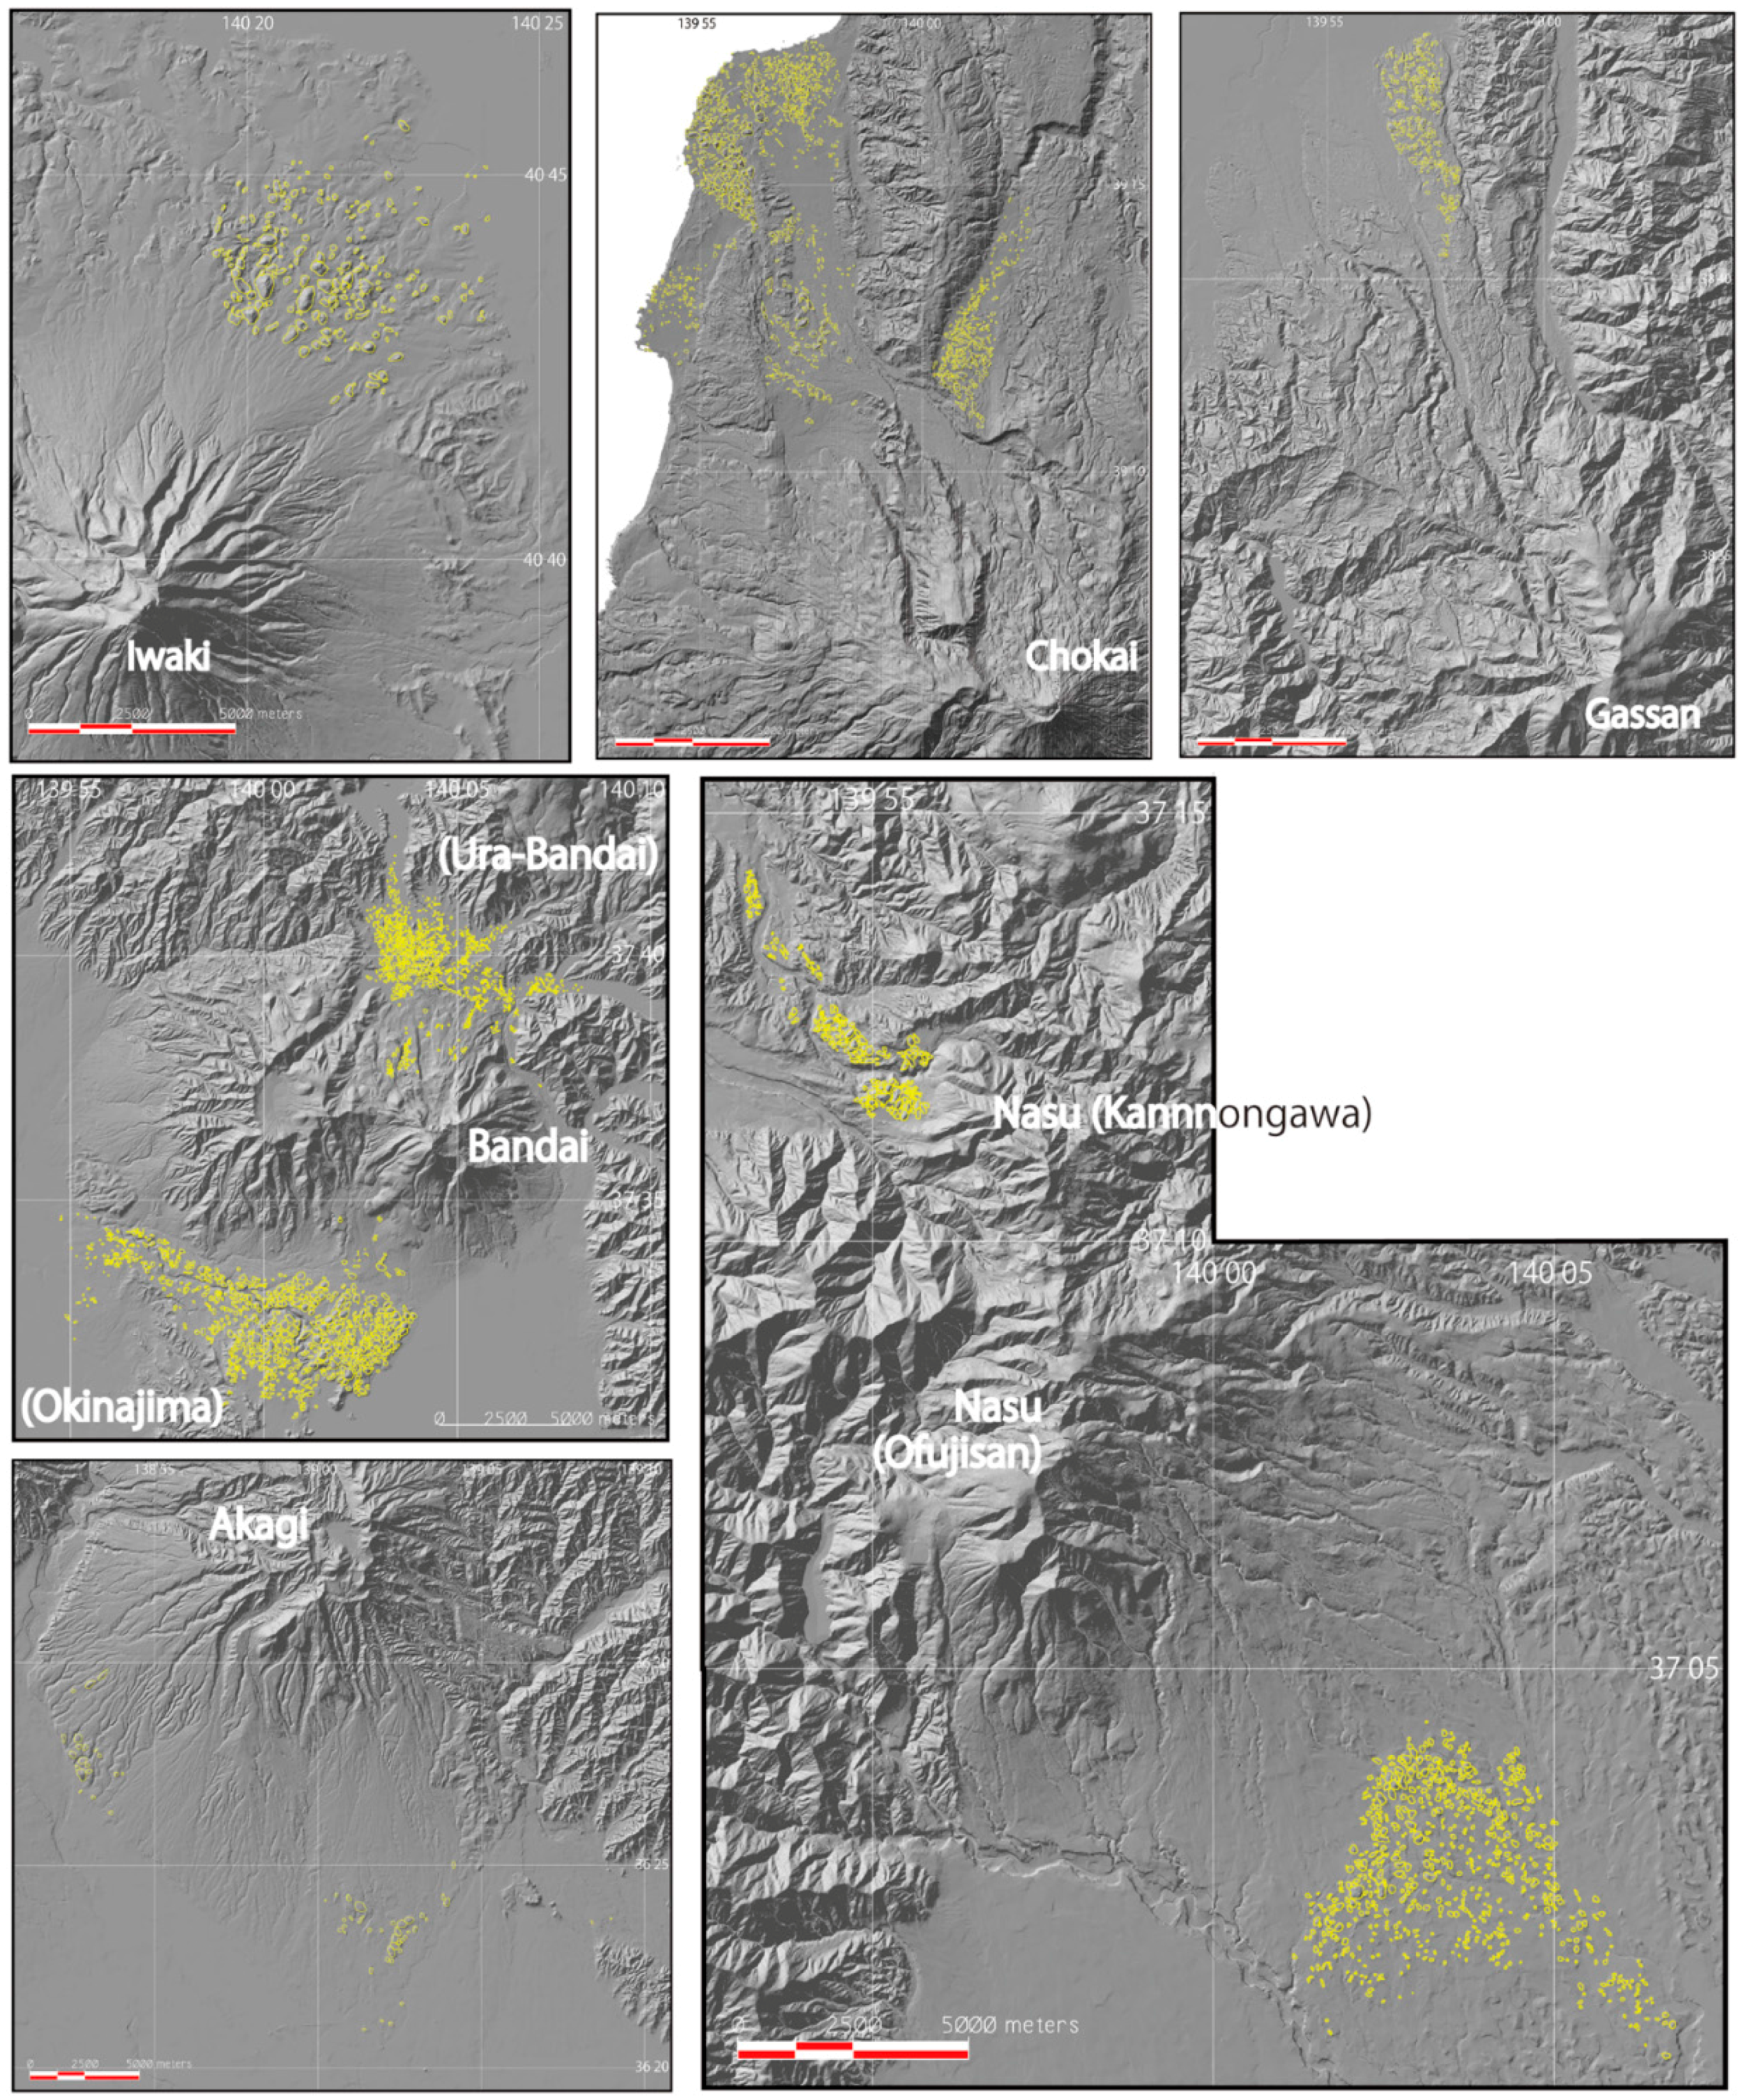
| 5 | Iwaki | Tokoshinai | Japan | 200 | Aerial photos | 1.60* | 15.0 | 0.107 |
| 6 | Chokai | Kisakata | Japan | 1185 | Aerial photos | 2.40 | 24.0 | 0.100 |
| 7 | Gassan | Sasagawa | Japan | 265 | Aerial photos | 1.95 | 22.5 | 0.087 |
| 8 | Bandai | Ura-Bandai | Japan | 1235 | Land Condition Map (GSI) | 1.20 | 11.0 | 0.109 |
| 9 | Bandai | Okinajima | Japan | 900 | Land Condition Map (GSI) | 1.80 | 16.0 | 0.113 |
| 10 | Nasu | Kannongawa | Japan | 230 | Aerial photos | 1.00 | 10.5 | 0.095 |
| 11 | Nasu | Ofujisan | Japan | 643 | Aerial photos | 1.60 | 19.0 | 0.084 |
| 12 | Akagi | Nashigi | Japan | 60 | Aerial photos | 2.40* | 23.5 | 0.102 |
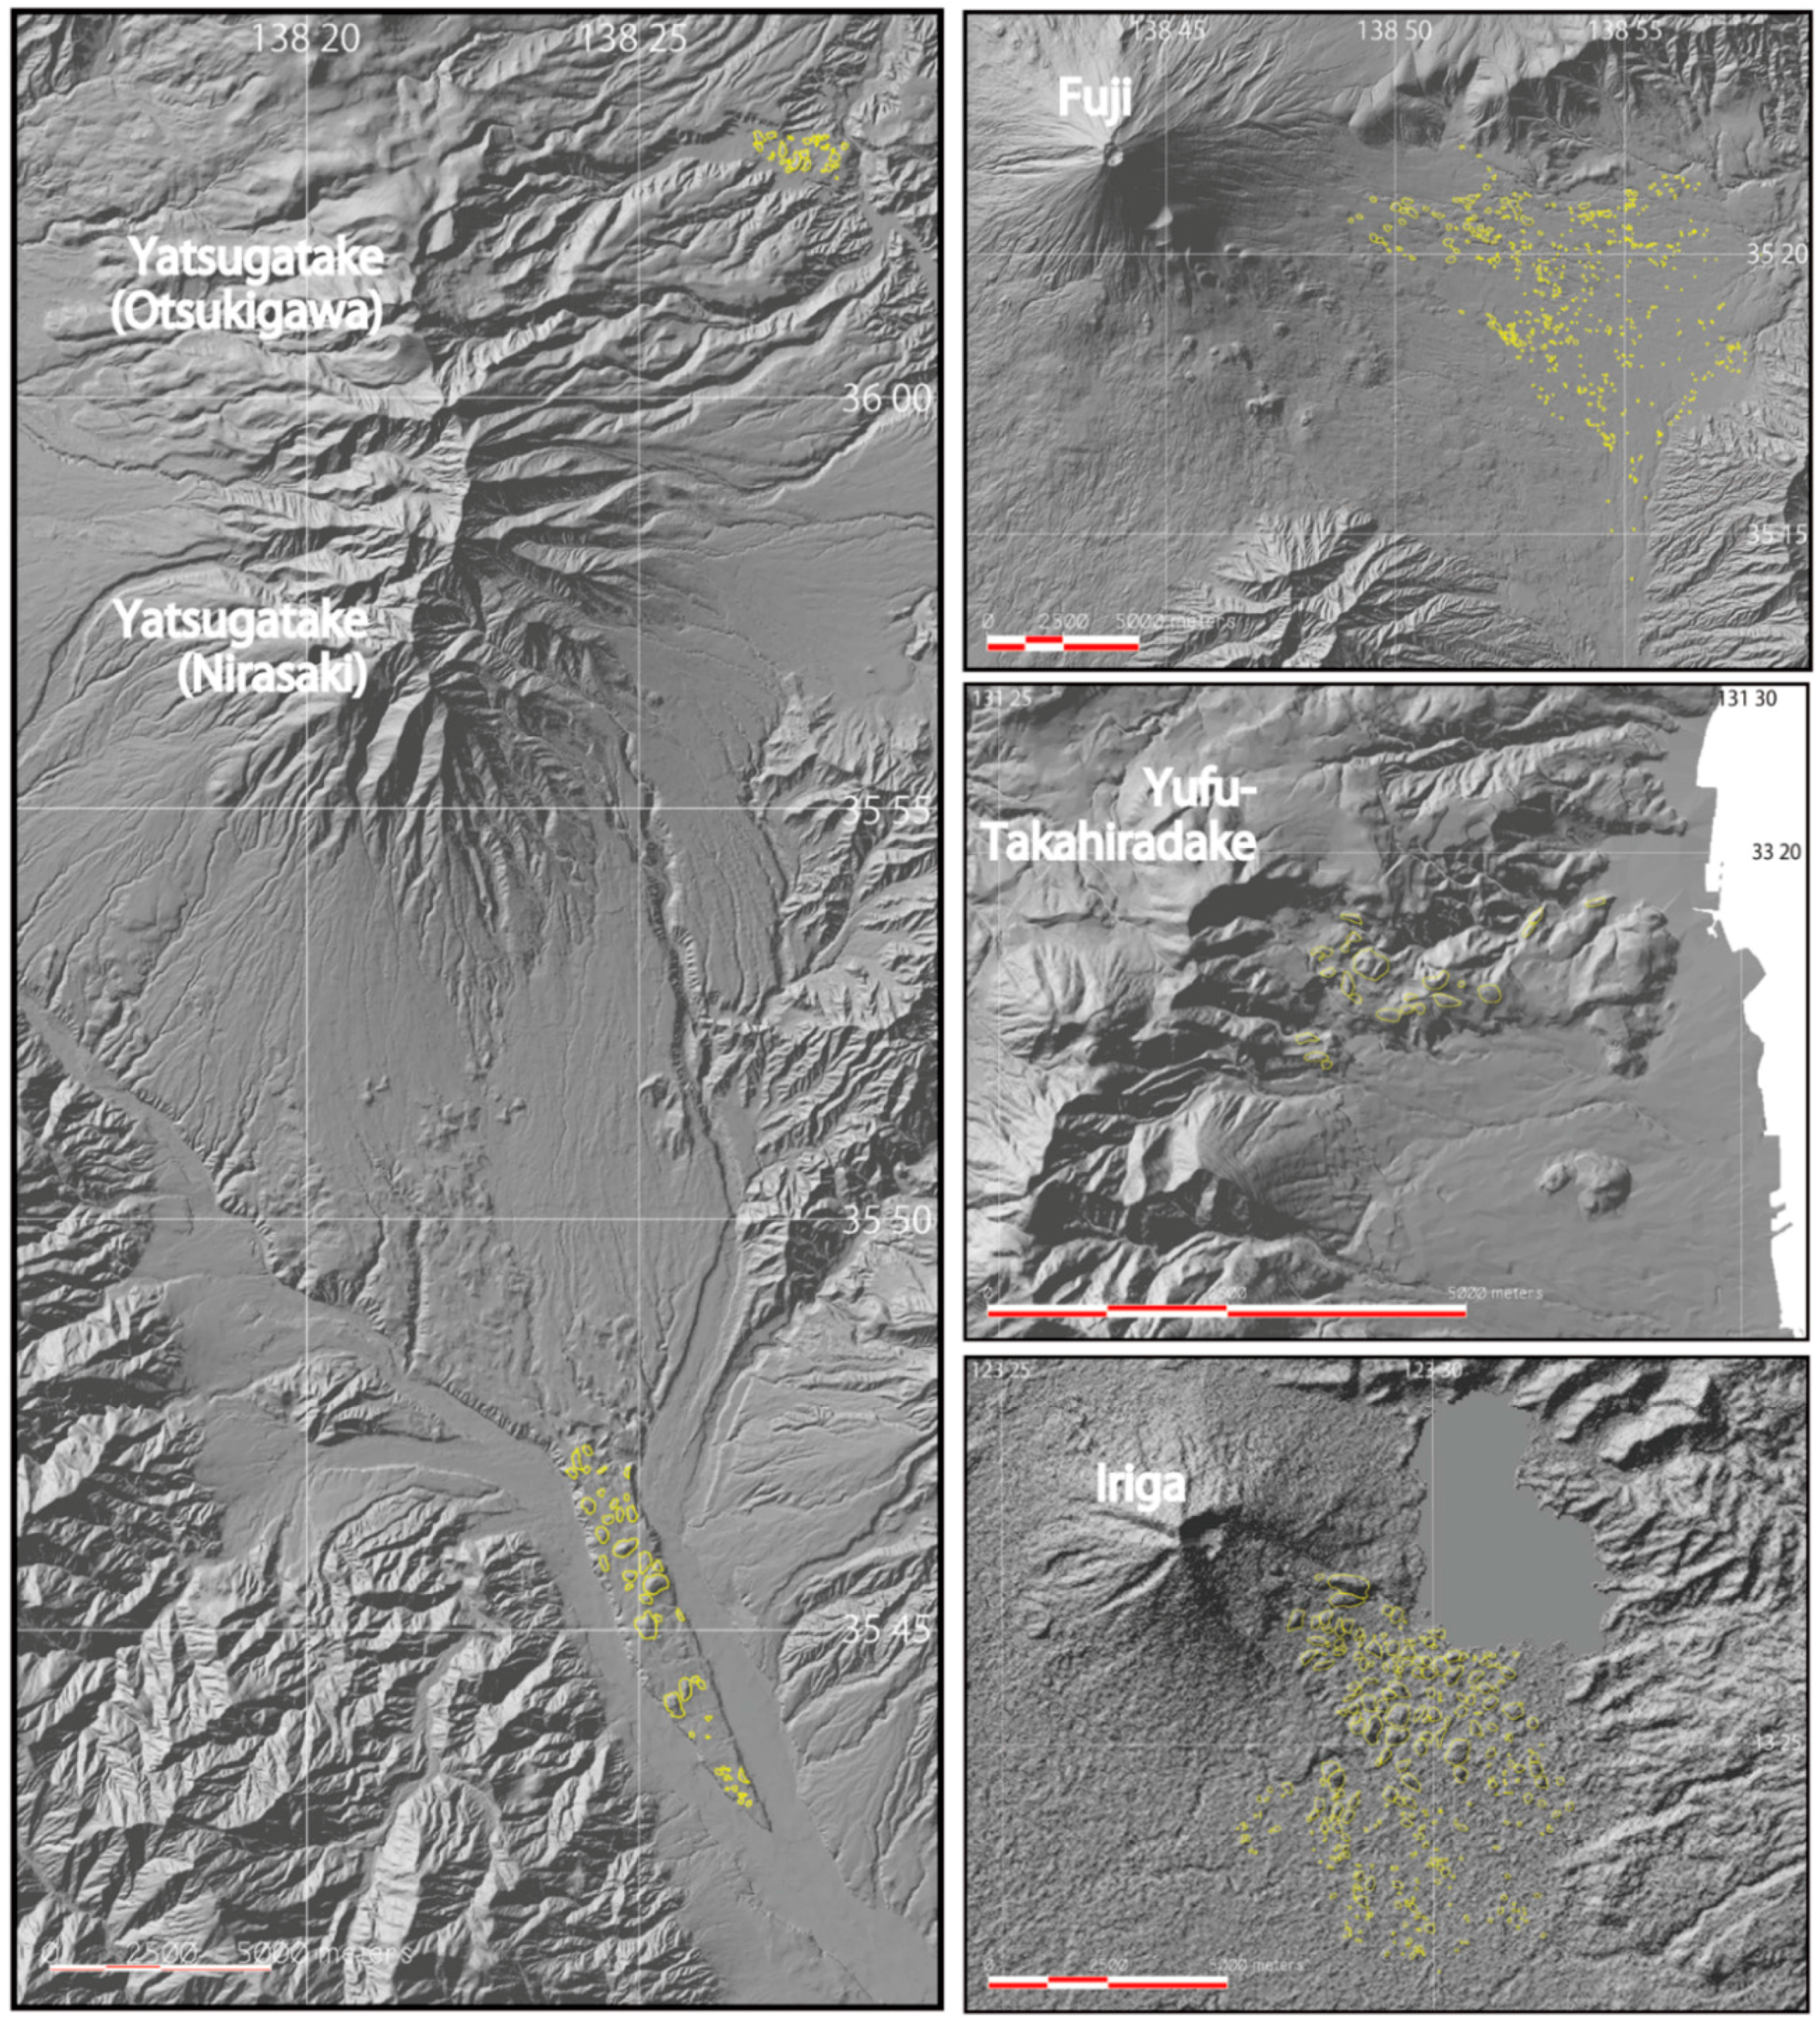
| 13 | Yatsugatake | Otsukigawa | Japan | 26 | Aerial photos | 1.40 | 11.0 | 0.127 |
| 14 | Yatsugatake | Nirasaki | Japan | 45 | Aerial photos | - | - | - |
| 15 | Fuji | Gotemba | Japan | 566 | Land Condition Map (GSI) | 2.70 | 24.0 | 0.113 |
| 16 | Yufu-Takahiradake | Kannawa | Japan | 23 | Aerial photos | 0.80 | 5.2 | 0.154 |
| 17 | Iriga | Iriga | Philippines | 303 | Aerial photos | 1.25 | 11.0 | 0.114 |


3. Results and Discussion
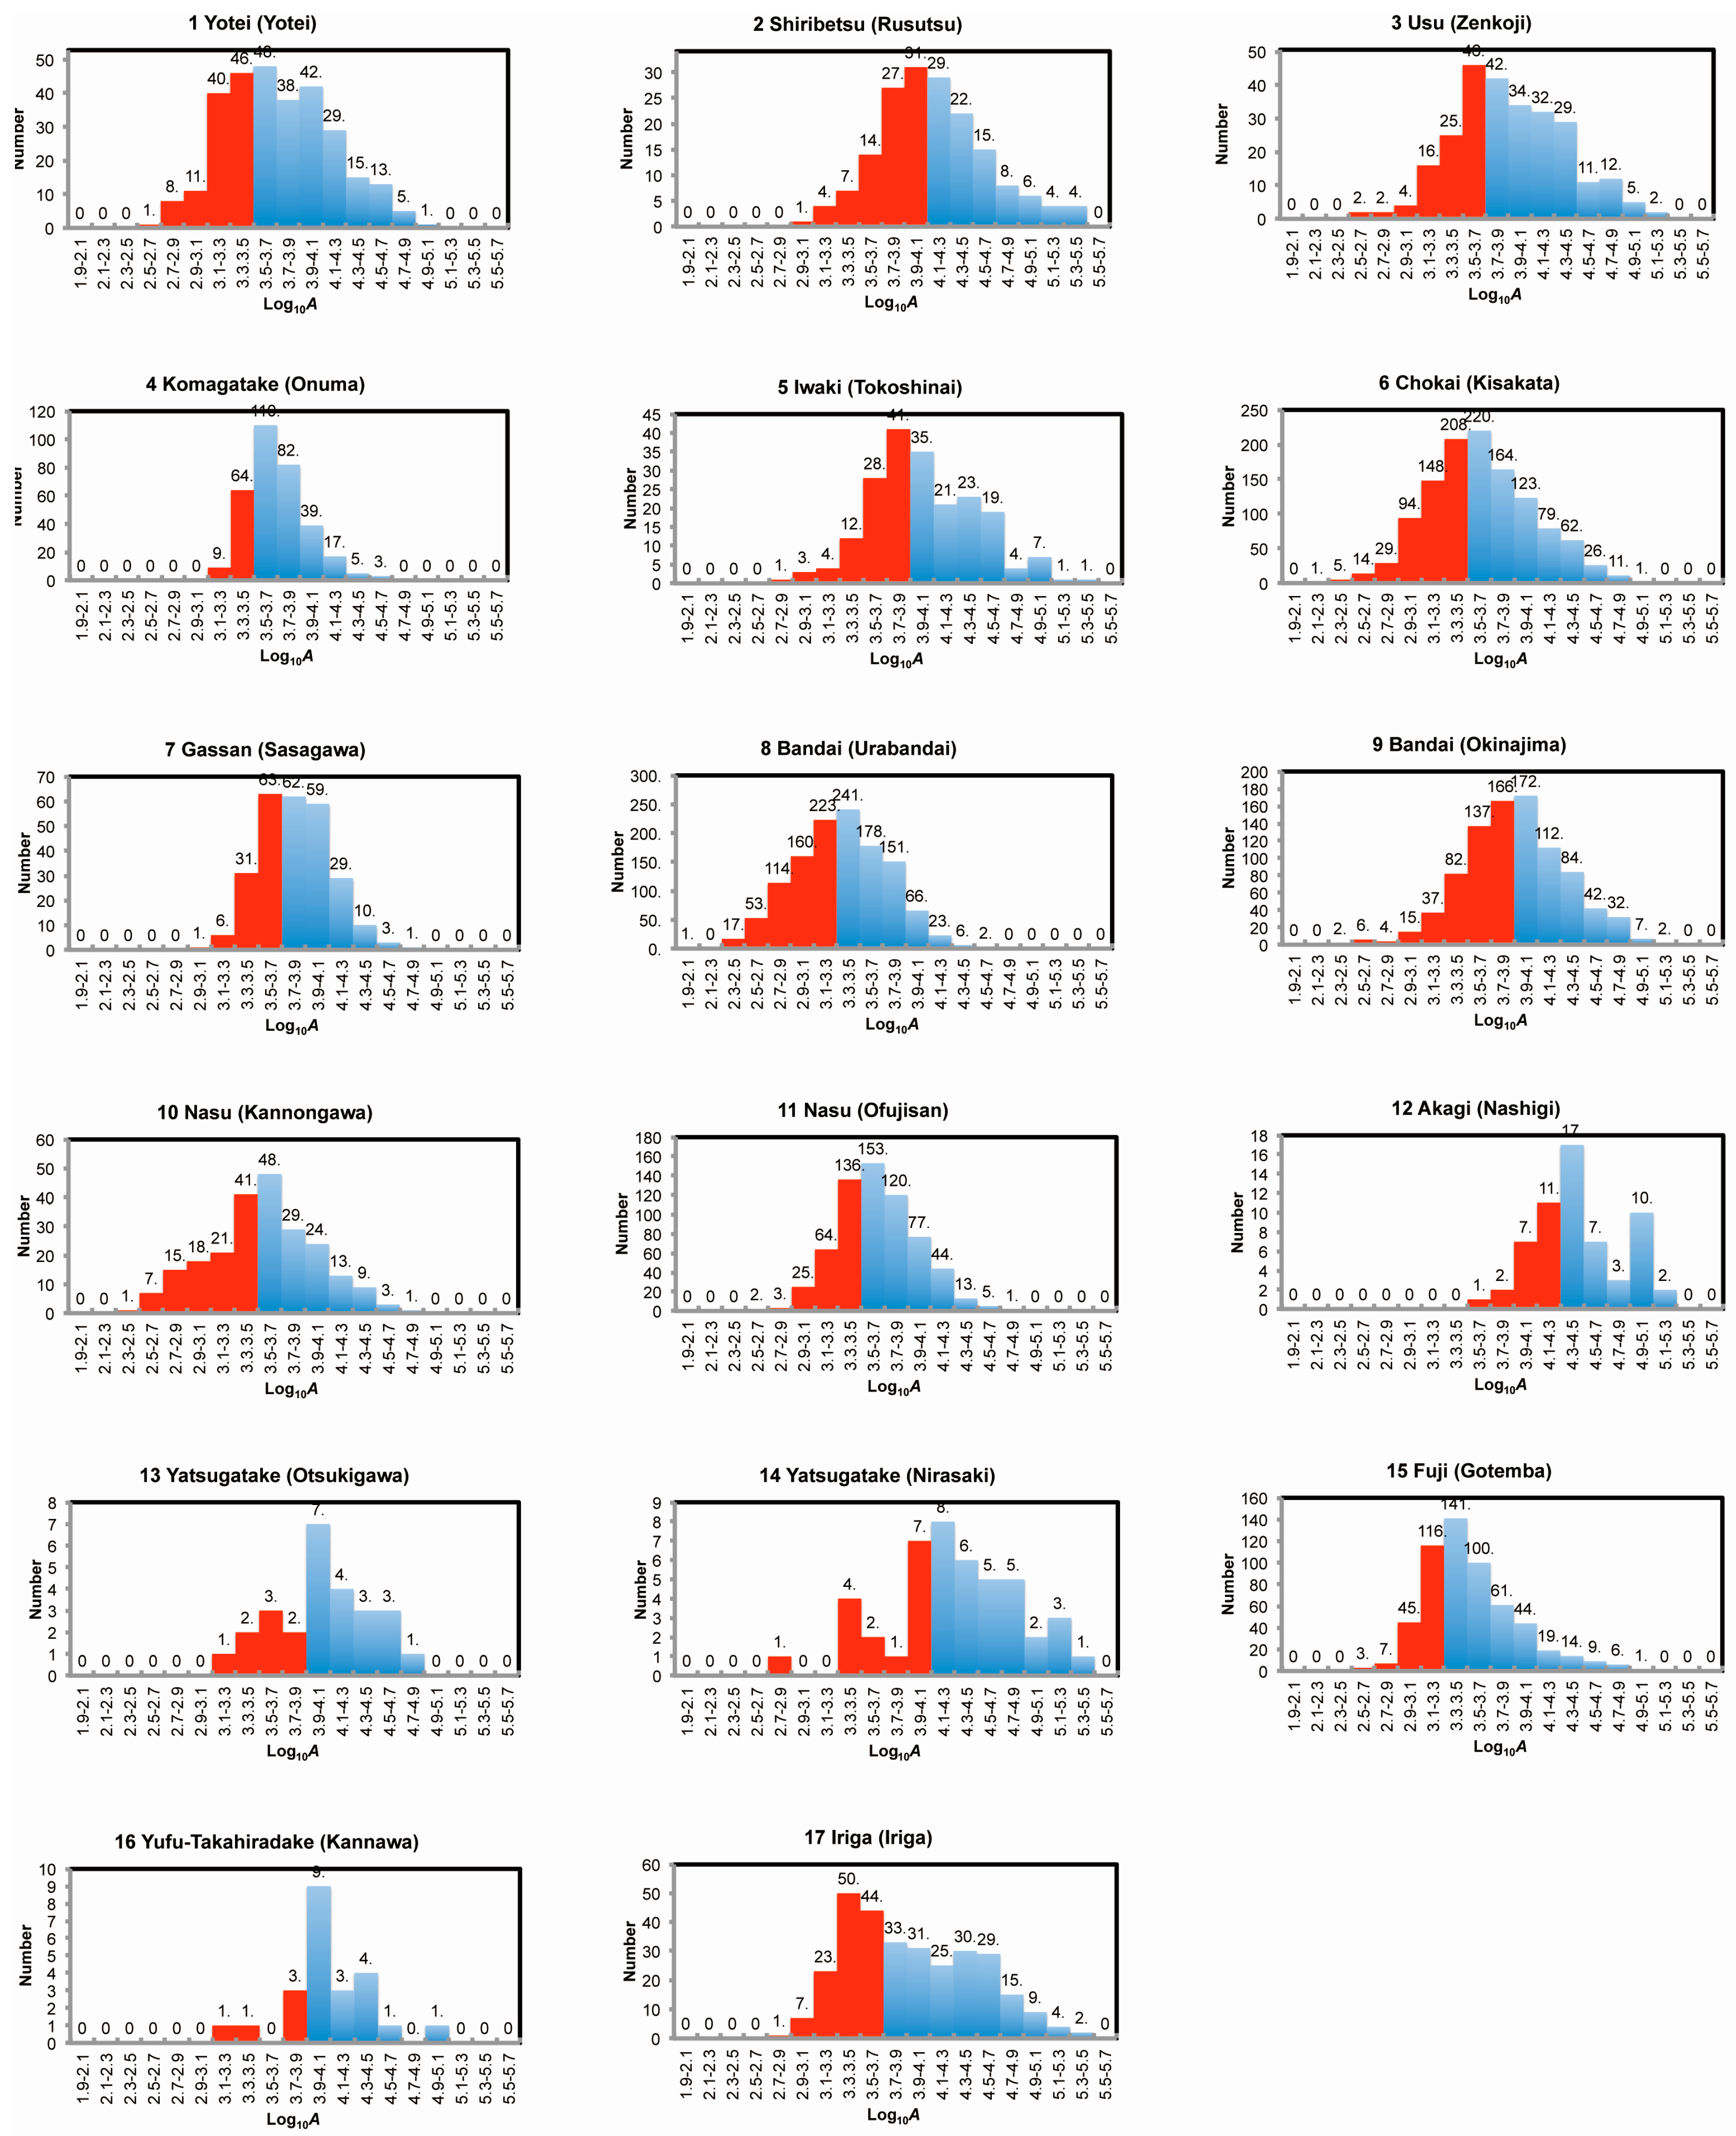
3.1. Data Analysis

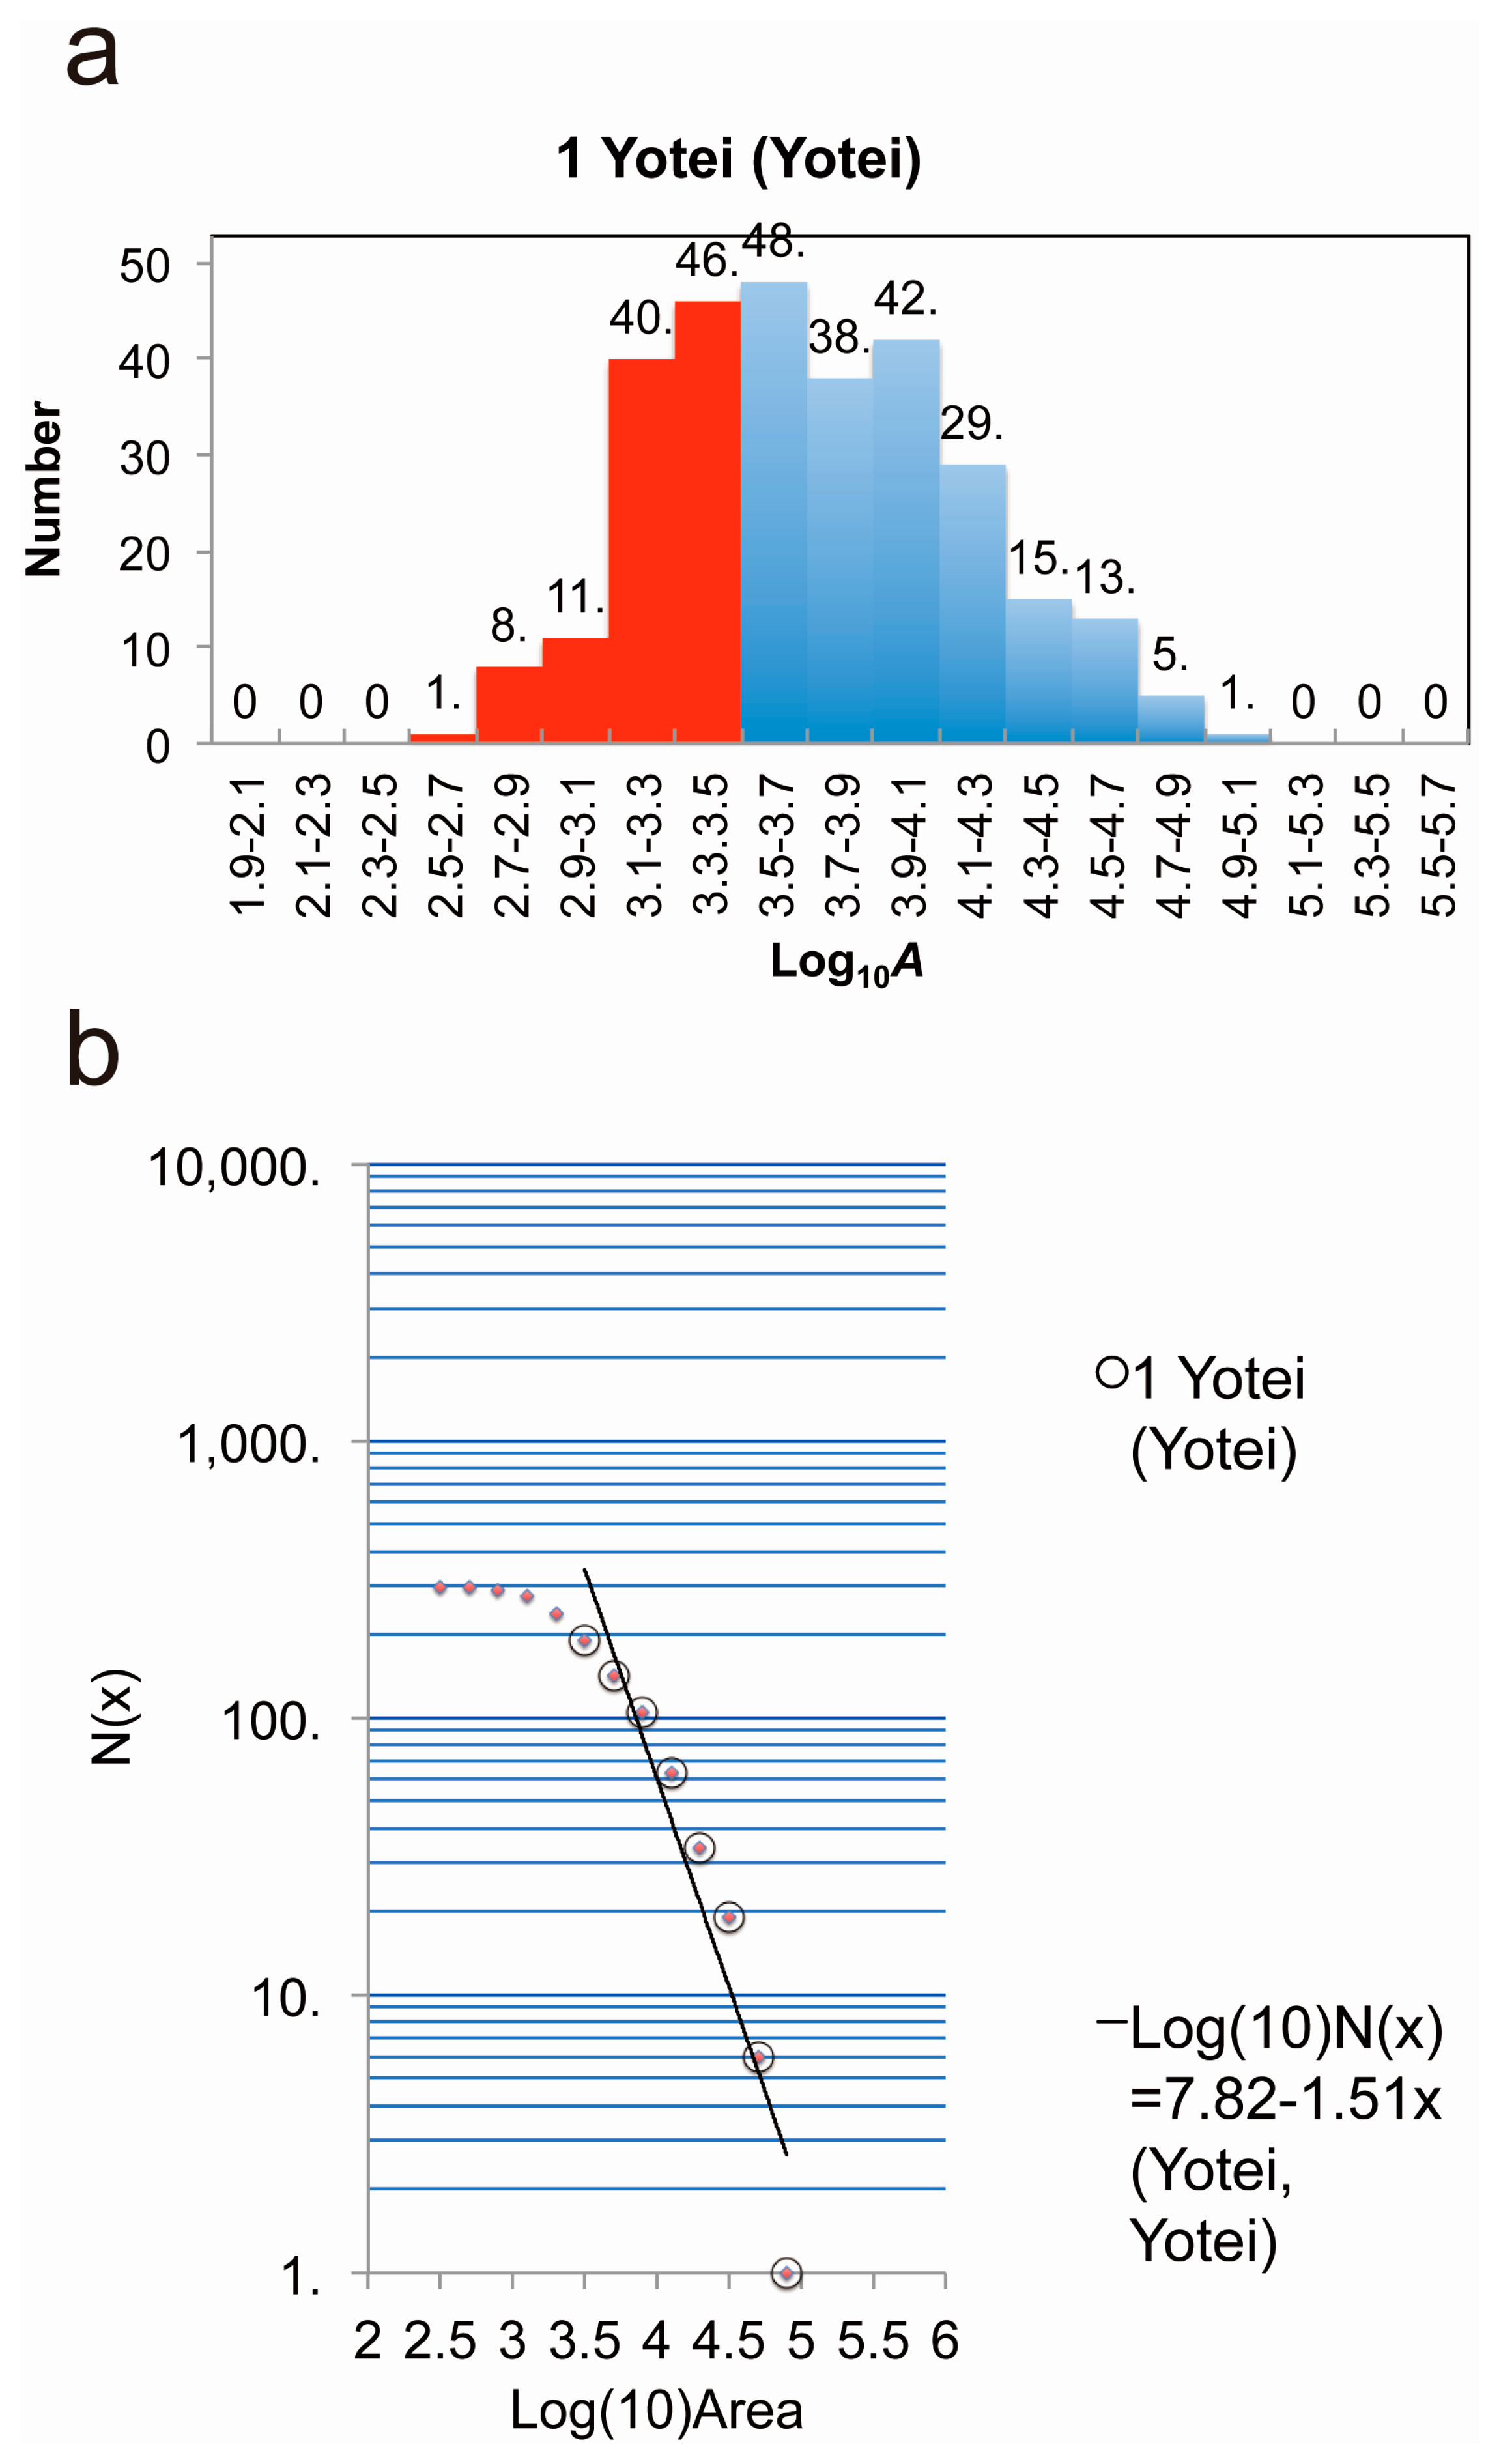
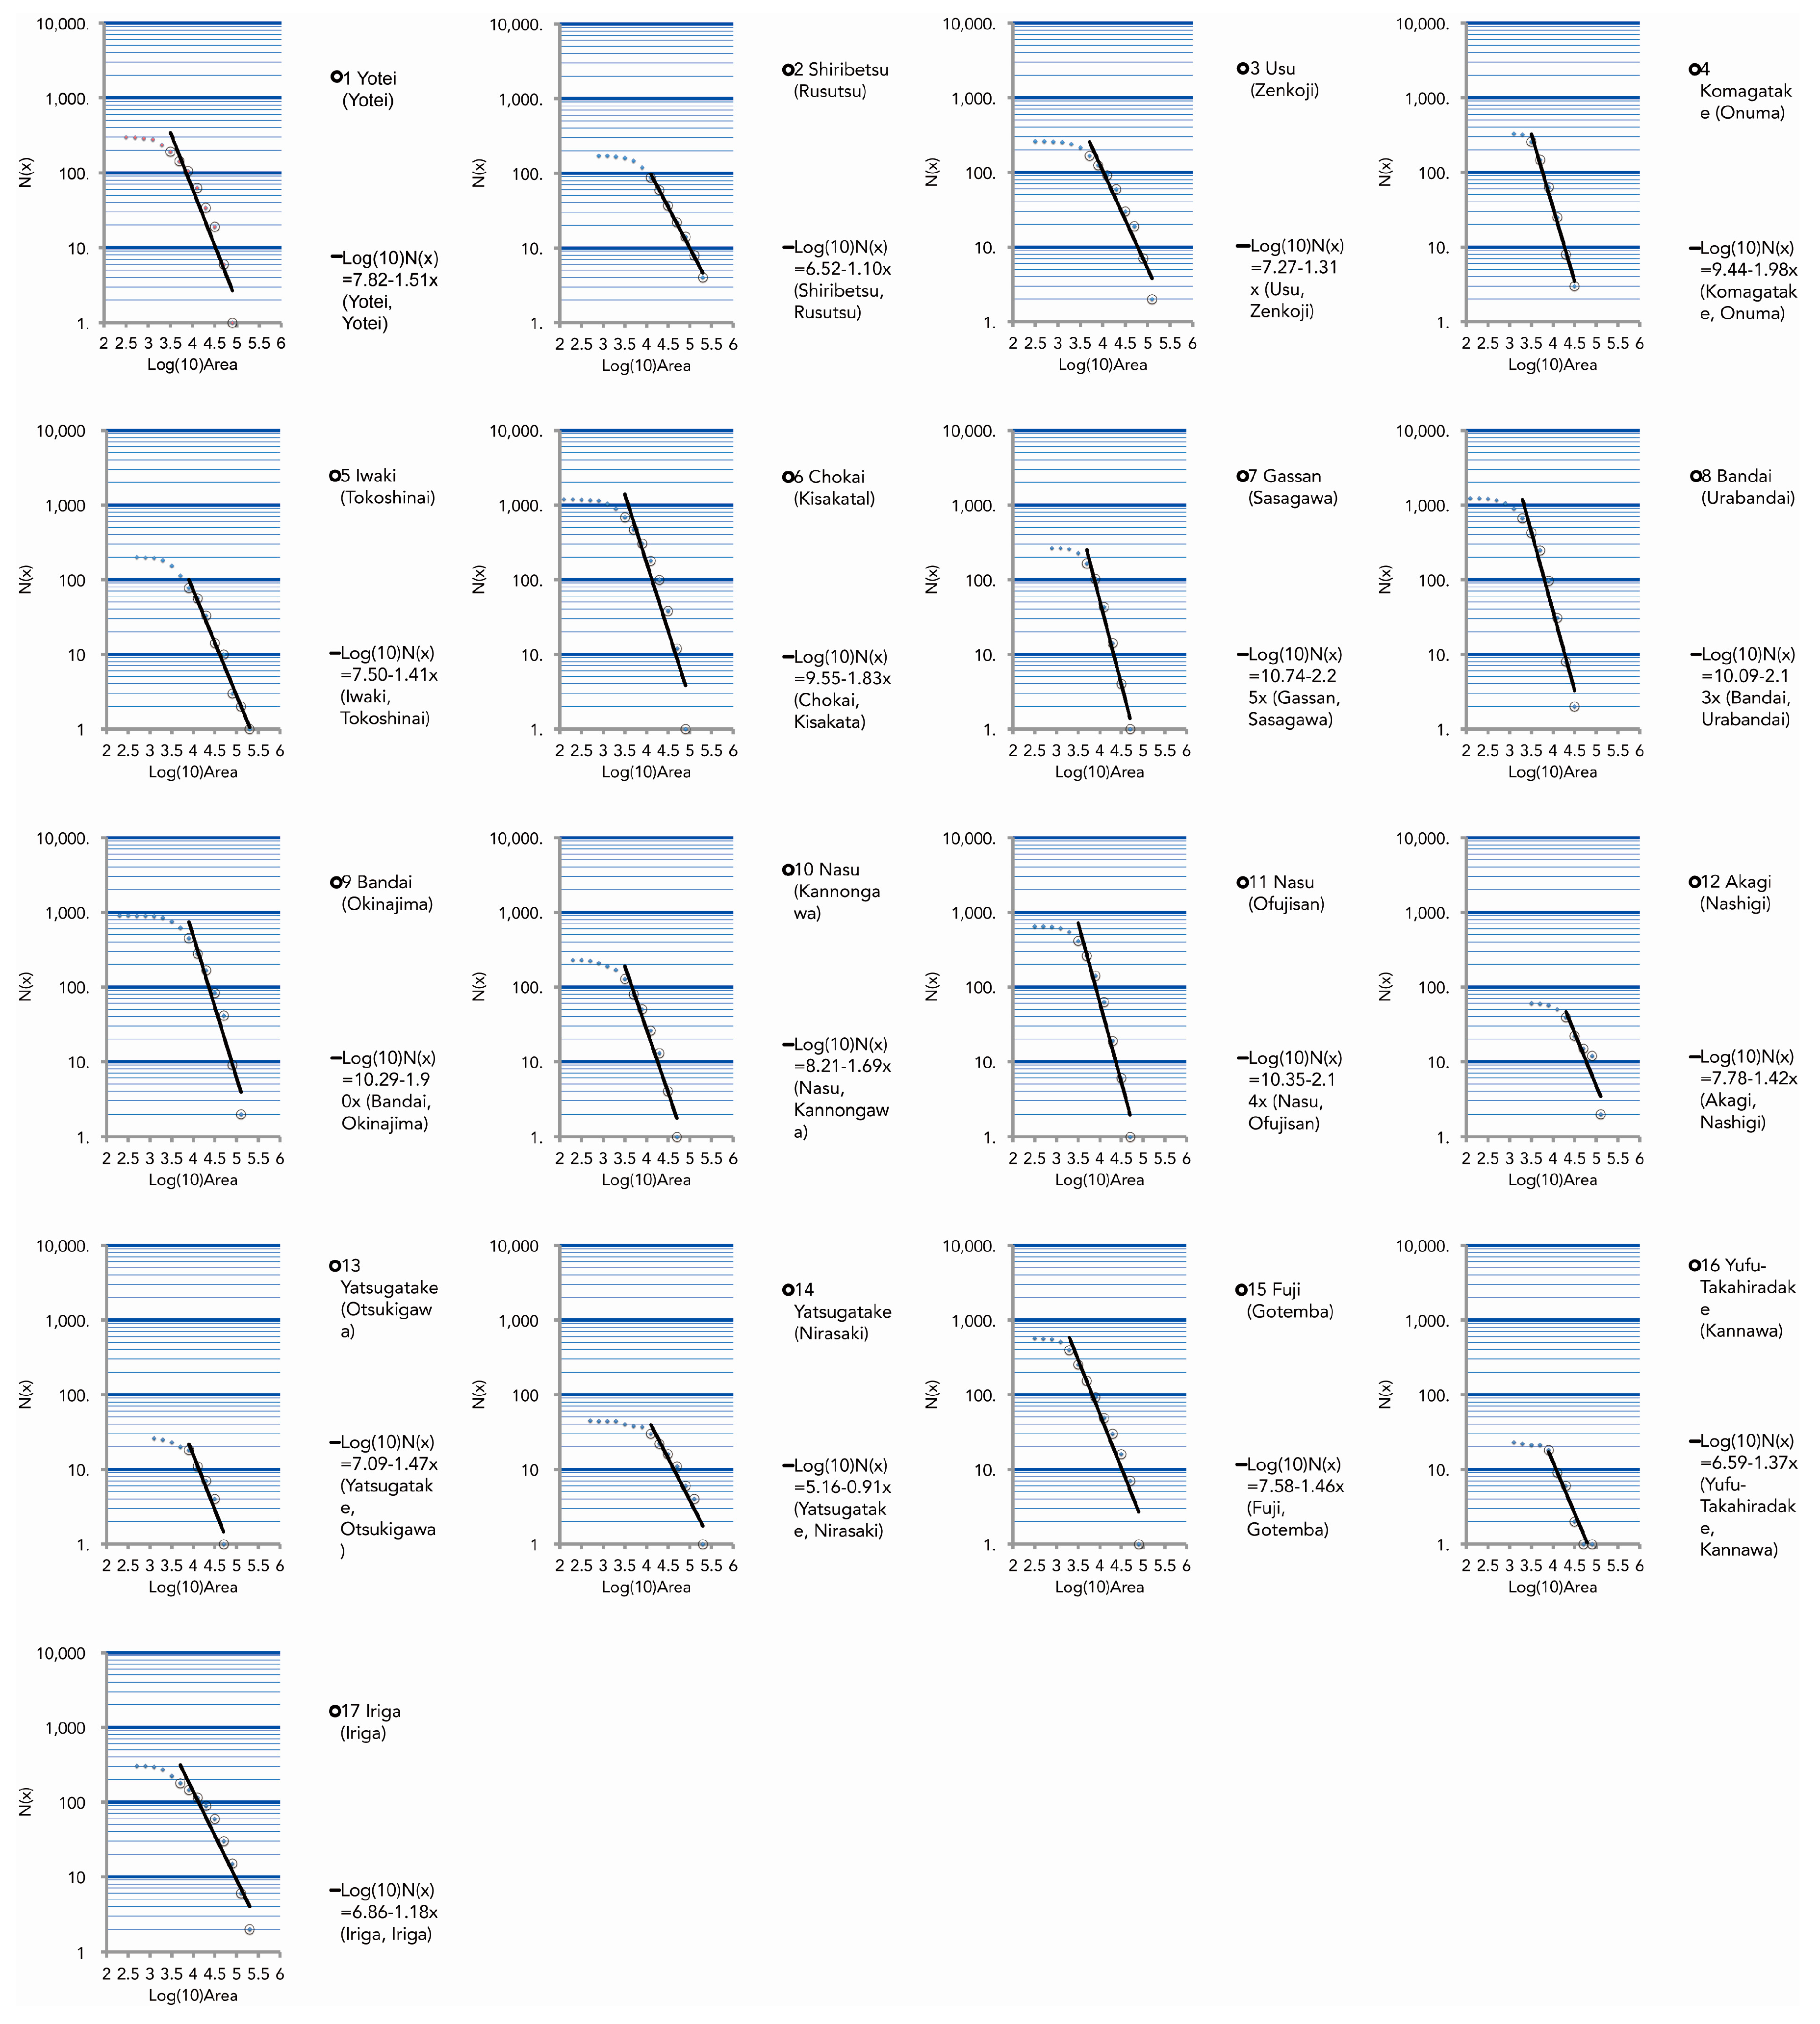
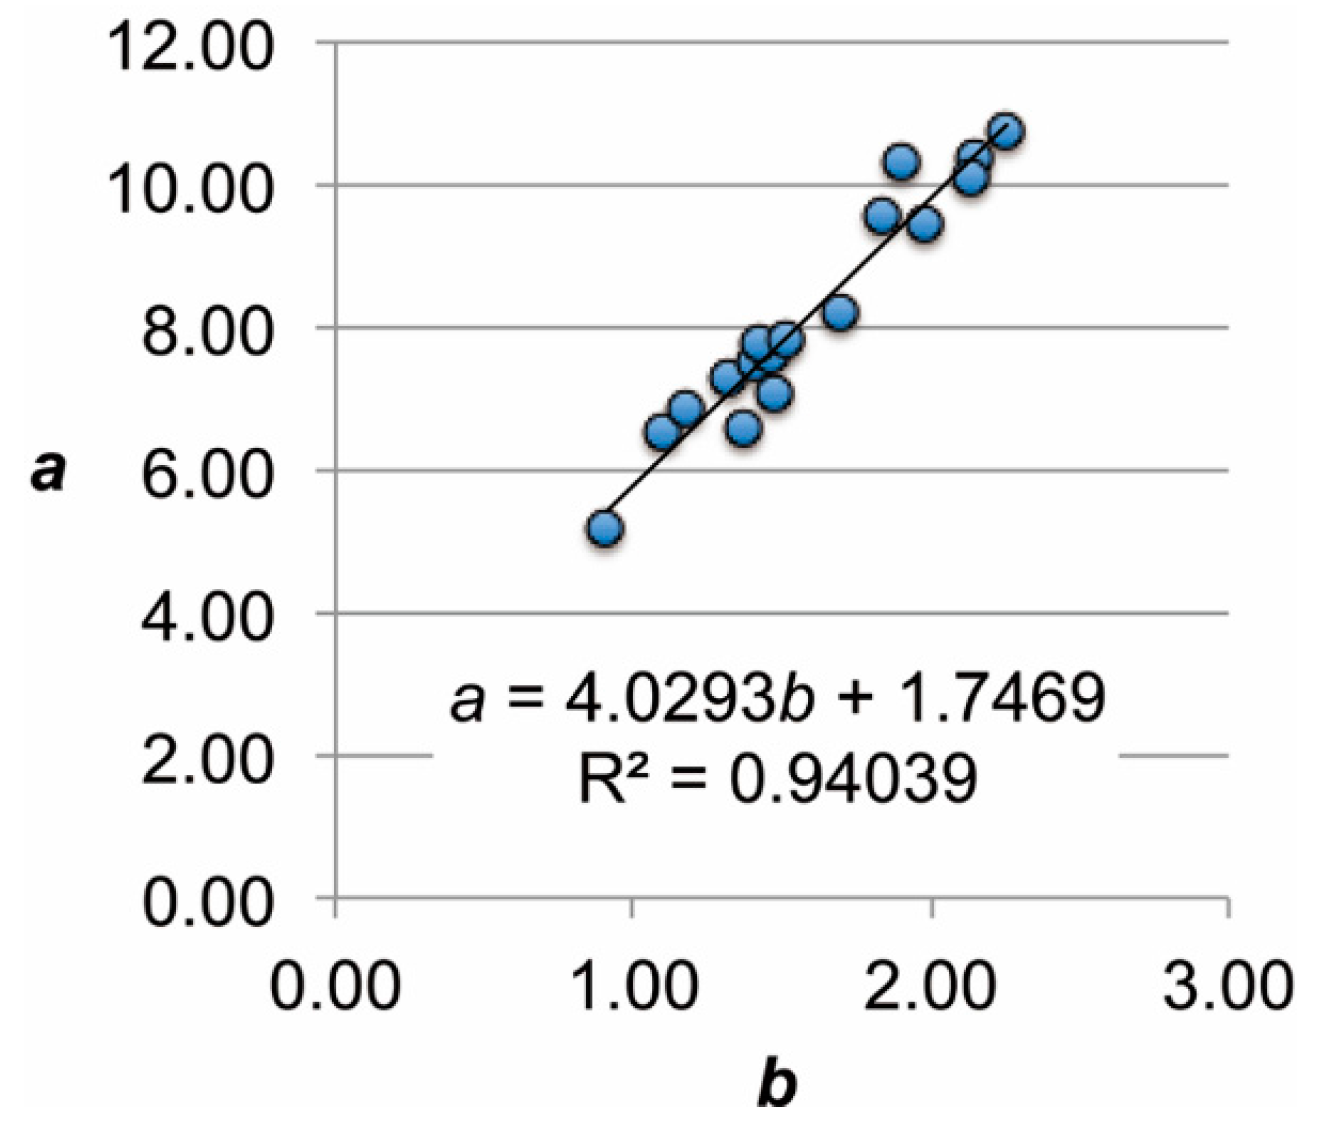
3.2. General Characteristics of the Magnitude-Frequency Distribution of Hummocks


| ID | Volcano | Debris avalanche | a | b | R |
|---|---|---|---|---|---|
| 1 | Yotei | Yotei | 7.82 | 1.51 | −0.952 |
| 2 | Shiribetsu | Rusutsu | 6.52 | 1.10 | −0.997 |
| 3 | Usu | Zenkoji | 7.27 | 1.31 | −0.969 |
| 4 | Komagatake | Onuma (Kurumizaka) | 9.44 | 1.98 | −0.995 |
| 5 | Iwaki | Tokoshinai | 7.50 | 1.41 | −0.993 |
| 6 | Chokai | Kisakata | 9.55 | 1.83 | −0.944 |
| 7 | Gassan | Sasagawa | 10.74 | 2.25 | −0.988 |
| 8 | Bandai | Ura-Bandai | 10.09 | 2.13 | −0.982 |
| 9 | Bandai | Okinajima | 10.29 | 1.90 | −0.971 |
| 10 | Nasu | Kannongawa | 8.21 | 1.69 | −0.976 |
| 11 | Nasu | Ofujisan | 10.35 | 2.14 | −0.978 |
| 12 | Akagi | Nashigi | 7.78 | 1.42 | −0.925 |
| 13 | Yatsugatake | Otsukigawa | 7.09 | 1.47 | −0.965 |
| 14 | Yatsugatake | Nirasaki | 5.16 | 0.91 | −0.947 |
| 15 | Fuji | Gotemba | 7.58 | 1.46 | −0.971 |
| 16 | Yufu-Takahiradake | Kannawa | 6.59 | 1.37 | −0.978 |
| 17 | Iriga | Iriga | 6.86 | 1.18 | −0.961 |
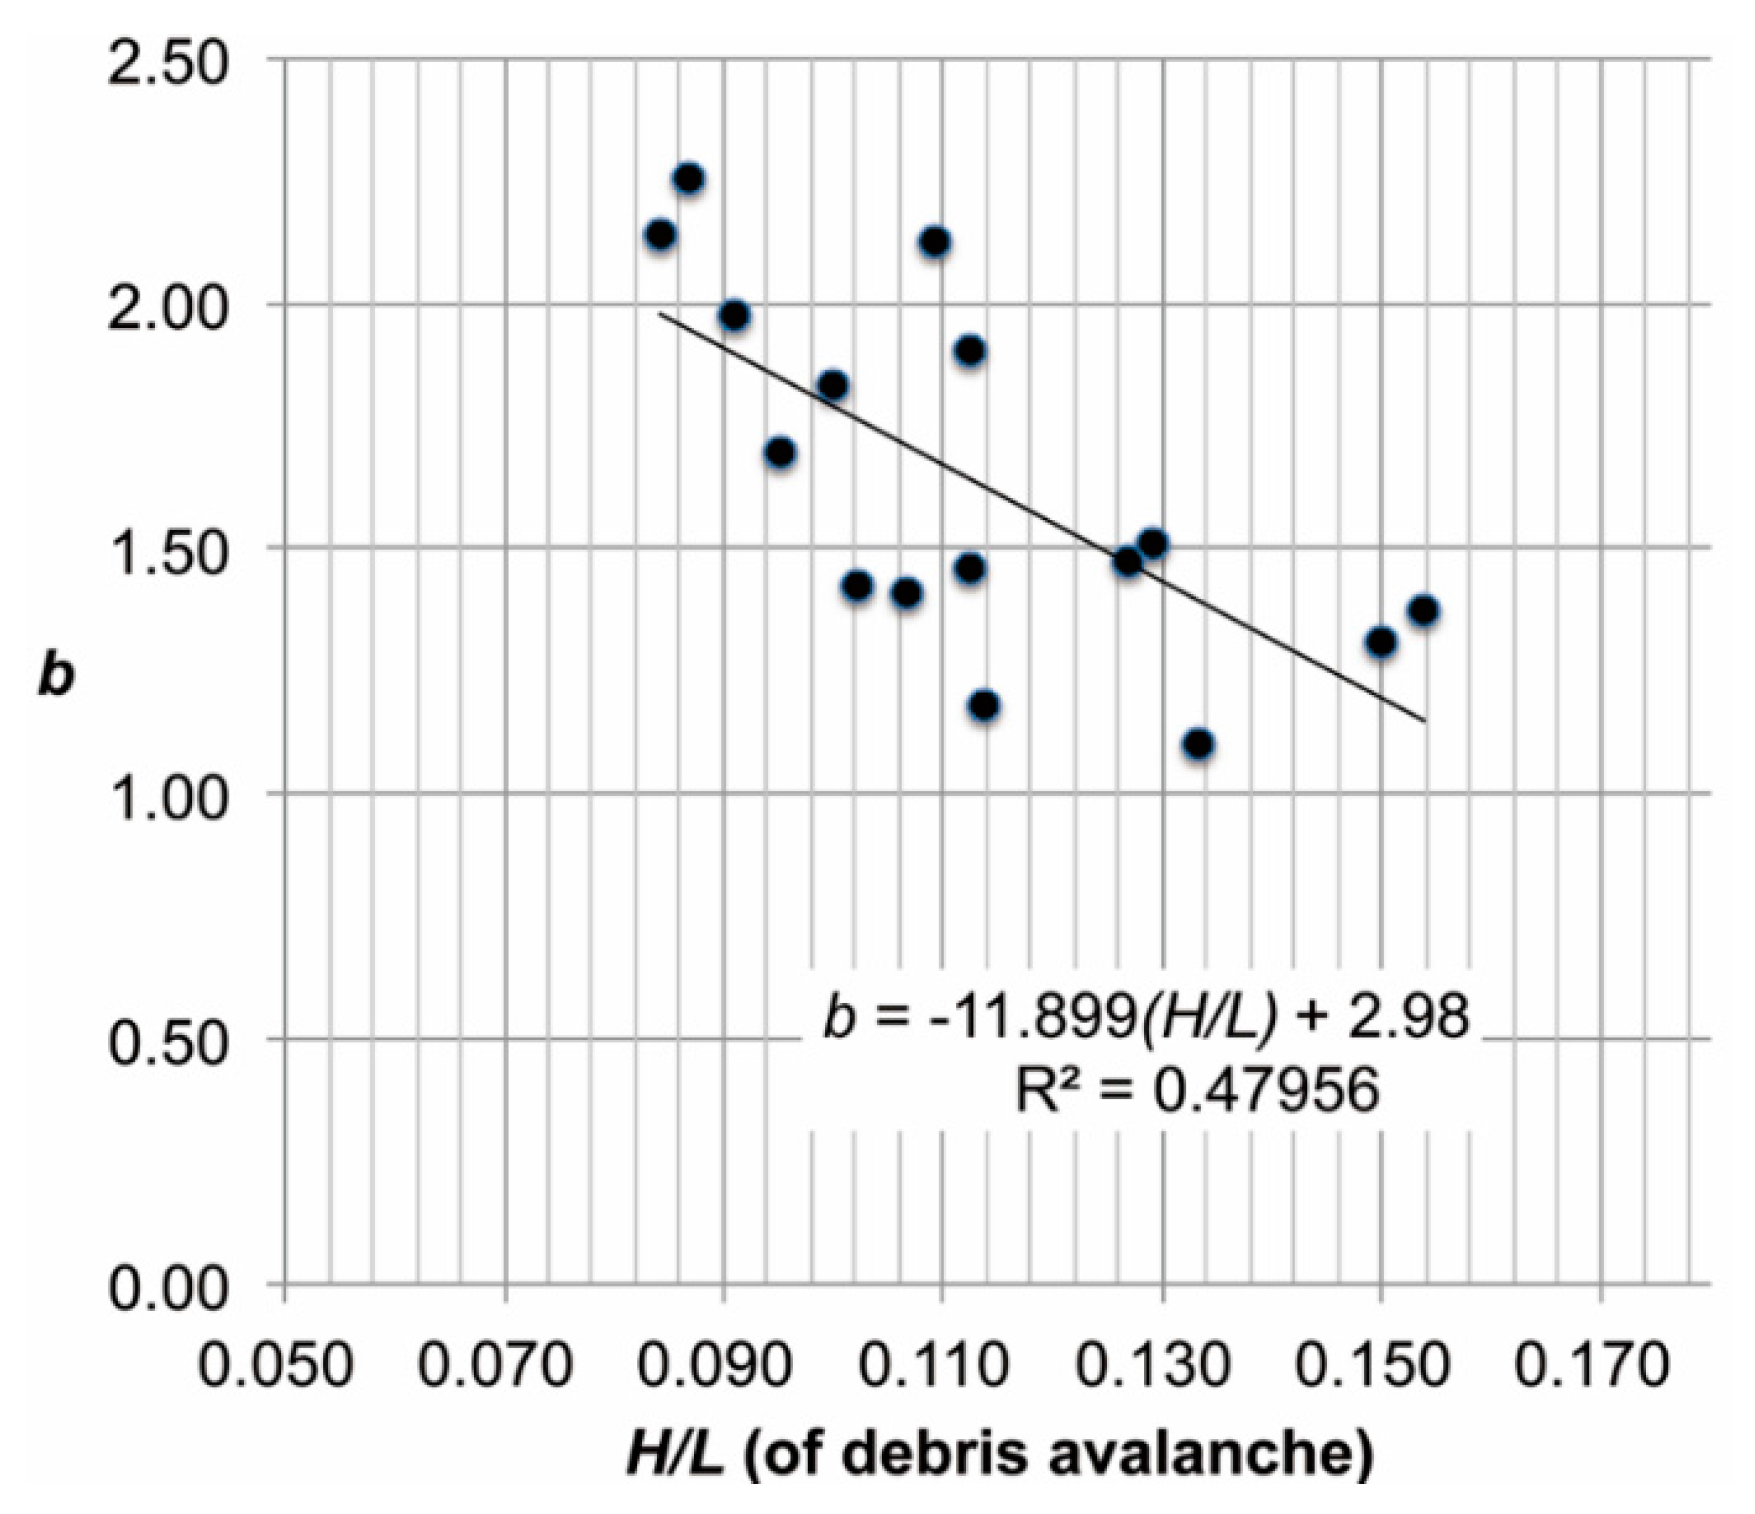
3.3. Rockslide-Debris Avalanche Processes Inferred from the Magnitude-Frequency Distributions of Hummocks


3.4. Geomorphological Significance
Acknowledgments
Conflicts of Interest
References
- Wolman, M.G.; Miller, J.P. Magnitude and frequency of forces in geomorphic processes. J. Geol. 1960, 68, 54–74. [Google Scholar] [CrossRef]
- Hirano, M.; Ohmori, H. Magnitude-frequency distribution for rapid mass movements and its geomorphological implication. Trans. Jpn. Geomorphol. Union 1989, 10, 95–111. (In Japanese) [Google Scholar]
- Sugai, T.; Ohmori, H.; Hirano, M. Rock control on magnitude-frequency distribution of landslides. Trans. Jpn. Geomorphol. Union 1994, 15, 233–251. [Google Scholar]
- Korup, O.; Görüm, T.; Hayakawa, Y. Without power? Landslide inventories in the face of climatic change. Earth Surf. Process. Landf. 2012, 37, 92–99. [Google Scholar] [CrossRef]
- Ohmori, H.; Hirano, M. Magnitude, frequency and geomorphological significance of rocky mud flows, landcreep and the collapse of steep slopes. Zeitschrift fur Geomorphology 1988, 67, 55–65. [Google Scholar]
- Ui, T.; Takarada, S.; Yoshimoto, M. Debris avalanches. In The Encyclopedia of Volcanoes, 2nd ed.; Sigurdsson, H., Houghton, B., McNutt, S., Rymer, H., Stix, J., Eds.; Academic Press: San Diego, CA, USA, 2000; pp. 617–626. [Google Scholar]
- Van Wyk de Vries, B.; Davies, T. Landslides, debris avalanches and volcanic gravitational deformation. In The Encyclopedia of Volcanoes, 2nd ed.; Sigurdsson, H., Houghton, B., McNutt, S., Rymer, H., Stix, J., Eds.; Academic Press: San Diego, CA, USA, 2015; pp. 665–685. [Google Scholar]
- Calhoun, N.; Poschinger, A.V.; Clague, J.J.; Giardino, M.; Masera, D.; Perotti, L. New Pieces to the Flims-Tamins Rockslide Puzzle. In Engineering Geology for Society and Territory-Volume 2; Lollino, G., Giordan, D., Crosta, G., Corominas, J., Azzam, R., Wasowski, J., Sciarra, N., Eds.; Springer International Publishing: Cham, Switzerland, 2015; pp. 899–903. [Google Scholar]
- Geertsema, M.; Hungr, O.; Schwab, J.W.; Evans, S.G. A large rockslide–debris avalanche in cohesive soil at Pink Mountain, northeastern British Columbia, Canada. Eng. Geol. 2006, 83, 64–75. [Google Scholar] [CrossRef]
- Glicken, H. Rockslide-Debris Avalanche of May 18, 1980, Mount St. Helens volcano, Washington; USGS Open-File Report 96–677; USGS: Reston, VA, USA, 1996; pp. 1–90.
- Shea, T.; van Wyk de Vries, B. Structural analysis and analogue modeling of the kinematics and dynamics of rockslide avalanches. Geosphere 2008, 4, 657–686. [Google Scholar] [CrossRef]
- Andrade, S.; van Wyk de Vries, B. Structural analysis of the early stages of catastrophic stratovolcano flank-collapse using analogue models. Bull. Volcanol. 2010, 72, 771–789. [Google Scholar] [CrossRef]
- Siebert, L. Large volcanic debris avalanches: Characteristics of source areas, deposits, and associated eruptions. J. Volcanol. Geotherm. Res. 1984, 22, 163–197. [Google Scholar] [CrossRef]
- Yoshida, H.; Sugai, T.; Ohmori, H. Size-distance relationship for hummocks on volcanic rockslide-debris avalanche deposits in Japan. Geomorphology 2012, 136, 76–87. [Google Scholar] [CrossRef]
- Clavero, J.E.; Sparks, R.S.J.; Huppert, H.E. Geological constraints on the emplacement mechanism of the Parinacota debris avalanche, northern Chile. Bull. Volcanol. 2002, 64, 40–54. [Google Scholar] [CrossRef]
- Paguican, E.M.R.; van Wyk de Vries, B.; Lagmay, A.M.F. Hummocks: how they form and how they evolve in rockslide-debris avalanches. Landslides 2012, 11, 67–80. [Google Scholar] [CrossRef]
- Cassie, J.W.; van Gassen, W.; Cruden, D.M. Laboratory analogue of the formation of molards, cones of rock-avalanche debris. Geology 1988, 16, 735–738. [Google Scholar] [CrossRef]
- Yoshida, H. Evaluation of the 1888 sector-collapse volume of Bandai volcano, Japan, in terms of the size-distance distribution pattern of debris avalanche hummocks. Trans. Jpn. Geomorphol. Union 2012, 33, 45–60. (In Janpanese) [Google Scholar]
- Yoshida, H. Longitudinal distribution pattern of hummocks of Kannongawa debris avalanche deposits, Nasu Volcanic Group, Japan, as an example of valley-filling debris avalanches due to the inland volcanic sector-collapse. Sundai Hist. Rev. 2012, 146, 19–36. (In Janpanese) [Google Scholar]
- Yoshida, H. Reexamination of volume loss due to the catastrophic sector-collapse causing the Okinajima debris avalanche of Bandai volcano, Japan. Trans. Jpn. Geomorphol. Union 2013, 34, 1–19. (In Janpanese) [Google Scholar]
- Yoshida, H. Restored image of volcanic sector collapse at “Old” Yotei volcano, southwestern Hokkaido of Japan, by the geomorphological interpretation of hummocks’ distribution. J. Geogr. 2015, 124, 575–586. (In Janpanese) [Google Scholar] [CrossRef]
- Yoshida, H. Decrease of size of hummocks with downstream distance in the rockslide-debris avalanche deposit at Iriga volcano, Philippines: similarities with Japanese avalanches. Landslides 2013, 10, 665–672. [Google Scholar] [CrossRef]
- Hsü, K.J. Catastrophic debris streams (Sturzstroms) generated by rockfalls. Geol. Soc. Am. Bull. 1975, 86, 129–140. [Google Scholar] [CrossRef]
- Siebert, L.; Glicken, H.; Ui, T. Volcanic hazards from Bezymianny- and Bandai-type eruptions. Bull. Volcanol. 1987, 49, 435–459. [Google Scholar] [CrossRef]
- Hovius, N.; Stark, C.P.; Allen, P.A. Sediment flux from a mountain belt derived from landslide mapping. Geology 1997, 25, 231–234. [Google Scholar] [CrossRef]
- Malamud, B.D.; Turcotte, D.L.; Guzzetti, F.; Reichenbach, P. Landslide inventories and their statistical properties. Earth Surf. Process. Landf. 2004, 29, 687–711. [Google Scholar] [CrossRef]
- Korup, O. Landslides in the Earth system. In Landslides: Types, Mechanisms and Modeling; Clague, J.J., Stead, D., Roberts, N., Korup, O., Hovius, N., Meunier, P., Waythomas, C.F., Davies, T., McSaveney, M., Hermanns, R.L., et al., Eds.; Cambridge University Press: Cambridge, UK, 2015; pp. 10–23. [Google Scholar]
- Guthrie, R.H.; Deadman, P.J.; Cabrera, A.R.; Evans, S.G. Exploring the magnitude-frequency distribution: A cellular automata model for landslides. Landslides 2008, 5, 151–159. [Google Scholar] [CrossRef]
- Dufresne, A.; Davies, T.R. Longitudinal ridges in mass movement deposits. Geomorphology 2009, 105, 171–181. [Google Scholar] [CrossRef]
© 2016 by the author; licensee MDPI, Basel, Switzerland. This article is an open access article distributed under the terms and conditions of the Creative Commons by Attribution (CC-BY) license (http://creativecommons.org/licenses/by/4.0/).
Share and Cite
Yoshida, H. Magnitude-Frequency Distribution of Hummocks on Rockslide-Debris Avalanche Deposits and Its Geomorphological Significance. Geosciences 2016, 6, 5. https://doi.org/10.3390/geosciences6010005
Yoshida H. Magnitude-Frequency Distribution of Hummocks on Rockslide-Debris Avalanche Deposits and Its Geomorphological Significance. Geosciences. 2016; 6(1):5. https://doi.org/10.3390/geosciences6010005
Chicago/Turabian StyleYoshida, Hidetsugu. 2016. "Magnitude-Frequency Distribution of Hummocks on Rockslide-Debris Avalanche Deposits and Its Geomorphological Significance" Geosciences 6, no. 1: 5. https://doi.org/10.3390/geosciences6010005