Article

Influence of Groundwater on the Very Shallow Geothermal Potential (vSGP) in the Area of a Large-Scale Geothermal Collector System (LSC)

1
GeoZentrum Nordbayern, Department Geographie und Geowissenschaften, Friedrich-Alexander-Universität Erlangen-Nürnberg, Schlossgarten 5, 91054 Erlangen, Germany
2
Department of Energy and Building, Technische Hochschule Nürnberg Georg Simon Ohm, 90489 Nürnberg, Germany
*
Author to whom correspondence should be addressed.
Geosciences 2023, 13(8), 251; https://doi.org/10.3390/geosciences13080251
Submission received: 10 July 2023 / Revised: 15 August 2023 / Accepted: 16 August 2023 / Published: 19 August 2023

Abstract

:
The water balance in the very shallow subsurface can be influenced by capillary rise due to a high groundwater table. Since moisture content is an important factor for the thermal conductivity of soils, this can also have an influence on the very shallow geothermal potential (vSGP). For this reason, the effect of spatial and seasonal variations in groundwater tables on moisture content in essential depth layers was investigated at a large-scale geothermal collector system (LSC) in Bad Nauheim, Germany. Quasi-one-dimensional simulations using the FEFLOW® finite-element simulation system were employed to determine site-dependent and seasonally varying moisture contents, from which thermal conductivities were derived. The model setup was previously validated based on recorded moisture contents. The simulations resulted in groundwater-related maximum seasonal and spatial differences in thermal conductivity of 0.14 W/(m∙K) in the LSC area. Larger differences of up to 0.21 W/(m∙K) resulted for different soil textures at the same depth due to different thermal properties. The results indicate that an efficient design of LSCs requires a sufficiently detailed subsurface exploration to account for small-scale variations in grain size distribution and groundwater level.

1. Introduction

1.1. The Significance of the Very Shallow Geothermal Potential (vSGP) in the Context of the Large-Scale Geothermal Collector System (LSC) in Bad Nauheim

A large-scale geothermal collector system (LSC) was installed in two layers (1.5 m and 2.9 m below ground level (m b.g.l.)) in Bad Nauheim, Hesse, in central Germany [1,2]. The approximately 11,000 m2 area is used for agriculture or as a horse paddock. The LSC, in combination with a low-temperature district heating and cooling network (5GDHC), supplies a new residential area with cooling and heating energy. Approximately 2.3 GWh/a of source heat is required to heat 400 residential units: 50% of this energy is extracted from the subsurface by the LSC, and 50% is obtained by the 5GDHC system due to low temperature levels and uninsulated piping [1]. The very shallow geothermal potential (vSGP) in the form of thermal conductivity is therefore crucial for the heat extraction of the overall system. The project is scientifically accompanied by the research project “KNW-Opt” (Grant No. 03EN3020).
The potential of very shallow geothermal applications can be described by the system-specific heat extraction [3] or by the thermal conductivity of soils (λ) [4]. The parameter λ is determined by soil physical parameters such as moisture content (θ), bulk density and grain size distribution [4,5,6,7]. Therefore, the thermal conductivity is independent of the geothermal system used and dependent on the available subsurface. The individual components of soils, such as soil grains, water and air, have different thermal properties. The contribution of each component to the total thermal conductivity of soils is shown by the sequence described by Yun and Santamarina [8]:
λair < λdry-soil < λwater < λsaturated-soil < λmineral

1.2. High Groundwater Level as an Influencing Factor on Moisture Content

Moisture content in particular is subject to temporal and spatial variations. Basically, the water balance in the very shallow subsurface depends on the hydraulic properties of the soil and is affected by surface influences, such as precipitation, evaporation and transpiration [9,10,11].
In addition, moisture can ascend from high groundwater tables into the very shallow subsurface through capillary rise [9,12,13]. The potential for capillary rise depends on the soil texture class and the associated pore size distribution, as well as the moisture content and soil moisture tension (pF value) [14]. Capillary rise and its effects can be simulated with appropriate modeling software for different applications [15,16].
At very high groundwater levels, soil moisture can also be significantly affected up to the surface, as Smit et al. [17] showed by comparing groundwater levels and surface moisture contents on a beach. Accordingly, groundwater distance is also an important factor for vegetation coverage, especially in arid areas [18]. The higher moisture contents caused by shallow groundwater tables can also lead to higher hydraulic conductivities of soils and thus result in higher infiltration and groundwater recharge rates [19].
Therefore, due to the low installation depth of very shallow geothermal systems, the influence of groundwater on the water balance, especially on the soil moisture content, and thus on the geothermal potential can be particularly evident at high groundwater levels. Due to the existing slope of the terrain, there are spatially distinct groundwater depths in the area of the LSC in Bad Nauheim that are also subject to seasonal fluctuations. For this reason, this test site is suitable for investigating the potential influence of the groundwater table on the moisture content and, further, on the very shallow geothermal potential.

1.3. Aim of This Study

The aim of this study is to examine the influences of spatially and seasonally varying groundwater conditions at the LSC in Bad Nauheim on moisture content and thus to determine the influence on the very shallow geothermal potential in the form of thermal conductivity. The investigations are intended to demonstrate the importance of sufficiently detailed subsurface explorations, including hydrogeological conditions, for the design of LSCs.
Quasi-one-dimensional simulations were used to determine moisture contents at various locations around the collector system, considering surface influences and the temporal and local variations in the groundwater level. Prior to this, the model structure was validated using moisture contents measured continuously with sensors. Based on the simulated moisture contents, the geothermal potentials were derived using thermal conductivities measured in the laboratory. Exemplary simulations of heat extraction were used to illustrate the resulting seasonal and site-dependent differences in thermal conductivity.

2. Materials and Methods

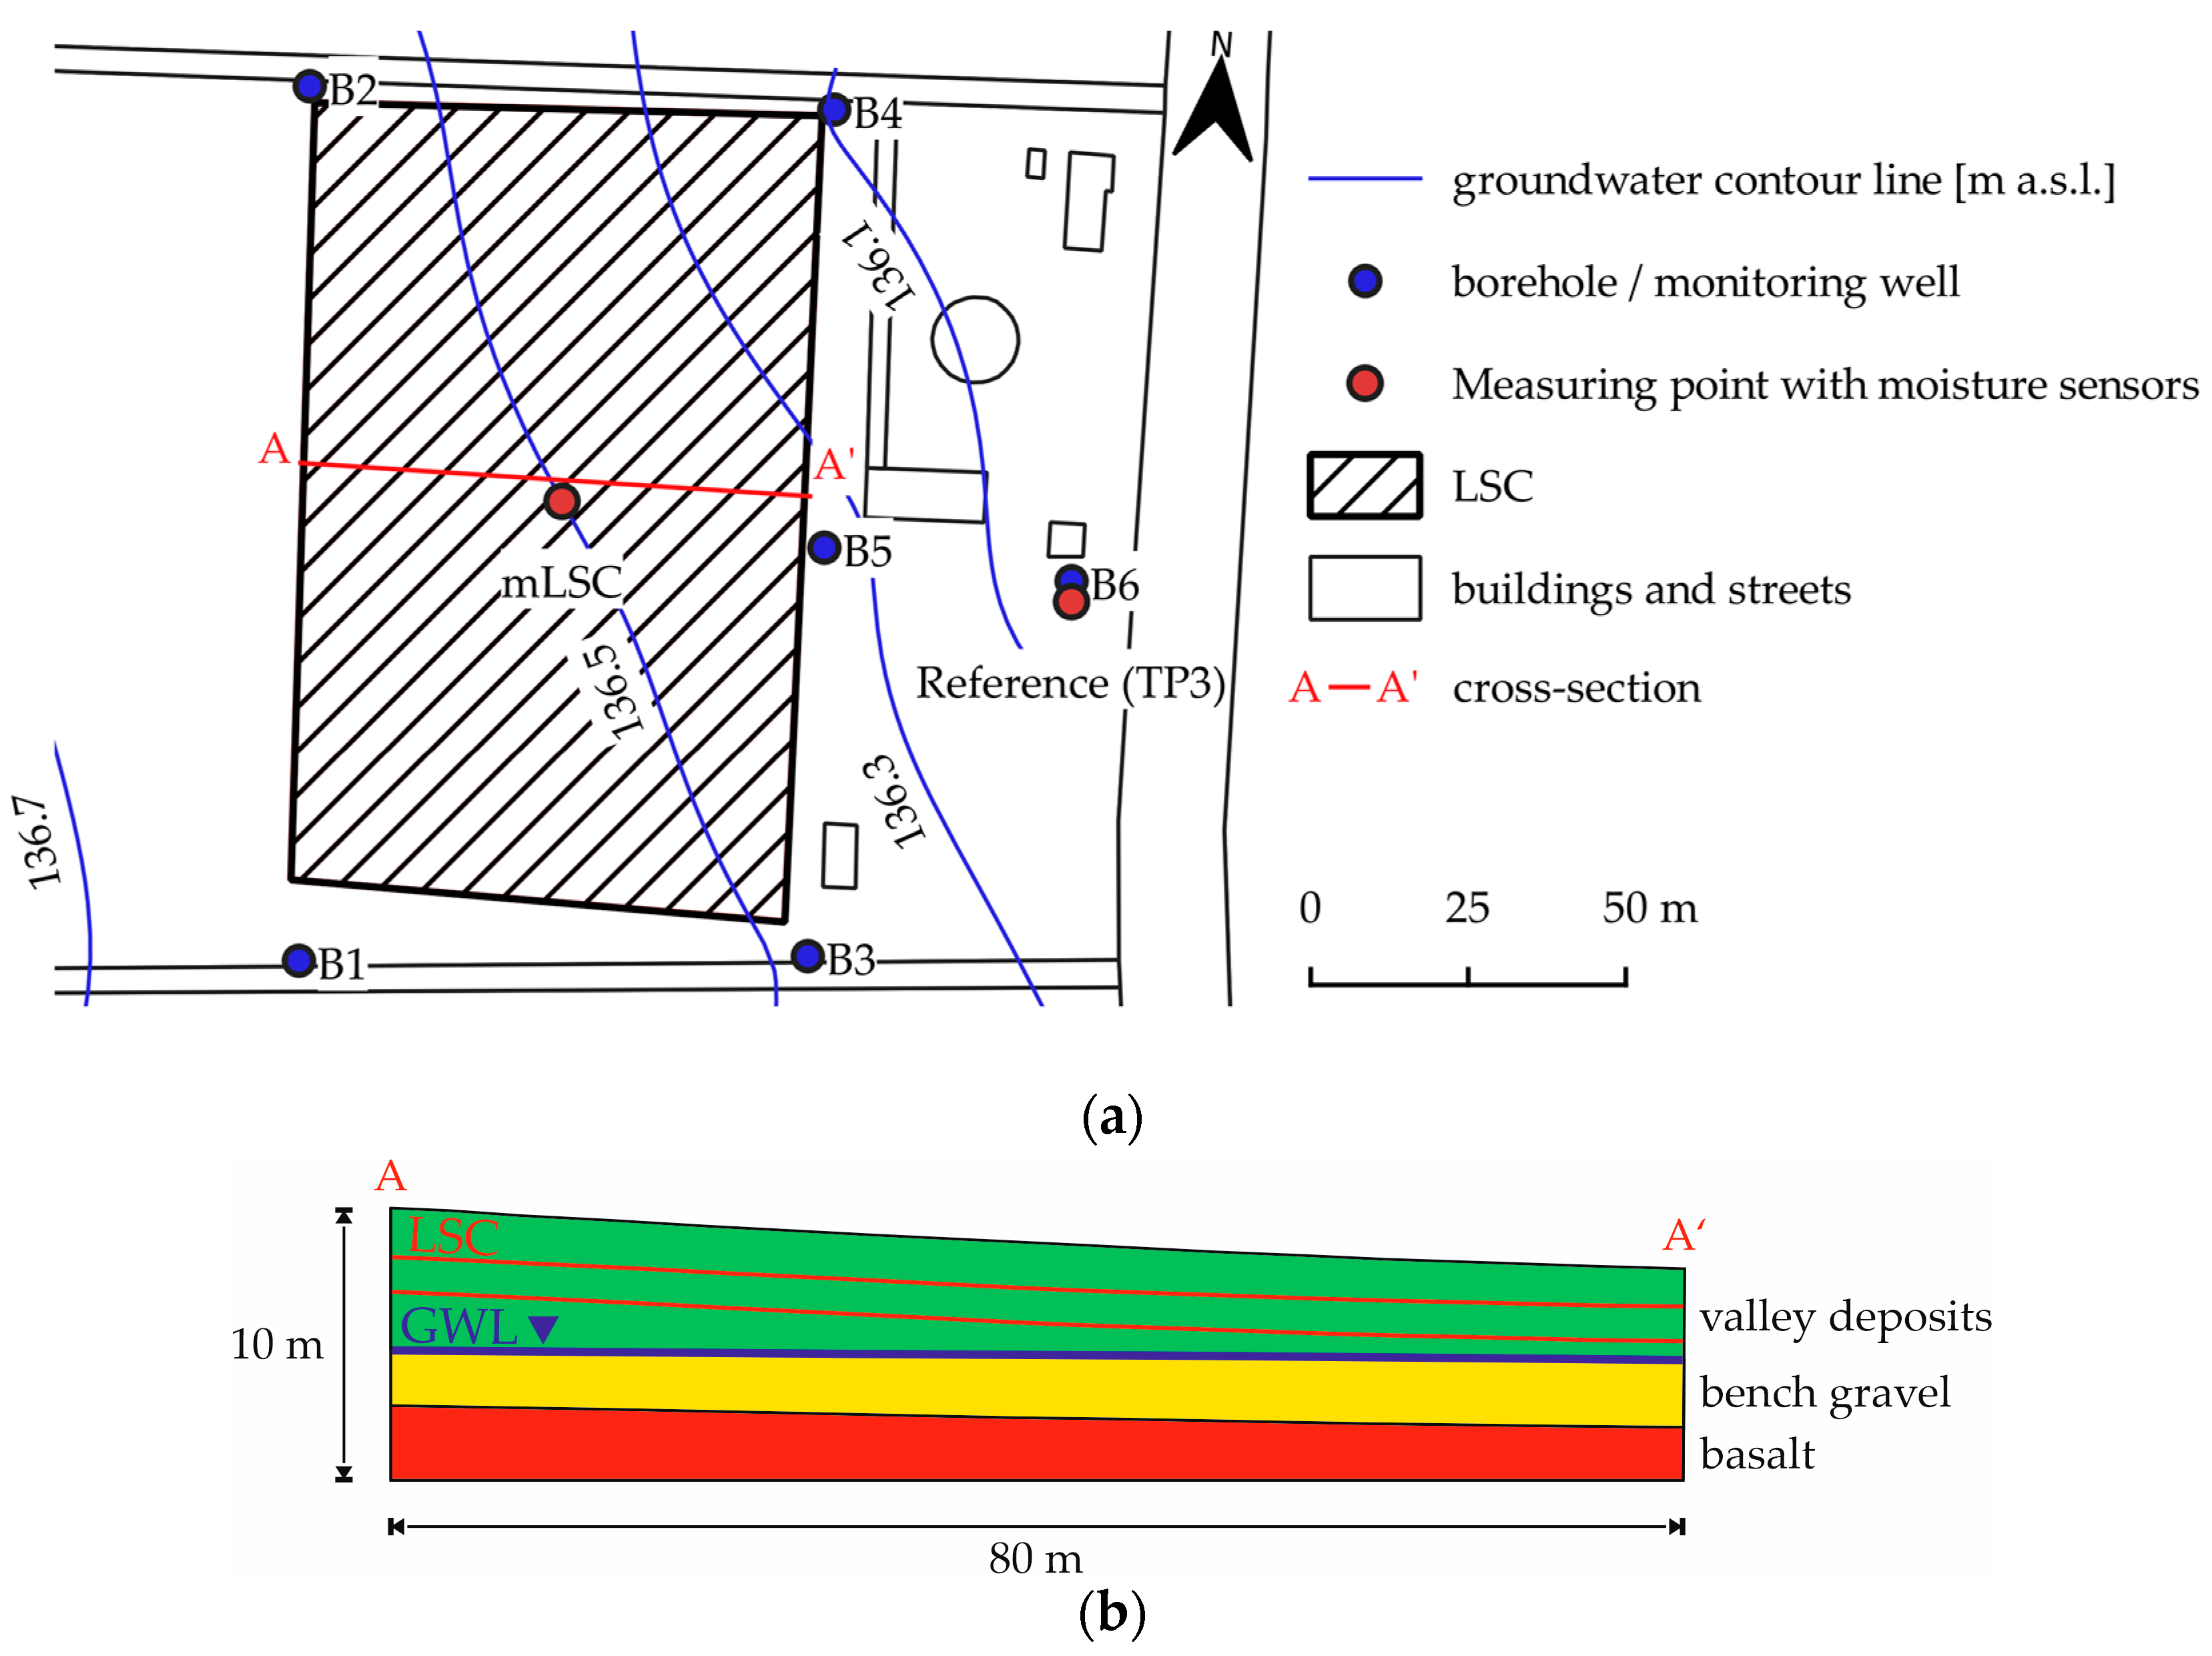
2.1. Hydrogeological Conditions at the LSC in Bad Nauheim

The LSC in Bad Nauheim was installed in Quaternary valley deposits [20,21], which consist mainly of silty clay loam and silt loam layers according to the USDA (U.S. Department of Agriculture) soil classification [22]. These layers are largely overlain by agriculturally influenced silt loam. Three open-end tests [23] in the silty clay loam layer at 1.5 m b.g.l. yielded hydraulic conductivities between 2.0∙10−3 and 2.2∙10−4 m/d. Several infiltration tests with double rings [24] yielded higher values, but these are considered less reliable.
The valley deposits overlay the 2.1 to 4.3 m thick bench gravel aquifer [25]. Due to the varying ground elevations, the distance between the groundwater and surface on site can range from 2.0 to 7.0 m. Since October 2020, groundwater levels have been measured with fluctuations of up to 1.9 m at six monitoring wells around the LSC (Figure 1a). Figure 1b shows the different groundwater depths due to the existing slope, despite the low hydraulic gradient seen in Figure 1a.
Sieve analyses based on DIN EN ISO 17892-4 [26] showed contents of gravel or coarser components of between 20% and 80% for the bench gravel layer. The grain size distributions are too non-uniform to derive hydraulic conductivity [27,28,29,30]. Evaluations of the recovery phase of two short pumping tests gave hydraulic conductivity values of 32 and 58 m/d for the bench gravel.
The boundary with the valley deposits is characterized by a gravelly loam or loamy gravel layer, which is stratigraphically largely assigned to the bench gravel. Below the aquifer, decomposed and locally water-conducting basalt is present [25].

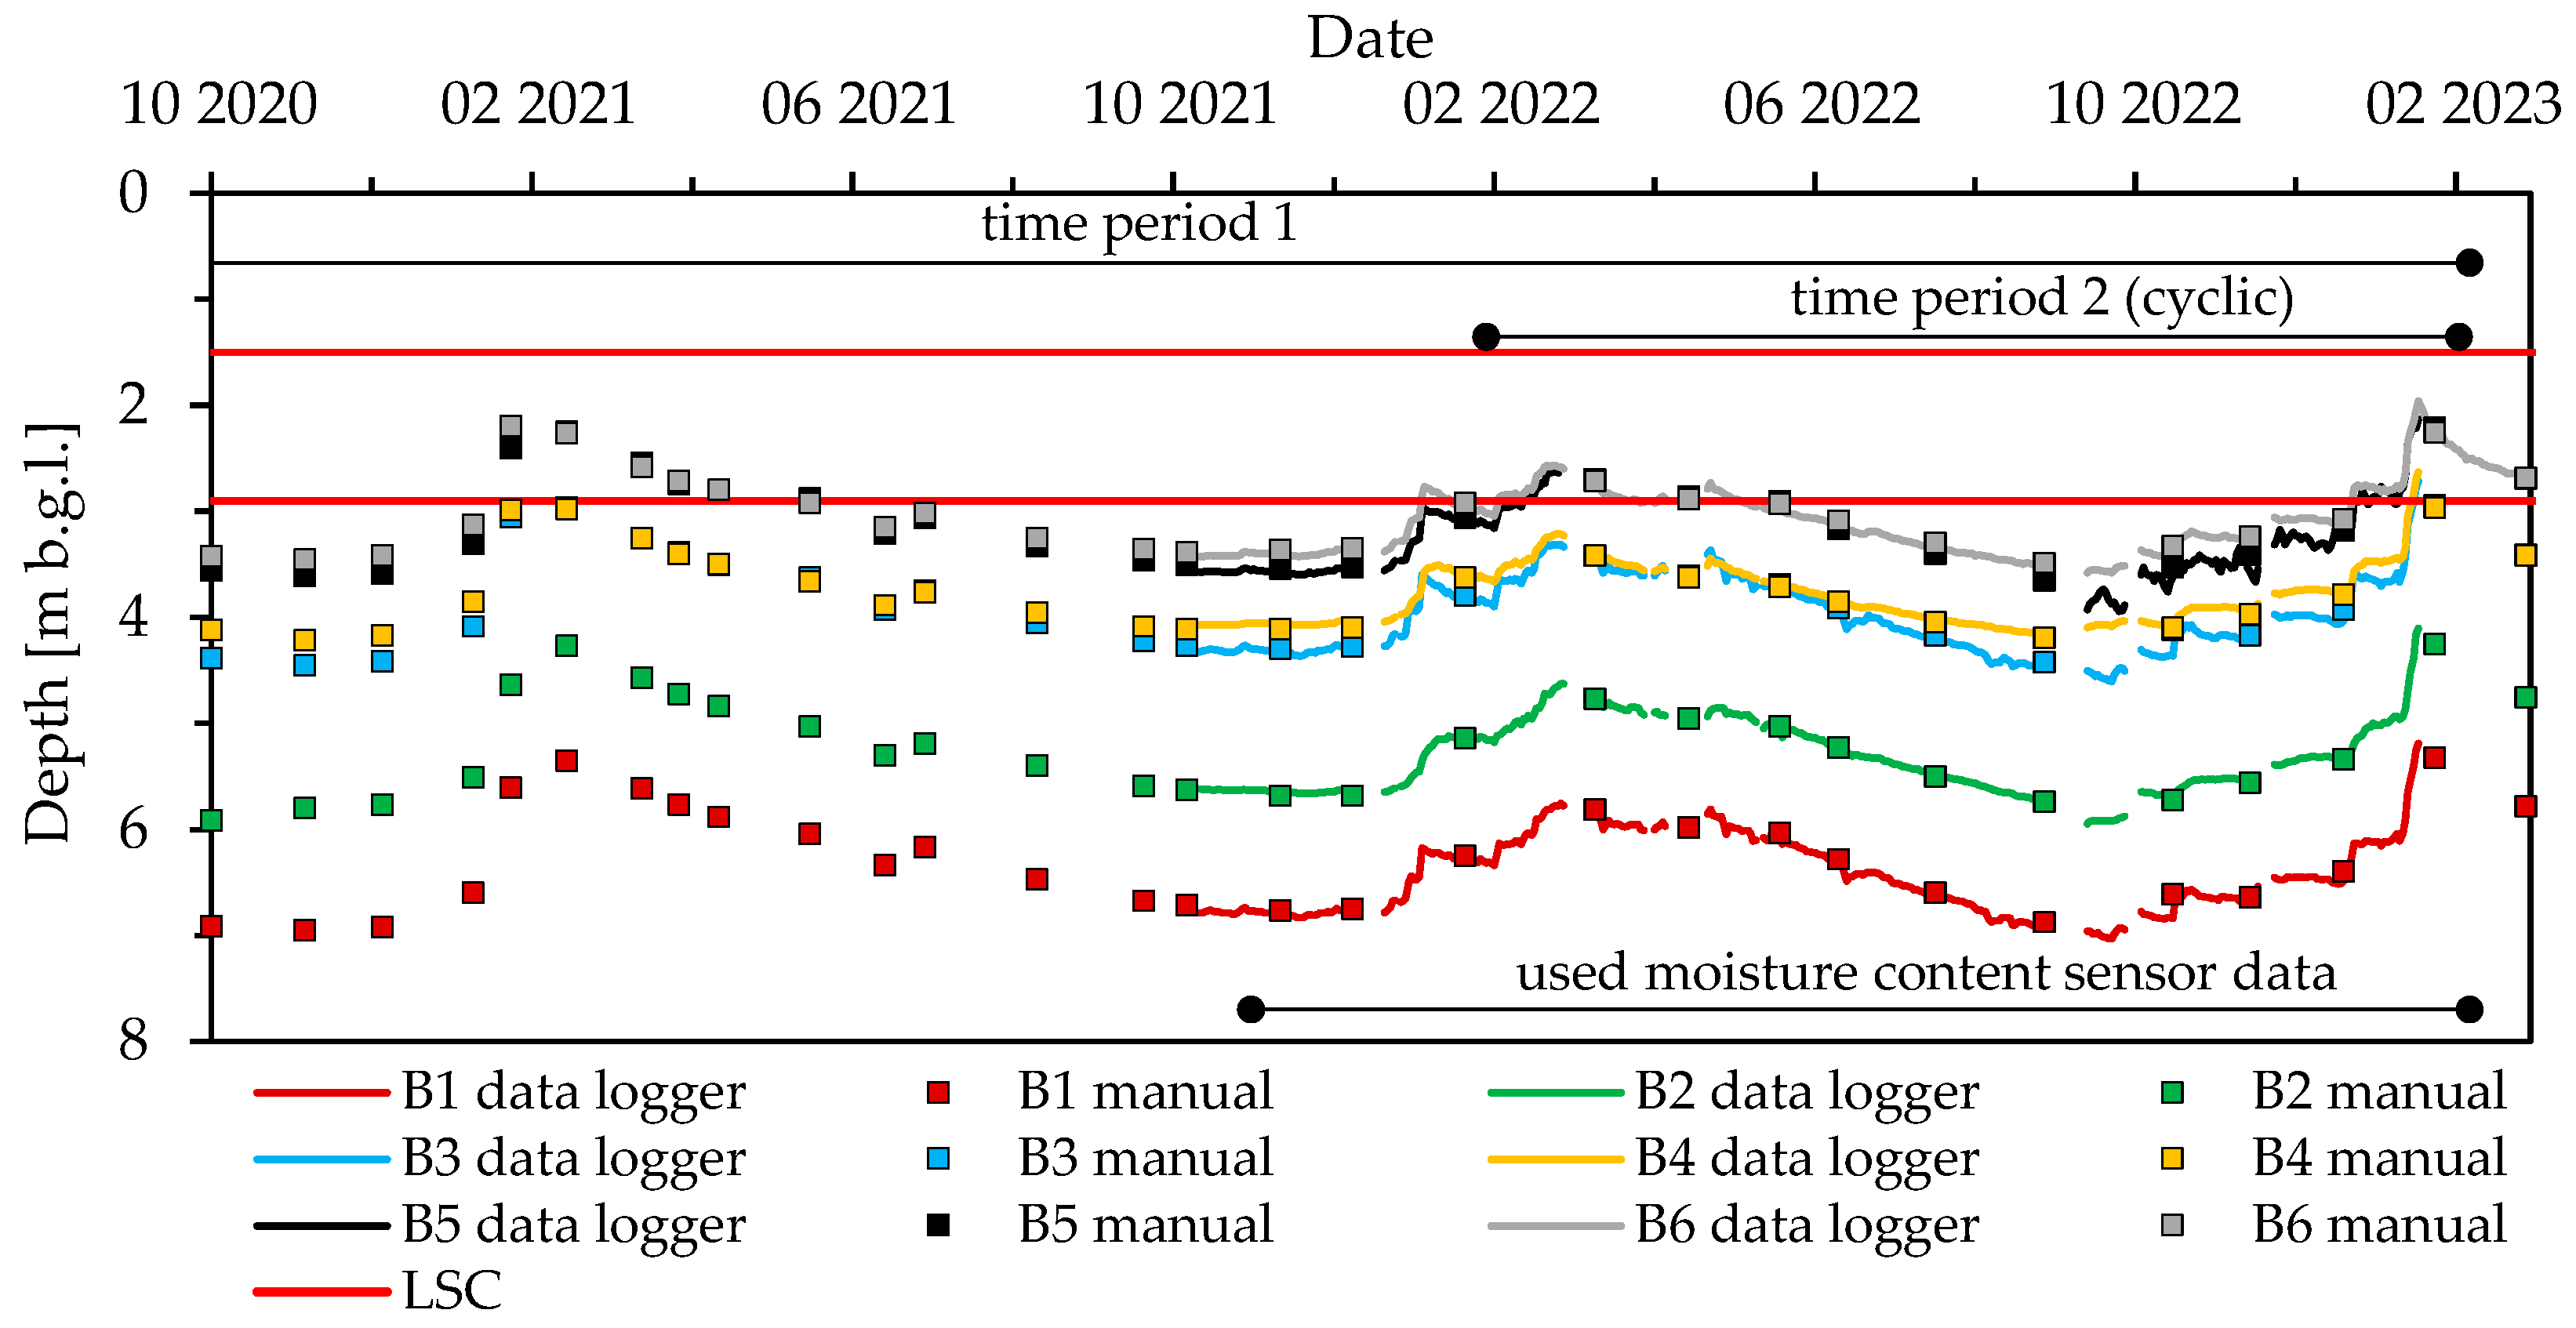
2.2. Monitoring of Moisture Content, Groundwater Table and Weather Data

The KNW-Opt research project involves intensive monitoring of the LSC [2]. Monitoring data on soil, groundwater and weather conditions were used for this study.
Moisture and temperature sensors were installed in the middle of the LSC at 1.5 m, 2.2 m and 2.9 m b.g.l. (measuring point “mLSC”) and at the “Reference” measuring point at 0.1 m, 0.25 m, 0.75 m, 1.5 m, 2.2 m and 2.9 m b.g.l. (Figure 1a). For the installation of the moisture sensors, it was necessary to ensure that the sensors were surrounded by fine-grained material. Therefore, to avoid damage, they were embedded in sand.
The area around “Reference” is covered with conifers, resulting in significantly increased water discharge in the shallow subsurface.
Furthermore, pressure and temperature sensors were installed in six groundwater-monitoring wells in the vicinity of the LSC (Figure 1a) with different groundwater distances due to the existing slope of the terrain (Figure 1b). These monitoring wells are described in detail in Bertermann and Rammler [25]. Recorded data are sent from an EASYBus data logger to a central server at 5-min intervals. All measurement components were calibrated by the manufacturer and adjusted to the different cable lengths. The measurement configurations of the used sensors are shown in Table 1.
Additionally, groundwater tables were manually recorded almost monthly starting in October 2020 (Figure 2).
To monitor weather conditions, a weather station was installed on the roof of the energy center at a height of about 3 m directly east of the LSC. Here, long-wave sky irradiation, short-wave radiation (global radiation), wind direction and speed, ambient temperature, precipitation and relative humidity were recorded at 1-min intervals starting in January 2021. Data gaps and time periods before January 2021 were filled with data from two other climate measurement systems of the German weather service (DWD) delivering open-source data within a range of 15 km from Bad Nauheim (https://opendata.dwd.de/, accessed 27 January 2023).

2.3. Quasi-One-Dimensional Simulations with FEFLOW®

The simulations to investigate the influence of different groundwater levels on moisture content were performed using the FEFLOW® (v8.0) finite-element simulation system from DHI Wasy GmbH [31]. A quasi-one-dimensional approach was adopted for a detailed investigation at a specific site focusing on vertical water movement. For this purpose, the models were created as one-meter-wide, two-dimensional vertical planar projections with a quadrangle element width of 1 m and height of 0.01 m. Water flow into or out of the model is only possible through the surface or through the gravel aquifer. The schematic model setup is shown in detail in Figure 3.
First, the model setup was validated by comparing the simulated moisture contents with recorded values at the “Reference” and “mLSC” measuring points at 1.5 m, 2.2 m and 2.9 m b.g.l. in time period 1 (b). Due to the expected significantly increased water extraction by the conifers at ”Reference”, the moisture sensors between 0.1 m and 0.75 m b.g.l. were not considered. The value of the hydraulic head of the first time step was set as initial condition for all nodes.
At monitoring wells B1 to B5, the seasonal, spatial, and depth-dependent moisture content differences over the course of different groundwater levels and surface influences were then determined by cyclic simulations in time period 2. For this purpose, the moisture contents of one simulated year at 1.5 m, 2.2 m, 2.9 m and 3.4 m b.g.l. after reaching an annual equilibrium were considered. B1 to B5 are located outside the LSC but are simply assumed to be the outer boundary of the LSC.

2.3.1. Material Properties and Model Layer Structure

The variably saturated states of the soils were simulated in FEFLOW® using Richards’ equation (mixed head–saturation) with the parametric van Genuchten–Mualem model [32,33,34]:
S e = θ θ r θ s θ r = S S r S s S r = 1 [ 1 + α ψ n ] m
k   S e = k 0 · S e L 1 1 S e 1 m m 2
m = 1 1 n
L = 0.5
with : S e :   r e l a t i v e   o r   e f f e c t i v e   s a t u r a t i o n ; S :   s a t u r a t i o n ; S s :   m a x i m u m   s a t u r a t i o n ; S r :   r e s i d u a l   s a t u r a t i o n ; θ :   v o l u m e t r i c   w a t e r   c o n t e n t   / m o i s t u r e   c o n t e n t   [ c m 3 / c m 3 ] ; θ r : r e s i d u a l   v o l u m e t r i c   w a t e r   c o n t e n t / m o i s t u r e   c o n t e n t   [ c m 3 / c m 3 ] θ s :   s a t u r a t e d   v o l u m e t r i c   w a t e r   c o n t e n t / m o i s t u r e   c o n t e n t   [ c m 3 / c m 3 ] ; α :   f i t t i n g   c o e f f i c i e n t   [ 1 / m ] ; ψ :   p r e s s u r e   h e a d   [ m ] ; n :   f i t t i n g   p a r a m e t e r ; m :   d e s c r i b e d   i n   E q u a t i o n   ( 3 ) ; k :   h y d r a u l i c   c o n d u c t i v i t y   [ m / d ] ; k 0 :   m a x i m u m   h y d r a u l i c   c o n d u c t i v i t y   [ m / d ] ; L :   p a r a m e t e r   f o r   p o r e   t o r t u o s i t y   a n d   p o r e   c o n n e c t i v i t y .
The hydraulic material properties of the fine-grained layers were determined in advance using the HYPROP® 2 measuring device from Meter Group, Inc. The measurement and evaluation are based on the simplified evaporation method [35,36,37]. Water retention and hydraulic conductivity curves, also based on the van Genuchten–Mualem model, were fitted by the automated adjustment of crucial parameters using the LABROS SoilView-Analysis software (v5.1.0.0), considering Equations (3) and (4). The van Genuchten–Mualem model was used to allow the direct transfer of the HYPROP® results to FEFLOW®.
A list of the soil samples used for the HYPROP® tests and a graphical representation of the results are shown in Table A1 and Figure A1.
Basically, an alternation of silt loam and silty clay loam was assumed for simplification for the shallow fine-grained area based on soil profiles and grain size analyses from Rammler et al. [22].
The layered structure of the model for the “Reference” measuring point was determined using trial pit TP3. The corresponding borehole profiles were used for the models at monitoring wells B1 to B5. The soil composition of the measuring point “mLSC” is unknown and was derived from average values. Local variations, as well as the possible mixing of stratification due to excavation and backfilling in the LSC area, were neglected to ensure the comparability of the models. Furthermore, the layer boundaries might be less visible or disturbed in the drilled soil material. Bench gravel was divided into the less gravelly transition zone (“loam/gravel”) and the pure gravel layer. Silty intermediate layers were neglected.
The layering for each model is summarized in Table 2.
The material properties assigned to the layers based on the HYPROP® results and literature data are listed in Table 3.
The k0 values determined with the Hyprop® tests may differ from the actual saturated hydraulic conductivities [41,42,43]. In addition, the focus of the fitting process using LABROS SoilView-Analysis software was on the water retention curves. The porosities are based on the bulk densities of the soil samples, so deviations are possible here as well.
In the first step, the parameters k0, α and n of the loam/gravel layer were estimated with the FePEST (v8.0.2.3519) software by DHI Wasy GmbH using singular value decomposition based on the observed moisture contents at the “Reference” measuring point. The fitted material properties of this layer were then applied to the other models.

2.3.2. Aquifer and Surface Boundary Conditions

The recorded and manually measured groundwater levels at the respective monitoring wells were used as boundary conditions for the hydraulic head in the gravel aquifer. For the “Reference” measuring point, the data of monitoring well B6 were used, as it is located directly next to it. At the “mLSC” site, the exact groundwater level is not known, so average values were calculated from the data from B1 to B4. Due to the significantly different groundwater levels in the individual monitoring wells, their influence on the moisture content can be worked out by simulations. For the period from January to October 2020, the corresponding groundwater levels of 2021 were assumed.
On the surface of the models, the climatic influences were implemented as fluid flux boundary conditions (Figure 3). These boundary conditions were derived from the basic water balance equation [39]:
D = P E R
with : D :   s u b s u r f a c e   d i s c h a r g e   r a t e   [ m 3 / d ] ; P :   p r e c i p i t a t i o n   r a t e   [ m 3 / d ] ; E :   e v a p o r a t i o n   r a t e   ( h e r e :   e v a p o t r a n s p i r a t i o n   r a t e   ) [ m 3 / d ] ; R :   s u r f a c e   r u n o f f   r a t e   [ m 3 / d ] .
Due to the low slope, it was assumed that the subsurface discharge rate D is equal to groundwater recharge. For simplification, the potential evapotranspiration calculated with the FAO grass reference evapotranspiration model [44,45] based on the Penman–Monteith model [46] was assumed as the actual evapotranspiration.
The groundwater recharge rate at the test site is between 26 and 100 mm/a according to a rough graphical evaluation of groundwater recharge maps [47,48], with between 65% and 70% of precipitation evaporating in Hesse [49]. To obtain the corresponding values and variance of surface influences, two scenarios were considered, each assuming a certain percentage of precipitation as surface runoff, including additional evaporation of accumulated rainwater and plant interception (Table 4).
By comparing the two scenarios, not only the influence of groundwater but also the surface influence on moisture content can be determined, and future developments due to climate change can be estimated.
No scenario distinction was made for the years 2020 and 2021, which were used in time period 1. For the dry year 2020, according to weather data, there was no groundwater recharge in the annual balance, and in the rainier and colder year 2021, after adjusting the surface runoff rate, there was an assumed groundwater recharge of 99 mm/a.

2.4. Derivation of Thermal Conductivities from Simulated Moisture Contents and Exemplary Simulations of Heat Extraction

In order to evaluate the influence of the different groundwater tables at the test site on the geothermal potential, thermal conductivities were derived from simulated moisture contents. For this purpose, two representative punctual thermal conductivity measurements from Rammler et al. [22] were used for the fine-grained soils for the investigated moisture ranges (θ > 0.15 cm3/cm3) (Table 5). Linear interpolation and extrapolation of the punctual measurements yielded the maximum possible and theoretical change in λ with changes in moisture content. However, the equations listed in Table 5 are not suitable for general thermal conductivity calculations, as they were only determined for a specific moisture content range.
The silty clay loam at the test site can have different thermal conductivities. For this study, a series of measurements with lower thermal conductivities were selected to obtain possible maximum differences from the silt loam layers.
For the loam/gravel layer, exemplary values from a master’s thesis, in which the thermal conductivities of the gravelly soils of Bad Nauheim were investigated [50], were used (Table 5 and Figure A2b).
The measurement series are shown graphically in Figure A2.
The potential impacts of the minimum and maximum groundwater-dependent or soil-texture-dependent thermal conductivities of the fine-grained soils calculated using the equations shown in Table 5 were illustrated by investigating the potential resulting heat extraction. Therefore, exemplary simulations were performed using the DELPHIN finite-volume simulation software (v6.1.5, https://www.bauklimatik-dresden.de/, accessed on 26 May 2023). With the DELPHIN software, the heat extraction of different geometric configurations of ground heat exchangers and LSCs can be examined in detail. Open-source climate data from the German weather service (https://opendata.dwd.de/, accessed on 27 January 2023) for moderate-climate regions in Germany were used for these simulations as boundary conditions. In addition, a homogeneous loamy subsurface with a constant thermal conductivity was assumed in each case. By adjusting the thermal conductivity of the soil according to the calculated minimum and maximum thermal conductivities, the resulting differences in heat extraction were determined.
The purpose of these simulations is to illustrate the noticeable variations in possible heat extraction associated with the variation in thermal conductivity. The results are therefore not presented as absolute values but as maximum percentage deviations in heat extraction that can be caused by different groundwater levels or the thermal properties of soils. The performed simulations do not correspond to an energy analysis of the specific LSC in Bad Nauheim.

3. Results

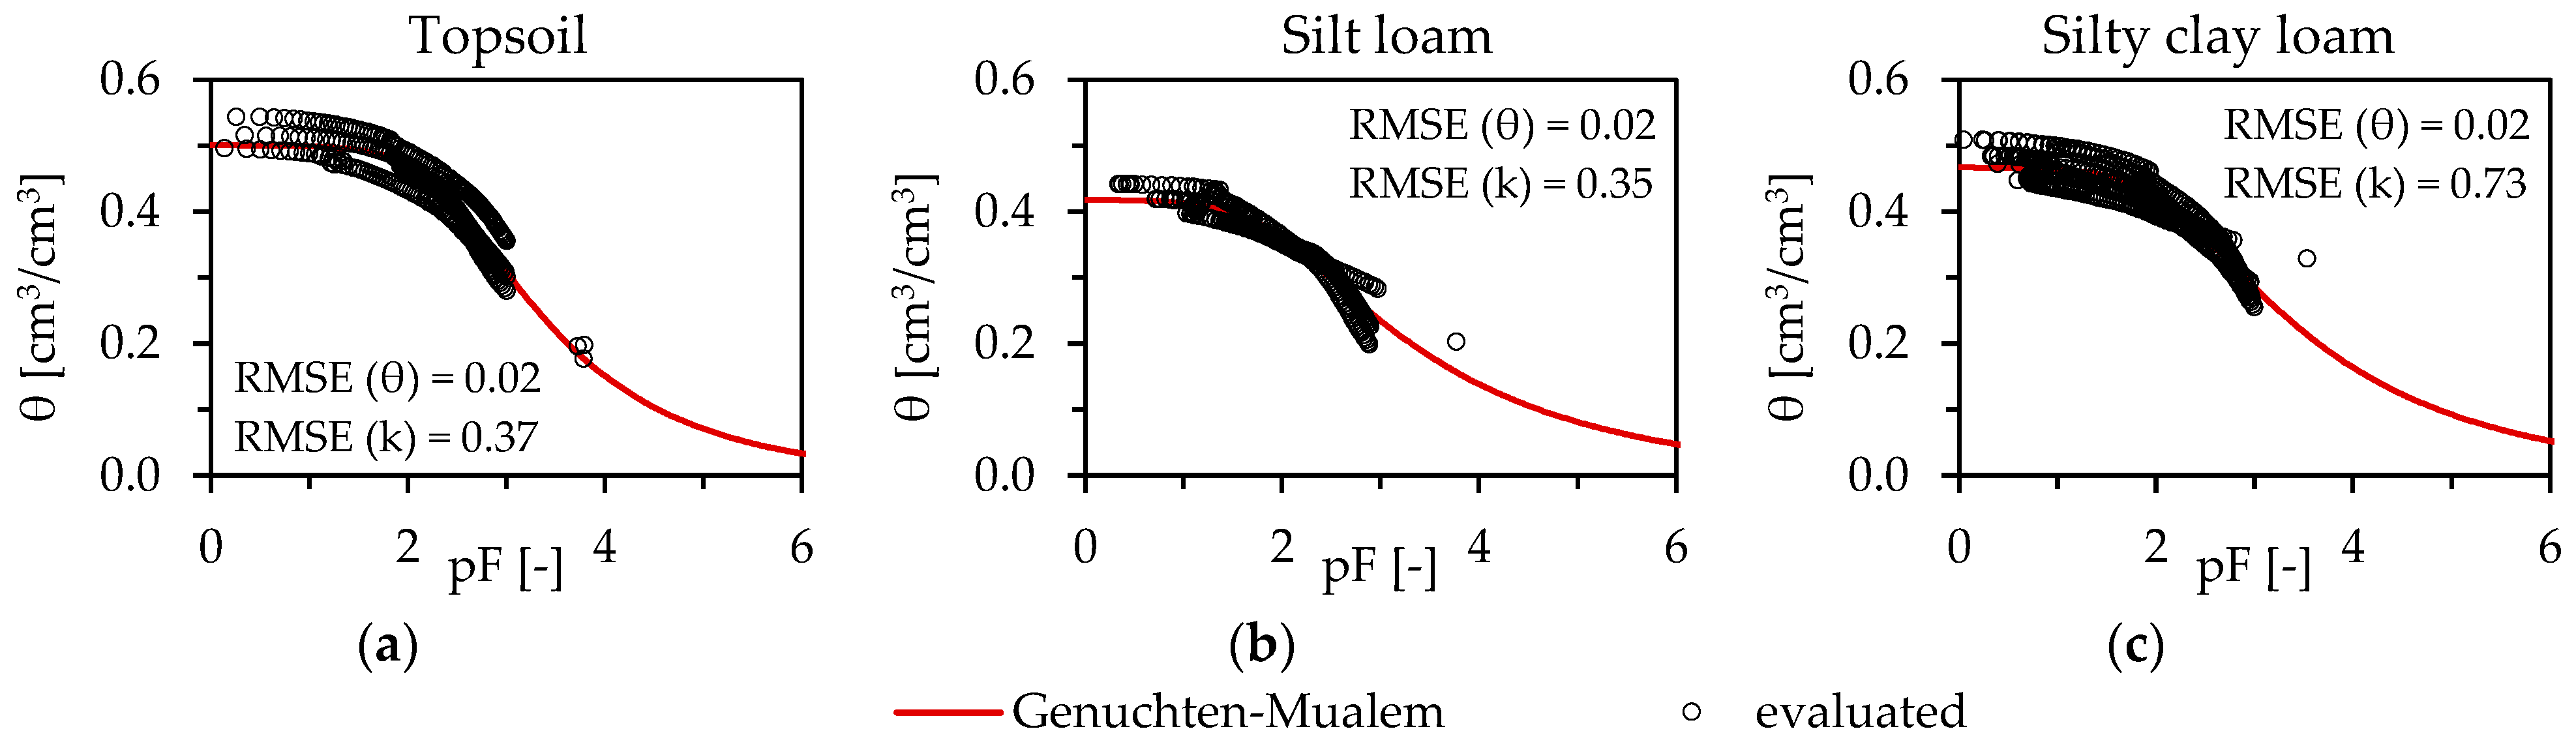
3.1. Parameter Estimation and Model Validation at “Reference” Measuring Point

In the considered period from 7 November 2021 to 6 February 2023, no data on observed moisture contents at “Reference” were available on nine days (2%). The groundwater level fluctuated between 2.0 m and 3.6 m b.g.l. during this period, with a median of 3.1 m b.g.l.
The results of the simulations and the comparison with the observed moisture contents are shown in Figure 4.
At 2.9 m b.g.l., the gravelly and loamy transition zone is present. Based on the material properties in Table 3, the simulation resulted in an RMSE value of 0.09 compared to the observed moisture contents (Figure 4c). By estimating the parameters k0, α and n with FePEST for this layer, the RMSE was significantly reduced to 0.01 due to a lower water retention capacity, regardless of the considered surface influences.
The adjusted material properties for the loam/gravel layer are shown in Table 6.
Parameter estimation had no significant effect on the simulated moisture content at 2.2 m b.g.l. (Figure 4b). Low RMSE values of 0.02 and 0.03 resulted, with the simulated moisture contents mostly slightly higher than observed values. Due to the sharp rise in groundwater at the end of the simulation period (b), the silt loam was temporarily fully saturated at this depth.
At 1.5 m b.g.l., the simulated moisture contents were significantly higher than the observed data, with RMSE values of 0.33 (Figure 4a). The median of the observed moisture contents was 0.07 cm3/cm3. The low values can be explained by the increased water extraction by the conifers in this area, which has an effect at least down to 1.5 m b.g.l. The resulting lower rate of groundwater recharge may also be the reason for the slightly higher simulated moisture contents at 2.2 m b.g.l. compared to observed values.
The low RMSE values of ≤0.03 at 2.2 m and 2.9 m b.g.l. in the range of measurement accuracy of the moisture sensors demonstrated the suitability of the quasi-one-dimensional model setup and the assigned material properties for the simulation of moisture contents, which, in this area, are mainly groundwater-influenced. Only minor or no differences were determined between scenarios A and B.

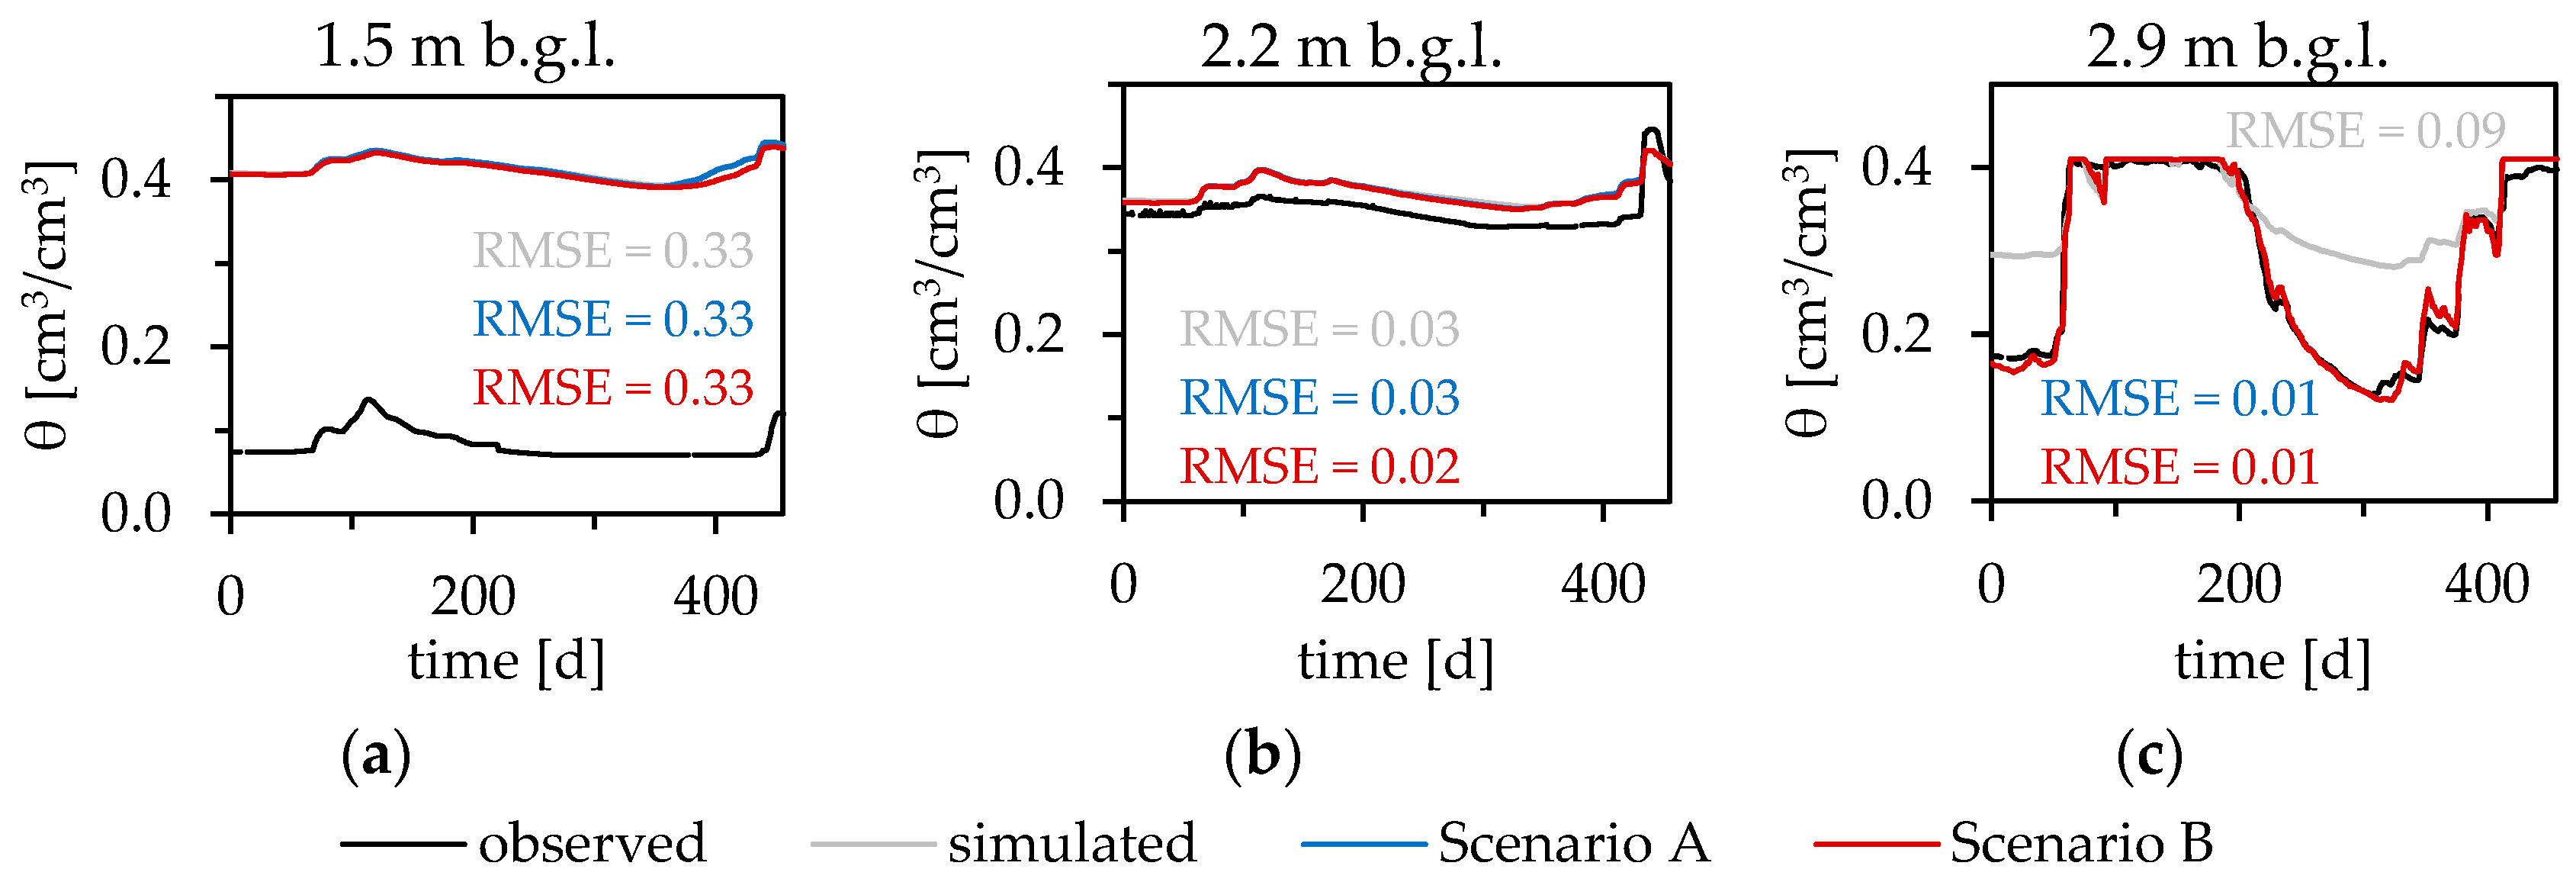
3.2. Model Validation at Measuring Point “mLSC”

In the considered period from November 07, 2021, to February 06, 2023, no data on observed moisture contents were available at “mLSC” on 18 days (4%). The assumed groundwater table fluctuated between 3.7 m and 5.4 m b.g.l. during this period, and the median was 4.9 m b.g.l.
The results of the simulations and the comparison with the observed moisture contents are shown in Figure 5.
Between January and May 2022, the recorded moisture contents showed a rapid and significant decrease and, toward the end of this period, a rapid and significant increase at each depth. During this period, the soil temperatures also reached minimum values as low as −0.4 °C. It is therefore assumed that the soil was temporarily and partially frozen due to heat extraction by the LSC. The course of the moisture contents thus did not correspond to the undisturbed and natural course. The time delays in freezing and thawing in the comparison of moisture contents and soil temperature can be explained by the required withdrawal and supply of icing enthalpy. Judging from temperature trends, the soil partially refroze immediately after the end of the simulation period. Since the thermal effects of the LSC and thus possible soil freezing were not considered in the simulations, these specific periods were not used for validation.
RMSE values ≤ 0.04 were reached at all depths considered, with no differences between scenarios A and B. At 1.5 m b.g.l., a significant and rapid increase in moisture content was initially recorded just before freezing (Figure 5a). This was probably due to a measurement error caused by a previously insufficient connection of the sensor to the surrounding soil. Considering only the period after thawing, there were even smaller deviations, with an RMSE = 0.01.
The largest deviations between simulated and observed moisture contents in the comparisons were observed at 2.9 m b.g.l. (Figure 5c), which is probably due to the unknown actual groundwater level. The significantly higher observed moisture content after thawing could be due to the appearance of cavities in the immediate vicinity of the sensor.
The low RMSE values ≤ 0.04, despite the groundwater levels being only assumed, were taken as evidence for the suitability of the quasi-one-dimensional model setup, including the assumed surface influences, and of the assigned material properties for the moisture content simulations.

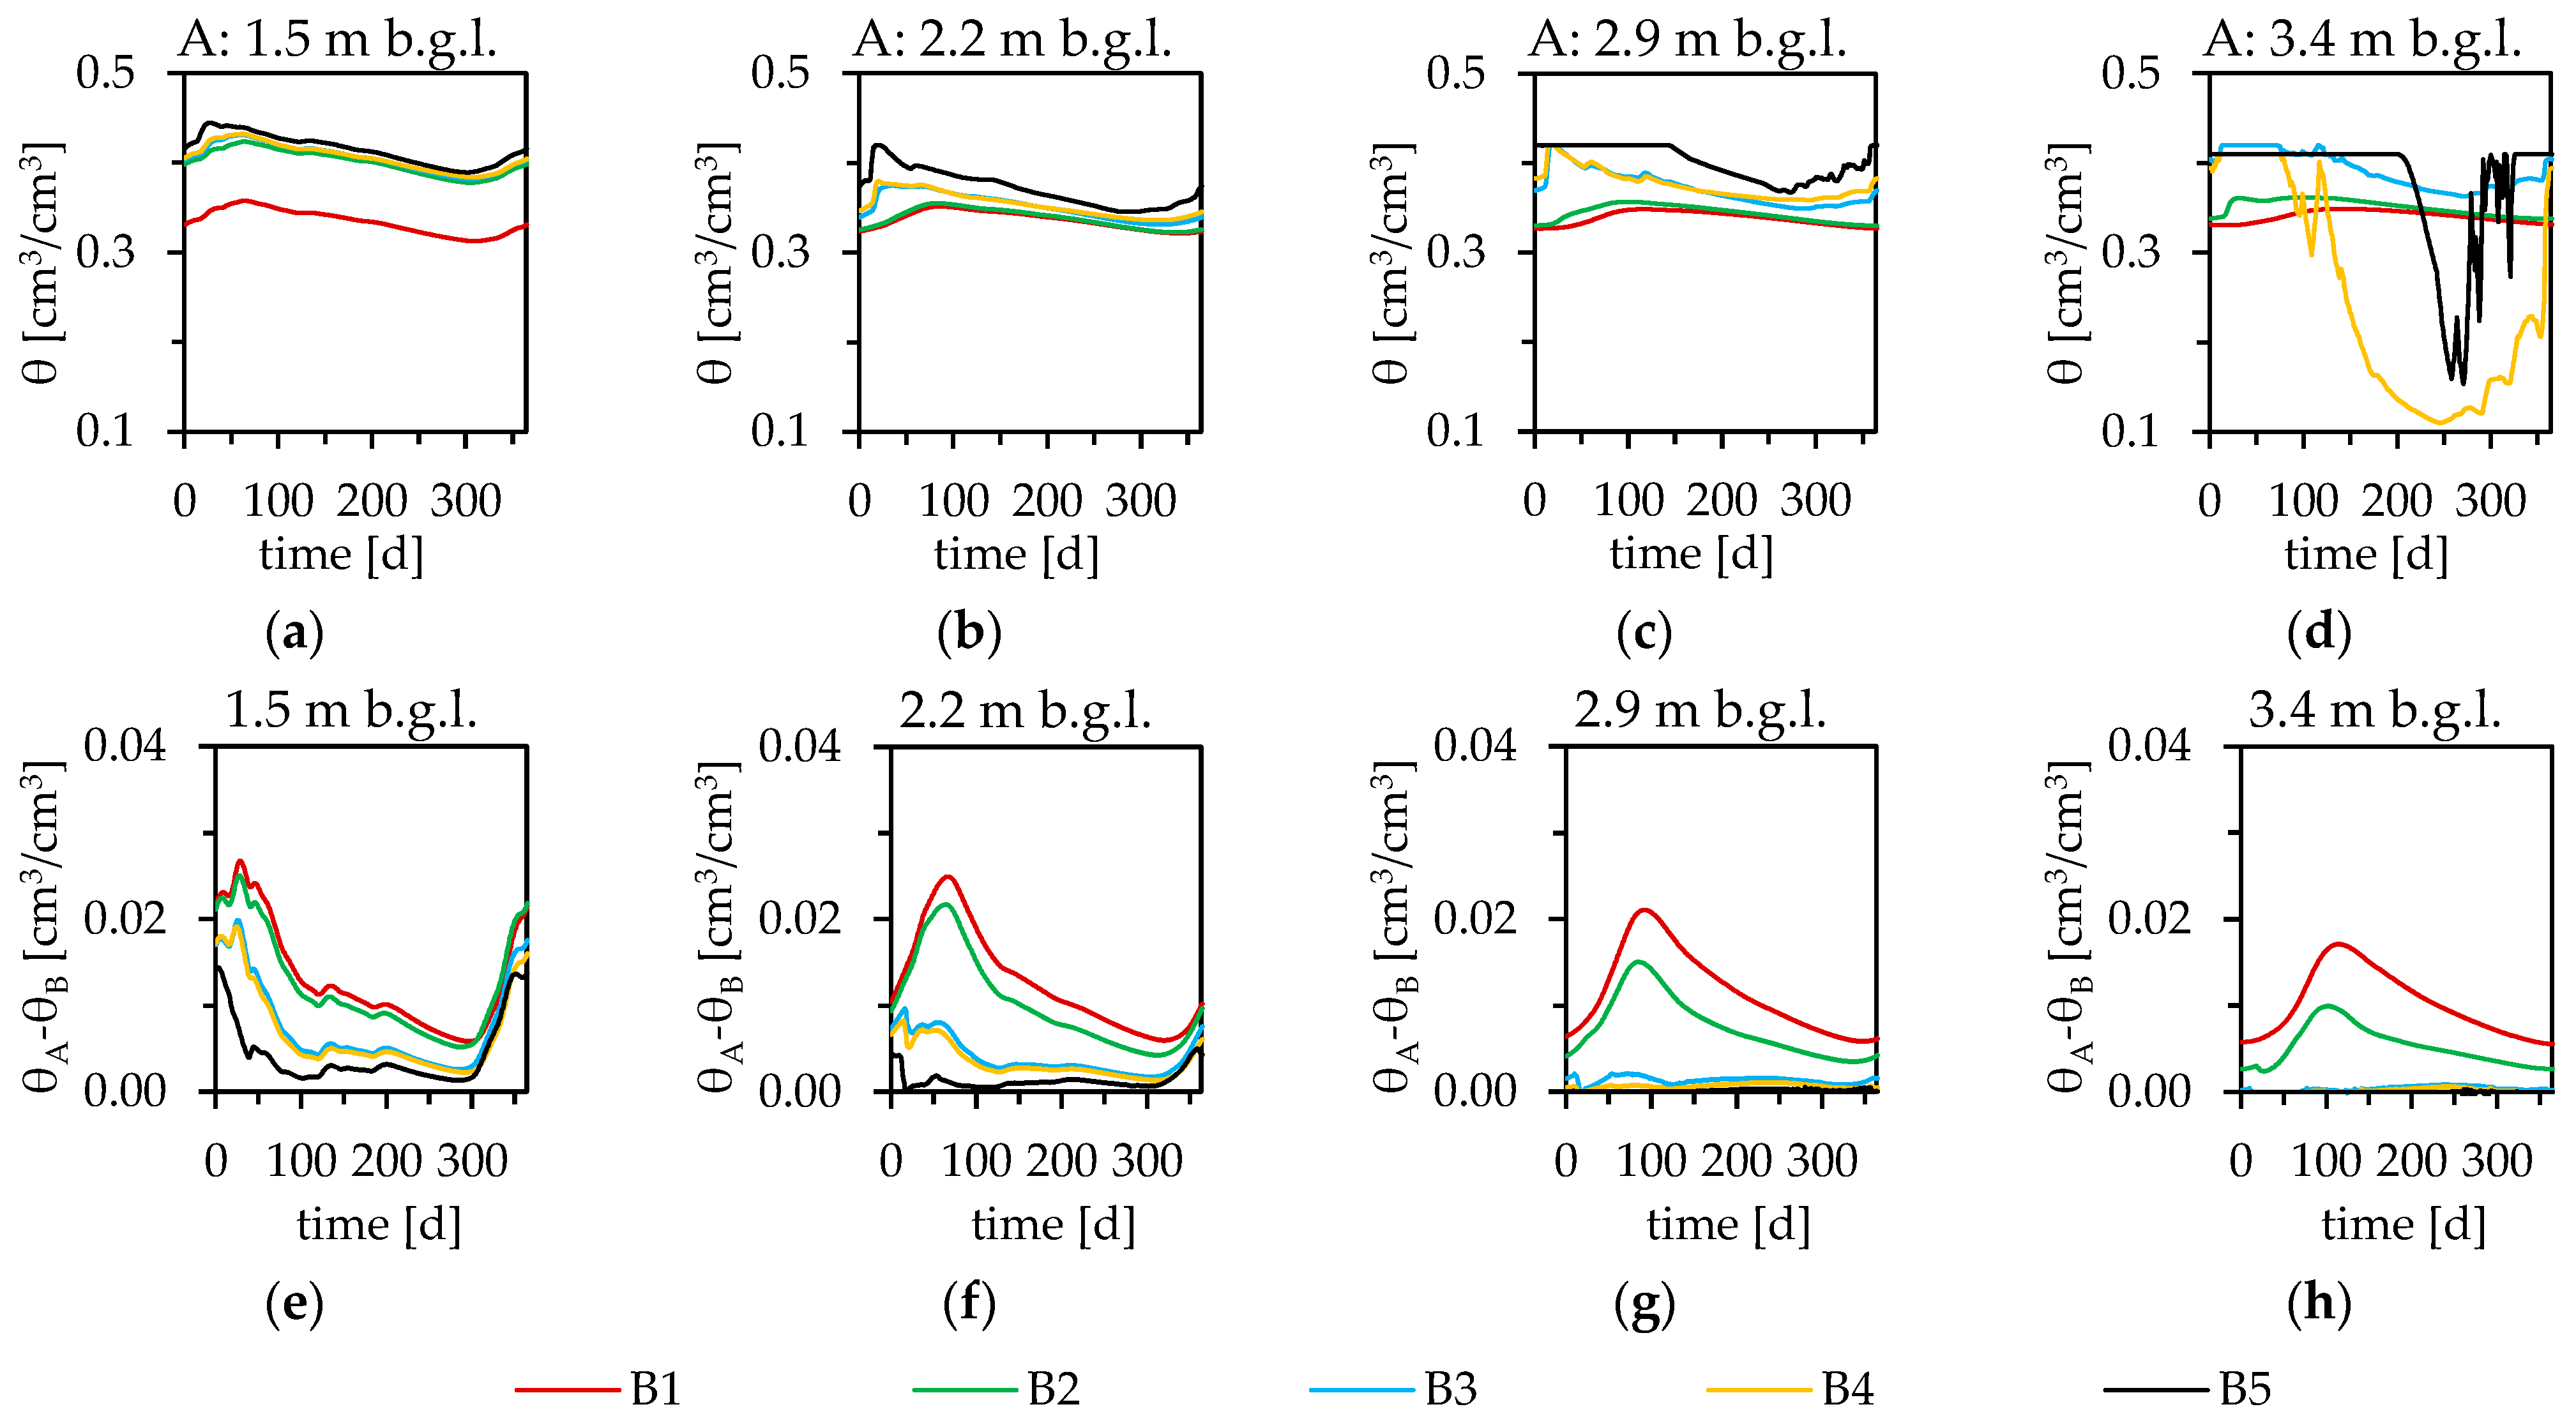
3.3. Simulated Moisture Contents with Different Groundwater Levels at Monitoring Wells B1 to B5

The simulated site- and depth-dependent annual trends in moisture contents are shown in Figure 6a–d, exemplary of scenario A. Since the simulated values are based on an annually repeating cycle of groundwater level and surface influences as well as on an assumed soil structure, the actual moisture contents may deviate from them. However, the validation simulations at “Reference” and “mLSC” showed only minor deviations from the actually observed moisture contents. Basic trends, as well as the effects, of different groundwater conditions can therefore be derived from the simulated data. Since B1 to B5 are located at the outer edge of the LSC, and B1, in particular, is even farther away, the simulated moisture contents thus represent maximum and minimum values for the LSC area.
At B3 and B4, the groundwater level is temporarily higher than 2.9 m b.g.l. At B5, the highest groundwater table in time period 2 is 2.1 m b.g.l.
Based on the medians in both scenarios, moisture contents between 0.32 and 0.42 cm3/cm3 were simulated for the fine-grained soils at the considered depths. The medians of the two scenarios differ by a maximum of 0.02 cm3/cm3. The sensors at “Reference” and “mLSC” recorded medians between 0.34 and 0.39 cm3/cm3, when periods of partially frozen soil are excluded. Thus, the observed values are within the range of moisture contents simulated at B1 to B5.
Moisture contents measured in a trial pit in the LSC area and moisture contents derived from gravimetric water contents measured in the boreholes B2 to B5 gave mean values between 0.31 and 0.34 cm3/cm3 for fine-grained soils and are thus basically in a similar, slightly lower range of values [22]. Sampling for this evaluation was conducted in the summer and autumn of the dry year 2020. As can be seen in Figure 6, lower moisture contents generally occur during these seasons.
At 3.4 m b.g.l., at B4 and B5, significantly lower moisture contents relative to the groundwater table occur temporarily due to the lower water retention capacity of the loam/gravel layer. In addition, different hydraulic properties of silt loam and silty clay loam are evident at a depth of 1.5 m b.g.l. While medians of 0.32 and 0.34 cm3/cm3 were simulated in the silt loam at B1, the median values in the silty clay loam at other monitoring wells are significantly higher (up to 0.09 cm3/cm3).
Figure 6e–h show the differences between the simulated moisture contents of scenarios A and B. These generally decrease with depth, as the groundwater influence increases and the surface influence decreases. In addition, the differences are greatest at high groundwater distances, such as at B1 and B2. The maximum values occur at 1.5 m b.g.l., mainly in the rainy period at the beginning of the year, and then appear with a certain time delay as the depth increases.

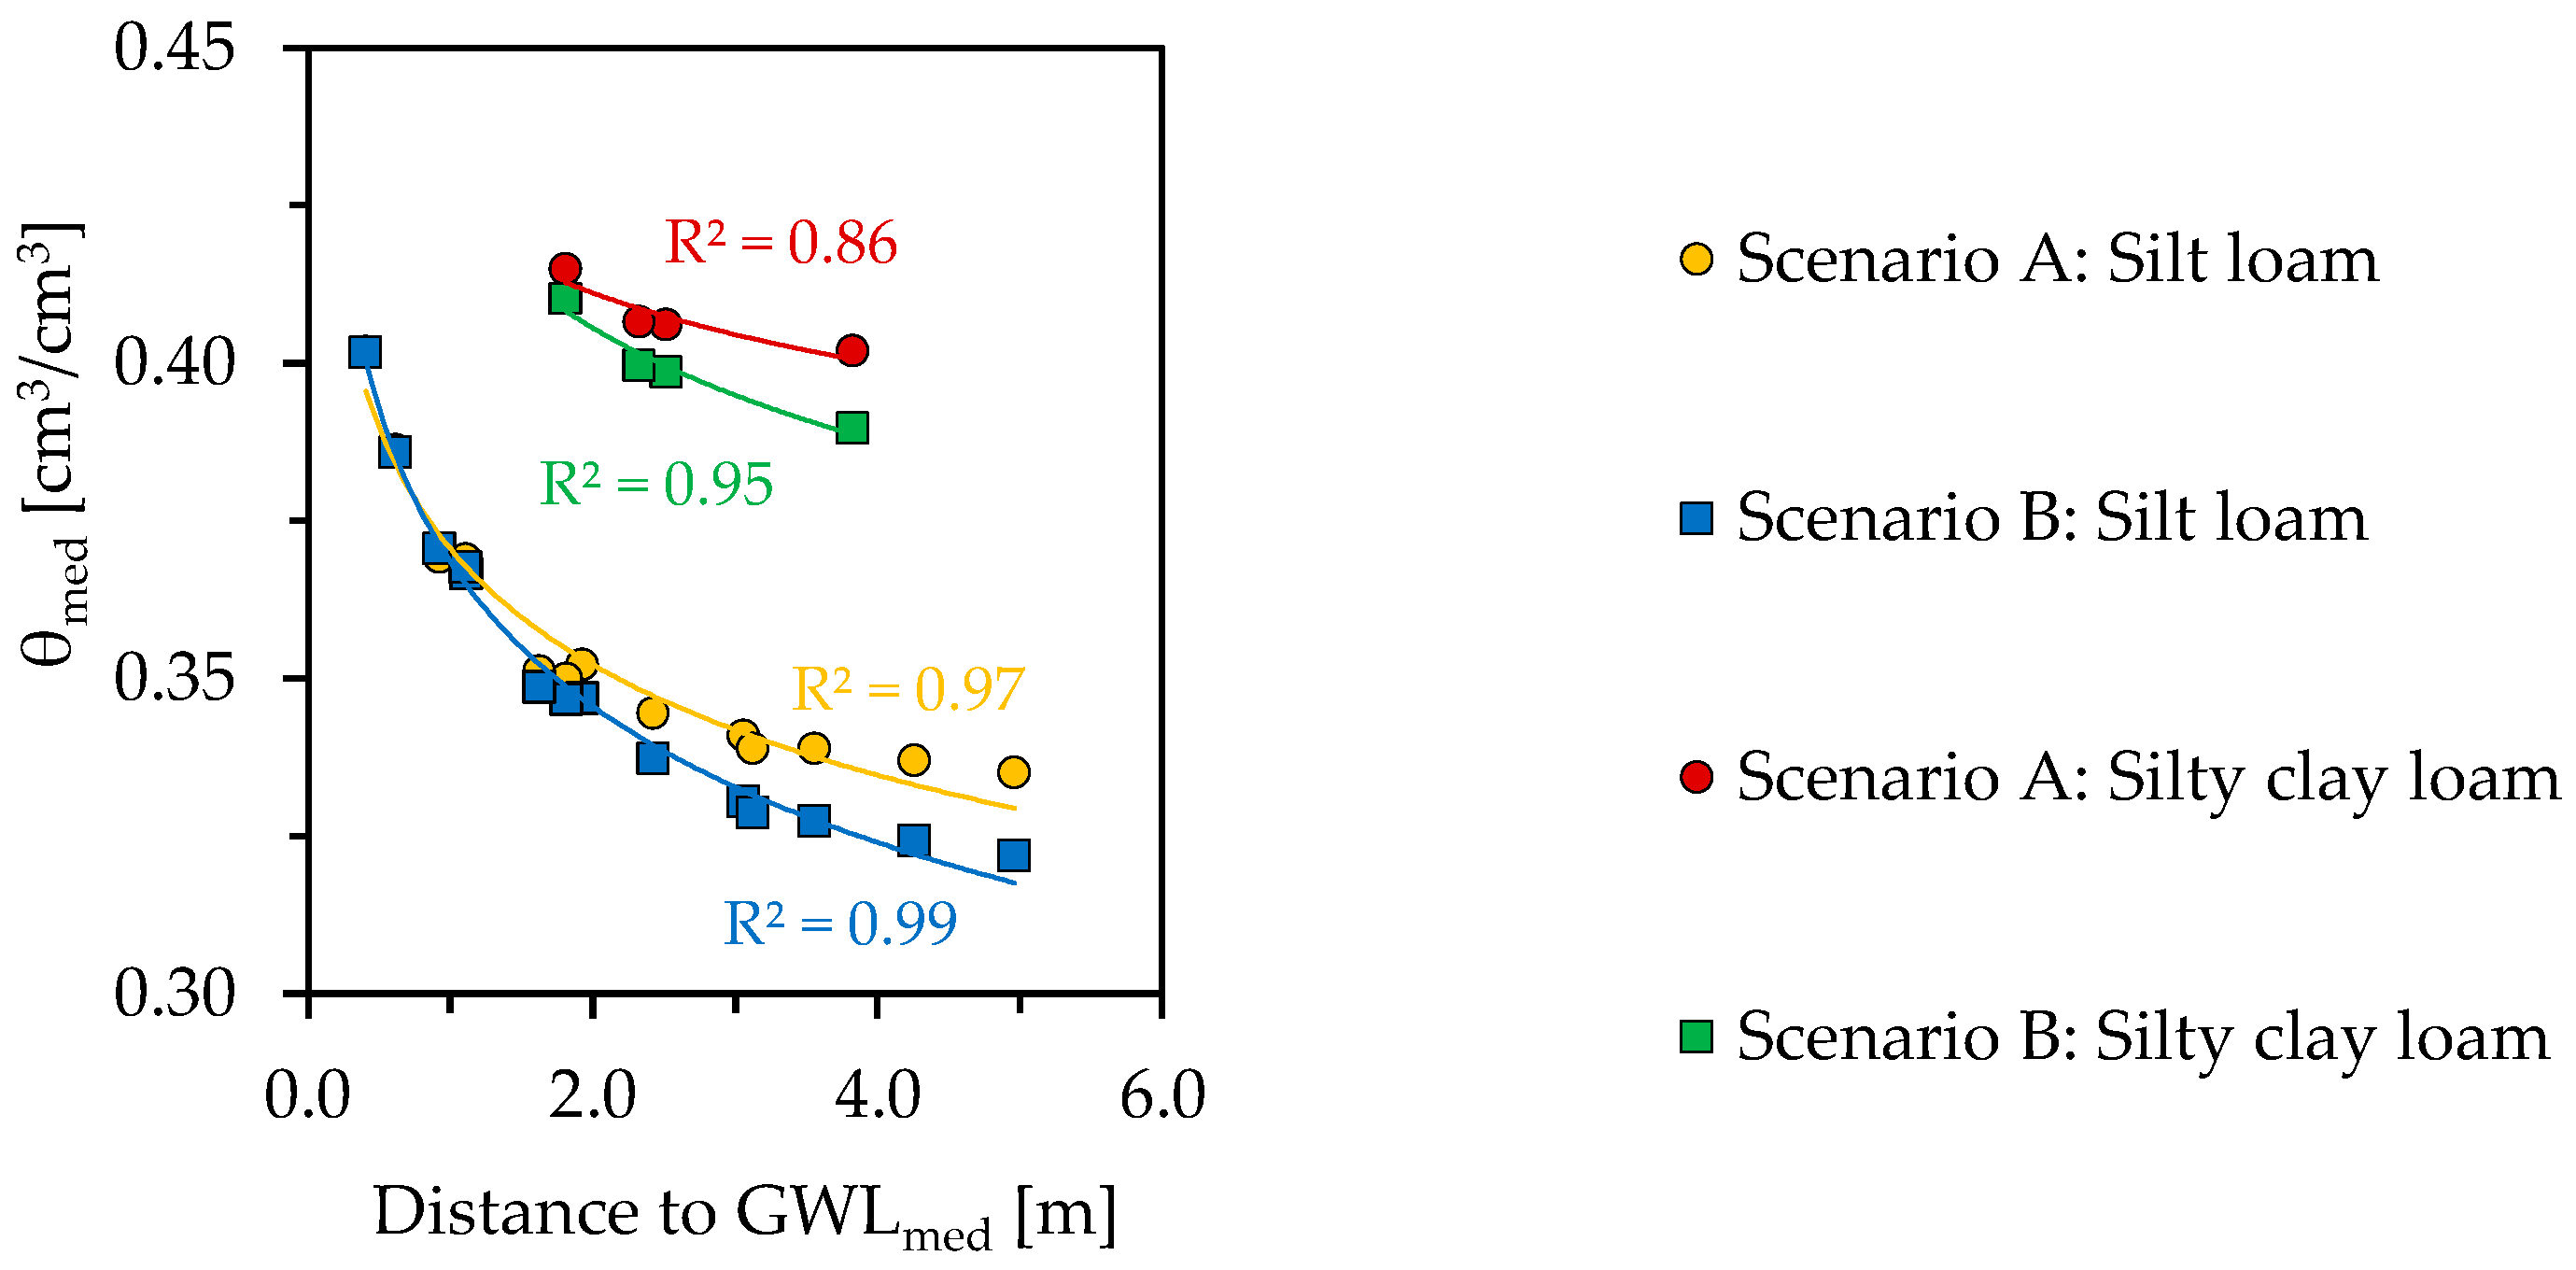
3.4. Influence of Spatial Differences in Groundwater Distance on Moisture Contents

The comparison of the simulated moisture contents with the distance to the groundwater level at the respective depths shows a clear correlation in the form of a power function with coefficients of determination (R2) between 0.86 and 0.99 (Figure 7).
Moisture content decreases with increasing distance to the groundwater level, depending on the soil texture class and surface influences. Considering medians (θmed), differences of up to 0.08 cm3/cm3 occur within one soil texture class (here: silt loam).
No differences between scenarios A and B are observed at very low groundwater distances. Here, the moisture content is mainly determined by capillary rise and groundwater-related temporary full saturation. With increasing distance to groundwater, increasing differences in θmed between the scenarios of up to 0.02 cm3/cm3 occur with generally higher moisture contents in scenario A, which is due to the higher groundwater recharge rate considered in scenario A. In addition, the decrease in moisture content with increasing groundwater distance in scenario B is therefore steeper.
For the same depth and the same soil texture class, differences in moisture content of up to 0.08 cm3/cm3 result from the spatial variation in groundwater levels. The largest differences occur at 2.9 m b.g.l. in the silt loam layer.

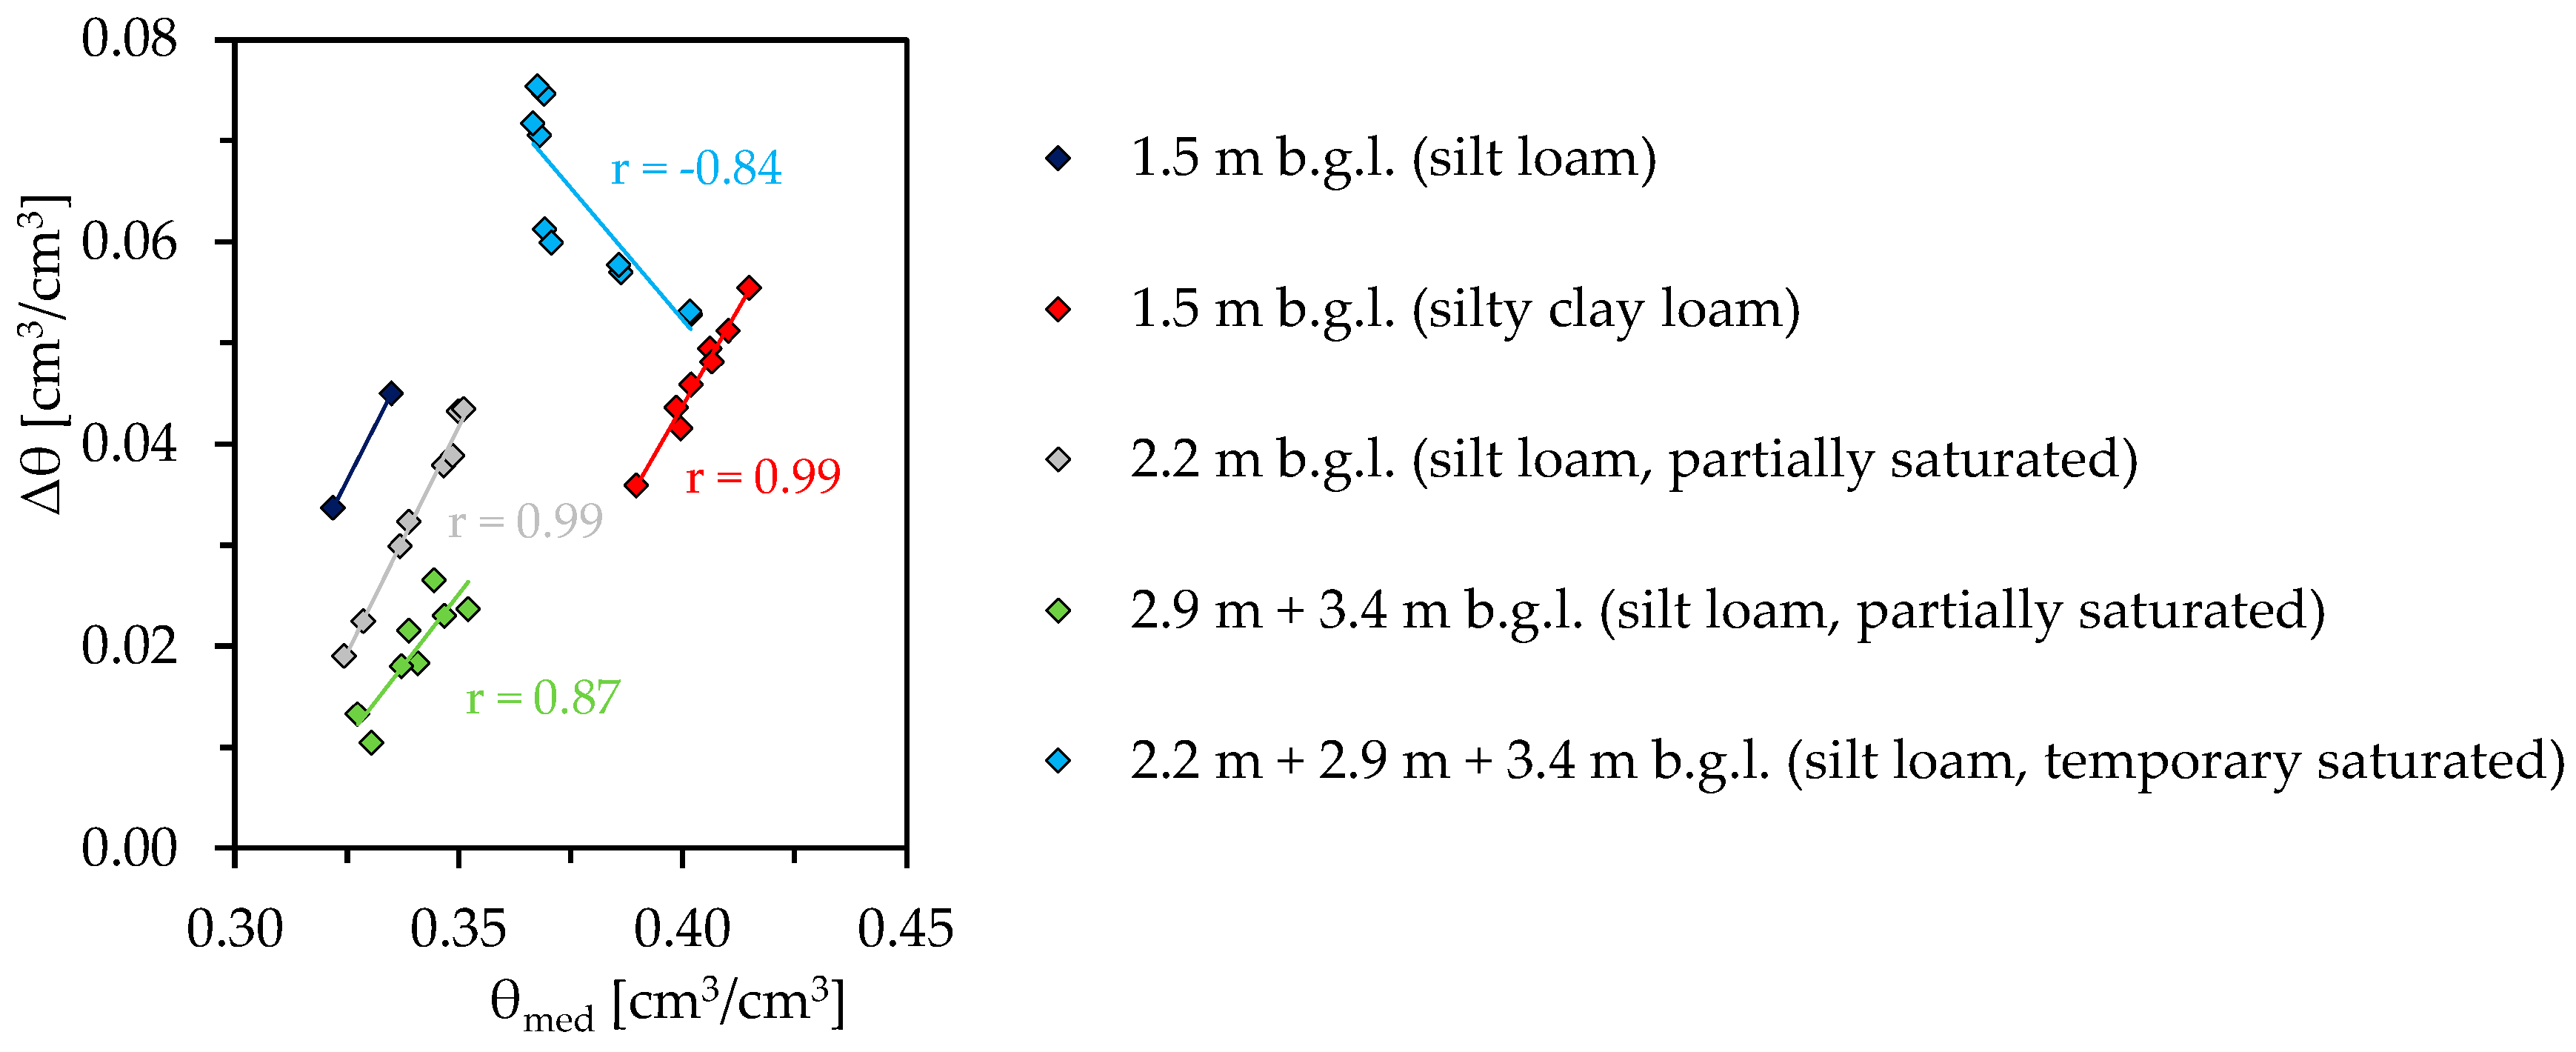
3.5. Influence of Groundwater on the Seasonal Variation in Moisture Content

The comparison of the maximum annual range of moisture contents (Δθ) at a given depth and location with θmed for different partially saturated soil texture classes and depth ranges shows a clear linear correlation, with Pearson’s correlation coefficients (r) between 0.87 and 0.99 (Figure 8).
Depending on the depth and the soil texture class, Δθ increases with increasing median moisture content and thus with decreasing distance to groundwater, additionally depending on the groundwater recharge rate. Maximum values of 0.08 cm3/cm3 are reached. In general, higher fluctuations are observed in scenario A due to the higher recharge rate from precipitation. At groundwater distances < 2 m from the considered depth, no differences between the two scenarios can be observed due to the groundwater influence.
Due to the surface influence of precipitation, high values of Δθ generally occur at 1.5 m b.g.l. At 2.2 m b.g.l., significantly higher fluctuations occur at B5, since the groundwater rises to 2.1 m b.g.l. at times, and thus fully saturated conditions also prevail.
At 2.9 m and 3.4 m b.g.l., fully saturated conditions exist intermittently at B3, B4 and B5 and additionally at 2.2 m b.g.l. at B5. Therefore, high Δθ and θmed values for silt loam are generally observed here. However, the range of variation decreases with increasing moisture content and thus with decreasing groundwater distance (r = −0.84). Since high moisture contents are already present due to the very low groundwater distance, the difference between the moisture content in the temporarily partially saturated conditions and the fully saturated moisture content is lower.

4. Discussion

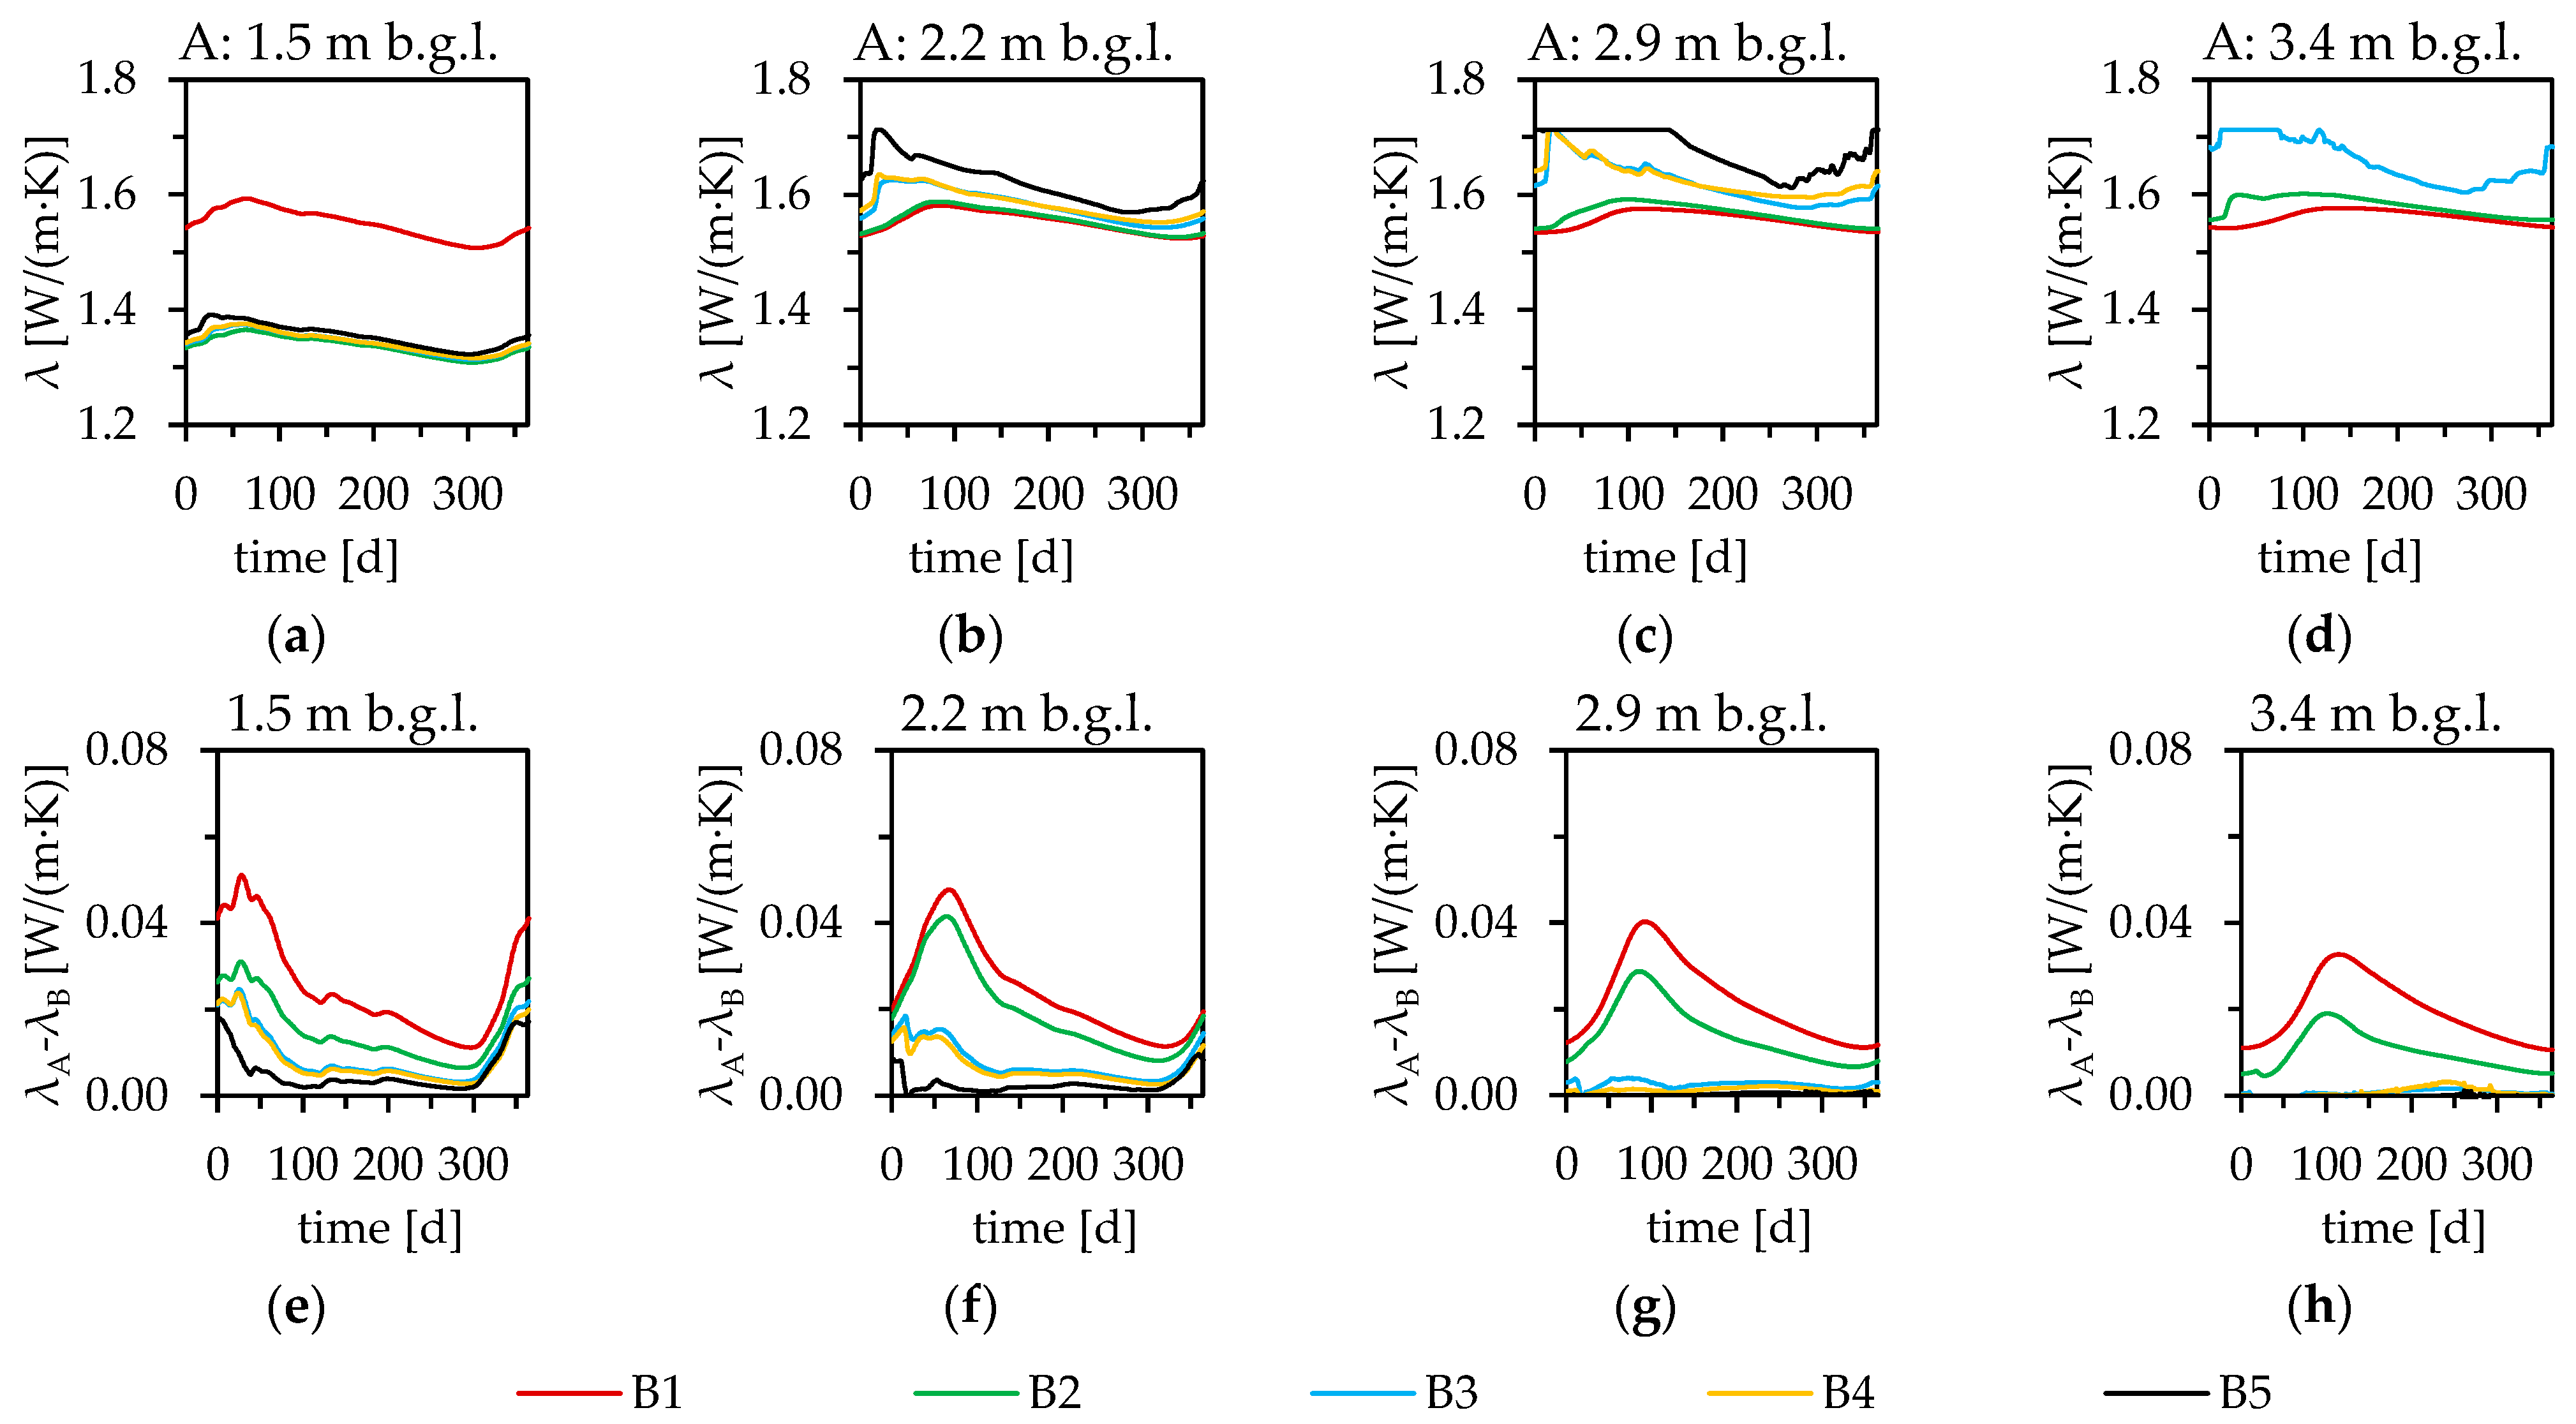
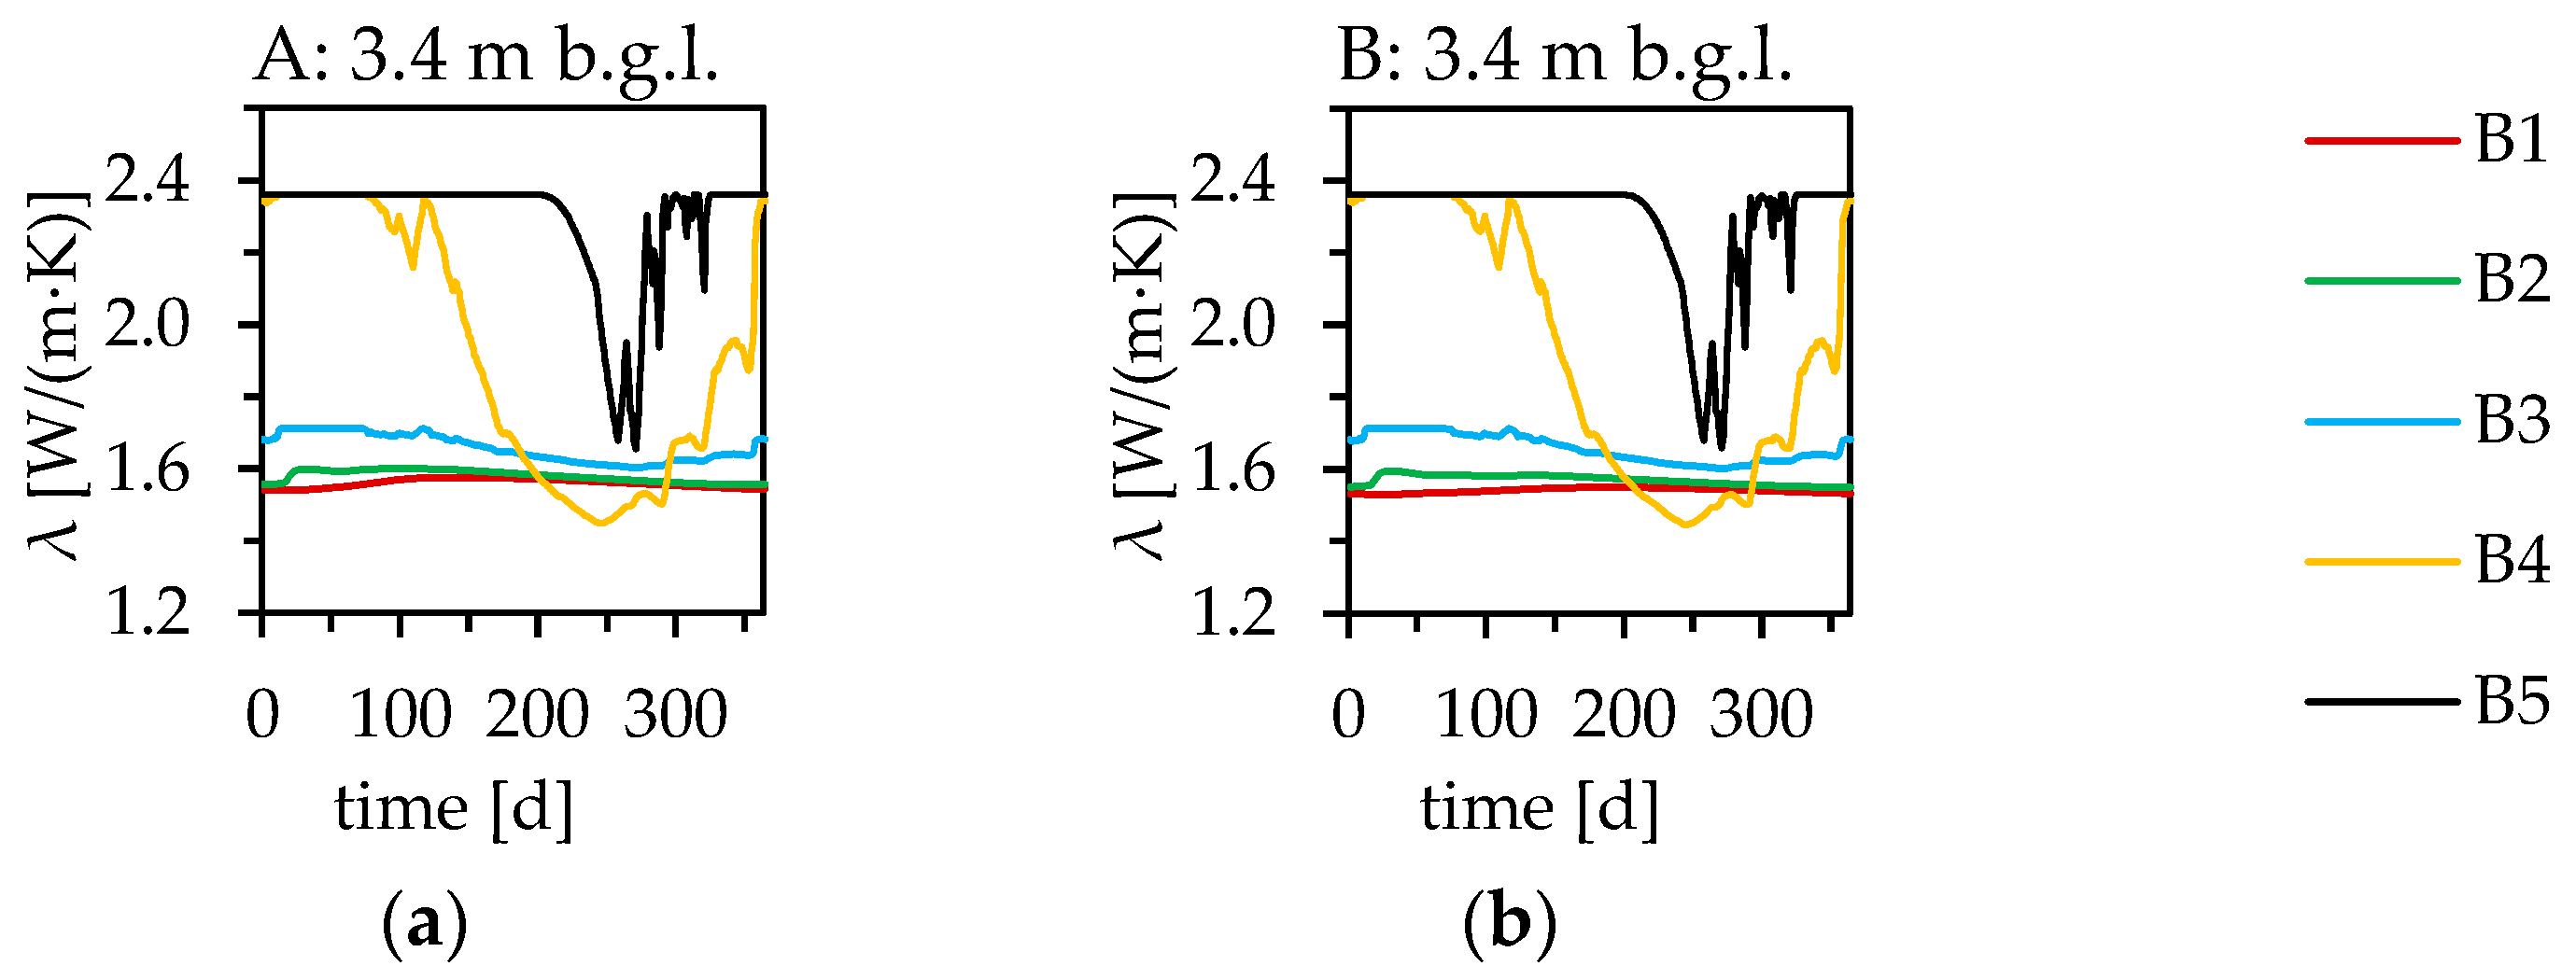
4.1. Derived Thermal Conductivities from Simulated Moisture Contents at Monitoring Wells B1 to B5

The derived site- and depth-dependent annual trends in thermal conductivity are shown in Figure 9a-d. Since the derived values are based on an annually repeating cycle of simulated moisture contents and on exemplary laboratory measurements of λ, the actual thermal conductivities may deviate from them. In addition, temporary icing caused by the LSC, as can be seen in the observed moisture contents in Figure 5, was not considered. Frozen soils generally have a significantly increased thermal conductivity [51].
Medians of λ between 1.52 W/(m∙K) at B1 and 1.68 W/(m∙K) at B5 were derived for the silt loam layers at the considered depths. Due to the deviating thermal properties of the silty clay loam, the medians in this layer at 1.5 m b.g.l. range between 1.32 W/(m∙K) and 1.35 W/(m∙K) (Figure 9a). The derived values largely agree with the mean thermal conductivities determined by Rammler et al. [22].
Looking at the medians, differences of up to 0.21 W/(m∙K) at 1.5 m b.g.l. result, which can mainly be attributed to the different thermal properties of silt loam and silty clay loam. Using the maximum differences at this depth with 1.34 W/(m∙K) at B2 and 1.55 W/(m∙K) at B1 in scenario A for the exemplary DELPHIN simulations, the different thermal properties of the fine-grained soils result in maximum spatial variations in theoretical heat extraction of 13% to 14% at this depth.
Figure 9e–h show the differences between the derived values for scenarios A and B. As with the moisture content, the differences generally decrease with depth, as the groundwater influence increases and the precipitation influence decreases. Due to the comparatively high groundwater distances at B1 and B2, the differences are greatest there, with values of up to 0.05 W/(m∙K). The maximum values occur mainly in the rainy period and then appear with a certain time delay as the depth increases. In the area with high groundwater levels (B3 to B5), there are no or only minor differences, particularly at 2.9 m and 3.4 m b.g.l.
The high Δθ values of the loam/gravel layer also cause the derived thermal conductivity to vary by up to 0.92 W/(m∙K) at 3.4 m b.g.l. (Figure 10). With a maximum thermal conductivity of 2.36 W/(m∙K), higher values are obtained in this layer than in the fine-grained soils at the same depth by up to 0.82 W/(m∙K) when comparing medians. For this layer, there is no significant difference between scenarios A and B due to the low groundwater distance and long-time full saturation.

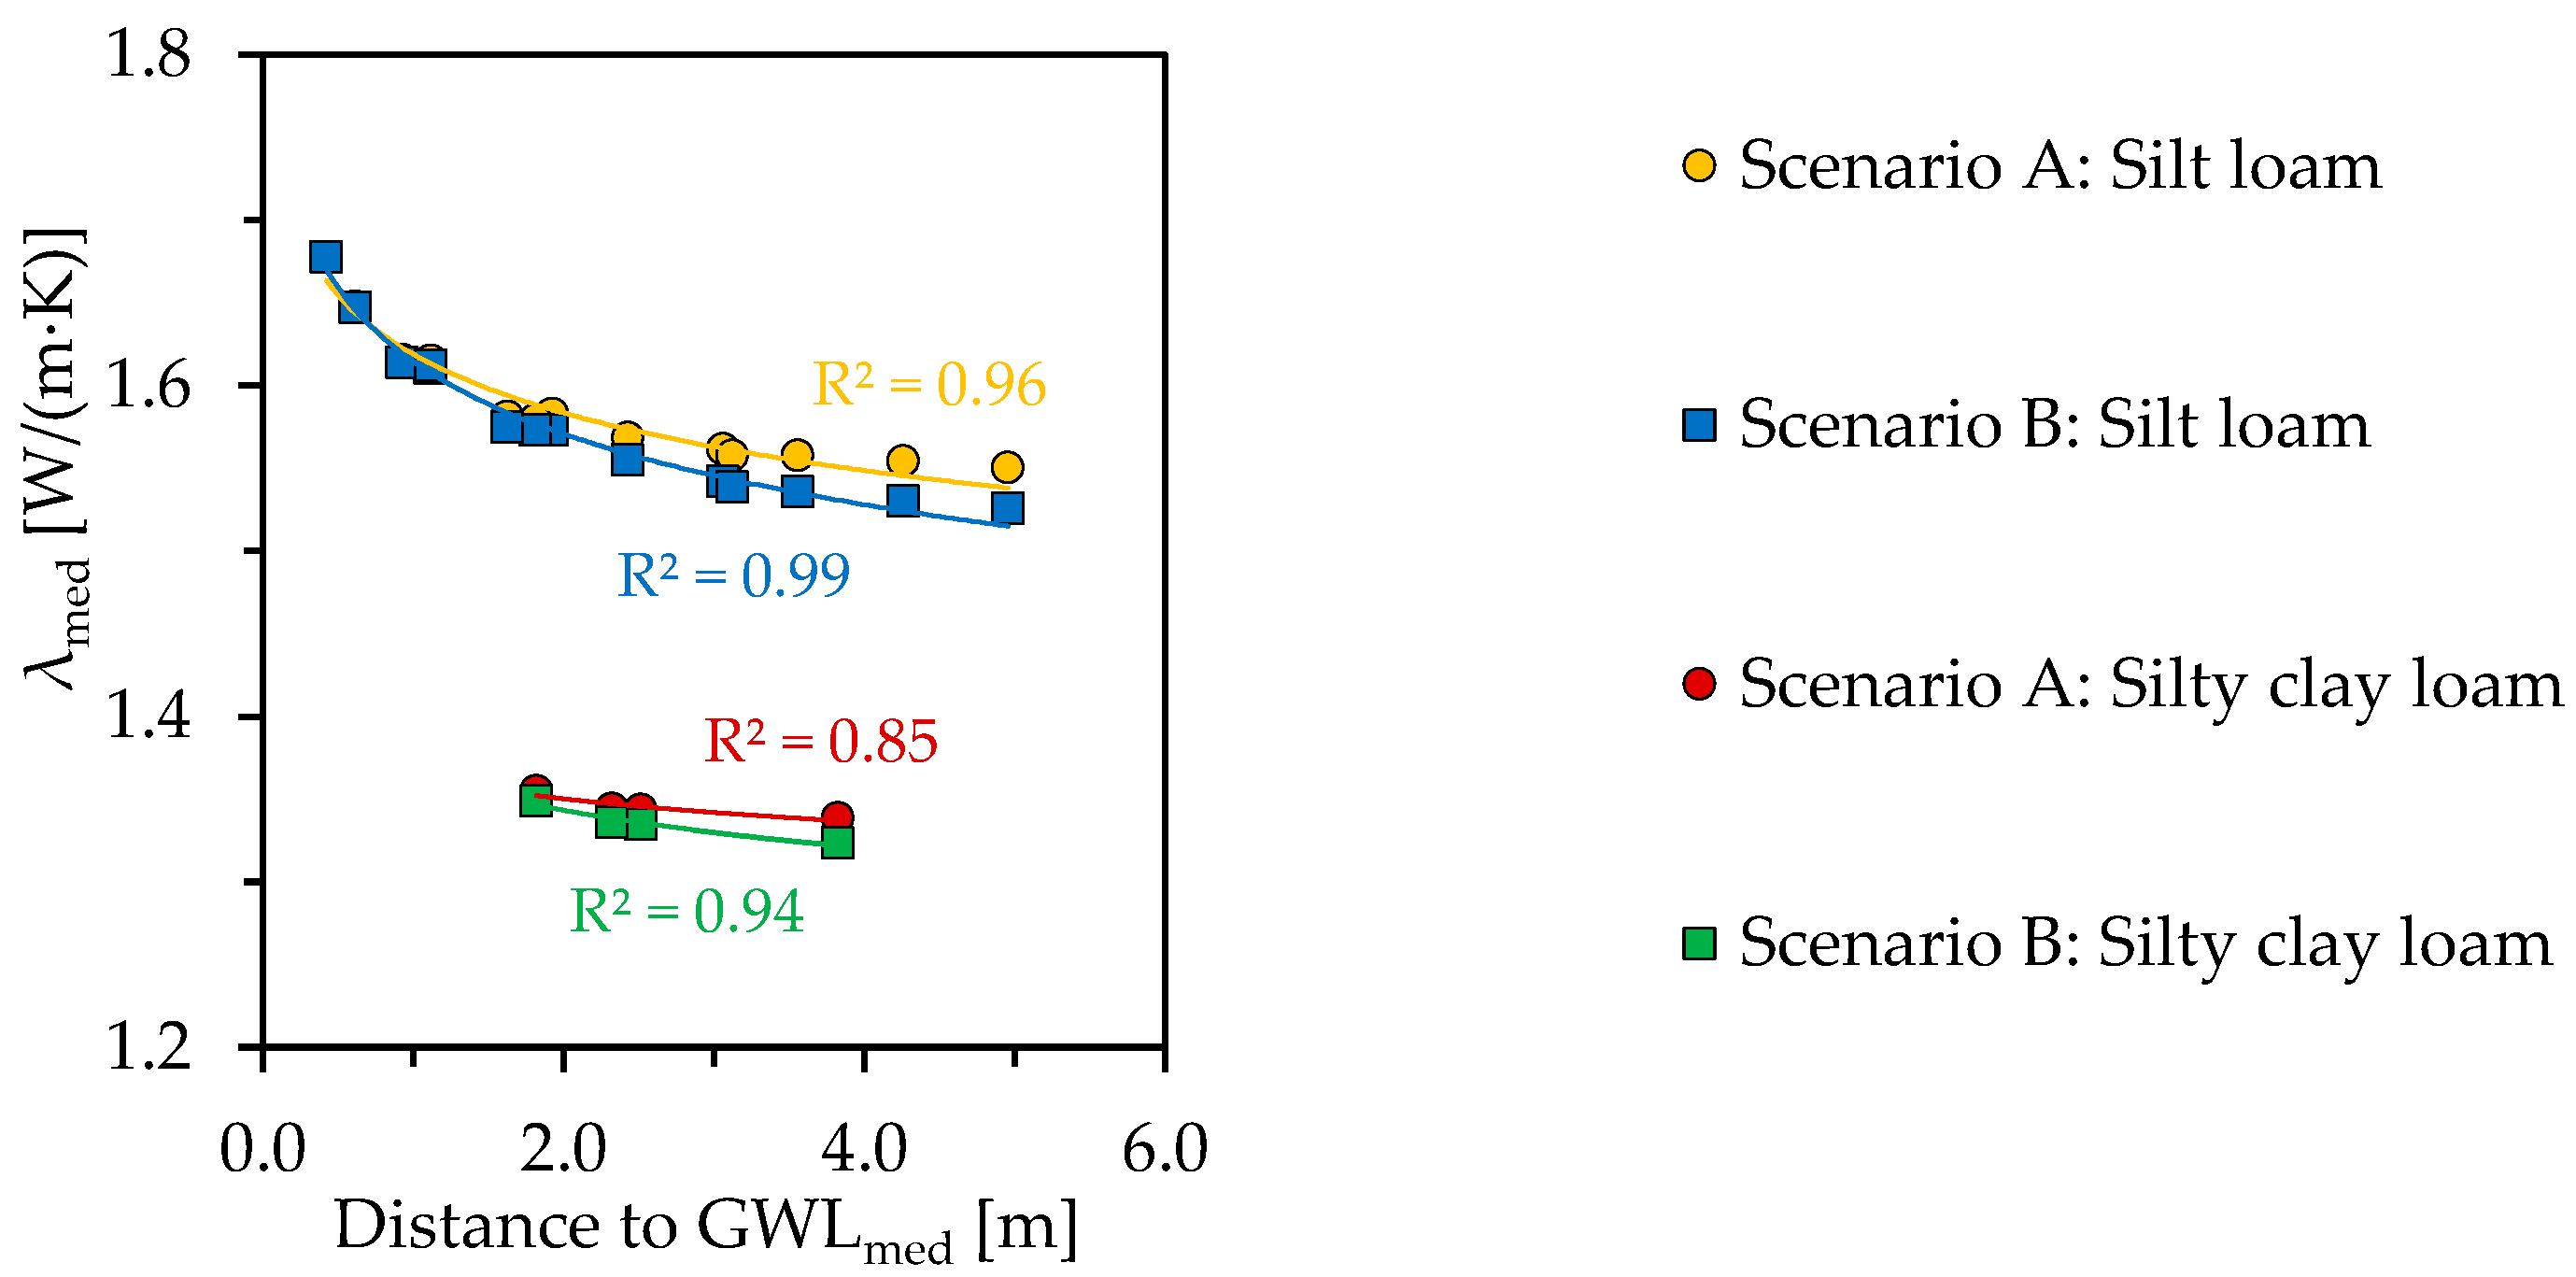
4.2. Influence of Spatial Differences in Groundwater Distance on the Very Shallow Geothermal Potential (vSGP)

The comparison of the derived thermal conductivities with the distances to groundwater at the respective depths shows a clear correlation in the form of a power function with coefficients of determination (R2) between 0.85 and 0.99 (Figure 11).
As the groundwater distance increases, λmed decreases due to the moisture content also decreasing (Figure 7). Looking at medians, the thermal conductivity of the silt loam soil texture class shows differences of up to 0.16 W/(m∙K). As the distance to groundwater increases, the difference between scenarios A and B increases to 0.03 W/(m∙K) when comparing median values, as the influence of groundwater on the moisture content decreases and that of precipitation increases. The resulting higher moisture contents in scenario A lead to higher thermal conductivities. The lower groundwater recharge rate also leads to a steeper decrease in λmed with increasing groundwater distance in scenario B. However, at low groundwater distances, the very shallow geothermal potential in the form of λ is mainly influenced by capillary rise and temporary full saturation.
For the same depth and the same soil texture class, differences in thermal conductivity of up to 0.14 W/(m∙K) result from the spatial variation in groundwater levels, considering medians. The largest differences occur at 2.9 m b.g.l. in the silt loam layer. Using this maximum spread of thermal conductivity for the exemplary DELPHIN simulations, with 1.54 W/(m∙K) at B1 and 1.68 W/(m∙K) at B5 in scenario B, this results in a maximum spatial variation in heat extraction of 7% to 9%.

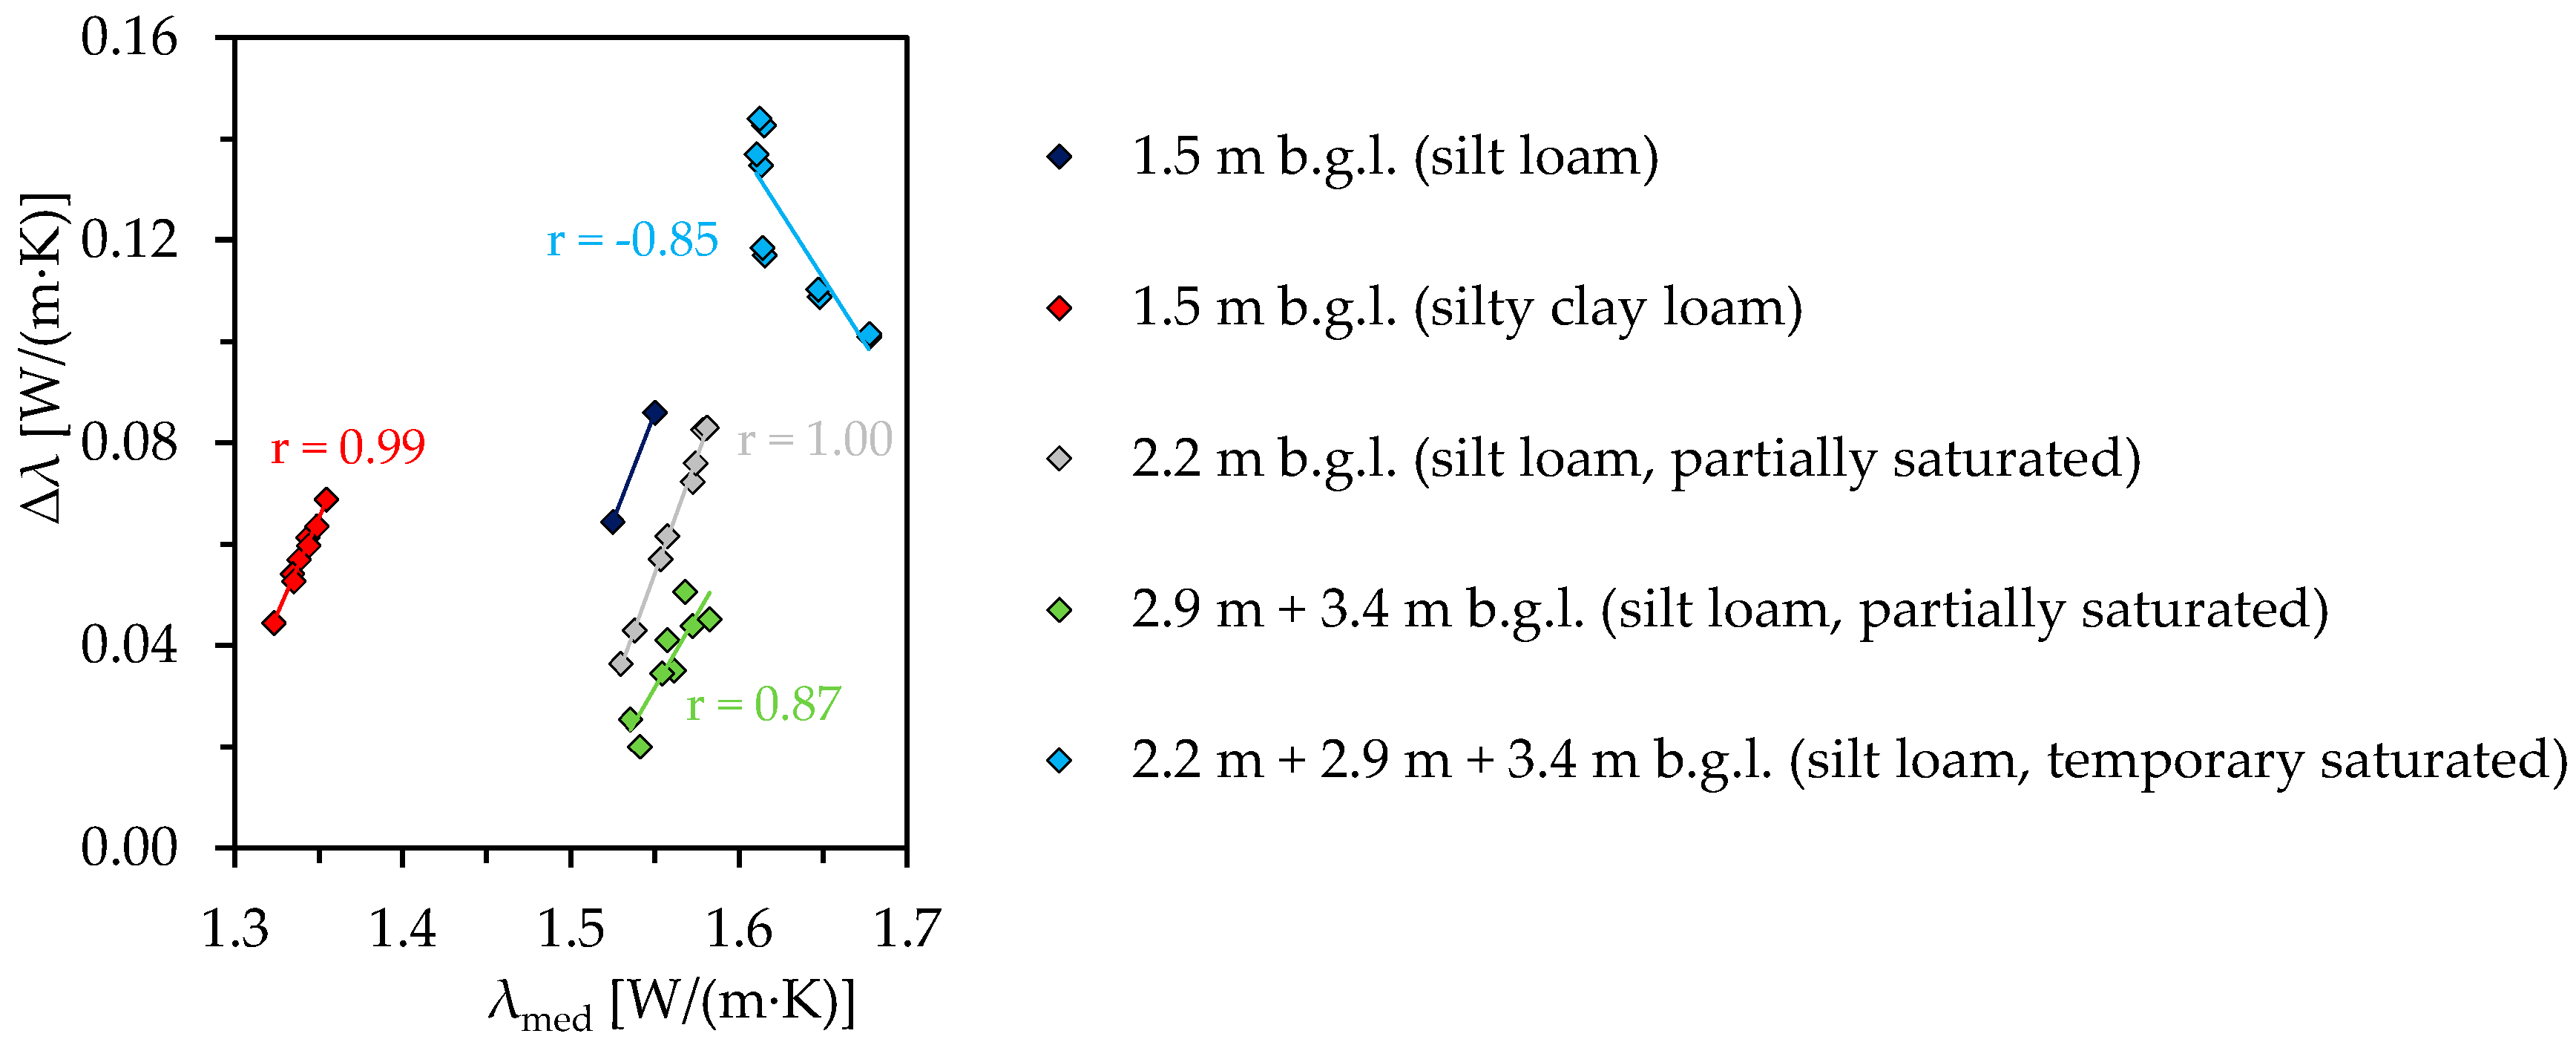
4.3. Influence of Groundwater on the Seasonal Variation in the Very Shallow Geothermal Potential (vSGP)

A comparison of the maximum annual range of thermal conductivity (Δλ) at a given depth and location with λmed for different partially saturated soil texture classes and depths shows a clear linear correlation, with Pearson’s correlation coefficients (r) between 0.87 and 1.00 (Figure 12).
Depending on the depth and soil texture class, Δλ increases with increasing moisture content and thermal conductivity and thus with decreasing distance to groundwater with a maximum of 0.14 W/(m∙K). As with the moisture content, the variations are smaller for scenario B due to the lower recharge rate from precipitation. There is no difference at low groundwater distances, where the influence of the groundwater dominates.
Due to the groundwater-induced high moisture content and temporary full saturation, there is also a decrease in Δλ with increasing λmed for the affected soils (r = −0.85).
The maximum Δλ value of 0.14 W/(m∙K) occurs, for example, at B5 at a depth of 2.2 m b.g.l. Here, the thermal conductivity varies between 1.57 W/(m∙K) and 1.71 W/(m∙K), mainly related to the annual groundwater fluctuation. Based on these values, the exemplary DELPHIN simulations result in a maximum annual variation in theoretical heat extraction of 7% to 8%.

5. Conclusions

The validation of the simulations based on the observed moisture contents at the measuring points “Reference” and “mLSC” showed the general suitability of the quasi-one-dimensional model setup and of the assigned material properties to simulate actual moisture contents. The methodology can thus also be transferred to other applications or issues concerning vertical water movement in a soil column. The extent to which scenario A or B corresponds more to the actual surface influences could not be conclusively assessed due to the small differences between the simulated moisture contents.
The simulations at monitoring wells B1 to B5 resulted in the following influencing factors and effects on moisture content and on the very shallow geothermal potential in the form of the thermal conductivity in the area around the LSC (Table 7).
According to exemplary simulations, groundwater-related spatial and seasonal variations in thermal conductivity can cause maximum changes in heat extraction of 7% to 9%. The determined differences represent maximum values due to the location of the monitoring wells at the outer boundary of the LSC.
Due to the different soil texture classes of fine-grained soils and their thermal properties, variations in heat extraction of 13% to 14% are possible. Even larger grain-size-distribution-related differences in thermal conductivity are particularly evident with respect to the loam/gravel layer, which is present in the northeast of the LSC from 3 m b.g.l. downward. Particularly high thermal conductivities are also expected in the purer gravel [50,52], which is only immediately deeper. Due to the effective thermal conductivity, which is influenced by the groundwater flow velocity [53], the bench gravel as a whole can thus have a significant impact on the thermal regeneration capability of the subsurface, depending on the location at the LSC.
Accordingly, a sufficiently detailed subsurface exploration is required in advance for the design of an efficient LSC. In addition to determining the spatial and seasonal groundwater conditions, the distribution of different soil textures and specific thermal properties should be a primary focus. In practice, this can be achieved primarily through a higher number of subsurface outcrops corresponding to the large area of an LSC. However, this must also be determined site-specifically based on various factors, such as the slope of the terrain or on the basis of hydrogeological, geological and pedological maps. A sufficiently detailed subsurface exploration can potentially lead to smaller and more efficient collector and distribution systems, thus increasing overall profitability.
The investigation has also shown that as groundwater recharge from precipitation decreases because of climate change [53], differences in the very shallow geothermal potential between areas at the LSC with high (east) and low (west) groundwater tables will become more pronounced. The resulting lowering of groundwater levels will also lead to decreasing thermal conductivities.

Author Contributions

Conceptualization, M.R.; methodology, M.R. and R.Z.; software, M.R. and R.Z.; validation, M.R.; formal analysis, M.R.; investigation, M.R.; resources, D.B; data curation, M.R.; writing—original draft preparation, M.R. and R.Z.; writing—review and editing, M.R., R.Z. and D.B.; visualization, M.R.; supervision, D.B.; project administration, D.B. and M.R.; funding acquisition, D.B. All authors have read and agreed to the published version of the manuscript.

Funding

This research was funded as part of the research project “KNW-Opt” by the Federal Ministry for Economic Affairs and Climate Action (BMWK), Grant No. 03EN3020C.

Data Availability Statement

The data presented in this study are available on request from the corresponding author. The data are not publicly available due to privacy restrictions.

Acknowledgments

A big thank you goes to our research partners Volker Stockinger and his group from the Technische Hochschule Nürnberg as well as to Stadtwerke Bad Nauheim GmbH, who provided administrative support for our scientific work. In addition, we would like to thank DHI Wasy GmbH for providing FEFLOW® free of charge for dissertation research.

Conflicts of Interest

The authors declare no conflict of interest.

Appendix A

Table A1. List of soil samples for which hydraulic properties were determined using the HYPROP® measuring device for each layer or soil texture class. The sampling sites are documented in Rammler et al. [22]. In addition, further tests were conducted that are not listed here because they were not used for this study. ρb_ini corresponds to the bulk density before saturation.
Layer/Soil Texture ClassSample PointDepth
[m b.g.l.]
Samplingρb_ini [g/cm3]
TopsoilDistributed around the LSC0.0Repacked1.26
0.0Repacked1.46
0.0Repacked1.41
0.0Repacked1.45
Silt loamEast of the LSC0.3Undisturbed1.60
0.3Undisturbed1.53
0.3Undisturbed1.64
Silty clay loamEast of the LSC0.3Undisturbed1.46
RCD11.1–1.5Repacked1.28
RCD21.3–1.5Repacked1.37
RCD3 + RCD41.5Repacked1.37
TP51.4Undisturbed1.43
Figure A1. Water retention curves based on the Genuchten–Mualem model with soil moisture tension (pF) and moisture content (θ) fitted to the evaluated values of the soil samples from Table A1 for (a) topsoil, (b) silt loam and (c) silty clay loam with LABROS SoilView-Analysis. The resulting parameters are listed in Table 3.
Geosciences 13 00251 g0a1
Figure A2. Measurement series from Rammler et al. [22] on which the derivation of the thermal conductivity (λ) was based for (a) fine-grained soils as a function of moisture content (θ) and (b) the loam/gravel layer as a function of saturation (S) (Table 5). The series of measurements selected were those of sample TP6 (1.6 m) for silty clay loam and those of sample TP2 (2.4 m) for silt loam. The sampling sites are documented in Rammler et al. [22]. Also shown in (a) are the trend lines of linear interpolation and extrapolation for θ > 0.15 cm3/cm3, as described in Table 5. For the loam/gravel layer, a series of measurements on the corresponding layer at B1 from a master’s thesis [50] was used. The trend line based on a second-degree polynomial function is also shown. The coefficient of determination (R2) is given for all trend lines.
Geosciences 13 00251 g0a2

References

  1. Zeh, R.; Ohlsen, B.; Philipp, D.; Bertermann, D.; Kotz, T.; Jocic, N.; Stockinger, V. Large-Scale Geothermal Collector Systems for 5th Generation District Heating and Cooling Networks. Sustainability 2021, 13, 6035. [Google Scholar] [CrossRef]
  2. Zeh, R.; Stockinger, V. Monitoring of a large-scale geothermal collector system and a 5GDHC in Bad Nauheim. In Proceedings of the Eurpean Geothermal Congress 2022, Berlin, Germany, 17–21 October 2022. [Google Scholar]
  3. Schwarz, H.; Jocic, N.; Bertermann, D. Development of a Calculation Concept for Mapping Specific Heat Extraction for Very Shallow Geothermal Systems. Sustainability 2022, 14, 4199. [Google Scholar] [CrossRef]
  4. Bertermann, D.; Klug, H.; Morper-Busch, L.; Bialas, C. Modelling vSGPs (very shallow geothermal potentials) in selected CSAs (case study areas). Energy 2014, 71, 226–244. [Google Scholar] [CrossRef]
  5. Abu-Hamdeh, N.H. Thermal Properties of Soils as affected by Density and Water Content. Biosyst. Eng. 2003, 86, 97–102. [Google Scholar] [CrossRef]
  6. Abu-Hamdeh, N.H.; Reeder, R.C. Soil Thermal Conductivity Effects of Density, Moisture, Salt Concentration, and Organic Matter. Soil Sci. Soc. Am. J. 2000, 64, 1285–1290. [Google Scholar] [CrossRef]
  7. Farouki, O.T. Thermal Properties of Soils; Cold Regions Research and Engineering Lab: Hanover, NH, USA, 1981. [Google Scholar]
  8. Yun, T.S.; Santamarina, J.C. Fundamental study of thermal conduction in dry soils. Granul. Matter 2008, 10, 197–207. [Google Scholar] [CrossRef]
  9. Chen, X.; Hu, Q. Groundwater influences on soil moisture and surface evaporation. J. Hydrol. 2004, 297, 285–300. [Google Scholar] [CrossRef]
  10. Connolly, R.D. Modelling effects of soil structure on the water balance of soil–crop systems: A review. Soil Tillage Res. 1998, 48, 1–19. [Google Scholar] [CrossRef]
  11. Ma, L.; Hoogenboom, G.; Saseendran, S.A.; Bartling, P.N.S.; Ahuja, L.R.; Green, T.R. Effects of Estimating Soil Hydraulic Properties and Root Growth Factor on Soil Water Balance and Crop Production. Agron. J. 2009, 101, 572–583. [Google Scholar] [CrossRef]
  12. Chen, J.; Huang, Y.; Yang, Y.; Wang, J. Evaluation of the Influence of Jiangxiang Reservoir Immersion on Corp and Residential Areas. Geofluids 2018, 2018, 9720970. [Google Scholar] [CrossRef]
  13. Wessolek, G.; Bohne, K.; Duijnisveld, W.; Trinks, S. Development of hydro-pedotransfer functions to predict capillary rise and actual evapotranspiration for grassland sites. J. Hydrol. 2011, 400, 429–437. [Google Scholar] [CrossRef]
  14. DIN 4220:2020-11; Pedologic Site Assessment—Designation, Classification and Deduction of Soil Parameters (Normative and Nominal Scaling). Beuth Verlag GmbH: Berlin, Germany, 2020.
  15. Awan, U.K.; Tischbein, B.; Martius, C. A GIS-based approach for up-scaling capillary rise from field to system level under soil–crop–groundwater mix. Irrig. Sci. 2014, 32, 449–458. [Google Scholar] [CrossRef]
  16. Widomski, M.; Lagod, G.; Suchorab, Z.; Pavlíková, M.; Pavlik, Z.; Záleská, M. Application of the Darcy and Richards equations for modelling of water capillary rise in building materials. J. Phys. Conf. Ser. 2021, 1736, 012042. [Google Scholar] [CrossRef]
  17. Smit, Y.; Donker, J.J.A.; Ruessink, G. Spatiotemporal Surface Moisture Variations on a Barred Beach and their Relationship with Groundwater Fluctuations. Hydrology 2019, 6, 8. [Google Scholar] [CrossRef]
  18. Danyar, S.; Yudong, S.; Jumakeld, M. Influence of groundwater level change on vegetation coverage and their spatial variation in arid regions. J. Geogr. Sci. 2004, 14, 323–329. [Google Scholar] [CrossRef]
  19. Pirastru, M.; Niedda, M. Evaluation of the soil water balance in an alluvial flood plain with a shallow groundwater table. Hydrol. Sci. J. 2013, 58, 898–911. [Google Scholar] [CrossRef]
  20. Kümmerle, E. Erläuterungen zur Geologischen Karte von Hessen 1: 25,000 Blatt Nr. 5618 Friedberg; Hessisches Landesamt für Bodenforschung: Wiesbaden, Germany, 1976; p. 247. [Google Scholar]
  21. Kümmerle, E. Geologische Karte von Hessen 1:25,000 5618 Friedberg; Hessisches Landesamt für Bodenforschung: Wiesbaden, Germany, 1976. [Google Scholar]
  22. Rammler, M.; Schwarz, H.; Wagner, J.; Bertermann, D. Comparison of Measured and Derived Thermal Conductivities in the Unsaturated Soil Zone of a Large-Scale Geothermal Collector System (LSC). Energies 2023, 16, 1195. [Google Scholar] [CrossRef]
  23. Scheytt, T.; Hengelhaupt, F. Auffüllversuche in der wassergesättigten und ungesättigten Zone—Ein Vergleich unterschiedlicher Verfahren. Grundwasser 2001, 6, 71–80. [Google Scholar] [CrossRef]
  24. DIN EN ISO 22282-5; Geotechnical Investigation and Testing—Geohydraulic Testing—Part 5: Infiltrometer Tests (ISO 22282-5:2012); German Version EN ISO 22282-5:2012. Beuth Verlag GmbH: Berlin, Germany, 2012.
  25. Bertermann, D.; Rammler, M. Suitability of Screened Monitoring Wells for Temperature Measurements Regarding Large-Scale Geothermal Collector Systems. Geosciences 2022, 12, 162. [Google Scholar] [CrossRef]
  26. DIN EN ISO 17892-4; Geotechnical Investigation and Testing—Laboratory Testing of Soil—Part 4: Determination of Particle Size Distribution (ISO 17892-4:2016); German Version EN ISO 17892-4:2016. Beuth Verlag GmbH: Berlin, Germany, 2017.
  27. Beyer, W. Zur Bestimmung der Wasserdurchlässigkeit von Kiesen und Sanden aus der Kornverteilungskurve. WWT 1964, 14, 165–168. [Google Scholar]
  28. Hazen, A. Some physical properties of sands and gravels with special reverence to their use in filtration. In Massachusetts State Board of Health 24th Annual Report; Massachusetts State Board of Health: Boston, MA, USA, 1892; pp. 539–556. [Google Scholar]
  29. Kaubisch, M. Zur Indirekten Ermittlung Hydrogeologischer Kennwerte von Kippenkomplexen, Dargestellt am Beispiel des Braunkohlenbergbaus. Ph.D. Thesis, Bergakademie Freiberg, Freiberg, Germany, 1986. [Google Scholar]
  30. Seelheim, F. Methoden zur Bestimmung der Durchlässigkeit des Bodens. Z. Anal. Chem. 1880, 19, 387–418. [Google Scholar] [CrossRef]
  31. Diersch, H.-J.G. FEFLOW Finite Element Modeling of Flow, Mass and Heat Transport in Porous and Fractured Media; Springer: Berlin/Heidelberg, Germany, 2014; p. 996. [Google Scholar]
  32. Mualem, Y. A new model for predicting the hydraulic conductivity of unsaturated porous media. Water Resour. Res. 1976, 12, 513–522. [Google Scholar] [CrossRef]
  33. Van Genuchten, M.T. Calculating the Unsaturated Hydraulic Conductivity with a New Closed-Form Analytical Model; Technical report 78-WR-08; Princeton University: Princeton, NJ, USA, 1978. [Google Scholar]
  34. van Genuchten, M.T. A Closed-form Equation for Predicting the Hydraulic Conductivity of Unsaturated Soils. Soil Sci. Soc. Am. J. 1980, 44, 892–898. [Google Scholar] [CrossRef]
  35. Peters, A.; Durner, W. Simplified evaporation method for determining soil hydraulic properties. J. Hydrol. 2008, 356, 147–162. [Google Scholar] [CrossRef]
  36. Peters, A.; Iden, S.C.; Durner, W. Revisiting the simplified evaporation method: Identification of hydraulic functions considering vapor, film and corner flow. J. Hydrol. 2015, 527, 531–542. [Google Scholar] [CrossRef]
  37. Schindler, U. Ein Schnellverfahren zur Messung der Wasserleitfähigkeit im teilgesättigten Boden an Stechzylinderproben. Arch. Acker Pflanzenbau Bodenkd. 1980, 24, 1–7. [Google Scholar]
  38. KA5. Manual of Soil Mapping, 5th ed.; Bundesanstalt für Geowissenschaften und Rohstoffe: Hannover, Germany, 2005. [Google Scholar]
  39. Hölting, B.; Coldewey, W.G. Hydrogeology, 1st ed.; Springer: Berlin/Heidelberg, Germany, 2019; p. 357. [Google Scholar]
  40. Mace, A.; Rudolph, D.L.; Kachanoski, R.G. Suitability of Parametric Models to Describe the Hydraulic Properties of an Unsaturated Coarse Sand and Gravel. Groundwater 1998, 36, 465–475. [Google Scholar] [CrossRef]
  41. Luckner, L.; Van Genuchten, M.T.; Nielsen, D.R. A consistent set of parametric models for the two-phase flow of immiscible fluids in the subsurface. Water Resour. Res. 1989, 25, 2187–2193. [Google Scholar] [CrossRef]
  42. Schaap, M.G.; Leij, F.J. Improved Prediction of Unsaturated Hydraulic Conductivity with the Mualem-van Genuchten Model. Soil Sci. Soc. Am. J. 2000, 64, 843–851. [Google Scholar] [CrossRef]
  43. Van Genuchten, M.; Nielsen, D.R. On Describing and Predicting the Hydraulic Properties of Unsaturated Soils. Ann. Geophys. 1985, 3, 615–628. [Google Scholar]
  44. Allen, R.; Smith, M.; Pereira, L.; Perrier, A. An update for the calculation of reference evaporation. ICID Bull. 1994, 43, 35–93. [Google Scholar]
  45. ATV-DVWK-M 504:2002-09; Verdunstung in Bezug zu Landnutzung, Bewuchs und Boden. Beuth Verlag GmbH: Hennef, Germany, 2002.
  46. Monteith, J.L. Evaporation and Environment. Symp. Soc. Exp. Biol. 1965, 19, 205–234. [Google Scholar] [PubMed]
  47. Hydrologie in Hessen, Heft 23. In Gewässerkundlicher Jahresbericht 2020; Hessisches Landesamt für Naturschutz, Umwelt und Geologie: Wiesbaden, Germany, 2021.
  48. Hydrologie in Hessen, Heft 24. In Gewässerkundlicher Jahresbericht 2021; Hessisches Landesamt für Naturschutz, Umwelt und Geologie: Wiesbaden, Germany, 2022.
  49. Kopp, B.; Baumeister, C.; Gudera, T.; Hergesell, M.; Kampf, J.; Morhard, A.; Neumann, J. Changes in soil water balance and groundwater recharge in Baden-Wurttemberg, Bavaria, Rhineland-Palatinate and Hesse from 1951 to 2015. HyWa 2018, 62, 62–67. [Google Scholar] [CrossRef]
  50. Thurner, F. Auswirkung Des Skelettanteils auf Die Thermische Leitfähigkeit von Böden. Master’s Thesis, Friedrich-Alexander-Universität Erlangen-Nürnberg, Erlangen, Germany, 2022. [Google Scholar]
  51. Zhao, X.; Zhou, G.; Jiang, X. Measurement of thermal conductivity for frozen soil at temperatures close to 0 °C. Measurement 2019, 140, 504–510. [Google Scholar] [CrossRef]
  52. Menberg, K.; Steger, H.; Zorn, R.; Reuß, M.; Pröll, M.; Bayer, P.; Blum, P. Bestimmung der Wärmeleitfähigkeit im Untergrund durch Labor- und Feldversuche und anhand theoretischer Modelle. Grundwasser 2013, 18, 103–116. [Google Scholar] [CrossRef]
  53. Huber, H.; Arslan, U.; Sass, I. Zum Einfluss der Filtergeschwindigkeit des Grundwassers auf die effektive Wärmeleitfähigkeit. Grundwasser 2014, 19, 173–179. [Google Scholar] [CrossRef]
Figure 1. (a) Test site and location of monitoring wells B1 to B6, measuring points with moisture sensors and exemplary groundwater elevation contour lines from groundwater table measurements taken on 7 April 2021, given in meters above sea level (m a.s.l.), adapted from Rammler et al. [22]; (b) exaggerated schematic cross-section through the collector area with stratigraphic units to illustrate the different distances of the groundwater level (GWL) to the collector layers (LSC) at 1.5 m and 2.9 m b.g.l. The location of the cross-section is shown in Figure 1a. Here, valley deposits include topsoil and agriculturally influenced soil.
Geosciences 13 00251 g001
Figure 2. Continuously recorded and manually measured groundwater levels in meters below ground level (m b.g.l.) and their location relative to the LSC layers. According to current knowledge, it is unclear what the temporary short-term stronger fluctuations in B5 can be attributed to. Surface influences could be a possible cause. Also shown are time periods 1 and 2, which were used for the simulations. Period 1 ranges from 1 January 2020, to 6 February 2023. Period 2, from 3 February 2022, to 2 February 2023, was repeated cyclically in the simulations. Data gaps were linearly interpolated. For a smoother transition when repeating the annual course of period 2, the first 20 days of groundwater levels were linearly interpolated. Moisture contents were recorded beginning on 7 November 2021.
Geosciences 13 00251 g002
Figure 3. Schematic model setup for quasi-one-dimensional FEFLOW® simulations. Boundary condition (BC) time series were implemented in a daily interval.
Geosciences 13 00251 g003
Figure 4. Observed and simulated moisture contents (θ) before (“simulated” for scenario A) and after parameter estimation of the loam/gravel layer with FePEST (scenarios A and B) starting on 7 November 2021, at (a) 1.5 m b.g.l., (b) 2.2 m b.g.l. and (c) 2.9 m b.g.l. Also shown is the root mean square error (RMSE) comparing simulated and observed values. Partly due to only minor differences between scenarios A and B, the corresponding lines largely overlap.
Geosciences 13 00251 g004
Figure 5. Observed and simulated moisture contents (θ) starting on 7 November 2021, at (a) 1.5 m b.g.l., (b) 2.2 m b.g.l. and (c) 2.9 m b.g.l. at “mLSC”. Also shown is the root mean square error (RMSE) when comparing simulated and observed values. In addition, the soil temperature recorded by the temperature sensors is shown for each depth. The time period in which the soil was partially frozen and that was not considered in the RMSE calculation is indicated by the dashed lines. Partly due to only minor differences between scenarios A and B, the corresponding lines largely overlap.
Geosciences 13 00251 g005
Figure 6. (ad) Simulated moisture contents using cyclic time period 2 after establishing an annual equilibrium for scenario A and (eh) the difference in the simulated moisture contents for scenario A (θA) and scenario B (θB) at monitoring wells B1 to B5 and their specific groundwater levels and soil structures at the depths 1.5 m, 2.2 m, 2.9 m and 3.4 m b.g.l. Time = 0 corresponds to January 01.
Geosciences 13 00251 g006
Figure 7. Comparison of distances present at 1.5 m, 2.2 m, 2.9 m and 3.4 m b.g.l. at B1 to B5 to median groundwater level (GWLmed) with median moisture contents (θmed) for scenarios A and B and for different fine-grained soil texture classes. Additionally shown are trend lines of power functions with an indication of the coefficient of determination (R2).
Geosciences 13 00251 g007
Figure 8. Comparison of the maximum range of annual variation in moisture content (Δθ) for different sub-domains considering scenarios A and B with the median moisture content (θmed). In addition, linear trend lines indicating Pearson’s correlation coefficient (r) are shown. Therefore, only fine-grained soil layers were considered.
Geosciences 13 00251 g008
Figure 9. (ad) Thermal conductivities derived from the simulated moisture contents with the equations from Table 5 for scenario A and (eh) the difference in the derived thermal conductivities for scenario A (λA) and scenario B (λB) at monitoring wells B1 to B5 and their specific groundwater levels and soil structures at the depths 1.5 m, 2.2 m, 2.9 m and 3.4 m b.g.l. Only fine-grained silty layers are considered for (ad). Time = 0 corresponds to January 01.
Geosciences 13 00251 g009
Figure 10. Thermal conductivities derived from the simulated moisture contents with the equations from Table 5 for (a) scenario A and (b) scenario B at monitoring wells B1 to B5 and their specific groundwater levels and soil structures at 3.4 m b.g.l. considering fine-grained silts and the loam/gravel layer. Time = 0 corresponds to January 01.
Geosciences 13 00251 g010
Figure 11. Comparison of distances at 1.5 m, 2.2 m, 2.9 m and 3.4 m b.g.l. at B1 to B5 to the median groundwater level (GWLmed) with the median thermal conductivity (λmed) for scenarios A and B and fine-grained soil texture classes. Additionally shown are trend lines of power functions with an indication of the coefficient of determination (R2).
Geosciences 13 00251 g011
Figure 12. Comparison of the maximum range of annual variation in thermal conductivities (Δλ) for different sub-domains considering scenarios A and B with the median thermal conductivity (λmed). In addition, linear trend lines indicating Pearson’s correlation coefficient (r) are shown. Therefore, only fine-grained soil layers were considered.
Geosciences 13 00251 g012
Table 1. Description and data specifications of the sensors used for the moisture content and temperature measurements in the soil and the groundwater level (GWL) and groundwater temperature measurements in the monitoring wells.
DomainParameterSensorAccuracyRange
SoilMoisture contentHD3910.1 (DeltaOHM)±3%0% to 100%
Temperaturefour-wire Pt1000 (GTF 101 P-OKH)±0.4% of the measured value−25 °C to +70 °C
GroundwaterTemperatureP-Sense320±0.2 °C0 °C to 70 °C
GWL±0.5%0 to 1 bar
Table 2. Lower boundaries of the layers in meters below ground level in the simplified model structure for the individual models. The gravelly loam or loamy gravel layer (“loam/gravel”) is stratigraphically assigned to the bench gravel, except for B4, which is a layer already found in the Quaternary valley deposits according to the drilled soil material. Besides topsoil, all simulated layers are labeled according to the soil texture class assumed or determined on site.
LayerReferencemLSC 1B1B2B3B4B5
Topsoil0.200.300.250.400.350.250.25
Silt loam1.000.900.800.800.751.250.80
Silty clay loam1.801.651.301.601.801.851.85
Silt loam2.804.506.404.604.103.003.30
Loam/gravel3.205.257.005.704.804.403.60
Gravel5.507.408.507.306.207.805.80
1 Average values of B1, B2, B3 and B4.
Table 3. The material properties assigned in FEFLOW®. For the layers’ topsoil, silt loam and silty clay loam, the results of HYPROP® measurements were used.
Layerk0 [m/d]Porosity 1Ss 1Srα [1/m]n
Topsoil0.0200.501.000.000.3851.328
Silt loam0.0800.421.000.001.1601.232
Silty clay loam0.0310.471.000.000.6841.248
Loam/gravel0.625 20.41 31.000.00 47.010 21.246 2
Gravel43.200 50.30 61.000.00 424.400 72.494 7
1 Simplified assumption that porosity corresponds to the maximum moisture content at saturation (θs). 2 k0, α and n taken from DIN 4220:2020-11 [14] for slightly clayey loam according to KA5 [38] based on a grain size analysis of the gravelly loam at B6. 3 Maximum recorded value of moisture content at saturated state at 2.9 m b.g.l. at “Reference”. 4 Simplified assumption. 5 Average value from evaluated pumping tests. 6 Medium porosity for sandy gravel according to Hölting and Coldewey [39]. 7 α and n for exemplary gravel according to Mace et al. [40].
Table 4. Scenarios A and B considering different surface influences for time period 2 (and for time period 1 in 2022 and 2023). In scenario A, a surface runoff of 20% of the precipitation was considered. For scenario B, 30% of the precipitation was assumed to be surface runoff.
ScenarioPrecipitation Rate
[mm/a]
Evapotranspiration Rate
[mm/a]
Surface Runoff Rate
[mm/a]
Groundwater Recharge Rate
[mm/a]
A569339114116
B56933917159
Table 5. Calculation equations of thermal conductivities (λ) using moisture content (θ) or saturation (S) for different depths and soil texture classes based on the thermal conductivity measurements shown in Figure A2. Also shown is the bulk density of the soil samples (ρb) during the measurement. For the thermal conductivity of the fine-grained soils, only the moisture range >0.15 cm3/cm3 was considered. No grain size analysis is available for the silt loam soil sample, but it is assumed to be the same soil texture class. For the loam/gravel layer, λ is calculated based on saturation, since the bulk density might differ significantly from the value considered in the simulations.
Depth [m b.g.l.]Layerρb [g/cm3]Calculation Equation
1.5Silty clay loam1.28λ = 1.24∙θ + 0.84
1.5–3.4Silt loam1.49λ = 1.91∙θ + 0.91
3.4Loam/gravel1.81λ = −1.13∙S2 + 2.68∙S + 0.81
Table 6. Material properties for the loam/gravel layer after parameter estimation with FePEST. Although the transition zone is very heterogeneous at the test site, for simplification, the estimated material properties were assumed for each considered measuring point or monitoring well.
Layerk0 [m/d]PorositySsSrα [1/m]n
Loam/gravel1.3660.411.000.004.0002.189
Table 7. Maximum differences (Δmax) in moisture content (θ) and thermal conductivity (λ) at the LSC site with respect to different main influencing factors. Here, median values are referred to, except for seasonal variations.
Influence FactorExpressed byΔmax (θ)
[cm3/cm3]
Δmax (λ)
[W/(m∙K)]
GroundwaterSpatial difference at the same depth for the same fine-grained soil texture class0.070.14
Annual variation in fine-grained soils0.080.14
Annual variation in loam/gravel layer at 3.4 m b.g.l.0.300.92
Soil
texture
Difference between silt loam and silty clay loam at 1.5 m b.g.l.0.090.21
Difference between silt loam and loam/gravel layer at 3.4 m b.g.l.0.170.82
Disclaimer/Publisher’s Note: The statements, opinions and data contained in all publications are solely those of the individual author(s) and contributor(s) and not of MDPI and/or the editor(s). MDPI and/or the editor(s) disclaim responsibility for any injury to people or property resulting from any ideas, methods, instructions or products referred to in the content.

