

Basin Structure for Earthquake Ground Motion Estimates in Urban Los Angeles Mapped with Nodal Receiver Functions

1
Department of Geology and Geophysics, Louisiana State University, Baton Rouge, LA 70803, USA
2
Department of Geosciences, University of Arizona, Tucson, AZ 85721, USA
3
Seismological Laboratory, California Institute of Technology, Pasadena, CA 91125, USA
*
Author to whom correspondence should be addressed.
Geosciences 2023, 13(11), 320; https://doi.org/10.3390/geosciences13110320
Submission received: 28 August 2023
/
Revised: 1 October 2023
/
Accepted: 10 October 2023
/
Published: 24 October 2023
(This article belongs to the Special Issue Advances in Seismic Hazard Assessment)
Abstract
:We constrained sedimentary basin structure using a nodal seismic array consisting of ten dense lines that overlie multiple basins in the northern Los Angeles area. The dense array consists of 758 seismic nodes, spaced ~250–300 m apart along linear transects, that recorded ground motions for 30–35 days. We applied the receiver function (RF) technique to 16 teleseismic events to investigate basin structure. Primary basin-converted phases were identified in the RFs. A shear wave velocity model produced in a separate study using the same dataset was incorporated to convert the basin time arrivals to depth. The deepest part of the San Bernardino basin was identified near the Loma Linda fault at a depth of 2.4 km. Basin depths identified at pierce points for separate events reveal lateral changes in basin depth across distances of ~2–3 km near individual stations. A significant change in basin depth was identified within a small distance of ~4 km near the San Jacinto fault. The San Gabriel basin exhibited the largest basin depths of all three basins, with a maximum depth of 4.2 km. The high lateral resolution from the dense array helped to reveal more continuous structures and reduce uncertainties in the RFs interpretation. We discovered a more complex basin structure than previously identified. Our findings show that the basins’ core areas are not the deepest, and significant changes in basin depth were observed near some faults, including the San Jacinto fault, Fontana fault, Red Hill fault and Indian Hill fault.
1. Introduction
The shape and structure of a sedimentary basin can significantly affect how seismic waves are amplified and transmitted through the Earth, potentially leading to variations in ground shaking intensity and seismic wave propagation patterns. Basins can increase the anticipated seismic hazard from an earthquake by amplifying seismic waves within the sedimentary fill [1,2]. Various aspects of seismic wave propagation in a basin include slower seismic waves within the basin, the development of multiple arrivals and surface waves, the focusing and trapping of seismic energy within the basin, and the channeling of seismic energy by basin structures [3,4,5,6]. The duration of strong shaking is an important contributor to damage during an earthquake [7]. Surface waves, which are responsible for prolonged ground shaking duration, can be generated at the basin edge by the conversion of body waves [8]. These low-velocity surface waves, scattered back into the basin from irregular basin margins, can increase the duration and amplitude of shaking within the basin [1]. The effects of focusing and defocusing in the basin and corresponding amplitude variations due to lateral changes in structure have been studied [4]. These effects can contribute to the amplification of seismic signals inside the basin.
Ground motion simulation is a popular method used to estimate the ground shaking hazard during an earthquake [3,9]. To understand the impact of basins on ground motions during an earthquake, it is essential to have a precise and accurate understanding of the structure and physical properties of the basin. Our study area encompasses multiple sedimentary basins in northern Los Angeles—San Bernardino, Chino, and San Gabriel—which are located in the vicinity of the southern segment of the ~1300 km long right-lateral San Andreas fault (Figure 1a). The fault has been identified in seismic hazard assessments as the most likely source for a very large earthquake in Southern California [10,11]. Ground motion simulations reveal that these basins are responsible for the longer duration of strong ground shaking during previous earthquakes, such as the 1999 Mw 7.1 Hector Mine and 2001 Mw 4.63 Big Bear Lake earthquakes [12,13]. It has also been shown that a waveguide channels seismic energy from the San Andreas fault into the Los Angeles basin [14].
To image the structure of the San Gabriel, Chino, and San Bernardino basins for future incorporation into ground motion simulations, the Basin Amplification Seismic INvestigation (BASIN) study was conducted across these basins. The BASIN project is a multipart earthquake hazard initiative that aims to characterize seismic wave amplification within these basins [19]. Data were collected using dense linear nodal seismic arrays. This paper presents the basin structure along the BASIN seismic lines interpreted from teleseismic RFs. A previous study has shown that the nodal seismic waveforms recorded by the BASIN array have enough bandwidth to produce comparable RFs to those from broadband stations [20]. Other studies have been and are being carried out using the BASIN nodal dataset, including a Bayesian array-based Coherent Receiver Function (CRF) study [21], an ambient noise shear wave velocity model [22], and a 3D seismic attenuation model based on local earthquake recordings [23]. A 3D model for the three basins has been developed using the RF results from this study, the CRF results, an ambient noise velocity model, and gravity data [24]. While the 3D basin model utilized a blend of these findings, this paper presents a detailed RF investigation based on multiple events that employs a uniform interpretation methodology throughout the basins.
Several studies have been previously conducted to characterize basin structure in this region using various geophysical approaches, including active source seismic reflection and refraction, borehole measurements, and gravity and magnetic modeling [16,25,26,27,28]. Seismic reflection is a popular method, but it is challenging to constrain the deeper parts of the basin from seismic reflection data due to the low signal-to-noise ratio (SNR) and limited depth of penetration. Active source surveys are less suitable in densely populated urban areas, not only because of their high cost but also due to permit requirements and restrictions. Additionally, these studies had limitations where seismic arrays were confined to a small and focused area in the basin or sparsely distributed wells, resulting in shallow depth of penetration and low SNR [16,26,28]. Combining gravity and magnetic data with reflection and borehole measurements has proven useful in addressing these limitations [25]. An RF study using short-period seismometers was conducted along a 140 km long profile across the San Andreas fault, but the array did not include stations in the northern Los Angeles basins [29]. Different approaches to imaging crustal structure along the Pacific–North American plate boundary using teleseismic RFs from broadband data have given useful results [30,31]. However, this paper shows that dense arrays of short-period seismic instruments, popularly known as N-arrays, are effective at overcoming the problems associated with the limited distribution of traditional broadband stations.
2. Geologic Setting
The northern Los Angeles basins are part [31] of a complex tectonic region where the Pacific and North American plates meet. The Pacific plate exhibits a northwestward migration rate of approximately 5 cm per year relative to the North American plate, and the movement finds substantial accommodation within the San Andreas Fault zone, attributing a significant seismic contribution to the plate boundary faults’ overall activity [32].
The San Bernardino basin, located in the eastern part of our study area (Figure 1a), is a pull-apart basin sandwiched between two active strike-slip faults: the San Andreas fault to the northeast and the San Jacinto fault zone to the southwest, separated by a distance of 3–10 km from each other [26,33]. The basin is bounded to the north by the San Bernardino mountains, to the southwest by the Peninsular Ranges, and farther to the southeast by Crafton Hills (Figure 1a). The formation of the basin has been significantly influenced by the San Jacinto fault, which has had an average slip rate of 20 mm/year for the past 1.5 million years [25,28]. The San Jacinto fault zone is the most seismically active fault zone in the San Bernardino basin [26]. The northern San Jacinto fault is a strike-slip fault, but earthquake focal mechanisms suggest a region of deep creep [34].
The modern trace of the San Jacinto fault has several right-slip strands, namely, the Glen Helen, Shandin Hill, Lytle Creek, and Rialto-Colton faults [25]. The Rialto-Colton fault is a strand of the San Jacinto fault and has 2 km right-slip offset [25]. The Rialto-Colton fault zone and the northeastern Shandin Hill fault zone also show extensional tectonic activity with normal faulting focal mechanisms [25]. The area between the Rialto-Colton fault to the east and the Indian Hill fault to the west is referred to as the Chino basin in this paper (Figure 1a). The Chino basin is a groundwater basin, and its hydrologic boundary is southwestern San Bernardino County and northwestern Riverside County, which is part of the Santa Ana River watershed [35]. The basin area is bounded to the north by the Cucamonga fault, west by Puente Hills, southwest by the Central Avenue and Chino faults, east-southeast by the Rialto-Colton fault, and south by Jurupa Hills and the Peninsular Ranges [36] (Figure 1a). The Fontana seismicity zone runs through the central part of the basin (Figure 1a). The Cucamonga fault zone has a thrust-slip component with a slip rate of 2–5 mm/year and the Cucamonga-Sierra Madre thrust fault system has the potential of producing > M 7.5 earthquakes [37,38].
The San Gabriel basin, located in the western part of our study area, is bounded by several faults. To the southwest lies the right-slip East Montebello fault; while the Indian Hill fault, the Walnut Creek fault, and the San Jose anticline are located to the east. Adjacent to the right-slip Whittier fault to the southeast is the Puente Hills anticline [37]. The northwestern and northern parts of this triangular-shaped basin are bounded by the left-slip, southward-convex Raymond fault, which may have a dip-slip component, and the Sierra Madre fault zone, respectively [37,39]. The San Jose fault, an active reverse fault with a slip rate of 0.4–0.8 mm/year, bounds the San Jose anticline to the south [37,40]. The East Montebello fault is the northern extension of the Whittier fault with a strike-slip rate of 0.1–0.3 mm/year on one strand [37]. North–south Quaternary convergence has been identified in the San Gabriel basin indicated by the Sierra Madre reverse fault to the north and Puente blind thrust to the south [37].
The lower part of the basement complex beneath the San Bernardino basin is predominantly composed of Pelona schist, which is less dense than the overlying rocks [25]. The upper part consists of prebatholitic crystalline rocks with Mesozoic plutons [33]. The crystalline rocks form the base of the San Bernardino basin, extending eastward from the San Jacinto fault. Schist is exposed near the Shandin Hill area [28] (Figure 1b). To the west of the San Jacinto fault zone, Peninsular Ranges rocks primarily composed of Jurassic and Cretaceous granodiorite, quartz diorite, tonalite, and gabbro are exposed [26]. The most common basement rocks of the Chino basin are Peninsular Ranges, which are exposed to the south of the basin [25,36]. Granitic gneiss is exposed at the eastern end of San Jose Hills (Figure 1b). Gneiss is also exposed to the north of the San Gabriel basin, and granitic rocks are exposed to the south in Puente Hills [37].
The upper part of the Cenozoic basin fill in the San Gabriel basin is predominantly composed of non-marine Pleistocene gravel and sands, while the lower part consists of clay-rich marine sandstone [37]. The contact between the upper and lower parts has been identified at depths between 1.2 and 1.75 km in the basin, marked by a prominent reversal in sonic velocity logs from the Live Oak Park and Ferris boreholes [16] (locations in Figure 1a). The marine sedimentary rocks in the Ferris borehole reveal a low-velocity zone approximately 0.8 km thick at a depth of 1.75 km [16]. In the Chino basin, a series of sedimentary rocks, including consolidated marine and continental conglomerates, sandstones, and siltstones ranging from the Paleocene to the late Miocene to Pliocene, overlie the underlying basement complex [36].
3. Data and Methods
The BASIN nodal seismic array of 758 stations was installed along 10 closely spaced seismic profiles within the greater Los Angeles region [19,20]. Note that 498 of the total nodes were distributed over four lines in the San Gabriel basin, three lines in Chino, and two lines in the San Bernardino basin. These 9 lines (SB2, SB3, SB4, SB5, SB6, SG1, SG2, SG3, and SG4) have 15 to 96 nodal stations, covering distances from 3 km up to 30 km (Figure 1a). The remaining 260 nodes were deployed along a single east–west-oriented line (SB1), covering a total distance of 82 km (Figure 1a). The nodal stations were deployed along the seismic profiles over four different periods between 2017 and 2019, each spanning a duration of 30–35 days, resulting in four distinct sets of teleseismic events recorded by the stations. In these 30–35-day periods, 13–15 earthquakes were recorded with magnitudes greater than 5.5 and epicentral distances from 30° to 90°, making a total number of 55 events recorded by the stations altogether (Table S1).
The teleseismic RF method is a well-established seismological technique used to image crustal structure [31,41,42,43,44]. The RF technique involves two major parts: data processing and RF computation. After gathering the teleseismic event information, waveforms were cut in 3600 s long windows starting from the event origin time, and data were decimated to ≤50 samples/s. Then, the P-onset and pre-event noise windows were picked (waveform examples have been included in the Supplementary Materials, Figure S1). The process includes rotating the horizontal recordings to obtain the radial and the tangential seismograms and estimating the power spectral density (PSD) of the pre-event noise on the vertical, radial, and tangential recordings. For the RF computation, we used the technique developed by Di Bona (1998) [45], which is particularly useful for analyzing single-event RFs by providing an uncertainty estimate which helps to assess the accuracy of the computed RFs. A frequency domain deconvolution was performed using the estimated noise PSD. The high-frequency noise in the RFs was reduced by applying a Gaussian filter. For our analysis, we allowed maximum frequency content from ~1 Hz up to ~3 Hz.
While stacked RFs from multiple events recorded by broadband stations are commonly used to identify crustal and lithospheric discontinuities, stacked RFs from nodal data can eliminate smaller amplitude phases present in individual RFs, which are helpful for interpreting shallow structure such as the sediment–basement interface. Stacking can also reduce the possibility of observing spatial variations in basin depth, which has led to the development of the array-based CRF method that considers nearby stations and produces a single profile of basin depths [21]. However, in regions of laterally varying structure and seismic velocities, individual RFs from linear nodal arrays can provide a detailed representation of the near-receiver structure. An example of stacked RFs from three events for SB2 is included in the Supplementary Materials (Figure S2). The stack was produced using 3 Hz RFs with similar back-azimuthal directions and epicentral distances. Compared to the SB2 profiles of individual RFs (as shown later in this paper), the stacked RFs show less lateral continuity and are more difficult to interpret.
In this study, we therefore analyzed single-event RFs to identify the sediment–basement interface, and the events used in the RF analysis, which are referred to by their event IDs, are listed in Table 1. Estimated Ps pierce points or conversion points at 5 km depth for each event are shown in Figure 2a. Travel times of the basement-converted phases at the respective pierce points provide information on basement topography in a swath near our profiles. In the Results Section 4, we discuss the basin depth variations observed at different pierce points.
To obtain depths from the basin-converted Ps times, we incorporate the 3D shear wave velocity model produced from ambient noise tomography as part of the BASIN project, which has a depth extent of 5 km with values every 50 m [22]. The depth conversion was carried out using the P-wave velocity, Vp, S-wave velocity, Vs, and ray parameter [47]. We estimated the path through the velocity model for each station-event pair using the back-azimuth and epicentral distance. The schematic diagram in Figure 3a shows a 150 m deep velocity model with an incoming wave recorded at the surface. Within each layer, the ray passes through a specific point with a corresponding Vs value (x and y values are latitude, longitude, and Vs values are the model velocity at those points in Figure 3a). We averaged the Vs values across 10 laterally adjacent cells around those points at every 50 m depth interval primarily for smoothing and removing small-scale heterogeneities. There are instances where the model has missing Vs values within the adjacent 10 cells (500 m), and the average is computed with the available values only. Vp was obtained using an empirical equation (Equation (1)), [48]. These velocities were then used in Equation (2) [47] to calculate the estimated P-to-s time relative to the direct P, tPs at different model depths. For each station, we find the estimated tPs that most closely matches the RF tPs for the basement interface, and the corresponding depth is recorded. Figure 3b shows the estimated tPs with depth for station 334 in the SG3 line where the start of the converted phase for the basement is at ~1.1 s in the RF (Figure 3c). The corresponding basin depth is 2150 m for 1.1 s from Figure 3b.
It is important to note that Equation (2) can provide significant differences in estimated thickness (H) for small changes in tPs, as the seismic wave velocities will amplify the effects of even minor changes in Ps timing. The sensitivity of the equation makes it important to have accurate velocity measurements for the time-to-depth conversion approach.
4. Results and Interpretations
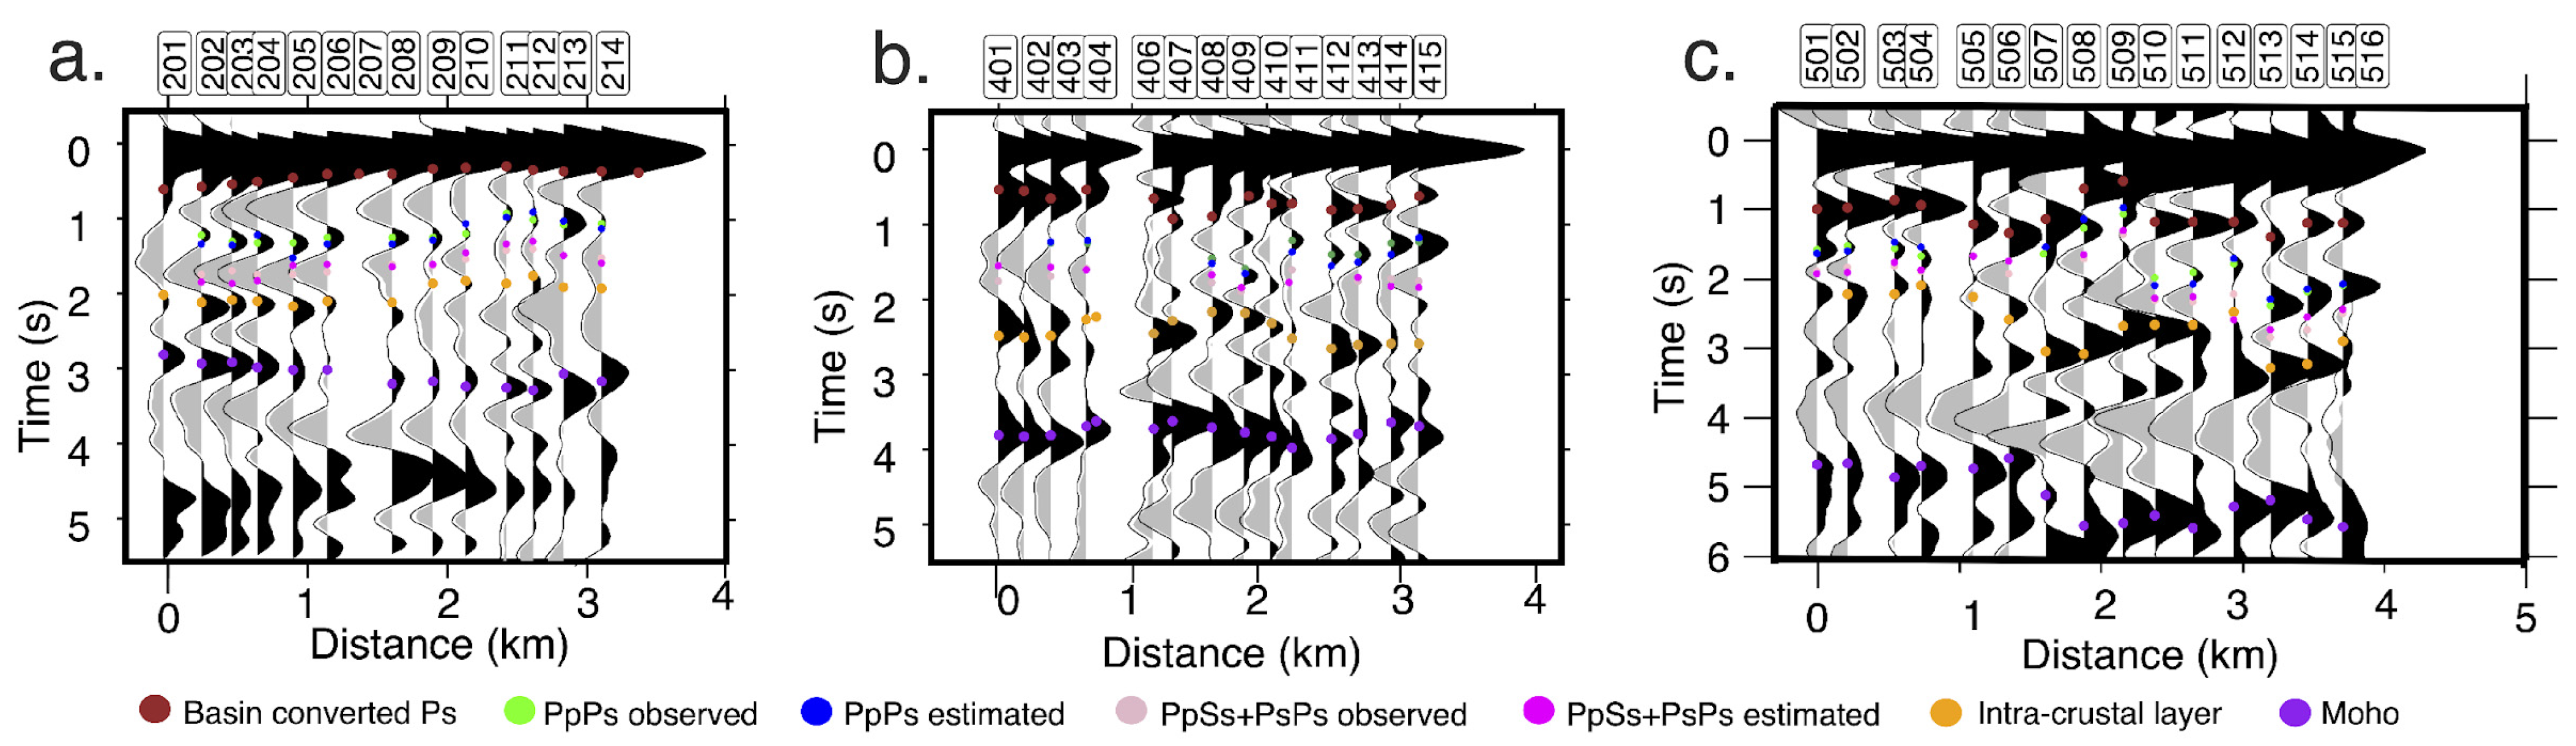
The histograms in Figure 2b depict the number of RFs generated for each linear array. The data reveal that nearly 80% of the stations produced RFs, indicating that a significant portion of the seismic data analyzed in this study was of high quality and useful for the analysis. For our interpretations, we used RFs with maximum frequencies of 1, 2, and 3 Hz. In lower-frequency RFs, two very close phases sometimes merge, and higher-frequency RFs are useful for separating out those phases and identifying shallow structure. The phase right after the direct P arrivals in the RFs is generally interpreted as the Ps conversion from the bottom of the sedimentary basin. While this is the most common scenario, exceptions occur where other conversions from within the basins are present in the RFs and may appear as a positive phase between the direct P and the basement-converted phases. Our interpretations of the basement interface were confirmed by distinguishing the primary Ps-converted phases from the later multiples. PpPs is the positive multiple, and PpSs + PsPs are the negative multiples. The estimated arrival times for these multiples were computed using the following equations [47].
Figure 4 shows the interpreted basement Ps and PpSs + PsPs multiples along three RF profiles in the three basins. The basin-converted Ps phase is marked with brown dots for all three cases. The multiples were identified and marked with green and light pink dots, respectively. We also show the arrival times of PpPs and PpSs + PsPs multiples calculated using Equations (3) and (4), which are shown with blue and pink dots in Figure 4, respectively. The estimated and observed arrival times match, thereby verifying our interpretations. The conversions identified as an intracrustal layer and the Moho in Figure 4 are additional phases visible in the RFs.
In this section, we present one radial RF profile with the interpreted basement-converted phases along with the corresponding depth profile for each line across the San Bernardino, Chino, and San Gabriel basins (Figure 5, Figure 6 and Figure 7). Additional radial RF profiles from other events are included in the Supplementary Materials (Figures S3–S5). The depths were obtained for the Ps times using a velocity model described in the previous section. All depths mentioned in this paper are relative to sea level. The interpretations of two deeper interfaces, an intracrustal layer and the Moho, are shown and discussed in a separate study.
4.1. San Bernardino Basin
The north–south-trending SB2 line, the east–west-trending SB6 line, and 10 stations in the eastern part of the SB1 line are located in the San Bernardino basin (Figure 1a). The 3 Hz RF profiles from the NA event for SB2 and SB6, and the MX event for SB1, are shown in Figure 5 with the interpreted sediment–basement interface.
The northeastern part of the San Bernardino basin is bounded by multiple strands of the San Andreas fault, and to the north, the basement is exposed near the fault. In the northern part of SB2, we identified the basin-converted phase at times ranging from 0.2 to 0.5 s for the NA event. The basin is as shallow as 80 m near station 210 (Figure 5b). The basement interface for the PB event was observed at around 1 s in that area (Supplementary Materials, Figure S3). The pierce points for the PB event are approximately 4 km apart from the NA event; however, we note that all pierce points are estimated for a depth of 5 km. The basin depths of 1700 m and 350 m, respectively, at those two pierce points indicate an estimated apparent basement dip of 18° (Figure 5 and Figure 8b, marked by the dashed rectangle labeled a in the maps).
Figure 5.
3 Hz RF profiles and cross sections showing basin structure along the seismic lines in the San Bernardino basin. (a) SB6; (b) SB2; (c) SB1-SB. The illustration depicting the layers overlaid on the RF profiles serves to enhance visualization. The inset map represents the basin depths at the pierce point for the three RF profiles shown in this figure; purple crosses are the station locations, and the white outline represents the basin boundary. The dashed rectangles in the inset map are discussed further in the text.

There is a ~7 km long northeast–southwest-striking blind fault located in the central part of the basin that cuts across the central part of the SB2 line (Figure 1a). An increase in the basin Ps arrival times was observed passing this point (near station 230) and going south along SB2 (Figure 5b). RFs become more complex in the central to the southern parts of the basin, near the Loma Linda fault and further south near the San Jacinto fault. The deepest part of the basin reaches up to 2.4 km near the northwestern extension of the Loma Linda fault, as observed along the SB2 line from the NA event at 1.3 s, close to station 239 (Figure 5b). The basin depths at stations 239–250 range from ~1.5 km to ~2.4 km based on the NA event. However, basin depths identified at the pierce points for the PB and V events located ~4 km to the south range from ~600 m to ~1.7 km (Figure 5 and Figure 8b, marked by the dashed rectangle b). Further south along SB2, the sediment–basement interface becomes shallow again and reaches 0.7 s (~700 m) near the San Jacinto fault, as observed for the NA event (Figure 5b).
The eastern end of the SB1 line intersects the Rialto-Colton fault and the San Jacinto fault in the San Bernardino basin. The sediment–basement interface between these two faults shows an eastward deepening in the RFs from 0.5 s to 1.1 s near station 1240 (Figure 5c). A similar structure was identified for the CH event where the basin deepens to 1.4 s near station 1241 (Supplementary Materials, Figure S3). The basin is shallow (100–500 m) to the east of the blind fault, as observed at the pierce points for the NA event along the SB6 line (Figure 5b). However, the other two events, PB and V, reveal a ~1 km deeper basin at their corresponding pierce points located further south.
4.2. Chino Basin
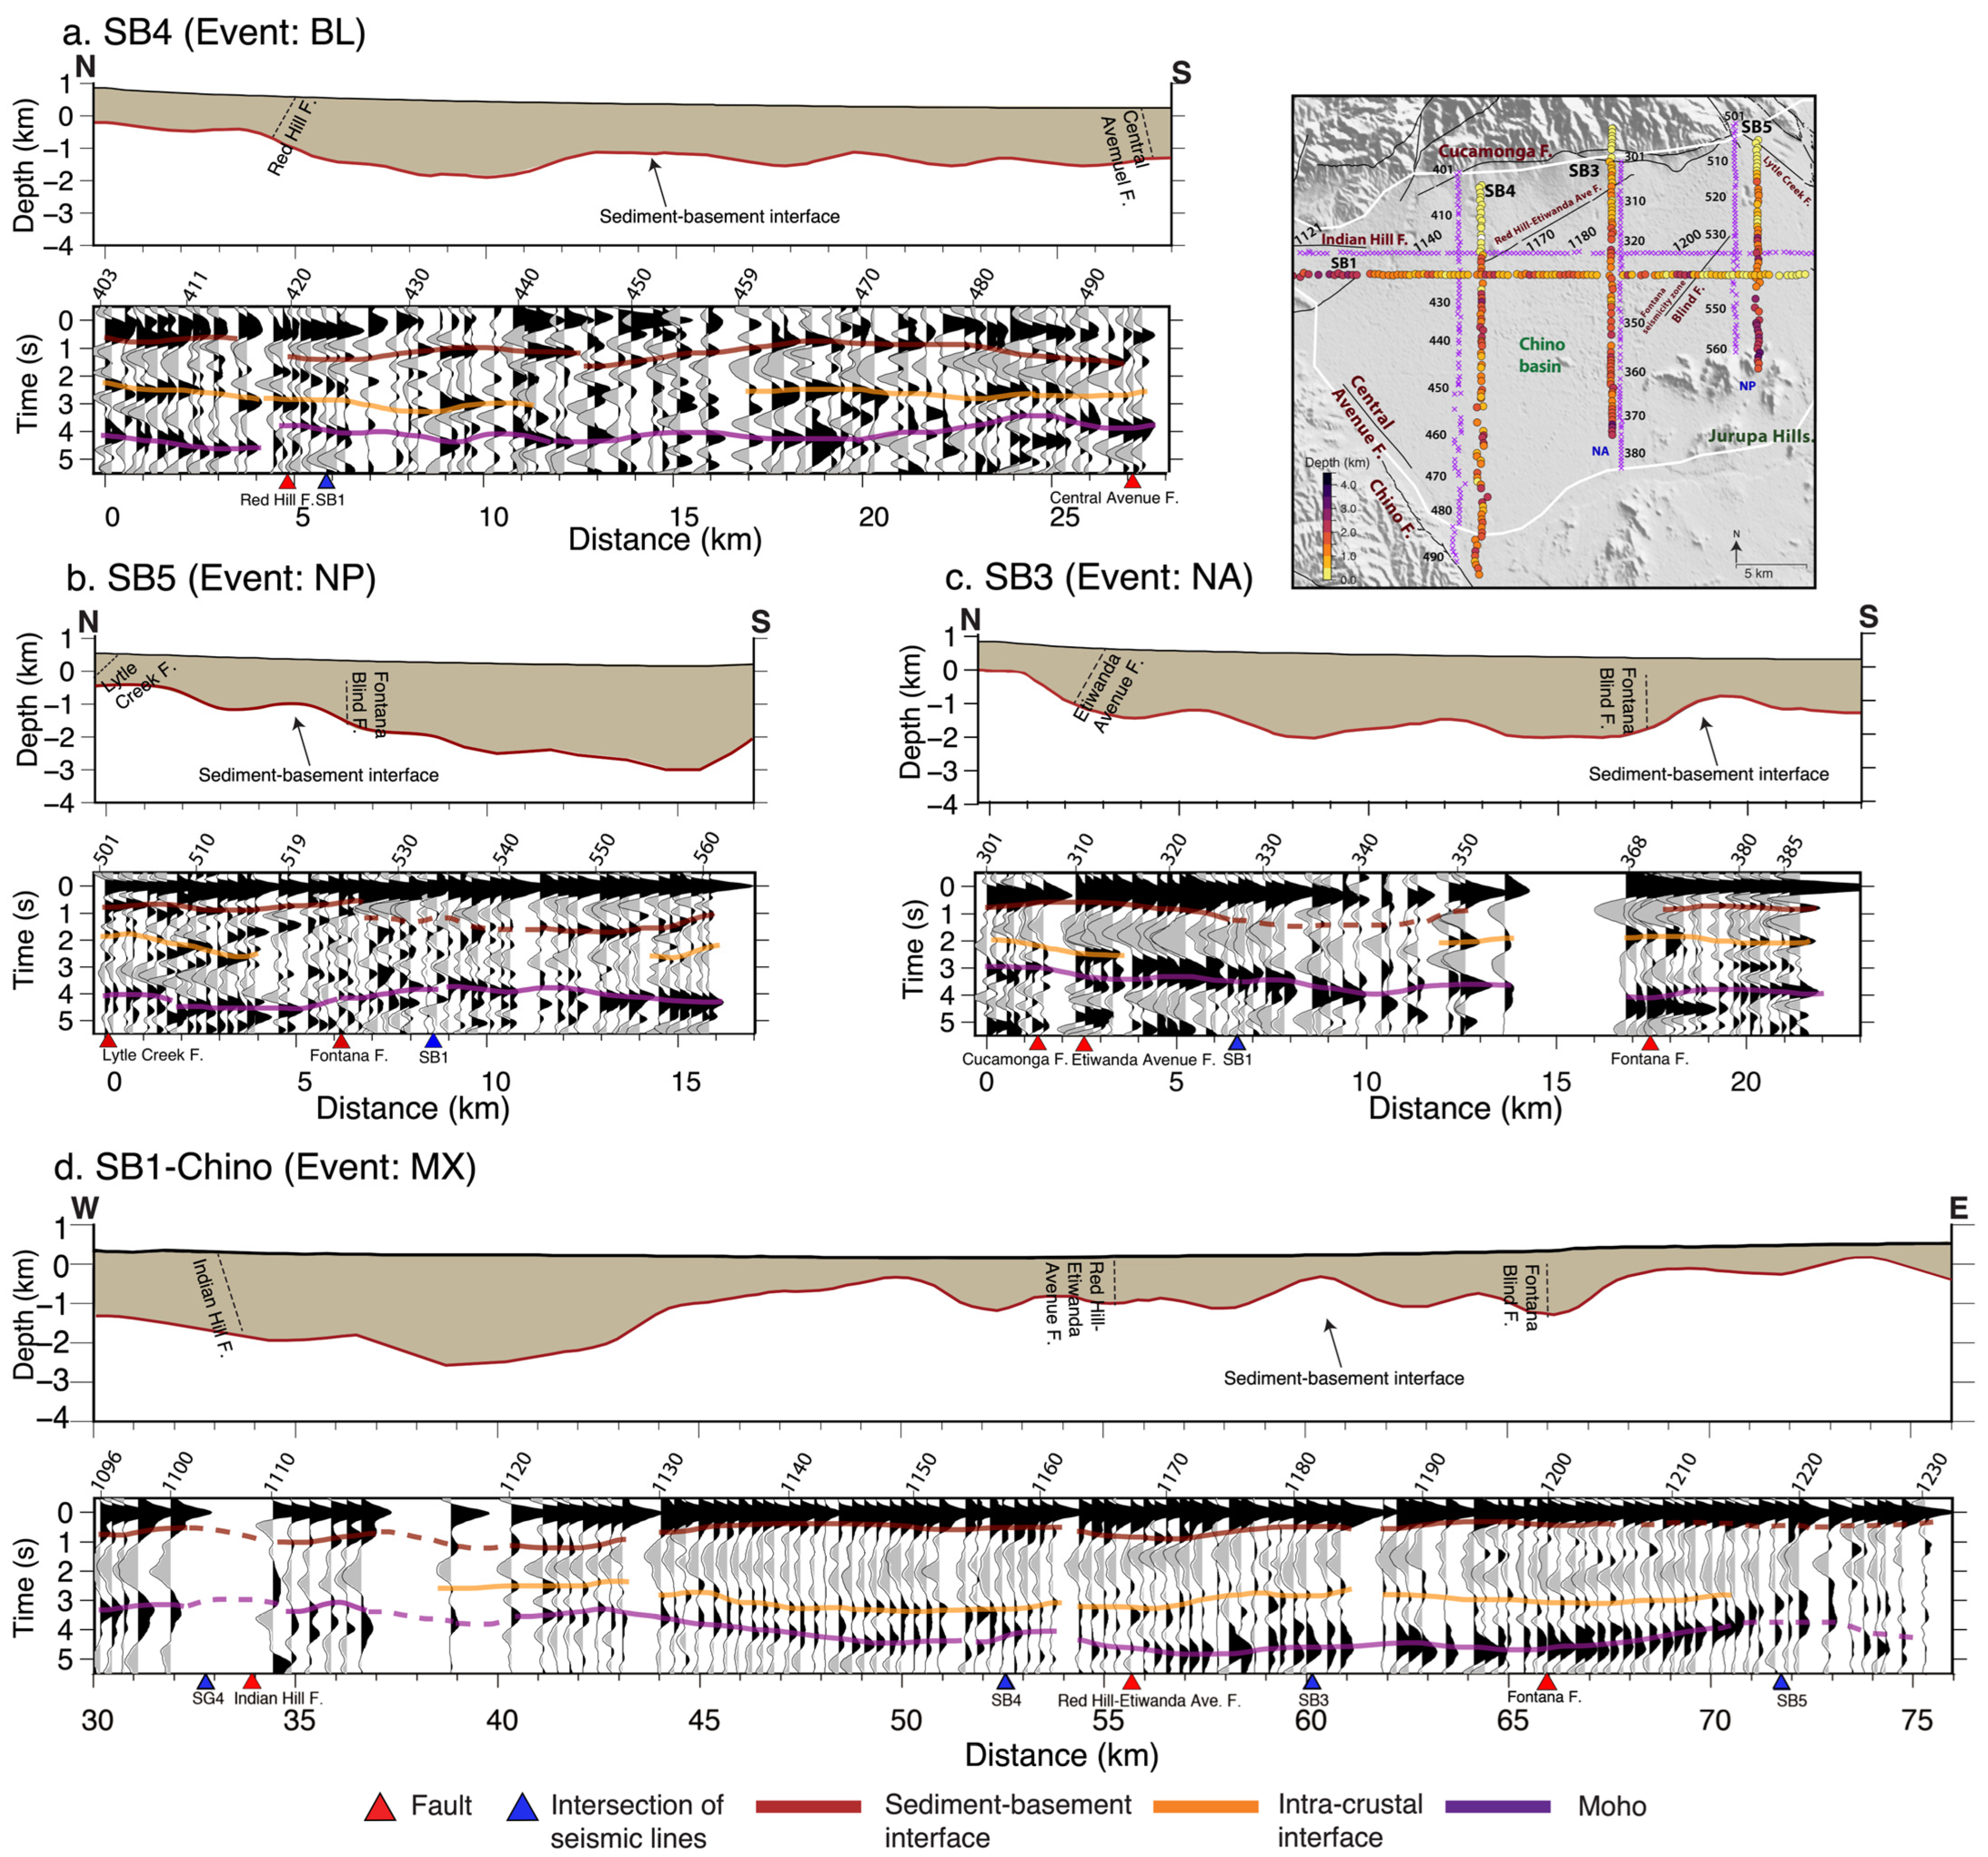
The north–south-oriented SB3, SB4, and SB5 lines and 137 stations along the east–west-oriented SB1 line are located in the Chino basin (Figure 1a). RFs for these four lines were computed for four different sets of events, as they recorded data at different times. The 3 Hz RF profiles from the NA event for SB3, NP for SB5, MX for SB1, and BL for SB4 are shown in Figure 6 with the interpreted sediment–basement interface.
The basement is exposed to the north of the profiles, and the basin depth is as shallow as ~20 m in that area, as observed along the SB3, SB4, and SB5 lines (Figure 6). The minimum arrival time for the basement interface was identified near the Cucamonga fault along SB3 at around 0.3 s for the NA event (Figure 6c). In the northeastern part of the Chino basin, along SB5, the minimum basement interface time is around 0.4 s near the Lytle Creek fault for the NP event (Figure 6b). The northwestern part of the basin exhibits a shallower basement at around 0.5 s, observed at stations located between the Cucamonga and Red Hill faults along SB4 for the BL event (Figure 6a). In Figure 1, the surface trace of the Rialto-Colton fault ends to the south of SB1; however, some studies suggest that the fault extends all the way to the north, and intersects with, the Cucamonga fault [25]. In that case, the fault would intersect the SB5 line near station 520. A shallower basin at ~0.6 s was observed near station 520 (Figure 6b). This area is also close to the approximately 25 km long Fontana blind fault in the central Chino basin and is associated with the Fontana seismicity zone that crosses the SB5 line.
The Red Hill–Etiwanda Avenue fault intersects the pierce points for the BL event along the SB4 line near station 420, where a sudden deepening from 0.5 s to 1 s in the basement was identified (Figure 6a). A phenomenon of the Moho becoming shallower and the basin becoming deeper was observed in the southern part of the SB4 line, near the Central Avenue fault (Figure 6a), which was also observed in the Los Angeles basin [30].
The eastern part of the basin deepens from north to south, close to the Jurupa Hills. The deepest point in the basin along SB5 was observed at ~3 km, located to the north of Jurupa Hills, near station 558 (Figure 6b). Within a short distance of ~4 km near stations 545–558 along SB5, basin depths range from ~1.6 km to ~3 km (Figure 6b). SB3 shows a gradual southward deepening of the basin, with the largest depth of 3.3 km in the central basin. For SB3, the NA event was recorded by most stations along the entire line, while only 20 stations to the south recorded the PB and V events. All three events showed a consistent pattern in basin depths to the south. To the north along SB3, the stations near the Cucamonga and Red Hill–Etiwanda Ave. faults show a basin depth variation of ~1 km within a very small (~1 km) profile distance (Figure 6c). A similar basin depth variation was observed along SB4 near those faults across an ~5 km profile distance (Figure 6a).
Figure 6.
3 Hz RF profiles and cross sections showing basin structure along the seismic lines in the Chino basin. (a) SB4; (b) SB5; (c) SB3; (d) SB1-Chino. The illustration depicting the layers overlaid on the RF profiles serves to enhance visualization. The inset map represents the basin depths at the pierce point for the three RF profiles shown in this figure; purple crosses are the station locations, and the white outline represents the basin boundary.
4.3. San Gabriel Basin
The seismic array in the San Gabriel basin includes the north–south-oriented SG1, SG3, and SG4 lines, the northwest–southeast-trending SG2 line, and 110 stations located at the western end of the SB1 line (Figure 1a). Figure 7 displays the 3 Hz RF profiles from the NP event for SG3 and SG4, MX for SB1, BL for SG1, and AR for SG2, with the interpreted sediment–basement interface.
Figure 7.
3 Hz RF profiles and cross sections showing basin structures along the seismic lines in the San Gabriel basin. (a) SG3; (b) SG4; (c) SG1; (d) SG2; (e) SB1-SG. The illustration depicting the layers overlaid on the RF profiles serves to enhance visualization. The inset map shows basin depths at the pierce point for the three RF profiles shown in this figure; purple crosses are the station locations, and the white outline represents the basin boundary.
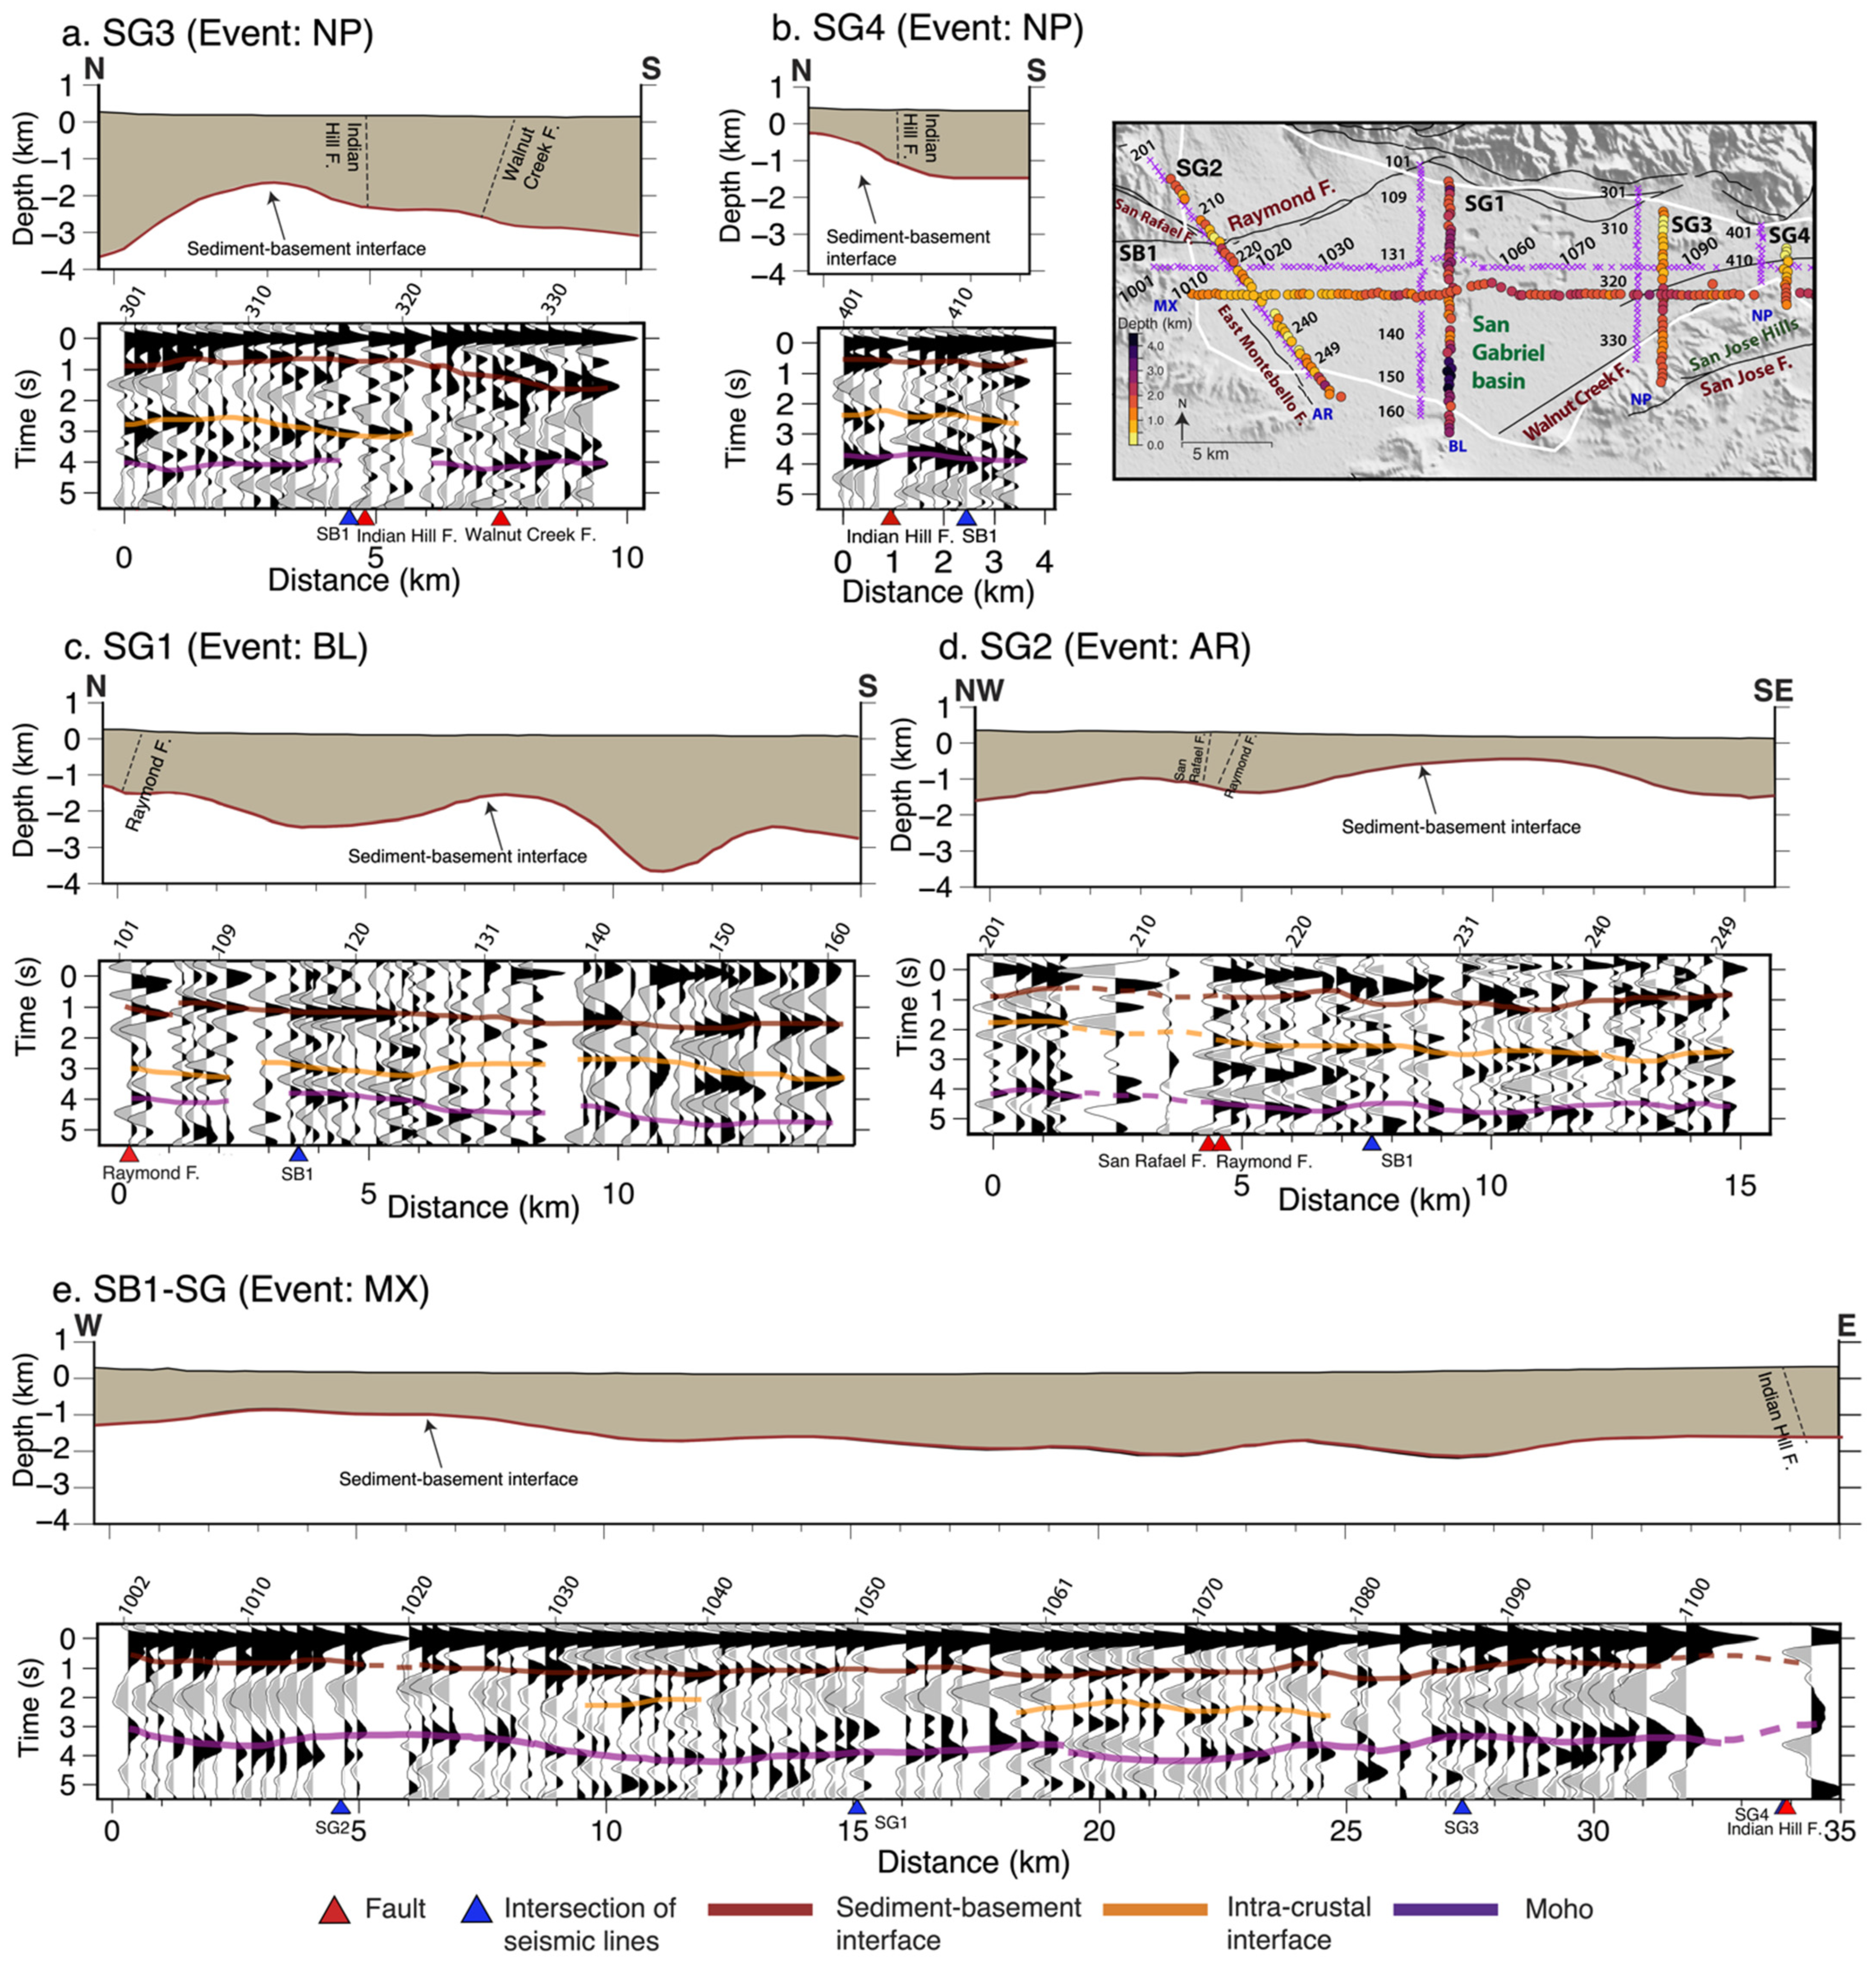
A relatively shallow sediment–basement interface was observed in the western part of the basin along the SG2 line (Figure 7d). The shallowest depth of the basin was identified at around 400 m, and the minimum Ps arrival time was ~0.4 s for the AR event along the SG2 line (Figure 7d).
The two easternmost lines of the San Gabriel basin, SG3 and SG4, located just west of the Chino basin, show a gradual deepening of the basin southward of the Indian Hill fault (Figure 7a,b). Along SG4, the basin is as shallow as 200 m to the north of the Indian Hill fault. Basin depths range from 1 to 2 km across a distance of ~3 km near stations 309–318 along SG3 (Figure 7a). Depths range from 200 m to ~1.7 km across ~4 km along the entire SG4 line. Along SG3, the maximum basement Ps arrival was identified at ~1.5 s to the south of the Walnut Creek fault near station 334 (Figure 7a). The deepest part of the San Gabriel basin was observed at 1.8 s, with a basin depth of around 4 km to the north of Puente Hills, near station 149 along SG1 (Figure 7c).
5. Discussions
Our study documents finer-scale variations in basin depth compared to what was previously identified. The deepest part of the San Bernardino basin was previously thought to be ~1.7 km near the San Jacinto fault, with a vertical displacement of 1.2 km across the fault [28]. Another study also documented the deepest part of the basin in the fault zone (~2 km depth) [25]. The results from our study agree with previous results but show more variability in basin depth. The single-event RFs in the San Bernardino basin gave average depths ranging from ~1 km to ~2 km in the area where the deepest part of the basin was identified from the pierce point locations for the NA and PB/V events near the San Jacinto fault over a distance of ~4 km (Figure 8b, dashed rectangle b). A general southwest dip of the basin across the San Jacinto fault dismissed the previously held idea of a symmetric basin [26,28]. The southwest dip was identified near the intersection of the Loma Linda fault and the SB2 line at 1.1 km depth [49]. The model presented by Anderson et al. (2004) [25] showed that extension is centered over the modern trace of the San Jacinto fault, and normal displacement is around 1 km at that fault-bounded graben area. Our results show consistency with the northern shallow basin, asymmetric shape, and southwest dip.
The CRF study carried out using the BASIN dataset showed a maximum depth of 3 km in the San Bernardino basin along SB2 [21]. That study focused on presenting the CRF methodology rather than the detailed basin structure and used constant Vs and Vp values for the time-to-depth conversions, whereas we incorporated a detailed velocity model for the process. However, the maximum depth was observed at the same location in both studies along the SB2 profile, which is near the Loma Linda fault. Although the general basin shape is the same, our RF interpretations of the basement from the NA event along SB2 are shallower at the northern end (~0.5 s and less with an average depth of ~500 m) and deeper in the south (~1.2 s with an average depth of ~1 km) than what was shown in Wang et al. (2021) [21] (~1 s and ~1.5 km in the north and ~0.5 s and ~500 m in the south). However, the stations to the north in the San Andreas fault zone show notable basin depth variability of ~1–1.5 km, with an apparent basement dip of ~18° between the pierce points for the NA and PB/V events (Figure 8b, dashed rectangle a).
The RFs show a complex pattern from the central to the southern part of SB2, which was discussed in Section 4.1. The Chino basin exhibits relatively shallow depths of ≤ 2 km, with few exceptions in the model of Villa et al. (2023) [24]. Our study identified the largest depths in the Chino basin to be around 3 km, observed near the Jurupa Valley with an average depth of ~2 km to the south of the Fontana seismicity zone observed along SB3 and SB5. The northern part of the basin along SB5 is shallower relative to its southern part, which conflicts with the results of Villa et al. (2023) [24] (Figure 8b). It is noteworthy here that our interpretations are based on the arrival times of the primary Ps phase identified from the RFs and are consistent for all three basins (as shown in Figure 8a). The basin model in Villa et al. (2023) [24] considered this phase to be a multiple of the basin-converted Ps phase in the Chino basin and therefore obtained shallower depths overall. However, the western deeper and eastern shallower pattern across the Chino basin is consistent in both studies and is observed along the SB1 line (Figure 8b).
Figure 8.
Maps showing (a) Ps times for the sediment–basement interface from the RFs and (b) basin depths obtained from those Ps times relative to sea level. The dashed rectangles are discussed further in the text. Both time and depth are plotted at the estimated pierce points for each station in the seismic array. Purple crosses mark the station locations, the colored stars represent known basin depths from Brocher et al. (1998) [16], and the white outline represents the basin boundary.
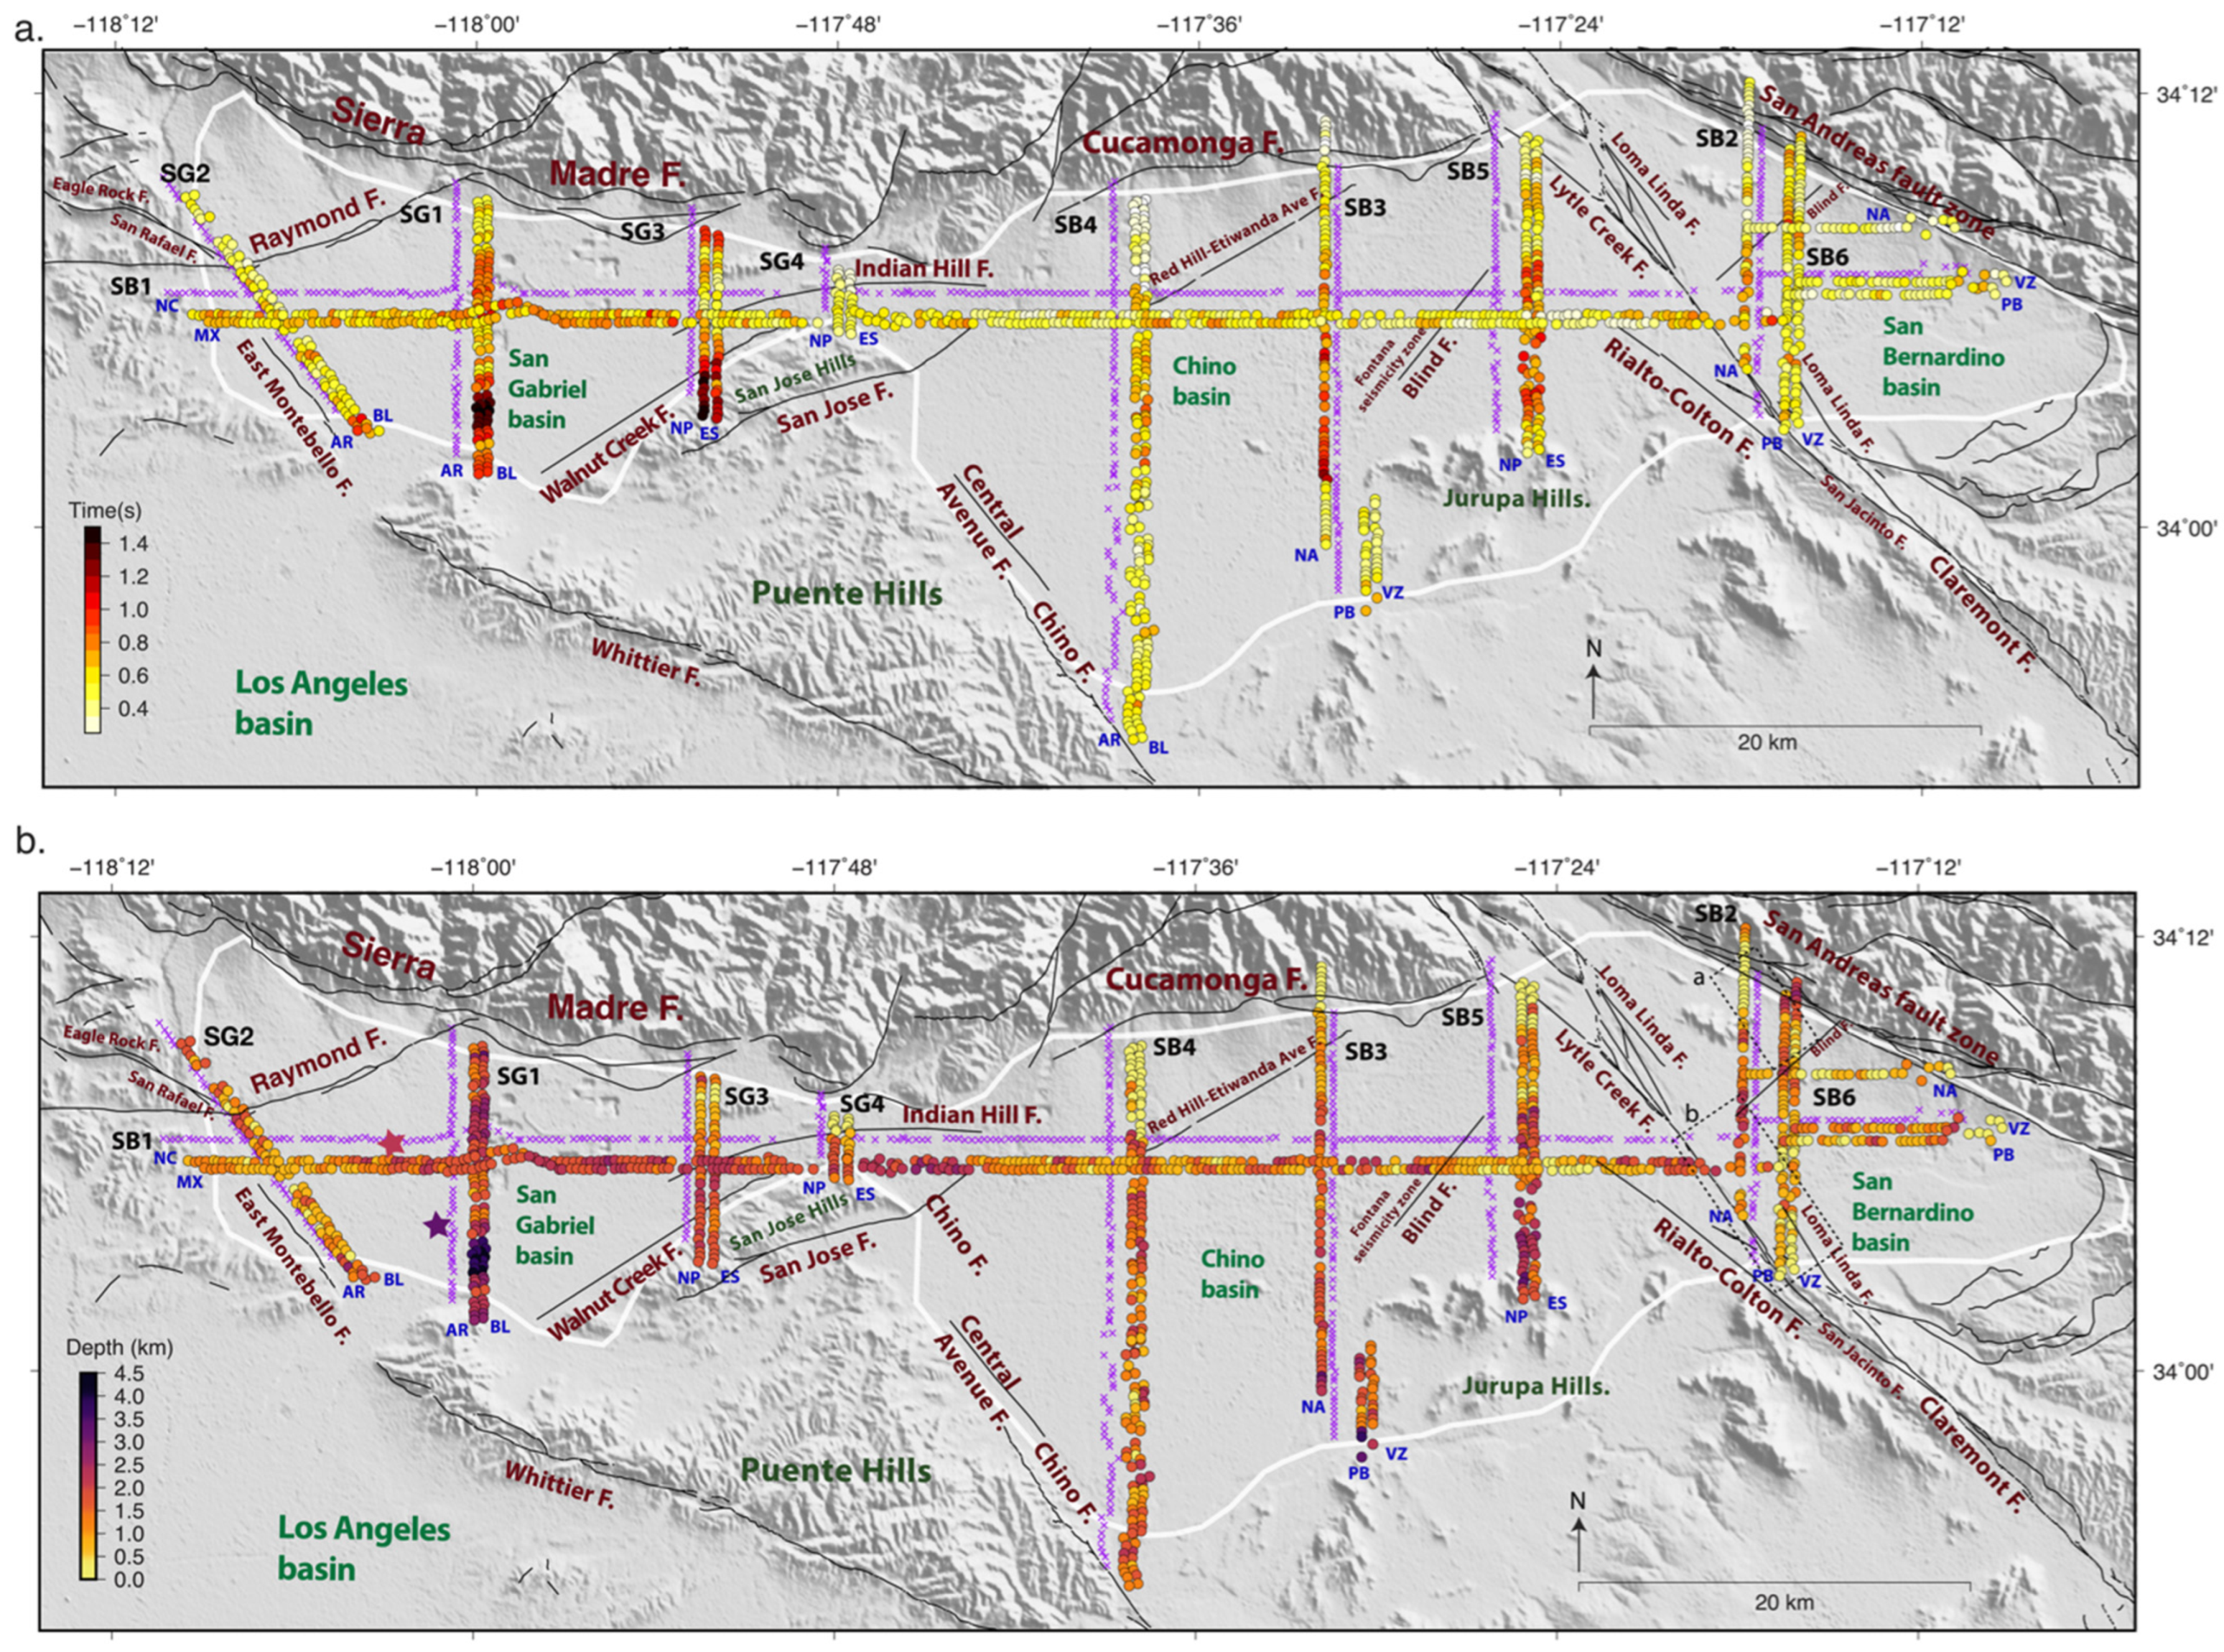
Basin depths identified from the sonic logs at the non-vertical Live Oak Park borehole reveal a true vertical basement depth of 2.3 km, and the Ferris well, which was drilled vertically, showed a basement top at 3.5 km in the San Gabriel basin [16,50] (shown by two stars in Figure 8b). Based on our study, the depth of the basement is approximately 1.5 km at a distance of 500 m north of the Live Oak Park borehole and 3.5 km at a distance of 1.5 km east of the Ferris borehole (Figure 8b). The San Gabriel basin has the deepest depths of all the basins, which was observed in the south-central area of the triangular basin. A notable basin depth variation of ~2 km is observed along the SG1 line within a distance of ~3 km (near stations 140–150 along SG1, Figure 7c). The borehole sonic logs [22] reveal a low-velocity zone in the basin that may have a significant impact on the depth estimates. This zone has a velocity approximately 1 km/s slower than the layer above it [22], which can affect the results of seismic imaging, possibly producing complex phase conversions near its top and causing longer arrival times for phases converted at the bottom of the basin. Our interpretations of the basin-converted phase is distinct in the RF profiles and consistent with nearby lines, and the presence of multiples following the interpreted primary Ps supports our interpretation. Our interpretation of SG3 is consistent with Wang et al. (2021) [21], except for the northern part. Liu et al. (2018) presented RFs along the SG1, SG2, and SB4 lines with basement interpretations that are consistent with our findings [20]. Near the Indian Hill fault, the average basin depth ranges from ~1.2 km in the west (stations 311–314 along SG3, Figure 7a) to ~300 m in the east (stations 401–404 along SG4, Figure 7b).
The RF profiles and corresponding basin depths exhibit notable changes near certain faults in our study area. Evidence of the Lytle Creek fault, Cucamonga fault, Red Hill–Etiwanda Avenue fault, and San Andreas fault can be confirmed by the shallowest basin depths (Figure 8b). In the San Bernardino basin, significant changes in basin depth were observed near the San Jacinto and Loma Linda faults (Figure 5). In the San Gabriel basin, a noteworthy change in basin depth is evident to the north of the Indian Hill fault (Figure 7). Some of the faults are located at the basin edges, some separate the basins, and others are basin-crossing faults, suggesting that the basins’ shapes and underlying basement topography are controlled by complex fault interactions.
In some instances, the RFs did not exhibit a strong conversion from the basement interface. For example, in the central part of SB5 near the Fontana fault, the primary converted Ps and multiples are not clearly visible in the RF profiles, leading to uncertainties while picking the Ps-converted phase (Figure 6b, dashed brown line in the RF profile). Differences between the onset and the peak of a converted phase in the RFs can be as large as 0.7 s, particularly if phases overlap. The depths obtained from the RF times also depend on the seismic velocities used. However, we relied on consistent patterns and amplitudes of the Ps-converted phases in the RF profiles when interpreting the sediment–basement interface, suggesting that the derived basin shapes are well resolved.
6. Conclusions
This study highlights the complex nature of basin structure in the northern Los Angeles region. Contrary to a general southward deepening pattern in basin depths, our findings revealed significant variability in the depth of the sediment–basement interface across the basins with the deepest parts of the San Bernardino, Chino, and San Gabriel basins at different locations with respect to the overall basin shapes. Individual RFs from different seismic events displayed depth variations over small distances within the basins. Our analysis also suggests that there are significant variations in basin depth near specific faults. Overall, this study contributes to a better understanding of the geological complexities of the sedimentary basins underlying the Los Angeles region and illustrates how nodal receiver functions can be used to map basement structure. A precise understanding of basin structure contributes to more precise seismic hazard assessments, enabling better-informed decisions in urban planning, infrastructure design, and disaster preparedness. By considering the geological complexities of the sedimentary basins underlying the Los Angeles area, we can enhance our ability to mitigate earthquake-related risks.
Supplementary Materials
The following supporting information can be downloaded at: https://www.mdpi.com/article/10.3390/geosciences13110320/s1, Figure S1: Example waveforms used to compute the RFs, Figure S2: Stacked RF profile along the SB2 line, Figure S3: Additional RF profiles for the San Bernardino basin, Figure S4: Additional RF profiles for the Chino basin, Figure S5: Additional RF profiles for the San Gabriel basin; Table S1: Teleseismic events recorded by all stations, Table S2: Number of stations that recorded events and produced RFs.
Author Contributions
Conceptualization: R.G. and P.P.; formal analysis: R.G. and P.P.; funding acquisition: P.P. and R.W.C.; methodology: R.G. and P.P.; project administration: P.P. and R.W.C.; investigation: R.G., P.P. and R.W.C.; writing—original draft preparation: R.G.; writing, review and editing: R.G. and P.P.; visualization: R.G. and P.P.; supervision: P.P. All authors have read and agreed to the published version of the manuscript.
Funding
This research is funded by the National Science Foundation (Grant Nos. 2105320 and 2105358), the U.S. Geological Survey awards (GS17AP00002 and G19AP00015) and Southern California Earthquake Center awards (18029 and 19033).
Data Availability Statement
The nodal dataset will be available through the IRIS Data Management Center in 2023. The receiver function files produced from this study are available at https://doi.org/10.5281/zenodo.7795769 (accessed on 20 August 2023).
Acknowledgments
We are thankful to the Incorporated Research Institutions for Seismology’s (IRIS) Portable Array Seismic Studies of the Continental Lithosphere (PASSCAL), Louisiana State University, University of Oklahoma, and Utah State University for providing nodal seismometers, as well as to all the volunteers who assisted with the nodal deployments.
Conflicts of Interest
The authors declare no conflict of interest.
References
- Frankel, A. Three-dimensional simulations of ground motions in the San Bernardino Valley, California, for hypothetical earthquakes on the San Andreas fault. Bull. Seismol. Soc. Am. 1993, 83, 1020–1041. [Google Scholar] [CrossRef]
- Aoi, S.; Honda, R.; Morikawa, N.; Sekiguchi, H.; Suzuki, H.; Hayakawa, Y.; Kunugi, T.; Fujiwara, H. Three-dimensional finite difference simulation of long-period ground motions for the 2003 Tokachi-oki, Japan, earthquake. J. Geophys. Res. Solid Earth 2008, 113. [Google Scholar] [CrossRef]
- Day, S.M.; Roten, D.; Olsen, K.B. Adjoint analysis of the source and path sensitivities of basin-guided waves. Geophys. J. Int. 2012, 189, 1103–1124. [Google Scholar] [CrossRef]
- Graves, R.W.; Clayton, R.W. Modeling path effects in three-dimensional basin structures. Bull. Seismol. Soc. Am. 1992, 82, 81–103. [Google Scholar] [CrossRef]
- Feng, L.; Ritzwoller, M.H. The effect of sedimentary basins on surface waves that pass through them. Geophys. J. Int. 2017, 211, 572–592. [Google Scholar] [CrossRef]
- Dhakal, Y.P.; Kubo, H.; Suzuki, W.; Kunugi, T.; Aoi, S.; Fujiwara, H. Analysis of strong ground motions and site effects at Kantipath, Kathmandu, from 2015 Mw 7.8 Gorkha, Nepal, earthquake and its aftershocks. Earth Planets Space 2016, 68, 1–12. [Google Scholar] [CrossRef]
- Hancock, J.; Bommer, J.J. A state-of-knowledge review of the influence of strong-motion duration on structural damage. Earthq. Spectra 2006, 22, 827–845. [Google Scholar] [CrossRef]
- Graves, R.W.; Pitarka, A.; Somerville, P.G. Ground-motion amplification in the Santa Monica area: Effects of shallow basin-edge structure. Bull. Seismol. Soc. Am. 1998, 88, 1224–1242. [Google Scholar] [CrossRef]
- Taborda, R.; Bielak, J. Large-scale earthquake simulation: Computational seismology and complex engineering systems. Comput. Sci. Eng. 2011, 13, 14–27. [Google Scholar] [CrossRef]
- Jones, L.M.; Bernknopf, R.L.; Cox, D.A.; Goltz, J.; Hudnut, K.W.; Mileti, D.S.; Perry, S.; Ponti, D.; Porter, K.A.; Reichle, M.S. The Shake out Scenario: Effects of a Potential M7. 8 Earthquake on the San Andreas Fault in Southern California; US Geological Survey: Reston, VA, USA, 2008.
- Porter, K.; Jones, L.; Cox, D.; Goltz, J.; Hudnut, K.; Mileti, D.; Perry, S.; Ponti, D.; Reichle, M.; Rose, A.Z. The ShakeOut scenario: A hypothetical Mw7. 8 earthquake on the southern San Andreas fault. Earthq. Spectra 2011, 27, 239–261. [Google Scholar] [CrossRef]
- Graves, R.W. The seismic response of the San Bernardino basin region during the 2001 Big Bear Lake earthquake. Bull. Seismol. Soc. Am. 2008, 98, 241–252. [Google Scholar] [CrossRef]
- Graves, R.W.; Wald, D.J. Observed and simulated ground motions in the San Bernardino basin region for the Hector Mine, California, earthquake. Bull. Seismol. Soc. Am. 2004, 94, 131–146. [Google Scholar] [CrossRef]
- Olsen, K.; Day, S.; Minster, J.; Cui, Y.; Chourasia, A.; Faerman, M.; Moore, R.; Maechling, P.; Jordan, T. Strong shaking in Los Angeles expected from southern San Andreas earthquake. Geophys. Res. Lett. 2006, 33. [Google Scholar] [CrossRef]
- Jennings, C.W.; Bryant, W.A. Fault Activity Map of California; California Geological Survey: Sacramento, CA, USA, 2010.
- Brocher, T.M.; Ruebel, A.L.; Wright, T.L.; Okaya, D.A. Compilation of 20 Sonic and Density Logs from 12 Oil Test Wells along LARSE Lines 1 and 2, Los Angeles Region, California; US Geological Survey Open-File Report 98-366; US Geological Survey: Reston, VA, USA, 1998; Volume 366, p. 53.
- Advanced National Seismic System (ANSS). Comprehensive Catalog of Earthquake Events and Products; US Geological Survey: Reston, VA, USA, 2017.
- Jennings, C.W.; Strand, R.G.; Rogers, T.H. Geologic Map of California: California Division of Mines and Geology, Scale 1:750,000. 1977. Available online: https://mrdata.usgs.gov/geology/state/kml/cageol.kml (accessed on 20 August 2023).
- Clayton, R.; Persaud, P.; Denolle, M.; Polet, J. Exposing Los Angeles’s Shaky Geologic Underbelly. Eos, 10 October 2019. [Google Scholar] [CrossRef]
- Liu, G.; Persaud, P.; Clayton, R.W. Structure of the northern Los Angeles basins revealed in teleseismic receiver functions from short-term nodal seismic arrays. Seismol. Res. Lett. 2018, 89, 1680–1689. [Google Scholar] [CrossRef]
- Wang, X.; Zhan, Z.; Zhong, M.; Persaud, P.; Clayton, R.W. Urban basin structure imaging based on dense arrays and bayesian array-based coherent receiver functions. J. Geophys. Res. Solid Earth 2021, 126, e2021JB022279. [Google Scholar] [CrossRef]
- Li, Y.; Villa, V.; Clayton, R.W.; Persaud, P. Shear Wave Velocities in the San Gabriel and San Bernardino Basins, California. J. Geophys. Res. Solid Earth 2023, 128. [Google Scholar] [CrossRef]
- Nardoni, C.; Persaud, P.; Clayton, R.W. 3D Seismic Attenuation Model for Ground Motion Predictions in the Los Angeles Metropolitan Area. In Proceedings of the AGU Fall Meeting Abstracts, Chicago, IL, USA, 12–16 December 2022; p. S23A-07. [Google Scholar]
- Villa, V.; Li, Y.; Clayton, R.W.; Persaud, P. Three-dimensional basin depth map of the northern Los Angeles Basins from gravity and seismic measurements. J. Geophys. Res. Solid Earth 2023, 128, e2022JB025425. [Google Scholar] [CrossRef]
- Anderson, M.; Matti, J.; Jachens, R. Structural model of the San Bernardino basin, California, from analysis of gravity, aeromagnetic, and seismicity data. J. Geophys. Res. Solid Earth 2004, 109. [Google Scholar] [CrossRef]
- Catchings, R.; Rymer, M.; Goldman, M.; Gandhok, G.; Steedman, C. Structure of the San Bernardino Basin along Two Seismic Transects: Rialto-Colton Fault to the San Andreas Fault and along the I-215 Freeway (I-10 to SR30); 2331-1258; US Geological Survey: Reston, VA, USA, 2008.
- Süss, M.P.; Shaw, J.H. P wave seismic velocity structure derived from sonic logs and industry reflection data in the Los Angeles basin, California. J. Geophys. Res. Solid Earth 2003, 108. [Google Scholar] [CrossRef]
- Stephenson, W.; Odum, J.; Williams, R.; Anderson, M. Delineation of faulting and basin geometry along a seismic reflection transect in urbanized San Bernardino Valley, California. Bull. Seismol. Soc. Am. 2002, 92, 2504–2520. [Google Scholar] [CrossRef]
- Zhu, L. Crustal structure across the San Andreas Fault, southern California from teleseismic converted waves. Earth Planet. Sci. Lett. 2000, 179, 183–190. [Google Scholar]
- Ma, Y.; Clayton, R.W. Structure of the Los Angeles Basin from ambient noise and receiver functions. Geophys. J. Int. 2016, 206, 1645–1651. [Google Scholar] [CrossRef]
- Persaud, P.; Pérez-Campos, X.; Clayton, R.W. Crustal thickness variations in the margins of the Gulf of California from receiver functions. Geophys. J. Int. 2007, 170, 687–699. [Google Scholar] [CrossRef]
- Atwater, T.; Stock, J. Pacific-North America plate tectonics of the Neogene southwestern United States: An update. Int. Geol. Rev. 1998, 40, 375–402. [Google Scholar] [CrossRef]
- Morton, D.; Matti, J.C. Extension and contraction within an evolving divergent strike-slip fault complex: The San Andreas and San Jacinto fault zones at their convergence in southern California. San Andreas Fault Syst. Displac. Palinspastic Reconstr. Geol. Evol. 1993, 178, 217. [Google Scholar] [CrossRef]
- Cooke, M.L.; Beyer, J. Off-fault focal mechanisms not representative of interseismic fault loading suggest deep creep on the northern San Jacinto Fault. Geophys. Res. Lett. 2018, 45, 8976–8984. [Google Scholar] [CrossRef]
- Blomquist, W.A. The Performance of Institution for Groundwater Management: Chino Basin; Report published by Indiana University: Bloomington, IN, USA, 1990. [Google Scholar]
- French, J.J. Ground-Water Outflow from Chino Basin, upper Santa Ana Valley, Southern California; US Government Printing Office: Washington, DC, USA, 1972.
- Yeats, R.S. Tectonics of the San Gabriel Basin and surroundings, southern California. GSA Bull. 2004, 116, 1158–1182. [Google Scholar] [CrossRef]
- Anderson, G.; Aagaard, B.; Hudnut, K. Fault interactions and large complex earthquakes in the Los Angeles area. Science 2003, 302, 1946–1949. [Google Scholar] [CrossRef]
- Crook Jr, R.; Allen, C.R.; Kamb, B.; Payne, C.M.; Proctor, R.J. Quaternary Geology and Seismic Hazard of the Sierra Madre and Associated Faults, Western San Gabriel Mountains; US Geological Survey: Reston, VA, USA, 1987.
- Herber, L. The San Jose fault—Geologic slip rates and recurrence intervals. In Proceedings of the Geological Society of America Abstracts with Programs, Denver, CO, USA, 1999. [Google Scholar]
- Yeck, W.L.; Sheehan, A.F.; Anderson, M.L.; Erslev, E.A.; Miller, K.C.; Siddoway, C.S. Structure of the Bighorn Mountain region, Wyoming, from teleseismic receiver function analysis: Implications for the kinematics of Laramide shortening. J. Geophys. Res. Solid Earth 2014, 119, 7028–7042. [Google Scholar] [CrossRef]
- Leahy, G.M.; Saltzer, R.L.; Schmedes, J. Imaging the shallow crust with teleseismic receiver functions. Geophys. J. Int. 2012, 191, 627–636. [Google Scholar] [CrossRef]
- Ryberg, T.; Weber, M. Receiver function arrays: A reflection seismic approach. Geophys. J. Int. 2000, 141, 1–11. [Google Scholar] [CrossRef]
- Yu, Y.; Song, J.; Liu, K.H.; Gao, S.S. Determining crustal structure beneath seismic stations overlying a low-velocity sedimentary layer using receiver functions. J. Geophys. Res. Solid Earth 2015, 120, 3208–3218. [Google Scholar] [CrossRef]
- Di Bona, M. Variance estimate in frequency-domain deconvolution for teleseismic receiver function computation. Geophys. J. Int. 1998, 134, 634–646. [Google Scholar] [CrossRef]
- Dziewonski, A.M.; Anderson, D.L. Preliminary reference Earth model. Phys. Earth Planet. Inter. 1981, 25, 297–356. [Google Scholar] [CrossRef]
- Zhu, L.; Kanamori, H. Moho depth variation in southern California from teleseismic receiver functions. J. Geophys. Res. Solid Earth 2000, 105, 2969–2980. [Google Scholar] [CrossRef]
- Brocher, T.M. Empirical relations between elastic wavespeeds and density in the Earth’s crust. Bull. Seismol. Soc. Am. 2005, 95, 2081–2092. [Google Scholar] [CrossRef]
- Hadley, D.; Combs, J. Microearthquake distribution and mechanisms of faulting in the Fontana-San Bernardino area of southern California. Bull. Seismol. Soc. Am. 1974, 64, 1477–1499. [Google Scholar]
- Wright, T.L. Structural Geology and Tectonic Evolution of the Los Angeles Basin, California: Chapter 3: PART 1. In Active Margin Basins; American Association of Petroleum Geologists: Tulsa, OK, USA, 1991. [Google Scholar]
Figure 1.
(a) Map showing the seismic array in the San Bernardino, Chino, and San Gabriel basins. The seismic lines are color-coded by deployment years. Active faults from the 2010 Fault Activity Map of California are shown with black lines [15]. The purple stars are two borehole locations from Brocher et al. (1998) [16]. In the inset map, the black rectangle represents the study area. The red stars are the location of major earthquakes that are mentioned in this paper [17]. (b) Map showing geologic units of the study area [18]. The white outline represents the basin boundary.
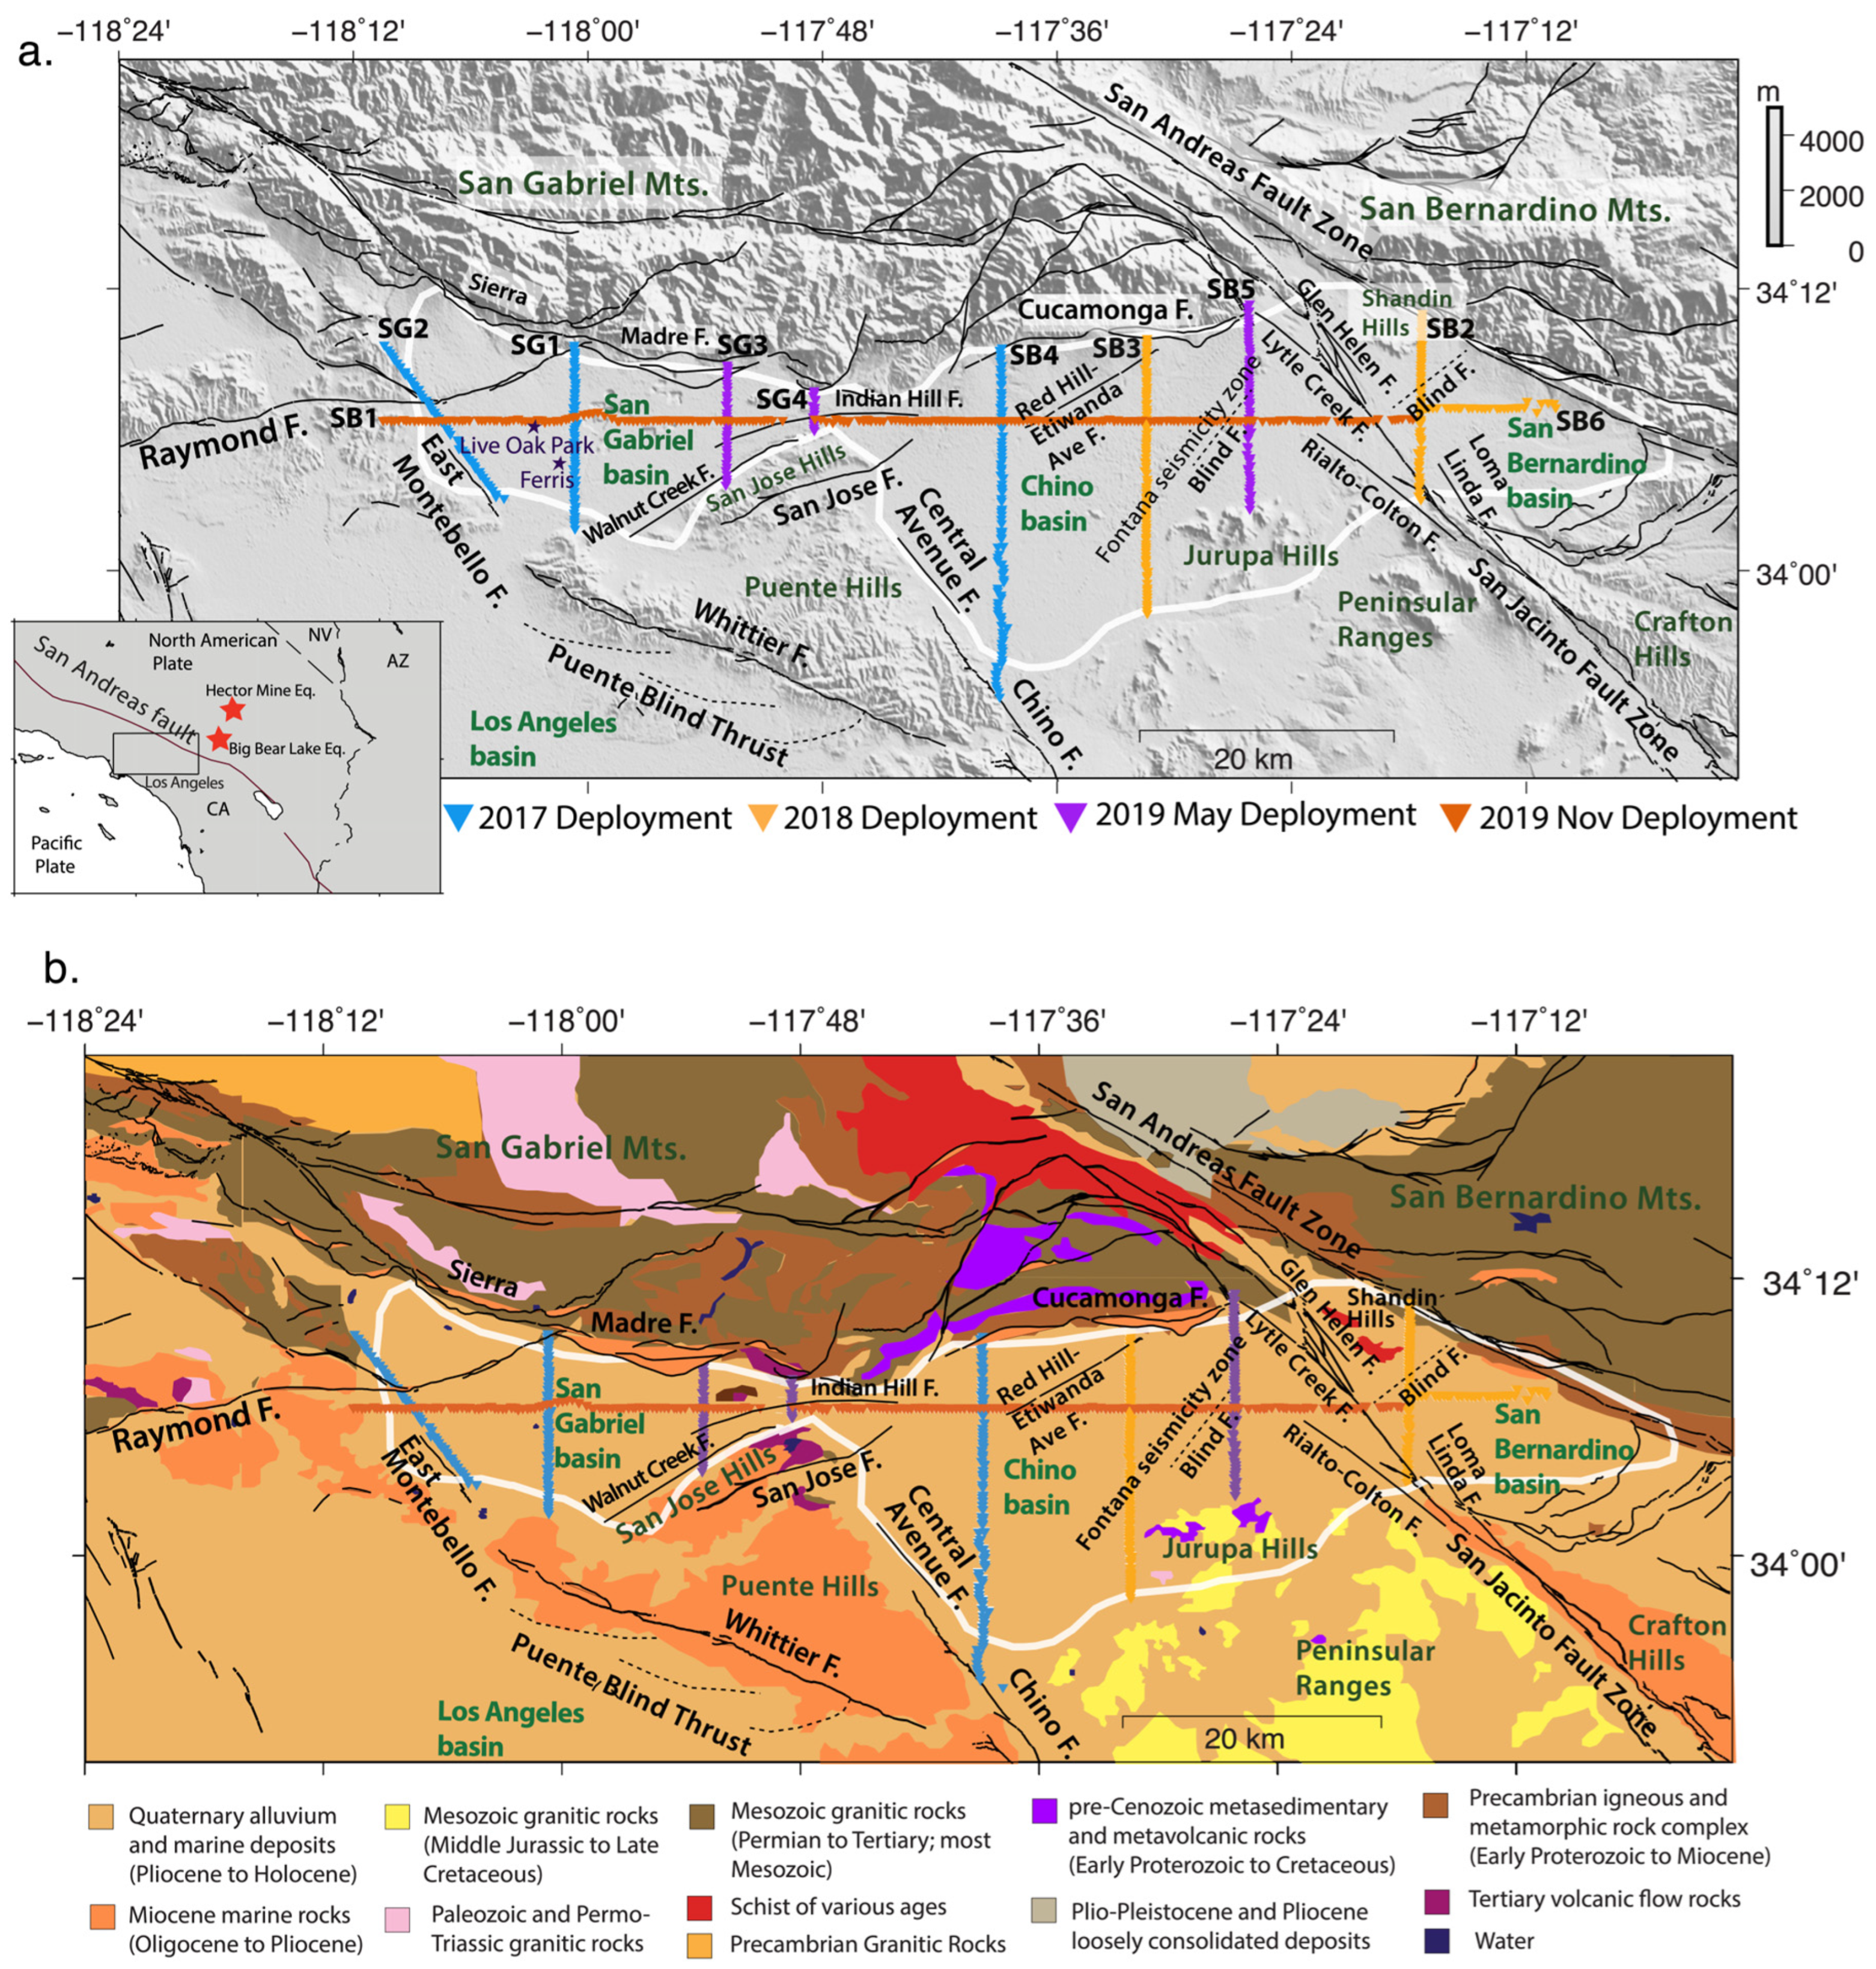
Figure 2.
(a) Map showing estimated pierce points at 5 km depth for each station along the 10 seismic lines computed using the PREM velocity model [46]. The yellow inverted triangles are the stations. Pierce points are color-coded by the events shown in the inset map in the bottom left corner. The white outline represents the basin boundary. (b) Histograms showing the number of stations recording each event and useful RFs produced from those events.

Figure 3.
Diagram illustrating the depth conversion. (a) Cross section of an incoming ray passing through a three-layer velocity model; the black triangle represents the seismic station. x and y values are the coordinates corresponding to each circle, and Vs values are the shear wave velocities at those locations. (b) Estimated Ps times (tPs) are plotted at the corresponding depths for station 334 in the SG3 line with the blue star marking the depth obtained for the interpreted basement in (c). (c) RF from station 334 showing the interpreted Ps for the basement interface marked with the blue star.
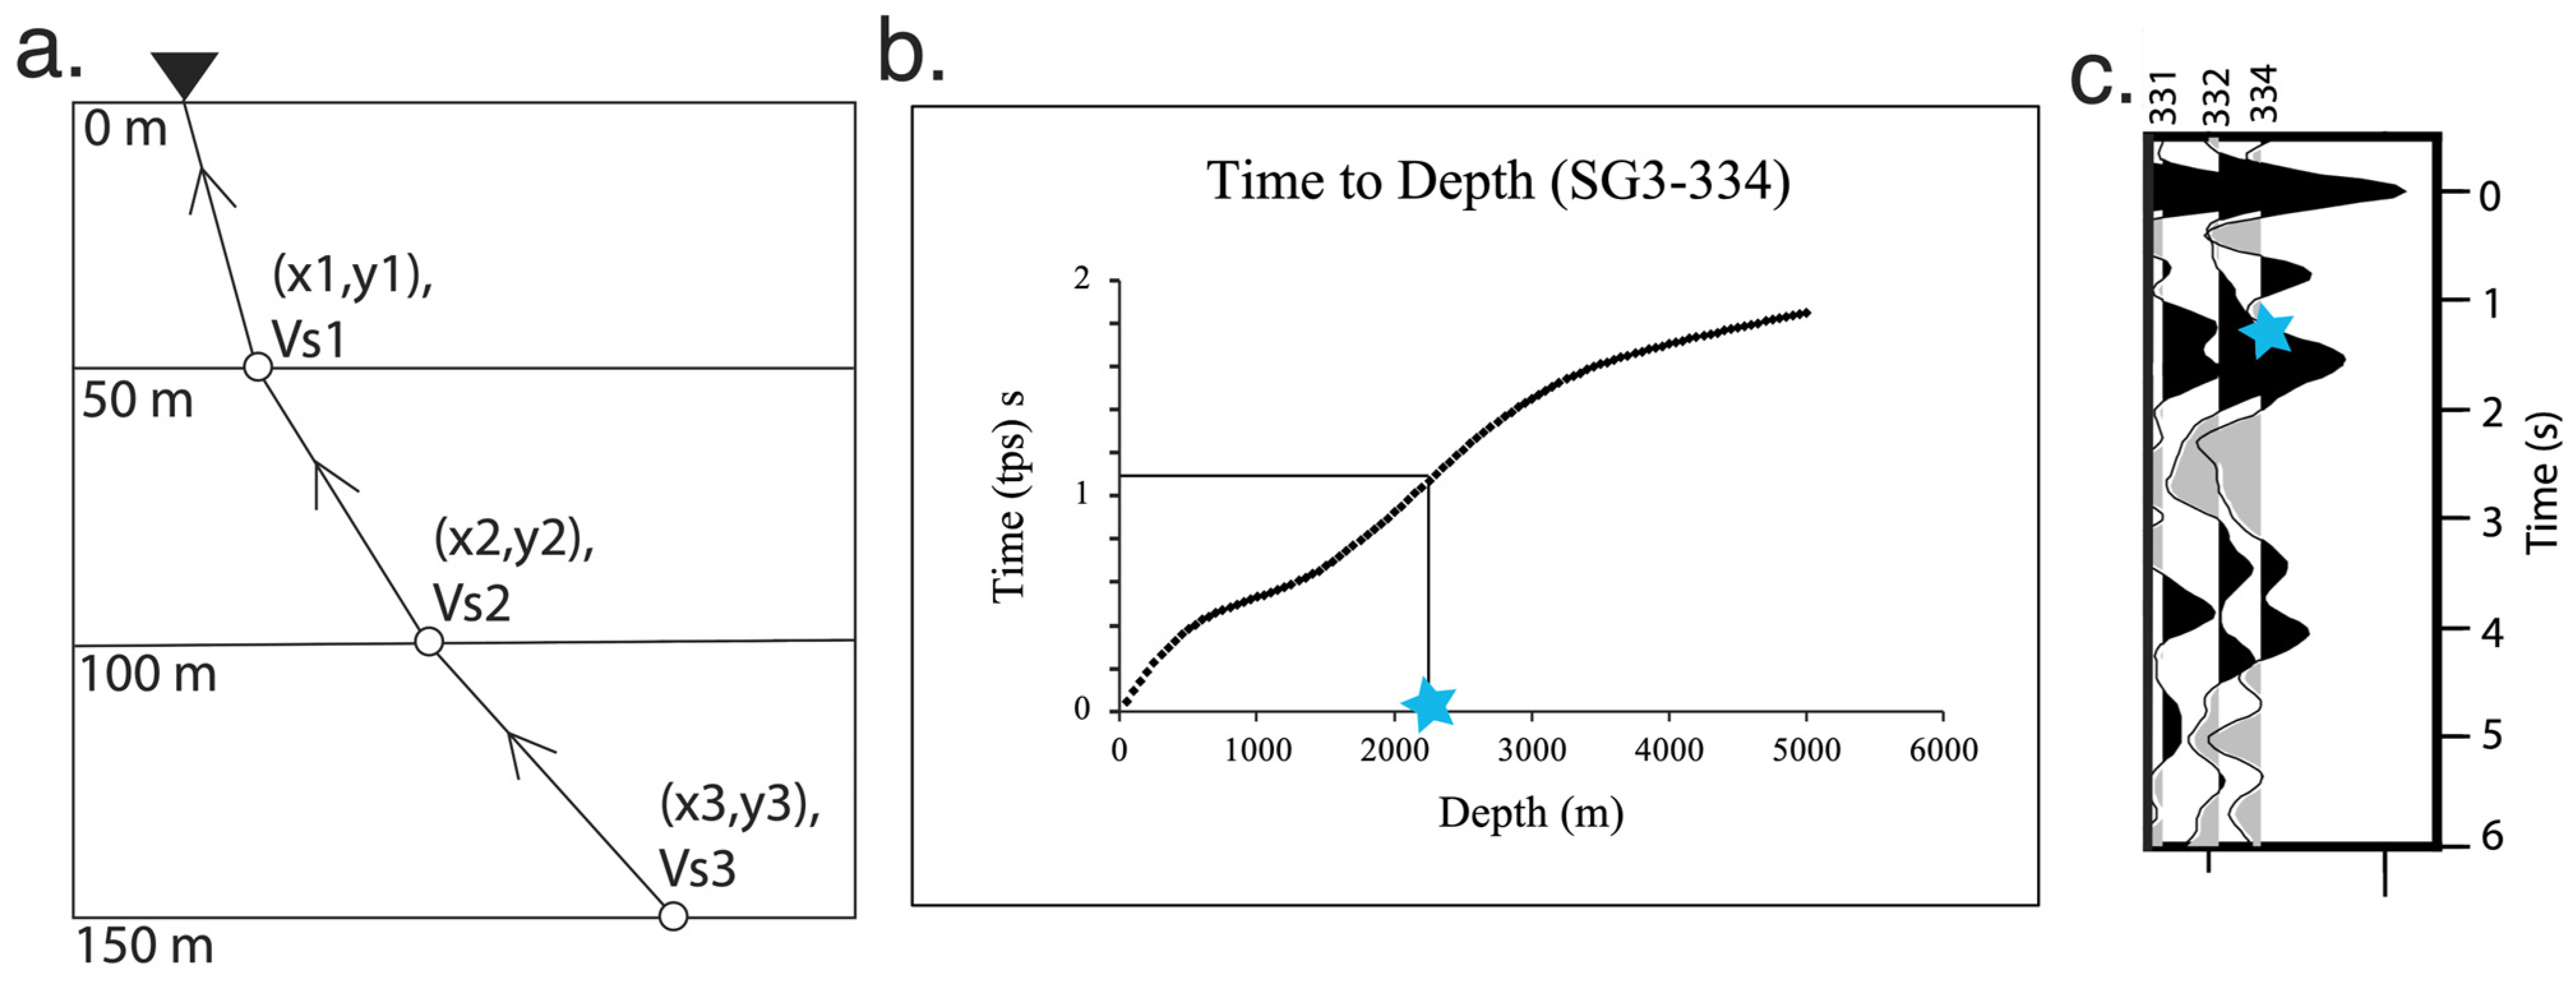
Figure 4.
RF profiles showing primary basin conversions and multiples along the (a) northern part of the SB2 line in the San Bernardino basin, (b) SG4 line in the San Gabriel basin, and (c) northern part of the SB5 line in the Chino basin.
Figure 4.
RF profiles showing primary basin conversions and multiples along the (a) northern part of the SB2 line in the San Bernardino basin, (b) SG4 line in the San Gabriel basin, and (c) northern part of the SB5 line in the Chino basin.

Table 1.
Teleseismic earthquakes selected for computing receiver functions.
| Event Date yyyy/mm/dd | Event Time hh:mm:ss | Geographic Location | Event ID | Latitude | Longitude | Magnitude | Depth (km) | Back-Azimuth (°) | Distance (°) |
|---|---|---|---|---|---|---|---|---|---|
| 2019/12/03 | 08:46:36 | Chile | CH | −18.5597 | −70.6504 | 6 | 32.44 | 131.56 | 69.26 |
| 2019/11/20 | 04:27:05 | Mexico | MX | 13.8855 | −93.2133 | 6.3 | 14.16 | 125.68 | 30.32 |
| 2019/05/30 | 09:03:28 | El Salvador | ES | 13.1462 | −89.3663 | 6.6 | 25 | 121.68 | 33.49 |
| 2019/05/26 | 07:41:15 | Northern Peru | NP | −5.8132 | −75.2775 | 8 | 122.4 | 125.92 | 56.77 |
| 2018/08/24 | 09:04:06 | Peru-Brazil | PB | −11.0424 | −70.8169 | 7.1 | 609.48 | 126.24 | 63.58 |
| 2018/08/21 | 21:31:47 | Venezuela | VZ | 10.7791 | −62.907 | 7.3 | 146.18 | 101.12 | 55.39 |
| 2018/08/12 | 14:58:54 | North Alaska | NA | 69.5619 | −145.2998 | 6.3 | 2.2 | 345.09 | 38.49 |
| 2017/02/21 | 14:09:04 | Bolivia | BL | −19.281 | −63.9047 | 6.5 | 595.98 | 127.14 | 74.03 |
| 2017/02/18 | 12:10:17 | Argentina | AR | −23.861 | −66.6592 | 6.3 | 222 | 132.32 | 75.59 |
Disclaimer/Publisher’s Note: The statements, opinions and data contained in all publications are solely those of the individual author(s) and contributor(s) and not of MDPI and/or the editor(s). MDPI and/or the editor(s) disclaim responsibility for any injury to people or property resulting from any ideas, methods, instructions or products referred to in the content. |
© 2023 by the authors. Licensee MDPI, Basel, Switzerland. This article is an open access article distributed under the terms and conditions of the Creative Commons Attribution (CC BY) license (https://creativecommons.org/licenses/by/4.0/).
Share and Cite
MDPI and ACS Style
Ghose, R.; Persaud, P.; Clayton, R.W. Basin Structure for Earthquake Ground Motion Estimates in Urban Los Angeles Mapped with Nodal Receiver Functions. Geosciences 2023, 13, 320. https://doi.org/10.3390/geosciences13110320
AMA Style
Ghose R, Persaud P, Clayton RW. Basin Structure for Earthquake Ground Motion Estimates in Urban Los Angeles Mapped with Nodal Receiver Functions. Geosciences. 2023; 13(11):320. https://doi.org/10.3390/geosciences13110320
Chicago/Turabian StyleGhose, Ritu, Patricia Persaud, and Robert W. Clayton. 2023. "Basin Structure for Earthquake Ground Motion Estimates in Urban Los Angeles Mapped with Nodal Receiver Functions" Geosciences 13, no. 11: 320. https://doi.org/10.3390/geosciences13110320
Note that from the first issue of 2016, this journal uses article numbers instead of page numbers. See further details here.