Article

The Impact of Probability Density Functions Assessment on Model Performance for Slope Stability Analysis

1
Research Institute for Geo-Hydrological Protection, National Research Council, 06128 Perugia, Italy
2
Department of Civil and Environmental Engineering, University of Perugia, 06125 Perugia, Italy
3
eCampus University, 22060 Novedrate, Italy
*
Author to whom correspondence should be addressed.
Geosciences 2021, 11(8), 322; https://doi.org/10.3390/geosciences11080322
Submission received: 22 June 2021 / Revised: 26 July 2021 / Accepted: 27 July 2021 / Published: 30 July 2021
(This article belongs to the Special Issue Landslide Monitoring and Mapping)

Abstract

:
The development of forecasting models for the evaluation of potential slope instability after rainfall events represents an important issue for the scientific community. This topic has received considerable impetus due to the climate change effect on territories, as several studies demonstrate that an increase in global warming can significantly influence the landslide activity and stability conditions of natural and artificial slopes. A consolidated approach in evaluating rainfall-induced landslide hazard is based on the integration of rainfall forecasts and physically based (PB) predictive models through deterministic laws. However, considering the complex nature of the processes and the high variability of the random quantities involved, probabilistic approaches are recommended in order to obtain reliable predictions. A crucial aspect of the stochastic approach is represented by the definition of appropriate probability density functions (pdfs) to model the uncertainty of the input variables as this may have an important effect on the evaluation of the probability of failure (PoF). The role of the pdf definition on reliability analysis is discussed through a comparison of PoF maps generated using Monte Carlo (MC) simulations performed over a study area located in the Umbria region of central Italy. The study revealed that the use of uniform pdfs for the random input variables, often considered when a detailed geotechnical characterization for the soil is not available, could be inappropriate.

1. Introduction

In many areas of the world, rainfall-induced landslides represent a relevant threat to the population, infrastructure, buildings, and cultural heritage. In recent years, extreme rainfall events have induced an increasing frequency of slope movements [1,2,3,4,5]; therefore, the prediction of rainfall-induced landslides represents a major challenge for the scientific community.
The most damaging landslides are triggered by intense or prolonged rainfall [6,7,8,9], and the most common phenomena are shallow landslides [10].
Considering the negative impact of landslides on society [11,12], different approaches have been developed to protect and safeguard the territory; for example, geomorphological mapping, analysis of landslide inventories, heuristic terrain, and statistically based classification methods [13,14] have often been used to evaluate the landslide susceptibility of an area.
Landslide susceptibility (S) is the likelihood of a landslide occurring in an area on the basis of local terrain conditions [15]. It represents an estimate of “where” landslides are likely to occur.
Susceptibility (S), hazard (H) (representing the probability that a landslide of a given magnitude will occur in a given period and in a given area), and vulnerability (V) (considering people and infrastructures involved) define landslide risk, which is therefore based on what has happened in the past.
Current extreme regimes are not comparable with past rainfall events; therefore, the zoning of risk (function of S, H, and V) is not always sufficient to guarantee the protection of the territory and people.
A robust and sustainable response to planning policies is represented by landslide forecasting models that are able to simulate slope stability as a function of expected meteorological conditions and physical characteristics of the territory.
Spatial and temporal forecasting of shallow landslides triggered by rainfall can be performed according to different approaches: empirical methods, which analyze records of landslide events and attempts to determine spatial and temporal variations in the occurrence and frequency of landslides [16]; and physically based (PB) approaches [17,18,19,20] accounting for the local physical and mechanical properties that control the failure processes [21,22,23,24,25,26,27,28]. The latter approaches are preferred to forecast the spatial and temporal occurrence of shallow landslides triggered by individual rainfall events, and they are commonly used by the scientific community due to their capability to describe the natural physical processes through appropriate analytical equations (some examples are presented in [29,30,31,32]).
If a detailed description of the study area is available in terms of slope topography and physical, mechanical, and hydraulic soil properties, PB approaches can provide a high level of reliability (see [33]). Generally, the detailed reconstruction of slope topography does not represent a relevant problem; on the contrary, adequate characterization of the physical, mechanical, and hydraulic properties of soil cover is subjected to economic and practical limitations. Soils and rocks are described by parameters characterized by high variability in space both in horizontal and vertical dimensions [34]. For instance, mechanical properties show their uncertainty not only from site to site and within a given stratigraphy but also within homogeneous covers as a consequence of natural deposition processes [35]. In addition to soil property variability (random uncertainty), soil parameters are characterized by two different forms of uncertainty. The first, epistemic uncertainty, is linked to the impossibility of directly measuring a soil characteristic [36]; the second, model uncertainty, is related to the approaches used to describe a specific phenomenon [37]. Model uncertainty includes: (1) measurement uncertainty, related to systematic errors (bias) and random errors (precision); (2) statistical uncertainty, linked to limited information and influenced by the technique used; and (3) uncertainty due to the idealizations present in the physics formulation of the problem. While epistemic uncertainty can be reduced, random uncertainty cannot be eliminated [38].
Nevertheless, PB models are often used considering the quantities involved in landslide processes deprived of uncertainty, quantified by a single fixed value [39,40]; consequently, the derived predictions are expressed by a single value of the factor of safety, Fs, or the critical rainfall intensity, Ic.
On the contrary, when PB models are used with a probabilistic approach, the variability of the input quantities is modeled and the dependent variables are described as random as well.
For landslide forecasting through PB approaches, a deterministic approach, which assumes the input data without uncertainty [25,26,41,42,43,44] is less suitable than a probabilistic approach, which considers input data as random variables [45] defined through their probability density functions (pdfs) [46]. In the probabilistic approach, the safety level of the slope is given by the probability of failure (PoF), i.e., the probability associated with a value of factor of safety equal or less than 1 [47,48].
A key point in PB probabilistic modeling is represented by the definition of the theoretical pdf for the random quantities involved in the simulated physical processes. For a specific variable, the theoretical pdf must be able to reproduce its variability starting from the available measures. Typically, large variability in the physical and mechanical properties of the soil makes it quite difficult to identify a priori the theoretical pdf. In addition, when applying PB probabilistic models over large areas, the objective difficulties of having a significant number of measures to correctly assess the pdf for each variable leads to the adoption of simplified hypotheses. When the probability density functions of strength parameters cannot be determined from in situ or laboratory tests, the pdfs are estimated based on judgment, experience, or indications supported by other authors [49].
In this paper, the impact of the selection of the pdf on the PoF estimation is discussed through the application of a PB probabilistic model to a pilot study area characterized by a detailed geotechnical characterization. Available collected measures in this area are used to define the pdfs for soil shear strength properties: effective cohesion (c’) and friction angle (ϕ’). In this work, a comparison is carried out between the PoF evaluated, (i) starting from uniform pdfs for all random variables, called PoFu, when the internal structure of the uncertainty is unknown and only the minimum and maximum values of the variable is known [50]; (ii) assuming the pdf able to consider the spatial variability of random quantities, called PoFr. Analyses were carried out to develop a modification of the transient rainfall infiltration and grid-based regional slope stability analysis (TRIGRS) code [26] in its probabilistic version [51]. Reliability analysis was carried out using the Monte Carlo method [47].
This paper is organized as follows. In Section 2, an overview of the theoretical aspects of the approach and the equations that govern the physically based probabilistic model implemented is described; a detailed description of the study area is presented in Section 2.2, where geotechnical and hydrological assumptions considered for the reliability analysis are illustrated. Experimental settings and the results, obtained in terms of the PoF, are discussed in Section 3. Conclusions and future research developments represent the final section of the paper (Section 4).

2. Materials and Methods

2.1. Physically Based Landslide Forecasting Model

The probabilistic model, implemented in order to assess the impact of pdf definition on the PoF evaluation, represents a new extension of the probabilistic version [51] of the original TRIGRS code [26]. The PB approach, implemented in the MATLAB/Octave environment, is able to work through discretization of the study area on a regular grid, coupling a hydraulic model for the evolution of the pore water pressure during time and a mechanical model for the assessment of the temporal slope stability conditions.
In the deterministic analysis, the slope stability is expressed by the factor of safety, Fs, equal to:
F s Z , t = t a n Φ t a n α + c γ w ψ Z , t t a n Φ γ Z s i n α c o s α
where a is the inclination grade of slope, c’ represents the effective cohesion of the soil, φ’ is the effective friction angle, ψ is the pressure head, and γ is the unit weight of the soil.
In transient flow conditions, the factor of safety varies with Z and t due to the evolution with time and space of the pressure head ψ generated by the rainfall infiltration process.
The evaluation of ψ evolution is based on the solution of the mass conservation equation for solid and liquid phases. In the particular case of fully saturated soil covers, and under 1d conditions, the equation reduces to the simple diffusion equation:
ψ t = D α 2 ψ Z 2
where Dα is the soil coefficient of 1D consolidation, corrected for the slope inclination a.
The resolution of Equation (2) requires the definition of the initial and boundary conditions. The initial condition is defined by the position, at time t = 0, of the pressure head profile ψ Z , 0 , while the flow boundary conditions are defined at the layer base Z = d b and at the ground surface (Z = 0). The latter are determined starting from the time evolution of the rainfall intensity i(t). The closed-form solution for Equation (2) is described in the works by Baum et al. (2002) for the saturated case [25] and in Baum et al. (2008) for the unsaturated case [26].
In conclusion, the stability analysis is controlled by the balance of mass for the pore water, which requires the definition of: (i) saturated (θs) and residual (θr) volumetric water content, (ii) the soil stiffness (Eed), (iii) the initial prestorm water table depth dw and the prestorm infiltration rate parameters aα and ILT, (iv) the thickness of the soil cover h, and (v) the hydraulic conductivity ks.
The Fs results depend on 12 parameters, represented in a synthetic form in Equation (3):
F s = f ( α , h , d w , γ s , c , φ , E e d , k s , θ s , θ r , a α , , I L T )
In the stochastic analysis, the stability conditions are expressed by the PoF. In principle, all the 12 parameters in Equation (3) can be considered a random variable; however, the number of random variables can be reduced without affecting the forecast reliability under appropriate hypotheses. In the considered case study, the following assumptions can be made:
(1)
On the safe side of the prediction, and without detailed characterization for the unsaturated parameters, the soil cover can be considered in fully saturated conditions; thus, the balance of mass for the pore water (dψ/dt = Dα d2ψ/dZ2, in which ψ is the pressure head linked to infiltration process, and Dα is the soil 1D consolidation coefficient) reduces to the simple diffusion;
(2)
Because γs is typically affected by low uncertainty, it can be considered constant and evaluated from the literature data;
(3)
If a high-resolution DTM is used, the slope steepness can be assumed accurate enough to be characterized by no uncertainty;
(4)
The water table depth should be monitored at different points of the study area.
Therefore, the PB probabilistic model used in this paper considers the randomness of the following quantities:
  • Soil mechanical properties (c’, φ’);
  • Soil saturated hydraulic conductivity ks and soil stiffness Eed, both considered in the infiltration problem through the coefficient of consolidation, D α = k s E e d γ w ;
  • Thickness of the soil cover layer, h.
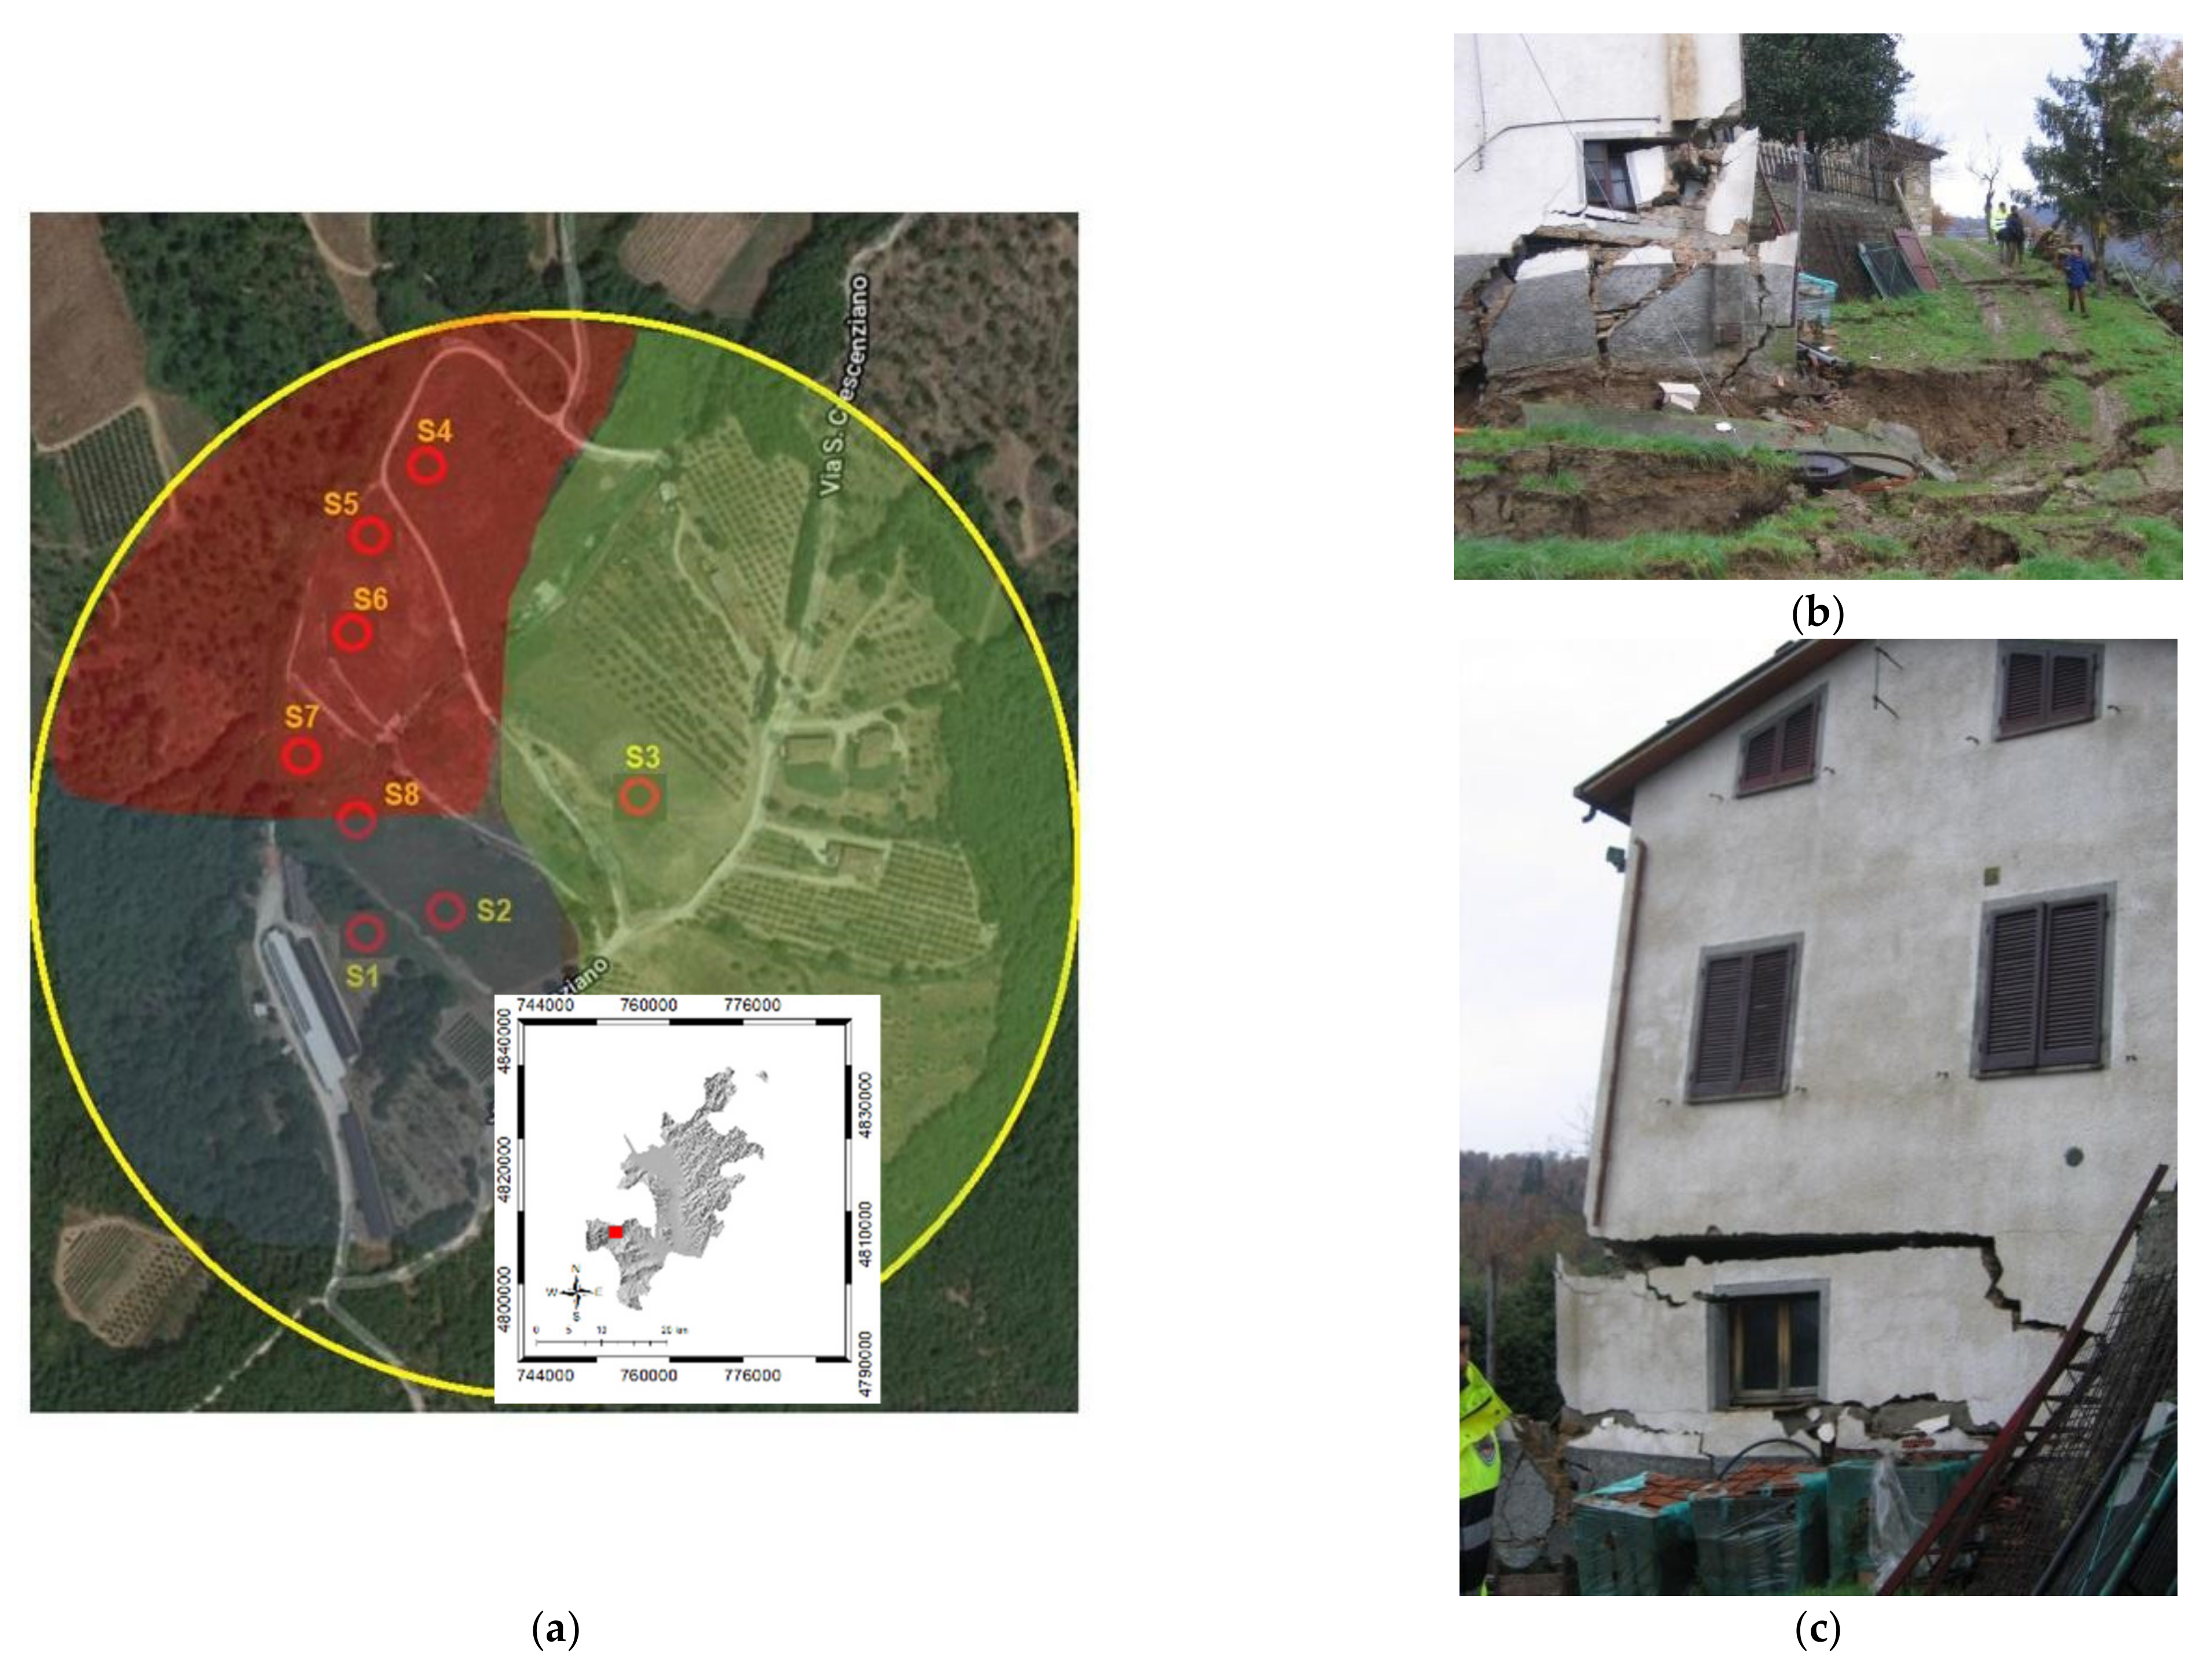
The model is organized into two blocks: the first assesses the pdfs, and the second performs the Monte Carlo simulations for the reliability analysis.
The comparison is carried out in terms of PoF estimations, by considering two different pdfs: (1) the assessed pdfr, evaluated by considering the actual variability of the random quantities; and (2) the uniform pdfu, which ignores the internal structure of the uncertainty considering only the possible or probable range of parameters variation. In the first case, the PoFr is obtained; in the second case, the PoFu is estimated.
To evaluate the influence of the pdf’s theoretical distribution, the Monte Carlo simulation was used for the reliability analysis. This approach requires knowledge of the pdf distributions of the random input variables in order to generate pseudorandom numbers for each random quantity.
The exact method consists of N deterministic analyses able to define the value assumed by a random dependent variable (the PoF in this case) connected to independent random input quantities. The PoF estimation, in addition to being connected to the accuracy of the estimation of the independent variables, is strictly linked to the number of simulations performed (N) and to the number of variables considered (m). N can be expressed as:
N = h α / 2 2 ε 2 m
where ε is given by the confidence level 1 − α, and hα/2 is the number of standard deviation units between the mean value and that defining the assigned confidence level. High confidence levels are required to ensure a good accuracy of the results.
For unrelated variables, and for the problem analyzed, the Monte Carlo method involves the generation of 5 sequences of random numbers. The N realizations provide a sample of possible values for the safety factor, Fs. In particular, the PoFu and PoFr were evaluated considering the number of Monte Carlo realizations for all cases equal to N = 100,00, corresponding to a possible estimate error of about 25%.

2.2. Study Area

The study area selected for the investigation is known as Nuvole di Morra (Figure 1a), a district located in the Città di Castello municipality (northern sector of the Umbria region, central Italy). The slopes are computed directly from a rather accurate digital elevation model, TINITALY/01, which is obtained starting from separate DEMs of single administrative regions of Italy available with a 10 m cell size grid. The slopes have a steepness varying between a maximum of 30° and a minimum of 5°, with the highest values in the west and southeast parts of the area.
The area, characterized by a high susceptibility to landslides, was affected by a damaging landslide in 2005 triggered by prolonged and heavy rainfall on 10 December 2005. The movement involved an area of about 45 Ha with a soil volume of 500,000 m3. The landslide appeared to be chiefly a reactivation of pre-existing landslides; however, areas not previously affected by old landslides were also affected by the new slope movement.
The landslide (Figure 1a) can be divided into three zones: the source area (red in Figure 1a), located in the northwest sector of the area; the entrainment area (blue in Figure 1a), located in the southwest sector; and the indirect movement area (green in Figure 1a), located in the east part.
Relevant damages were caused to structures and infrastructures, and several families were transferred to other safe places (Figure 1b,c). After the event, geotechnical surveys were planned to support the structural remedial work design and implementation.
In particular, in correspondence to 8 perforation tests (S1 to S8 in Figure 1a), 4 tests of Class Q5 (undisturbed sample) and 10 tests of Class Q3 (disturbed samples of Class 3) were analyzed. In addition to laboratory tests, 2 standard penetrometric tests (SPTs), 4 geometric multichannel analysis of surface waves (MASWs) tests, 4 seismic refraction profiles, and 3 permeability tests were performed.
In this study, the available in situ measurements were integrated with the information derived by the data set of Perugia Province [52,53] to obtain a detailed geotechnical characterization that makes this area particularly suitable for the evaluation of the impact of the pdf on the model performance.

2.3. Physical and Mechanical Properties
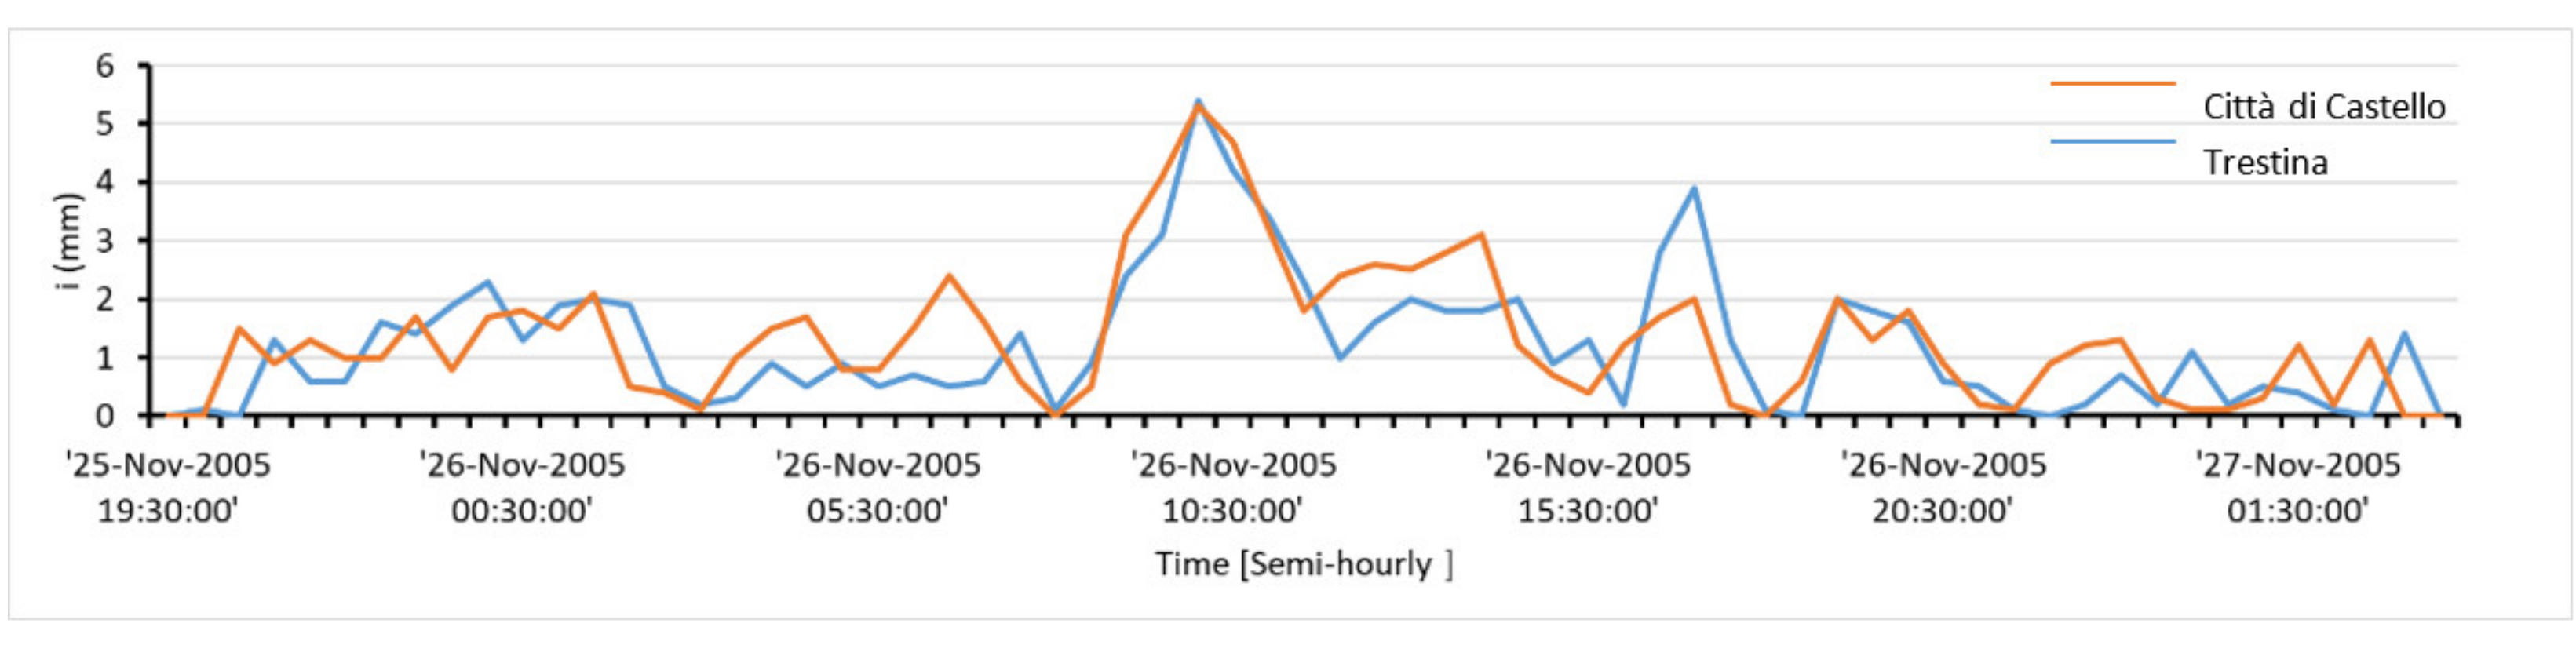
On the basis of the documentation related to the study area, the soil analyzed can be considered homogeneous [54]. According to the geological map of the Umbria region, the outcropping lithotype is “turbidites pelitic arenaceous” (also reported in the classification described in [52,53]). The definition of the stochastic parameters (mean value and coefficient of variation (COV)) for c’ and φ’ (Table 1) is derived from the integration between the regional data set information [51] and in situ test measurements, as mentioned previously in Section 3.
For the soil stiffness (Eed) and the hydraulic conductivity (ks), considering the few available measurements, literature data were used. In particular, for ks, characterized by a high variability, a log-normal distribution was considered, while for Eed, often delimited by two fixed extreme values, the beta distribution, which combines low values of physical quantity and a low probability of occurrence, was considered [34].
The thickness of the soil cover (h), for each cell of the grid, was evaluated using the following empirical formula:
H = 14exp(−0.07∗α)
where α is expressed in degrees [42], and h is a further random variable of the probabilistic model, considered normally distributed (Table 1).
The unit weight of the soil, γs, was assumed equal to 19 kN/m3, and the soil cover was considered homogeneous. Considering the significant rainfall events that affected the autumn of 2005, the stability conditions were precautionarily evaluated assuming the saturated conditions of the soil (Sr = 1).
In the absence of detailed information or recorded data, the initial prestorm water table depth (dw) was set equal to 50% of h, and the steady prestorm infiltration rate (ILT) was assumed to be negligible.

2.4. Rainfall Data

The role of the pdfs on the PoF evaluation is discussed with reference to the rainfall event that affected the Umbria region between September and December 2005. The large amount of rainfall triggered many shallow landslides; among these, Nuvole di Morra is the most relevant event.
Meteorological rainfall data for the study area were obtained through the rain gauges of the Umbria region’s monitoring network, which provides semihourly data, recorded continuously throughout the year 2005. The rainfall data recorded by the rain gauges of Città di Castello and Trestina (located near Città di Castello) were considered (Figure 2). In particular, the Morra landslide was triggered by rainfall observed between 25 and 28 November. The rainfall event considered an input in the probabilistic physically based landslide forecasting model was characterized by a total duration (t) of 32 h and cumulative rainfall of about 90 mm.

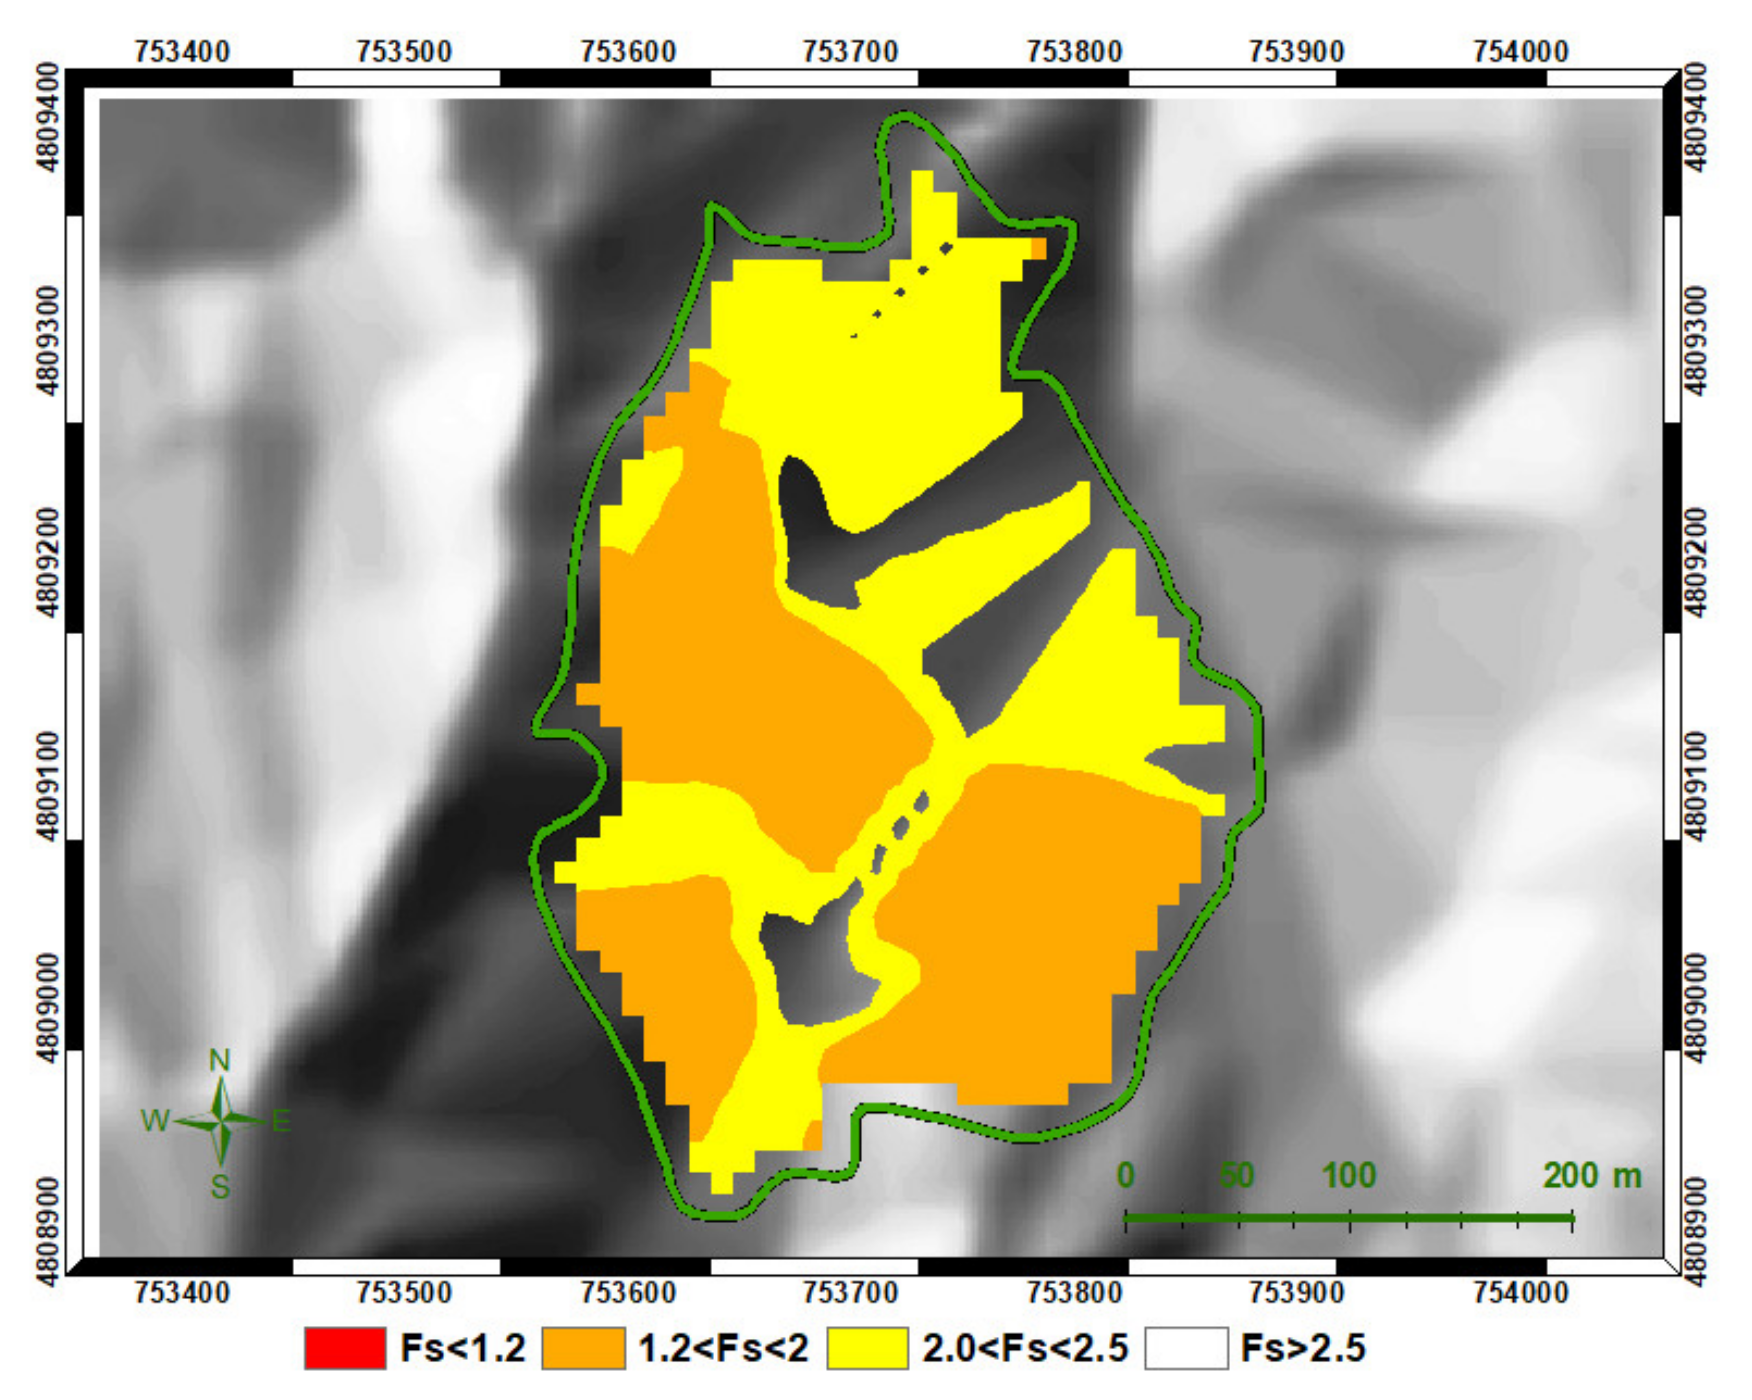
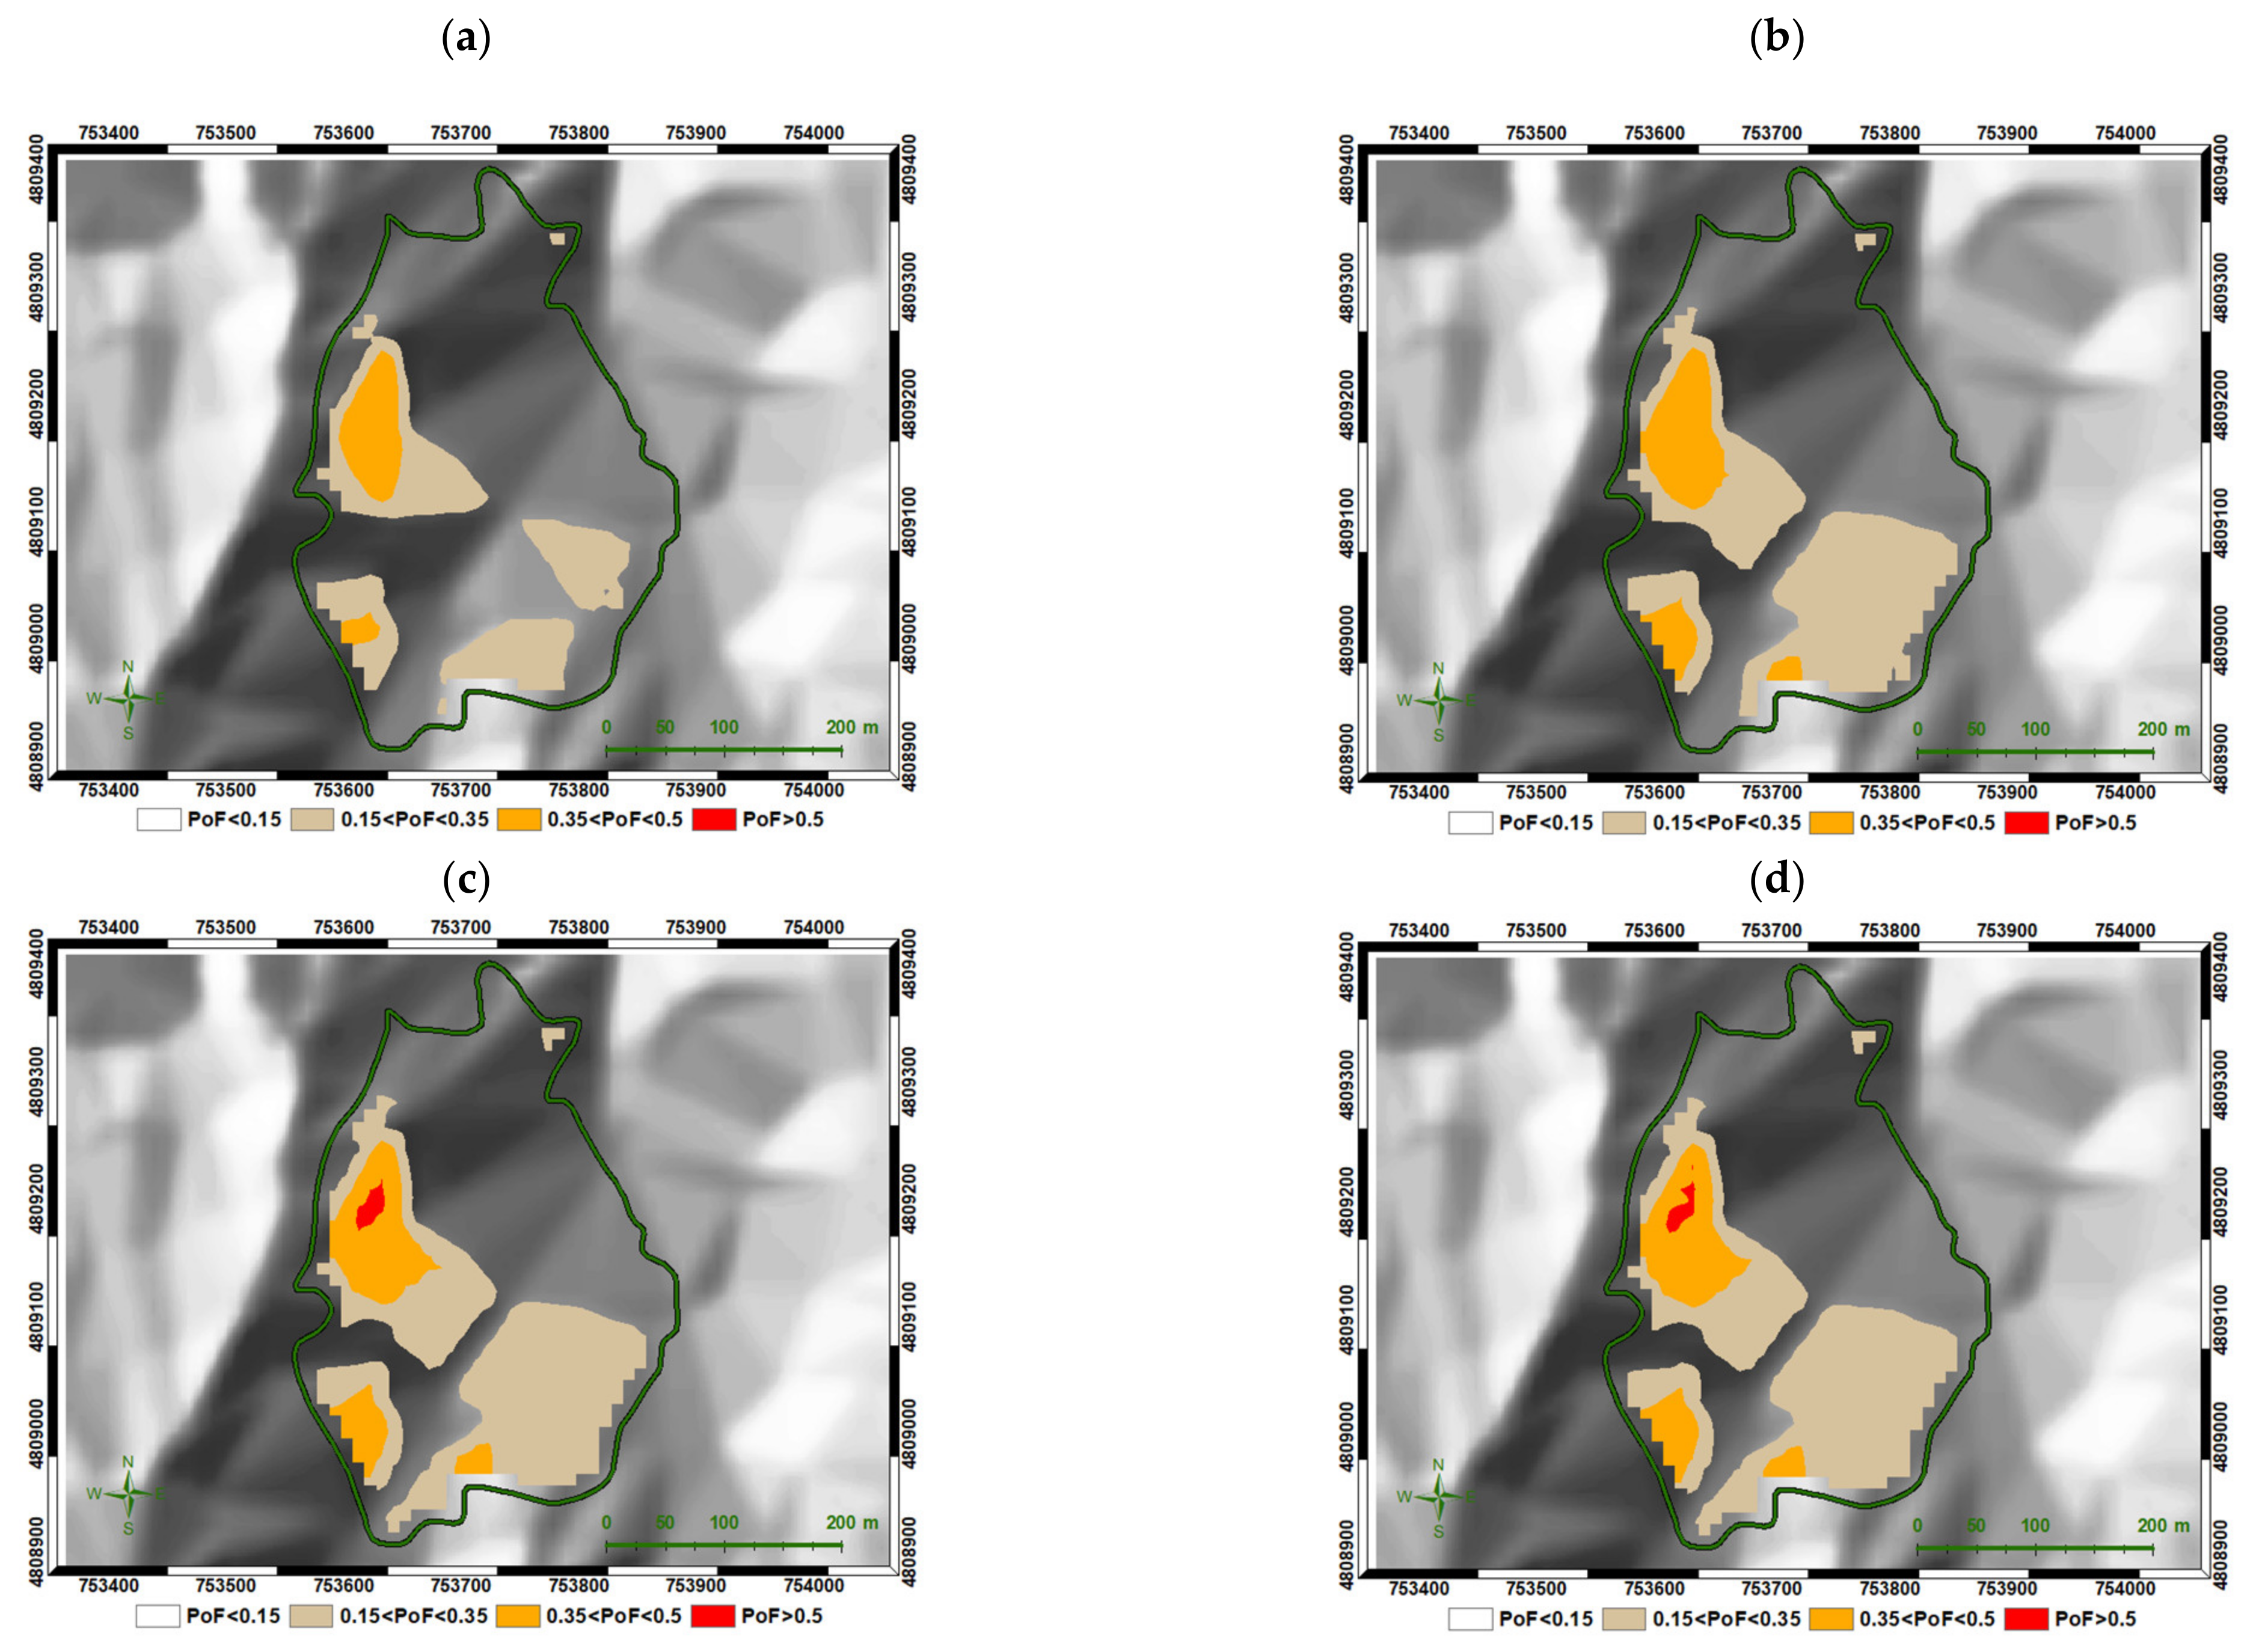
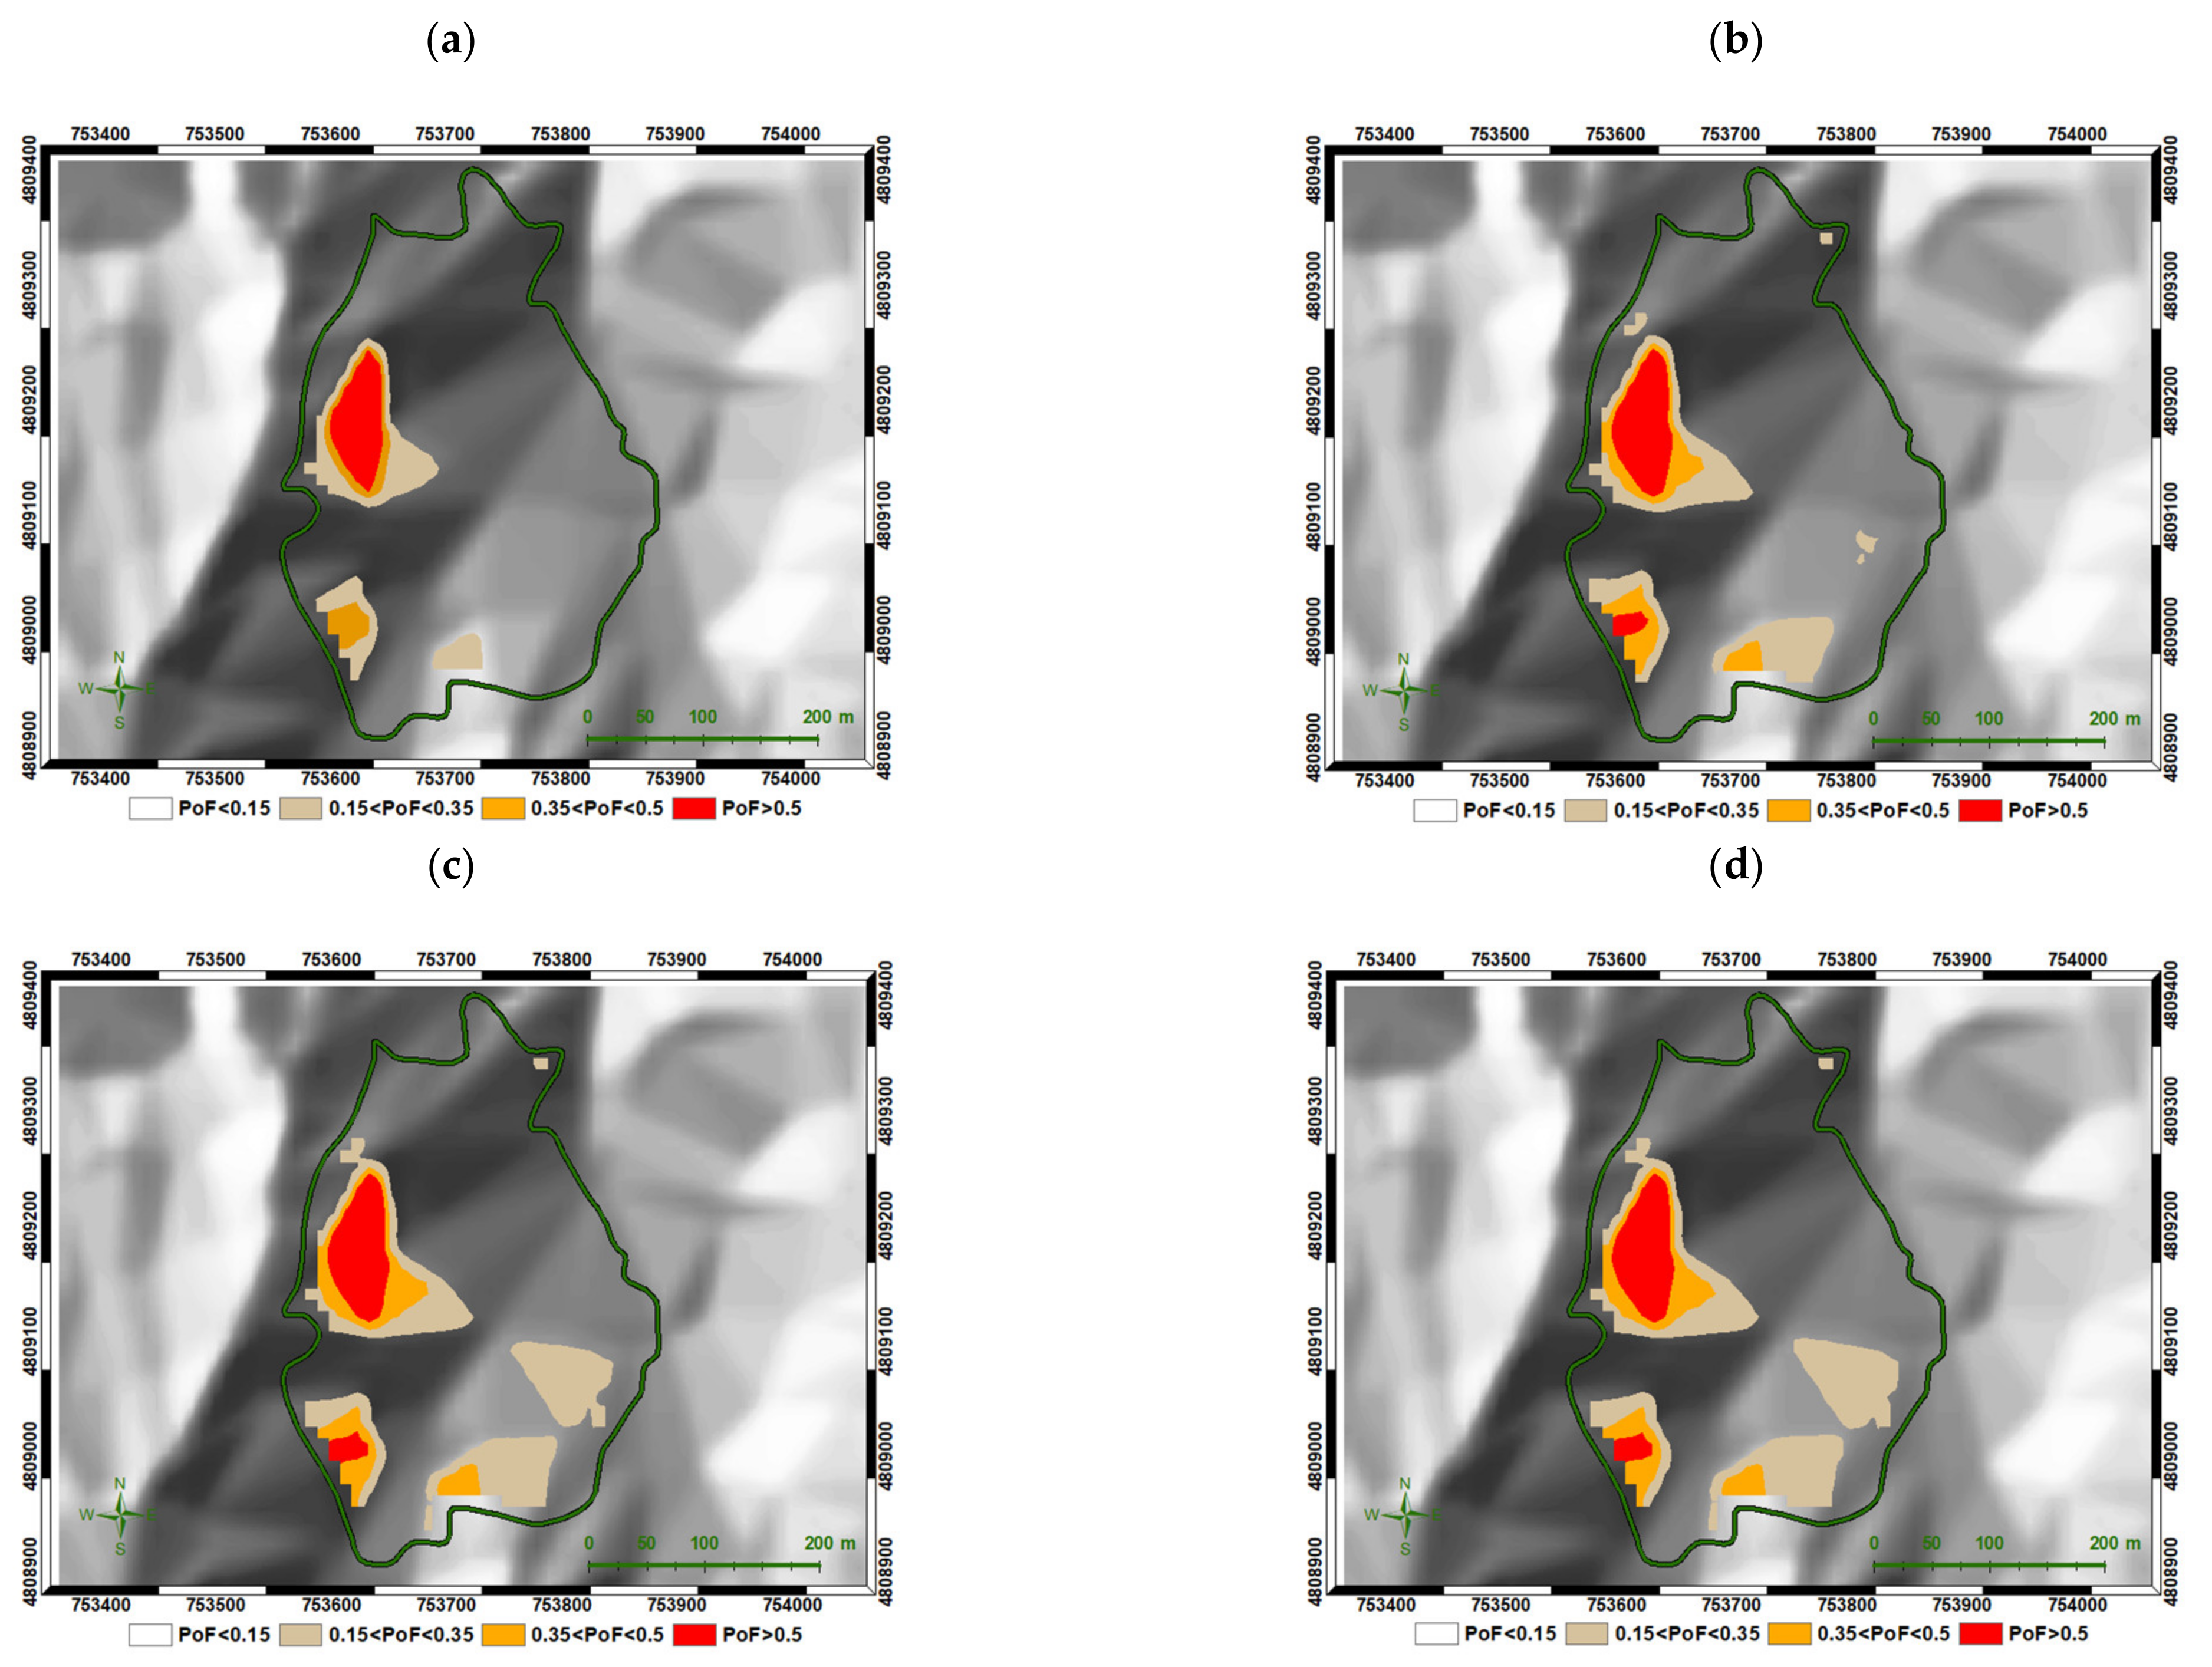
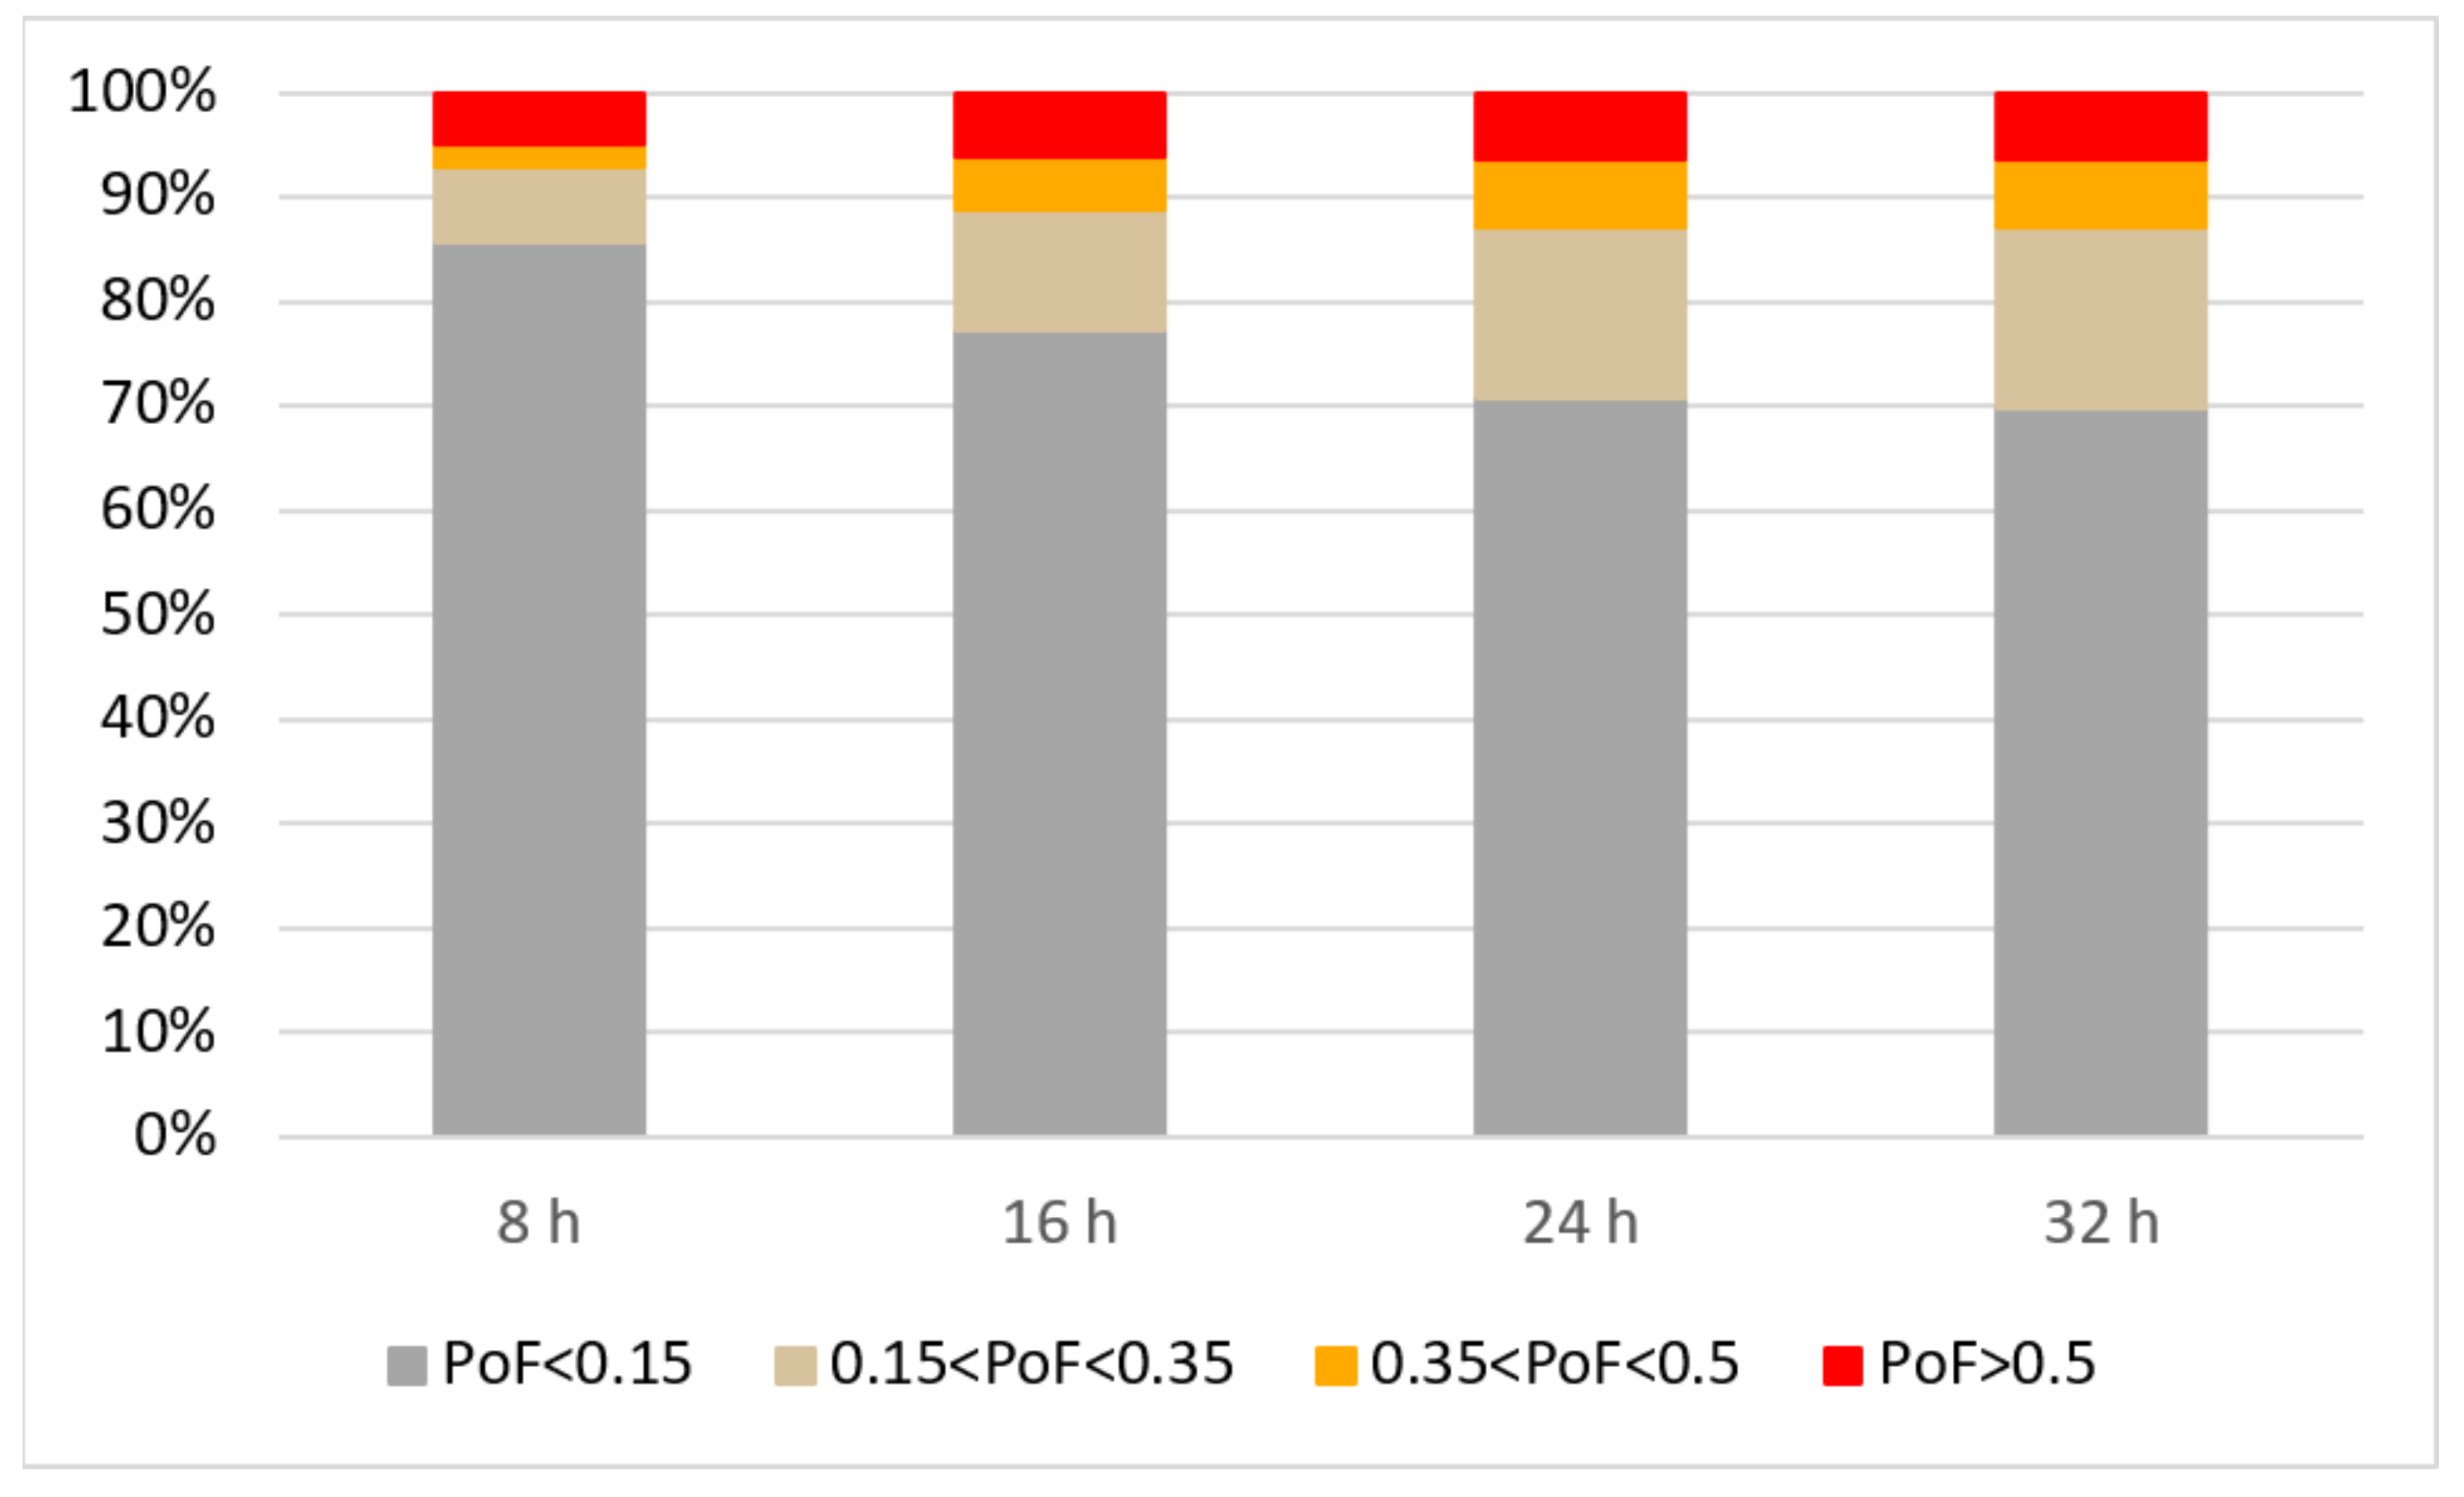
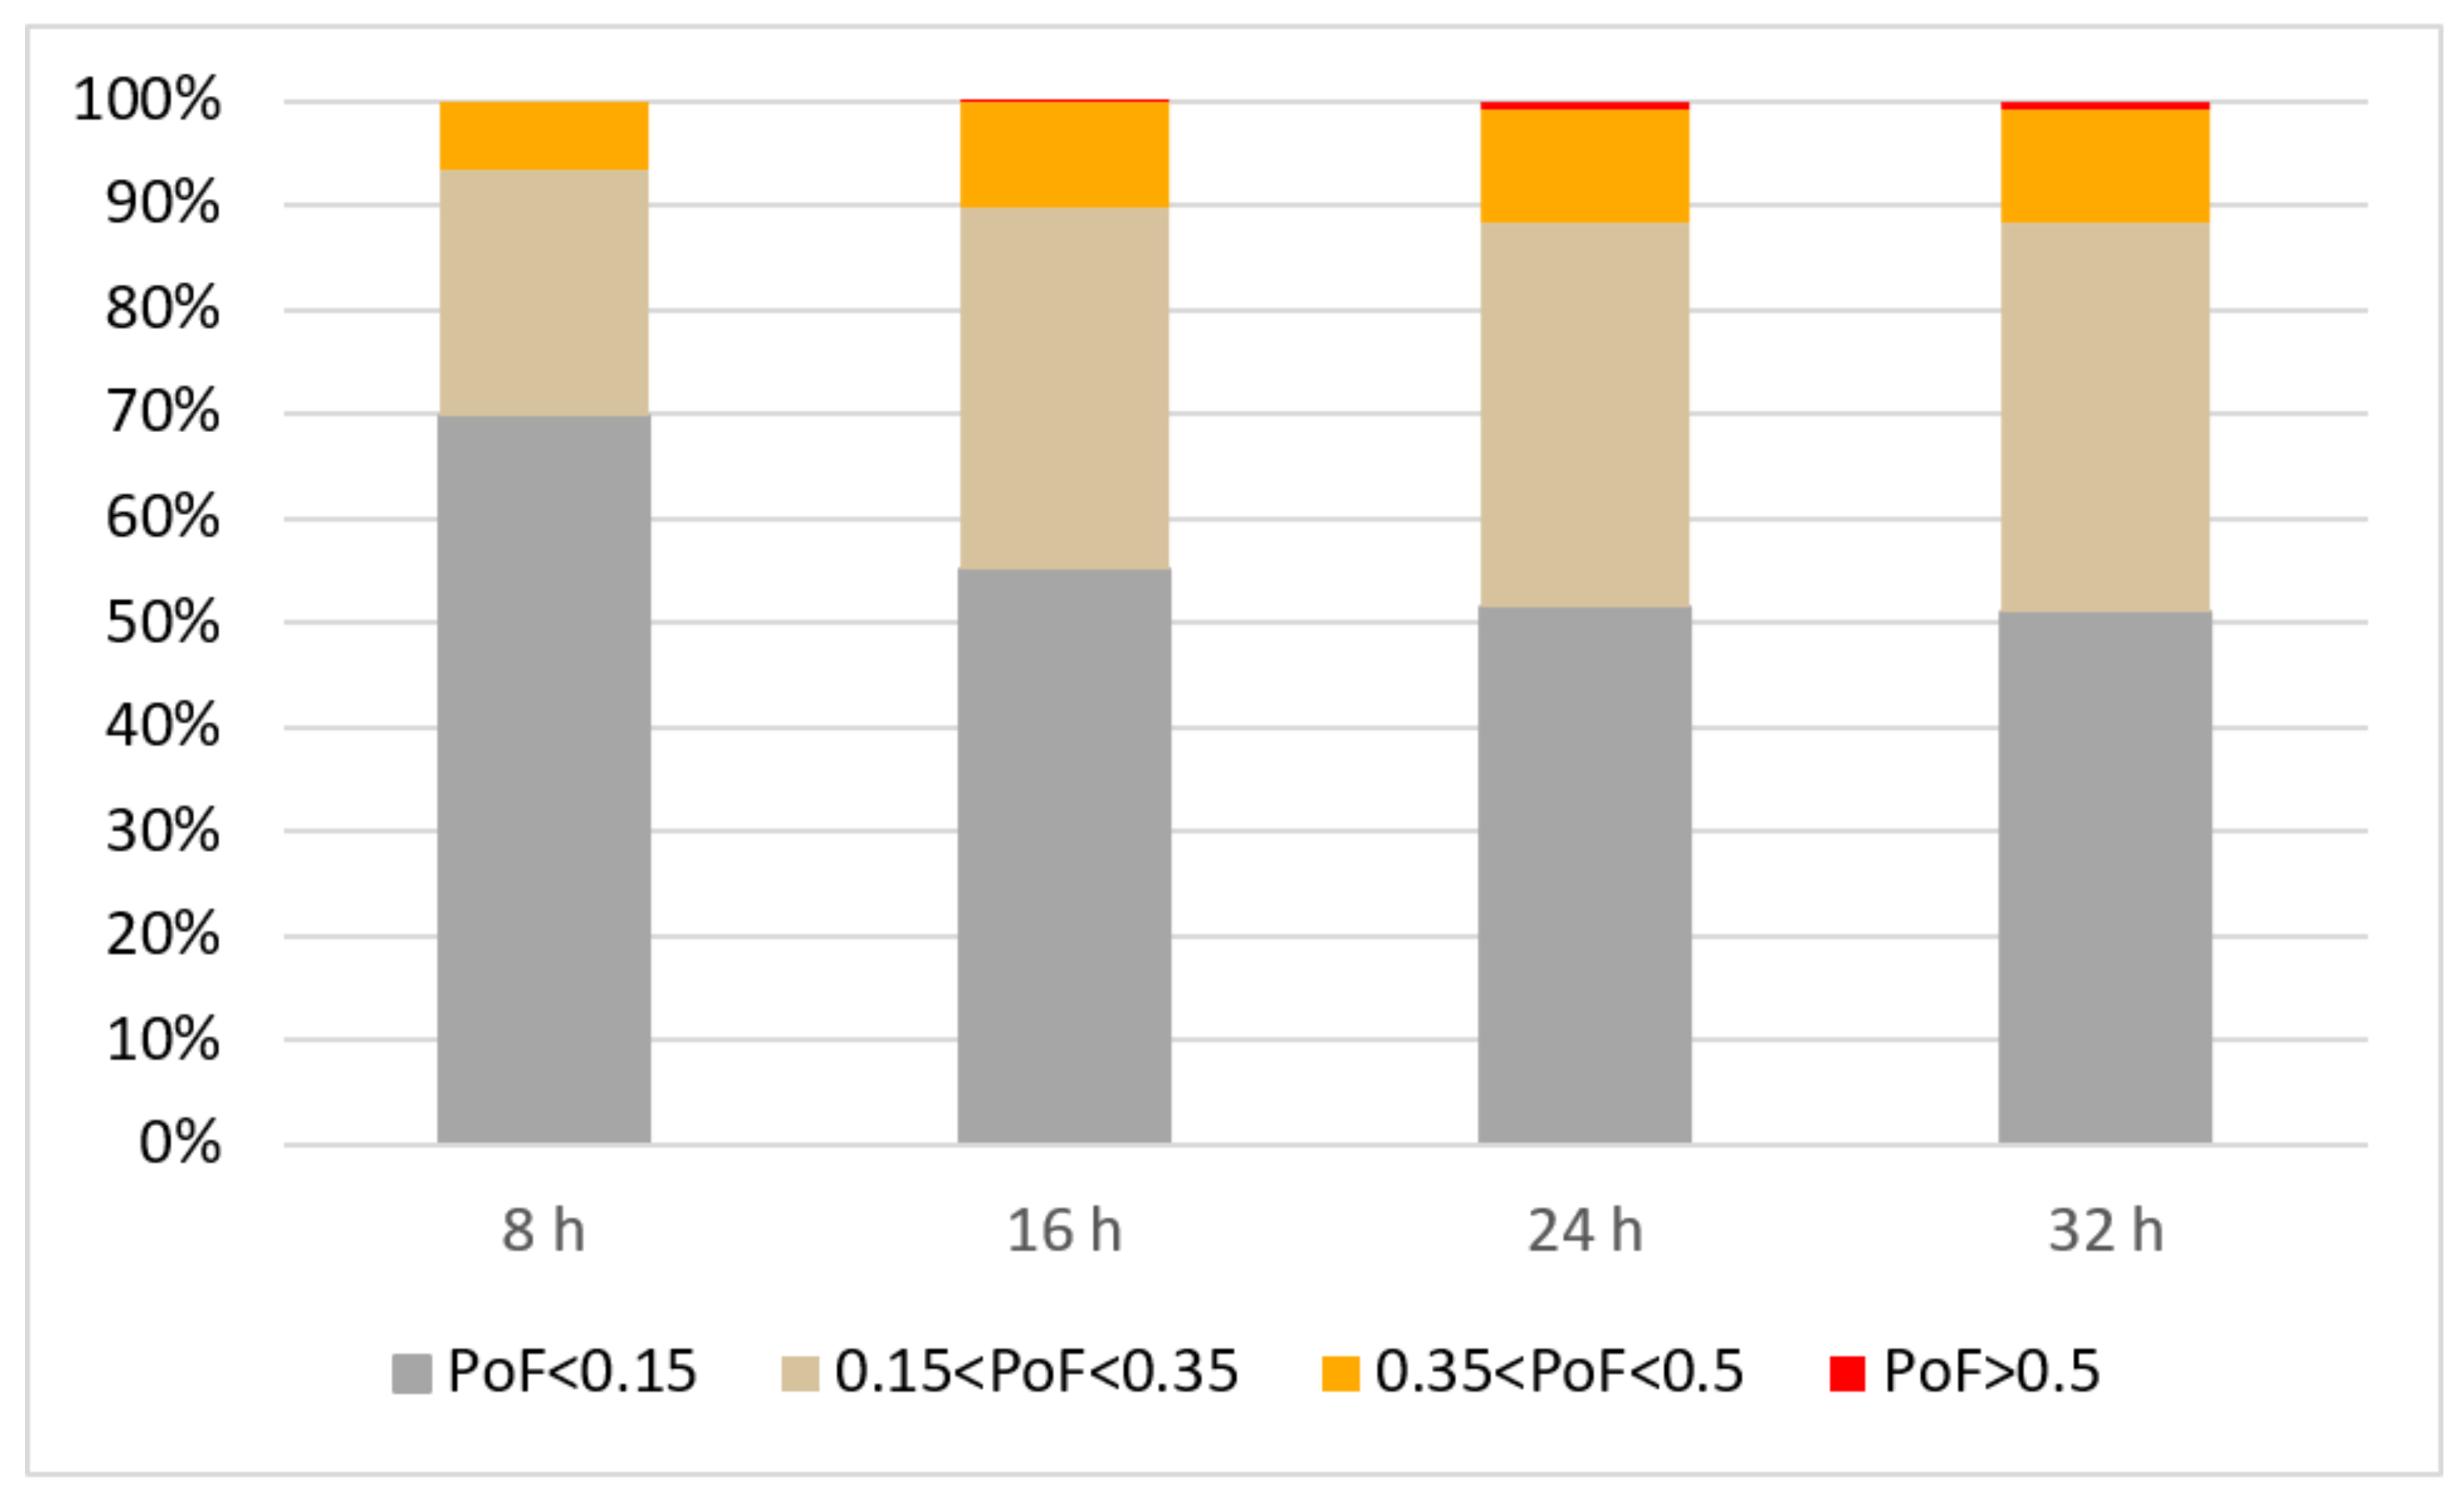
3. Results and Discussion

Figure 3 shows the spatial distribution of the safety factor FS evaluated by means of the TRIGRS code (deterministic analyses), considering the average deterministic values of the physical and mechanical soil properties reported in Table 1.
As shown in Figure 3, in the absence of rainfalls, the area is stable, with values of Fs always greater than unity. As can be expected, the areas characterized by high susceptibility to landslides correspond to the sectors characterized by the highest slope (west and southeast areas of the polygon in Figure 3).
The modified PG_TRIGRS code was applied to the study area to obtain predictions on its stability with different rainfall conditions. Using the rainfall event described in Section 2.4, the code provides the predictions shown in Figure 4. As expected, the stability conditions of the study area change during time, with the evolution of the rainfall event. To observe the effect of the rainfall on the model of spatially distributed predictions, the PoF is evaluated at four different time instants, td (td = 8 h, td = 16 h, td = 24 h, and (iv) td = t = 32 h), considering the uniform pdf for the random quantities (Figure 4).
Considering a subdivision of the PoF variability range into four classes (0 ≤ PoF < 0.15; 0.15 ≤ PoF < 0.35; 0.35 ≤ PoF < 0.5; PoF ≥ 0.5), as expected, at an early time (Figure 4a), there are no areas associated with a very high PoFu (PoF > 50%). As time increases (Figure 4b), the PoFu starts to increase, and there is a transition from low (white cells) to high PoFu levels (orange and red pixels). Starting from time t = 24 h (Figure 4c), cells with a PoFu variable between 15% and 50% start to concentrate in the southeast and west sector of the landscape.
At the end of the storm (Figure 4d), the stability conditions are similar to those shown for t = 24 h. In the last 8 h, the rain intensity of the event is low, and it corresponds to a cumulative rainfall of 8 mm.
In the second simulation, the pdf based on the actual measures of the study area was used. Similar results are obtained for PoFr; in particular, at the beginning of the event (Figure 5a), areas in the western sector depicted by PoFr > 50% are observed. The first 8 h of rain are characterized by a cumulative rain intensity of about 20 mm.
As time increases, the pixels that fall in the very high PoFr class do not increase (Figure 5b), but a transition from a low PoFr (white cells) to medium PoFr values (beige and orange cells) in the southeast sector is visible (Figure 5c,d).
In this case, the stability conditions reached at t = 24 h are similar to those obtained at the end of the event.
A similar spatial PoF distribution can be observed in Figure 4 and Figure 5. The portions characterized by a higher probability of failure are distributed in the same sectors of the area; however, the pixels that as time progresses pass into higher PoF classes are different (Figure 6 and Figure 7).
It is possible to notice, as expected, that with increasing rainfall time, the areas characterized by a lower PoF decrease (in both cases of PoFr and PoFu), as long as the areas with bigger PoF values increase. It can also be noticed that there is an increase in the rainfall time of areas characterized by PoFr > 50 (red classes), while the red classes of PoFu retain small and almost constant values.
In particular, from the histograms drawn in Figure 6 and Figure 7, it can be noted that:
-
A decreasing trend with time of rainfall can be observed for gray classes: after 8 h of rainfall, the areas involved by PoFr < 15% are about 85%, and those by PoFu < 15% are about 70%, while after 32 h, gray PoFr classes reach 70%, and gray PoFu classes about 50%;
-
An increasing trend with time of rainfall can be observed for both beige (15% < PoF < 35%) and orange (35% < PoF < 50%) classes;
-
In the case of the more dangerous classes (red classes), it can be noticed that the red PoFr portions pass from about 5% (td = 8 h) to 8% (td = 32 h), while the red PoFu areas are negligible during all the duration of the rainfall (they reach about 1% at the end of the rainfall).
To promote a quantitative comparison between two approaches, the quantity:
Δ E = P o F u P o F r
was evaluated. For the sake of brevity, only the comparison in relation to the end of the event is shown (Figure 8).
The areas where the quantity Δ E is negative, thus PoFr > PoFu, correspond to the areas characterized by the highest PoF (red class in Figure 4 and Figure 5); the portions characterized by a positive or null value of Δ E correspond to areas with a lower probability of failure (white and beige pixels in Figure 4 and Figure 5).
Considering the topographic features measure after the Morra landslide, the sector in which Δ E is negative corresponds to the triggering area of the landslide, and the portion in which Δ E is positive corresponds to the secondary area of the sliding phenomenon.
In conclusion, the PB probabilistic model with a realistic pdf provides a higher PoFr in the trigger zones; the PB model with a uniform pdf provides a higher PoFu in the less susceptible sectors. The use of a uniform pdf then produces: (i) a nonprecautionary estimate of the failure conditions in the most vulnerable areas and (ii) false alarms in the stable slopes (through a PoF overestimation in areas characterized by small instability conditions).
Therefore, the link between the reliability of the results and the pdfs definition for the input random variables represents a crucial aspect in stochastic PB models, even if the attention of the scientific community has been mainly paid to the comparison between the results of the statistical and deterministic analysis [11,12,55,56].

4. Conclusions

The physical process that leads to slope failure is characterized by multiple uncertainties, which should never be considered null. The uncertainty of the quantities involved is considered in probabilistic approaches where the safety level of the slope is expressed as a random variable, quantified by the probability of the failure PoF.
The PoF evaluation is strictly related to the theoretical pdfs considered for the input quantities of the forecast models. In this work, it was shown that the definition of pdfs for the physical and mechanical properties of the soil influences the reliability analysis; this effect has been quantified with the exact method of Monte Carlo. The probability of failure was computed in relation to a particular case study where a detailed geotechnical characterization is available. This feature supports the possibility to define a pdf that is other than uniform. In addition, the small extension of the study area ensures a good compromise between the reliability of the results and the calculation times, which can prohibit results for too large a scale. In relation to the Morra area, the results show that differences between PoFu and PoFr are not negligible. In the portion of the area characterized by high susceptibility to landslides, the use of the pdfu seems to lead to nonprecautionary PoF estimates (PoFu < PoFr). On the contrary, in areas characterized by lower susceptibility, the PoFu appears to overestimate the conditions of potential instability (PoFu > PoFr). This trend occurs in relation to all the time instants considered to be independent of the rainfall intensities observed.
In order to generalize the results, the comparison in terms of the PoF on other study areas is necessary and large areas, characterized by different morphologies, will be considered in future research.
Properly defining pdfs for random parameters not only improves the reliability of the results but promotes a more informed use of physics-based probabilistic approaches.

Author Contributions

Conceptualization, E.V.; writing—original draft preparation, E.V.; writing—review and editing, S.C. and L.C.; supervision, L.B., E.C. and D.S. All authors have read and agreed to the published version of the manuscript.

Funding

This research received no external funding.

Data Availability Statement

Not applicable.

Conflicts of Interest

The authors declare no conflict of interest.

References

  1. Salciarini, D.; Brocca, L.; Camici, S.; Ciabatta, L.; Volpe, E.; Massini, R.; Tamagnini, C. Physically based approach for rainfall-induced landslide projections in a changing climate. Proc. Inst. Civ. Eng. Geotech. Eng. 2019, 172, 481–495. [Google Scholar] [CrossRef]
  2. Alvioli, M.; Melillo, M.; Guzzetti, F.; Rossi, M.; Palazzi, E.; von Hardenberg, J.; Brunetti, M.T.; Peruccacci, S. Implications of climate change on landslide hazard in Central Italy. Sci. Total Environ. 2018, 630, 1528–1543. [Google Scholar] [CrossRef]
  3. Ciabatta, L.; Camici, S.; Brocca, L.; Ponziani, F.; Stelluti, M.; Berni, N.; Moramarco, T. Assessing the impact of climate-change scenarios on landslide occurrence in Umbria Region, Italy. J. Hydrol. 2016, 541, 285–295. [Google Scholar] [CrossRef]
  4. Haque, U.; da Silva, P.F.; Devoli, G.; Pilz, J.; Zhao, B.; Khaloua, A.; Wilopo, W.; Andersen, P.; Lu, P.; Lee, J.; et al. The human cost of global warming: Deadly landslides and their triggers (1995–2014). Sci. Total Environ. 2019, 682, 673–684. [Google Scholar] [CrossRef]
  5. Gariano, S.L.; Melillo, M.; Peruccacci, S.; Brunetti, M.T. How much does the rainfall temporal resolution affect rainfall thresholds for landslide triggering? Nat. Hazards 2020, 100, 655–670. [Google Scholar] [CrossRef] [Green Version]
  6. Guzzetti, F.; Cardinali, M.; Reichenbach, P. The AVI project: A bibliographical and archive inventory of landslides and floods in Italy. Environ. Manag. 1994, 18, 623–633. [Google Scholar] [CrossRef]
  7. Guzzetti, F.; Tonelli, G. Information system on hydrological and geomorphological catastrophes in Itlay (SICI): A tool for managing landslide and flood hazards. Nat. Hazards Earth Syst. Sci. 2004, 4, 213–232. [Google Scholar] [CrossRef]
  8. Trigila, A.; Iadanza, C.; Spizzichino, D. Quality assessment of the Italian Landslide Inventory using GIS processing. Landslides 2010, 7, 455–470. [Google Scholar] [CrossRef]
  9. Peruccacci, S.; Brunetti, M.T.; Gariano, S.L.; Melillo, M.; Rossi, M.; Guzzetti, F. Rainfall thresholds for possible landslide occurrence in Italy. Geomorphology 2017, 290, 39–57. [Google Scholar] [CrossRef]
  10. Brunetti, M.T.; Luino, F.; Vennari, C.; Peruccacci, S.; Biddoccu, M.; Valigi, D.; Luciani, S.; Cirio, C.G.; Rossi, M.; Nigrelli, G.; et al. Rainfall Thresholds for Possible Occurrence of Shallow Landslides and Debris Flows in Italy. In Dating Torrential Processes on Fans and Cones. Advances in Global Change Research; Schneuwly-Bollschweiler, M., Stoffel, M., Rudolf-Miklau, F., Eds.; Springer: Dordrecht, The Netherlands, 2013; Volume 47. [Google Scholar] [CrossRef]
  11. Sestras, P.; Bilașco, Ș.; Roșca, S.; Dudic, B.; Hysa, A.; Spalević, V. Geodetic and UAV Monitoring in the Sustainable Management of Shallow Landslides and Erosion of a Susceptible Urban Environment. Remote Sens. 2021, 13, 385. [Google Scholar] [CrossRef]
  12. Zhang, L.; Wang, X.; Xia, T.; Yang, B.; Yu, B. Deformation Characteristics of Tianjiaba Landslide Induced by Surcharge. ISPRS Int. J. Geo-Inf. 2021, 10, 221. [Google Scholar] [CrossRef]
  13. Aleotti, P.; Chowdhury, R. Landslide hazard assessment: Summary review and new perspectives. Bull. Int. Assoc. Eng. Geol. 1999, 58, 21–44. [Google Scholar] [CrossRef]
  14. Guzzetti, F.; Carrara, A.; Cardinali, M.; Reichenbach, P. Landslide hazard evaluation: A review of current techniques and their application in a multi-scale study, Central Italy. Geomorphology 1999, 31, 181–216. [Google Scholar] [CrossRef]
  15. Brabb, E. Innovative Approaches for Landslide Hazard Evaluation. IV Int. Symp. Landslides 1984, 1, 307–323. [Google Scholar]
  16. Gariano, S.L.; Guzzetti, F. Landslides in a changing climate. Earth-Sci. Rev. 2016, 162, 227–252. [Google Scholar] [CrossRef] [Green Version]
  17. Srivastava, R.; Yeh, T.-C.J. Analytical solutions for one-dimensional, transient infiltration toward the water table in homogeneous and layered soils. Water Resour. Res. 1991, 27, 753–762. [Google Scholar] [CrossRef]
  18. Conte, E.; Troncone, A. A method for the analysis of soil slips triggered by rainfall. Géotechnique 2012, 62, 187–192. [Google Scholar] [CrossRef]
  19. Zhang, J.; Zhu, D.; Zhang, S. Shallow slope stability evolution during rainwater infiltration considering soil cracking state. Comput. Geotech. 2020, 117, 103285. [Google Scholar] [CrossRef]
  20. Xu, J.; Zhao, X.; Li, P.; Zhang, M. Stability of a 3D unsaturated vertical cut slope subjected to variable rainfall infiltration. Comput. Geotech. 2021, 134, 104110. [Google Scholar] [CrossRef]
  21. Montgomery, D.R.; Dietrich, W.E. A physically based model for the topographic control on shallow landsliding. Water Resour. Res. 1994, 30, 1153–1171. [Google Scholar] [CrossRef]
  22. Wu, W.; Sidle, R.C. A Distributed Slope Stability Model for Steep Forested Basins. Water Resour. Res. 1995, 31, 2097–2110. [Google Scholar] [CrossRef]
  23. Iverson, R.M. Landslide triggering by rain infiltration. Water Resour. 2000, 36, 1897–1910. [Google Scholar] [CrossRef] [Green Version]
  24. Jibson, R.W.; Harp, E.L.; A Michael, J. A method for producing digital probabilistic seismic landslide hazard maps. Eng. Geol. 2000, 58, 271–289. [Google Scholar] [CrossRef]
  25. Baum, R.L.; Savage, W.Z.; Godt, J.W. TRIGRS—A FORTRAN program for transient rainfall infiltration and grid-based regional slope stability analysis. US Geol. Surv. Open File Rep. 2002, 424, 38. [Google Scholar]
  26. Baum, R.L.; Savage, W.Z.; Godt, J.W. TRIGRS—A FORTRAN Program for Transient Rainfall Infiltration and Grid-Based Regional Slope-Stability Analysis, Version 2.0 U.S. Geological Survey Open-File Report 2008-1159. Available online: https://pubs.usgs.gov/of/2008/1159 (accessed on 21 July 2008).
  27. Frattini, P.; Crosta, G.B.; Fusi, N.; Negro, P.D. Shallow landslides in pyroclastic soils: A distributed modelling approach for hazard assessment. Eng. Geol. 2004, 73, 277–295. [Google Scholar] [CrossRef]
  28. Salciarini, D.; Volpe, E.; Kelley, S.A.; Brocca, L.; Camici, S.; Fanelli, G.; Tamagnini, C. Modeling the Effects Induced by the Expected Climatic Trends on Landslide Activity at Large Scale. Procedia Eng. 2016, 158, 541–545. [Google Scholar] [CrossRef] [Green Version]
  29. Salciarini, D.; Tamagnini, C.; Conversini, P.; Rapinesi, S. Spatially distributed rainfall thresholds for the initiation of shallow landslides. Nat. Hazards 2011, 61, 229–245. [Google Scholar] [CrossRef]
  30. Salciarini, D.; Tamagnini, C.; Ponziani, F.; Berni, N. Defining Physically-Based Rainfall Thresholds for Early Warning Systems. Landslide Sci. Pract. 2013, 1, 651–657. [Google Scholar]
  31. Schilirò, L.; Cepeda, J.; Devoli, G.; Piciullo, L. Regional Analyses of Rainfall-Induced Landslide Initiation in Upper Gudbrandsdalen (South-Eastern Norway) Using TRIGRS Model. Geoscience 2021, 11, 35. [Google Scholar] [CrossRef]
  32. Lind, N. Modelling of uncertainty in discrete dynamical systems. Appl. Math. Model. 1983, 7, 146–152. [Google Scholar] [CrossRef]
  33. Godt, J.; Baum, R.; Savage, W.; Salciarini, D.; Schulz, W.; Harp, E. Transient deterministic shallow landslide modeling: Requirements for susceptibility and hazard assessments in a GIS framework. Eng. Geol. 2008, 102, 214–226. [Google Scholar] [CrossRef]
  34. Fenton, G.A.; Griffiths, D.V. Risk Assessment in Geotechnical Engineering; Wiley: New York, NY, USA, 2008. [Google Scholar]
  35. Lacasse, S.; Nadim, F. Uncertainties in Characterizing Soil Properties. In Proc. ASCE Special Technical Publication 58: Uncertainty in the Geologic Environment—From Theory to Practice; Pacific Earthquake Engineering Research Center (PEER): Richmond, CA, USA, 1996. [Google Scholar]
  36. Calvello, M. Dispense del Corso di Frane e Stabilità dei pendii. Personal communication, 2012. [Google Scholar]
  37. Caira, M.; Carcassi, M.; Carpignano, A.; Castiglia, F.; Zio, E. Le Incertezze Nelle Analisi di Rischio. Rapp. Tecn. Available online. IHMC Cmap-Tools 2006-01, Florida Institute for Human e Machine Cognition. 2006. Available online: http://conference.ing.unipi.it/vgr2006/archivio/Articoli/285.pdf (accessed on 30 July 2021).
  38. Baecher, G.B.; Christian, J.T. Reliability and Statistics in Geotechnical Engineering; John Wiley & Sons: Hoboken, NJ, USA, 2005. [Google Scholar]
  39. Montrasio, L.; Valentino, R. A model for triggering mechanisms of shallow landslides. Nat. Hazards Earth Syst. Sci. 2008, 8, 1149–1159. [Google Scholar] [CrossRef]
  40. Cascini, L.; Cuomo, S.; Pastor, M.; Sorbino, G. Modeling of Rainfall-Induced Shallow Landslides of the Flow-Type. J. Geotech. Geoenviron. Eng. 2010, 136, 85–98. [Google Scholar] [CrossRef]
  41. Crosta, G.B.; Frattini, P. Distributed modelling of shallow landslides triggered by intense rainfall. Nat. Hazards Earth Syst. Sci. 2003, 3, 81–93. [Google Scholar] [CrossRef] [Green Version]
  42. Salciarini, D.; Godt, J.W.; Savage, W.Z.; Conversini, P.; Baum, R.L.; Michael, J.A. Modeling regional infiltration of rainfall induced shallow landslides in the eastern Umbria region of central Italy. Landslides 2006, 3, 181–194. [Google Scholar] [CrossRef]
  43. Salciarini, D.; Godt, J.; Savage, W.Z.; Baum, R.; Conversini, P. Modeling landslide recurrence in Seattle, Washington, USA. Eng. Geol. 2008, 102, 227–237. [Google Scholar] [CrossRef]
  44. Cascini, L.; Calvello, M.; Grimaldi, G.M. Groundwater Modeling for the Analysis of Active Slow-Moving Landslides. J. Geotech. Geoenviron. Eng. 2010, 136, 1220–1230. [Google Scholar] [CrossRef]
  45. Salciarini, D.; Volpe, E.; Cattoni, E. Probabilistic vs. Deterministic Approach in Landslide Triggering Prediction at Large–scale. In Geotechnical Research for Land Protection and Development; Part of the Lecture Notes in Civil Engineering Book Series (LNCE, Volume 40); Springer International Publishing: Cham, Switzerland, 2020; pp. 62–70. [Google Scholar]
  46. Nadim, F. Tools and Strategies for Dealing with Uncertainty in Geotechnics; Springer: Berlin/Heidelberg, Germany, 2007; Volume 491, pp. 71–95. [Google Scholar]
  47. Harr, M.E. Reliability-Based Design in Civil Engineering; Dover Publications, Department of Civil Engineering, School of Engineering, North Carolina State University: Raleigh, NC, USA, 1984. [Google Scholar]
  48. Papaioannou, I.; Straub, D. Reliability updating in geotechnical engineering including spatial variability of soil. Comput. Geotech. 2012, 42, 44–51. [Google Scholar] [CrossRef] [Green Version]
  49. Park, H.J.; Lee, J.H.; Woo, I. Assessment of rainfall-induced shallow landslide susceptibility using a GIS-based probabilistic approach. Eng. Geol. 2013, 161, 1–15. [Google Scholar] [CrossRef]
  50. Raia, S.; Alvioli, M.; Rossi, M.; Baum, R.L.; Godt, J.W.; Guzzetti, F. Improving predictive power of physically based rainfall-induced shallow landslide models: A probabilistic approach. Geosci. Model. Dev. 2014, 7, 495–514. [Google Scholar] [CrossRef] [Green Version]
  51. Salciarini, D.; Fanelli, G.; Tamagnini, C. A probabilistic model for rainfall—Induced shallow landslide prediction at the regional scale. Landslides 2017, 14, 1731–1746. [Google Scholar] [CrossRef]
  52. Fanelli, G.; Salciarini, D.; Tamagnini, C. Reliable soil property maps over large areas: A case study in central Italy. Environ. Eng. Geosci. 2016, 22, 37–52. [Google Scholar] [CrossRef]
  53. Salciarini, D.; Tamagnini, C.; Ronchi, F.; Volpe, E.; Fanelli, G. An approach for large-scale soil characterization for the application of non-structural landslide risk mitigation. Riv. Ital. Ing. Geotec. 2017, 51, 7–21. [Google Scholar]
  54. Regione Umbria. Italian Report: Analisi del Dissesto in Umbria ed Eventi di Frana del Novembre, Umbria Region Report n.1. 2005. Available online: https://www.isprambiente.gov.it/it (accessed on 30 July 2021).
  55. Borrelli, L.; Ciurleo, M.; Gullà, G. Shallow landslide susceptibility assessment in granitic rocks using GIS-based statistical methods: The contribution of the weathering grade map. Landslides 2018, 15, 1127–1142. [Google Scholar] [CrossRef]
  56. Ciurleo, M.; Cascini, L.; Calvello, M. A comparison of statistical and deterministic methods for shallow landslide susceptibility zoning in clayey soils. Eng. Geol. 2017, 223, 71–81. [Google Scholar] [CrossRef]
Figure 1. (a) Study area location, landslide area (yellow polygon), and position of geotechnical tests: S1–S8; (b,c) photos taken after the landslide event of 10 December 2005.
Geosciences 11 00322 g001
Figure 2. Semihourly rainfall intensity recorded by rain gauges of Trestina (blue line) and Città di Castello (orange line).
Geosciences 11 00322 g002
Figure 3. Spatial distribution of Fs evaluated considering the mean deterministic values defined in Table 1 for the physical and mechanical properties of the soil. The green polygon denotes the landslide area.
Geosciences 11 00322 g003
Figure 4. Maps of the probability of failure computed considering the uniform pdf (PoFu) for the random variables in input in the PB model. (a) td = 8 h; (b) td = 16 h; (c) td = 24 h; (d) td = 32 h.
Geosciences 11 00322 g004
Figure 5. Maps of the probability of failure (PoFr) computed considering the pdf defined in Table 1 for the random variables in input in the PB model. (a) td = 8 h; (b) td = 16 h; (c) td = 24 h; (d) td = 32 h.
Geosciences 11 00322 g005
Figure 6. Number of cells in each PoFr class for different time instants td of the rainfall event.
Geosciences 11 00322 g006
Figure 7. Number of cells in each PoFu class for different time instants td of the rainfall event.
Geosciences 11 00322 g007
Figure 8. Map showing the spatial distribution of Δ E evaluated at the end of the rainfall event.
Geosciences 11 00322 g008
Table 1. Physical and mechanical soil characterization used in the reliability analysis.
Random VariableSymbolUnitpdfMeanCOV
Effective friction angleφ′(deg)Normal300.20
Effective cohesionc(kPa)Log-normal50.25
Saturated hydraulic conductivityks(m/s)Log-normal5 × 10−71
Oedometric modulusEed(kPa)Beta1 × 10−40.18
Thickness of the soil coverh(m)Normal14exp(−0.07∗α)0.20
Publisher’s Note: MDPI stays neutral with regard to jurisdictional claims in published maps and institutional affiliations.

