1. Introduction
Any mining project begins with the exploration stage which includes estimation of the expected economic returns, which can be made after significant mineralization has been encountered. Naturally, each exploration stage is designed to proceed to the next stage only if the results of the current stage justify this continuation. Therefore, the key goal remains the identification of high-priority targets and the description of a conceptual model upon which the mine design and the project’s net present value can be established.
There are notable commercial interests in developing methods to accelerate an exploration and to more precisely identify the most realistic economic scenario. Thereby, the focus is on making predictions for unexplored areas based on limited drilling data and using this to estimate anticipated costs and potential revenues. Our method can be very useful in this context. Namely, in situations where the data is insufficient to perform any reasonable resource estimation, an Exploration Target Statement can be obtained. However, it may be that early drilling results may delineate the Exploration Target and lead to an Inferred Mineral Resource.
In this work, we utilize recent developments in high-dimensional statistics which provide a control on prediction accuracy by the reduction of the so-called “generalization error”. This error is a crucial notion in modern statistical analysis and represents a cumulative result deterioration (due to uncertainty in model specification and its estimation errors) when applying predictions to new observations. The reduction of generalization error is achieved using appropriate penalization and regularization techniques, which are usually combined with some parameter selection method. In our approach, such parameter selection is based on in-sample estimation of predictive performance, effected by the so-called “cross-validation”. This approach has been successful (see [
1,
2,
3]) in estimation of very weak dependencies in large data sets. This work presents a statistically accounted decision support methodology targeted on:
improving prediction accuracy of mineral presence, which may lead to more cost-efficient exploration,
assessment of the spatial mineralization characteristics, which may provide an alternative viewpoint which contrasts with existing methodologies,
introduction of advanced statistical/artificial intelligence methods into the traditional area of geostatistics.
In this work, we demonstrate how drilling data can be combined with penalized regression to establish a statistical model focused on predictive performance. The results of this approach are compared to a traditional technique.
2. Background
In the literature, the term spatial prediction refers to an interpolation by weighted averages of the observed data [
4]. Thereby, any existing method used in resource definition has its own drawbacks. Prediction of grade variability is often viewed as an interpolation methodology, which has been criticized for a number of restrictive assumptions [
5,
6,
7]. Traditional geostatistical methods described in [
7,
8,
9,
10,
11] presume a certain probabilistic structure obtained from the variogram. In some sense, it is supposed that the observation of a mineral concentration at location
follows a random field
indexed by points of a given geological structure
. Having adopted appropriate assumptions on this random field such as stationarity and its covariance structure and given measurements
at locations
,
, the estimation of
at an unobserved point
is defined in terms of conditional expectations
While a probabilistic framework and estimation (
1) provides foundation for this work, the proposed approach is different. Instead of relying on stationarity with the inconvenient need to specify a certain dependence type, it is supposed that the dependence between spatial observations is modeled naturally, in terms of the so-called ore body—a hidden structure which contains a certain concentration of a mineral. The shape, size, and content of the ore body are random and are determined by a superposition of the so-called prime ore deposits, deposits which are modeled by ball-shape structures with uncertain radius, location and rock mass content. Having assumed that the ore deposits may occur at virtually any location of the domain, we obtain an over-determined model which can be estimated using modern techniques of high-dimensional statistics. More importantly, the proposed estimation is performed by the selection of a most appropriate model from the viewpoint of its predictive accuracy.
Remark 1. Here, we use stimation in the statistical sense of likelihood estimation for a parameterized family of densities. In this context, the notion overdetermined stands for a situation where there are different parameter sets which represents the same likelihood maximizing density. These concepts are introduced and explained in the following sections.
3. High-Dimensional Statistics: LASSO and Ridging
A linear regression model is characterized by the relation
where
are observed response variables, ,
is a given matrix,
is an unknown vector of coefficients,
are unobserved random variables ( zero-mean, with unknown variance ),
n is the sample size,
p denotes number of predictors.
Note that the matrix entries
are non-random by assumption. This situation is referred as fixed design. The columns
for
are called predictor realizations. The model (
2) is linear because its dependence from the coefficients
, is linear. As mentioned above, the predictor (
p variables) can be obtained via non-linear transformation of some (multivariate) explanatory factors. Similarly, the response variable can also be described by some non-linear transformation of the actual observations, for instance by their measurement on a different (logarithmic) scale. On this account, linear models are able to capture non-linear dependencies between random phenomena. In applications of linear models, the estimation of
from observation of
and
Y is typically unstable when columns of
are correlated. In this case, the least-squares estimation may be ill-posed (if eigenvalues in the matrix
are small). Furthermore, there are applications with more potential explanatory variables than observations (
). In such situations, the ridge regression [
12] (p. 215) which penalizes the size of the regression coefficients, suggests solving a penalized least squares problem
for Euclidean norm
,
with an appropriate penalization parameter. Note that even in the case that
does not have full rank, this problem possesses a unique solution, which is obtained from the equation
where
stands for the identical matrix. The ridge penalty
causes a shrinkage of the coefficients
This usually yields a variance reduction
but introduces a systematic error (bias)
The LASSO is introduced in [
1] as a regularization method for a linear regression which uses an
penalty to achieve a sparse solution and the name “LASSO” was also introduced as an acronym for Least Absolute Selection and Shrinkage. With the goal of the variable selection in mind, the LASSO brings a major improvement from the viewpoint of the generalization error reduction since LASSO determines
as a minimizer
with
-norm (instead of the Euclidean norm) on the coefficients
Note that in difference to the ridge regression, this minimization is not solvable by simple linear algebra but needs quadratic programming or related algorithms. More importantly, such a solution is appealing because usually many coefficients in
vanish (which yields a kind of model selection by variables reduction). Let us explain why
is usually a sparse vector. Finding the unconstrained minimum
is equivalent to finding the constraint minimum
for an appropriate boundary parameter
. Since the ball
has sharp edges, the solution
is a sparse vector.
Using advanced numerical schemes, it is possible to determine for many (all relevant) penalization parameters , thus one can chose the most appropriate LASSO penalization through the so-called cross-validation (CV). Here are typical steps for the LASSO:
Divide all observations into train and test sets (i.g., 90 % train, 10 % test). Do this randomly i.g., in 10 different ways.
Determine on the train data, and with this calculate the averaged mean-square error on the test data. Average these errors over all 10 samples. Do this for (all relevant) .
Determine a penalty parameter , which yields the best averaged result on the test data.
Infer the model coefficients as .
The literature suggests that various types of optimization problems can be solved with the
-norm as a regularizer. An overview of some basic optimization algorithms for convex problems, with an emphasis on aspects of particular relevance to regularized estimators such as the LASSO can be found in [
3].
4. Proposed Design
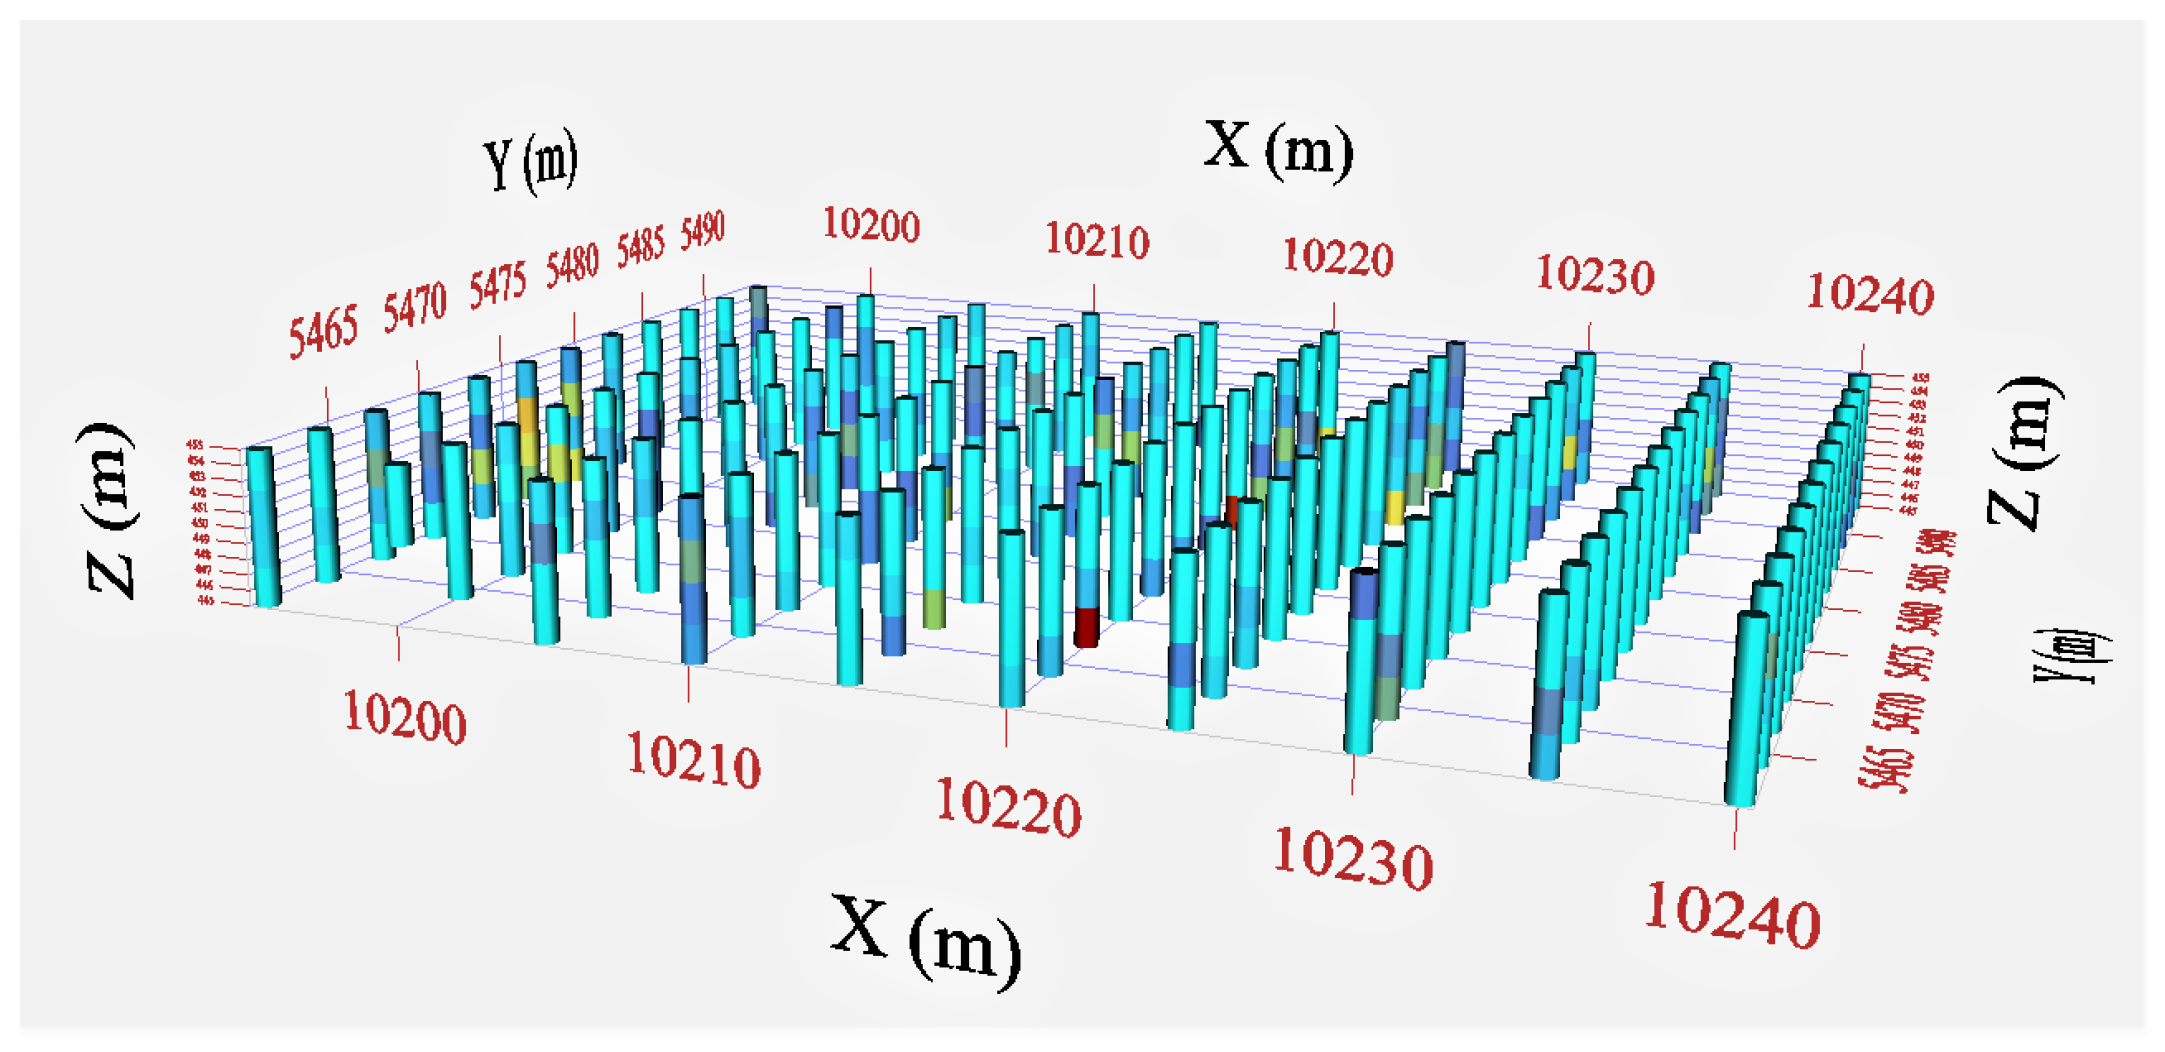
Suppose that within a predetermined mineralized rock mass
there are sparsely distributed observations at locations which are based on samples obtained from drill-core assay. Then the distribution is being estimated at each spatial point within the targeted range. To address such problem, a number of techniques have been suggested which are usually based on interpolation, such as inverse distance-weighted and radial basis functions, global polynomial and local polynomial interpolations (see [
13]). However, our approach is different and originates from the observation that the occurrence of worthwhile ores is associated with an ore body, which is a geological structure containing a distinct (compared to the average area) concentration of metals. Specifically, it is proposed to estimate ore reserves through the reconstruction of such an ore body, whose shape and distribution should give a best possible explanation of the taken samples. The core idea is that having determined a notably high concentration
at a location
, the conditioned probability density for the mineral concentration at any other point
depends on the Euclidean distance
to the location and on the concentration measured there. Although this dependence is difficult to quantify, it is assumed that the higher
y and the smaller the distance
, the more likely it is to find the mineral (in high concentration) at the point
. This idea is represented in terms of a kernel density
with the assumption that given a location
, the function
represents a a spherical ore body, concentrated around a point
. This statement can be quantified as follows: given the occurrence of a prime ore deposit located at point
, the expectation of the (averaged) gold concentration within each rock mass volume
is represented by a random variable whose (conditioned) expectation is given by
To reflect the expected concentration decay depending only on the distance, without taking into account any particular direction, it is assumed that
Suppose further that such mineral deposits can be located at different points and have different intensities . Note that the intensity coefficient describes the ore concentration and, according to our modeling, the dependence of concentration on the coefficients is linear.
To resemble an ore body by a superposition of such deposits, we suppose that the expectation of the (averaged) mineral concentration within each rock mass volume
is represented by a random variable whose (conditioned) expectation is given by
Finally, we agree to explicitly construct such random variables for each rock mass volume
in terms of
indexed by all Borel sets
of
. Here,
is a pre-specified parameter and the family
represents a so-called Gaussian white noise. This is a family of Gaussian random variables which satisfy
where
denotes the Lebesgue measure and
N stands for normal distribution.
Having agreed on the assumption (
6) and (
7), determining the shape of the ore body boils down to the estimation of the parameters
and
, given the observations
of the mineral concentration within a number
of volume samples
. A generic method therefore is the maximization of the log-likelihood density
where the numbers
stand for the expectation of the mineral concentration within the sample volume
under the assumption that the deposit locations are
and their intensities are
:
Following the above maximum-likelihood principle, a maximum of the function
must be determined. However, a straight-forward application of such a concept has a number of drawbacks:
The log-likelihood function is not convex, and the dimension of its arguments is in general very high.
There are numerical issues determining its global maximum.
The choice of the number of prime ore deposits is arbitrary and there is no obvious way to determine this number. Choosing p too low results in a poor model, whereas if p is too high, then a large number of parameters may cause over-fitting and deteriorate the predictive performance of the model.
In what follows, a different approach to prediction is suggested. The idea is based on advances in high-dimensional statistics. Utilizing these tools, the obstacles described above can be overridden. From an abstract perspective, a moderate-dimensional non-convex problem is reformulated into an extremely high-dimensional but convex optimization problem. Furthermore, a built-in penalization of parameters with the focus on the minimization of the generalization errors leads to dimension reduction while maximizing the model’s predictive performance.
Let us explain our approach. Having supposed that the volume samples
have equal sizes
and assuming that the locations
of all prime ore deposits are fixed, we observe that the log-likelihood function must be maximized with respect to the intensity parameters
. However, the problem of finding a maximum of
can be formulated using a standard framework of linear models, where the unknown coefficients
are estimated under the assumption that
are observations of the response variable
with independent identically normally distributed random variables
and a non-random design matrix
Note, however that the centers
of prime ore deposits are fixed. To address this issue, we propose that their total number
p is sufficiently high, which allows a potential prime ore deposit to exist at virtually any location. At the same time, we suggest to use a penalized regression. Instead of solving the ordinary regression
we address an adequate formulation in the spirit of LASSO (
4) with
-norm (
5) on the coefficients.
As mentioned above, the penalized regression has several advantages: It allows a view from the perspective of high-dimensional statistics whose methods are designed to solve linear models under the assumption that the number of explanatory variables exceeds (by magnitudes) the number of observations, having in mind that only a few (not knowing which) of the explanatory variables have non-zero coefficients. Furthermore, the penalized regression in the LASSO formulation performs an automated variable selection, by determining those non-zero coefficients which maximize the predictive performance through an estimation of the generalization error via cross-validation. Note that this method is appropriate for our statistical estimation since we suppose that at virtually each location there could be a prime ore deposit of unknown intensity. Realistically, almost all intensities shall vanish, but it is not known which deposits contribute with non-zero intensity.
Finally, let us emphasize that the goal of a geostatistical model is not to fit/smooth a given sample of observations, but to infer a mineral concentration in the entire domain with enhanced predictive ability. Of course, all relevant physical and geological considerations (for instance, the mineral clustering described in terms of the ore body concept) must be incorporated in some way into such a model. These goals are approached by our methodology.
6. Results
The distribution of gold has been successfully estimated by solving a high-dimensional convex optimization problem using standard techniques, returning results which are potentially applicable for evaluation. Both procedures (LASSO and kriging) indicate the presence of a trend of increasing grade with depth in the NE direction and the existence of internal dilution in SE direction. Both methods suggest the existence of localized occurrence of middle/high localized grades within the underlying subsection of the mining bench (flitch), the development of which may be economically profitable. Our methodology uses standard open-source implementations, is stable and requires low computing resources. More importantly it is fast: the average run time on a standard PC ranges from 110 s to 160 s. One crucial aspect of our technique is that the algorithm determines virtually the same solution for a wide range when used with different starting values and model parameters, which is in line with our expectations. Note that, in contrast with traditional interpolation, the estimated mineral concentration is smooth and plane (in the sense that it exhibits moderate spatial changes and extreme values). A comparison of LASSO computations with those obtained from kriging provides clear evidence that both methodologies yield similar results. However, the models are conceptually different: unlike kriging, the LASSO does not require variography and model fitting. Since both methods are based on different concepts, that the analysis of prediction disagreements may be helpful in uncovering potential shortcomings in both methods.
The distribution of gold has been successfully estimated by solving a high-dimensional convex optimization problem using standard techniques, returning results which are potentially applicable for evaluation. Both procedures (LASSO and kriging) indicate the presence of a trend towards North-East direction with overall increase of grade with depth and the existence of internal dilution in SE direction. Both methods suggest the existence of localized occurrence of middle/high localized grades within the underlying flitch, the development of which can be economically profitable. Our methodology uses standard open-source implementations, is stable, and requires low computing resources.
More importantly, it is fast: the average run time on a standard PC ranges from 110 s to 160 s. One crucial aspect of our technique is that the algorithm determines virtually the same solution for a wide range with different starting values and model parameters, which is in line with our expectations. Note that in difference to traditional interpolation, the estimated mineral concentration is smooth and plane.
We have concluded that the generalization error control avoids undesirable concentration spikes and turbulences inherent to interpolation methods. A comparison of LASSO computations with those obtained from kriging provides clear evidence that both methodologies render semantically comparable plots. However, the models are conceptually different: unlike kriging, the LASSO does not require variography and model fitting. Since both methods are based on different concepts, the comparison of prediction disagreements can be helpful in uncovering the singularities and shortcomings of both methods.
Interpretation
Kriging: To explore and compare the distributions, four gold favourability maps of 2.5 m thick layers were created using kriging. The cut-off grade = 0.5 g/t has been artificially applied to all maps to display the contrast between low and higher grades. The realizations (
Appendix A) shown in
Figure A2 and
Figure A3 indicate that depending on the depth, the bench (flitch) 10 m may contain gold concentrations ≥19.00 ppm or 19
Au g/t. Low
Au grades are present at the locality 5470 N/10,230 E. Relatively high grades may occur at 5485 N/10,210 E. The cross-sections (
Figure A3 and
Figure A4) display the presence of developing trend in increasing grades with depth. The extraction and processing of rock mass of underlying flitch can be economic. However, the Eastern region shows a very low reading. From an engineering point of view, the depth below RL445 should be worthy for close attention because the underlying horizontal levels are likely to have larger amount of gold. Comparing four cross-sections side-by-side (
Figure A1,
Figure A2,
Figure A3 and
Figure A4), one may conclude that the distribution is not gradational. Obviously, the sampling intervals 2.5 m are too large to make an accurate assumption on gold potential.
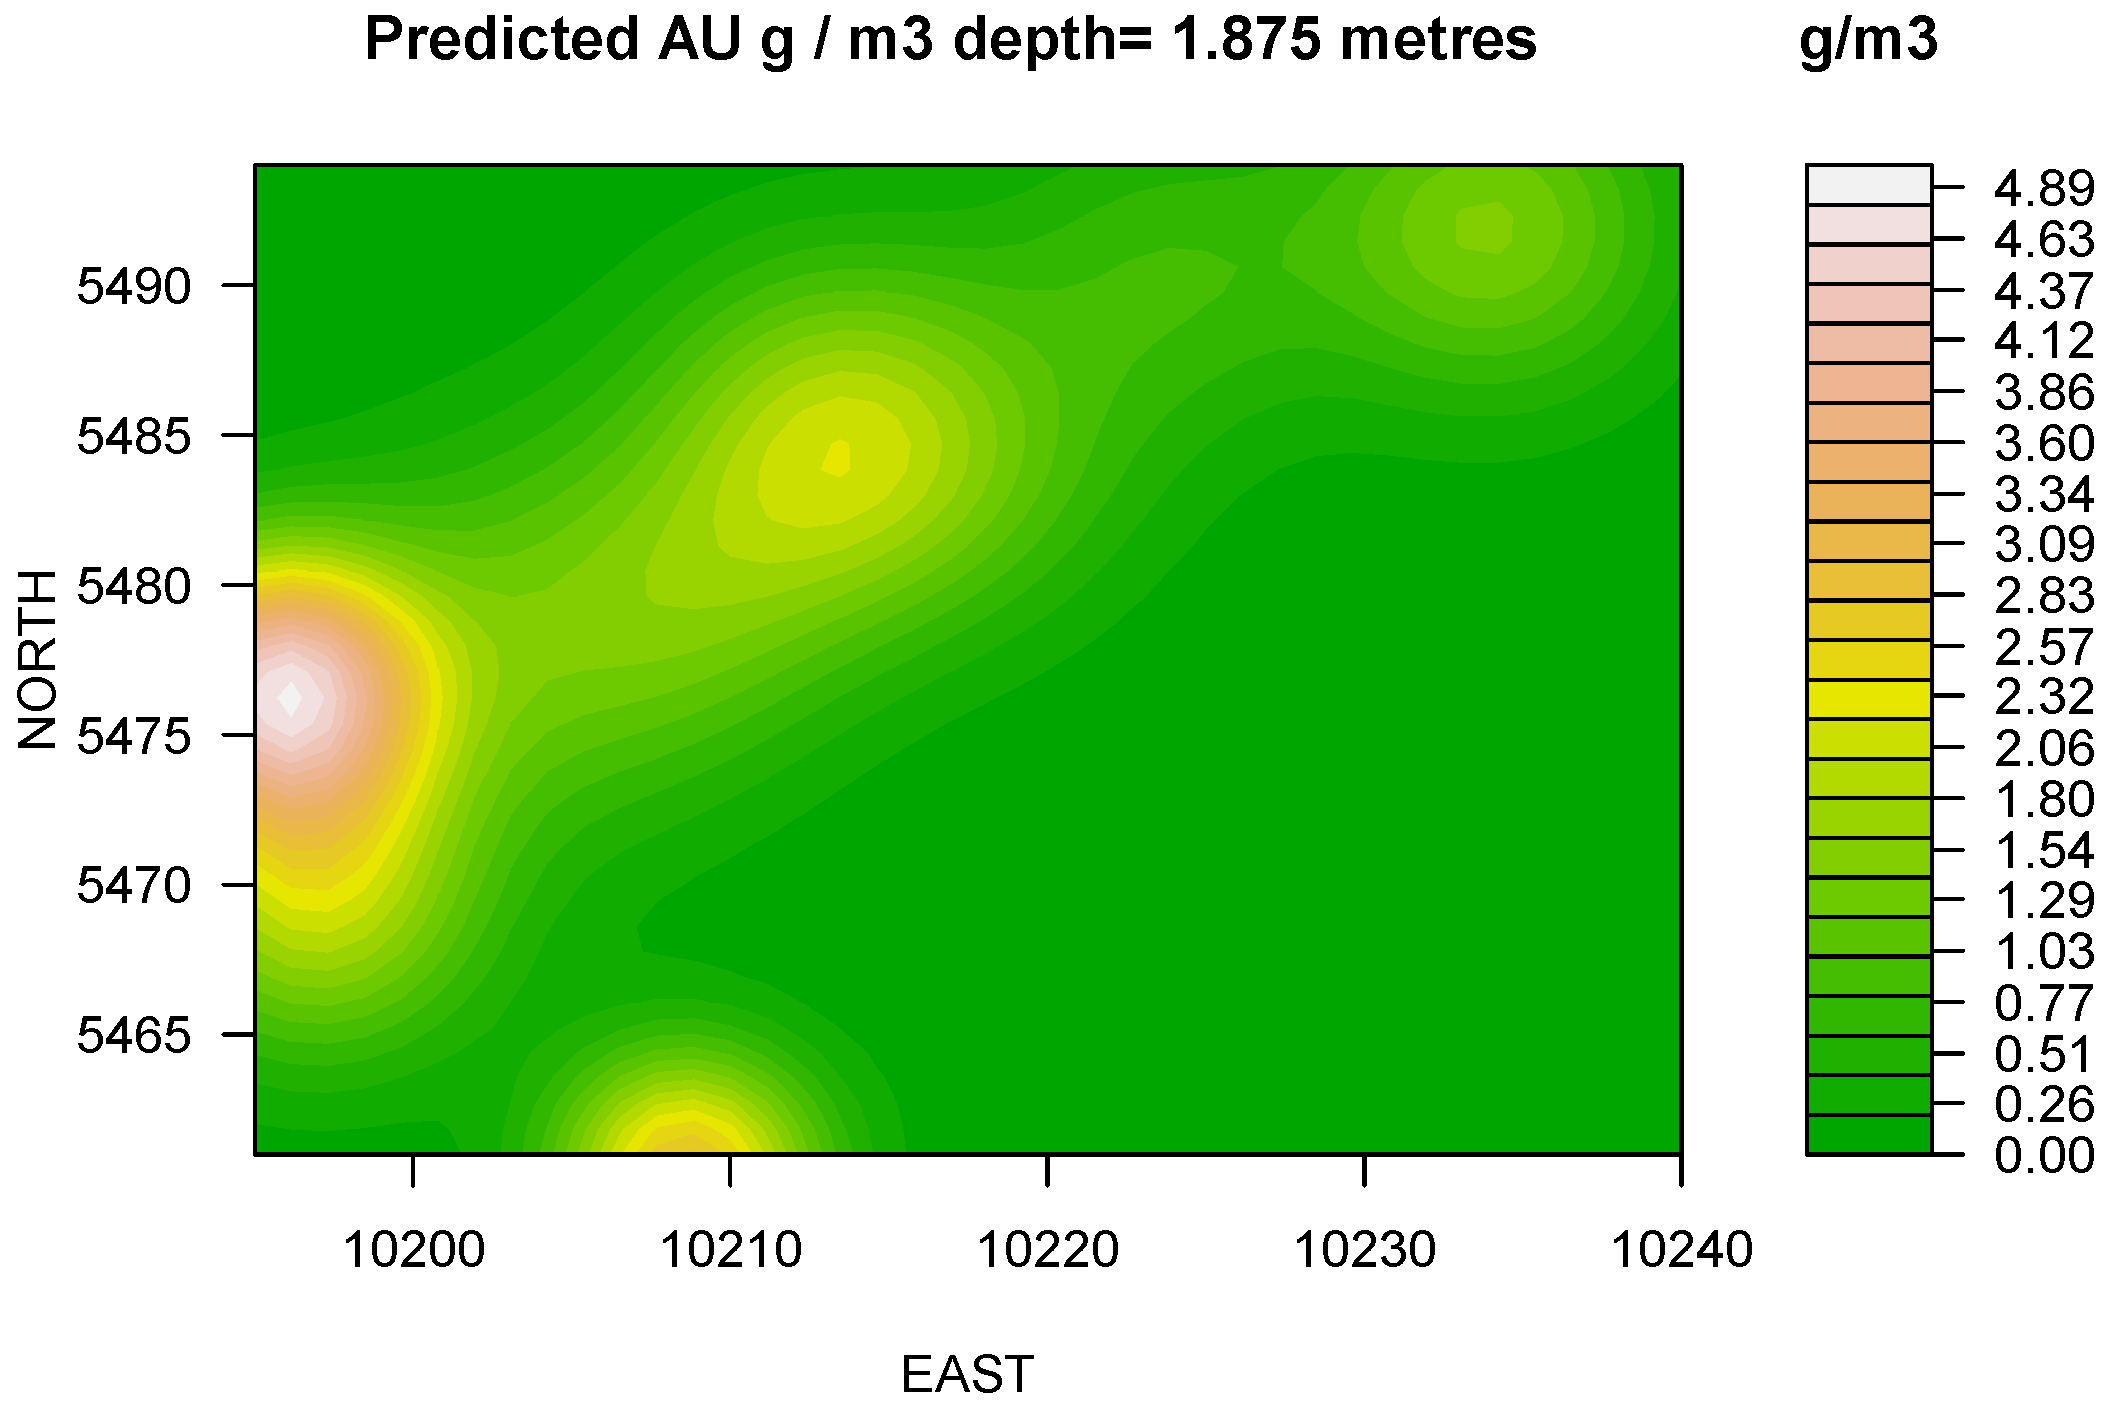
LASSO: At 1.875 m depth the model predicts the presence of a developing trend towards North-East direction with overall increase of grade and the existence of internal dilution in South-East and East directions (
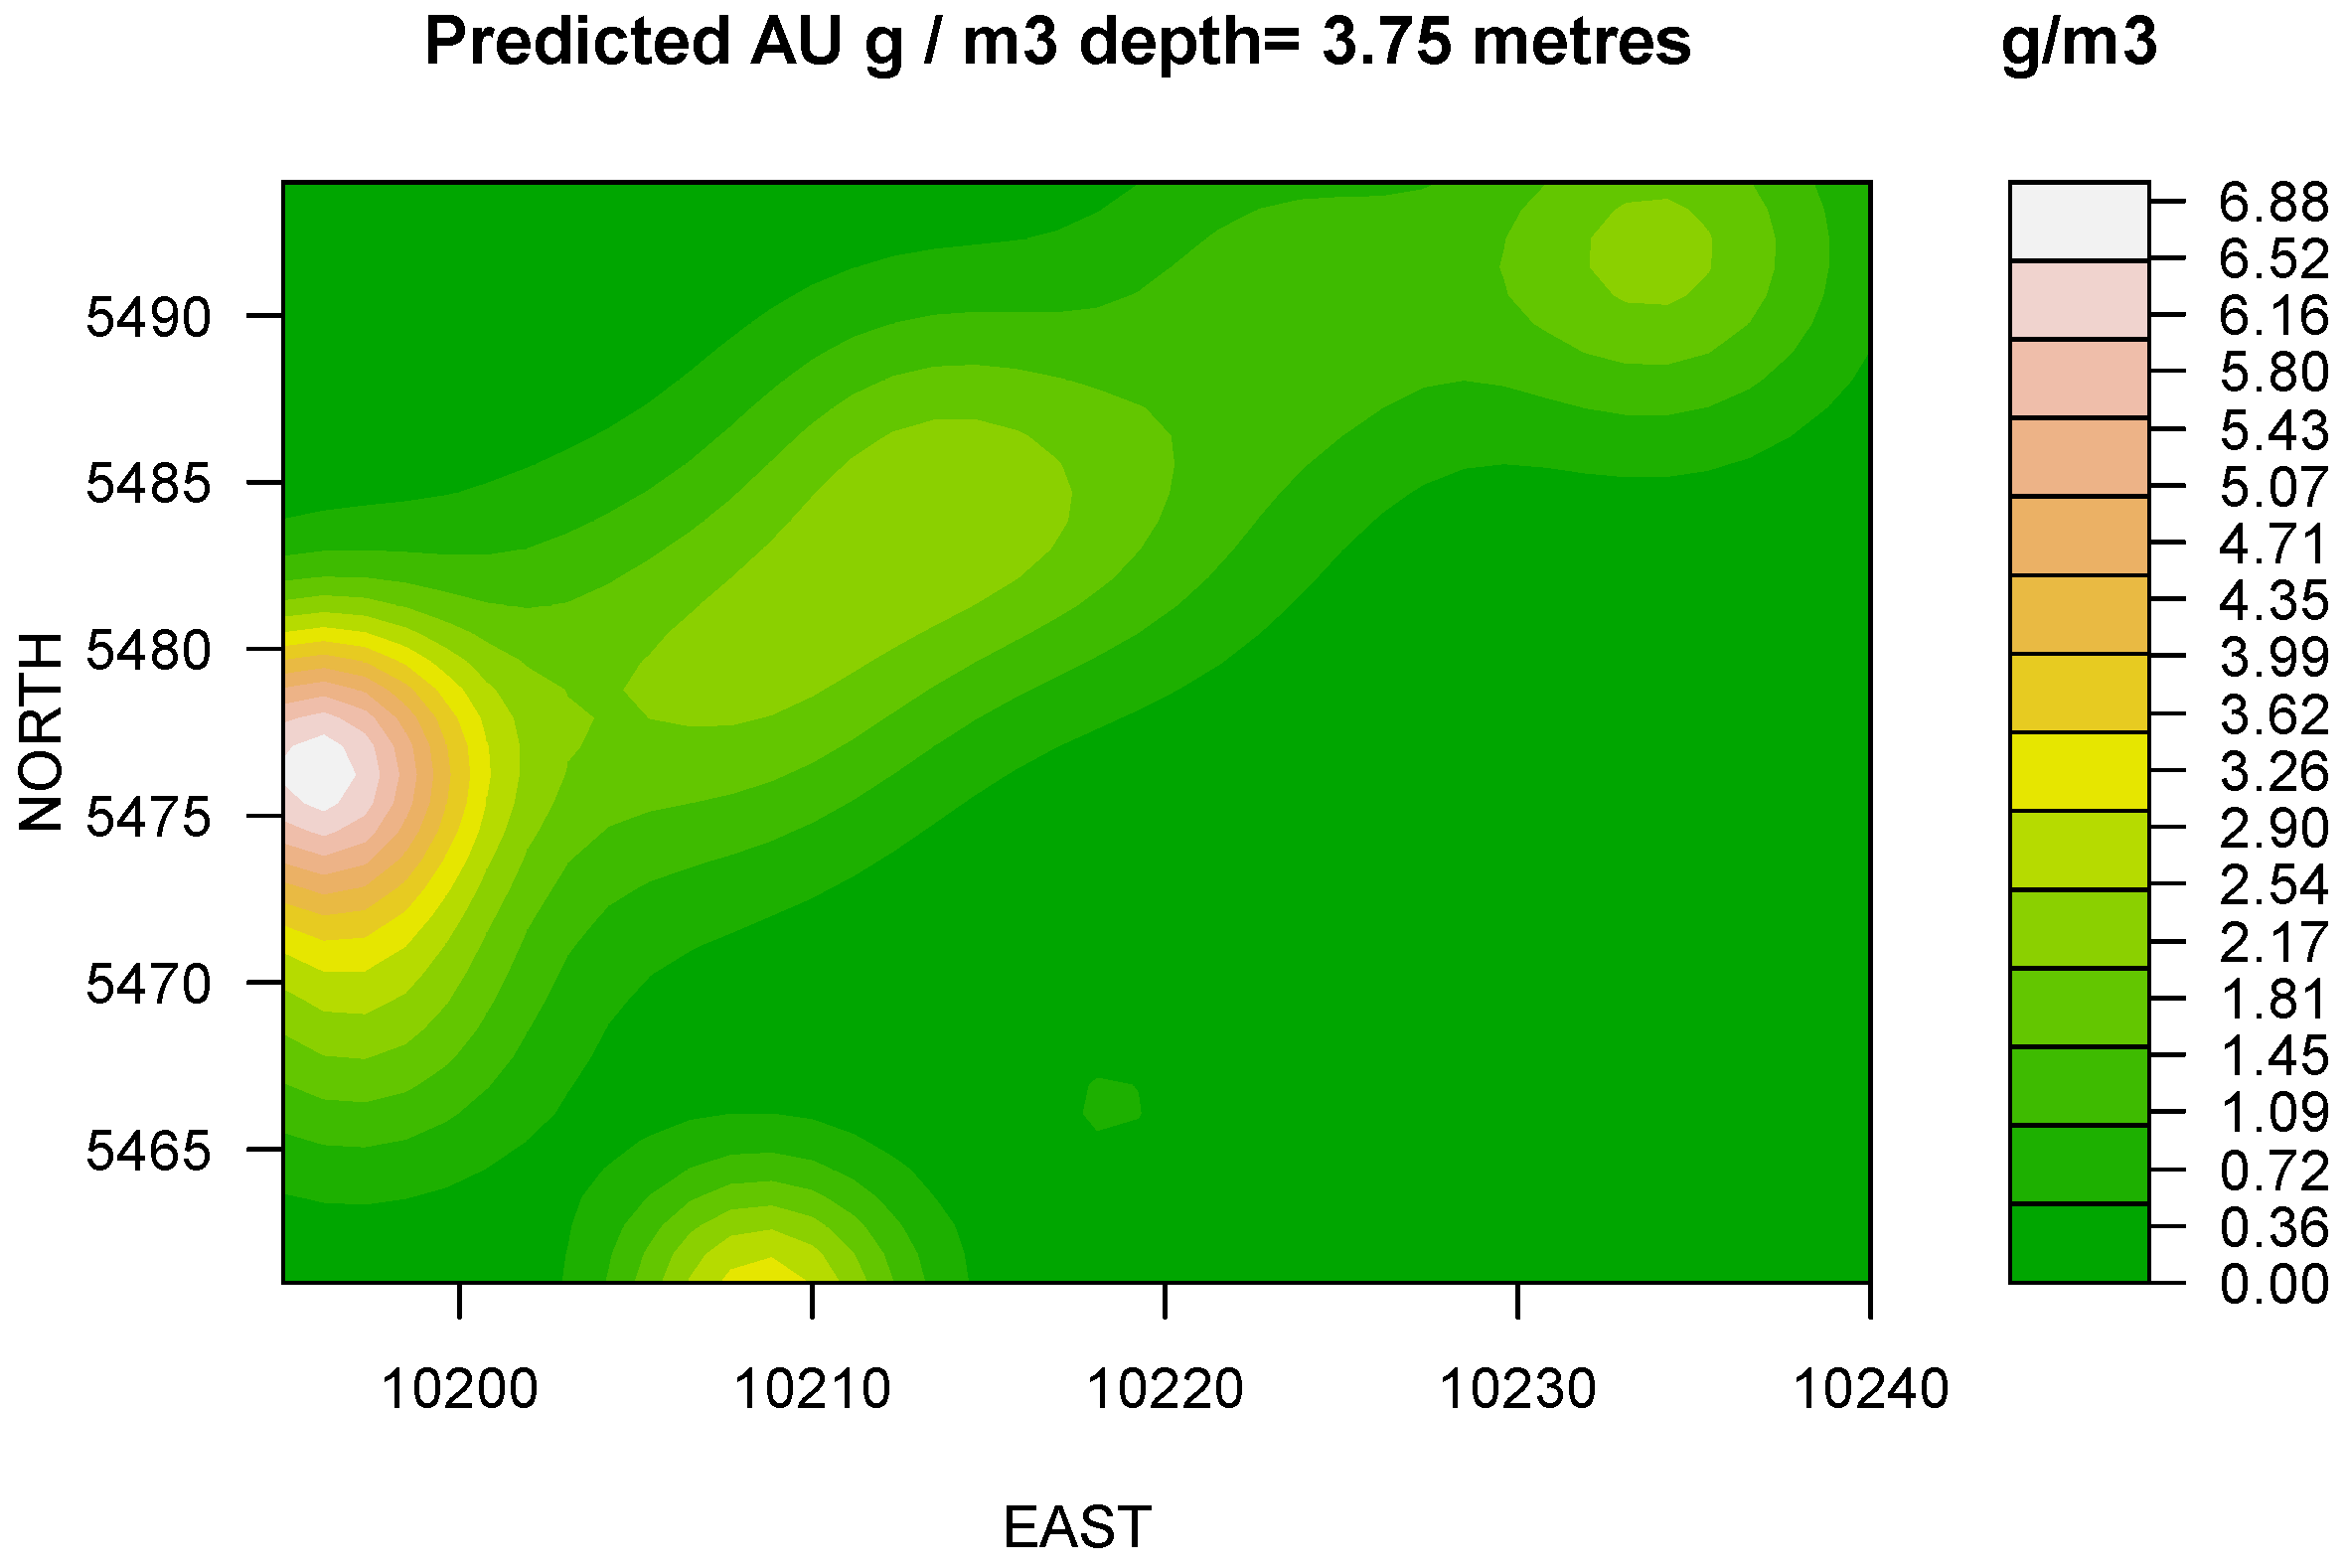
Figure 2). At 3.75m depth a stable trend identified and model indicates significant geometrical changes accompanied by the mean and median displacements (
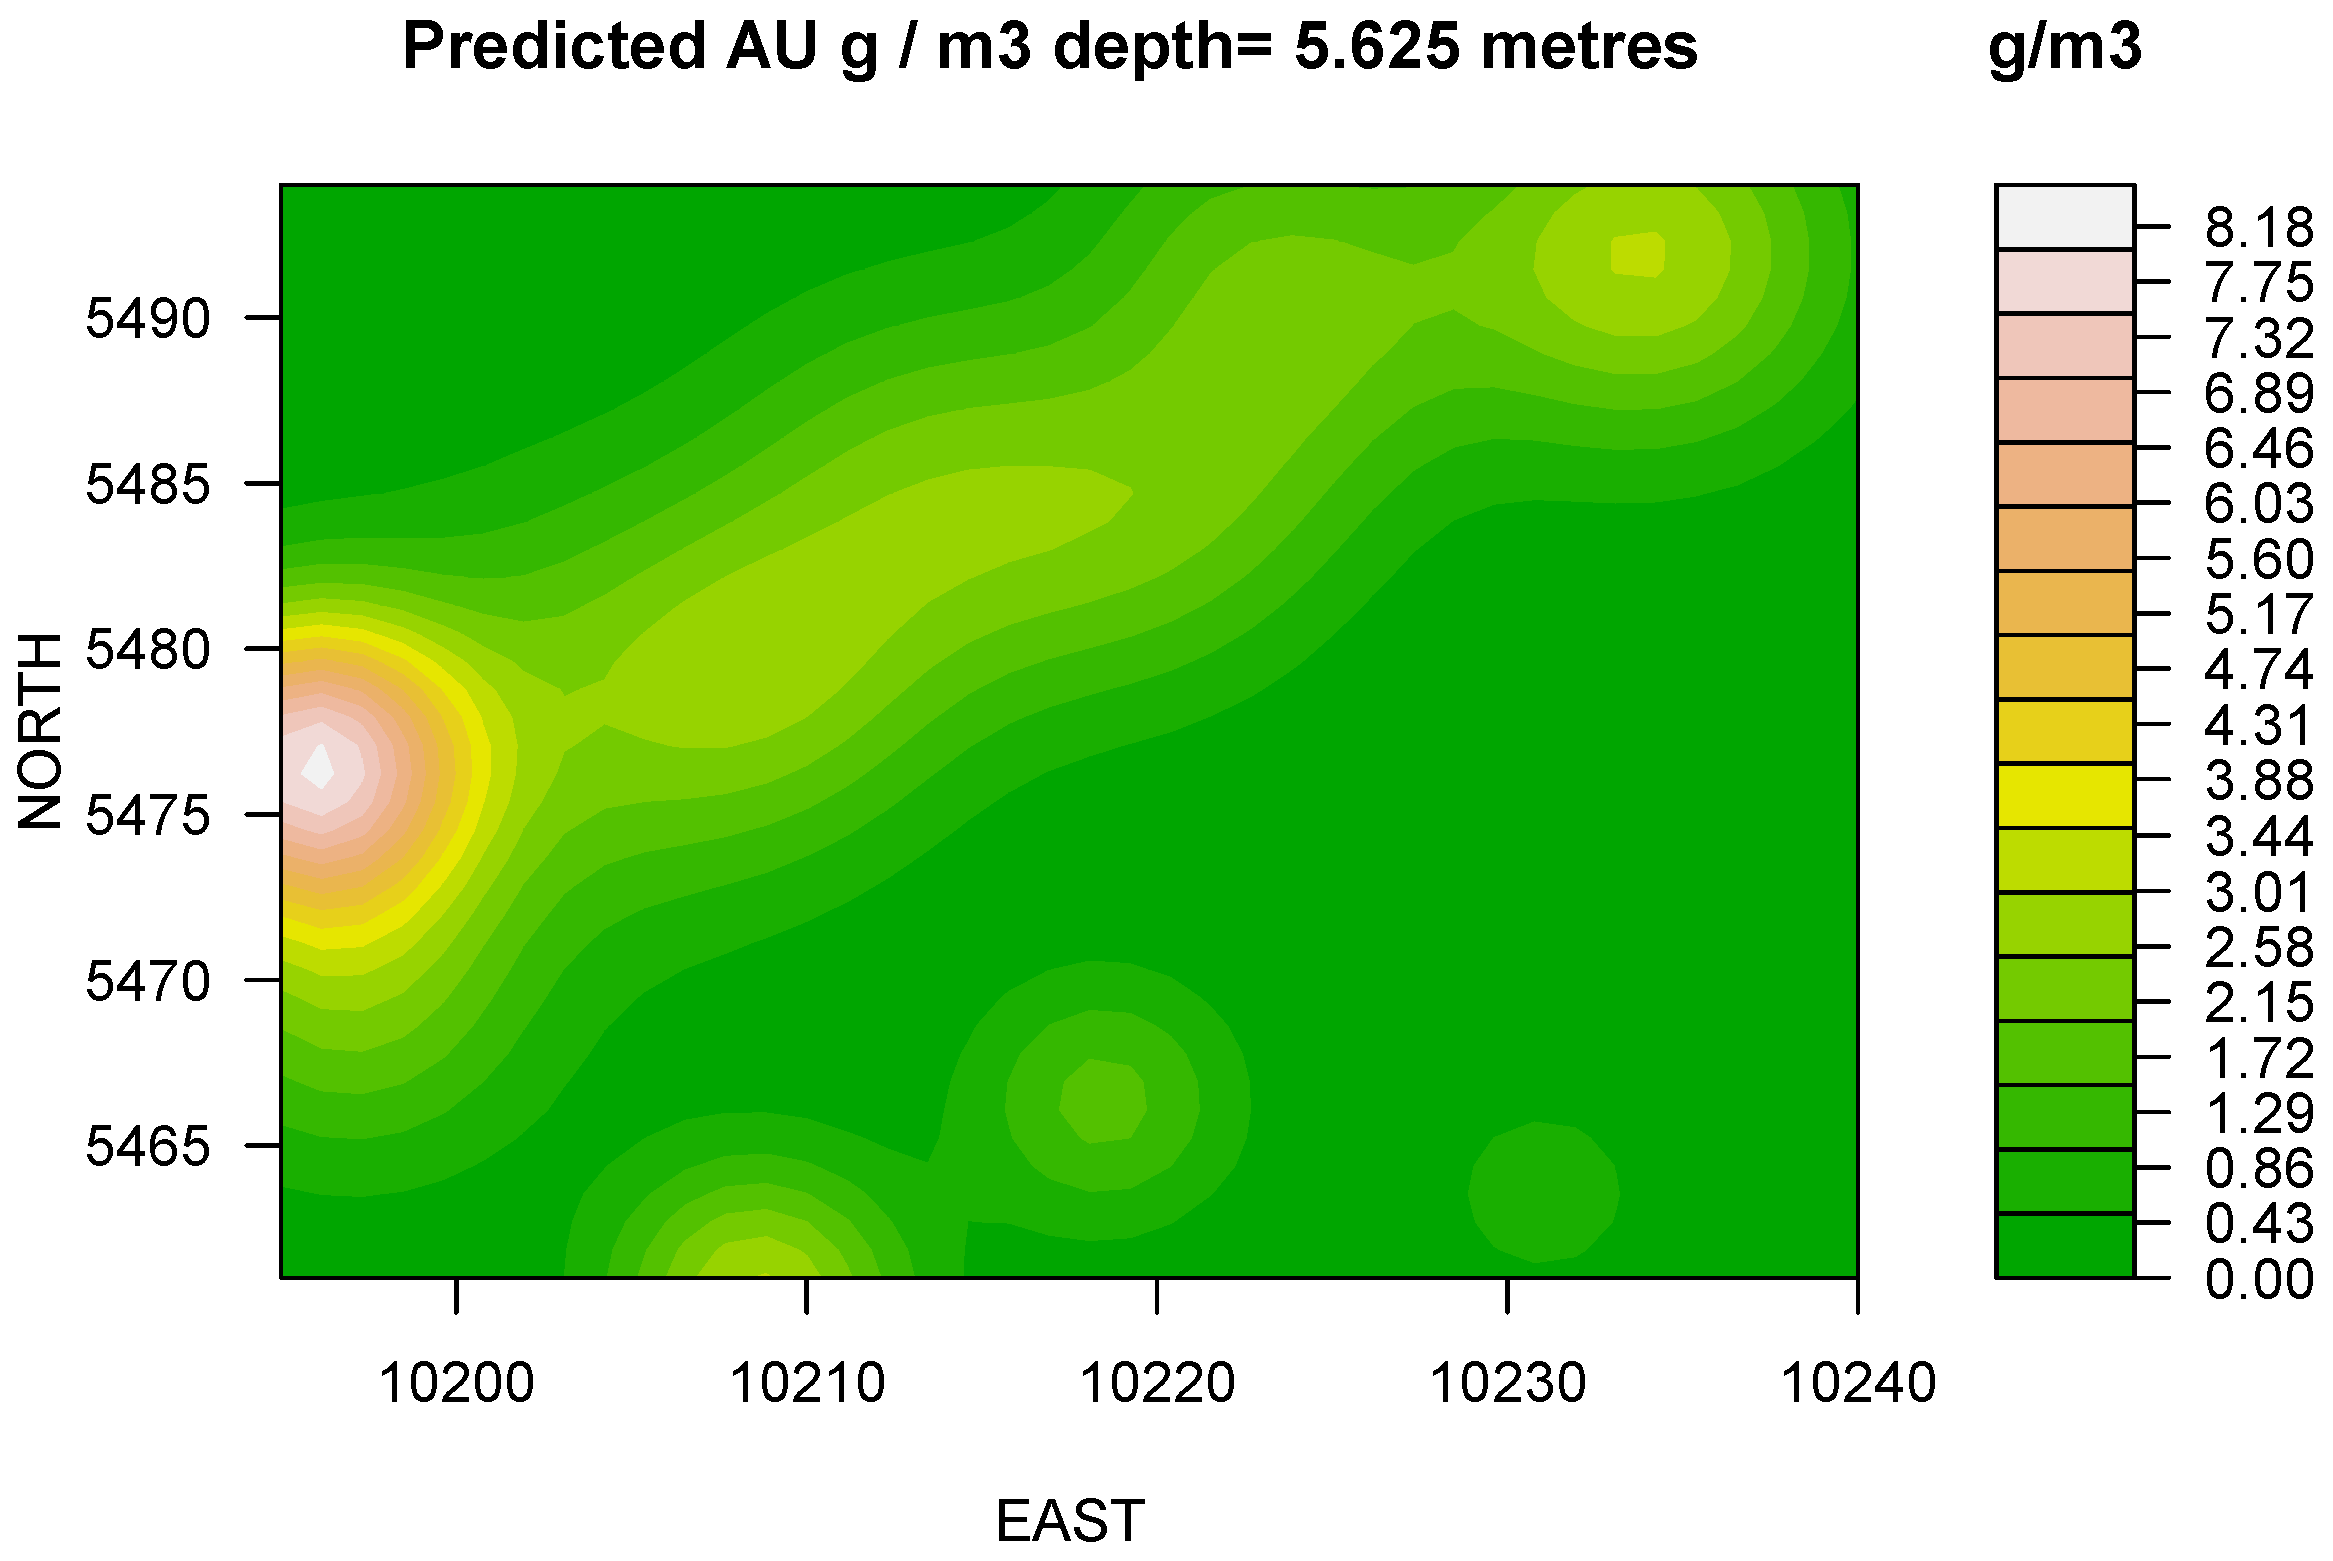
Figure 3). At 5.625 m model renders consistent increase of the apparent grade with the depth. The distribution reflects insignificant reshaping and suggests the displacement of maximums (
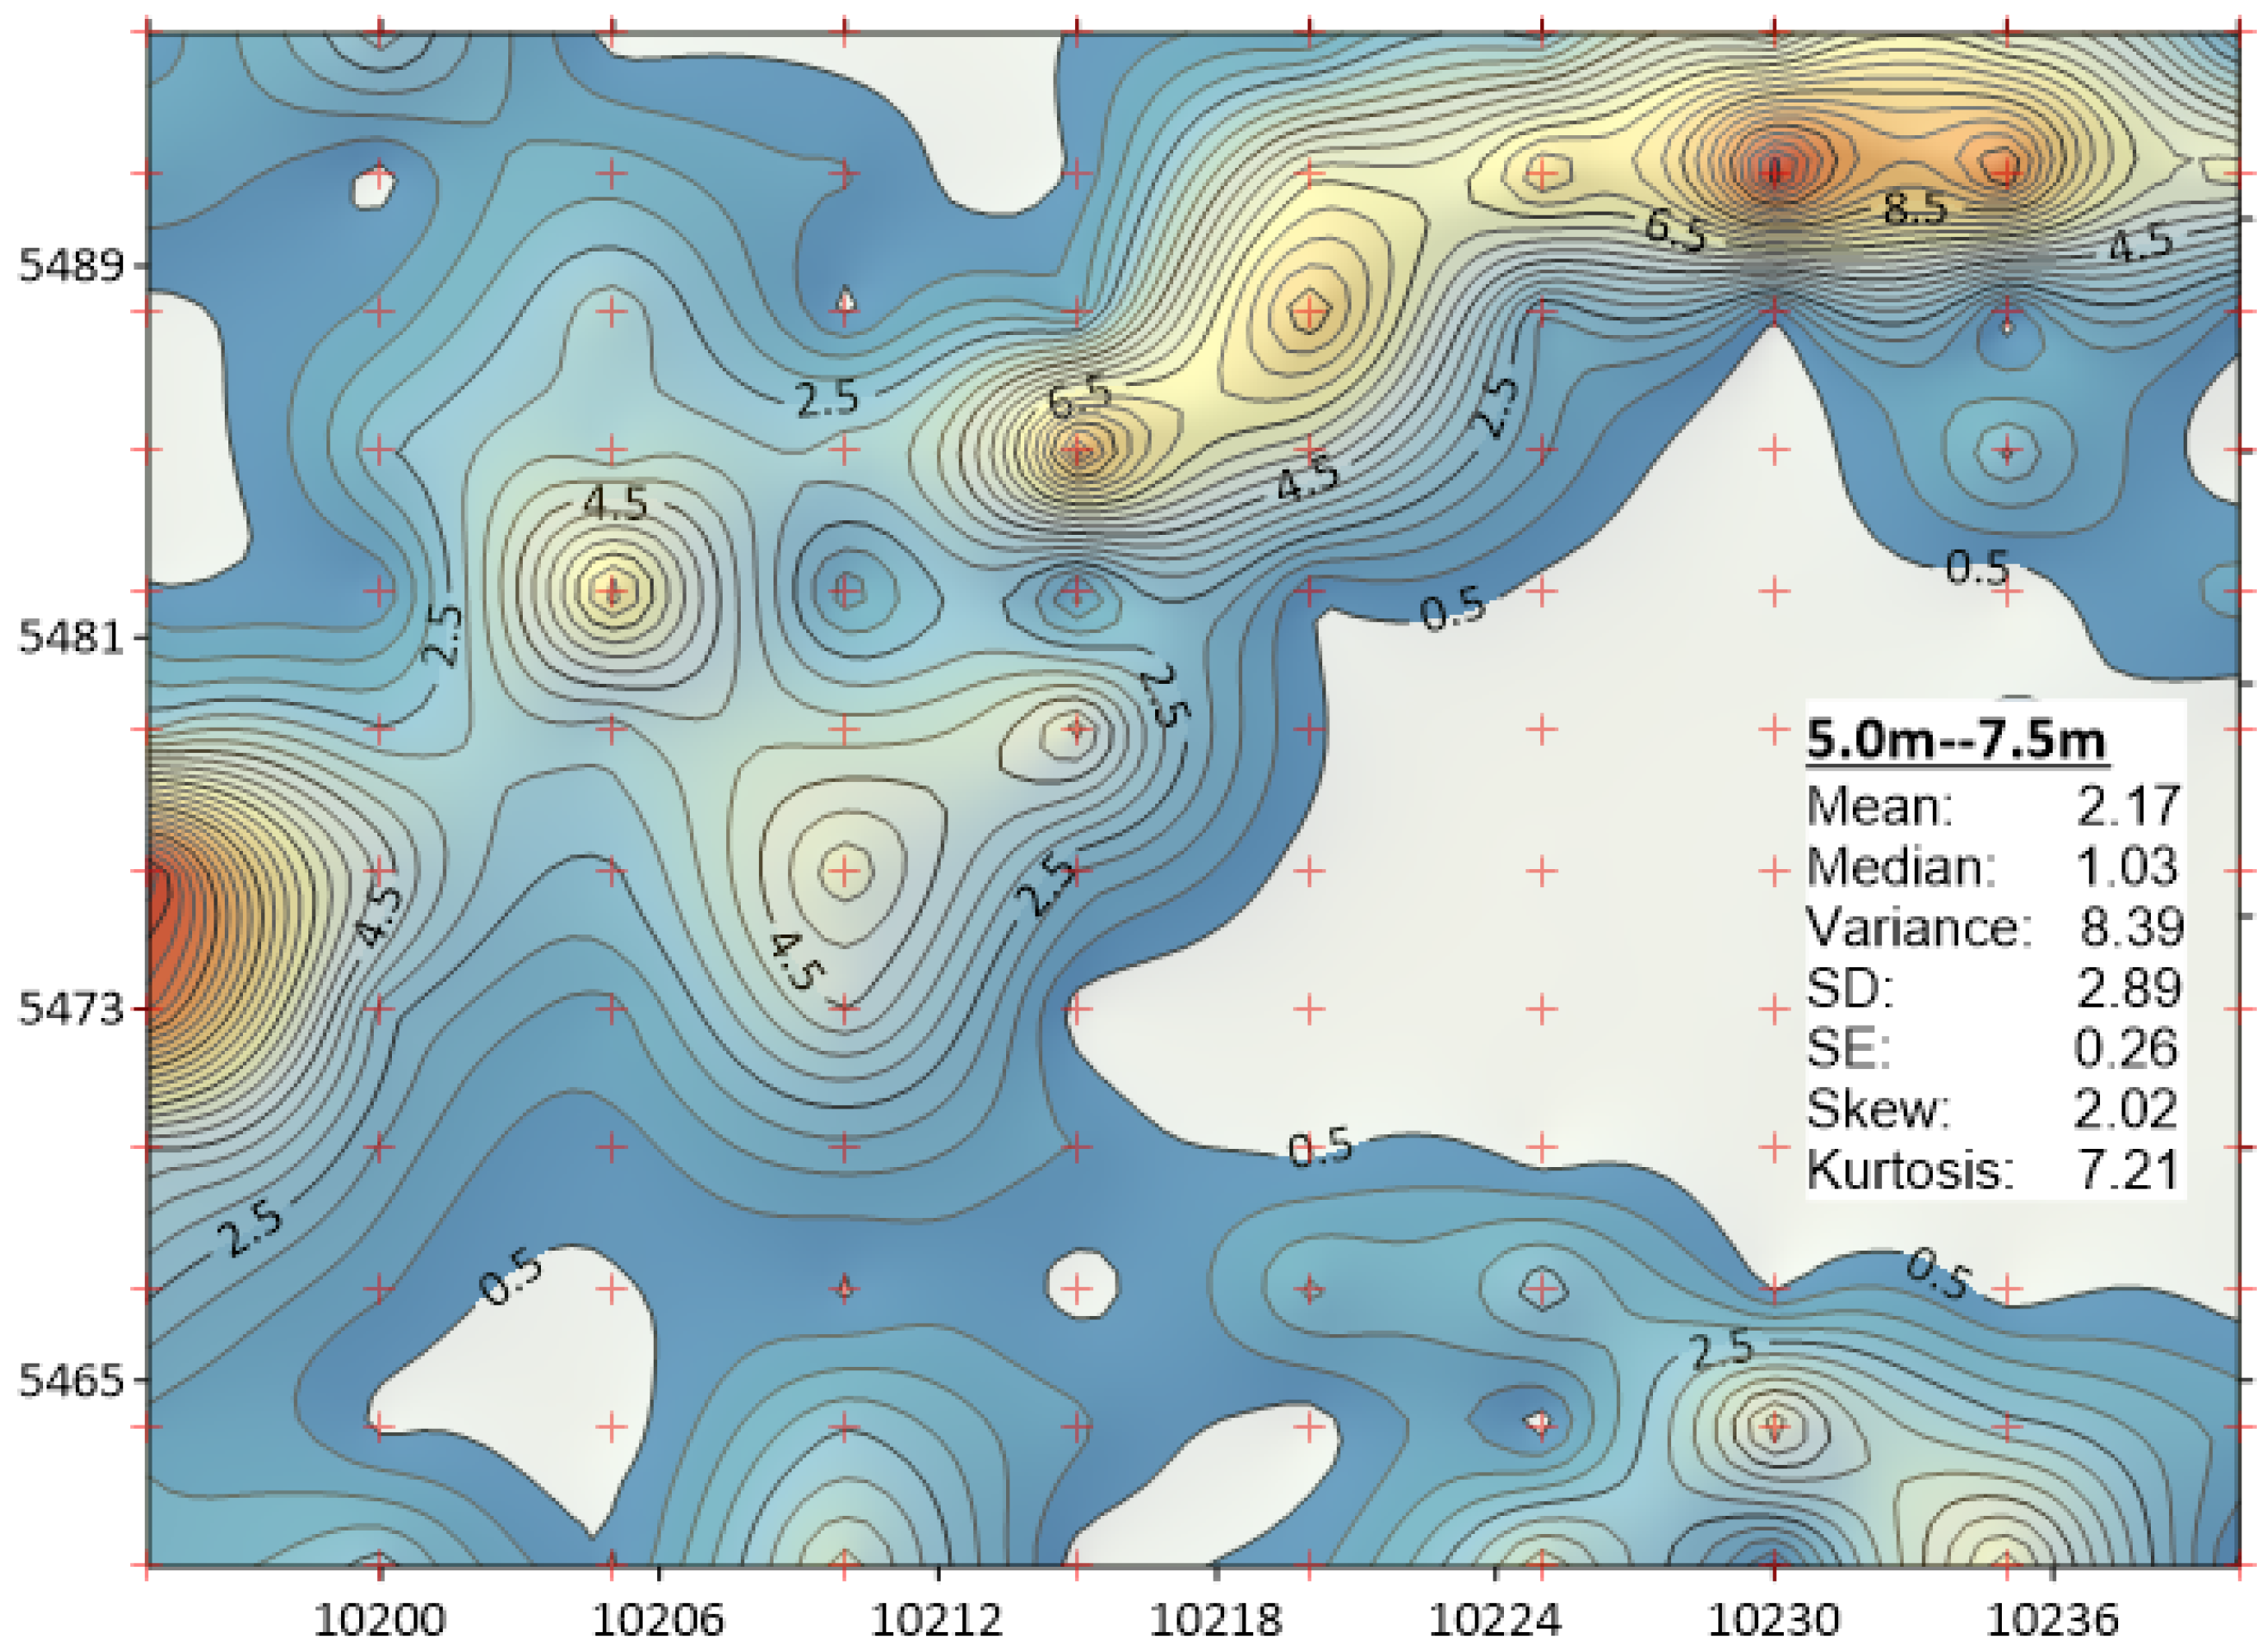
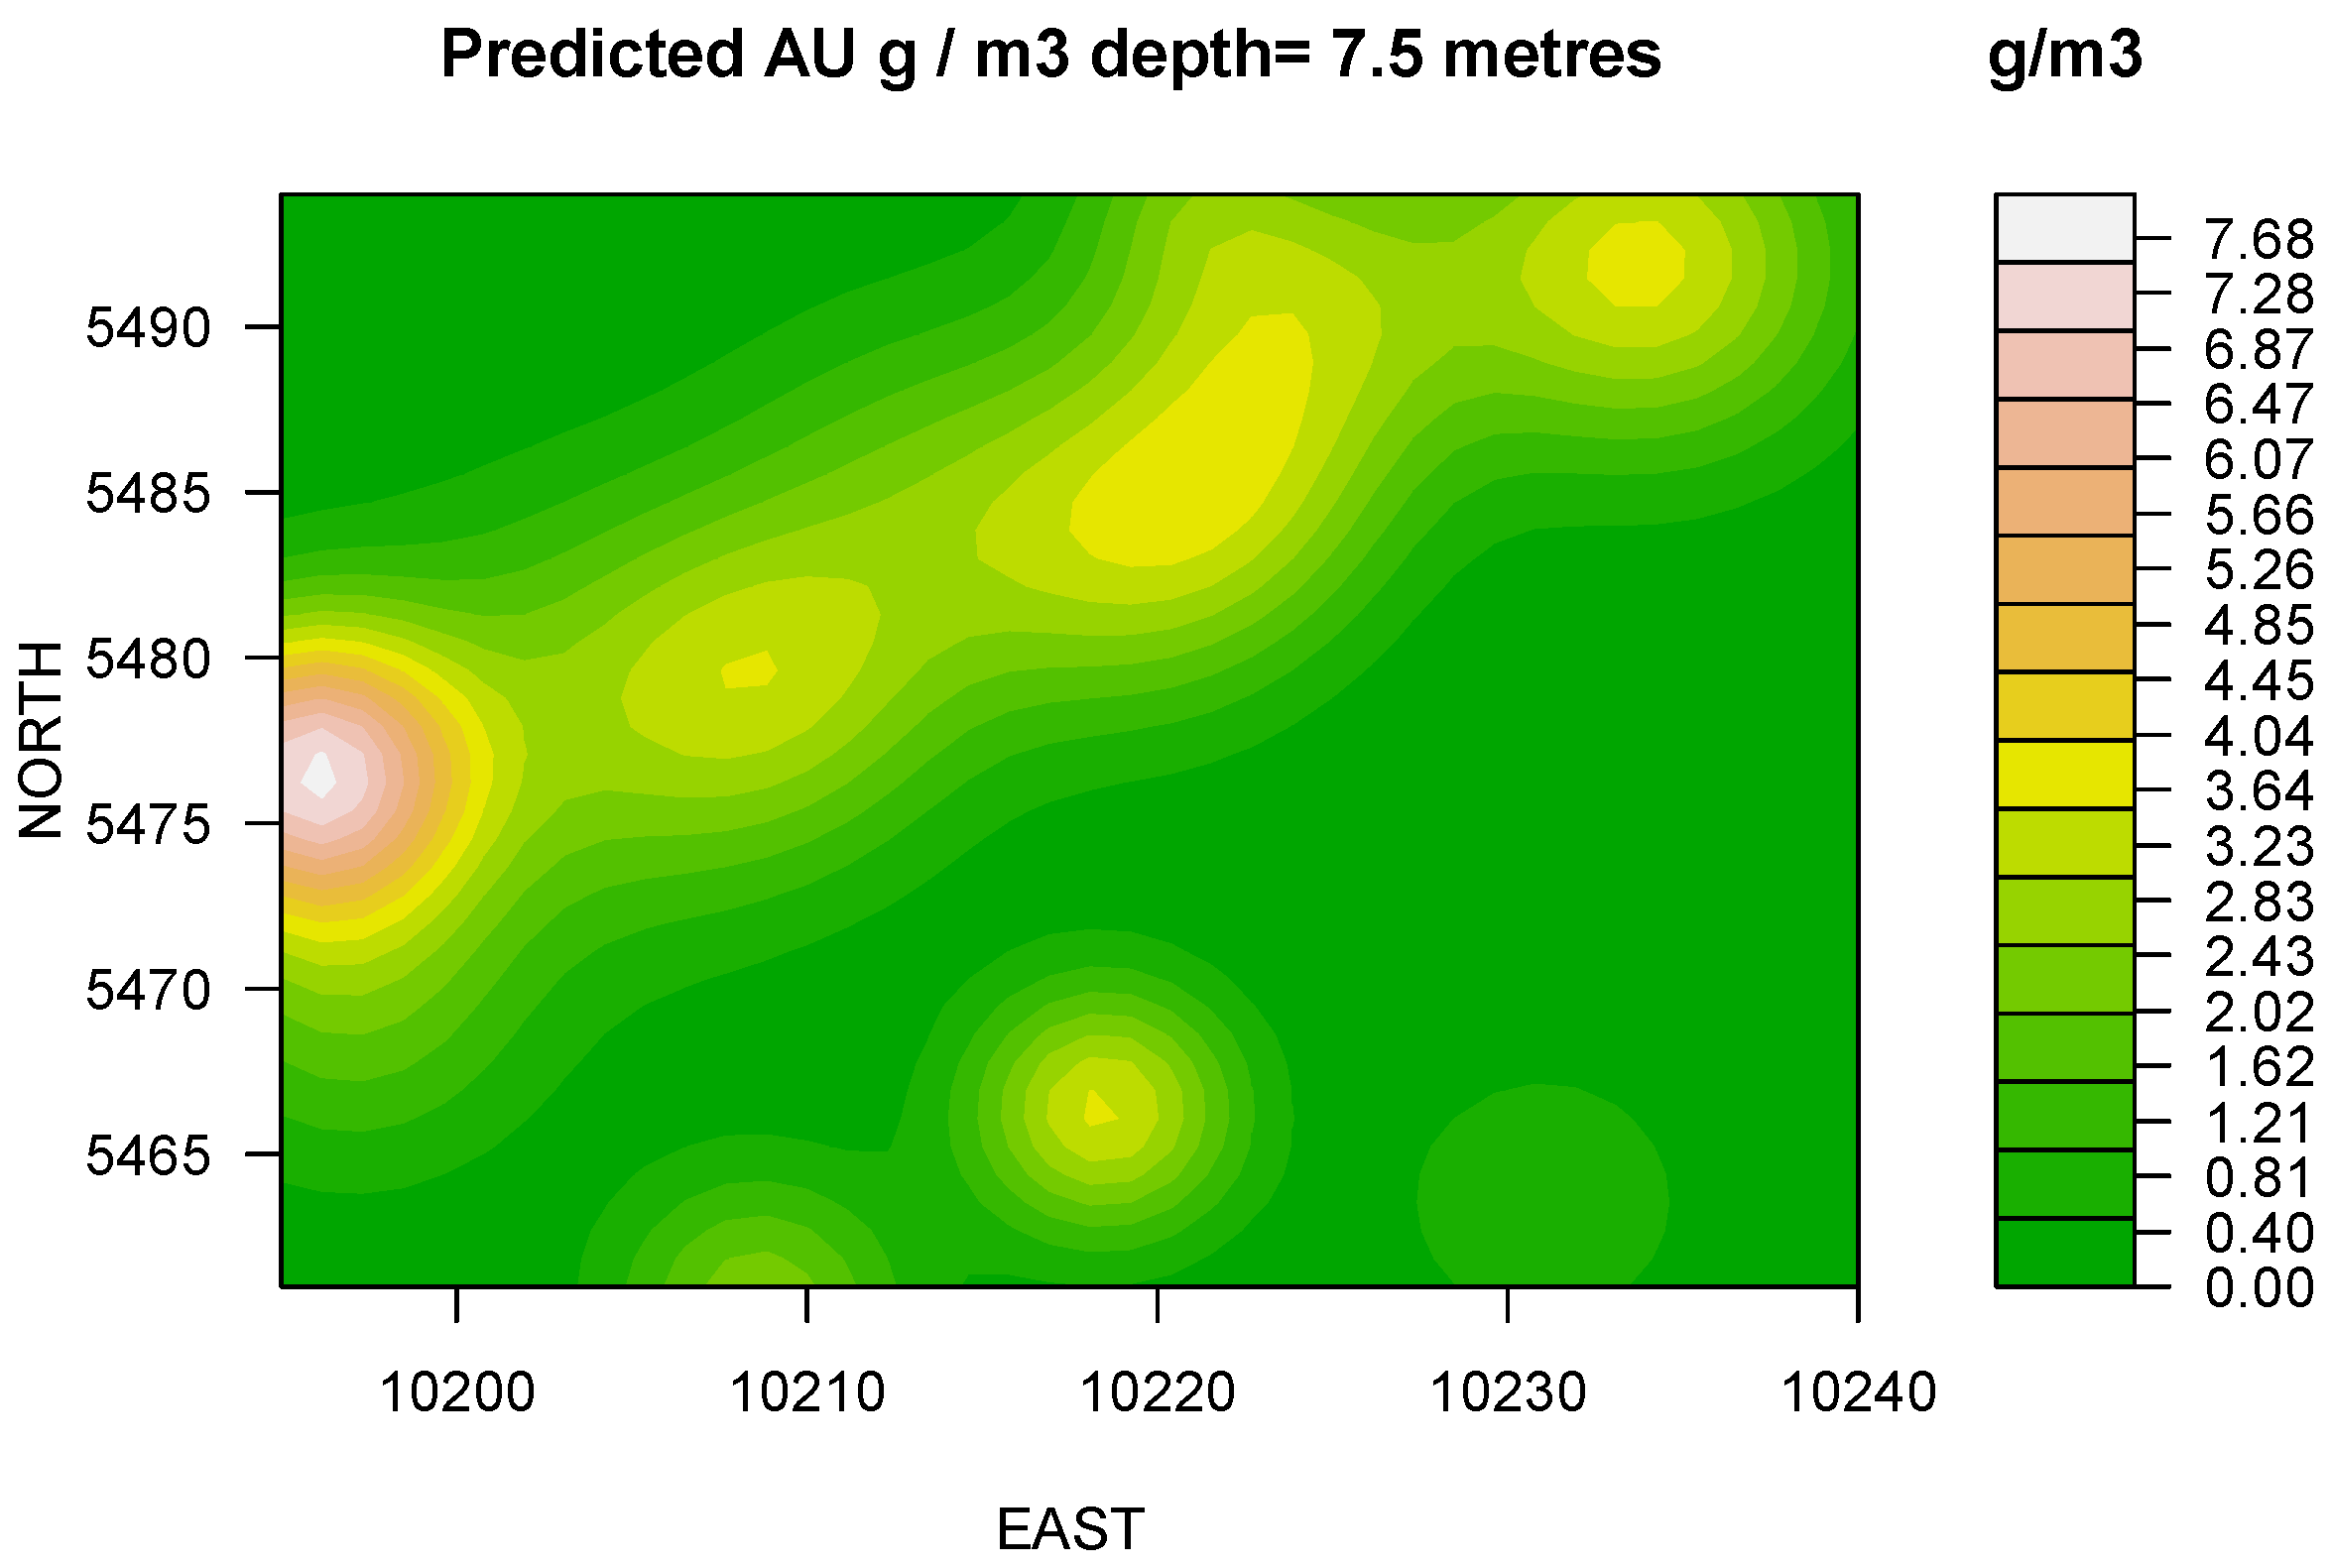
Figure 4). Finally, at 7.5 m depth (
Figure 5) the apparent grade increases considerably with the increase of depth. Contours illustrate a preferential trend in the northeasterly direction. The extraction of the underlying level, i.e., below RL445 can be economically profitable. The adjacent flitch at the Easterly locality requires for careful grade control.
Comparison: Note that the above methods are not competing as they investigate the same problem from different perspectives using different concepts and metrics. However, both methods indicate the presence of an increasing trend in grades with depth. From an engineering perspective, the rate of change of gold grades in the “kriged” models is to0 abrupt, in particular between RL455–RL447.5 (as depicted in
Figure A2,
Figure A3 and
Figure A4). Furthermore, the borders of the extraction targets are not well defined. The shape of dilution (waste or barren rock) is more critical during plant operation than the location of the erratic and insignificant concentrations of the gold. The
Cu/Au deposits such as Marvin are usually extracted by blocks, in a 10 m lift by a shovel with bucket capacity >20 m
3. That means the impact of the excessive amount of dilution may be extremely large. Although little evidence is available from the data to suggest that LASSO prevails over kriging in terms of predictive accuracy, note LASSO technique is designed to select a model with the strongest predictive performance—a quality target, which is absolutely not present in the kriging approach.
Advantages and limitations: Being designed to deal with very large data sets, out methodology may be applicable to a huge amount of geological data: in a test study, the present code was able to handle more than 50.000 samples. Furthermore, for Reverse Circulation (RC) samples (which are usually large, often longer than 3.0 m and much less variable) the analysis by kriging is complex so that LASSO provides solutions significantly faster. Moreover, the variography and model fitting are not required for LASSO, unlike for kriging which is based on anisotropy depicted by variogram in different directions. That is, in cases when an ore body is unstructured and the shapes of low-grade boundaries are gradational, LASSO can assist in fast decision making on equipment. Finally, let us mention the advantages implementation: LASSO implementation as R-package glmnet is a part of open-source environment and benefits from numerous data analysis and visualization techniques which are free, well-maintained, and easily accessible. However, this advantage comes at the cost of dealing with advanced scientific computing methods which require appropriate skills.
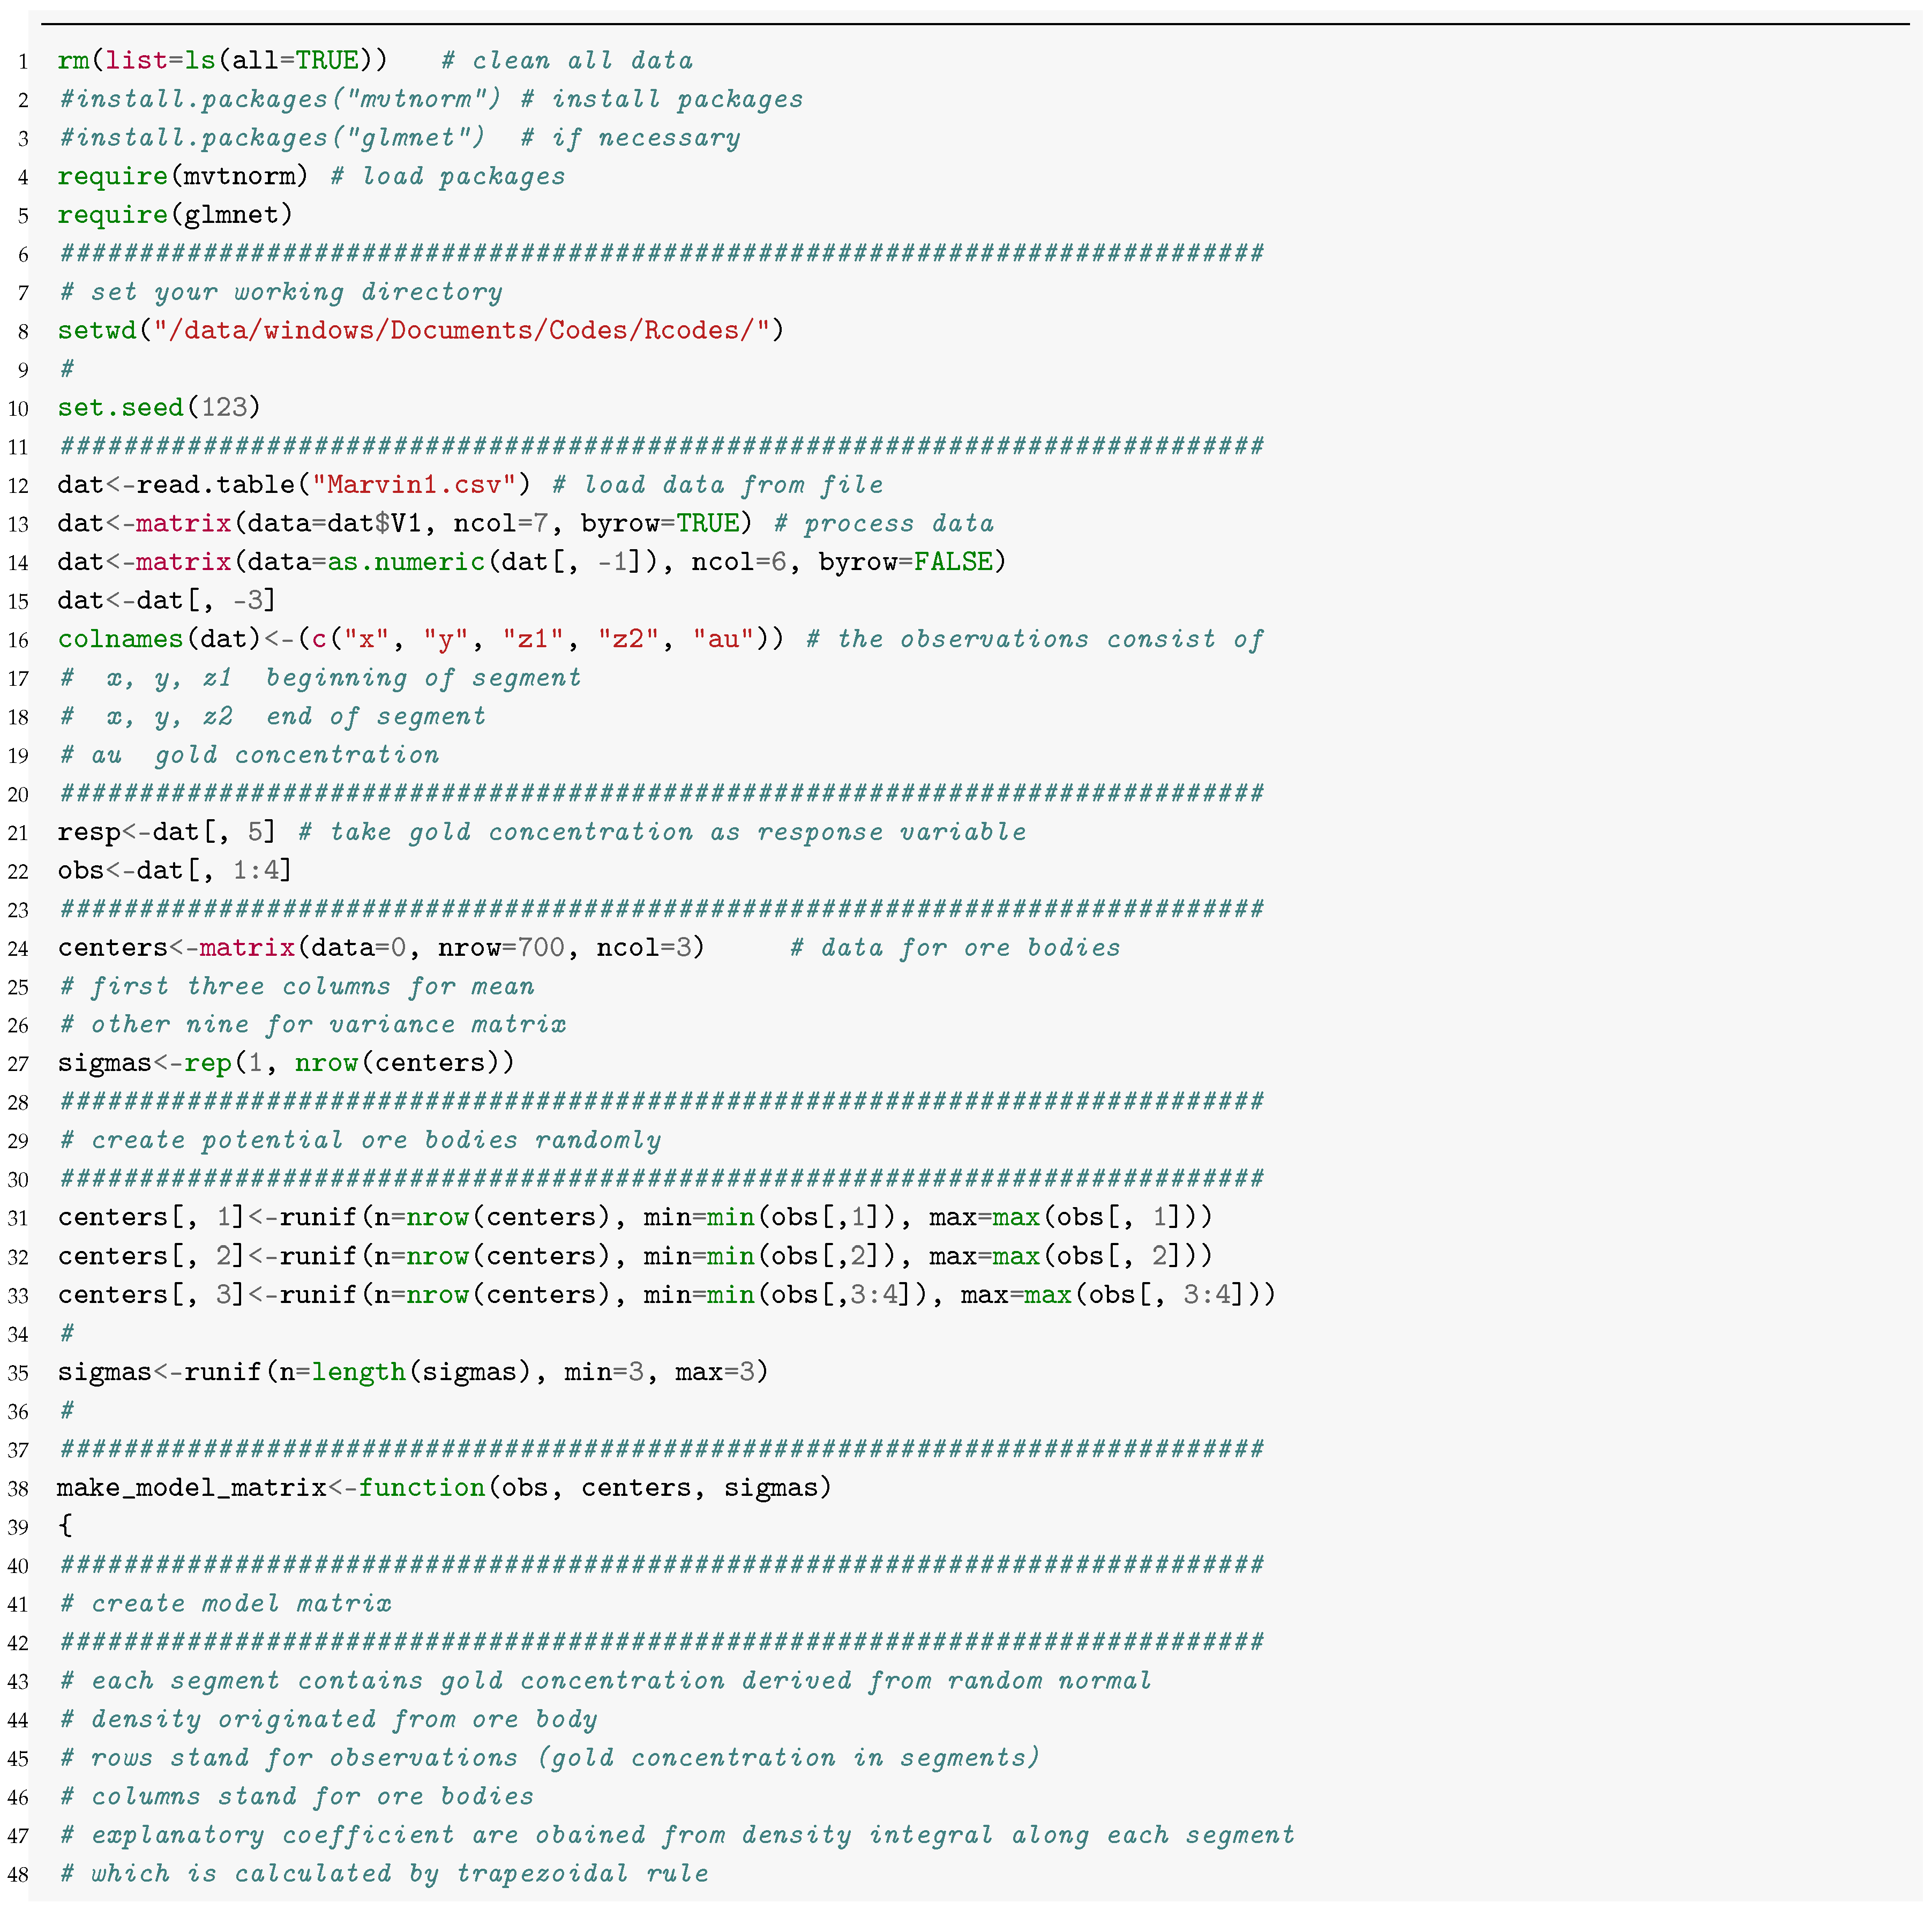
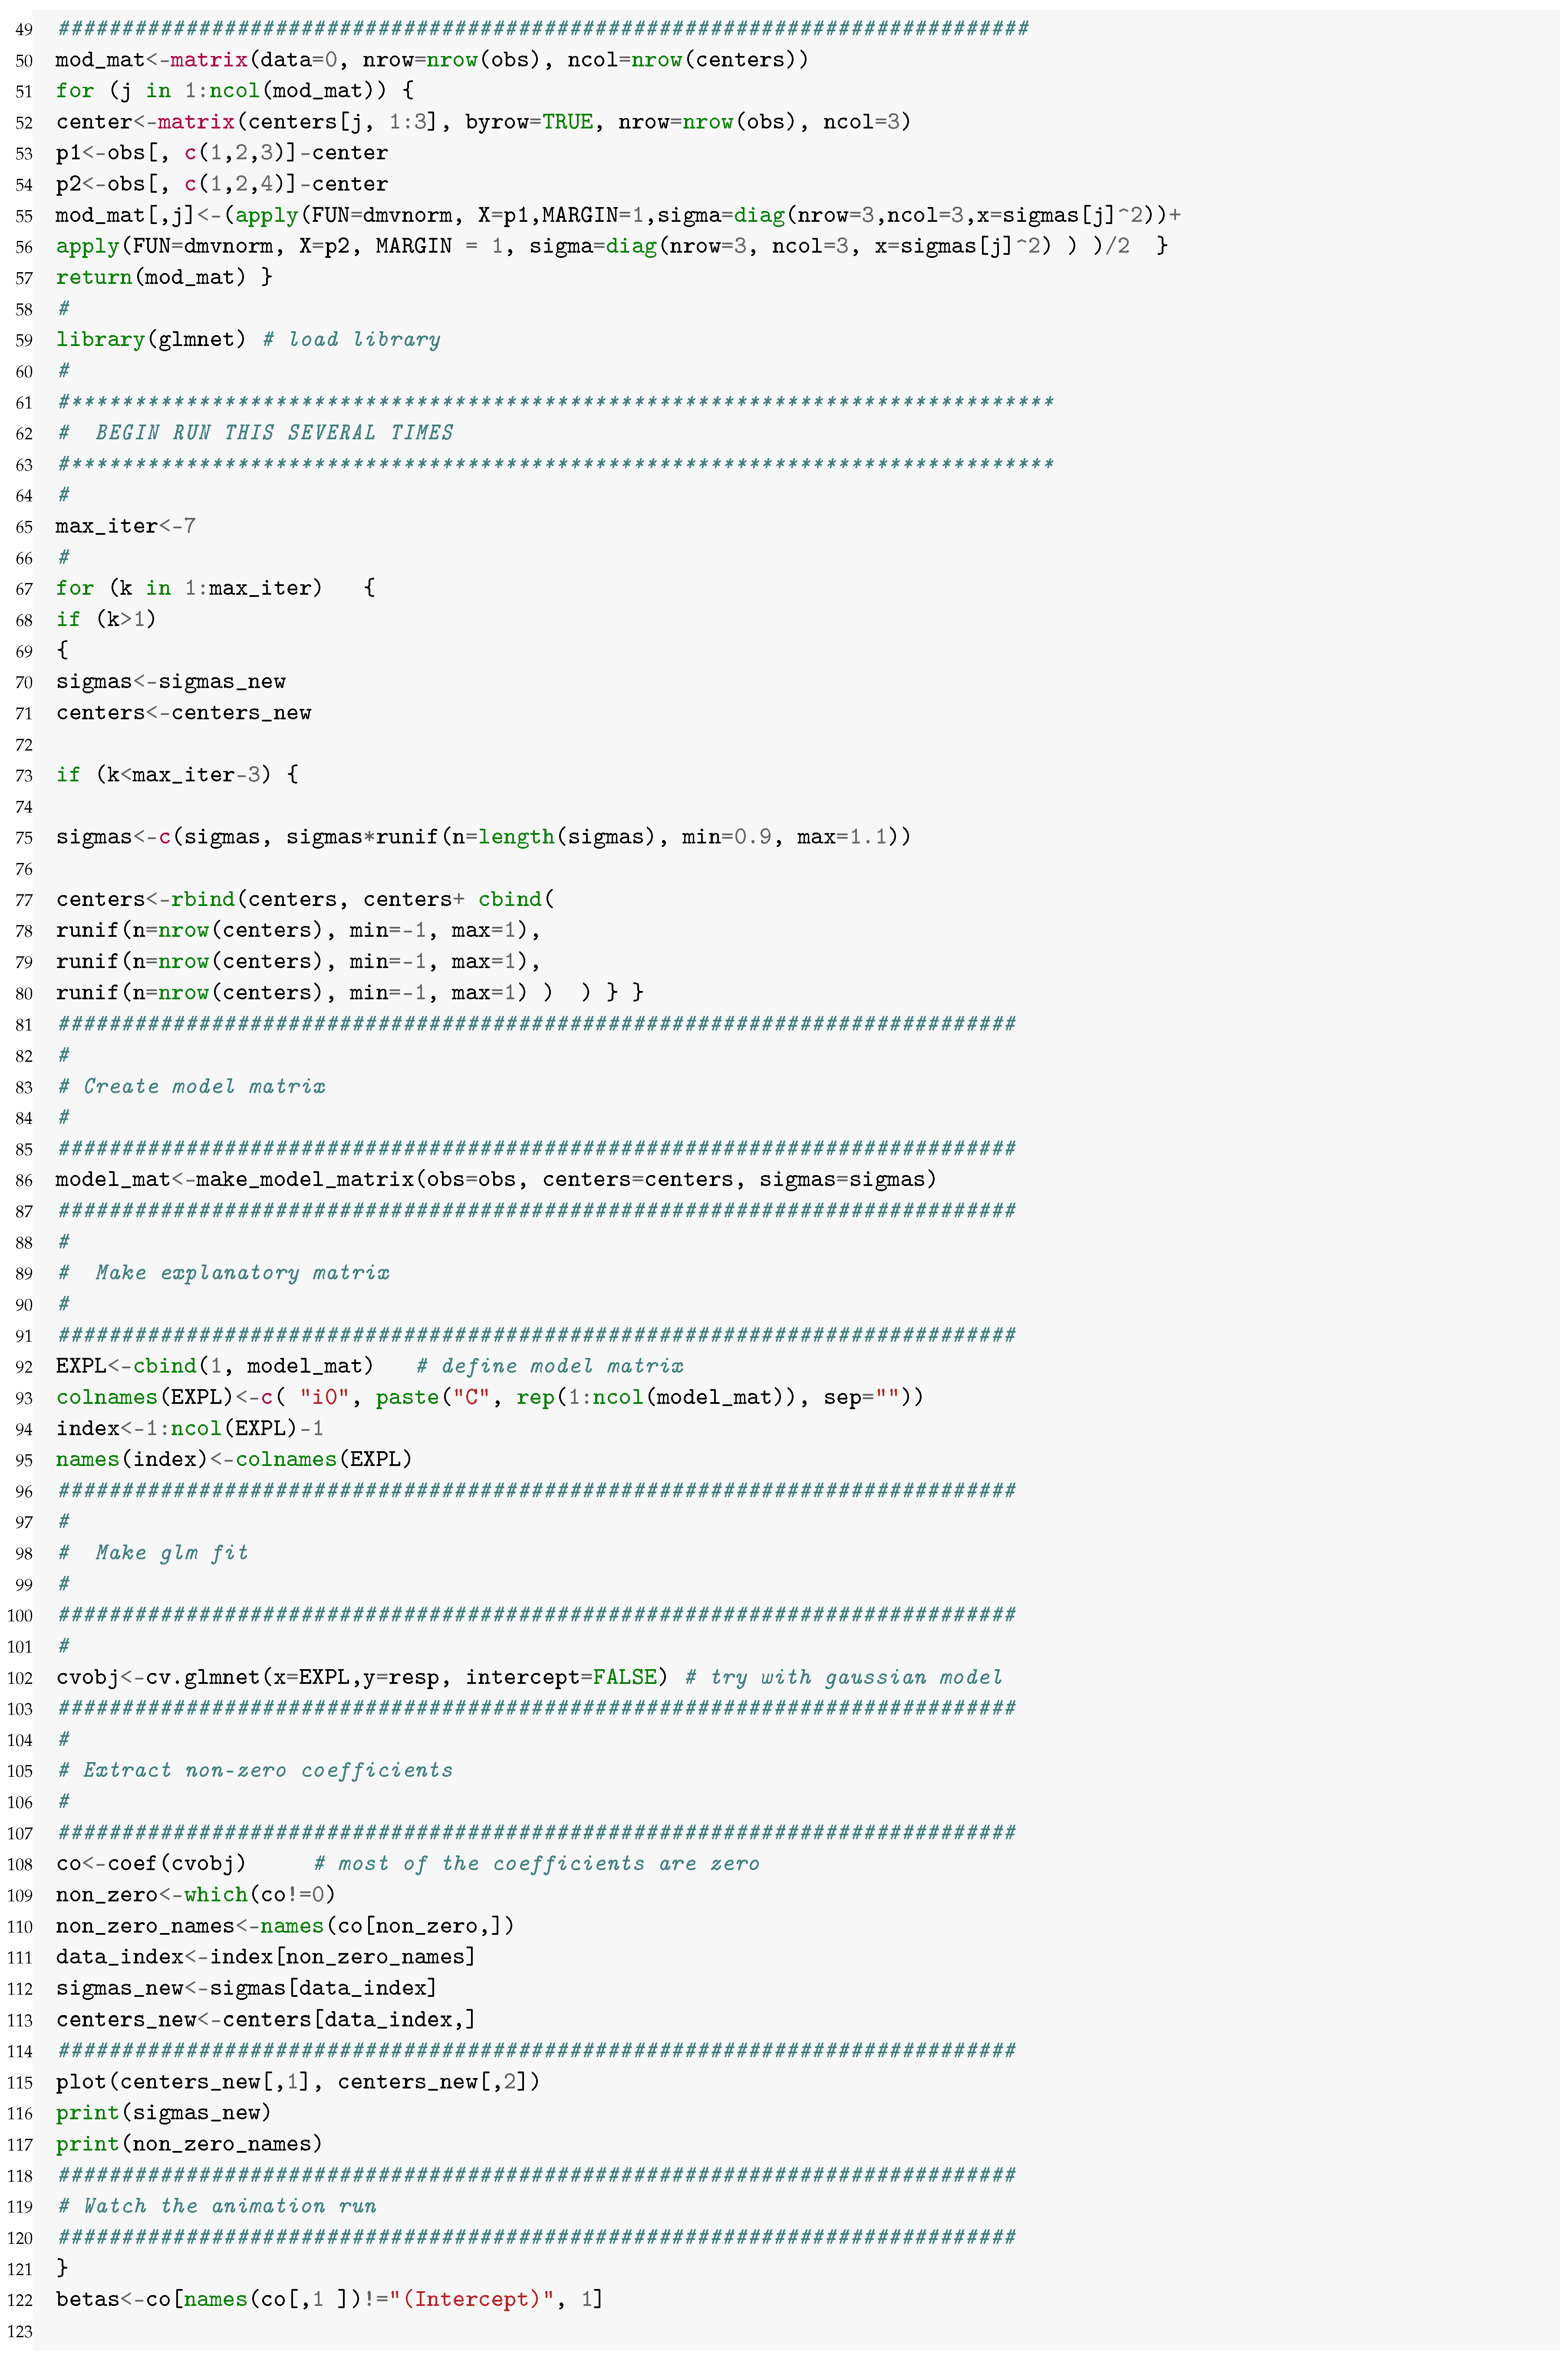
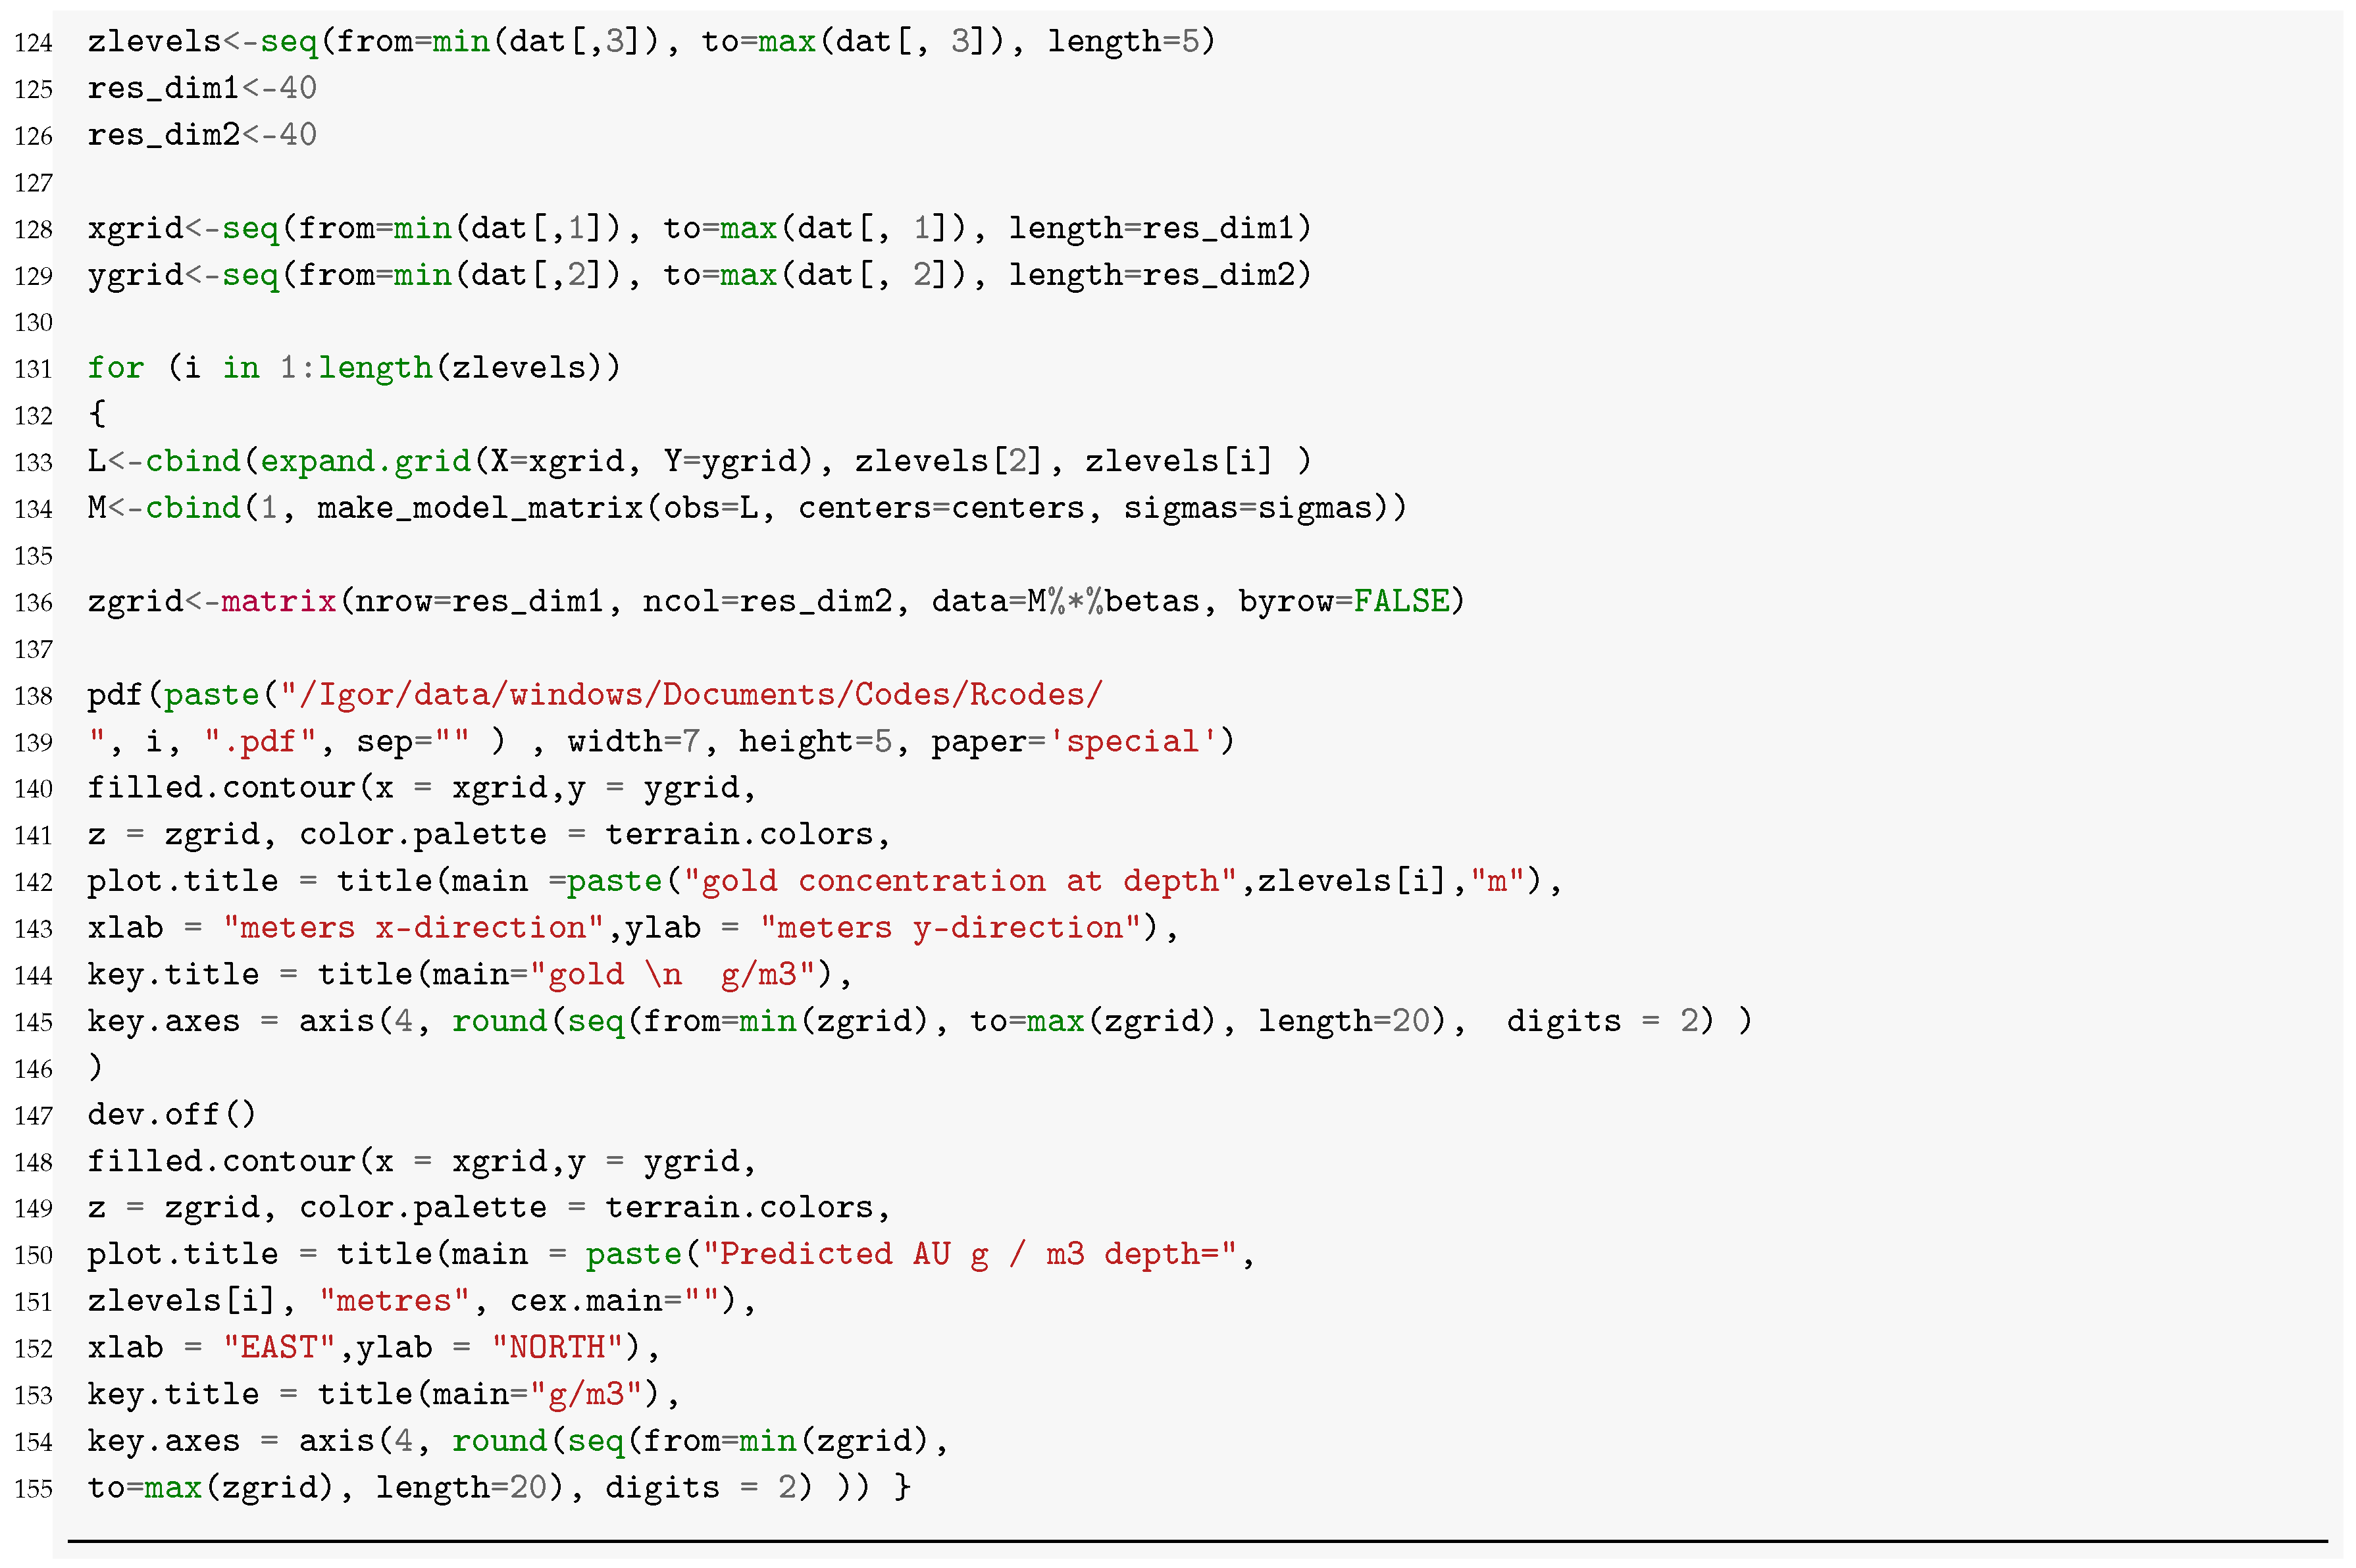
Outlook: The authors conclude that a further development of their methodology can yield a user-friendly implementation within R-environment, similarly to our code listed in
Appendix B, whose use merely requires regular drilling data updates. Such implementation can be easily integrated into any on-board drilling software. Using this, the exploration and extraction crews can observe in real time the effects of their decisions in the search for high-priority mineralization.


