Topographic Analysis of Landslide Distribution Using AW3D30 Data


1
Faculty of Engineering and Design, Kagawa University, Takamatsu 7610396, Japan
2
Yonden Consultants Co., Inc., Takamatsu, Kagawa 7610121, Japan
3
Japan Aerospace Exploration Agency (JAXA), Tsukuba, Ibaraki 3058505, Japan
4
Asia Air Survey Co., Ltd., Kawasaki, Kanagawa 2150004, Japan
*
Author to whom correspondence should be addressed.
Geosciences 2020, 10(4), 115; https://doi.org/10.3390/geosciences10040115
Submission received: 12 February 2020
/
Revised: 21 March 2020
/
Accepted: 23 March 2020
/
Published: 25 March 2020
(This article belongs to the Special Issue Satellite remote sensing for landslide monitoring and mapping)
Abstract
:Landslides cause serious damage to society, and some occur as reactivations of old landslides in response to earthquakes and/or rainfall. Landslide distributions are therefore useful when siting engineering projects such as road and tunnel constructions. Although several methods have been proposed to extract landslides from topographic data on the basis of their morphological features (crown, main scarp, and main body), such morphological features are gradually eroded by heavy precipitation or landslide recurrence. Therefore, conventional methods cannot always identify areas influenced by recurrent landslides. In this study, we investigated the relationship between ridgeline continuity and landslide distribution using AW3D30, which is a global digital surface model (DSM) dataset produced from the Panchromatic Remote-sensing Instrument for Stereo Mapping (PRISM) onboard the Advanced Land Observing Satellite (ALOS) launched by the Japan Aerospace Exploration Agency (JAXA) in 2013. The relationship between the area of landslides and the number of ridge pixels was analyzed, and we propose a method for estimating the upper bound distribution of landslide topographies based on extracted ridgelines data using the Data Envelopment Analysis (DEA) function on the R statistical software packages. The upper bound on the area of landslides decreases as the number of ridge pixels increases. The same trend was seen in all the five sites, and the upper bound derived from one site is hardly exceeded by those derived from all other sites. By using the upper bound distribution function, the landslide distribution will not be missed.
1. Introduction
Landslides are dangerous geohazards that can destroy or isolate residential areas and block roads and rivers. During the 2008 Wenchuan earthquake (China), rivers were dammed by more than 200 landslides [1], and potential dam failures pose a continued threat of catastrophic flooding in downstream areas. In the 2015 Nepal Gorkha earthquake, a huge landslide with an estimated volume of around 15 × 106 m3 destroyed Langtan village, killing 350 people [2]. Another landslide during the Gorkha earthquake dammed the Marshyangdi River, producing a new lake. To mitigate landslide damage, it is necessary to identify landslide susceptibility.
To assess the probability of landsliding, numerous methods have been developed. Those are largely separated into three categories: heuristic approaches, deterministic approaches, and statistical approaches [3]. In order to estimate the probability of landslide occurrences, statistical approaches are considered appropriate if there is enough data [4,5]. However, since the occurrence of landslides is infrequent and collecting observation data is difficult, especially for large-scale landslides, statistical approaches are hardly applicable. On the other hand, heuristic approaches can be used to estimate the landslide susceptibility because some landslides occur as reactivations of previous landslides in response to earthquakes and/or rainfall. Once a landslide mass is loosened, landslides tend to occur repeatedly in the same location [6]. Therefore, the locations of previous landslides must be considered when siting engineering projects such as road and tunnel constructions [7,8].
Landslide inventory maps document the locations of known past landslides, which are mostly identified visually from topographic data [9]. The crowns, main scarps, and main bodies of landslides are explicit topographic features commonly used to identify landslides [10,11]. Several methods have been proposed to extract landslides from topographic data [12,13,14,15]. However, not all landslides are clearly and easily recognizable; morphological features of landslides gradually disappear due to erosion by heavy precipitation or recurrent landslides triggered by heavy rainfall or earthquakes. Therefore, it is impossible to prepare complete landslide inventories based on the morphological features of landslides using conventional methods. On the other hand, Keefer [16] reported that original topographic features were altered and ridgelines were disconnected by landslides triggered during the 1989 Loma Prieta earthquake, producing discontinuous topographical features. Ridgelines become increasingly ambiguous with repeated landslide reactivation, and some may eventually be lost.
The objective of this study was to investigate the relationship between ridgeline continuity and the distribution of landslides (including older, more eroded landslides) in the eastern part of Shikoku Island, Japan, which includes landslide prone areas. Based on this relationship, we propose a method to estimate landslide distributions. To make our method widely applicable without data limitation, we used a freely available satellite-based digital elevation model (DEM) with global coverage, AW3D30 data.
2. Study Area
Our study area is in mountainous areas of the eastern part of Shikoku Island (Figure 1a), where elevations range from 200 to 1955 m (Figure 1b). The Izumi group, Sanbagawa metamorphic rocks, Chichibu complex, and Shimanto belt are the main geological units on Shikoku Island (Figure 1c). The Shimanto belt extends 1800 km along the Pacific side of southwestern Japan. It evolved atop the subducting Philippine Sea plate during Cretaceous accretion. The Chichibu complex comprises schists and weakly metamorphosed rocks. The Sanbagawa metamorphic rocks extends roughly east to west for more than 800 km from central to southwestern Japan. Metamorphosed Mikabu green rocks are intermittently present along the southern margin of the Sanbagawa metamorphic rocks. The Izumi group mostly consists of interbedded sandstone and shale with subordinate felsic tuffs and conglomerates (Figure 1c) [17,18].
To develop a method to automatically identify ridgelines, we analyzed the topographical features of connected ridgelines in three sites: Site A (Chichibu complex) and Site B and Site C (Izumi group), so to not be biased towards specific geology. Site B is located in the Asan mountain range and Site C is located near the MTL (Median Tectonic Line). To analyze the relationship between the area of landslides and the number of ridge pixels, the landslide inventory distribution and the extracted ridgelines were analyzed in 900 m × 900 m grids in five areas: Site 1 and Site 2 span the Sanbagawa metamorphic rocks, Mikabu green rocks, Chichibu complex and Shimanto belt (northern belt). Site 3 is in the Sanbagawa metamorphic rocks, Site 4 spans the Izumi group and Ryouke belt, and Site 5 is in the Shimanto belt (northern belt) (Figure 1c).
3. DEM and Landslide Datasets
Alganci et al. [19] evaluated freely available Advanced Spaceborne Thermal Emission and Reflection Radiometer (ASTER), Shuttle Radar Topography Mission (SRTM), and Advanced Land Observing Satellite (ALOS) 30-m resolution DEMs in terms of relative vertical agreement. They reported that the ALOS AW3D DEM provided better results than the others because the original AW3D product is a 5-m DEM processed from images at 2.5-m resolution [20], whereas the ASTER and SRTM products are processed from images at 15- and 30-m resolution, respectively. We therefore selected the AW3D DEM with 1 arc second (approximately 30-m mesh) resolution (AW3D30) as input data for this study [21]. The vertical accuracy of this DEM is reported to be 4.40 m RMS [21].
We used the National Research Institute for Earth Science and Disaster Resilience (NIED) landslide inventory map product [22] as the landslide inventory in the study area. The landslide maps are based on interpretations of 1:40,000 aerial photographs. The inventory data show crowns, flanks, and displaced masses on 1:50,000 topographic maps, and are available in digitized format through the NIED website free of charge. This dataset is commonly used for landslide susceptibility assessments (e.g., [23]).
4. Ridgeline Extraction
A flow chart of our analysis routine is provided in Figure 2. We first prepared a reference topographic dataset by manually digitizing ridge and depression lines on a visualized 10-m resolution DEM prepared by the Geospatial Information Authority of Japan. The Izumi group was developed in the Asan mountain range and the southern boundary of Izumi group is formed by the Median Tectonic Line (MTL). Site B is located in the Asan mountain range and Site C is located near the MTL. Because of landslide occurrences, parts of the slopes have been deformed and the original topographies have been affected by the deformation. Due to the influence of the deformation, ridgelines are not clearly identified over Mikabu green rocks and Sanbagawa metamorphic rocks. In order to clearly extract the topographic characteristics on ridgelines and exclude the influence of landslide deformation as much as possible, data sampling was performed on Chichibu complex (Site A) and Izumi group (Site B and Site C).
Figure 3 shows digitized ridge and depression lines at each site, where continuous ridgelines and depression lines are clearly identified on the visualized DEM. At each site, both ridge and depression lines were digitized using 150–200 points at 30-m intervals.
We investigated the usefulness of three topographic parameters for the automatic extraction of ridgelines from the AW 3D30 DEM: profile curvature, plan curvature, and openness. Curvature describes the orientation of a slope surface and quantifies concave and convex morphologies; plan curvature represents the curvature in the horizontal plane of a contour line and profile curvature represents the curvature along a slope cross section [24,25]. These parameters are used to characterize local landforms [26,27,28,29,30]. To topographically emphasize localized surface characteristics such as concavities and convexities, openness is also used as an angular measurement of the relationship between surface relief and horizontal distance based on the terrain line-of-sight principle [31].
Plan curvature, profile curvature, and openness were derived from the AW3D30 DEM and compared to the reference ridge and depression line dataset to determine which parameters best distinguished between the two topographic features (Figure 4). The distributions of plan and profile curvature values largely overlapped for ridge and depression lines, whereas the openness distributions of ridge and depression lines were completely separate. These results indicate that openness is the most appropriate parameter for extracting ridgelines from the AW3D30 DEM.
Finally, extracting ridgelines based on openness required determining a threshold openness value. Table 1 shows the average and standard deviation of openness at each site. Since the pixels on the ridgeline show larger openness, the threshold to extract ridgelines was decided by calculating the average and standard deviation of openness on the ridgelines. Because of the variation of the ridge shape, the values of the openness also show variation. The absolute value of openness is nearly zero at a flat plane. In order to decide the rule for extracting pixels located on the ridge and excluding pixels on flat planes, the threshold for extracting ridgelines is set at ave-2σ, which excludes 2.1% of the data below the lower confidence limit in the case of normal distribution. We determined the threshold value to be 6 by subtracting twice the standard deviation from the average openness value at each site, then averaging the three site-specific values and getting 5.8 (Table 1). A series of connected two or more ridge pixels is regarded to be a ridgeline.
5. Landslide Distributions Relative to Ridgelines
The relationship between the landslide inventory distribution and the extracted ridgelines was analyzed in five areas: Site 1 and Site 2 span the Sanbagawa metamorphic rocks, Mikabu green rocks, and Chichibu complex, Site 3 is in the Sanbagawa metamorphic rocks, Site 4 is in the Izumi group, and Site 5 is in the Shimanto belt (northern belt) (Figure 1c). The landslide inventory was compared to the extracted ridgelines in 900 m × 900 m grids over areas of 9 km × 14.4 km (10 × 16 grids, Site 1 and Site 2) or 9 km × 9 km (10 × 10 grids, sites 3–5). Figure 5 shows the extracted ridgelines and the NIED landslide inventory at the five sites.
In the case of Site 1, in the middle section (from L4C1 to L8C10), large-scale landslides and repetitive landslides are widely distributed. The density of extracted ridgelines is relatively low compared to other parts. In the northern section (from L1C1 to L2C10), connected ridgelines are clearly distributed. Below the connected ridgelines, small-scale landslides are distributed. It implies that surrounding the connected ridgelines, there have been no catastrophic landslides which occurred from the ridgelines.
In the case of Site 2, in the north-west section (from L1C1 to L4C5), the density of extracted ridge line is lower than that in other sections. Ridgelines are disconnected at the scar of large-scale or/and repetitive landslides. In the south-west section (from L7C1 to L11C2), ridgelines are connected and mostly coincide with the scar of landslides. In this section, the scale of landslides is smaller than that in the northern section. In the south-east section (from L7C3 to L16C10), the density of ridgelines is higher than that in the northern section and the number of landslides is lower than that in the northern section. It implies that surrounding of the connected ridgelines, there have been no catastrophic landslides which occurred from the ridgelines.
In the case of Site 3, below the connected ridgelines, small-scale landslides are distributed (e.g., in L7C9). At the scar of a large-scale landslide, such as in L6C3 to L7C4, the ridgelines are disconnected. At L2C10 and at L7C3, the number of ridge pixels is similar (approximately 100), but the area and distribution pattern of the landslides are different: 81% of the part of L7C3 is covered with large-scale and repetitive landslides. On the other hand, at L2C10, 38% of the grid is covered with small-scale landslides, which are located below the ridgelines. The relationship between the number of ridge pixels and the area of landsides shows variations.
In the case of Site 4, in the southern section (L5C1 to L10C10), small-scale landslides are distributed below connected ridgelines. In the northern section (L1C1 to L4C10), the ridgelines are disconnected and the density of ridge pixels is low, but there are no landslides. This is a different pattern from the other sites. The northern section has hilly topography with gentle slopes and there are no landslides.
In the case of Site 5, overall, ridgelines are connected and there are very few landslides.
In order to derive the function for estimating the area of landslides in each grid, the relationship between the number of ridge pixels and the area of landslides was focused upon. The average and standard deviations of the landslide body areas included in each 900 m × 900 m grid at each site are reported in Table 2. Since Site 1 shows the largest standard deviation of landslide areas, the function is defined by using the data of Site 1. The applicability of the function is verified using the data of the other sites.
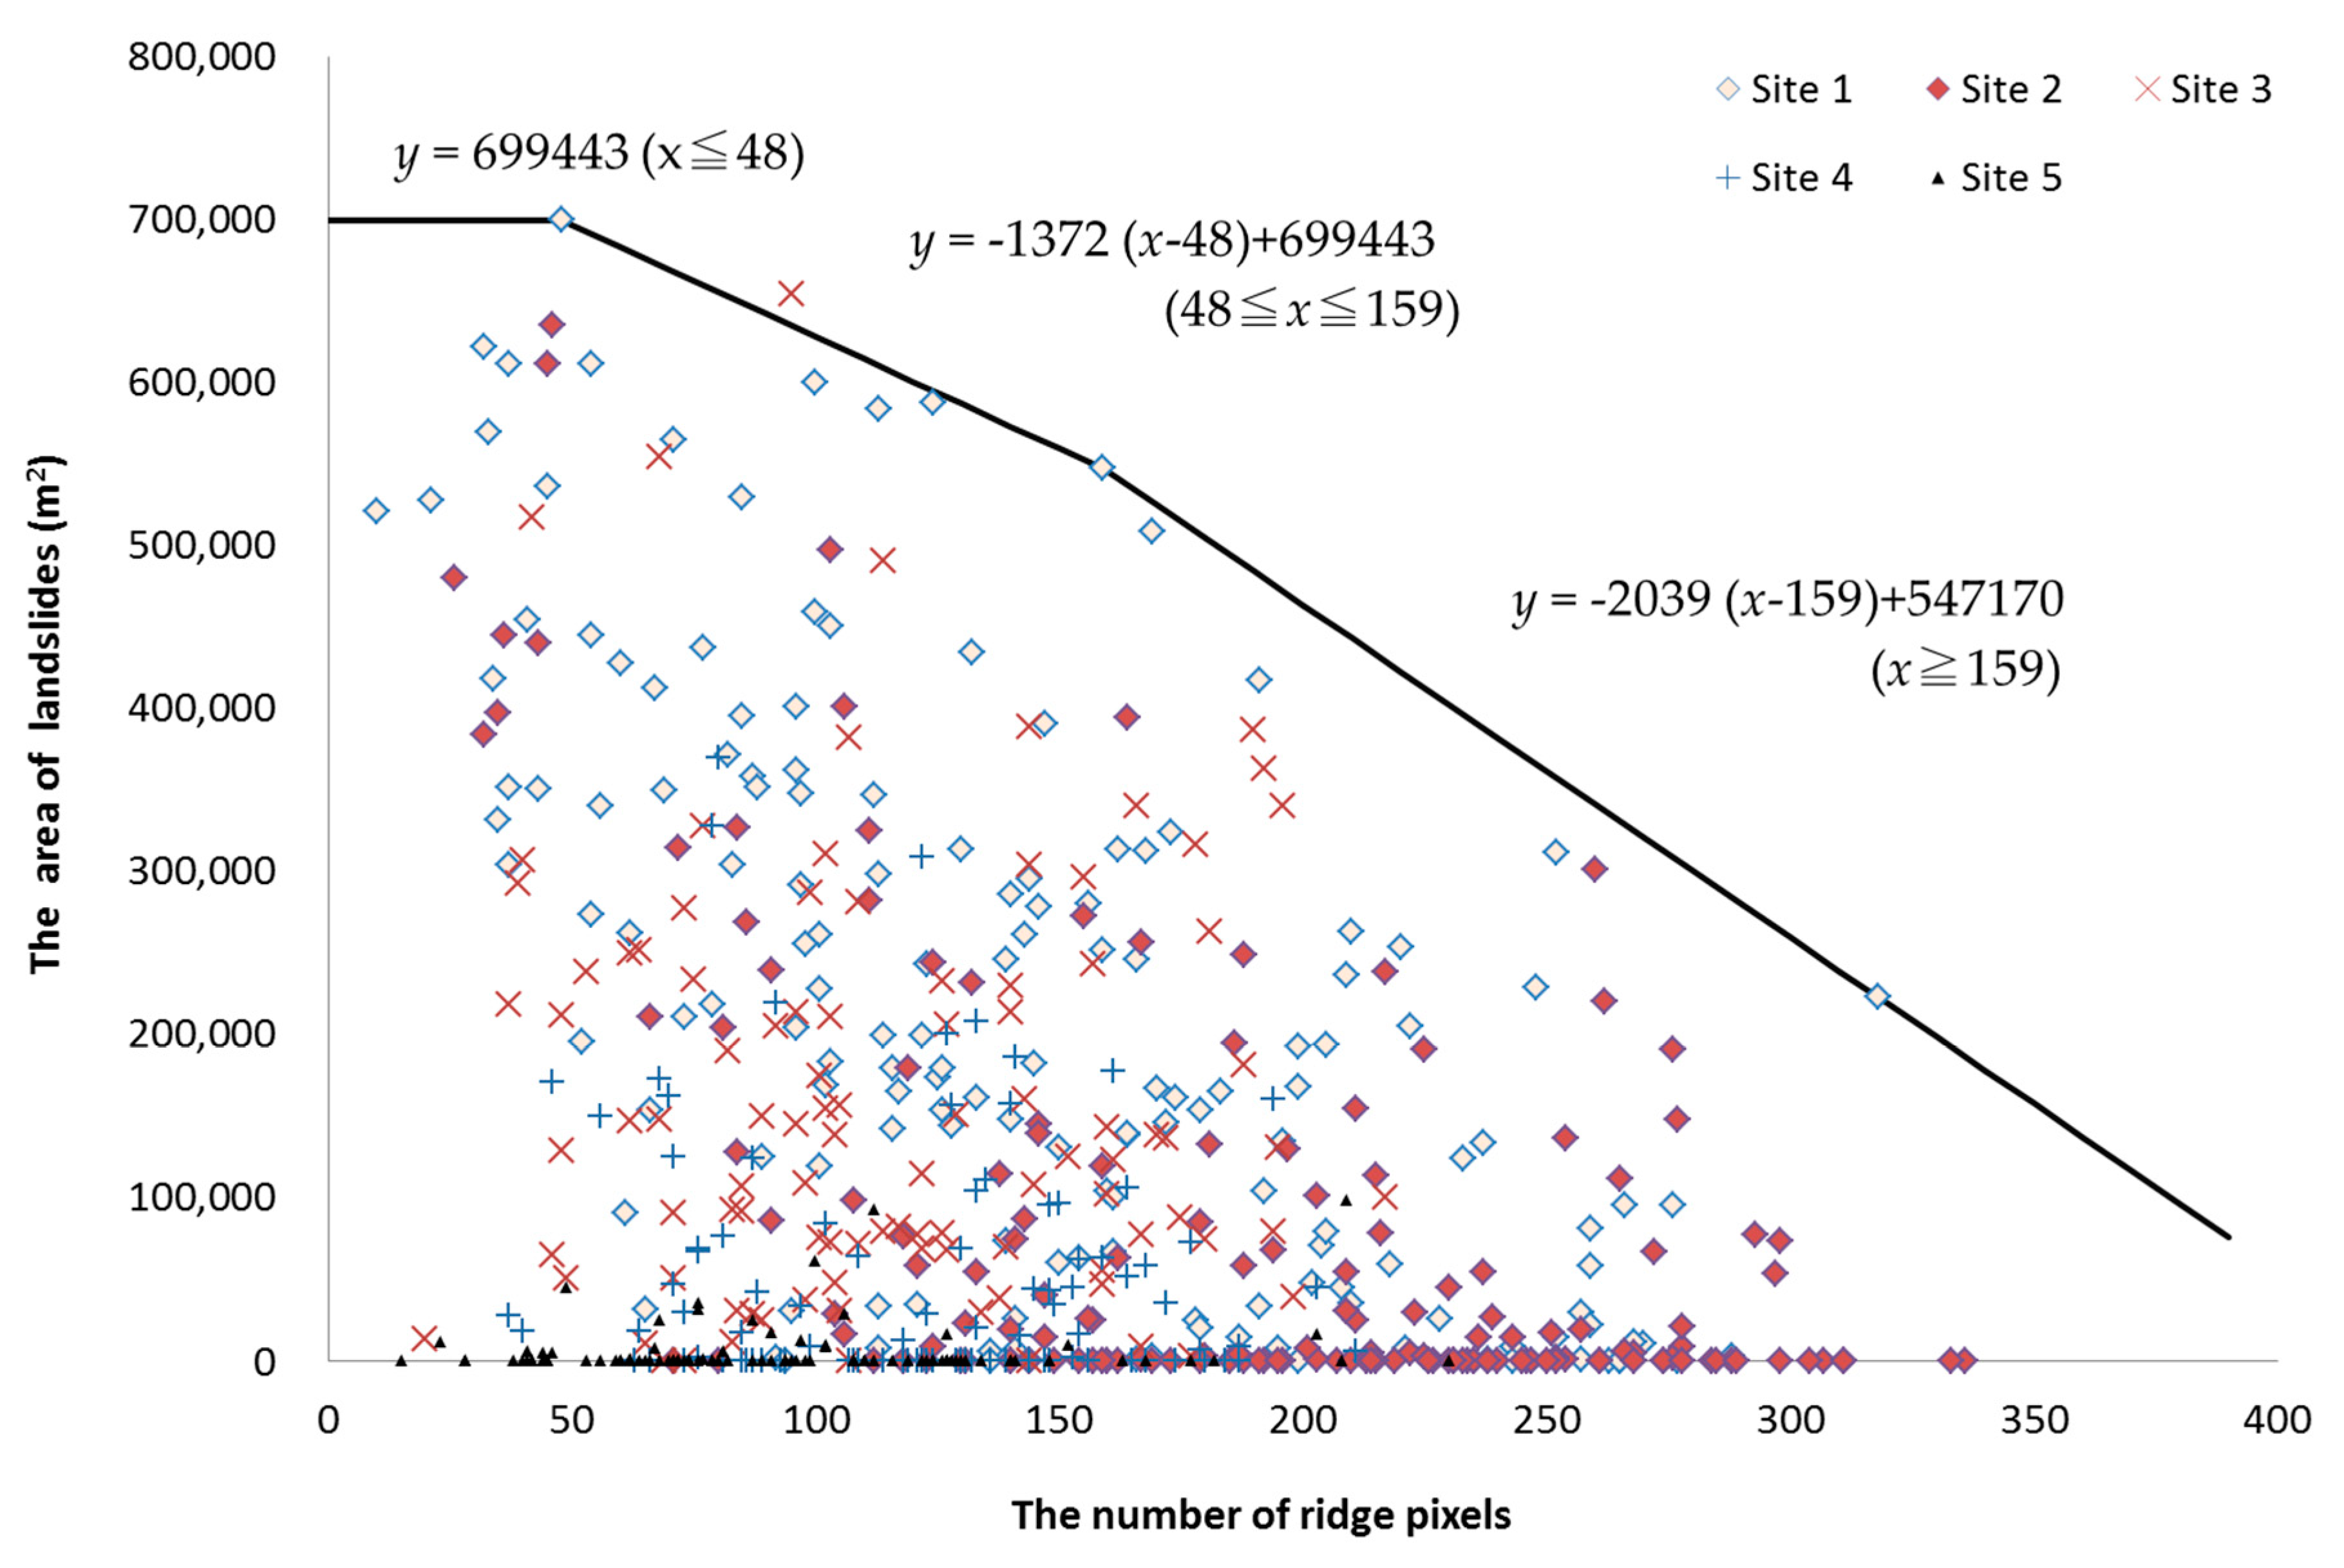
Figure 6 shows the relationship between the total area encompassed by the main bodies of landslides and the number of ridge pixels in each grid at Site 1. In some grids with a small number of ridge pixels, the area of landslide tends to be large; there are 13 grids with less than 50 ridge pixels each. In 7 out of 13 grids (69.2%), more than half of the area is covered by landslides. As the number of ridge pixels increases, the area of landslide decreases, but it shows variations in area. In the case of Site 1, it suggests that the number of ridge pixels can be used to estimate the upper bound area of landslides in each grid. In order not to underestimate the area of landslide nor miss the landslide susceptible zones, the upper bound of the scatter plot needs to be functionalized.
Kaihara et al. [32] propose a new approach to set critical lines for estimating slope failure occurrence by assigning risk to each slope. The critical line was derived using the hourly rainfall and effective rainfall data with and without slope failures. In order not to miss the risk of slope failures, the critical line of slope failure occurrence was determined by data envelope analysis (DEA). DEA was introduced for the efficiency analysis of decision-making units [33] and has become a leading approach of efficiency analysis in many fields, such as supply chain management, business research and development, and the design of petroleum distribution systems [34]. In order not to miss the landslide topographies, we also applied DEA to our landslide and ridgeline data to derive upper bound equations. In this study, the upper bound equations were derived by applying DEA to data regarding both the ridgeline and area of landslide in each grid using R package (rDEA) [35]. We derived the upper bound equations using the data of Site 1. Figure 6 shows the relationships between the area of landslides and the number of ridge pixels in Sites 1–5, with the upper bound equations derived from the data of Site 1. Almost all of the data points from the five sites are distributed within the boundary of the DEA function derived for Site 1. The DEA function therefore defines the upper bound of the areal extent of landslides for a given ridgeline density within a given area.
6. Discussion
In this study, the relationship between the area of landslides and the number of ridge pixels was analyzed and we proposed a method through which to quantify the upper bound area of landslides based on ridge pixels by applying DEA. In the case of Site 1, the upper bound of the area of landslides decreases as the number of ridge pixels increases. The same trend was seen in the other four sites, and the upper bound derived from Site 1 was hardly exceeded by those derived from all other sites.
The area of landslide shows a wide distribution in terms of the number of ridge pixels. With large-scale landslides or/and repetitive landslides, displaced materials are widely distributed and some grids are included in the displaced material. In these grids, the percentage of displaced material tends to be large. On the other hand, in the case of non-repetitive and small-scale landslides, the percentage of displaced mass tends to be small, because other sections of landslide, such as scarps and crowns, tend to remain clear. From L4C1 to L8C10 in Site 1, although the oldest recorded landslide occurred during the 1854 Ansei-Nankai earthquake [36], landslides certainly occurred repeatedly long before 1854, because the area is near the epicenters of multiple Nankai trough earthquakes. The age of the large-scale landslide was estimated to be between several hundred years and several hundred thousand years according to the morphological dating and dissection process [37]. During that time, scarps were cut by subsequent landslides and the typical topographic landslide features are not prominent on the slopes today. On the other hand, in the grids where the area of landslides is relatively small, small-scale landslides are located below the ridgelines. Over large-scale and repetitive landslides, catastrophic landslides had occurred from the ridgelines and the whole slopes came to be composed of landslide deposit. On the other hand, on slopes where small-scale landslides are located below the ridgelines, the lower sections of the slopes are composed of landslide deposit. In terms of damages which might be caused by landslide occurrences in the future, these two types of grids need to be distinguished.
Recent developments in remote sensing techniques enable various landslide survey and analysis approaches. Predominantly, remote sensing datasets are used to detect damages by analyzing differences in data, which are acquired before and after the disaster [38]. The size and the resolution of detected damage depend on the spatial resolution of satellite data: from several meters to several tens of meters. Moreover, interferometric synthetic aperture radar (InSAR) enables us to estimate the amount of displacement within a few centimeters (e.g., [39,40,41]). Using these approaches, mass movement can be detected as pixel-by-pixel changes. Because landslide masses tend to be loosened and landslides tend to occur repeatedly in the same location, landslide topographic features are key to understanding the mechanism of mass movement and identifying landslide-prone areas, and to landslide risk assessment. For example, if the detected changed pixels are sections of repetitive landslides, other landslides might successively occur on the same slope. If the detected changed pixels are located at a large-scale landslide, the landslide mass might be loosened, and other landslides might occur at the same slope in the future. In Van Westen et al. [42], it is mentioned that a combination of factors related to landslide occurrence are useful for estimating the risk of a landslide. A combination of the change detection technique and our proposing method is expected to enable more efficient risk management of landslide-related disasters.
7. Conclusions
This work represents a first step towards identifying landslides without clear topographic features using estimated ridge pixels. In this study, the relationship between the area of landslides and the number of ridge pixels was analyzed, and we developed a method to estimate the area of landslide in each 900 m × 900 m grid using AW3D30 data and the landslide inventory dataset in Shikoku, Japan. Since the relationship between the number of ridge pixel and the area of landsides shows variations, we proposed a new approach to estimate upper bound of landslide area by applying DEA so to not underestimate the landslides. Although landslide inventory data are prepared in Japan, such datasets are not available in other countries. Since AW3D30 provide global coverage (S82°- N82°) free of charge, our method might prove useful for roughly estimating landslide distributions in such locations.
The applicability of this method will be investigated through future applications. Currently, we find that the distribution of disconnected ridgelines is related to landslide distribution: the ridgeline is disconnected at the scar of a relatively large-scale landslide. The connectivity of the ridgelines should be evaluated quantitatively.
Author Contributions
A.N. conceived and designed the research and wrote the paper. S.H. supported the geological research. D.K. support GIS analyses. T.T. created and provided the AW3D30 dataset, gave comments, and corrected the manuscript. T.C. reviewed the manuscript. All authors have read and agreed to the published version of the manuscript.
Funding
This research was funded by the Takahashi industrial and economic research foundation.
Acknowledgments
English writing was supported by ELSS service and Megumi Takahashi.
Conflicts of Interest
The authors declare no conflict of interest.
References
- Xu, Q.; Fan, X.; Huang, R.; Westen, C. Landslide dams triggered by the Wenchuan Earthquake, Sichuan Province, southwest China. Bull. Eng. Geol. Environ. 2009, 68, 373–386. [Google Scholar] [CrossRef]
- Lacroix, P. Landslides triggered by the Gorkha earthquake in the Langtang valley, volumes and initiation processes. Earth Planets Space 2016, 68, 46. [Google Scholar] [CrossRef] [Green Version]
- Dai, F.C.; Lee, F.C.; Ngai, Y.Y. Landslide risk assessment and management: An overview. Eng. Geol. 2002, 64, 65–87. [Google Scholar] [CrossRef]
- Kirschbaum, D.B.; Stanley, T.; Simmons, J. A dynamic landslide hazard assessment system for Central America and Hispaniola. Nat. Hazards Earth Syst. Sci. 2015, 15, 2257–2272. [Google Scholar] [CrossRef] [Green Version]
- Froude, M.J.; Petley, D.V. Global fatal landslide occurrence from 2004 to 2016. Nat. Hazards Earth Syst. Sci. 2018, 18, 2161–2181. [Google Scholar] [CrossRef] [Green Version]
- Fan, X.; Zhan, W.; Dong, X.; Westen, C.; Xu, Q.; Dai, L.; Yang, Q.; Huang, R.; Havenith, H. Analyzing successive landslide dam formation by different triggering mechanisms: The case of the Tangjiawan landslide, Sichuan, China. Eng. Geol. 2018, 243, 128–144. [Google Scholar] [CrossRef]
- Chang, K.; Chan, Y.; Chen, R.; Hsieh, Y. Geomorphological evolution of landslides near an active normal fault in northern Taiwan, as revealed by lidar and unmanned aircraft system data. Nat. Hazards Earth Syst. Sci. 2018, 18, 709–727. [Google Scholar] [CrossRef] [Green Version]
- Wang, Y.; Ma, C.; Wang, Z. Prediction of landslide position of loose rock mass at mountain tunnel exit. Adv. Civ. Eng. 2019, 2019, 1–9. [Google Scholar] [CrossRef]
- Guzzetti, F.; Mondini, A.; Cardinali, M.; Fiorucci, F.; Santangelo, M.; Chang, K. Landslide inventory maps: New tools for an old problem. Earth-Sci. Rev. 2012, 112, 42–66. [Google Scholar] [CrossRef] [Green Version]
- Varnes, D. Slope Movement Types and Processes. In Landslides: Analysis and Control; Schuster, R., Krizek, R., Eds.; National Research Council; Transportation Research Board; Special Report 176; National Academy of Science: Washington, DC, USA, 1978; pp. 11–33. [Google Scholar]
- International Association for Engineering Geology and the Environment (IAEG) Commission. Suggested nomenclature for landslides. Bull. Int. Assoc. Eng. Geol. 1990, 41, 13–16. [Google Scholar] [CrossRef]
- Tarolli, P.; Tarboton, D. A new method for determination of most likely landslide initiation points and the evaluation of digital terrain model scale in terrain stability mapping. Hydrol. Earth Sys. Sci. 2006, 10, 663–677. [Google Scholar] [CrossRef] [Green Version]
- Booth, A.; Roering, J.; Perron, J. Automated landslide mapping using spectral analysis and high-resolution topographic data: Puget Sound lowlands, Washington, and Portland Hills, Oregon. Geomorphology 2009, 109, 132–147. [Google Scholar] [CrossRef]
- Hölbling, D.; Betts, H.; Spiekermann, R.; Phillips, C. Identifying Spatio-Temporal Landslide Hotspots on North Island, New Zealand, by Analyzing Historical and Recent Aerial Photography. Geosciences 2016, 6, 48. [Google Scholar] [CrossRef] [Green Version]
- Pawluszek, K. Landslide features identification and morphology investigation using high-resolution DEM derivatives. Nat. Hazards 2019, 96, 311–330. [Google Scholar] [CrossRef] [Green Version]
- Keefer, D. The Loma Prieta, California, Earthquake of October 17, 1989—Landslides; USGS Professional Paper 1551–C; US Government Printing Office: Washington, DC, USA, 1998.
- AIST. GeomapNavi, Geological Map Display System of Geological Survey of Japan; AIST: Warrendale, PA, USA, 2014. [Google Scholar]
- Hasegawa, S.; Tamura, E.; Kanbara, D. Georisks along active faults of Median Tectonic Line in Shikoku, Southwest Japan. In Proceedings of the 10th Asian Regional Conference of IAEG, Kyoto, Japan, 26–29 September 2015; pp. 1–8. [Google Scholar]
- Alganci, U.; Besol, B.; Sertel, E. Accuracy assessment of different digital surface models. ISPRS Int. J. Geo-Inf. 2018, 7, 114. [Google Scholar] [CrossRef] [Green Version]
- Tadono, T.; Ishida, H.; Oda, F.; Naito, S.; Minakawa, K.; Iwamoto, H. Precise Global DEM Generation by ALOS PRISM. ISPRS Ann. Photogramm. Remote Sens. Spat. Inf. Sci. 2014, 4, 71–76. [Google Scholar] [CrossRef] [Green Version]
- Tadono, T.; Nagai, H.; Ishida, H.; Oda, F.; Naito, S.; Minakawa, K.; Iwamoto, H. Initial Validation of the 30 m-mesh Global Digital Surface Model Generated by ALOS PRISM. Int. Arch. Photogramm. Remote Sens. Spat. Inf. Sci. ISPRS 2016, 157–162. [Google Scholar] [CrossRef]
- National Research Institute for Earth Science and Disaster Prevention. Digital Archive for Landslide Distribution Maps. Available online: http://dil-opac.bosai.go.jp/publication/nied_tech_note/landslidemap/gis.html (accessed on 10 February 2020).
- Dou, J.; Bui, D.; Yunus, A.; Jia, K.; Song, X.; Revhaug, I.; Xia, H.; Zhu, Z. Optimization of causative factors for landslide susceptibility evaluation using remote sensing and GIS data in parts of Niigata, Japan. PLoS ONE 2015, 10, e0133262. [Google Scholar] [CrossRef] [Green Version]
- Schmidt, J.; Evans, I.; Brinkmann, J. Comparison of polynomial models for land surface curvature calculation. Int. J. Geogr. Inf. Sci. 2003, 17, 797–814. [Google Scholar] [CrossRef]
- Shary, P.; Sharaya, L.; Mitusov, A. Fundamental quantitative methods of land surface analysis. Geoderma 2002, 107, 1–32. [Google Scholar] [CrossRef]
- Bergonse, R.; Reis, E. Controlling factors of the size and location of large gully systems: A regression-based exploration using reconstructed pre-erosion topography. Catena 2016, 147, 621–631. [Google Scholar] [CrossRef]
- Conoscenti, C.; Angileri, S.; Cappadonia, C.; Rotigliano, E.; Agnesi, V.; Märker, M. Gully erosion susceptibility assessment by means of GIS-based logistic regression: A case of Sicily (Italy). Geomorphology 2014, 204, 399–411. [Google Scholar] [CrossRef] [Green Version]
- Dewitte, O.; Daoudi, M.; Bosco, C.; Eeckhaut, M. Predicting the susceptibility to gully initiation in data-poor regions. Geomorphology 2015, 228, 101–115. [Google Scholar] [CrossRef]
- Gutiérrez, Á.; Schnabel, S.; Felicísimo, Á. Modelling the occurrence of gullies in rangelands of southwest Spain. Earth Surf. Proc. Landf. 2009, 34, 1894–1902. [Google Scholar] [CrossRef]
- Nonomura, A.; Hasegawa, S.; Matsumoto, H.; Takahashi, M.; Masumoto, M.; Fujisawa, K. Curvature derived from LiDAR digital elevation models as simple indicators of debris-flow susceptibility. J. Mt. Sci. 2015, 16, 95–107. [Google Scholar] [CrossRef]
- Yokoyama, R.; Shirasawa, M.; Pike, R. Visualizing topography by openness: A new application of image processing to Digital Elevation Models. Photogramm. Eng. Remote Sens. 2002, 68, 257–265. [Google Scholar]
- Kaihara, S.; Arakawa, M.; Tetsuga, H.; Sato, T.; Maeda, M.; Nakayama, H.; Furukawa, K. A study on the method of critical line in the each slope using data envelopment analysis. J. Jpn. Soc. Eros. Control Eng. 2015, 16, 95–107. [Google Scholar]
- Charnes, A.; Cooper, W.; Rhodes, E. Measuring the efficiency of decision making units. Eur. J. Oper. Res. 1978, 2, 429–444. [Google Scholar] [CrossRef]
- Cooper, W.; Seiford, L.; Zhu, J. Data envelopment analysis, History, Models, and Interpretations. In Handbook on Data Envelopment Analysis; Springer: Boston, MA, USA, 2011; pp. 1–39. [Google Scholar]
- CRAN. Available online: https://cran.r-project.org/web/packages/rDEA/rDEA.pdf (accessed on 12 June 2016).
- Ministry of Land, Infrastructure, Transport and Tourism, Government of Japan. Shikoku Regional Development Bureau. Available online: https://www.skr.mlit.go.jp/kokai/project_evaluation/h23/2nd/pdf/6.pdf (accessed on 12 October 2011).
- Yanagida, M.; Hasegawa, S. Morphological dating and dissection process of landslide topography. In Landslide, Proceedings of the 7th International Conference and Field Workshop on Landslides, 28 August–15 September 1993, Czech and Slovakia; Novosad, S., Wagner, P., Eds.; A.A. Balkema: Rotterdam, The Netherlands; Brookfield: Toronto, ON, Canada, 1993; pp. 117–122. [Google Scholar]
- NASA. Landsat Science. Available online: https://www.nasa.gov/jpl/landsat-8-reveals-extent-of-quake-disaster-in-nepal-s-langtang-valley (accessed on 12 February 2020).
- Nappo, N.; Peduto, D.; Mavrouli, O.; Westen, C.; Gullà, G. Slow-moving landslides interacting with the road network: Analysis of damage using ancillary data, in situ surveys and multi-source monitoring data. Eng. Geol. 2019, 260, 105244. [Google Scholar] [CrossRef]
- Li, L.; Yao, X.; Yao, J.; Zhou, Z.; Feng, X.; Liu, X. Analysis of deformation characteristics for a reservoir landslide before and after impoundment by multiple D-InSAR observations at Jinshajiang River, China. Nat. Hazards 2019, 98, 719–733. [Google Scholar] [CrossRef]
- Hao, J.; Wu, T.; Wu, X.; Hu, G.; Zou, D.; Zhu, X.; Zhao, L.; Li, R.; Xie, C.; Ni, J.; et al. Investigation of a small landslide in the Qinghai-Tibet Plateau by InSAR and absolute deformation model. Remote Sens. 2019, 11, 2126. [Google Scholar] [CrossRef] [Green Version]
- Van Western, C.J.; Van Asch, T.W.J.; Soeters, R. Landslide hazard and risk zonation—Why is it sill so difficult? Bull. Eng. Geol. Environ. 2006, 65, 167–184. [Google Scholar] [CrossRef]
Figure 1.
Study area (a) Location of the study area (Black square shows the study area) (b) Elevation map (c) Geological map [17] with the location of sites (Site A-Site C and Site 1-Site 5).
Figure 1.
Study area (a) Location of the study area (Black square shows the study area) (b) Elevation map (c) Geological map [17] with the location of sites (Site A-Site C and Site 1-Site 5).
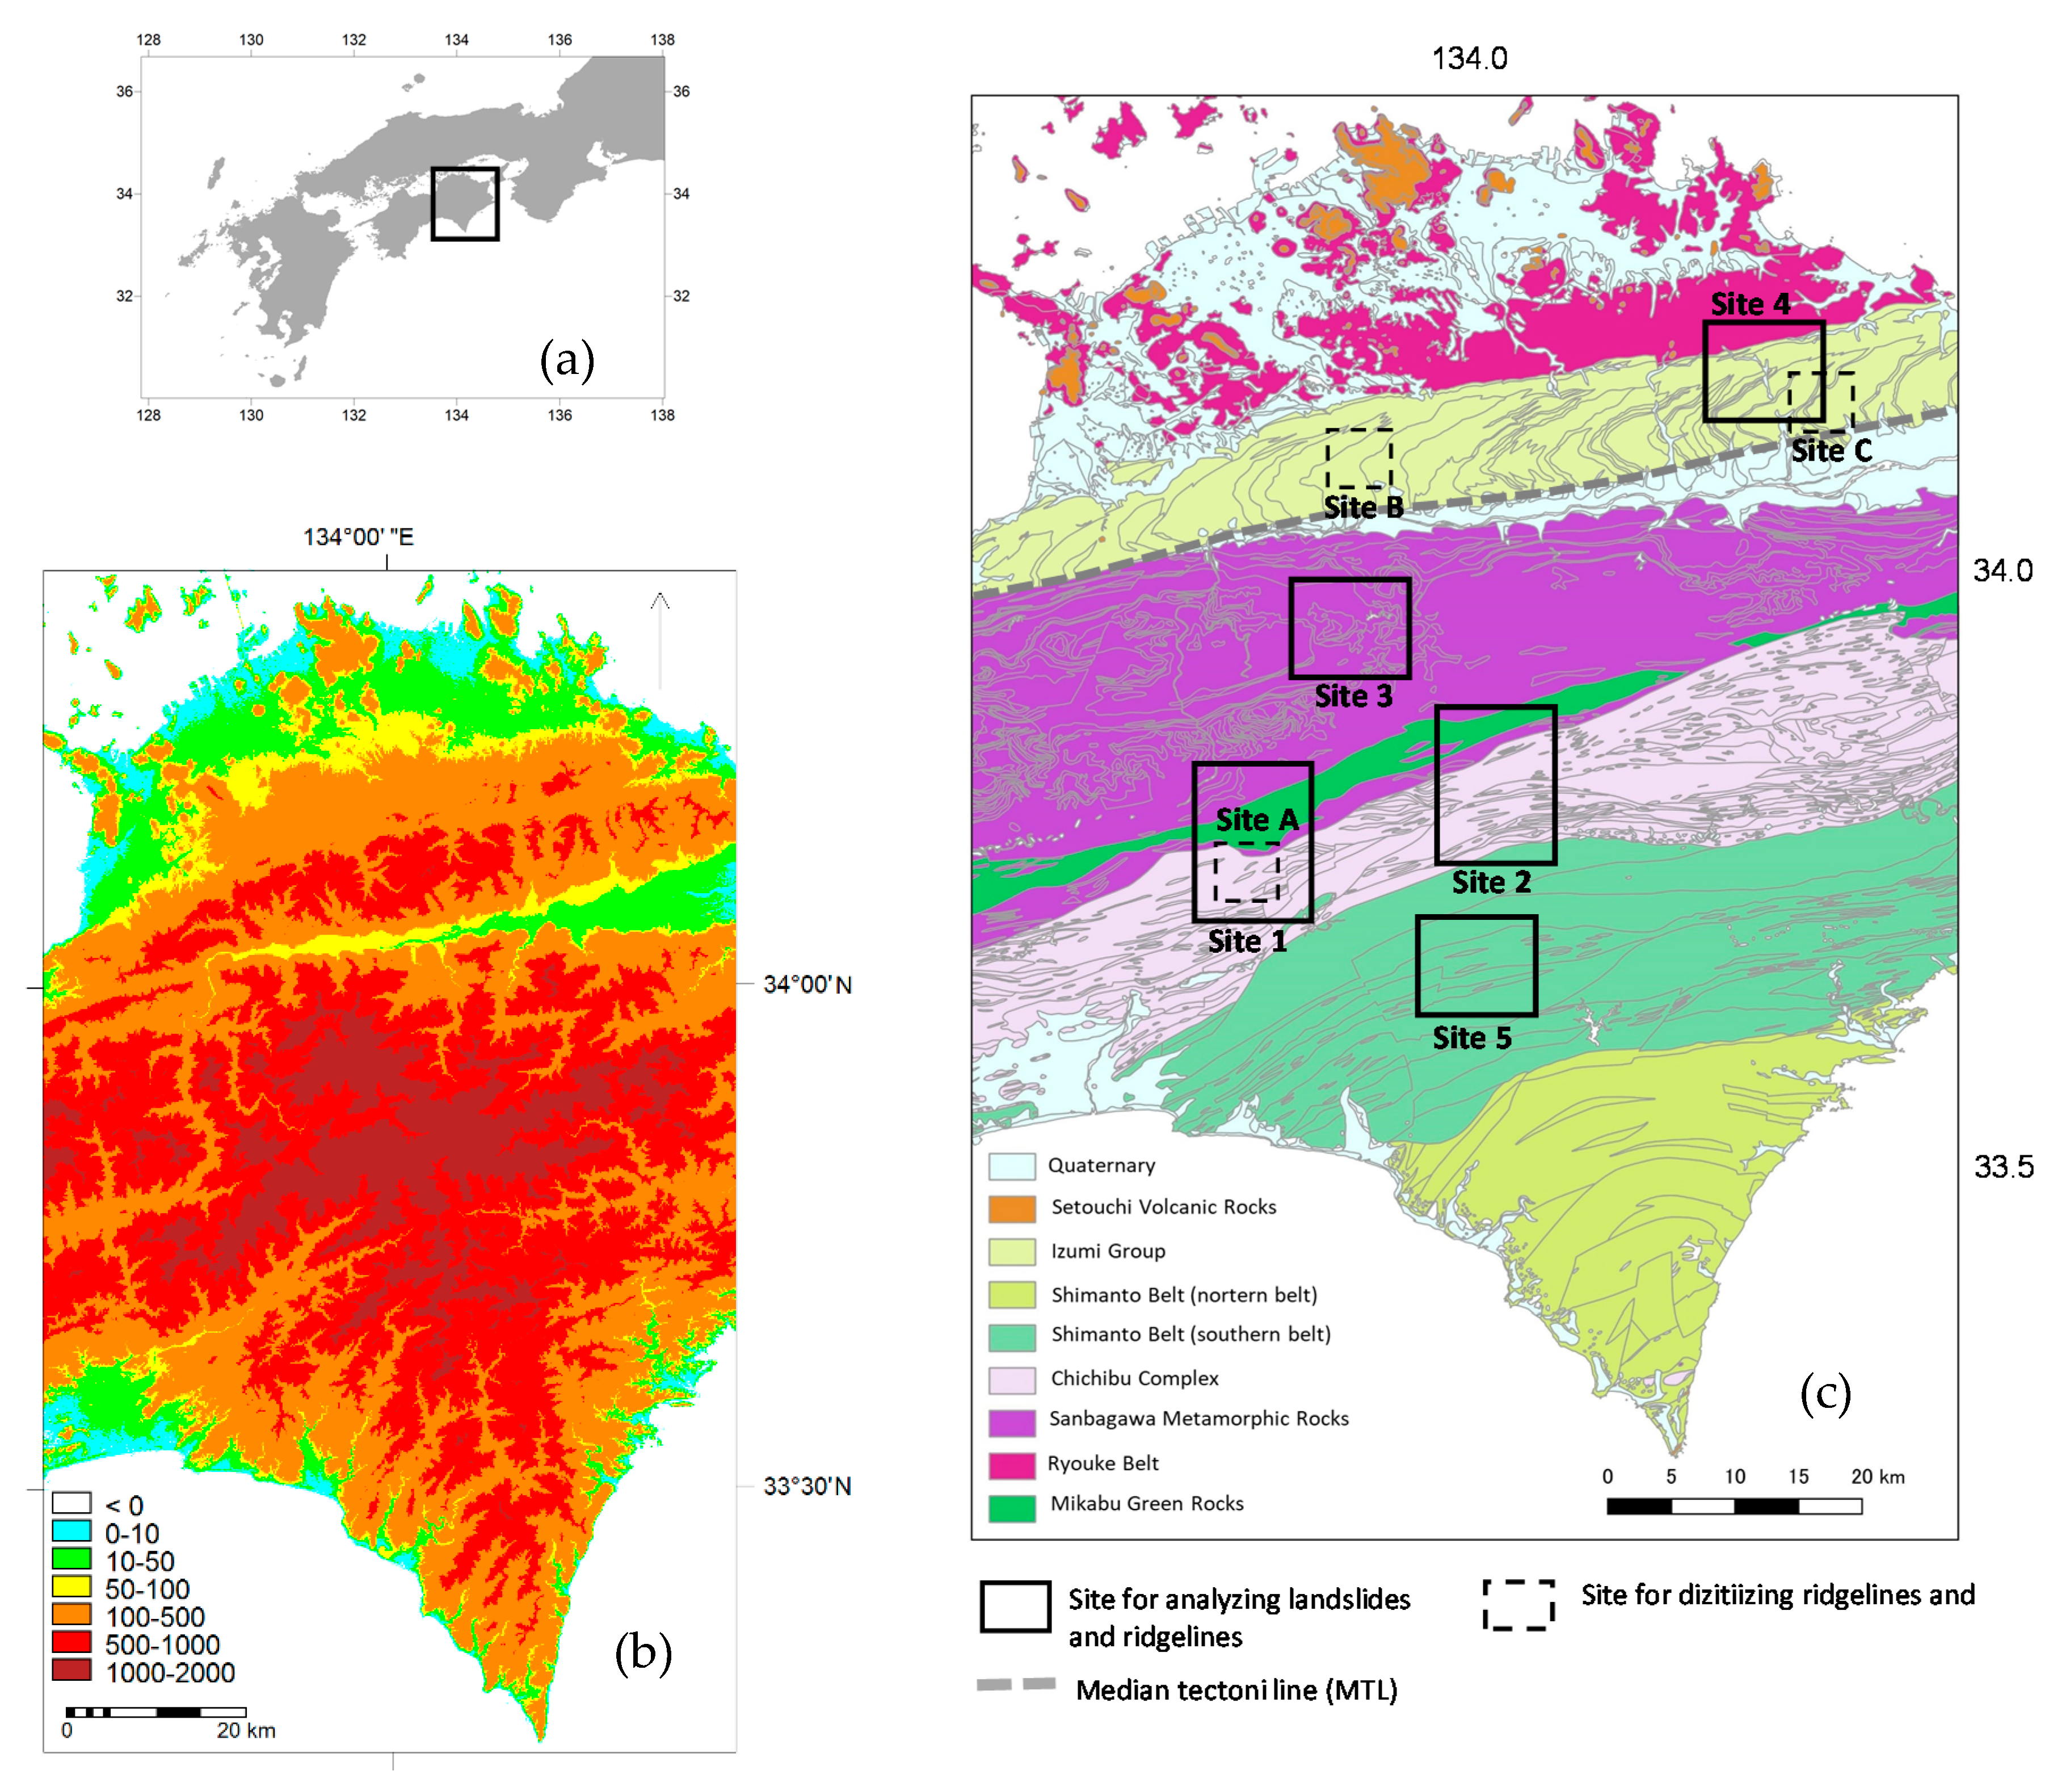
Figure 2.
Flowchart of the topographic processing and comparison with landslide inventory data employed in this study.
Figure 2.
Flowchart of the topographic processing and comparison with landslide inventory data employed in this study.
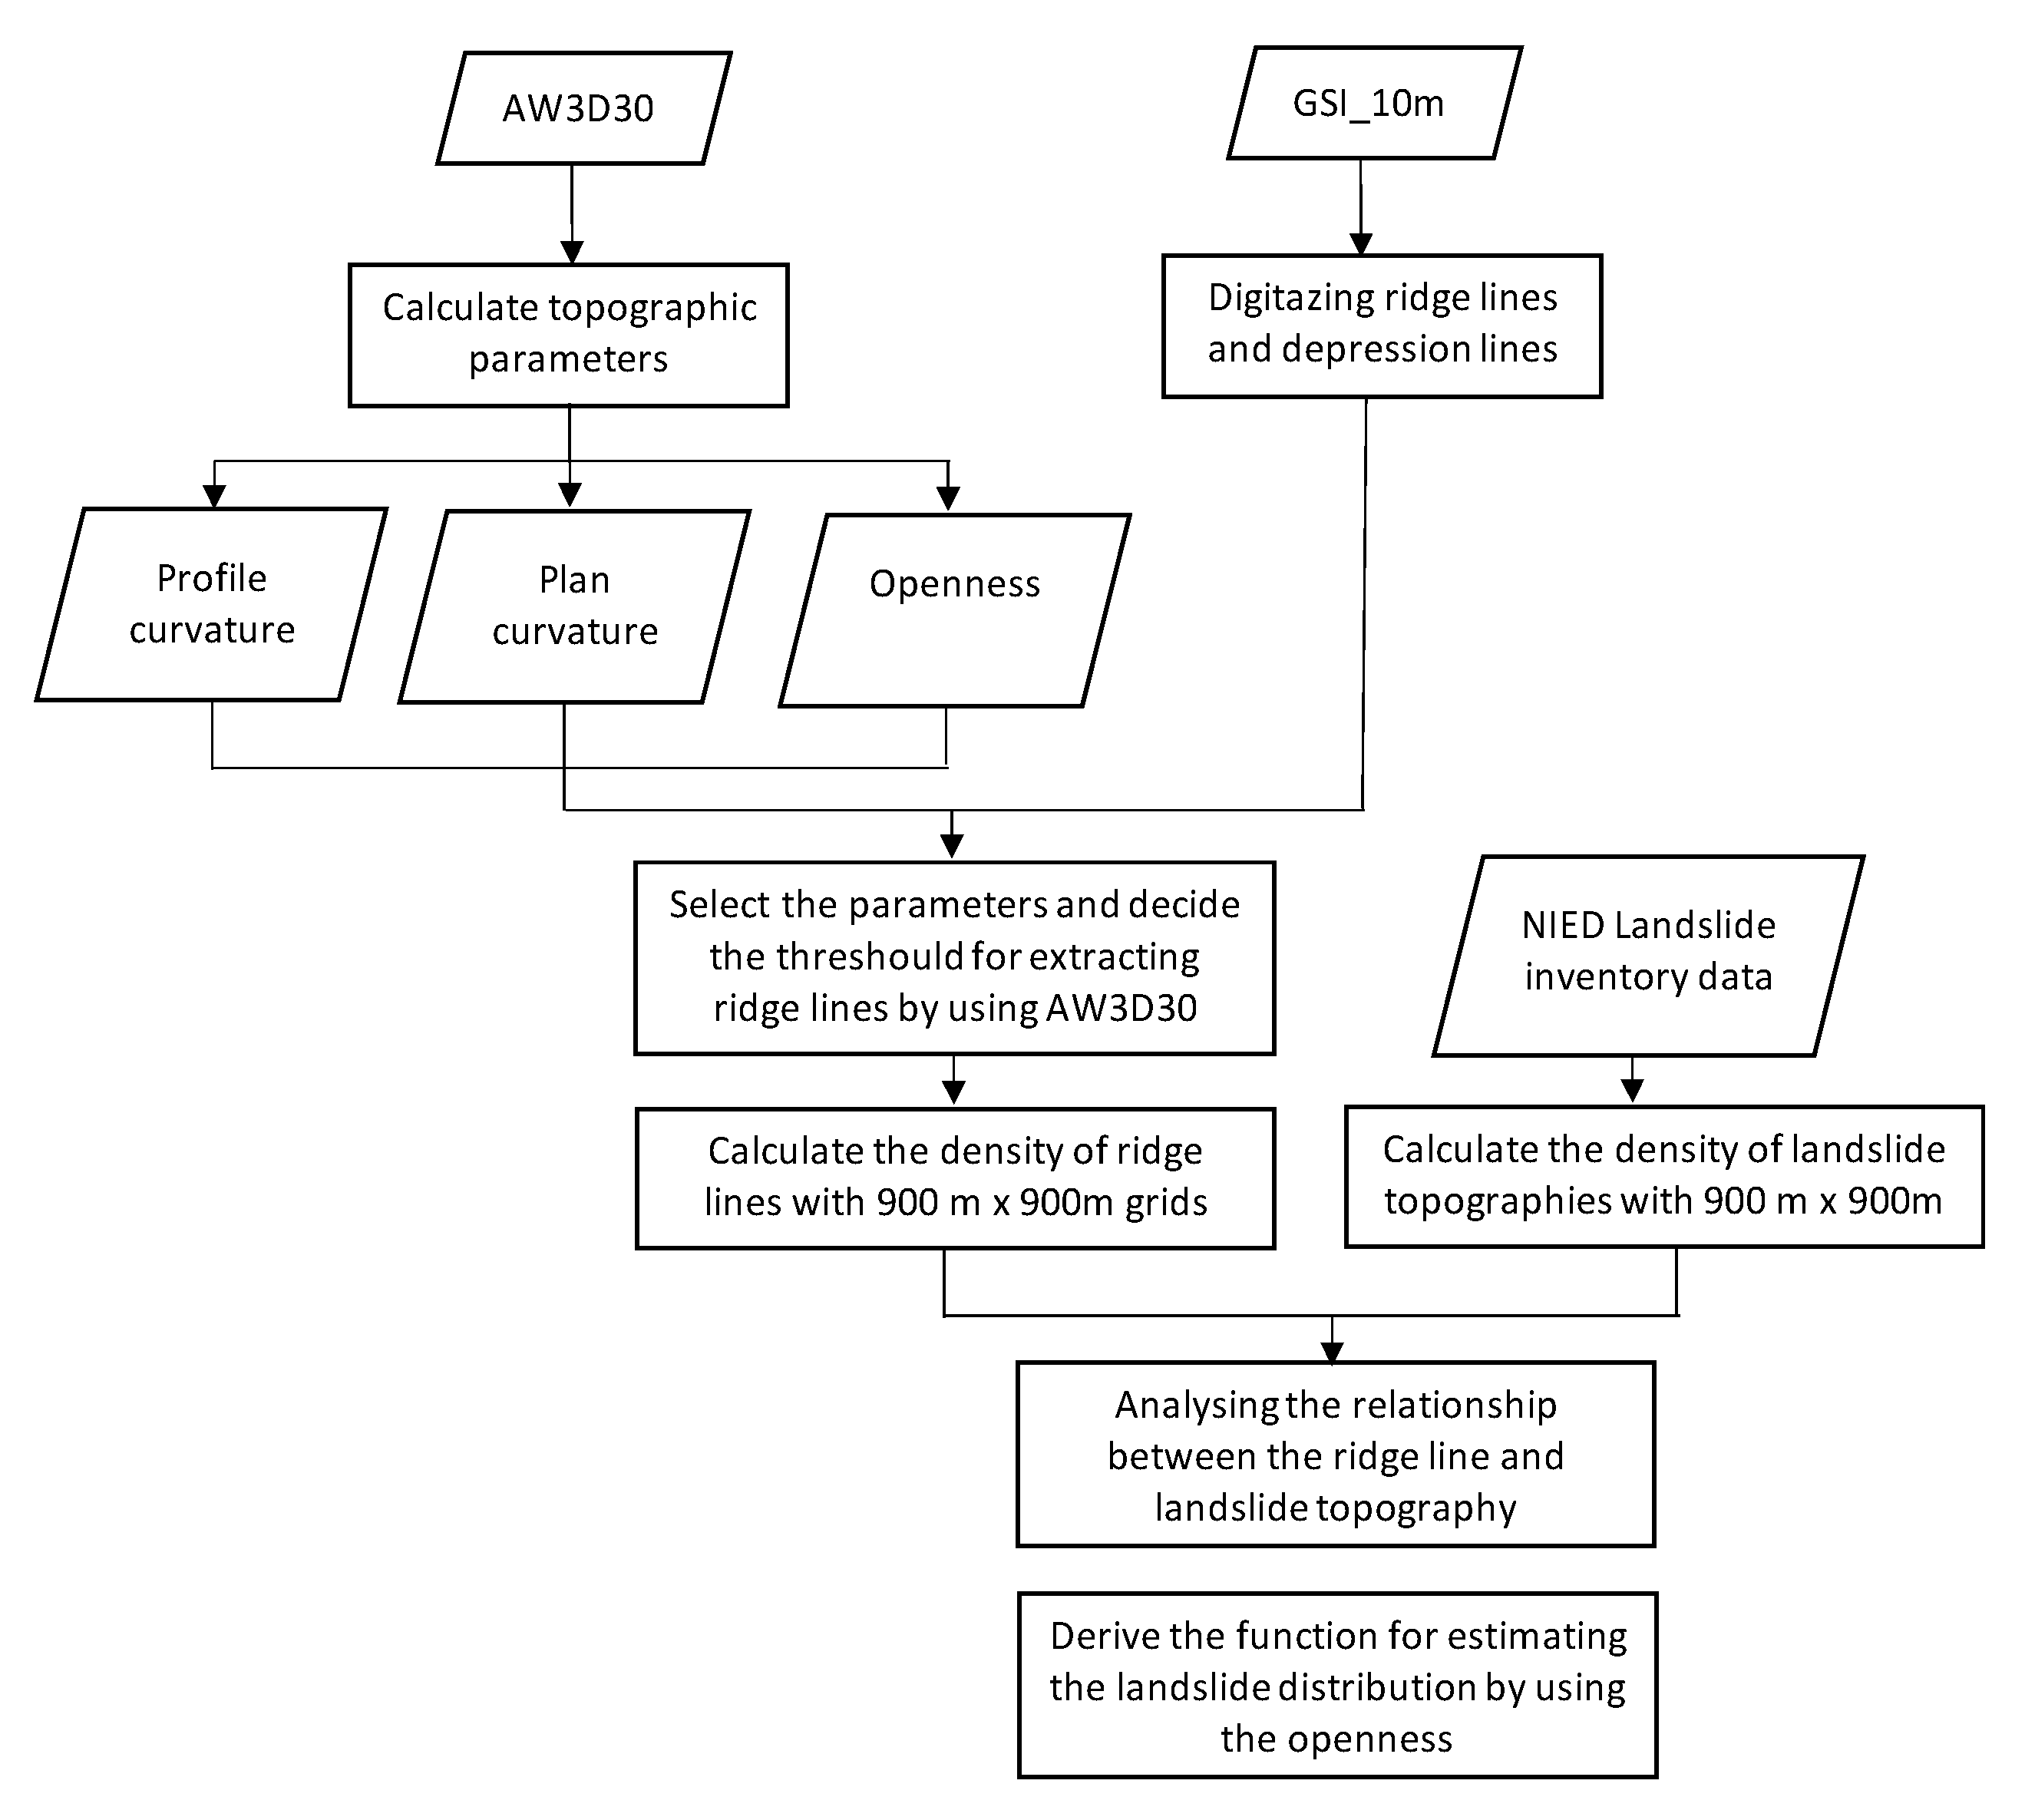
Figure 3.
Locations of representative depressions and ridgelines digitized at sites (a) Site A, (b) Site B, and (c) Site C.
Figure 3.
Locations of representative depressions and ridgelines digitized at sites (a) Site A, (b) Site B, and (c) Site C.
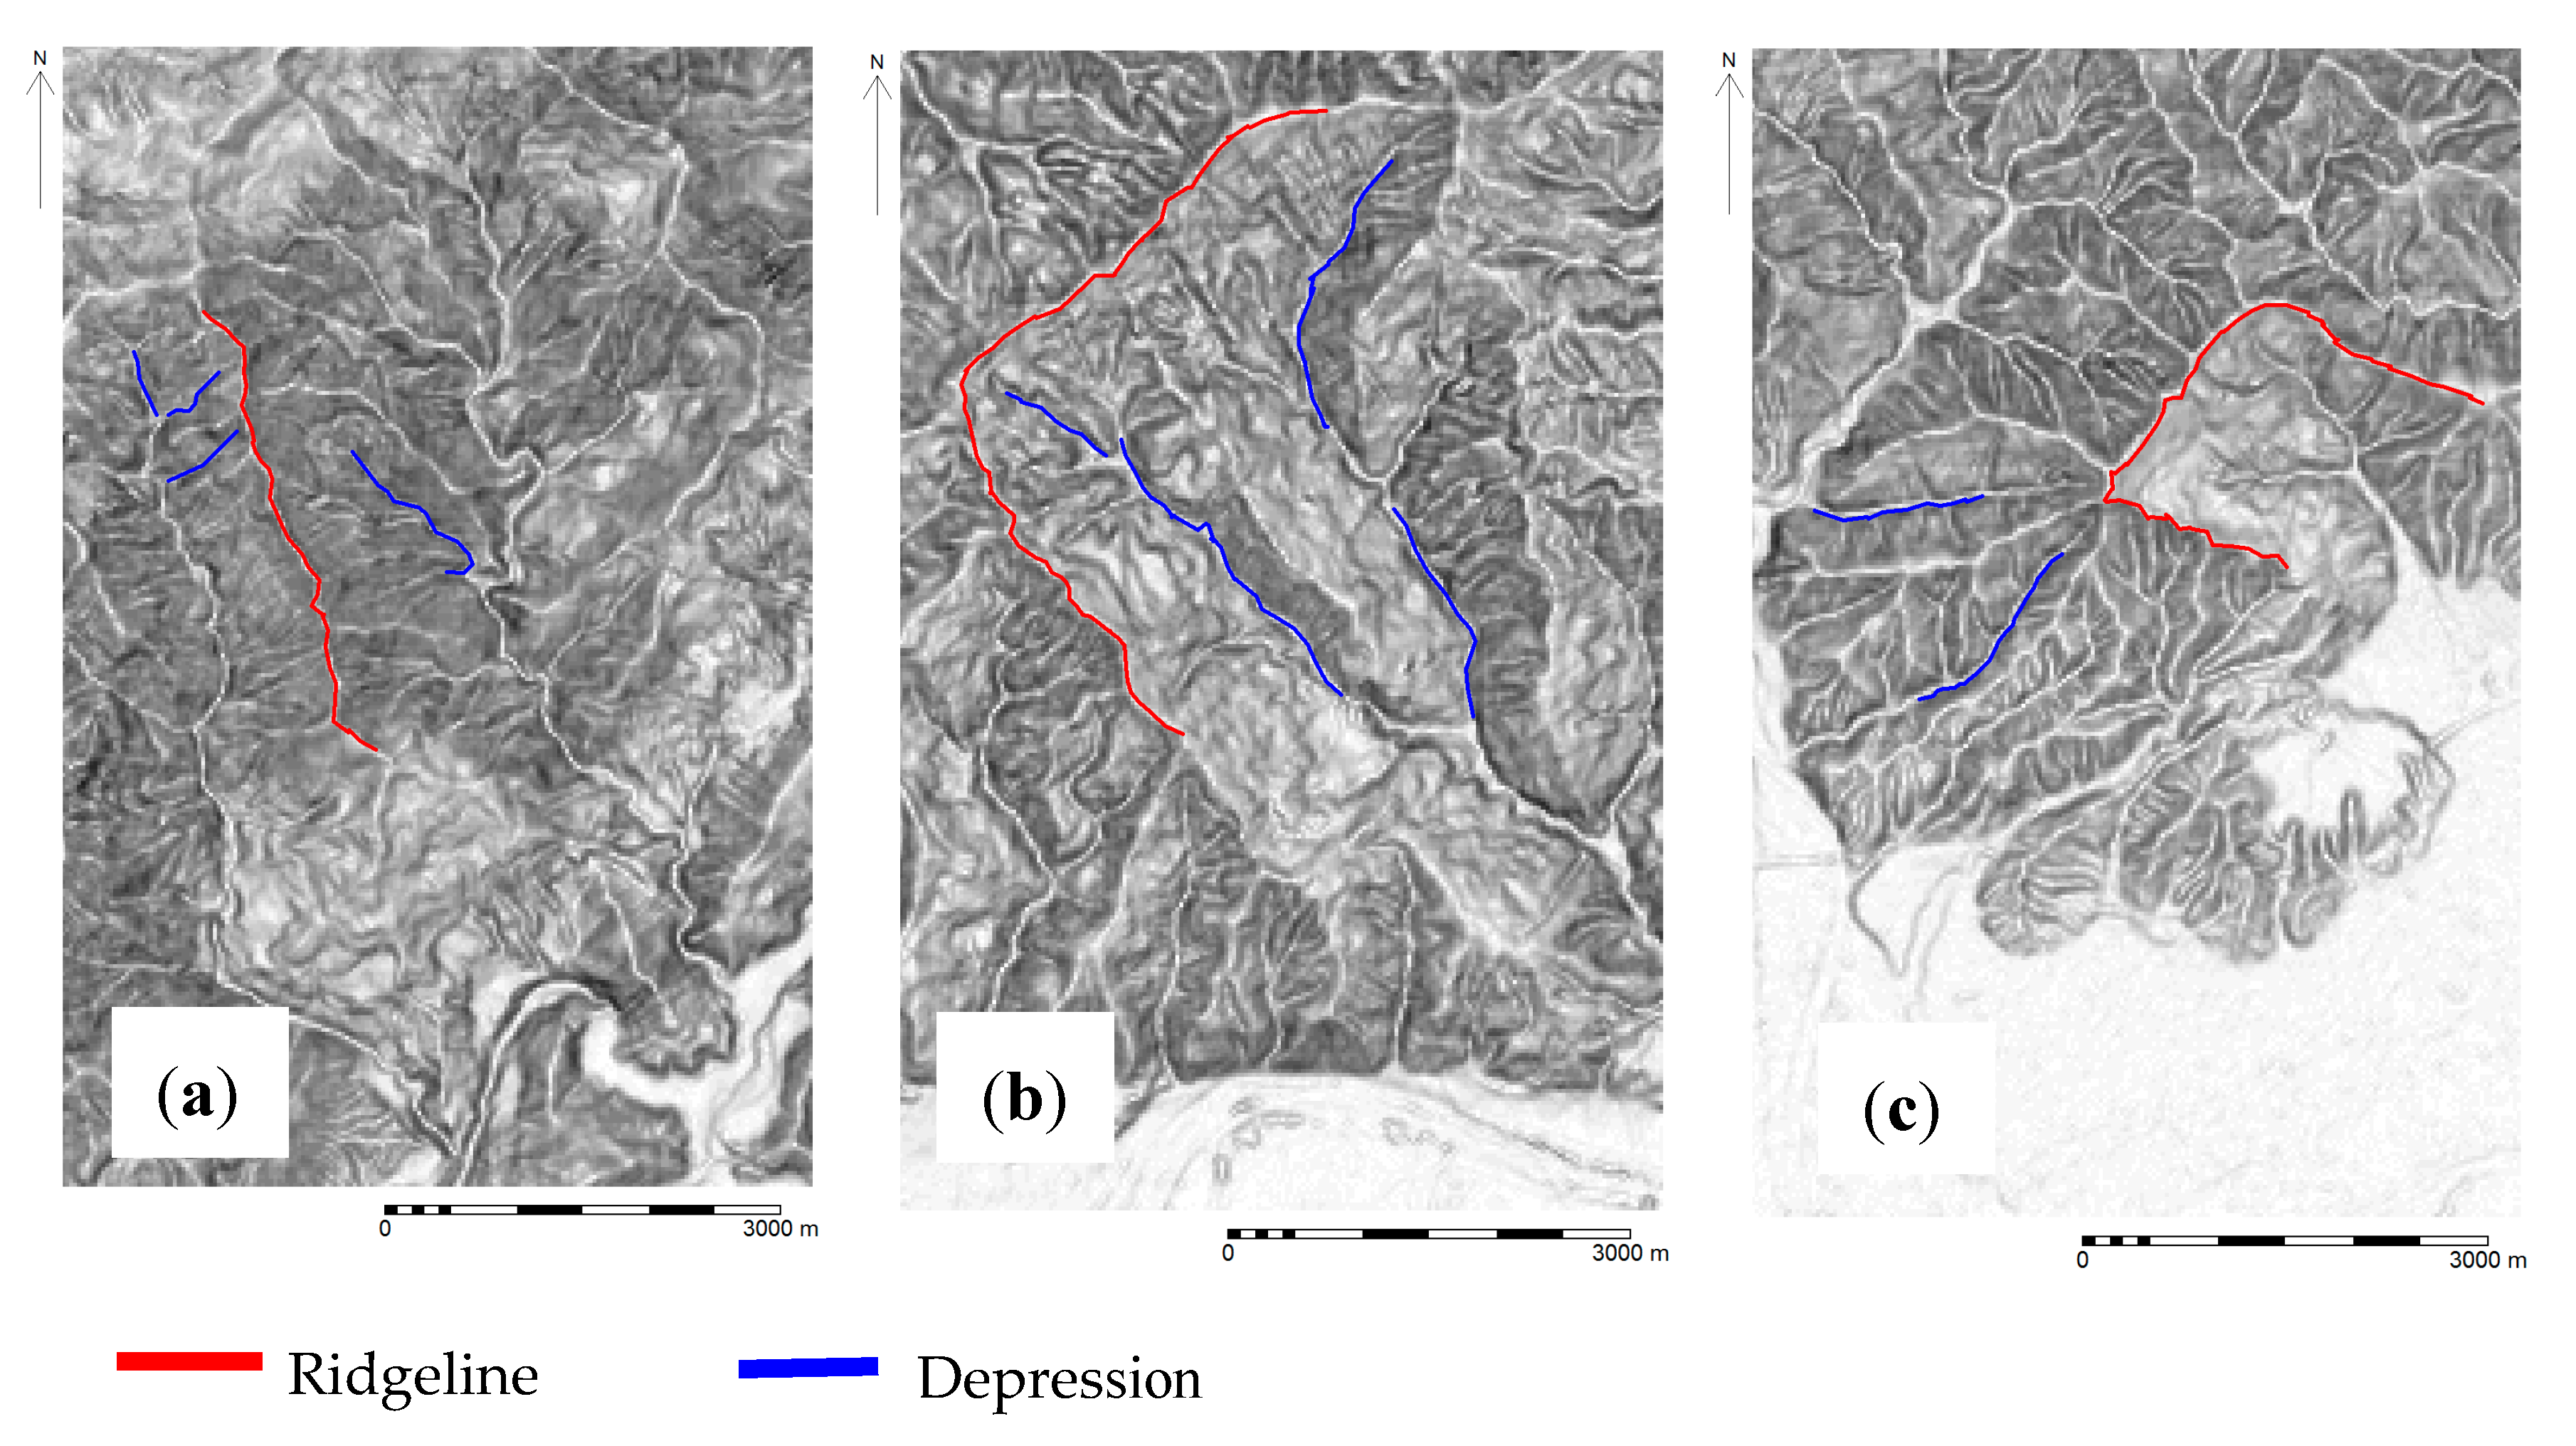
Figure 4.
Histograms of topographic parameters openness (top), plan curvature (middle), and profile curvature (bottom) at (a) Site A, (b) Site B (b), and (c) Site C.
Figure 4.
Histograms of topographic parameters openness (top), plan curvature (middle), and profile curvature (bottom) at (a) Site A, (b) Site B (b), and (c) Site C.
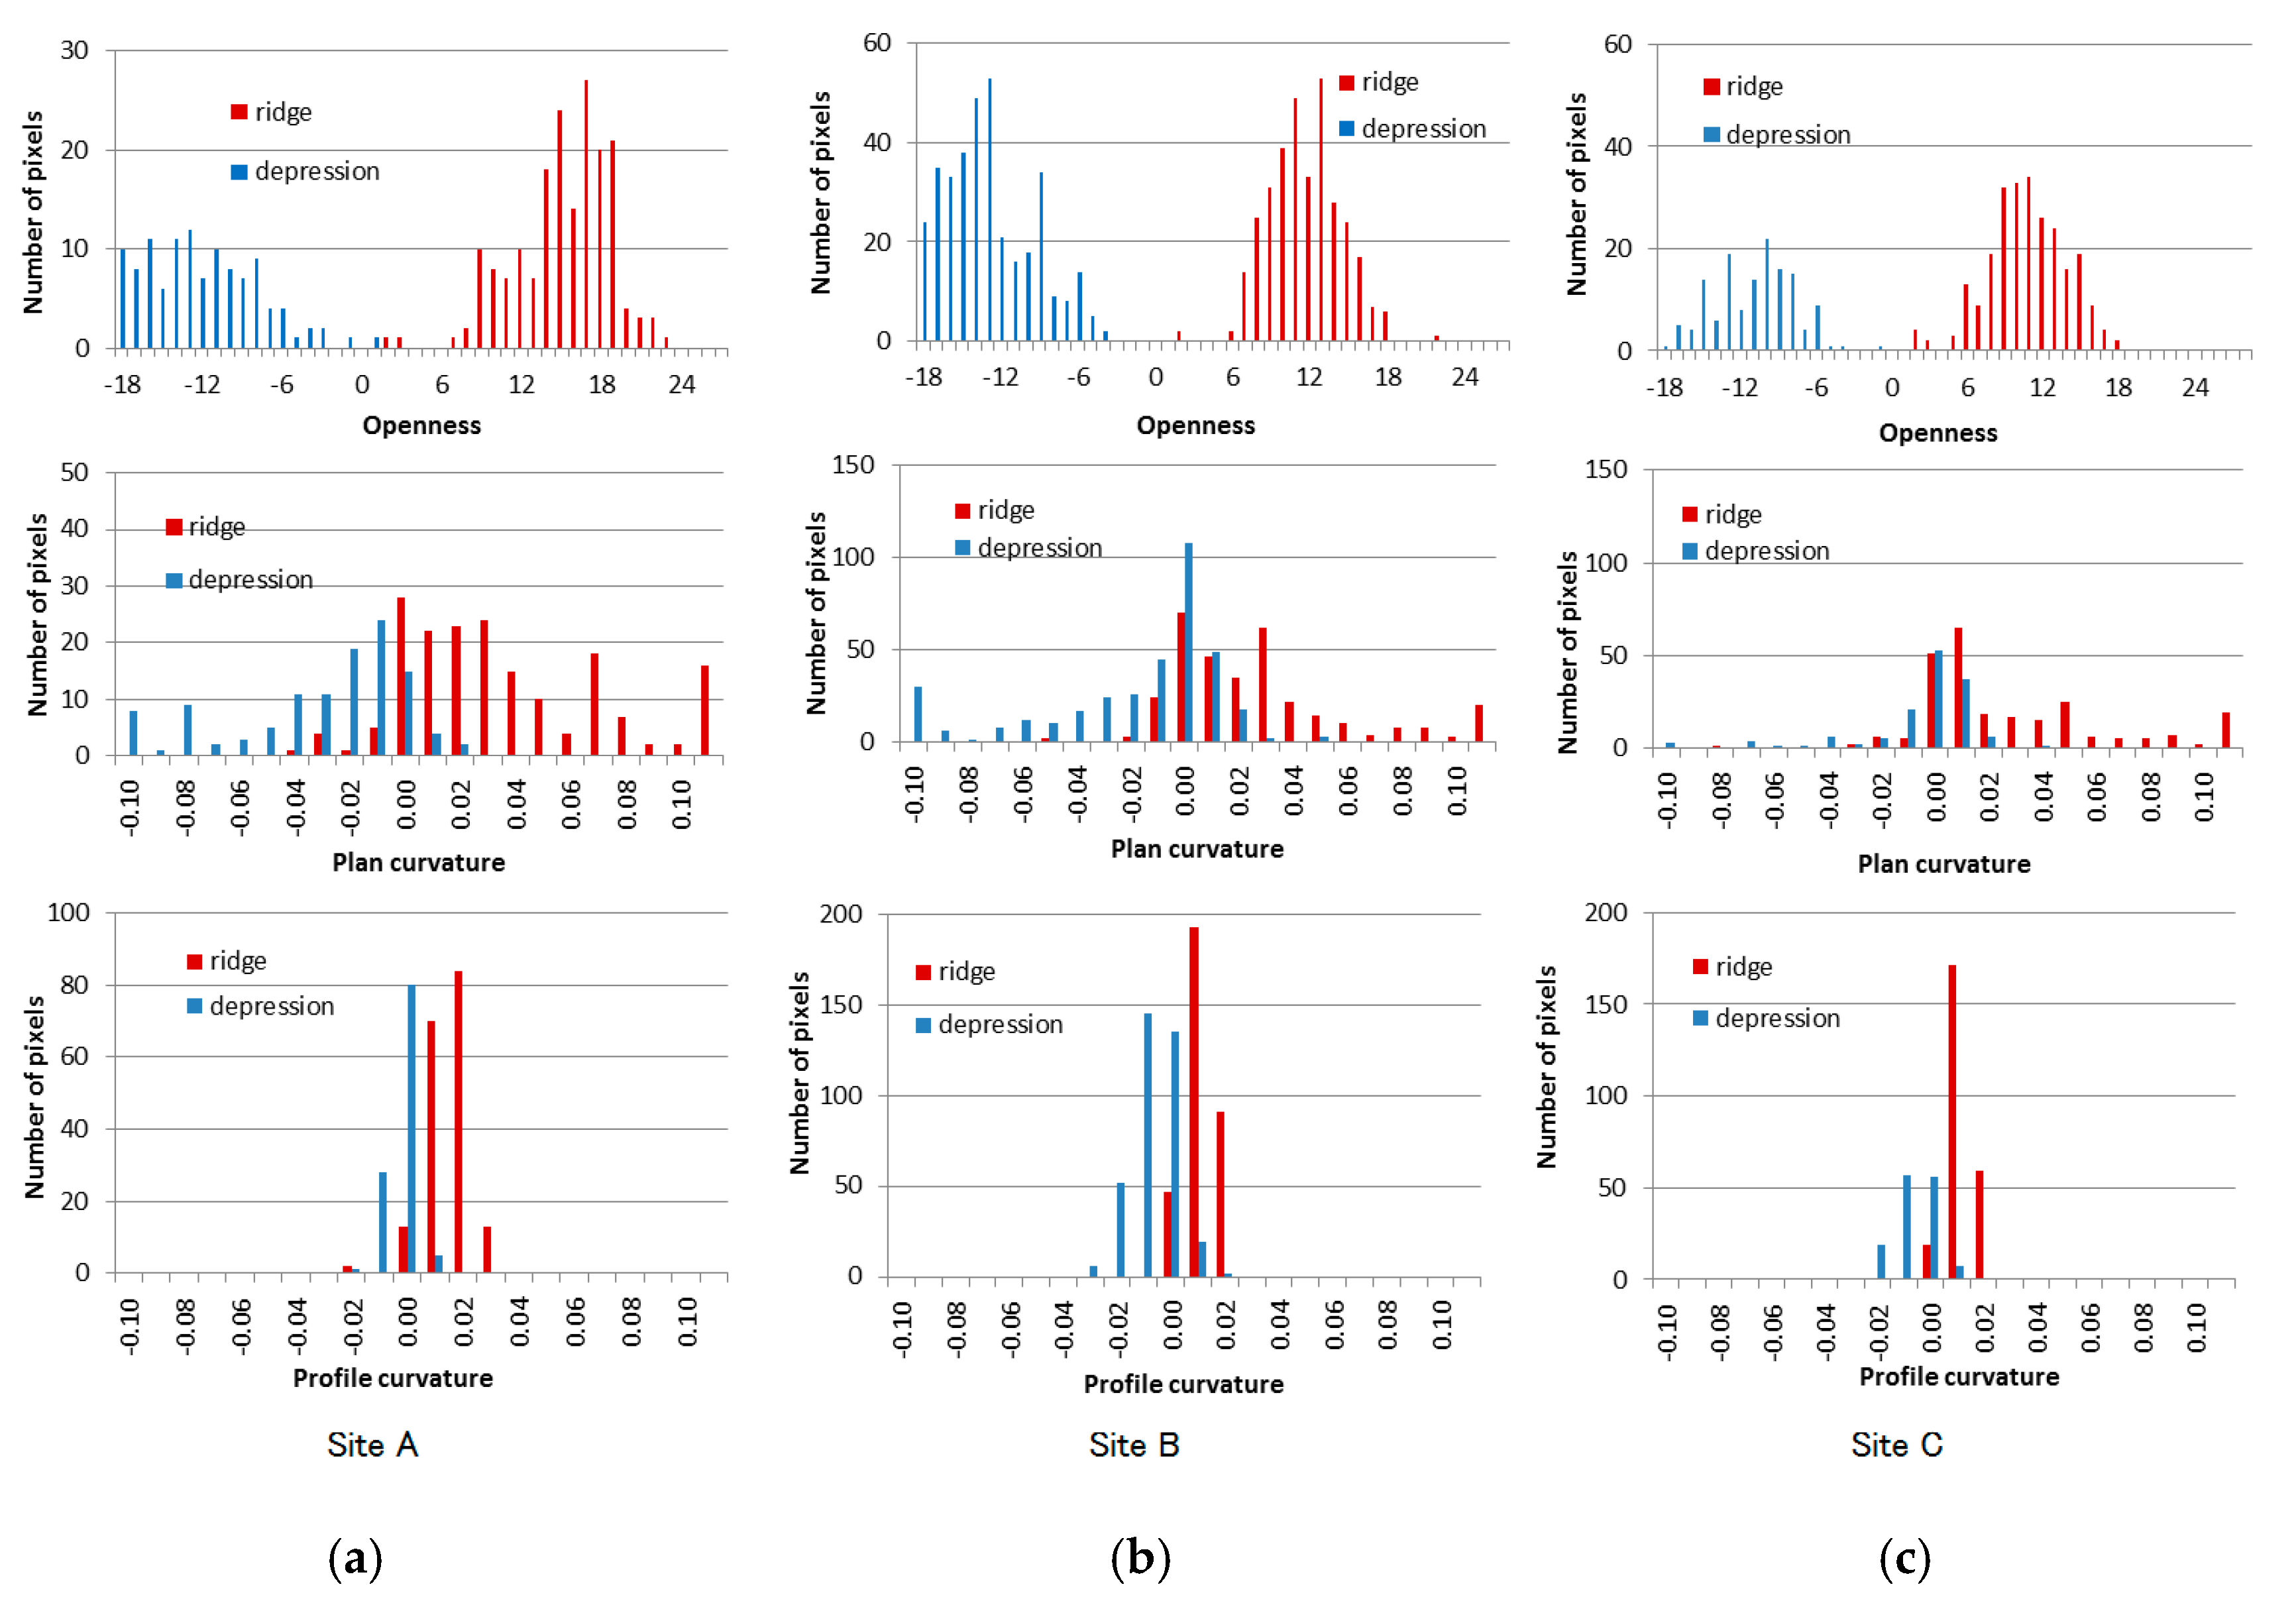
Figure 5.
Extracted ridgelines with openness values (left) and the topographic data (right) with landslide inventory (brown lines) in (a) Site 1, (b) Site 2, (c) Site 3, (d) Site 4, (e) Site 5. Black lines show the 900 m × 900 m grids. Each grid is identified by column ID and line ID.
Figure 5.
Extracted ridgelines with openness values (left) and the topographic data (right) with landslide inventory (brown lines) in (a) Site 1, (b) Site 2, (c) Site 3, (d) Site 4, (e) Site 5. Black lines show the 900 m × 900 m grids. Each grid is identified by column ID and line ID.
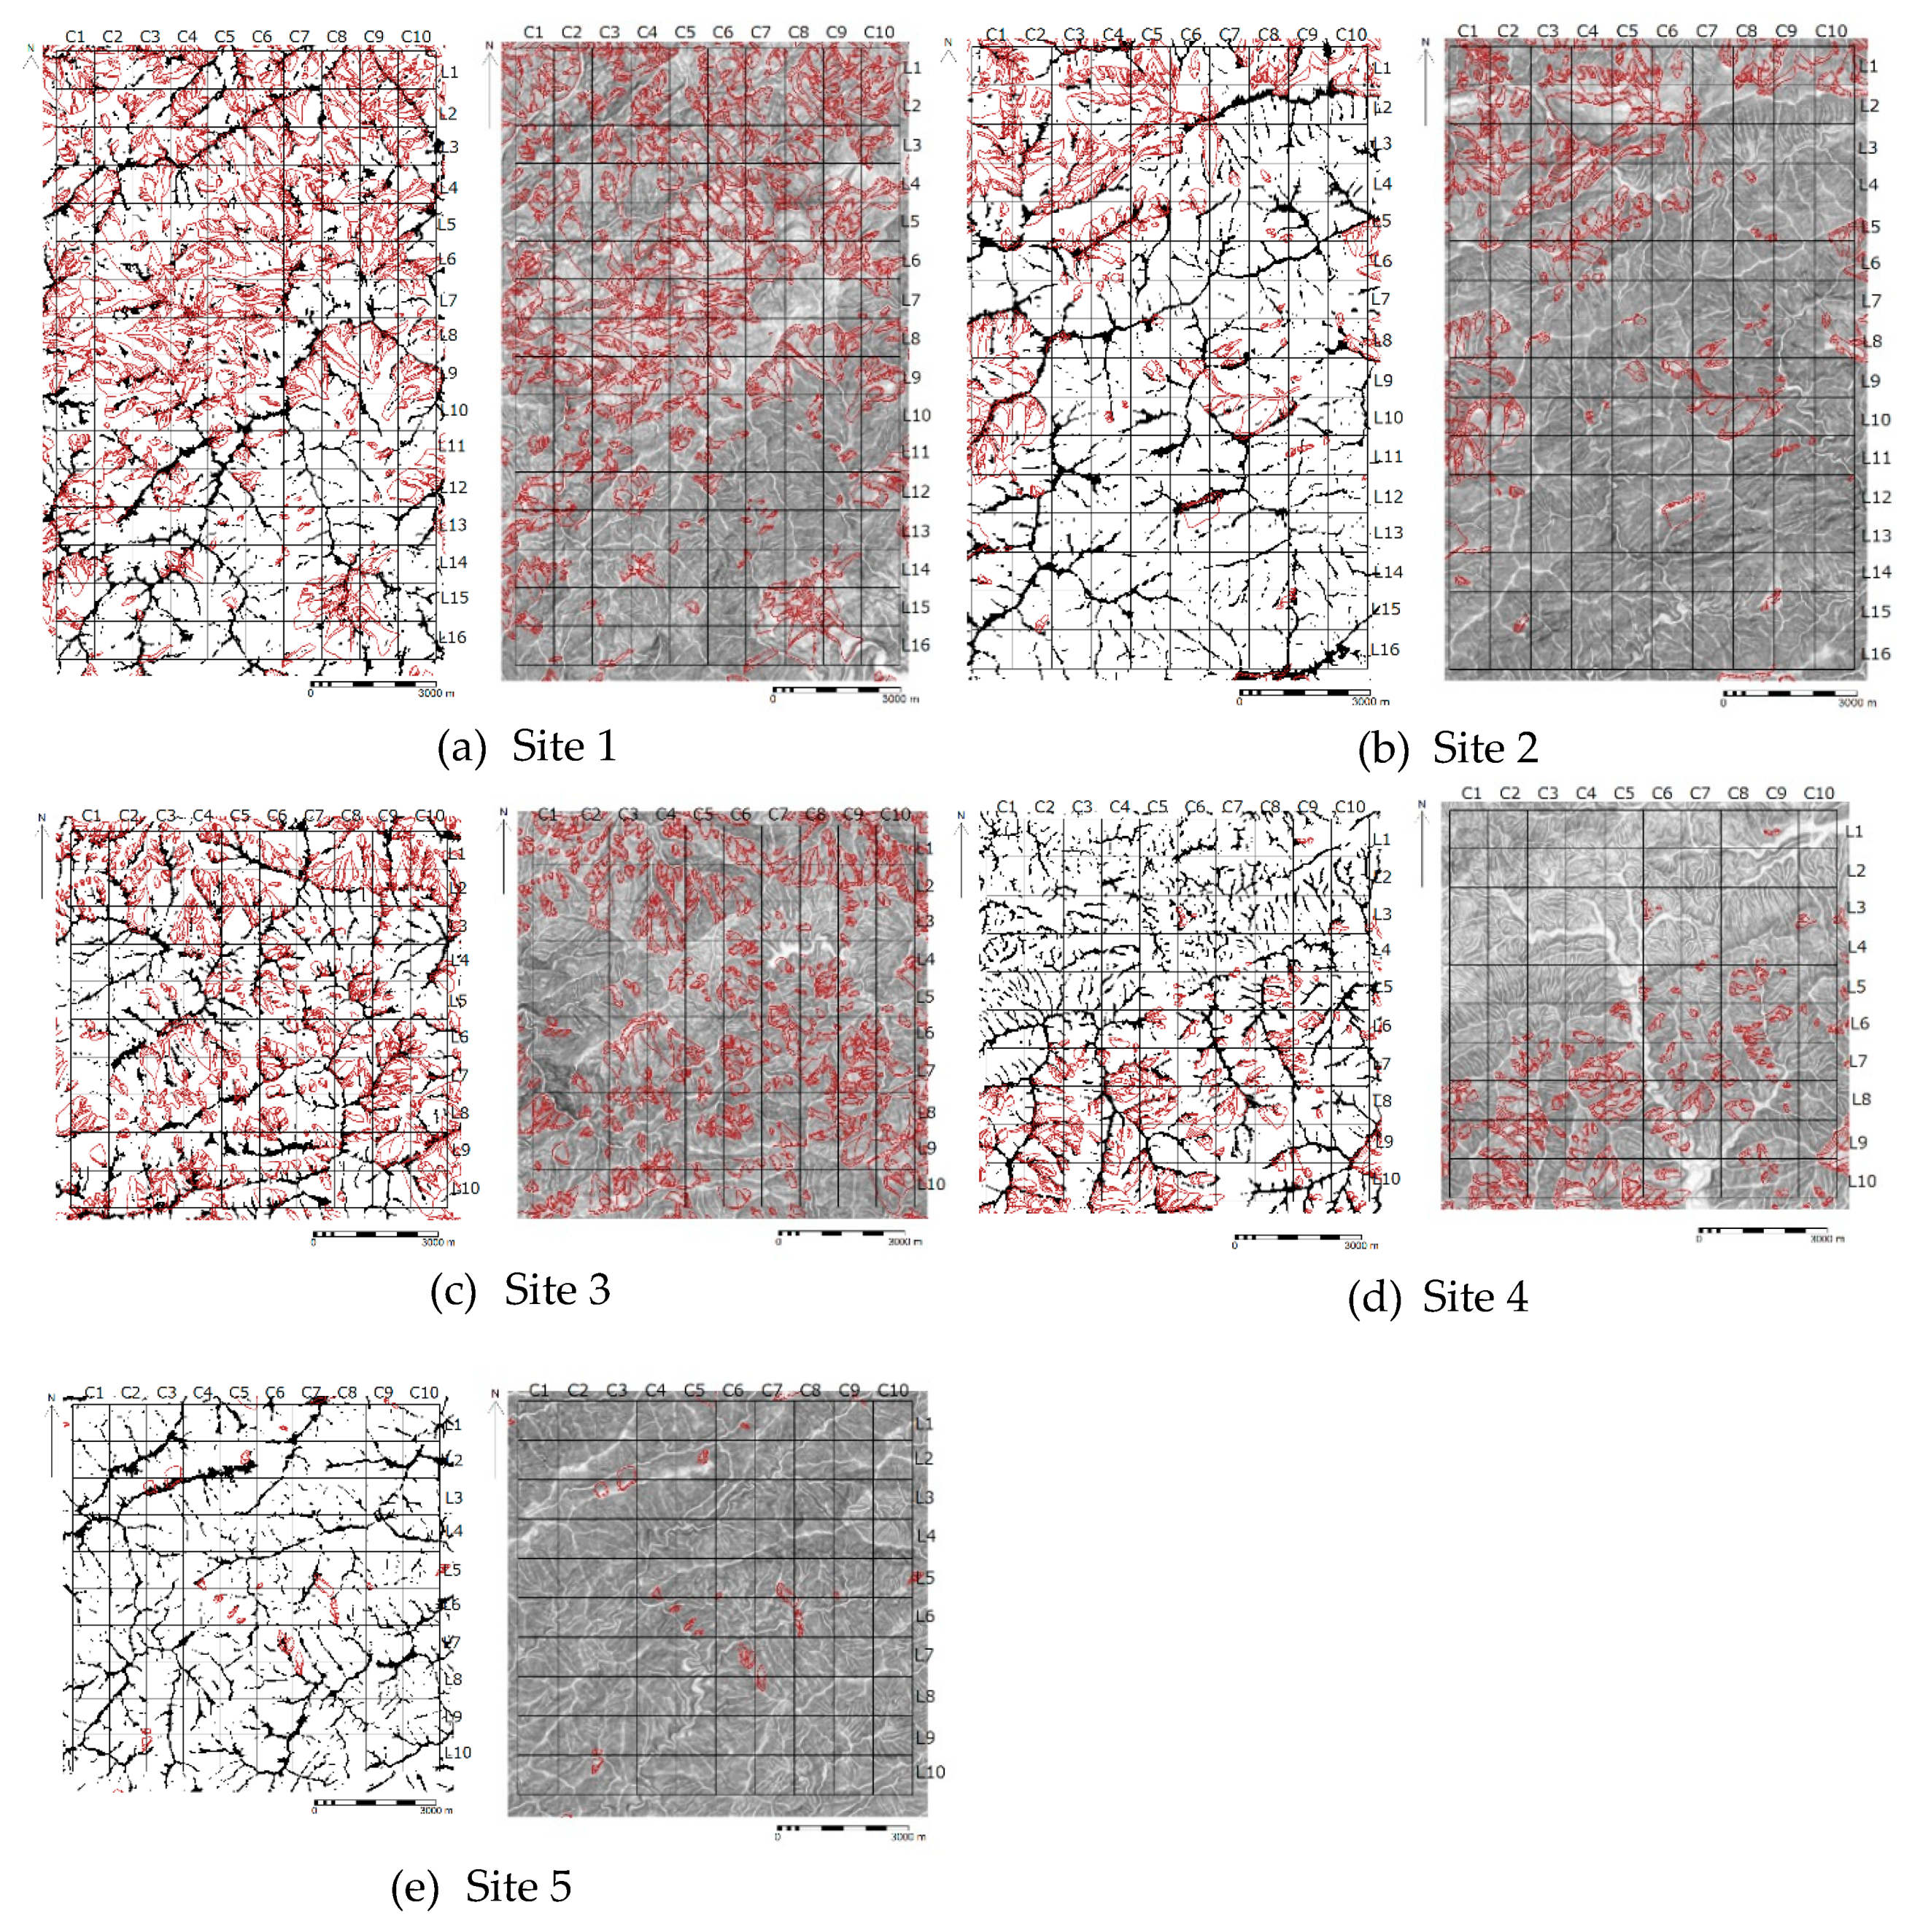
Figure 6.
Relationship between the area of landslides and the number of ridge pixels in each 900 m × 900 m grid at Sites 1–5 with upper bound equation derived from data of Site 1.
Figure 6.
Relationship between the area of landslides and the number of ridge pixels in each 900 m × 900 m grid at Sites 1–5 with upper bound equation derived from data of Site 1.

Table 1.
The distribution of openness at ridgelines in Site A, Site B, and Site C.
| Site A | Site B | Site C | Average | |
|---|---|---|---|---|
| Average (ave) | 14.7 | 11.2 | 10.4 | - |
| Standard deviation (σ) | 3.6 | 2.8 | 3.1 | - |
| Ave-σ | 11.1 | 8.5 | 7.3 | 9.0 |
| Ave-2σ | 7.5 | 5.7 | 4.2 | 5.8 |
Table 2.
The average and standard deviation of landslide area with the grids in each site.
| Site 1 | Site 2 | Site 3 | Site 4 | Site 5 | |
|---|---|---|---|---|---|
| Average (m2) | 209,965 | 81,739 | 52,421 | 162,660 | 5811 |
| Standard deviation (m2) | 176,874 | 132,260 | 77,824 | 131,828 | 16,406 |
| The number of grids | 160 | 160 | 100 | 100 | 100 |
© 2020 by the authors. Licensee MDPI, Basel, Switzerland. This article is an open access article distributed under the terms and conditions of the Creative Commons Attribution (CC BY) license (http://creativecommons.org/licenses/by/4.0/).
Share and Cite
MDPI and ACS Style
Nonomura, A.; Hasegawa, S.; Kanbara, D.; Tadono, T.; Chiba, T. Topographic Analysis of Landslide Distribution Using AW3D30 Data. Geosciences 2020, 10, 115. https://doi.org/10.3390/geosciences10040115
AMA Style
Nonomura A, Hasegawa S, Kanbara D, Tadono T, Chiba T. Topographic Analysis of Landslide Distribution Using AW3D30 Data. Geosciences. 2020; 10(4):115. https://doi.org/10.3390/geosciences10040115
Chicago/Turabian StyleNonomura, Atsuko, Shuichi Hasegawa, Daisuke Kanbara, Takeo Tadono, and Tatsuro Chiba. 2020. "Topographic Analysis of Landslide Distribution Using AW3D30 Data" Geosciences 10, no. 4: 115. https://doi.org/10.3390/geosciences10040115
Note that from the first issue of 2016, this journal uses article numbers instead of page numbers. See further details here.