Dog Population & Dog Sheltering Trends in the United States of America

Simple Summary
Abstract
1. Introduction
Data Sourcing
- (a)
- individual shelters;
- (b)
- previous attempts to track national shelter trends;
- (c)
- state reports of shelter numbers; other attempts to track shelter trends;
- (d)
- from the commercial software vendor, PetHealth.
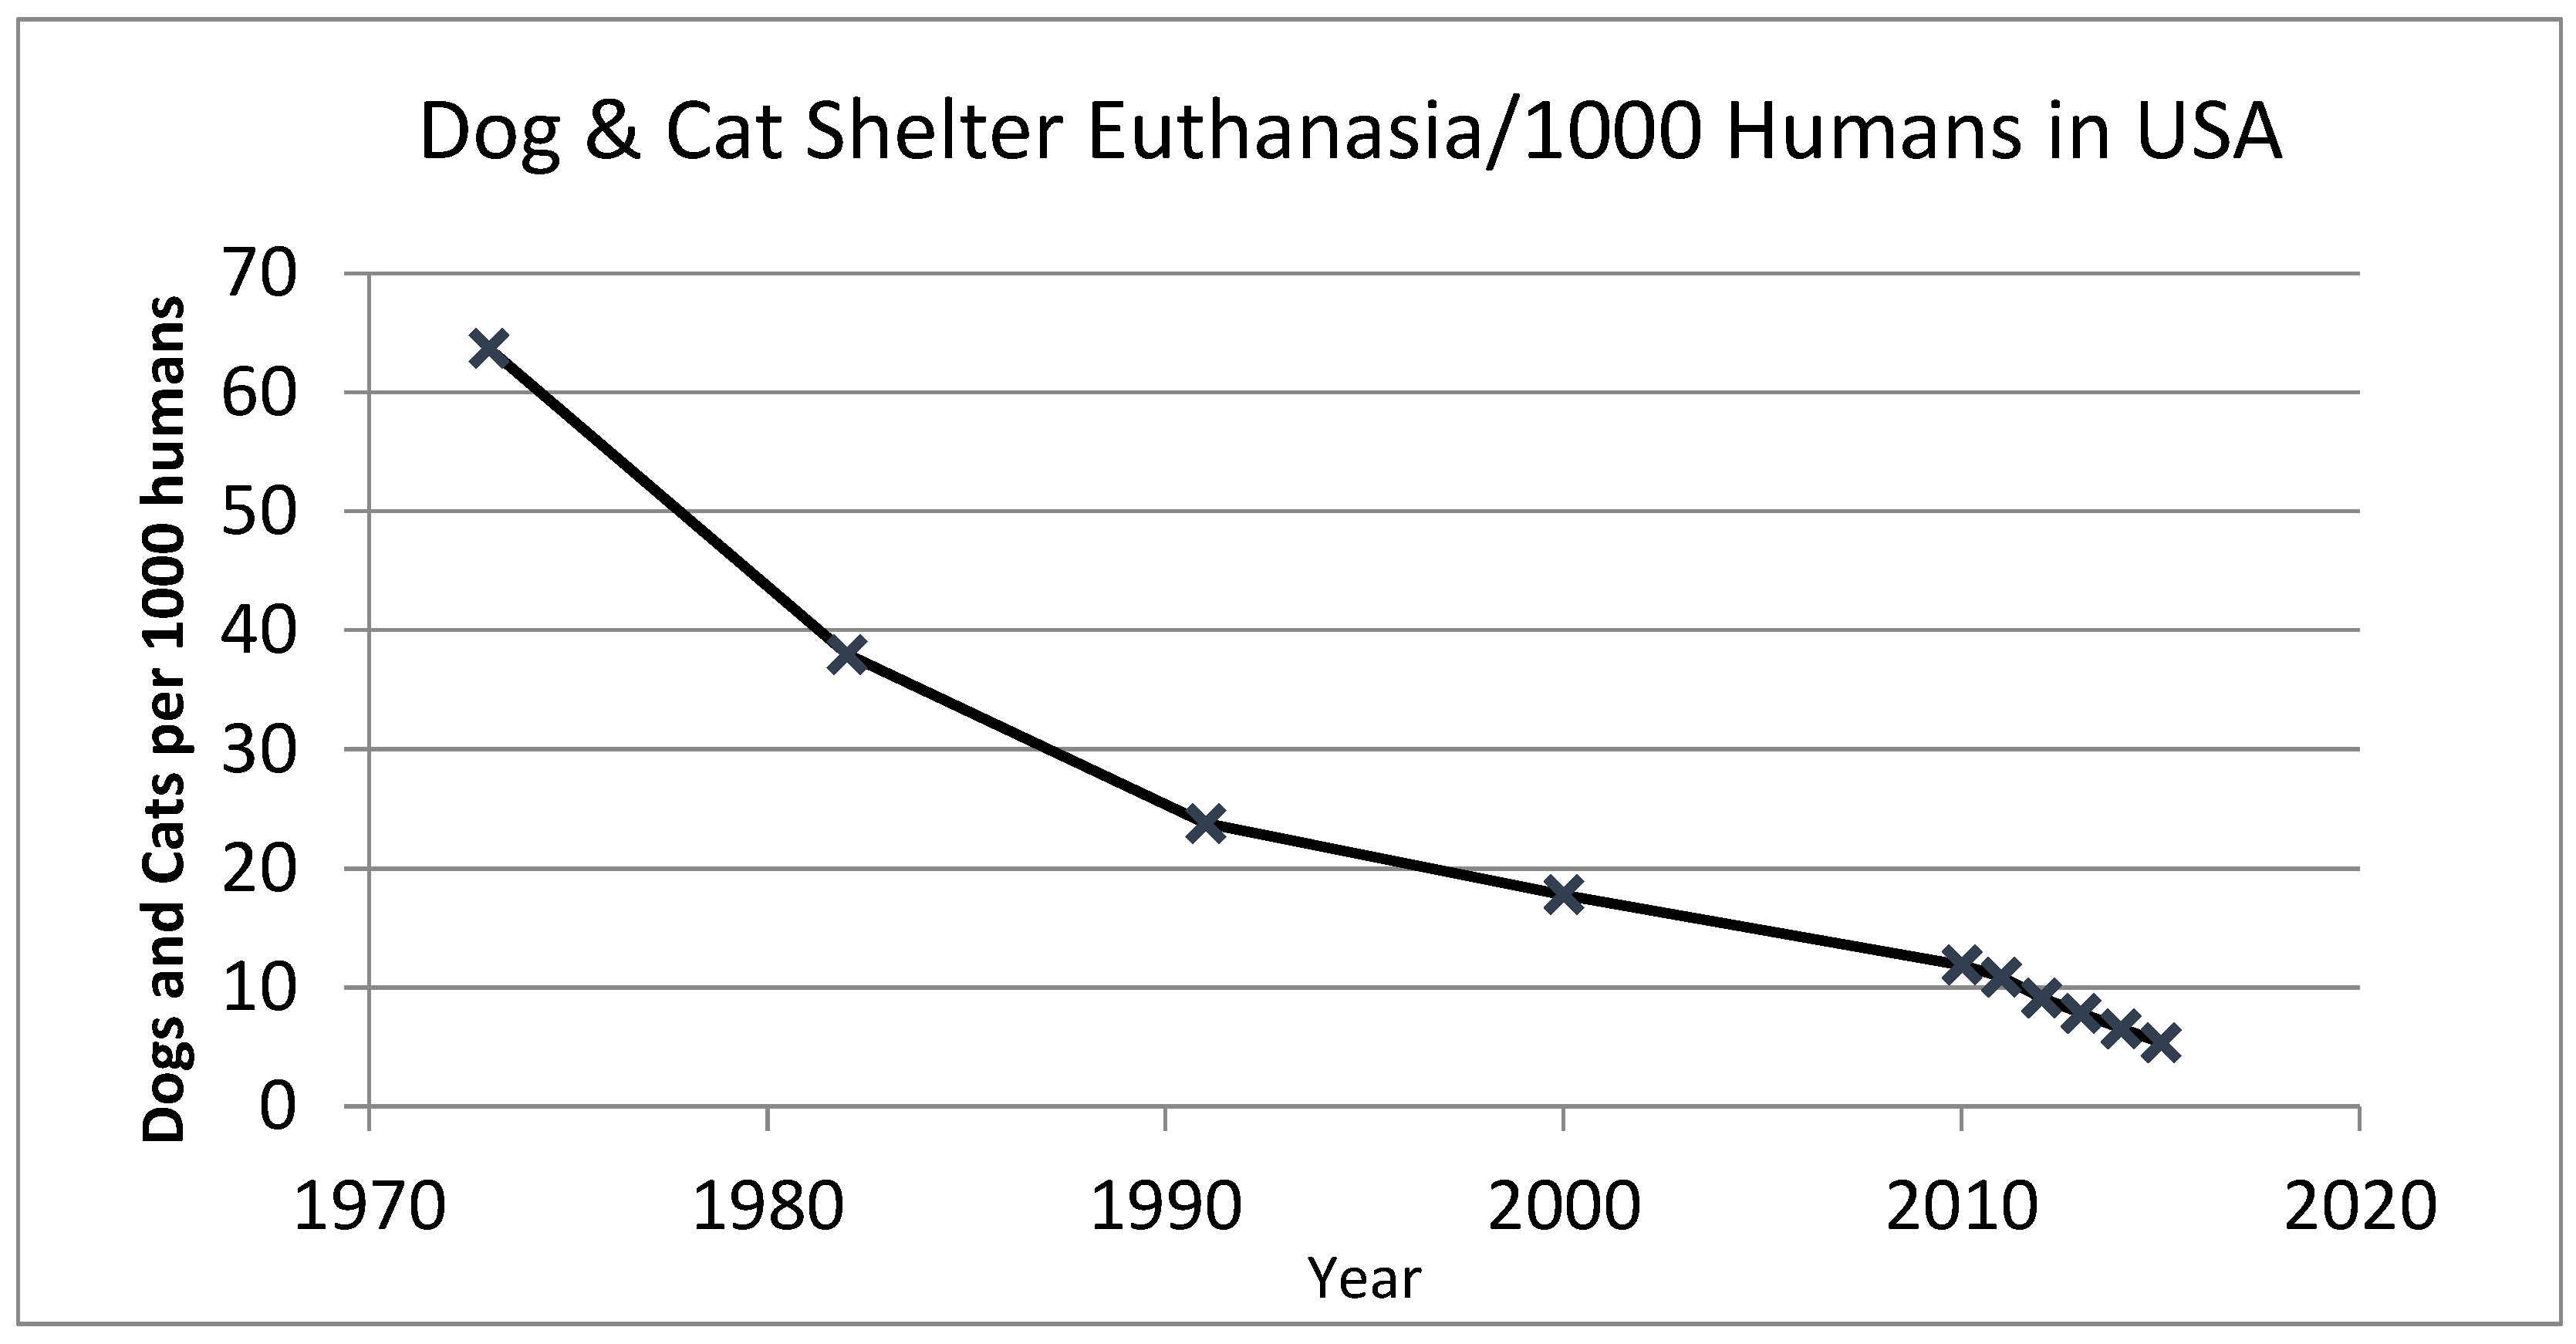
2. National Trends in Animal Shelter Demographics from 1970 to 2010
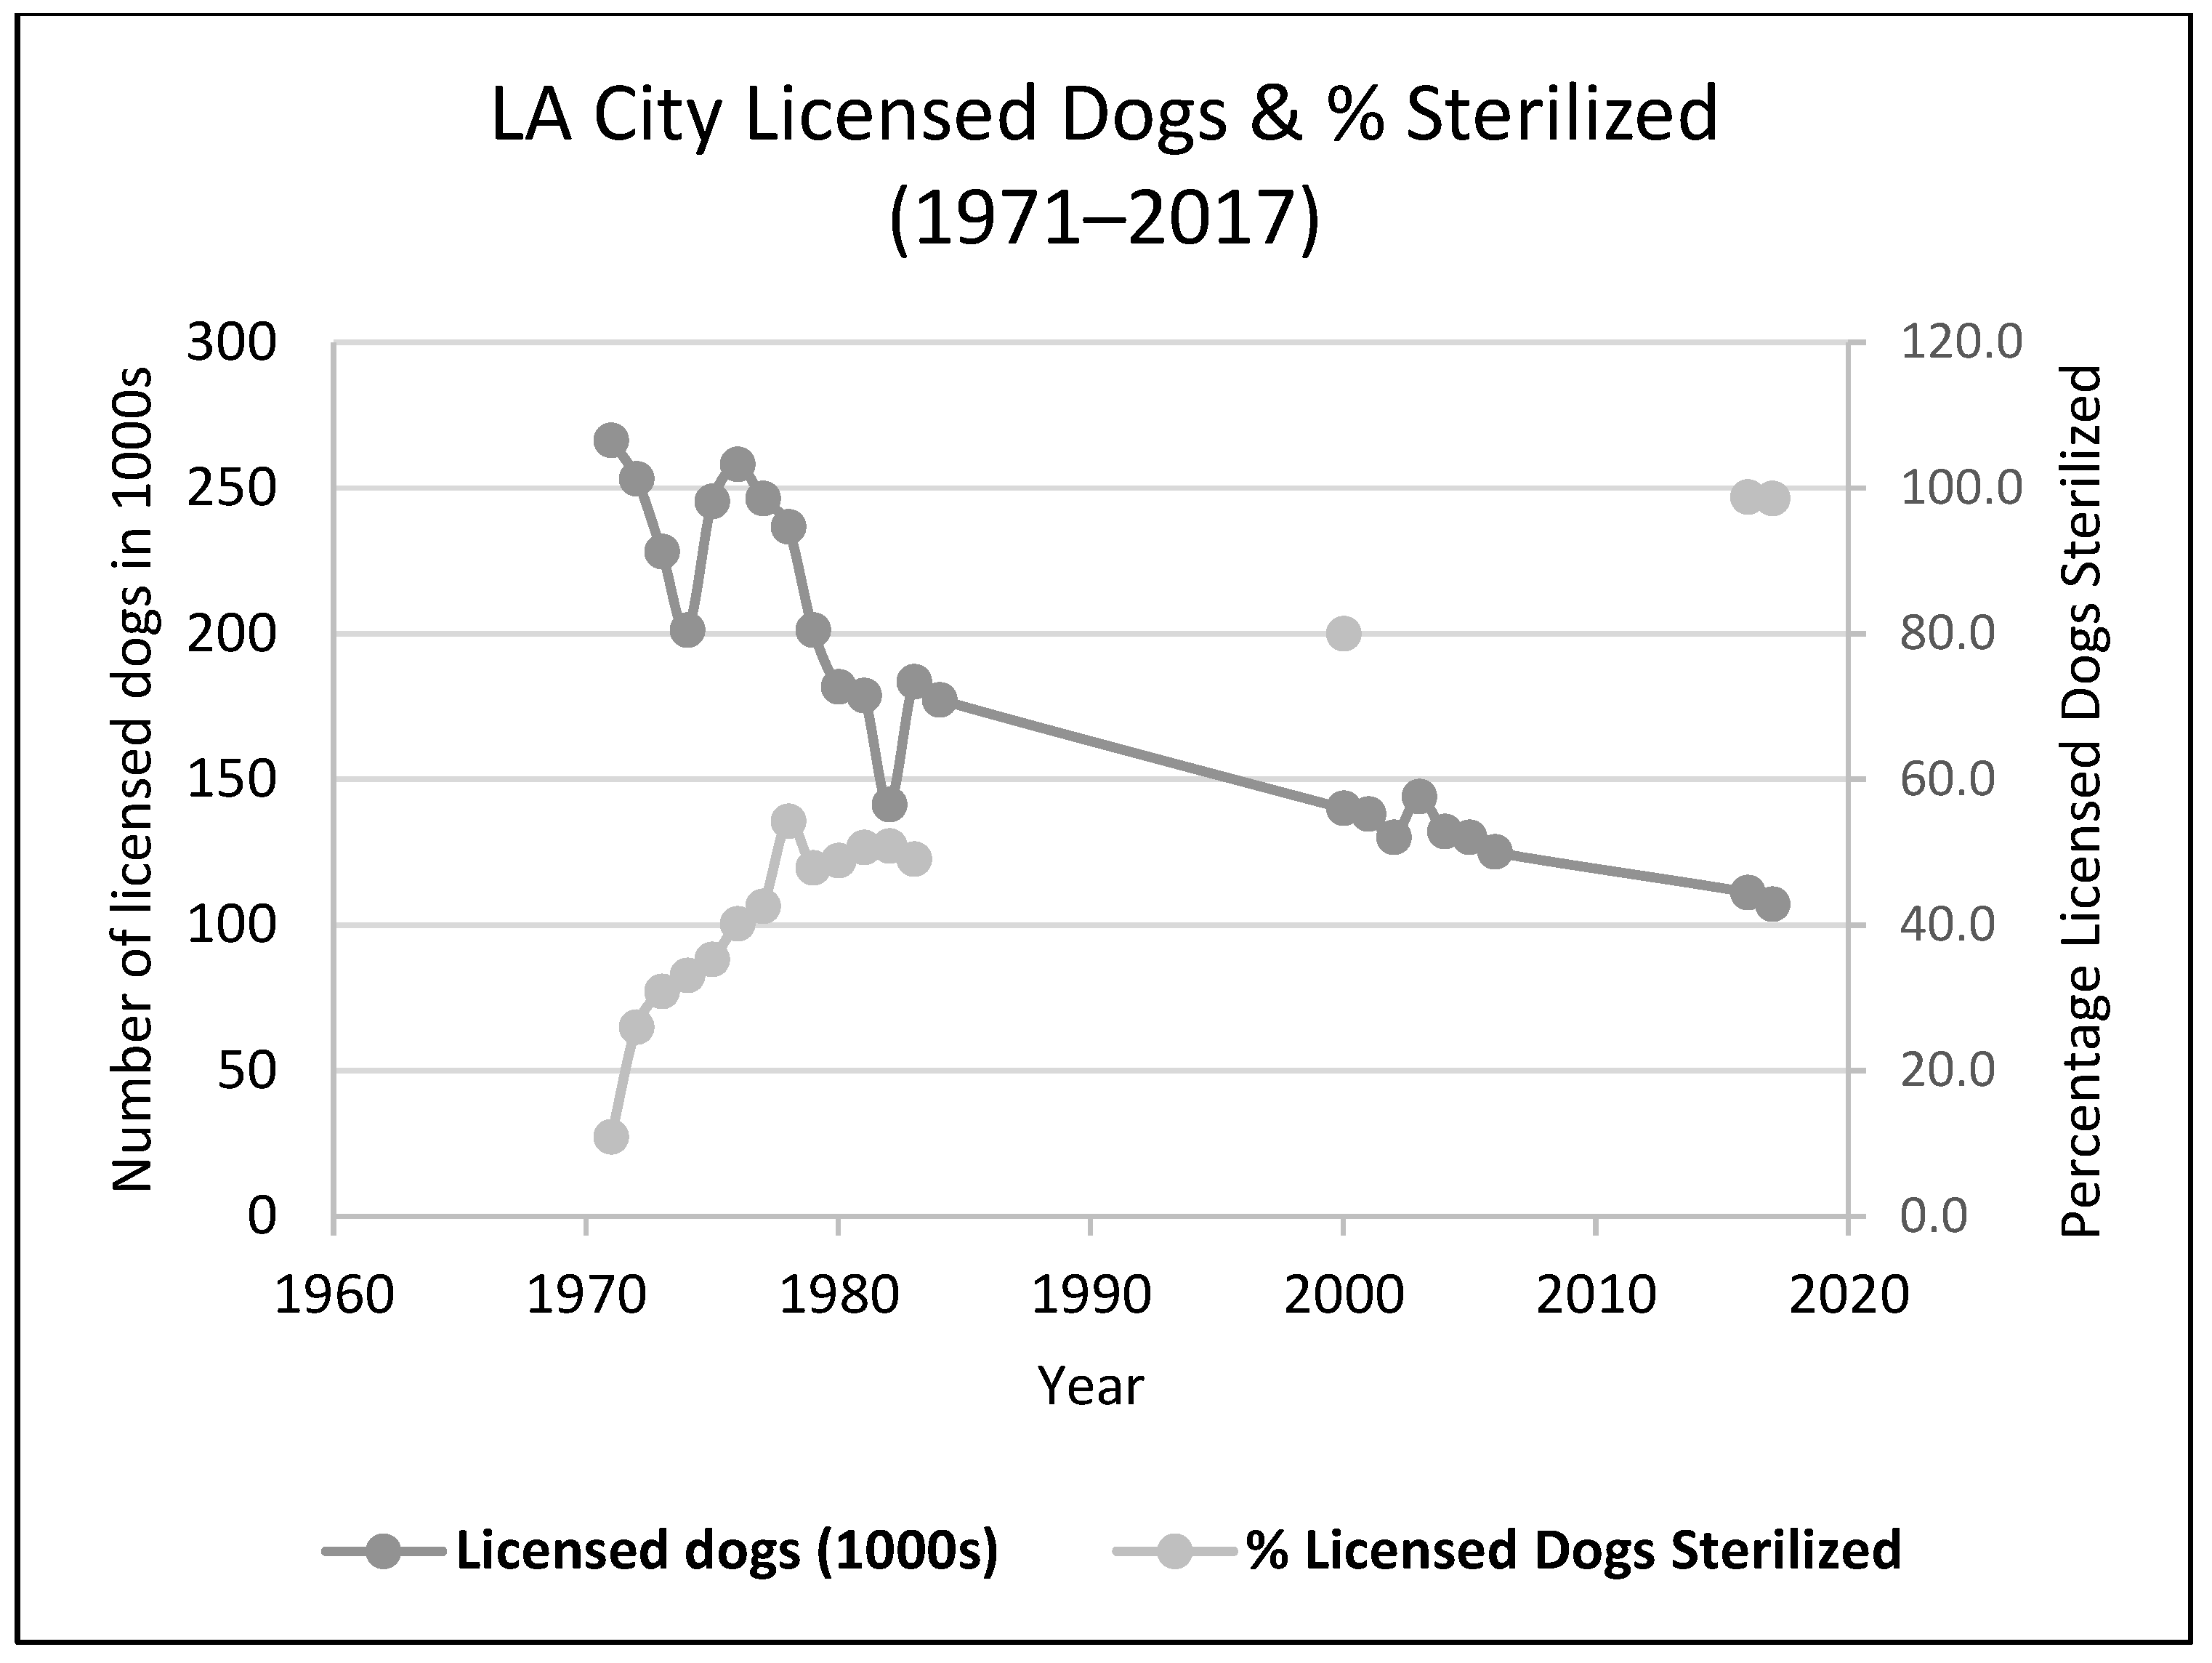
The Success of Sterilization and Differentiated Dog Licensing in the United States of America
3. Recent National Trends (Post 2010)
4. Regional and State Trends in Shelter Demographics
4.1. State Trends
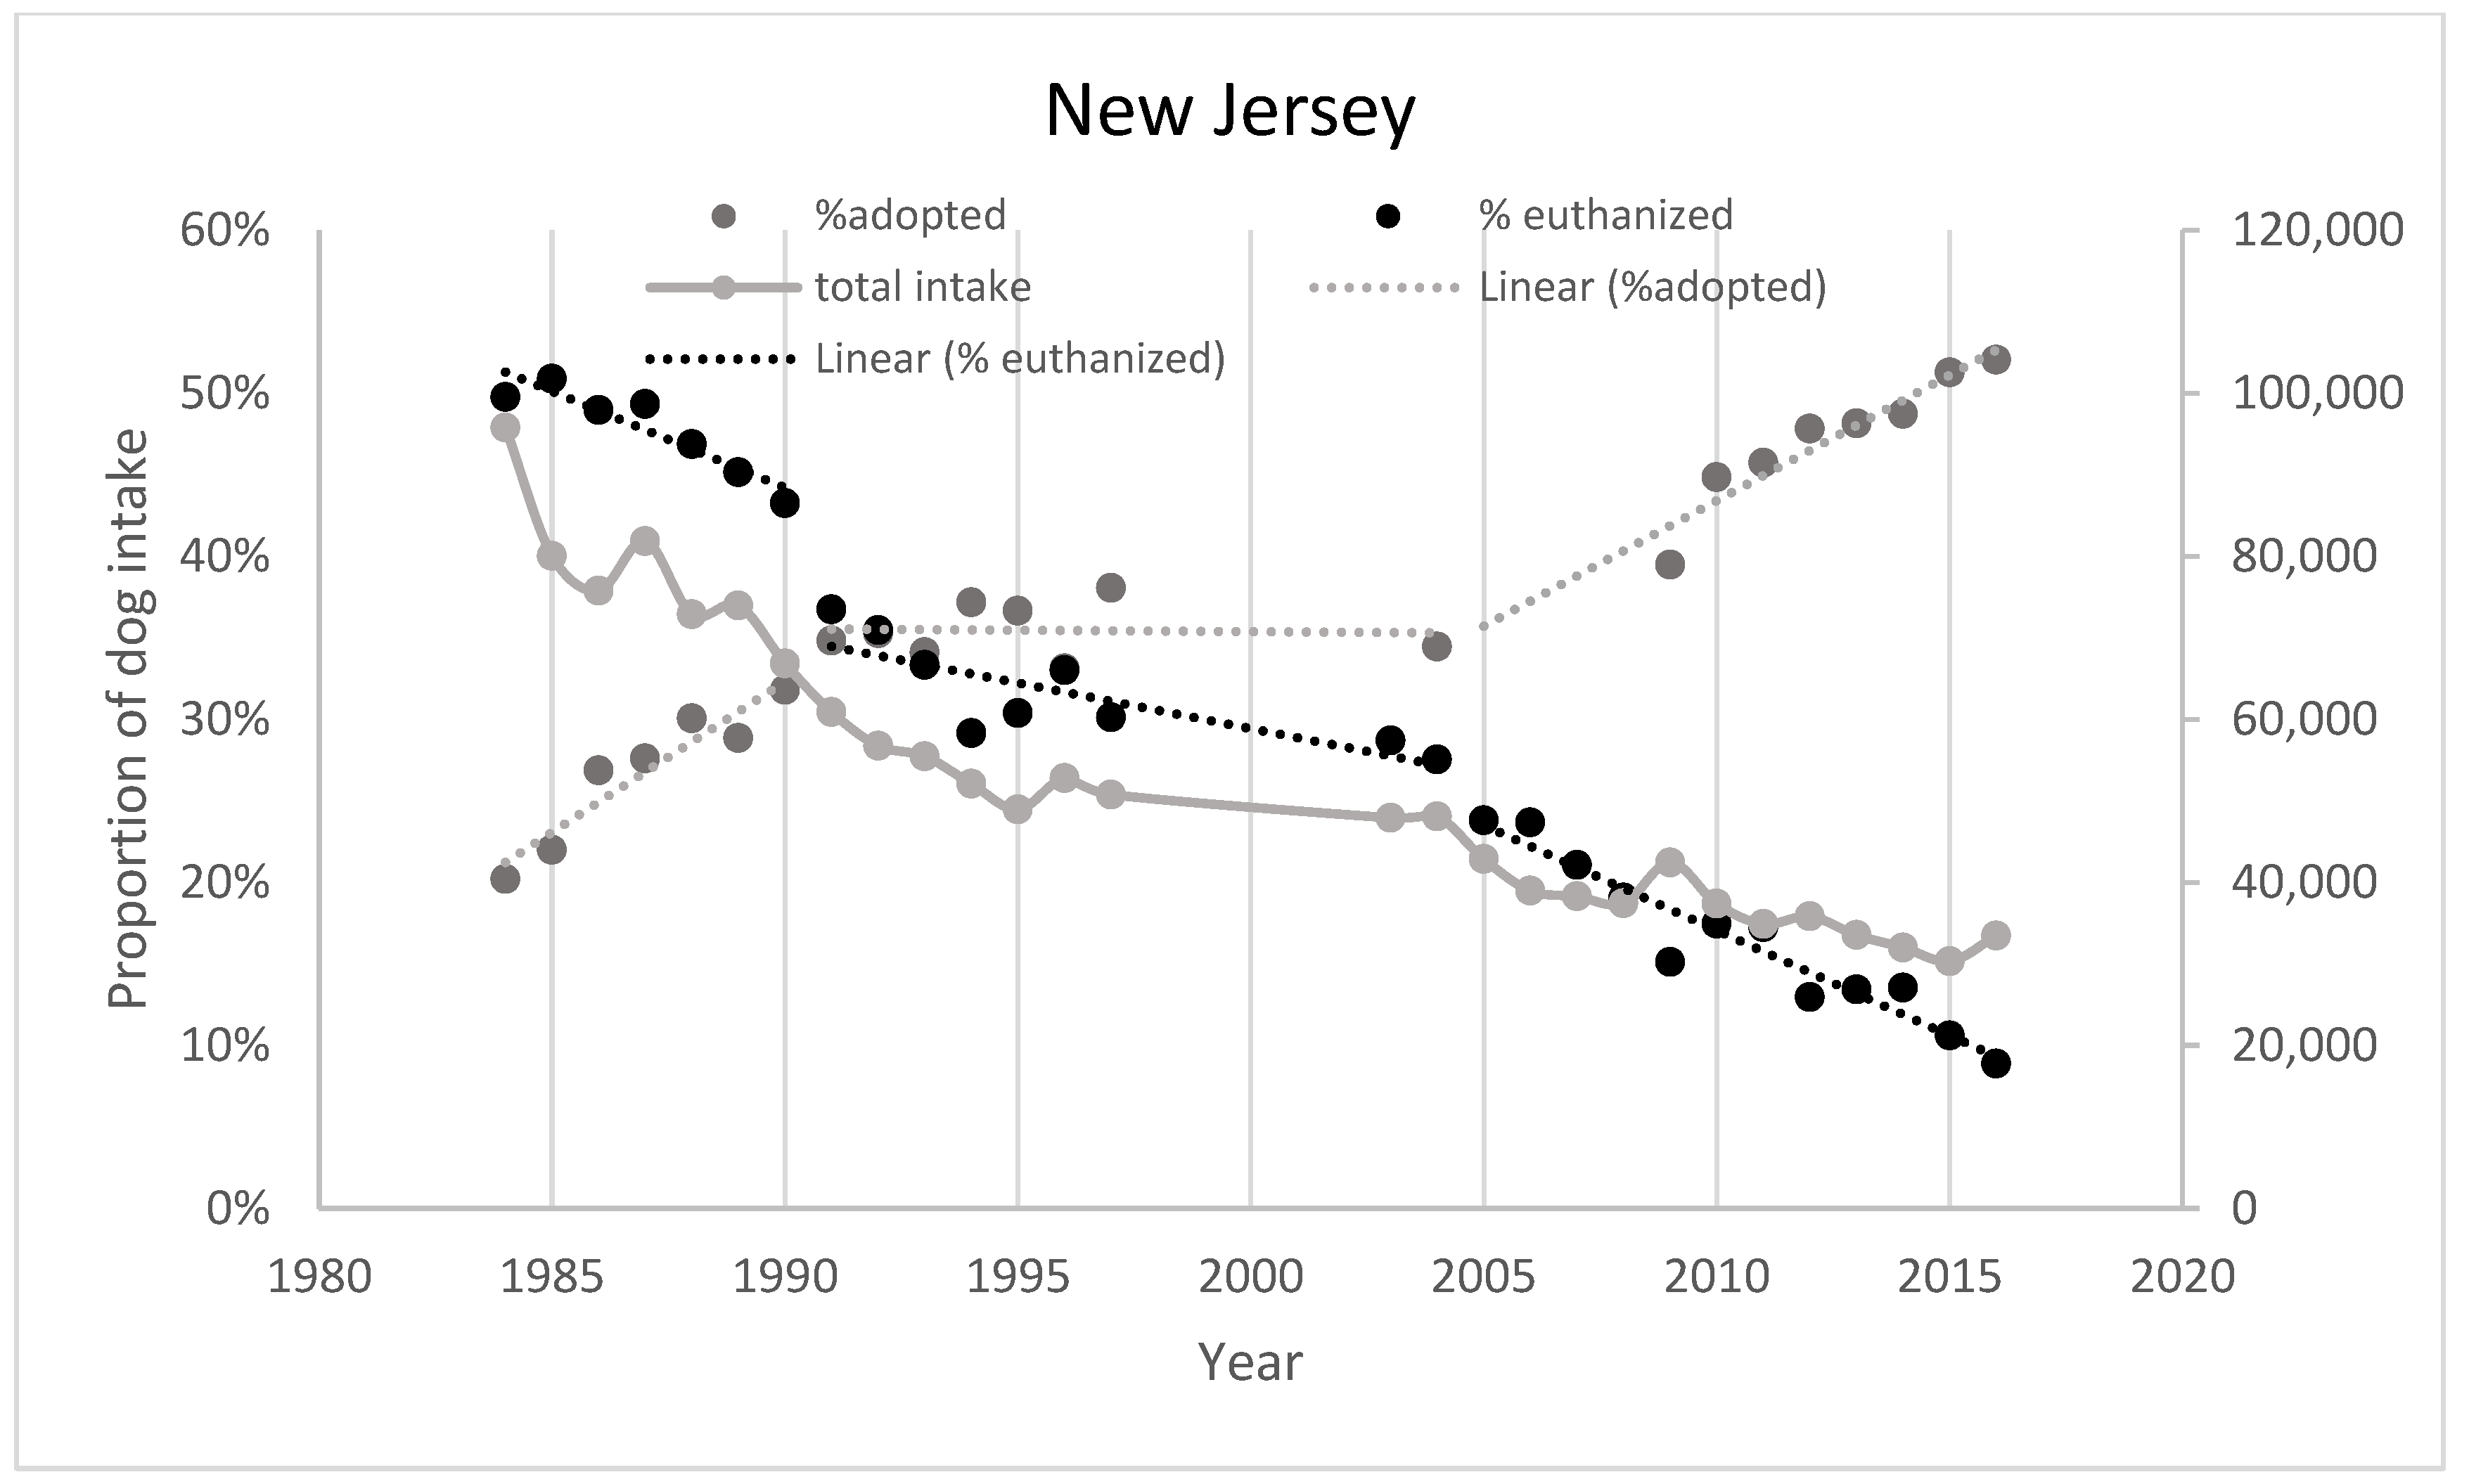
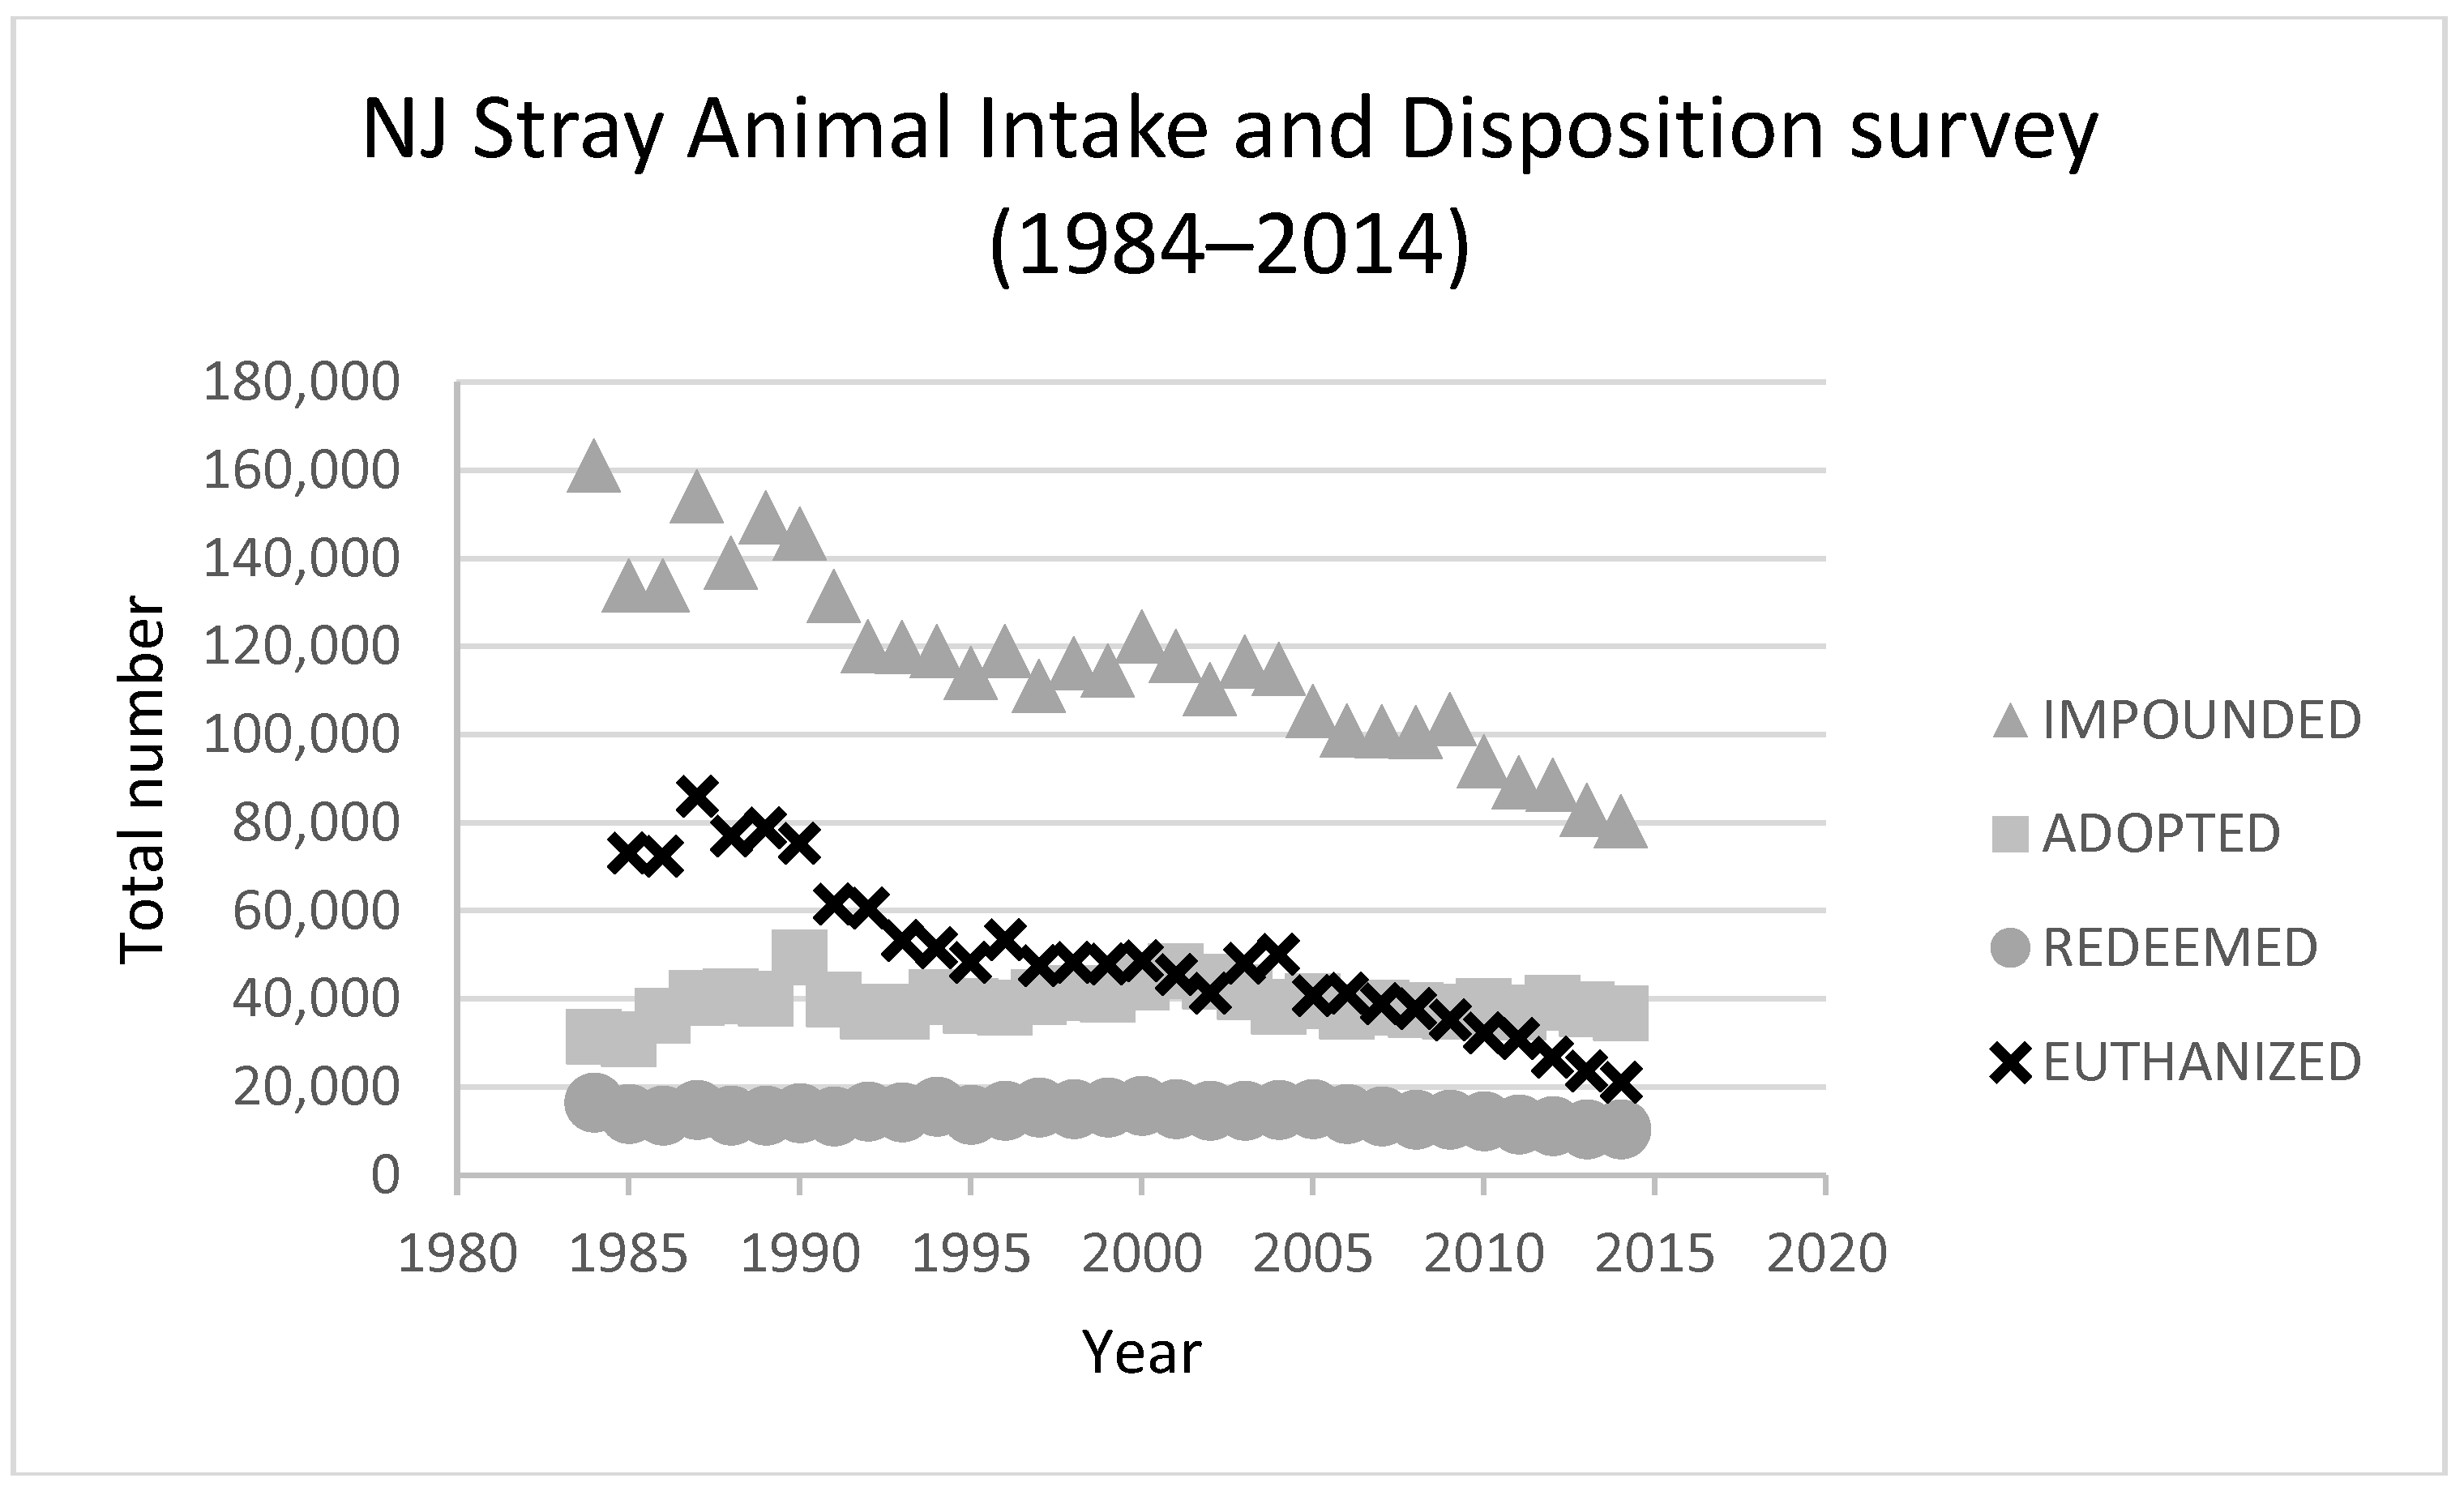
4.1.1. New Jersey
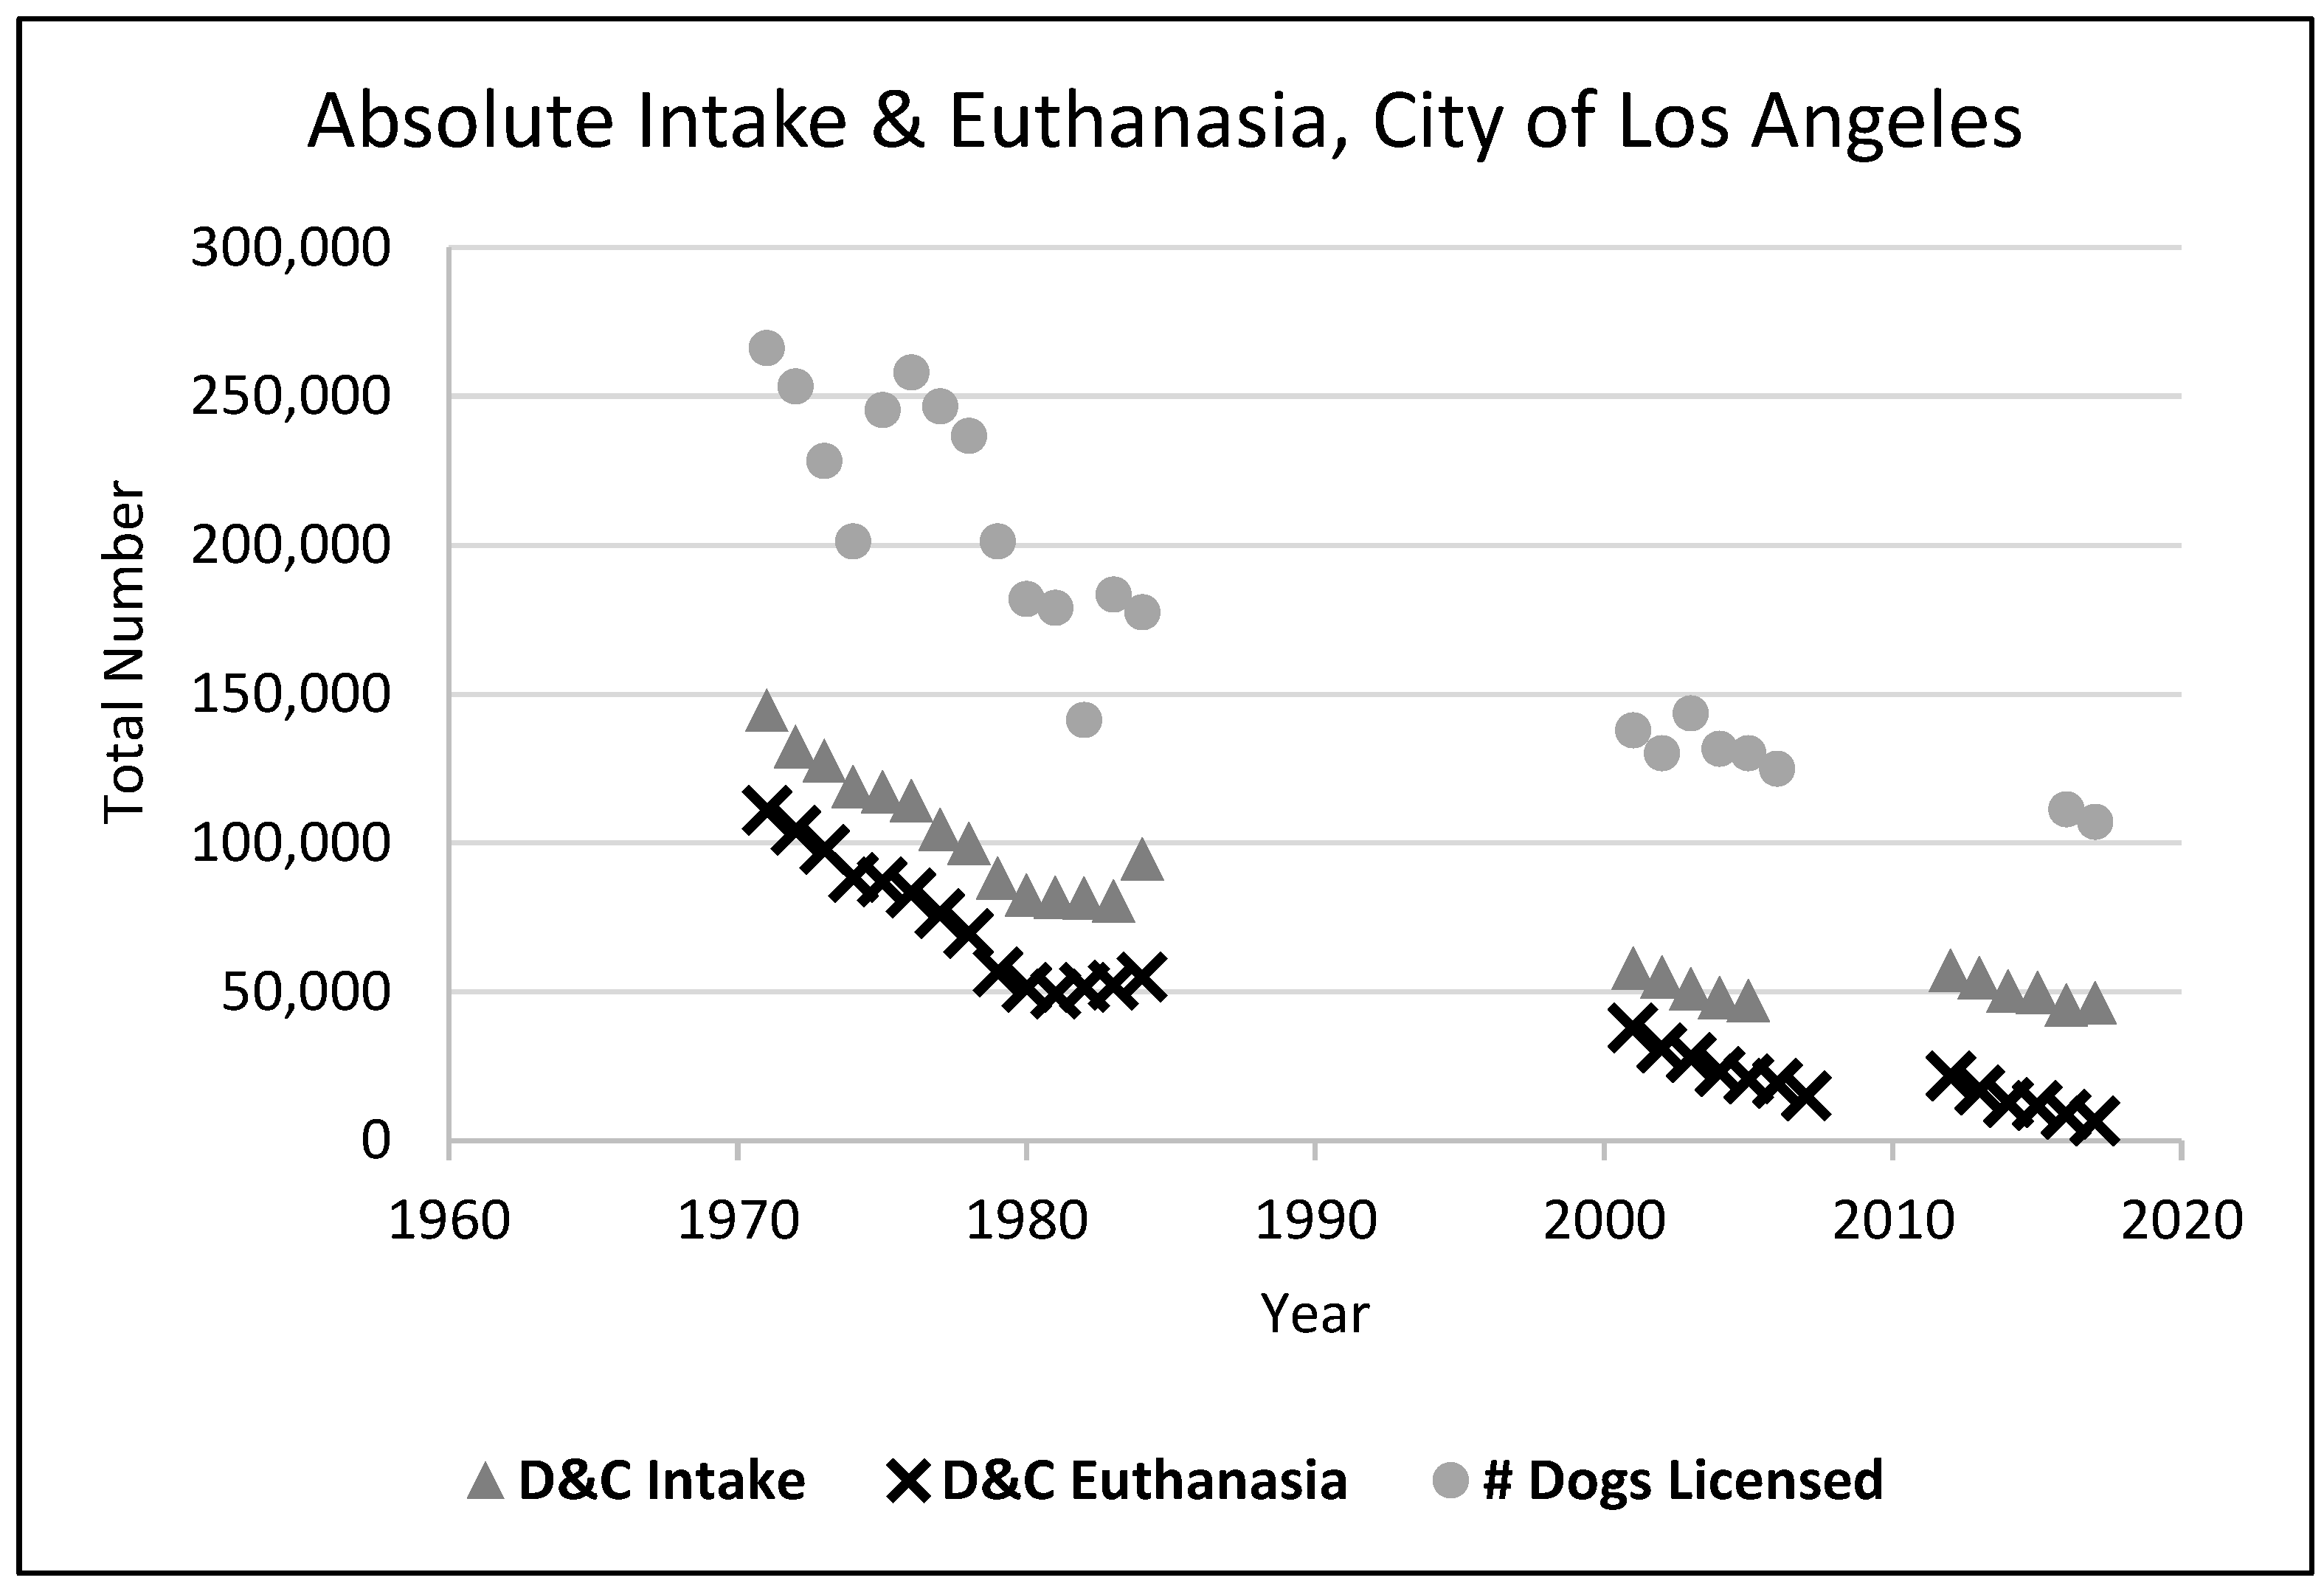
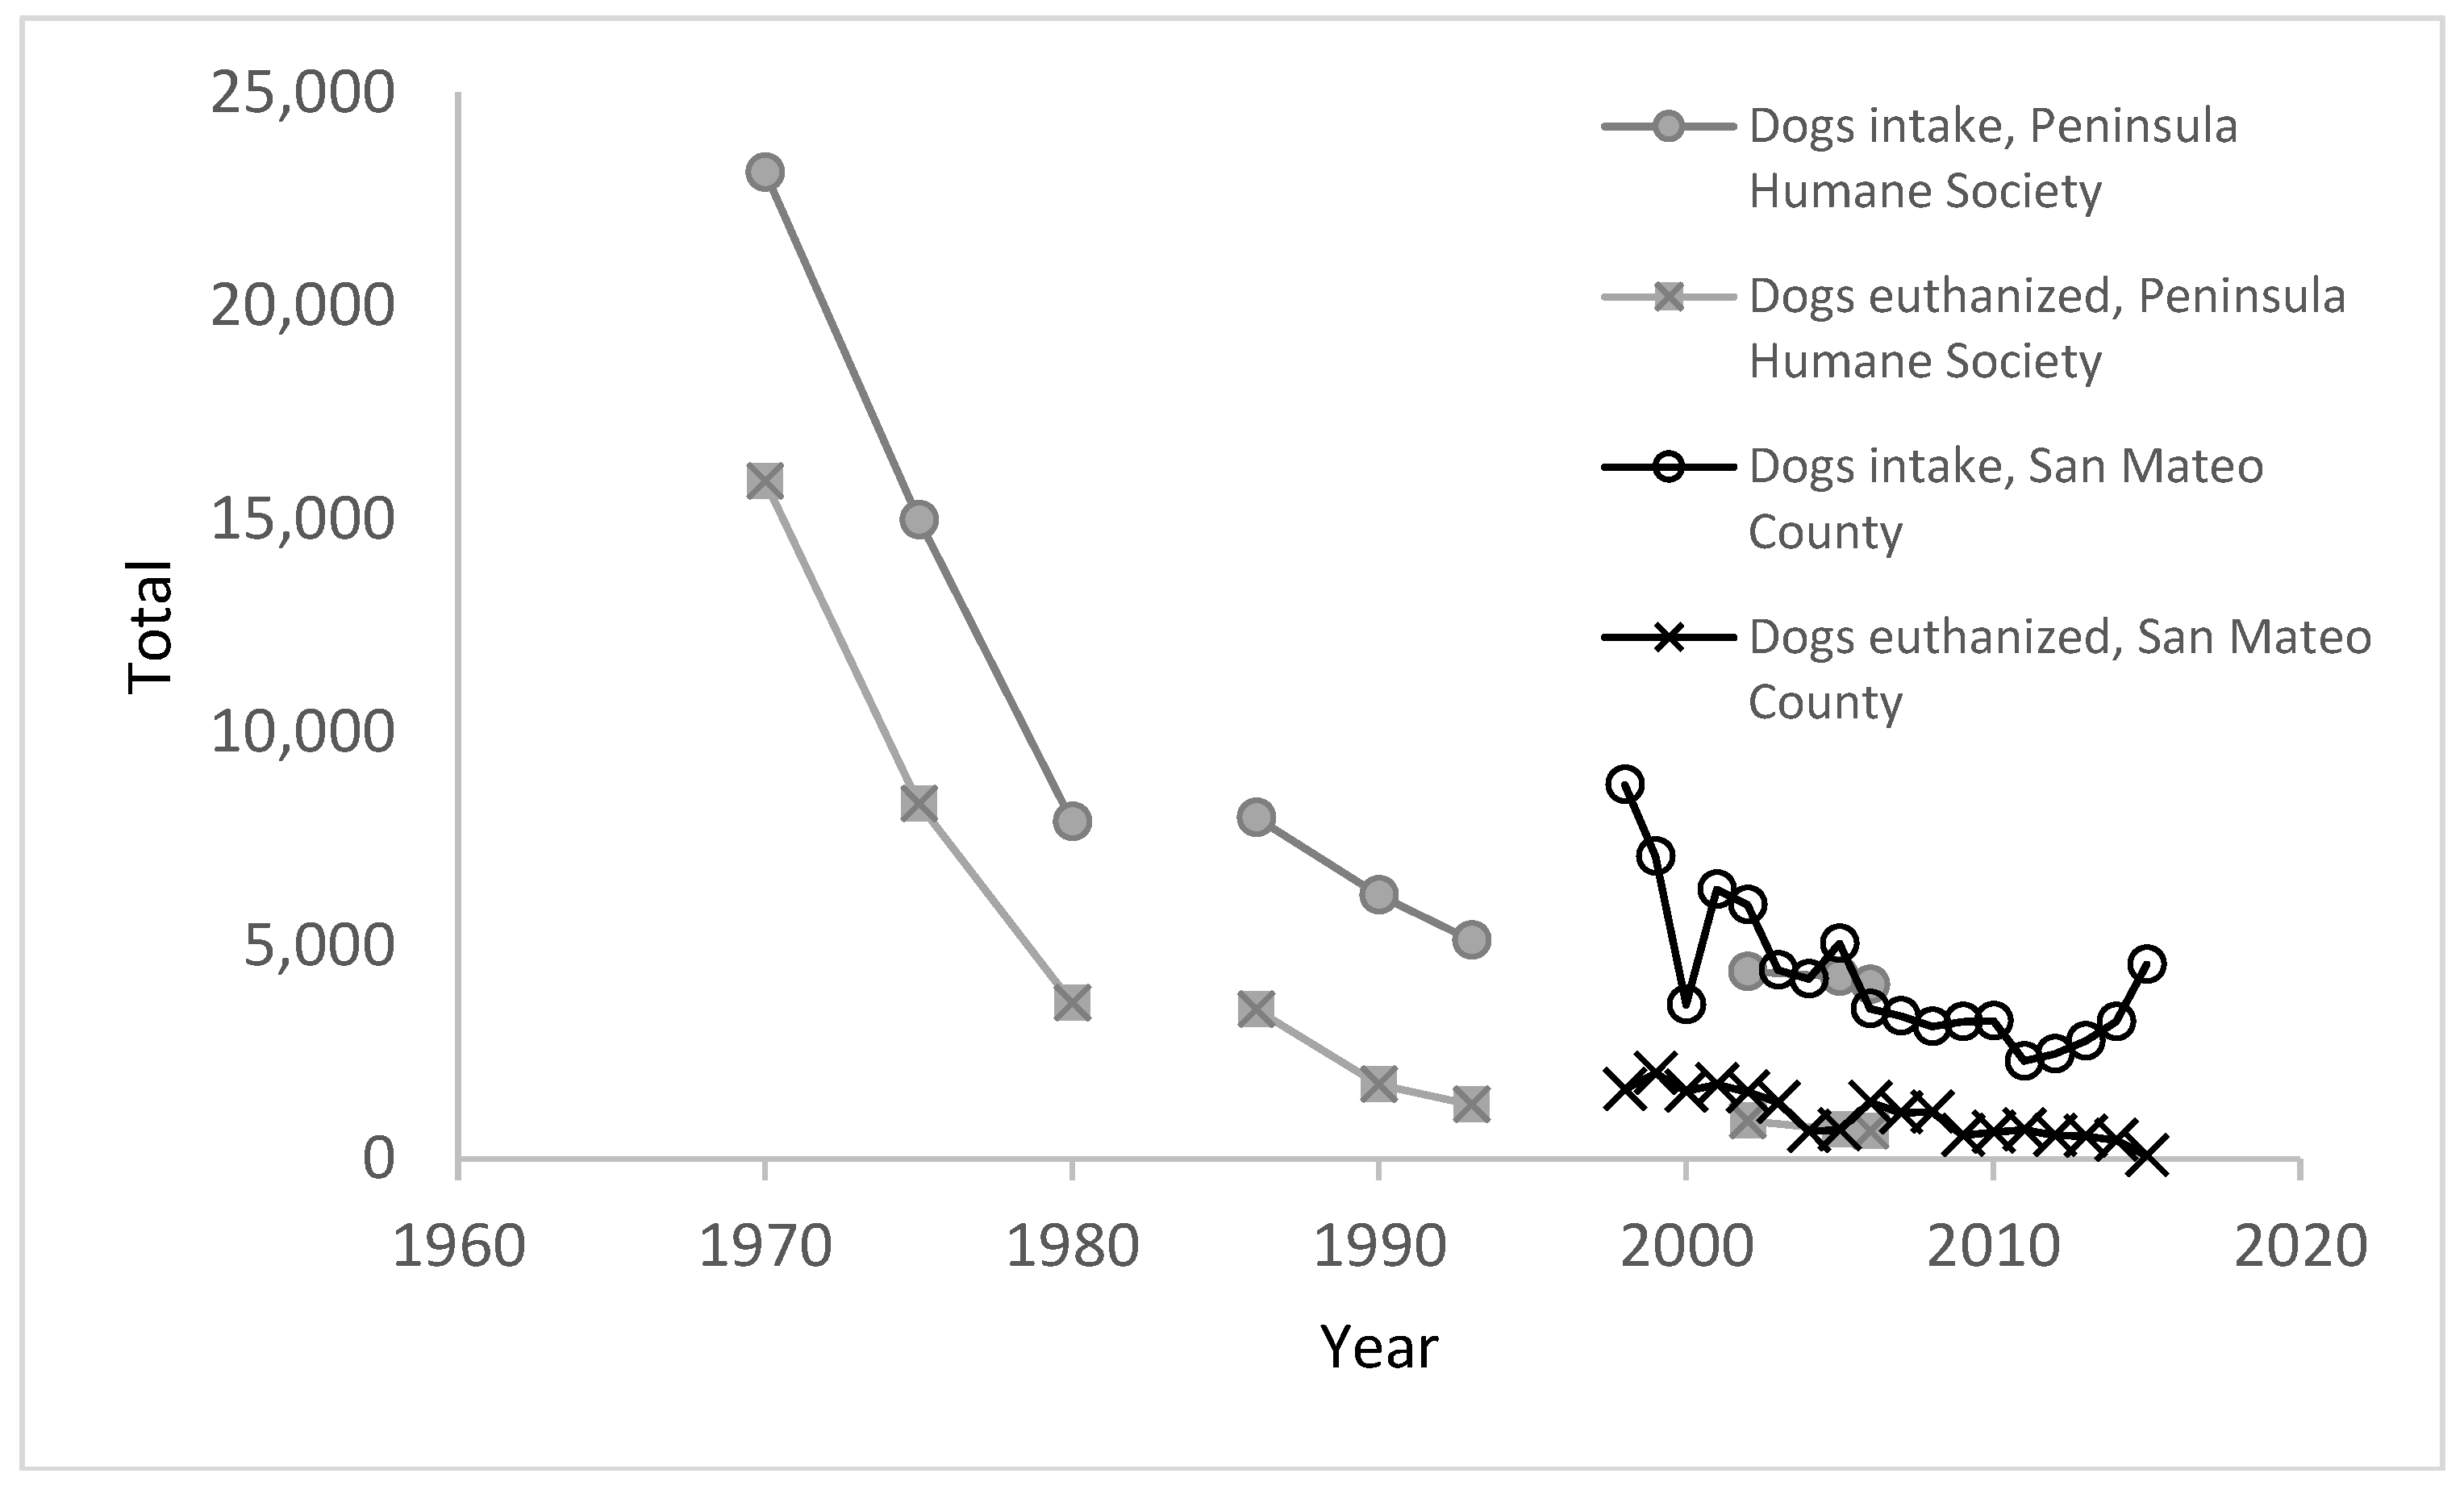
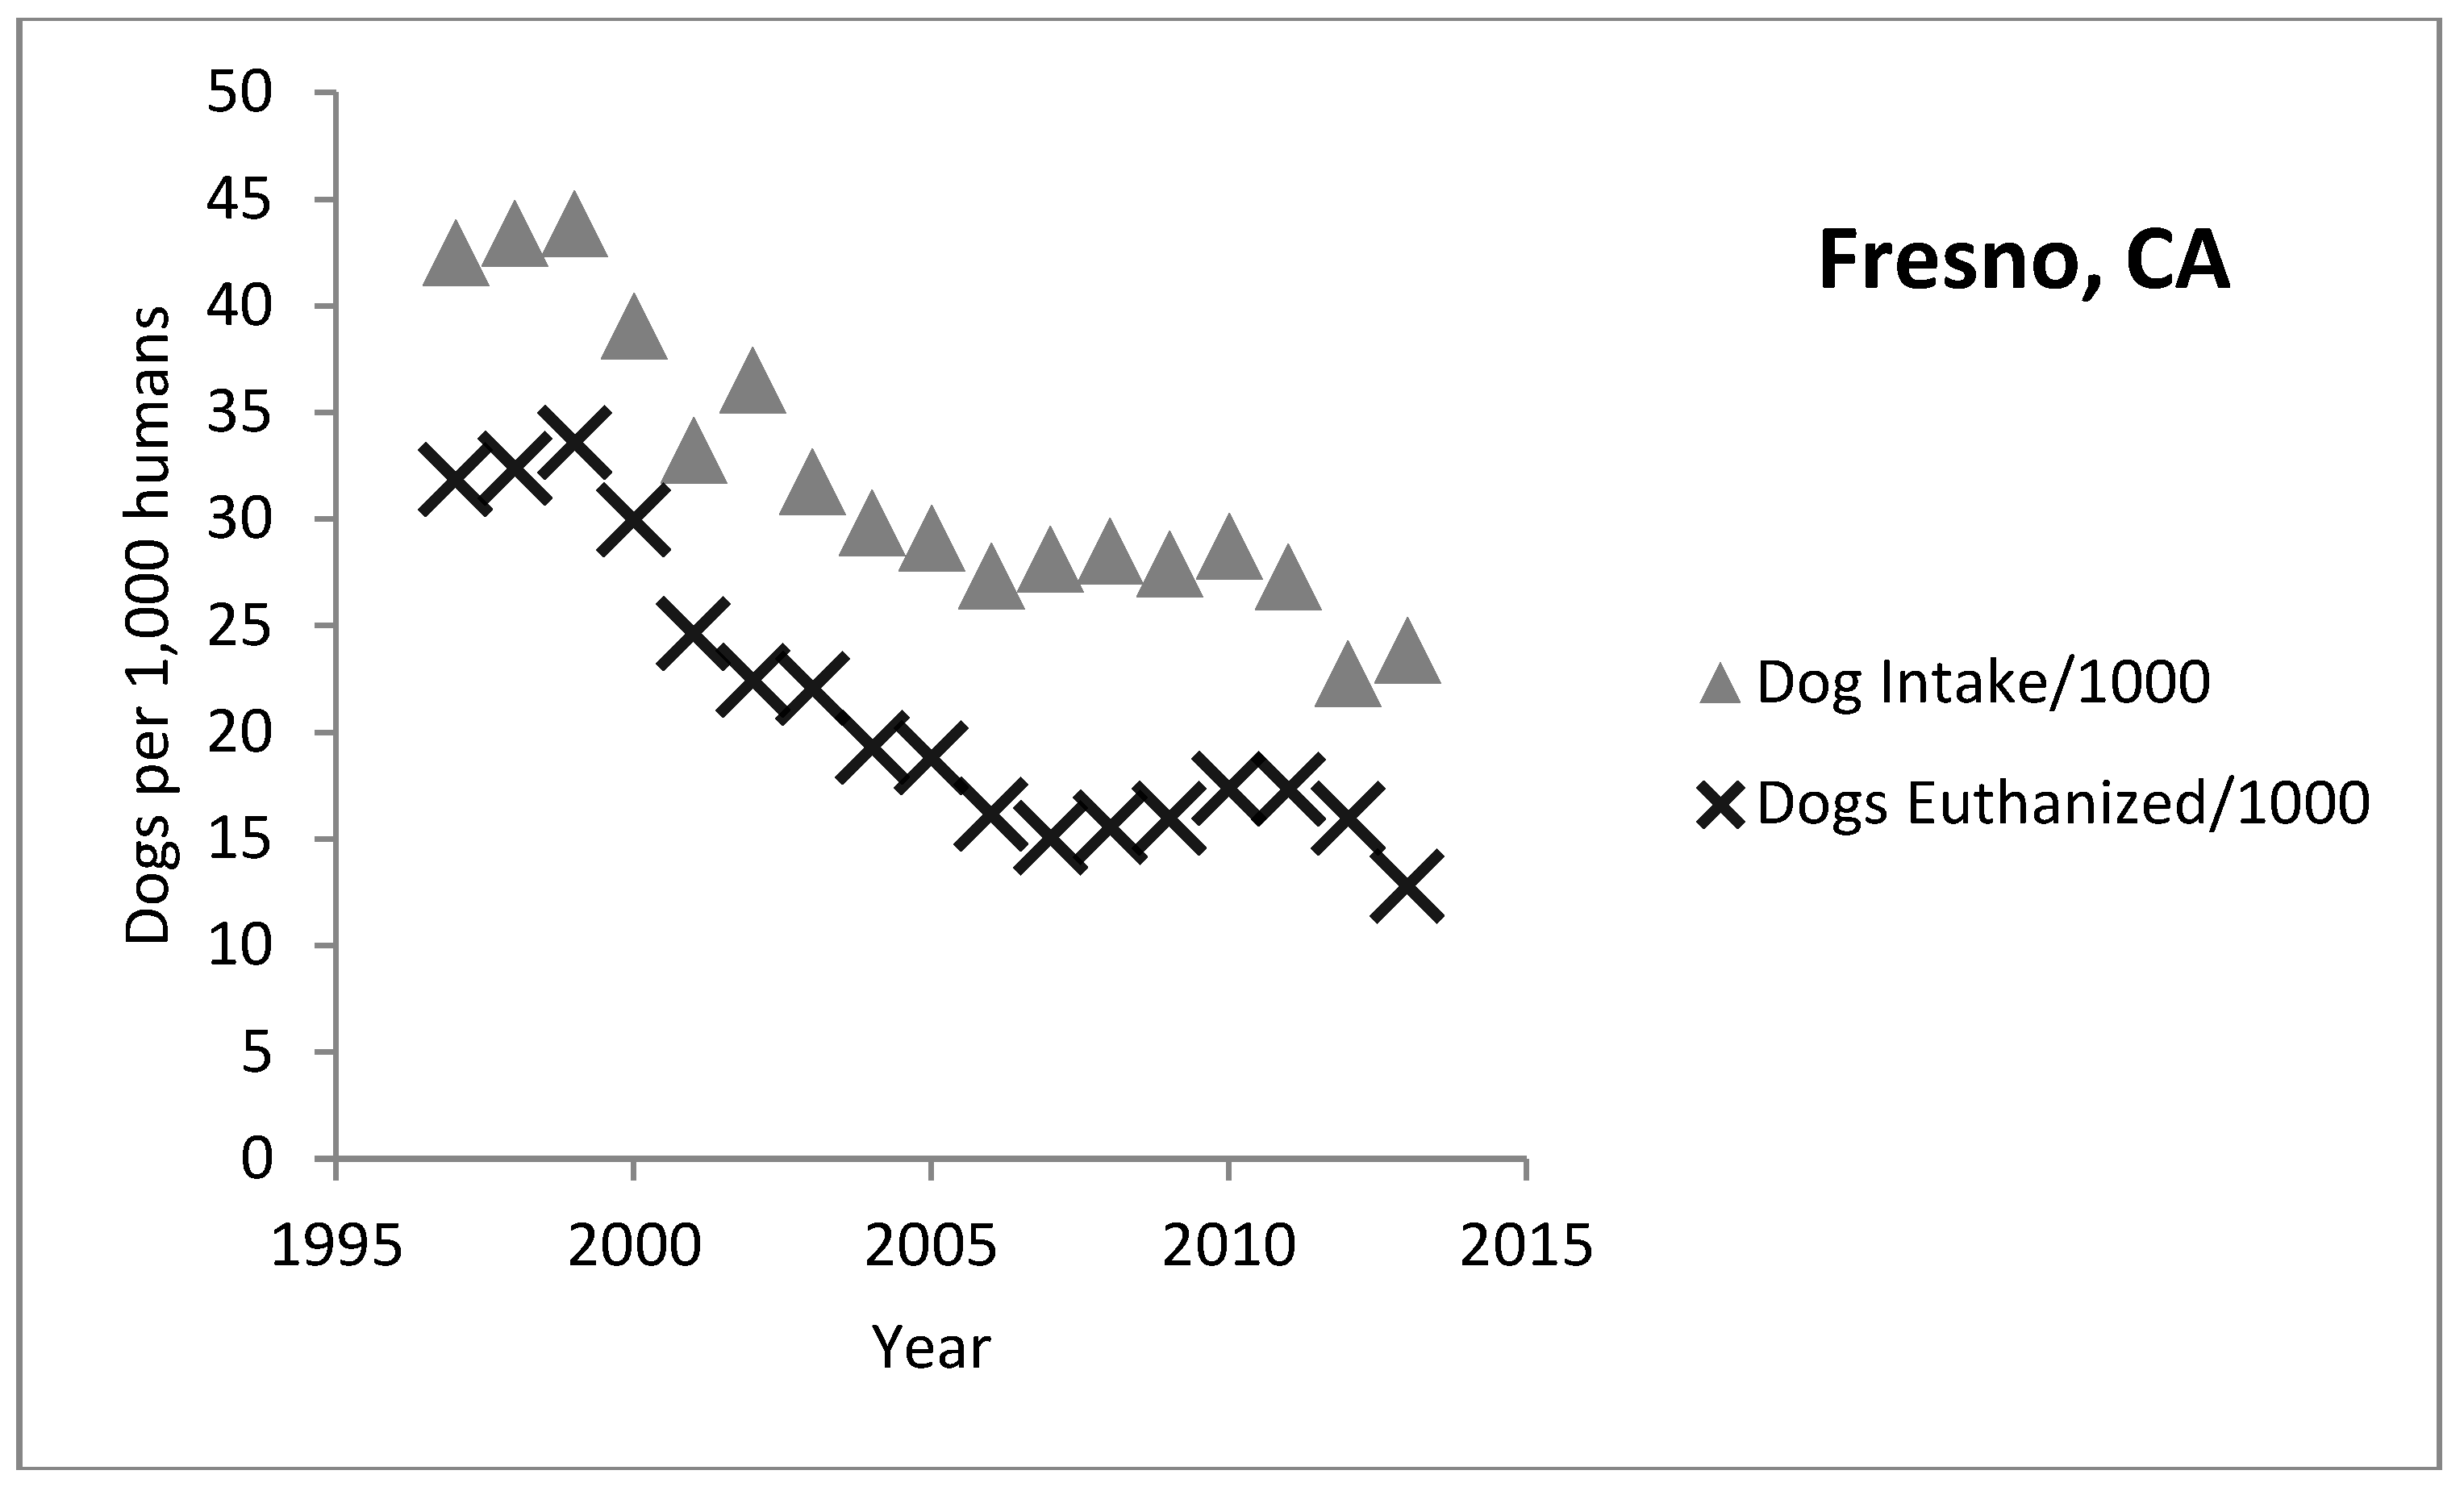
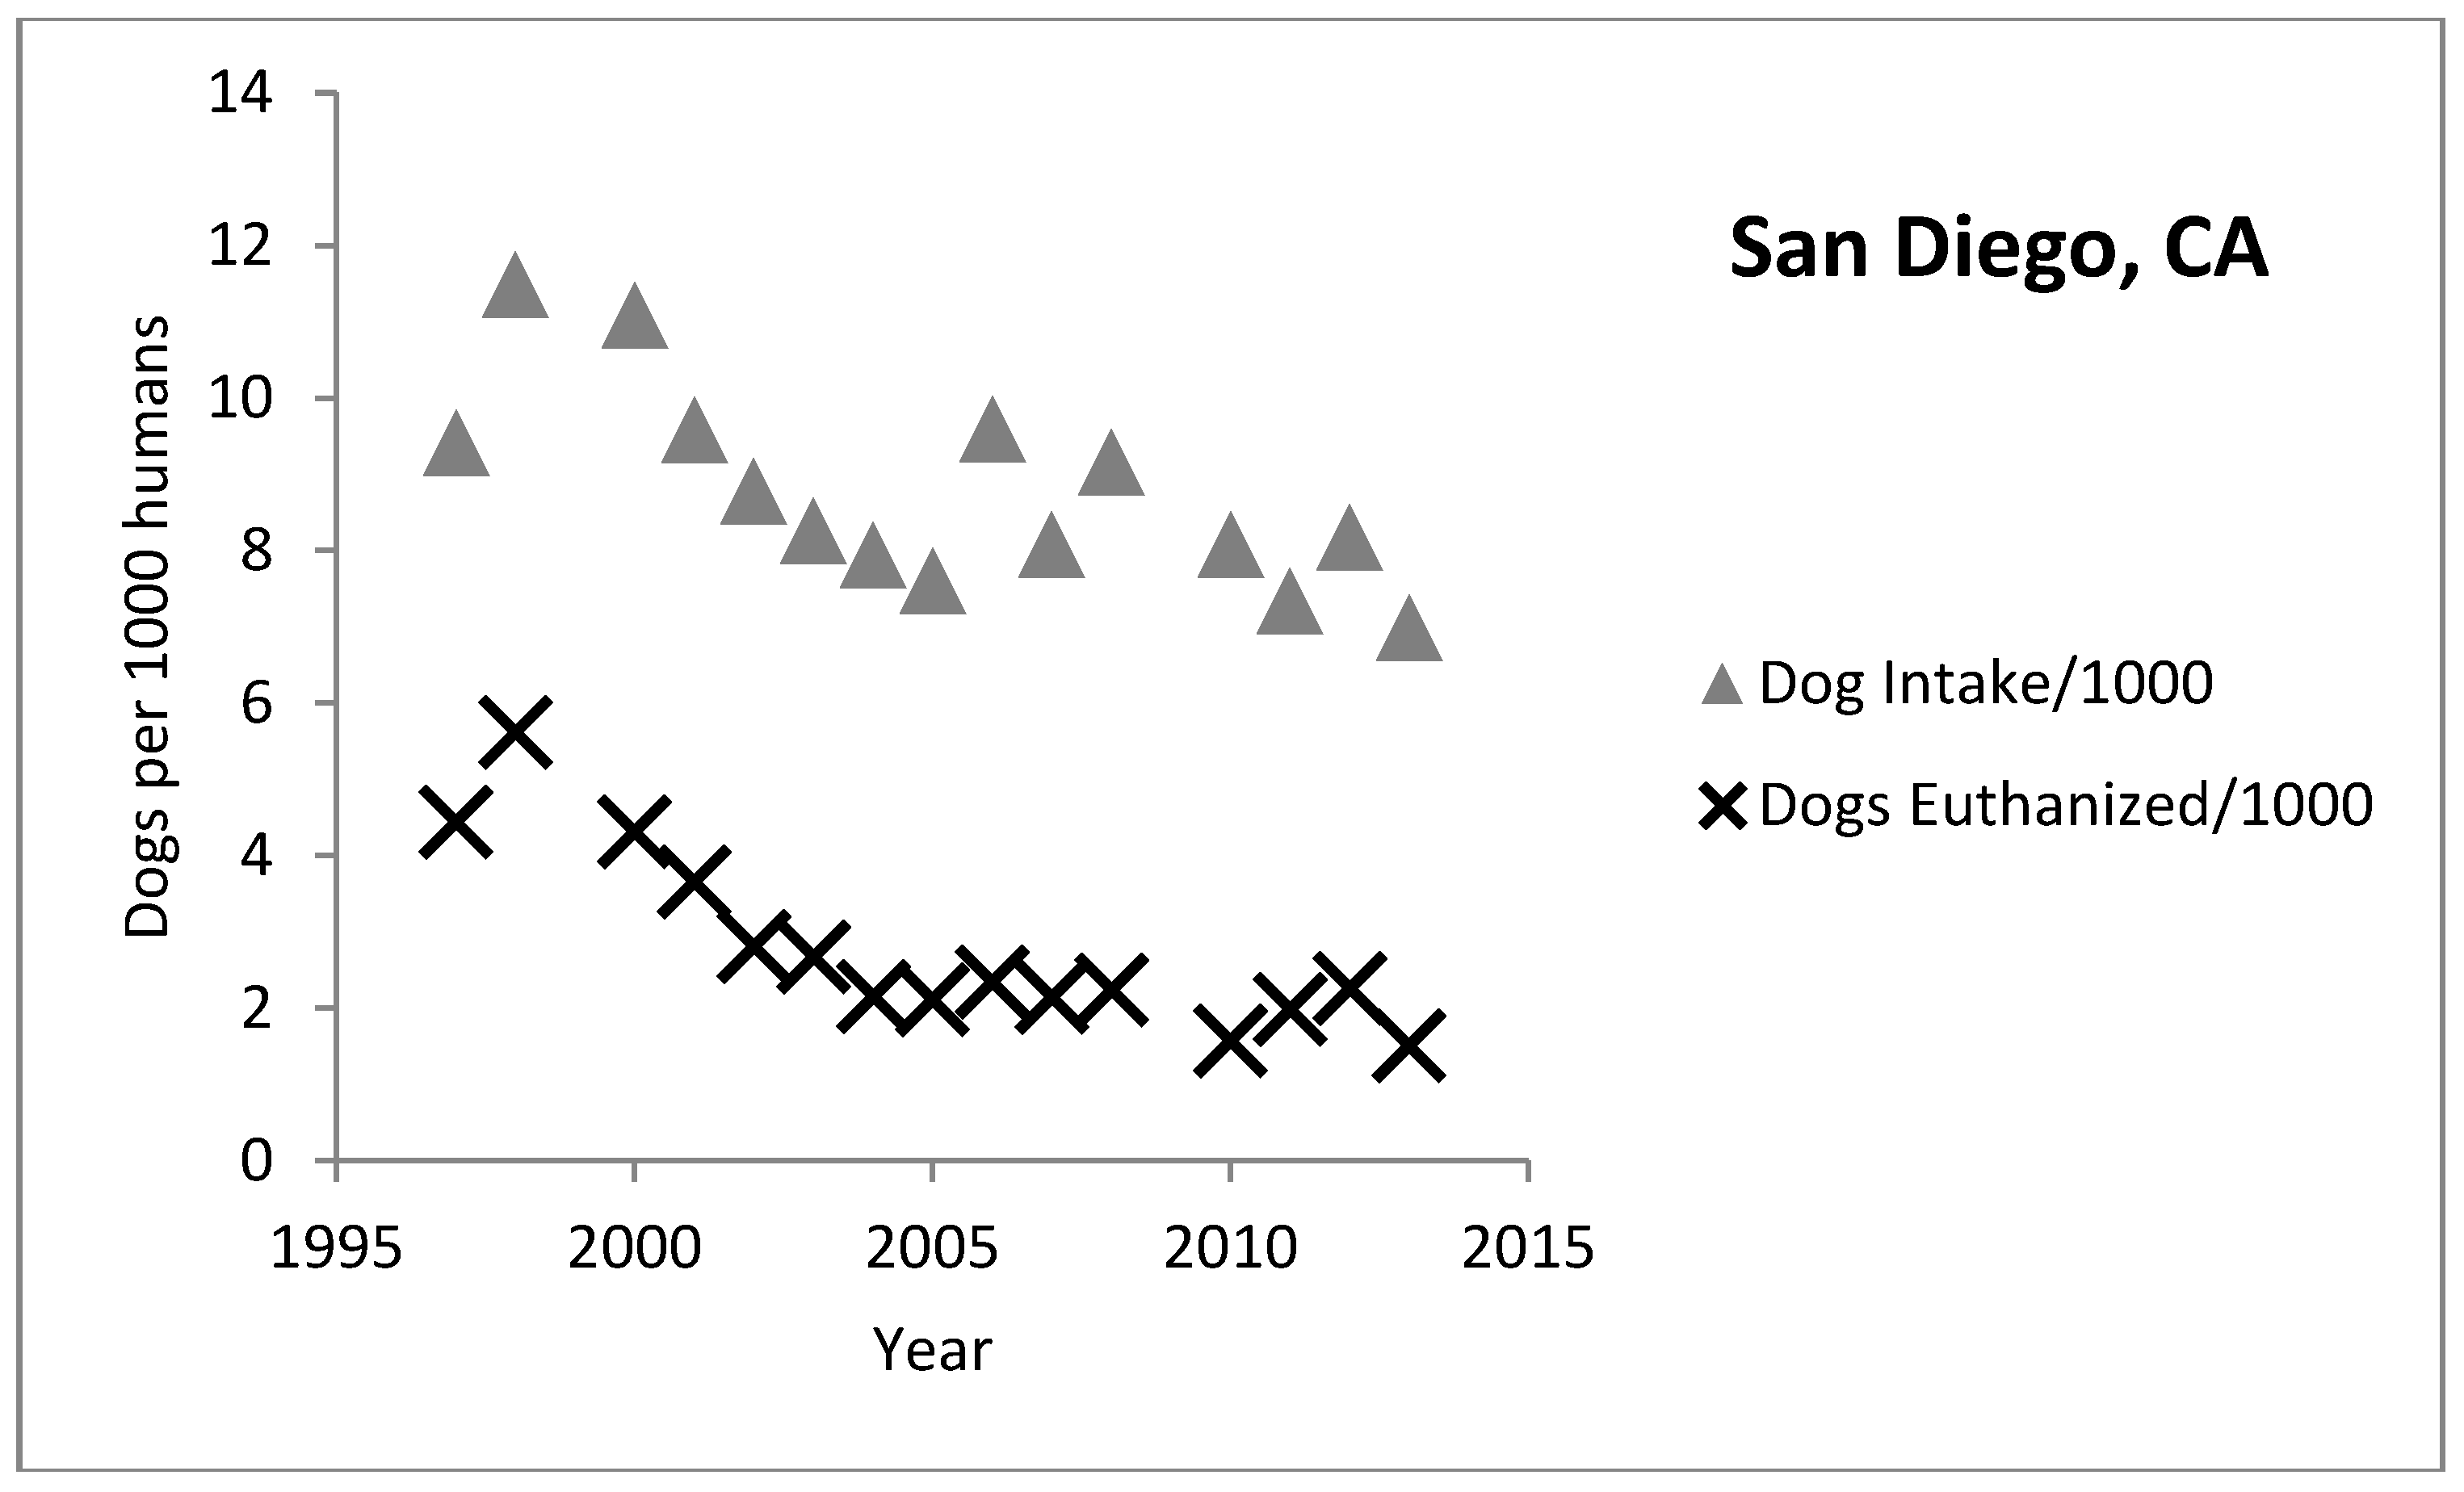
4.1.2. California
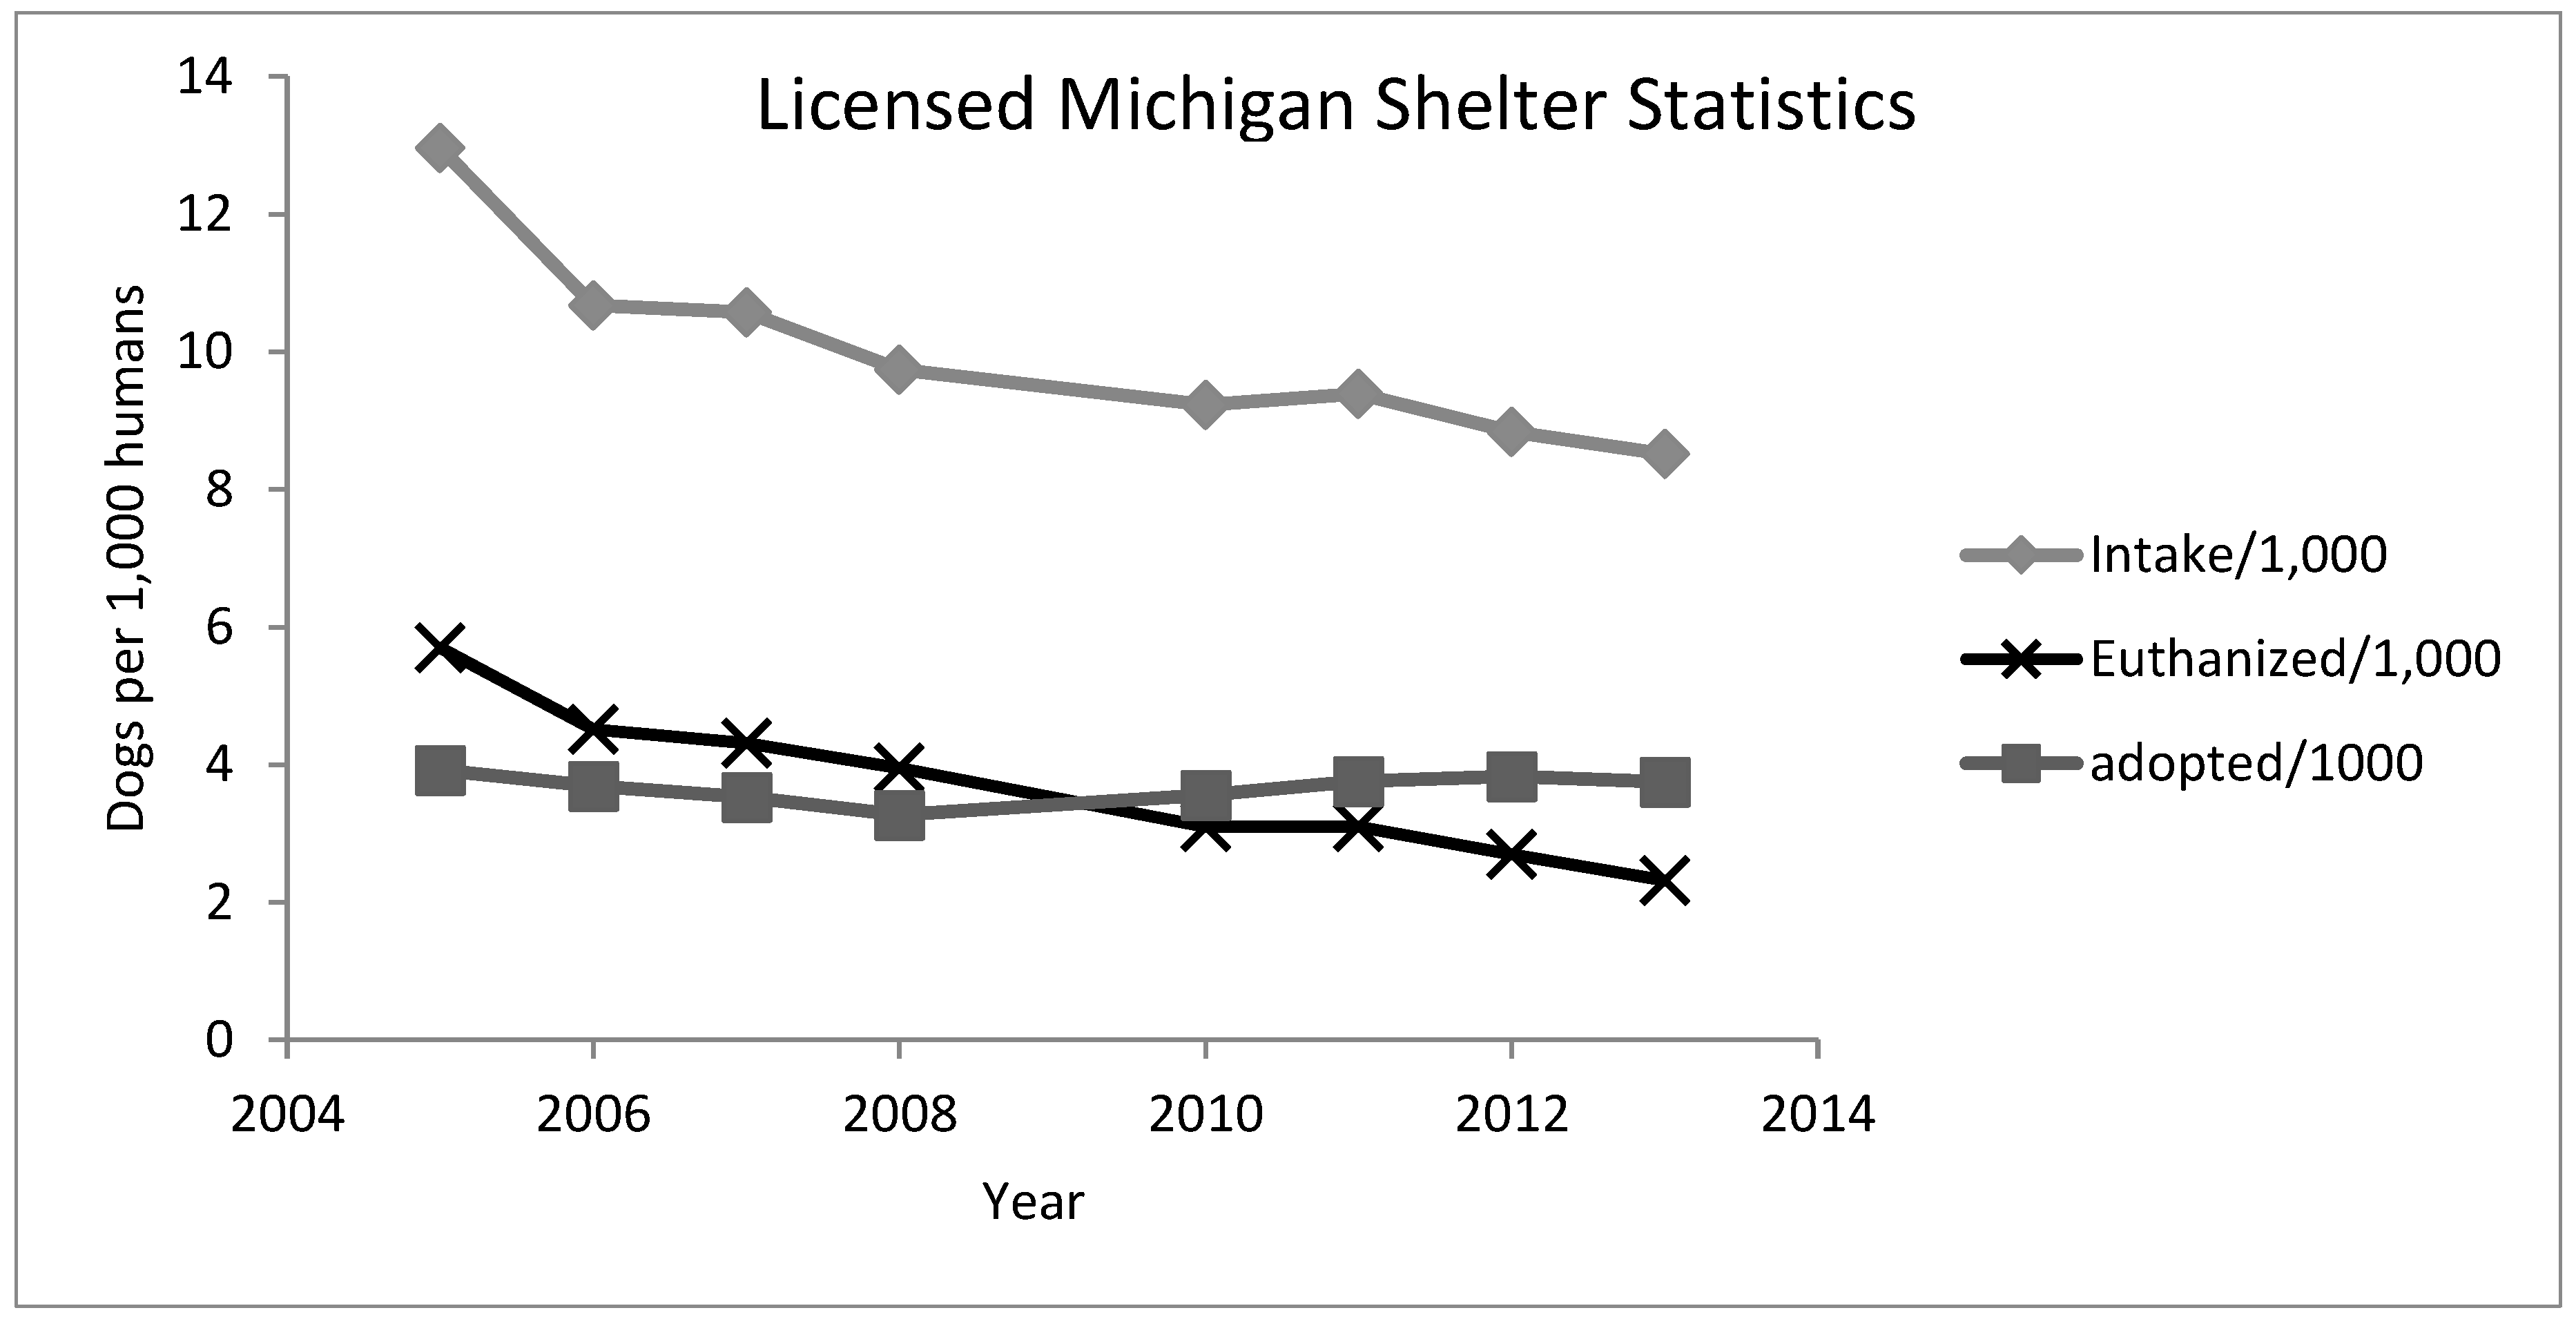
4.1.3. Michigan
4.1.4. Ohio
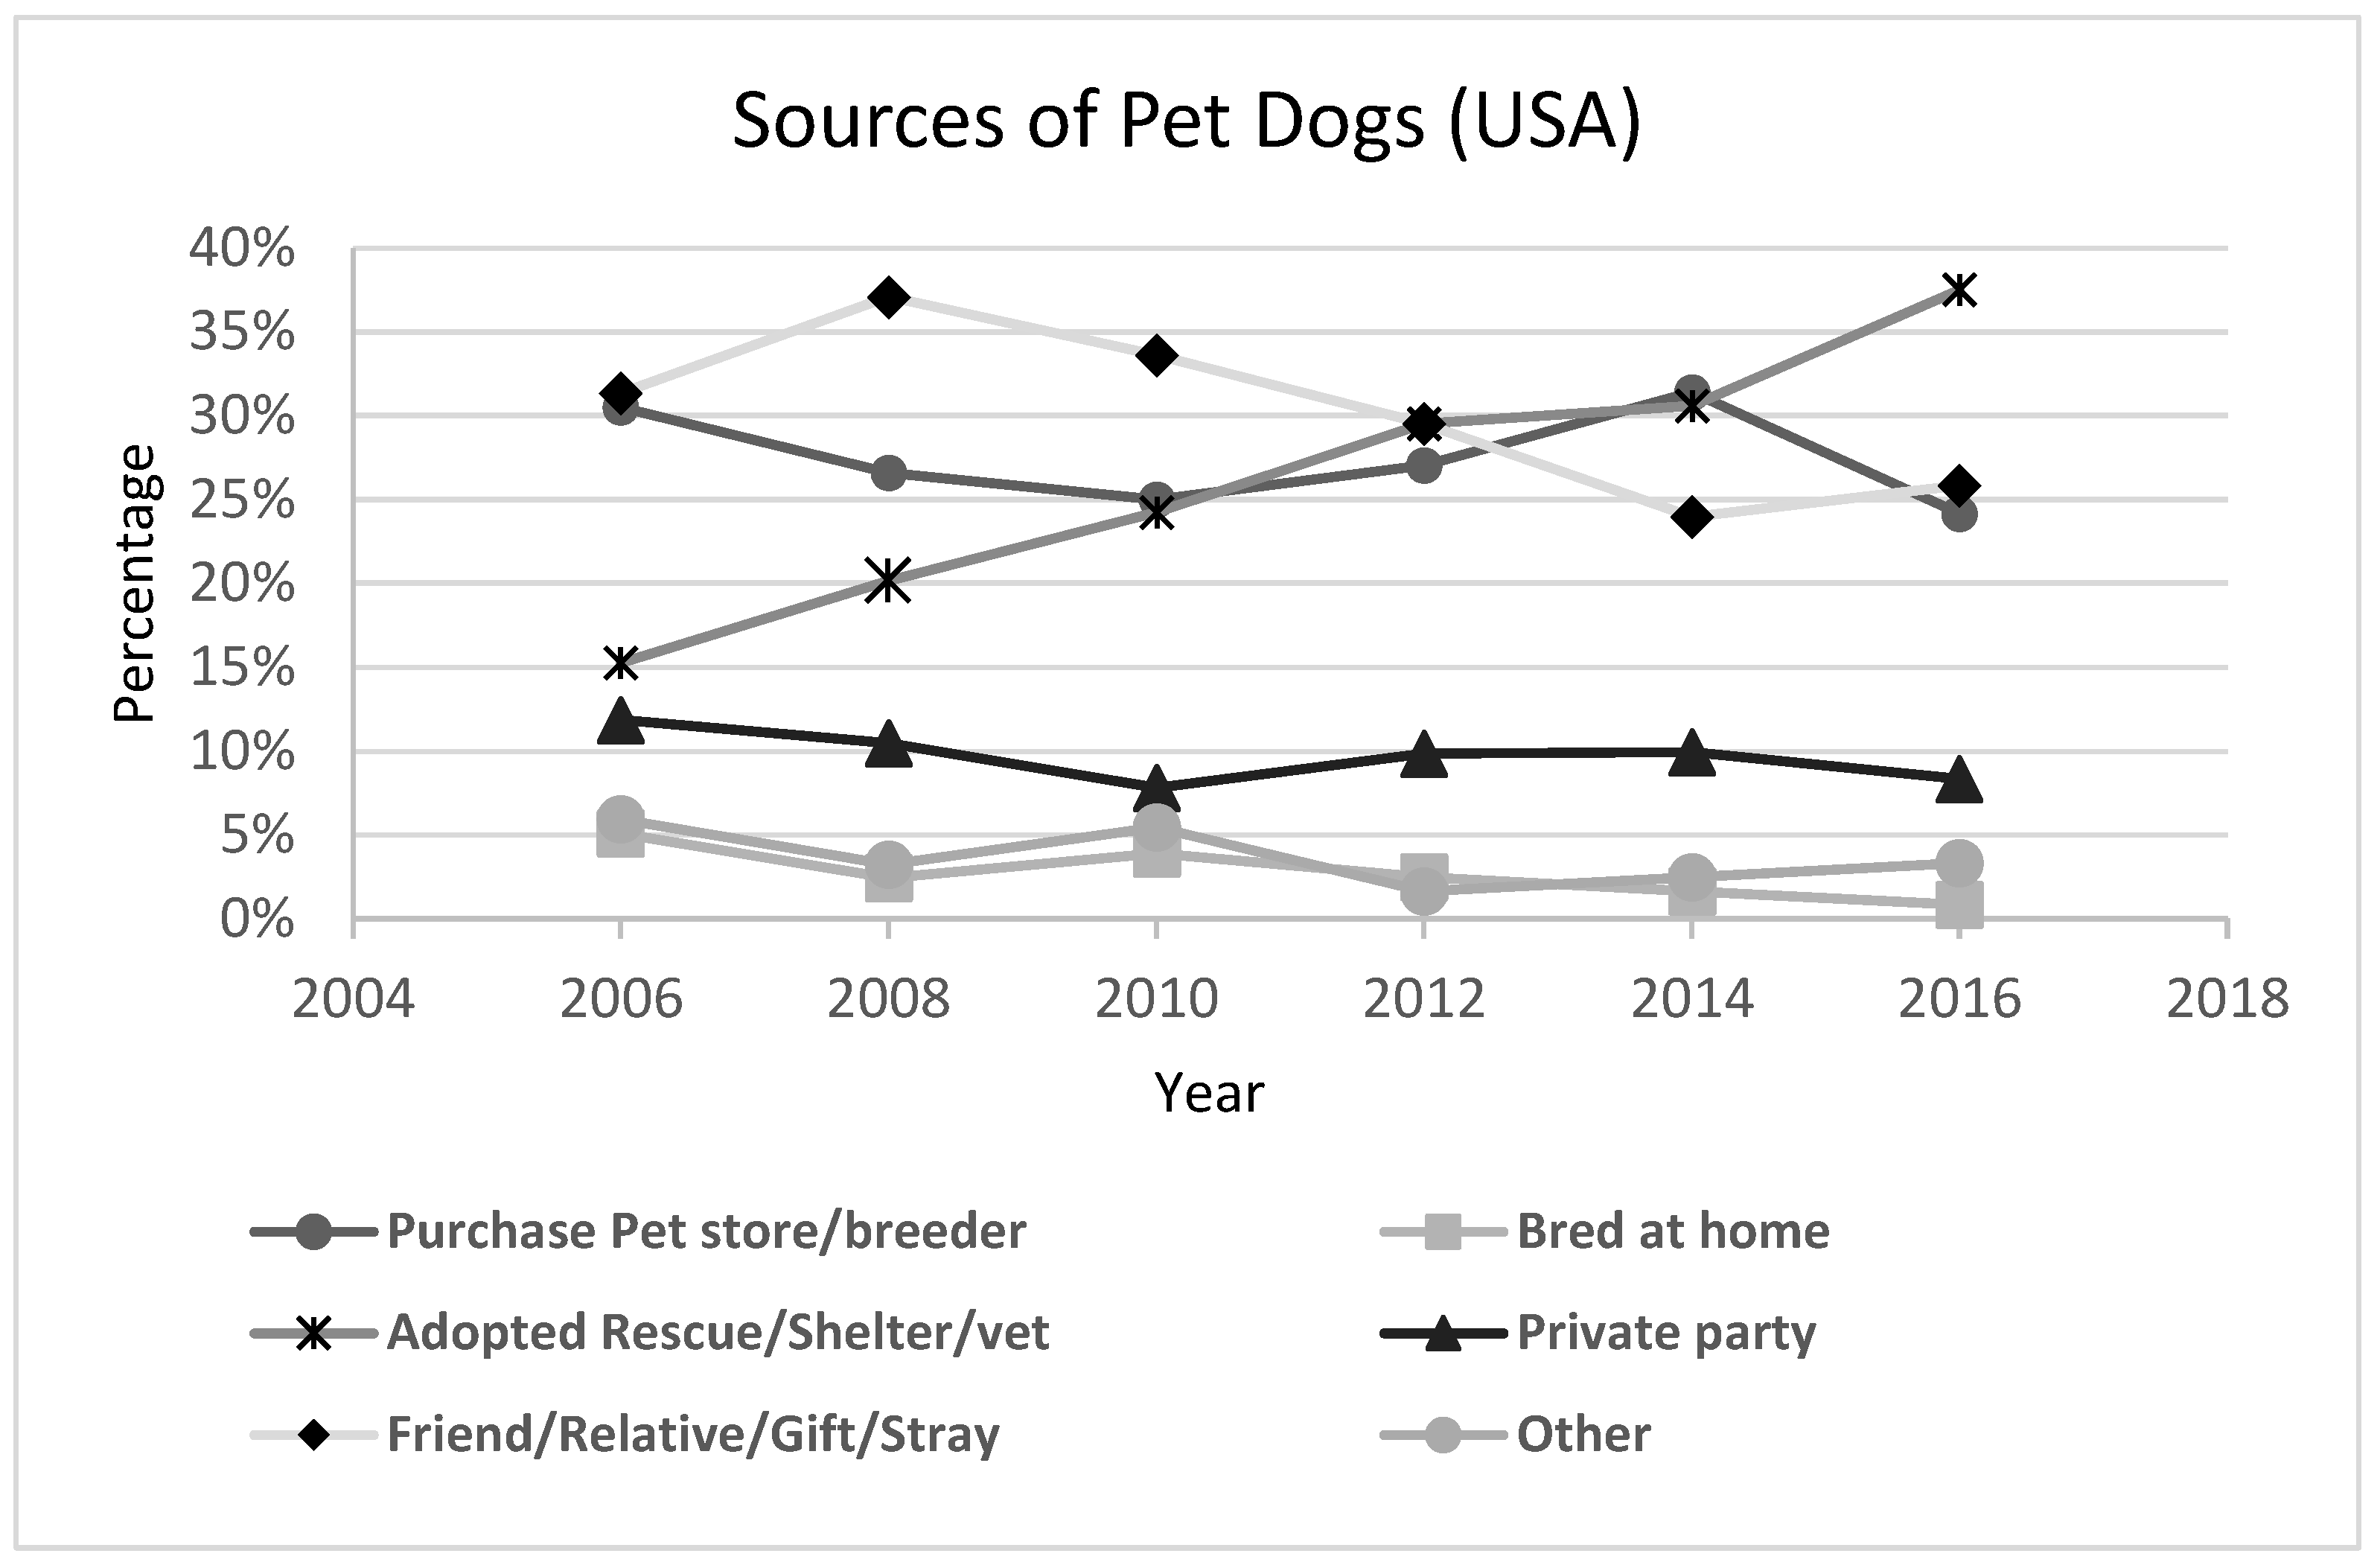
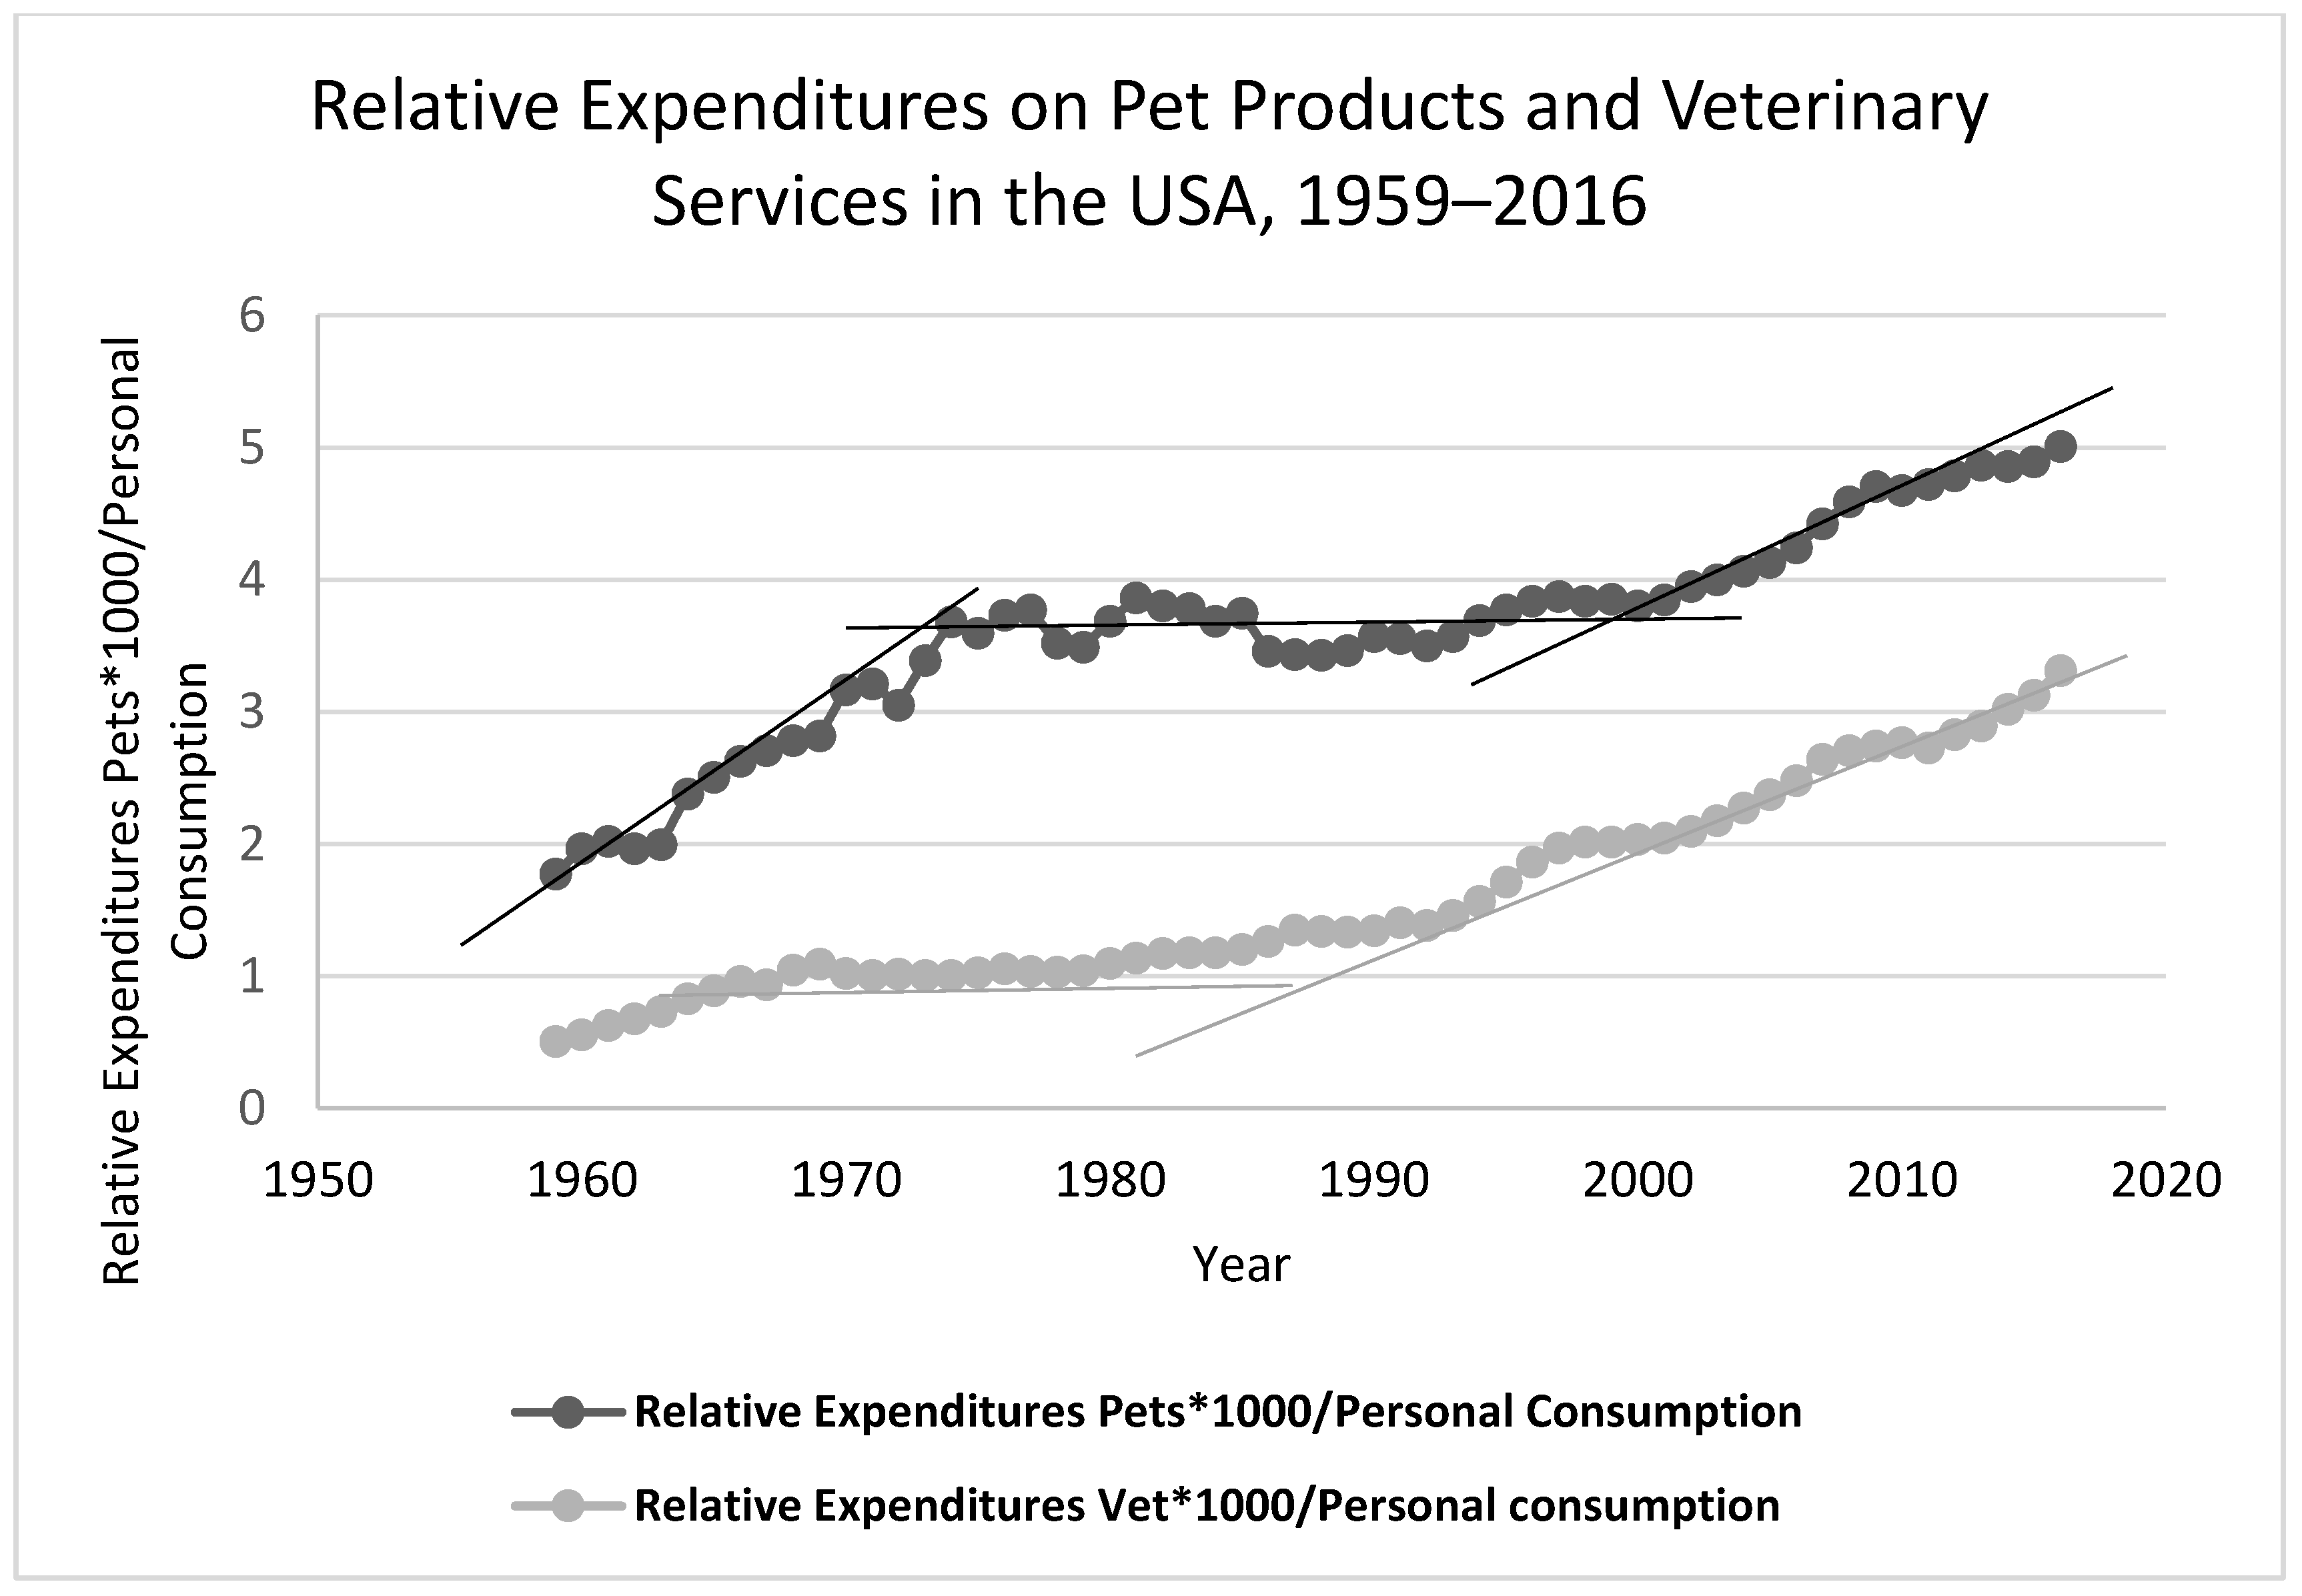
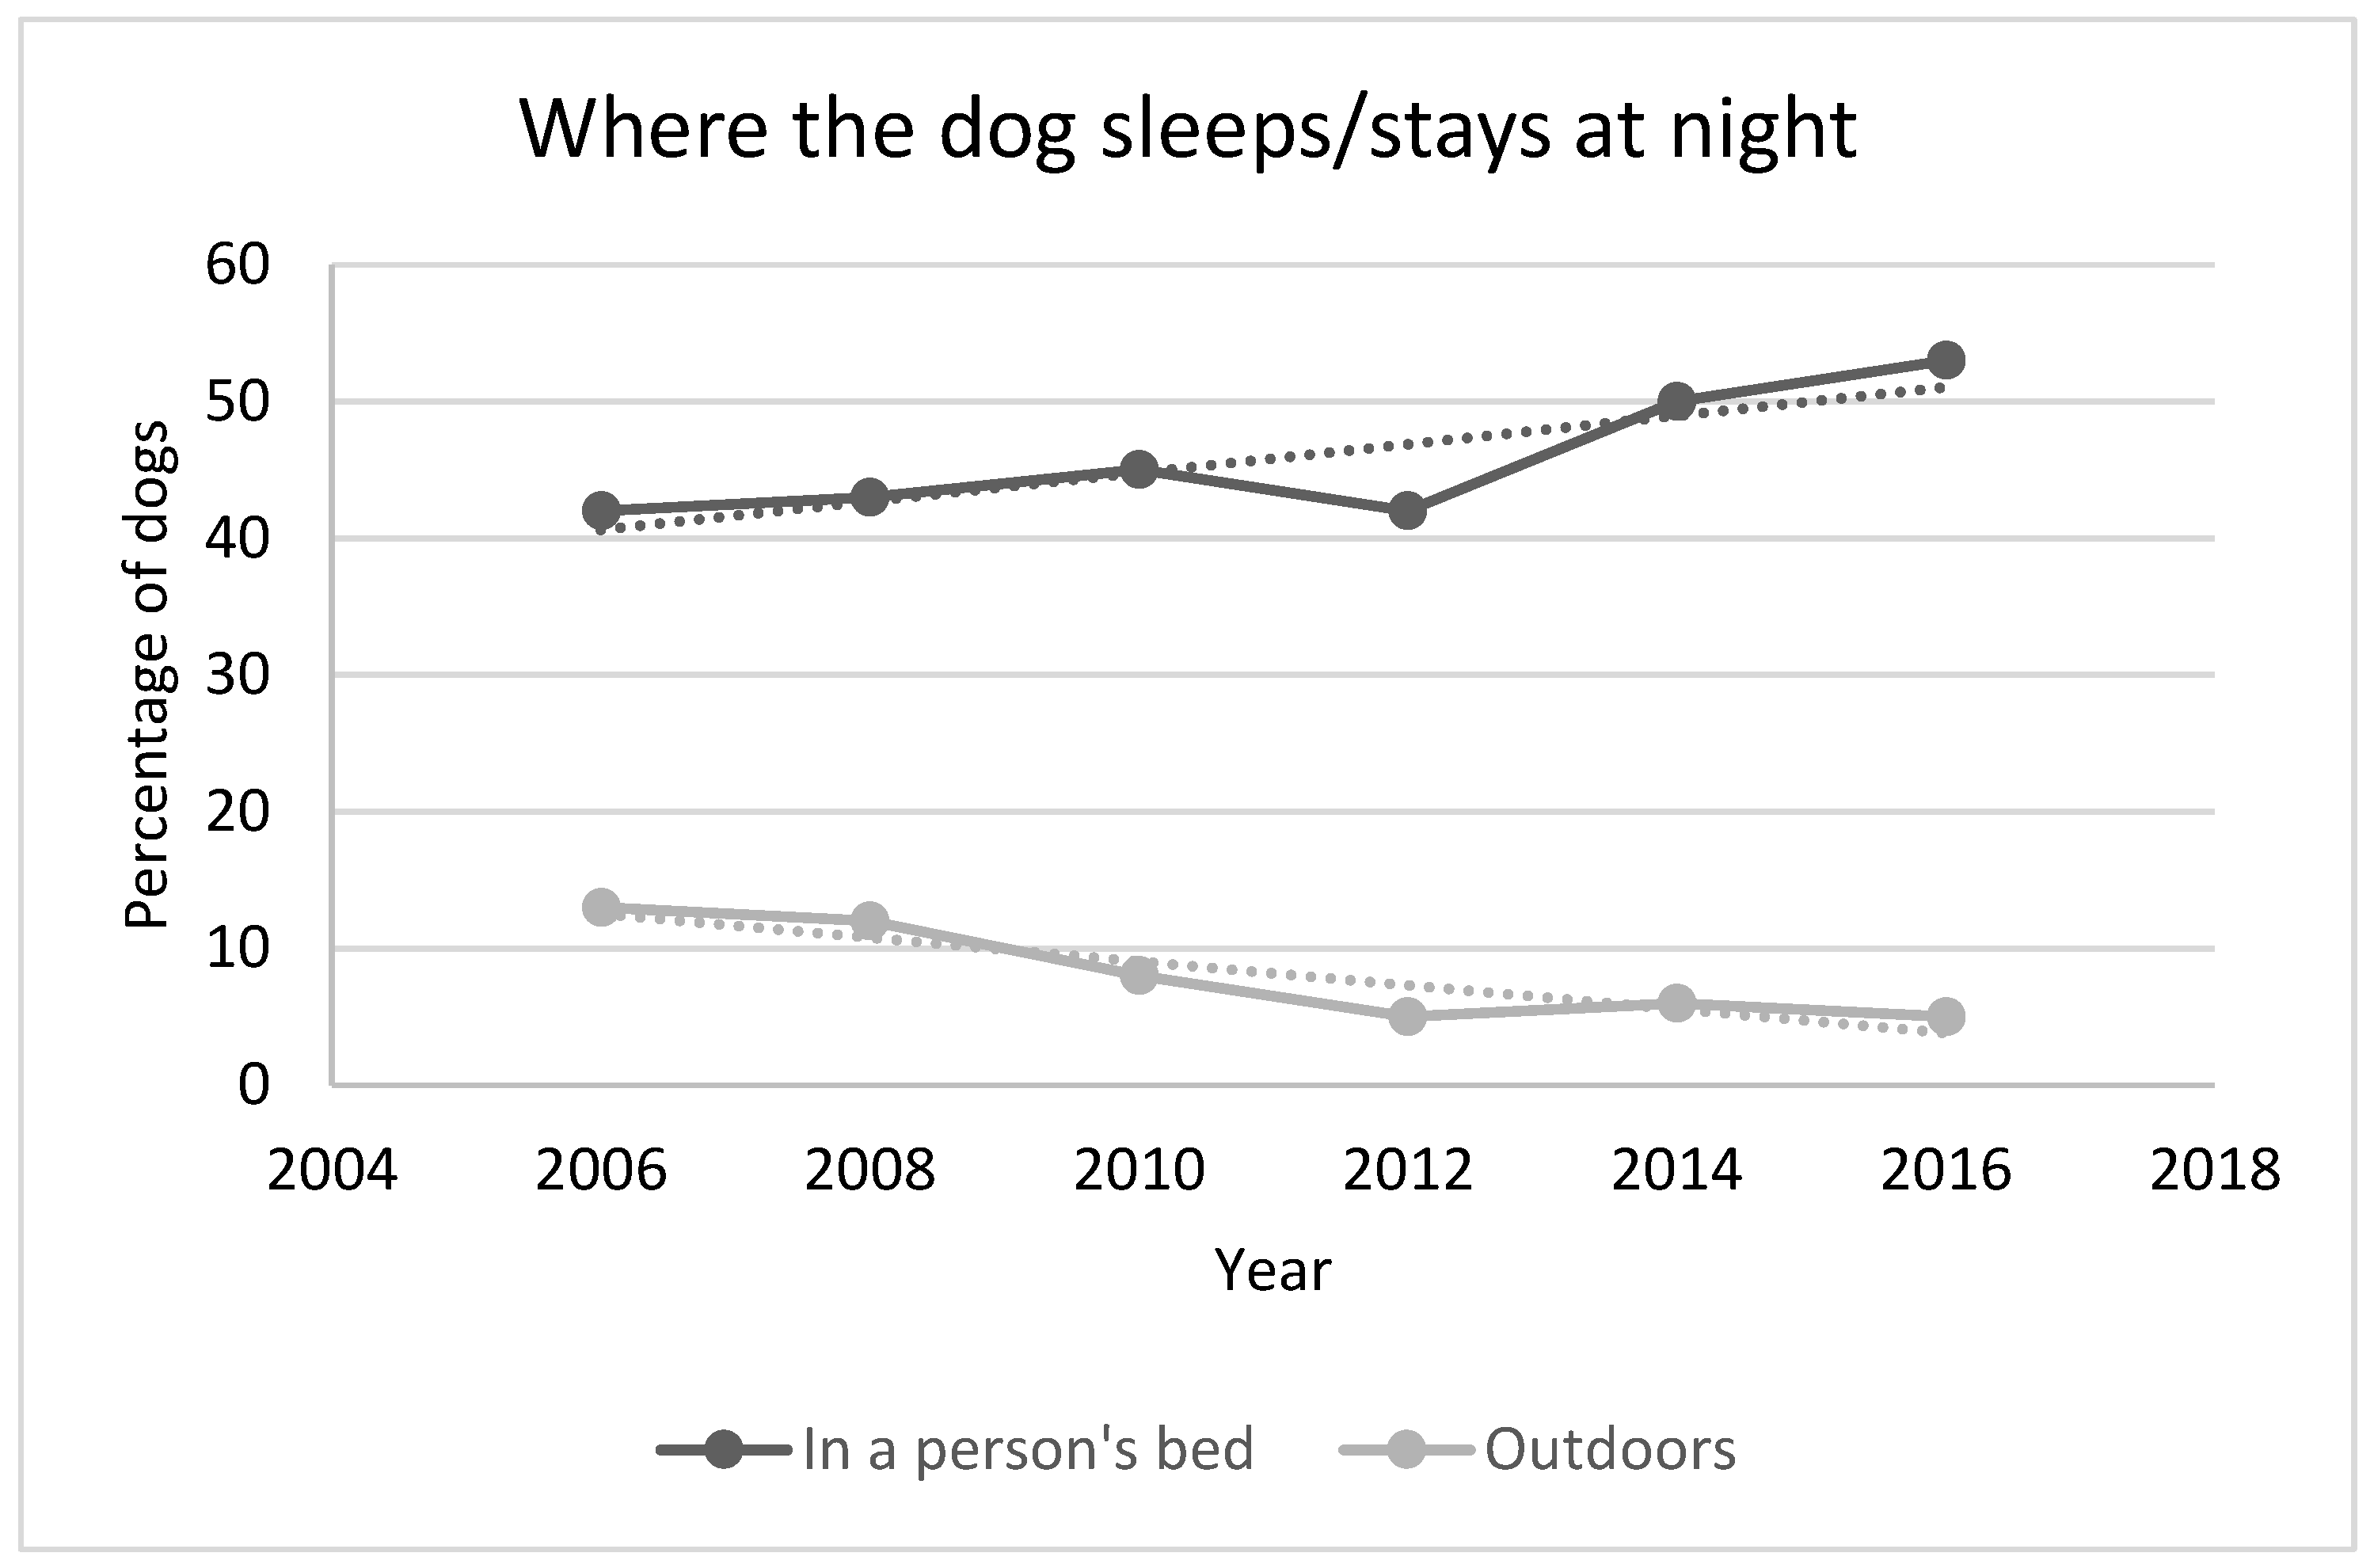
5. Responsible Pet Ownership Developments in the United States
6. Discussion
7. Conclusions
Supplementary Materials
Author Contributions
Acknowledgments
Conflicts of Interest
References
- Kay, A.; Coe, J.B.; Pearl, D.; Young, I. A scoping review of published research on the population dynamicsand control practices of companion animals. Prev. Vet. Med. 2017, 144, 40–52. [Google Scholar] [CrossRef]
- McCrea, R.C. The Humane Movement: A Descriptive Survey; RareBooksClub.com: Memphis, TN, USA, 1910; No. 179.3 M2. [Google Scholar]
- Chenoweth, R.J. The President’s Address at the Annual Banquet. November 1959. [Google Scholar]
- Rowan, A.N.; Williams, J. The success of companion animal management programs: a review. Anthrozoös 1987, 1, 110–122. [Google Scholar] [CrossRef]
- Marsh, P. Replacing Myth with Math: Using Evidence-Based Programs to Eradicate Shelter Overpopulation; Town and Country Reprographics, Incorporated: Concord, NH, USA, 2010. [Google Scholar]
- Feldmann, M. The problem of urban dogs. Science 1974, 185, 903. [Google Scholar] [CrossRef] [PubMed]
- Djerassi, C.; Israel, A.; Jochle, W. Planned parenthood for pets? Bull. Atom. Sci. 1973, 29, 10–19. [Google Scholar] [CrossRef]
- Unti, B.O. Protecting all Animals. A Fifty Year History of The Humane Society of the United States; Humane Society Press: Washington, DC, USA, 2004; ISBN 0-9658942-8-2. [Google Scholar]
- Mackie, M. High-Volume, Low-Cost Spay/Neuter Clinics. Available online: http://isaronline.org/programs/dog-and-cat-overpopulation/high-volume-low-cost-spayneuter-clinics/ (accessed on 27 March 2018).
- Rush, R.I. Letter to Phyllis Wright of the HSUS, Letter. 25 August 1981.
- Anonymous. LA Animal Services Woof Stat Report for February 2018. Available online: http://www.laanimalservices.com/pdf/reports/WoofStatReport.pdf (accessed on 27 March 2018).
- Rush, R.I. City of Los Angeles Animal Care and Control. In Animal Management and Population Control: What Progress Have We Made? Wilson, A.K., Rowan, A.N., Eds.; Tufts Center for Animals and Public Policy, N.: Grafton, MA, USA, 1985; pp. 55–58. [Google Scholar]
- Anonymous. LA Animal Services Statistical Reports 2007–2017 and from Annual Reports of Local Rabies Control Activities, California Department of Health and Human Services from 1997 to the Present. Available online: https://www.cdph.ca.gov/Programs/CID/DCDC/Pages/LocalRabiesControlActivities.aspx (accessed on 24 April 2018)(the reports for the years from 1997 to 2009 are no longer available on the website).
- Anonymous. Working Together to Make Los Angeles the Safest Big City in the U.S. for Our Pets; Annual Report 2005/6; Los Angeles Animals Services: Los Angeles, CA, USA, 2006. [Google Scholar]
- Anonymous. “Spay Clinics: Boon or Boondoggle?” Staff Report. Mod. Vet. Pract. 1973, 54, 23–29. [Google Scholar]
- Anonymous. “Spay Clinics: The Other Side of the Story”, Staff Report. Mod. Vet. Pract. 1973, 55, 23–29. [Google Scholar]
- McKee, D. An Analysis of the City of Los Angeles Pet Population and Attitudes towards Pet Adoption and Spay/Neuter; Humane America Animal Foundation: Los Angeles, CA, USA, 2000. [Google Scholar]
- Zawistowski, S.; Morris, J.; Salman, M.D.; Ruch-Gallie, R. Population dynamics, overpopulation, and the welfare of companion animals: New insights on old and new data. J. Appl. Anim. Welf. Sci. 1998, 1, 193–206. [Google Scholar] [CrossRef] [PubMed]
- Scarlett, J.M.; Salman, M.D.; New, J.C., Jr.; Kass, P.H. Reasons for relinquishment of companion animals in U.S. animal shelters: Selected health and personal issues. J. Appl. Anim. Welf. Sci. 1999, 2, 41–57. [Google Scholar] [CrossRef] [PubMed]
- Reed, D. Pet Overpopulation: Spay/Neuter Efforts Continue to Reduce Animal Births. Shelter Sense 1986, 9, 3. Available online: http://animalstudiesrepository.org/shesen/74 (accessed on 21 November 2017).
- Pets for Life Program. Available online: http://m.humanesociety.org/assets/pdfs/pets/pets-for-life/pfl-report-0214.pdf (accessed on 28 November 2017).
- Decker Sparks, J.L.; Camacho, B.; Tedeschi, P.; Morris, K.N. Race and ethnicity are not primary determinants in utilizing veterinary services in underserved communities in the United States. J. Appl. Anim. Welf. Sci. 2017, 1–10. [Google Scholar] [CrossRef] [PubMed]
- Humane Alliance. Available online: https://www.google.com/maps/d/u/0/viewer?ll=37.46014431961729%2C-97.18653599999999&spn=21.031657%2C54.12432&hl=en&msa=0&source=embed&ie=UTF8&mid=1Fb7POuZqChH8KrBDS_ZIE89BSHQ&z=3 (accessed on 28 November 2017).
- Morris, K.N.; Wolf, J.L.; Gies, D.L. Trends in intake and outcome data for animal shelters in Colorado, 2000 to 2007. J. Am. Vet. Med. Assoc. 2011, 238, 329–336. [Google Scholar] [CrossRef] [PubMed]
- Clancy, E.A.; Rowan, A.N. Companion Animal Demographics in the United States: A Historical Perspective, In the State of the Animals II; The Humane Society of the United States: Washington DC, USA, 2003. [Google Scholar]
- Clifton, M. Record Low Shelter Killing Raises Both Hopes & Questions. Available online: http://www.animals24-7.org/2014/11/14/record-low-shelter-killing-raises-both-hopes-questions/ (accessed on 30 October 2017).
- Pet Point. Industry Data. Available online: http://www.petpoint.com/industry_data.asp (accessed on 24 April 2018).
- Looney, A.L.; Bohling, M.W.; Bushby, P.A.; Howe, L.M.; Griffin, B.; Levy, J.K.; Eddlestone, S.M.; Weedon, J.R.; Appel, L.D.; Rigdon-Brestle, Y.K.; et al. The Association of Shelter Veterinarians veterinary medical care guidelines for spay-neuter programs. Vet. Med. Today Spe. Rep. JAVMA 2008, 233, 1. [Google Scholar] [CrossRef] [PubMed]
- Lau, E. New Company Aspires to Clean Up Pet Microchip Mess. Available online: http://news.vin.com/vinnews.aspx?articleid=13737 (accessed on 27 March 2018).
- Woodruff, K.A.; Smith, D.R. An Estimate of the Number of Dogs in US Shelters. In Proceedings of the NAVC Conference Small Animals Edition Volume 31, Orlando, FL, USA, 4–8 February 2017. [Google Scholar]
- Shelter Animals Count. Available online: https://shelteranimalscount.org/data/Explore-the-Data (accessed on 30 October 2017).
- United States Census Bureau. Available online: https://www.census.gov/2010census/ (accessed on 30 October 2017).
- American Veterinary Medical Association (AVMA). Pet Survey; American Veterinary Medical Association: Schaumburg, IL, USA, 2012. [Google Scholar]
- Secovich, S.J. Case Study: Companion Animal Over-Population Programs in New Jersey, New Hampshire, and Maine and a New Program for Maine. Master’s Thesis, Public Policy and Management, University of Southern Maine, Portland, ME, USA, 2003. [Google Scholar]
- Bartlett, P.C.; Bartlett, A.; Walshaw, S.; Halstead, S. Rates of euthanasia and adoption for dogs and cats in Michigan animal shelters. J. Appl. Anim. Welf. Sci. 2005, 8, 97–104. [Google Scholar] [CrossRef] [PubMed]
- Michigan Department of Agriculture and Rural Development. Animal shelter annual reports. Available online: http://www.michigan.gov/mdard/0,4610,7-125-1569_16979_21260-00.html (accessed on 15 October 2016).
- Lord, L.K.; Wittum, T.E.; Ferketich, A.K.; Funk, J.A.; Rajala-Schultz, P.; Kauffman, R.M. Demographic trends for animal care and control agencies in Ohio from 1996 to 2004. J. Am. Vet. Med. Assoc. 2006, 229, 48–54. [Google Scholar] [CrossRef] [PubMed]
- Schneider, R.; Vaida, M.L. Survey of canine and feline populations: Alameda and Contra Costa Counties, California, 1970. J. Am. Vet. Med. Assoc. 1975, 166, 481–486. [Google Scholar] [PubMed]
- Johnson, T.P.; Garrity, T.F.; Stallones, L. Psychometric evaluation of the Lexington attachment to pets scale (LAPS). Anthrozoös 1992, 5, 160–175. [Google Scholar] [CrossRef]
- American Pet Products Association (APPA). APPA National Pet Owner’s Survey; American Pet Products Association: Greenwich, CT, USA, 2017. [Google Scholar]
- US Department of Commerce. Available online: https://www.bea.gov/ (accessed on 30 October 2017).
- Shannon-Missal, L. More Than Ever, Pets are Members of the Family. Available online: http://www.theharrispoll.com/health-and-life/Pets-are-Members-of-the-Family.html (accessed on 30 October 2017).
- Patronek, G.; Zawistowski, S. The Value of Data. Editors’ introduction to Neidhart and Boyd. J. Appl. Anim. Welf. Sci. 2002, 5.3, 171–174. [Google Scholar] [CrossRef] [PubMed]
- Rowan, A.N. Shelters and Pet Overpopulation: A Statistical Black Hole. Anthrozoös 1992, 5.3, 140–143. [Google Scholar] [CrossRef]
- Marsh, P. Getting to Zero. 2012. Available online: http://www.shelteroverpopulation.org/Books/Getting_to_Zero.pdf (accessed on 30 December 2017).
- New, J.C., Jr.; Salman, M.D.; King, M.; Scarlett, J.M.; Kass, P.H.; Hutchinson, J.M. Characteristics of shelter-relinquished animals and their owners compared with animals and their owners in U.S. pet-owning households. J. Appl. Anim. Welf. Sci. 2000, 3, 179–201. [Google Scholar] [CrossRef]
- DiGiacomo, N.; Arluke, A.; Patronek, G. Surrendering pets to shelters: The relinquisher’s perspective. Anthrozoös 1998, 11, 41–51. [Google Scholar] [CrossRef]
- Salman, M.D.; New, J.C., Jr.; Scarlett, J.; Kass, P.; Ruch-Gallie, R.; Hetts, S. Human and animal factors related to the relinquishment of dogs and cats in 12 selected animal shelters in the United States. J. Appl. Anim. Welf. Sci. 1998, 1, 207–226. [Google Scholar] [CrossRef] [PubMed]
- Salman, M.D.; Hutchinson, J.; Ruch-Gallie, R.; Kogan, L.; New, J.C., Jr.; Kass, P.H.; Scarlett, J.M. Behavioral reasons for relinquishment of dogs and cats to 12 shelters. J. Appl. Anim. Welf. Sci. 2000, 3, 93–106. [Google Scholar] [CrossRef]


| Topics | Woodruff & Smith (2016) | PetPoint (2016) | ||
|---|---|---|---|---|
| Number | Total Number | Lower 95% | Upper 95% | |
| Shelters | 7076 | 6399 | 7890 | NA |
| Total Dogs Entering | 5,532,904 | 5,003,528 | 6,169,579 | 4,171,017 |
| Adopted Dogs | 2,628,112 | 2,376,660 | 2,930,531 | 2,302,829 |
| Dogs Returned to Owner | 969,443 | 876,689 | 1,080,998 | 591,375 |
| Dogs Transferred | 778,385 | 703,911 | 867,955 | 642,856 |
| Dogs Euthanized | 776,970 | 702,631 | 866,366 | 592,255 |
| State | Year | Dogs Euthanized in Shelters | Human Population (2010) | Dogs/1000 People (2011) | Dogs Euthanized per 1000 People | % of Pet Dogs in State Euthanized in Shelters |
|---|---|---|---|---|---|---|
| California | 2011 | 176,907 | 37,253,956 | 177 | 4.69 | 2.65% |
| Colorado | 2013 | 6968 | 5,029,196 | 264 | 1.36 | 0.52% |
| Delaware | 2011 | 2012 | 897,934 | 180 | 2.22 | 1.23% |
| Maine | 2012 | 644 | 1,328,361 | 226 | 0.48 | 0.21% |
| Maryland | 2011 | 10,477 | 5,773,552 | 157 | 1.8 | 1.15% |
| Michigan | 2013 | 22,909 | 9,883,640 | 206 | 2.32 | 1.13% |
| Nevada | 2011 | 14,679 | 2,700,551 | 212 | 5.39 | 2.54% |
| New Hampshire | 2012 | 346 | 1,316,470 | 161 | 0.26 | 0.16% |
| New Jersey | 2011 | 6023 | 8,791,894 | 152 | 0.68 | 0.45% |
| North Carolina | 2013 | 62,269 | 9,535,483 | 261 | 6.45 | 2.47% |
| Virginia | 2013 | 16,519 | 8,001,024 | 210 | 2.04 | 0.97% |
| Total for 11 States | 296,867 | 90,512,061 | 3.28 | |||
| Estimated USA Totals | 2010 | 1,723,039 | 309,350,000 | 225 | 5.57 | 2.48% |
| (from PetPoint & AVMA data) |
| Topic | 1996 | 2004 |
|---|---|---|
| Dogs Handled/1000 people | 19.14 | 15.59 |
| Dogs Euthanized/1000 people | 11.50 | 6.85 |
| Total Animals Handled/1000 people | 29.41 | 26.84 |
| Total Animals Euthanized/1000 people | 18.73 | 14.89 |
© 2018 by the authors. Licensee MDPI, Basel, Switzerland. This article is an open access article distributed under the terms and conditions of the Creative Commons Attribution (CC BY) license (http://creativecommons.org/licenses/by/4.0/).
Share and Cite
Rowan, A.; Kartal, T. Dog Population & Dog Sheltering Trends in the United States of America. Animals 2018, 8, 68. https://doi.org/10.3390/ani8050068
Rowan A, Kartal T. Dog Population & Dog Sheltering Trends in the United States of America. Animals. 2018; 8(5):68. https://doi.org/10.3390/ani8050068
Chicago/Turabian StyleRowan, Andrew, and Tamara Kartal. 2018. "Dog Population & Dog Sheltering Trends in the United States of America" Animals 8, no. 5: 68. https://doi.org/10.3390/ani8050068
APA StyleRowan, A., & Kartal, T. (2018). Dog Population & Dog Sheltering Trends in the United States of America. Animals, 8(5), 68. https://doi.org/10.3390/ani8050068