
The Impact of Rendered Protein Meal Oxidation Level on Shelf-Life, Sensory Characteristics, and Acceptability in Extruded Pet Food

Abstract
:Simple Summary
Abstract

1. Introduction
2. Materials and Methods
2.1. Rendered Protein Meal
2.2. Diet
2.3. Extrusion Process
2.4. Shelf Life
2.5. Descriptive Sensory Analysis
2.6. Consumer Acceptance
2.7. Data Analysis
3. Results
3.1. Descriptive Sensory Analysis
3.1.1. Beef Meat and Bone Meal (BMBM)
3.1.2. Chicken Byproduct Meal (CBPM)
3.2. Consumer Acceptance
3.2.1. Acceptability of Shelf-Life Samples
Beef Meat and Bone Meal (BMBM-O)
Chicken Byproduct Meal (CBPM-O)
3.2.2. Penalty Analysis
Beef Meat and Bone Meal (BMBM-O)
Chicken Byproduct Meal (CBPM-O)
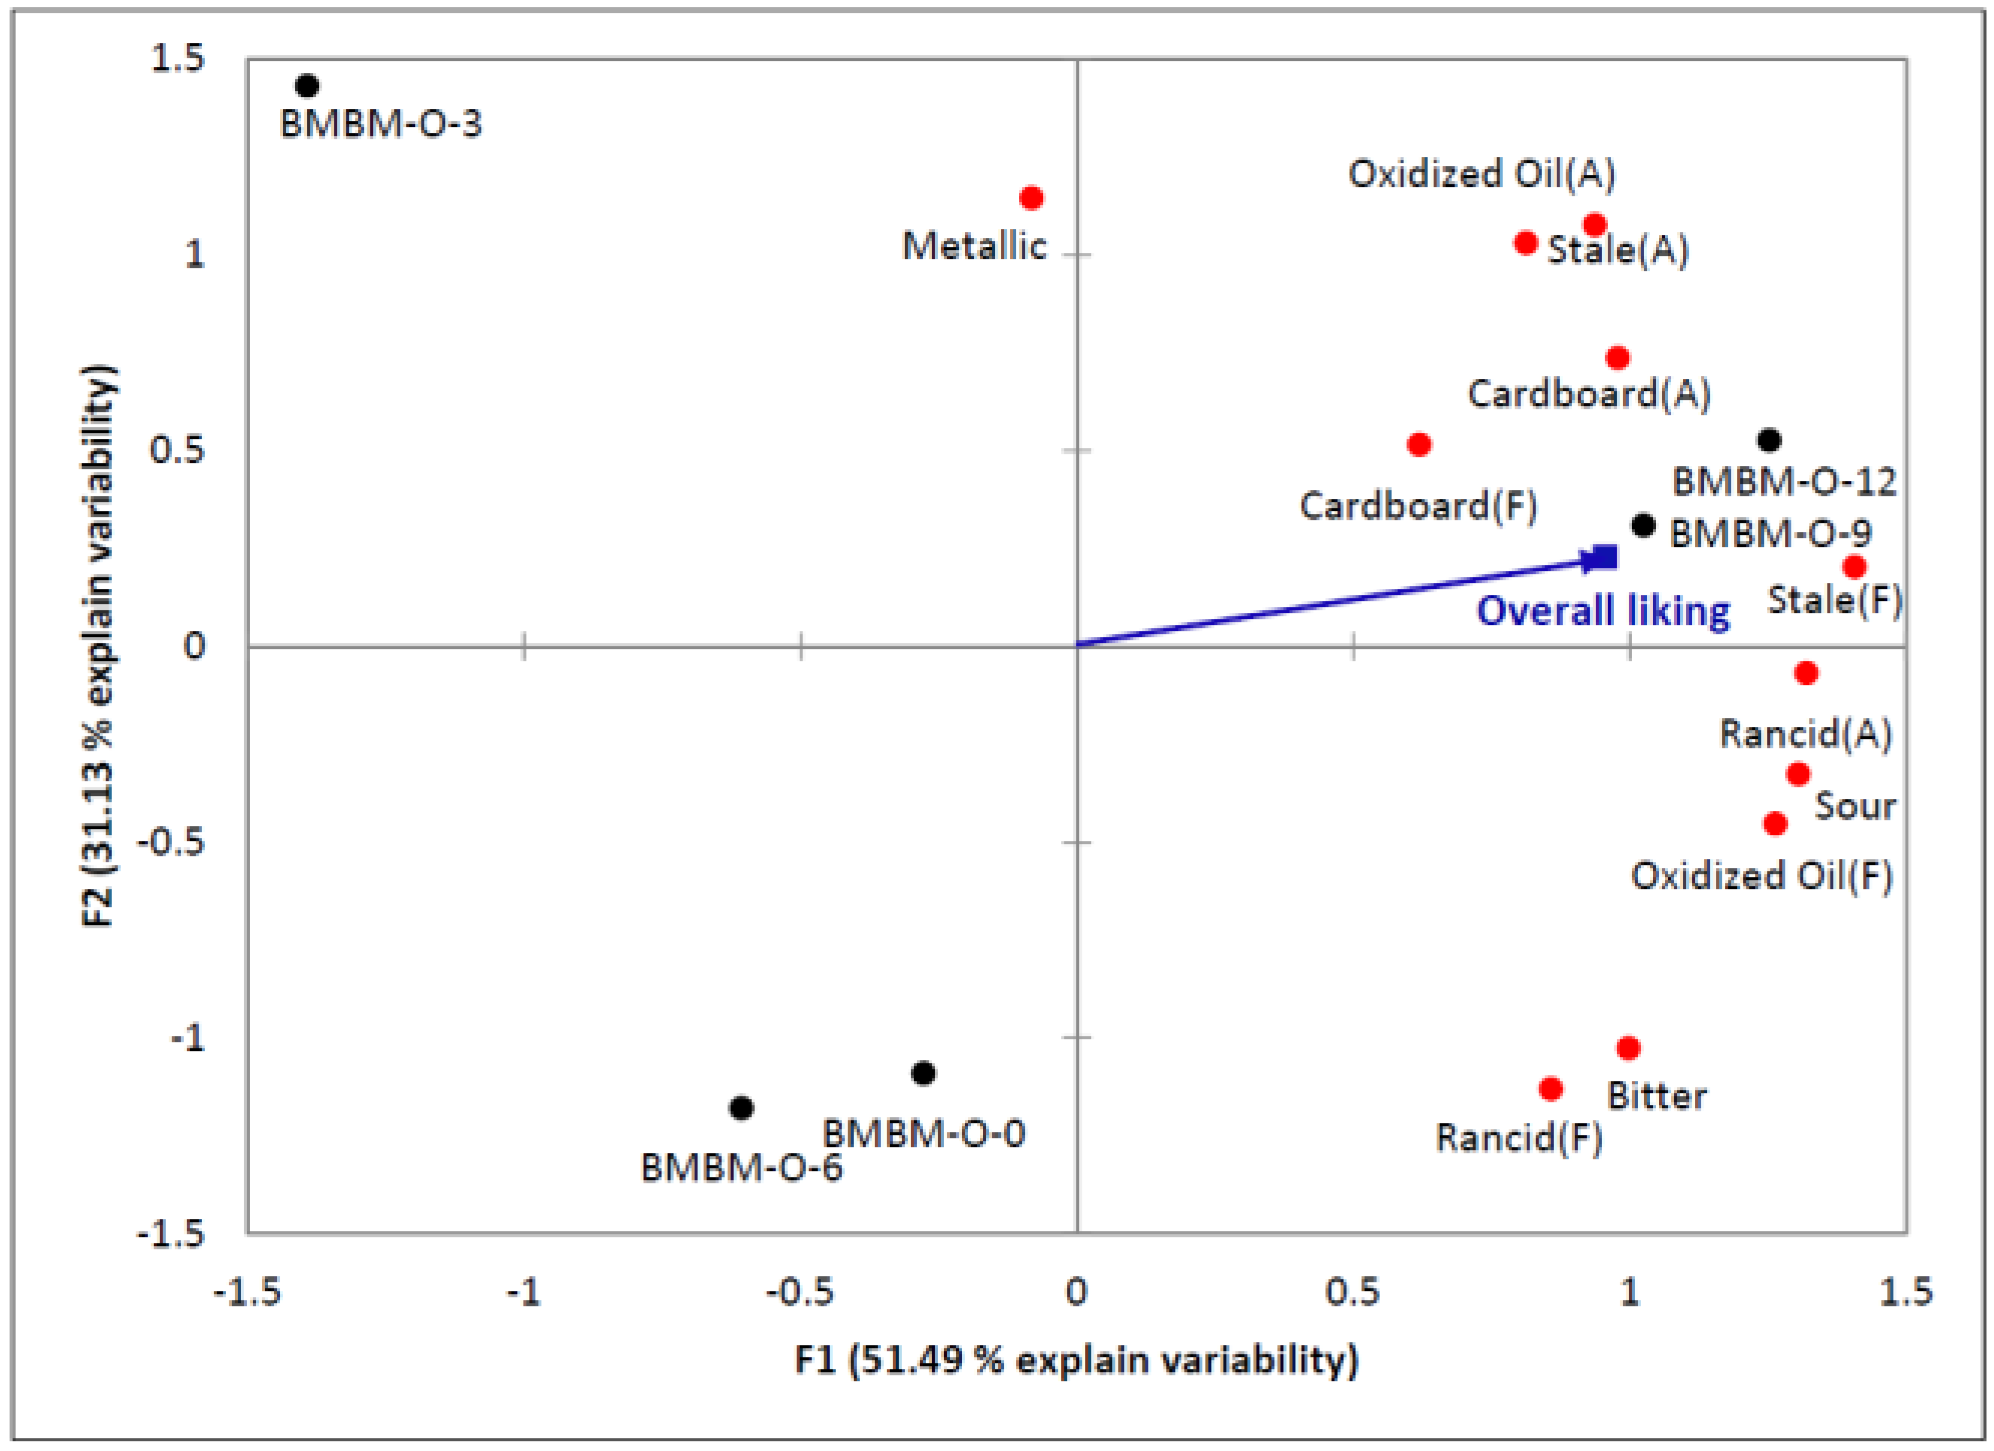
3.2.3. Drivers of Liking
Beef Meat and Bone Meal (BMBM-O)
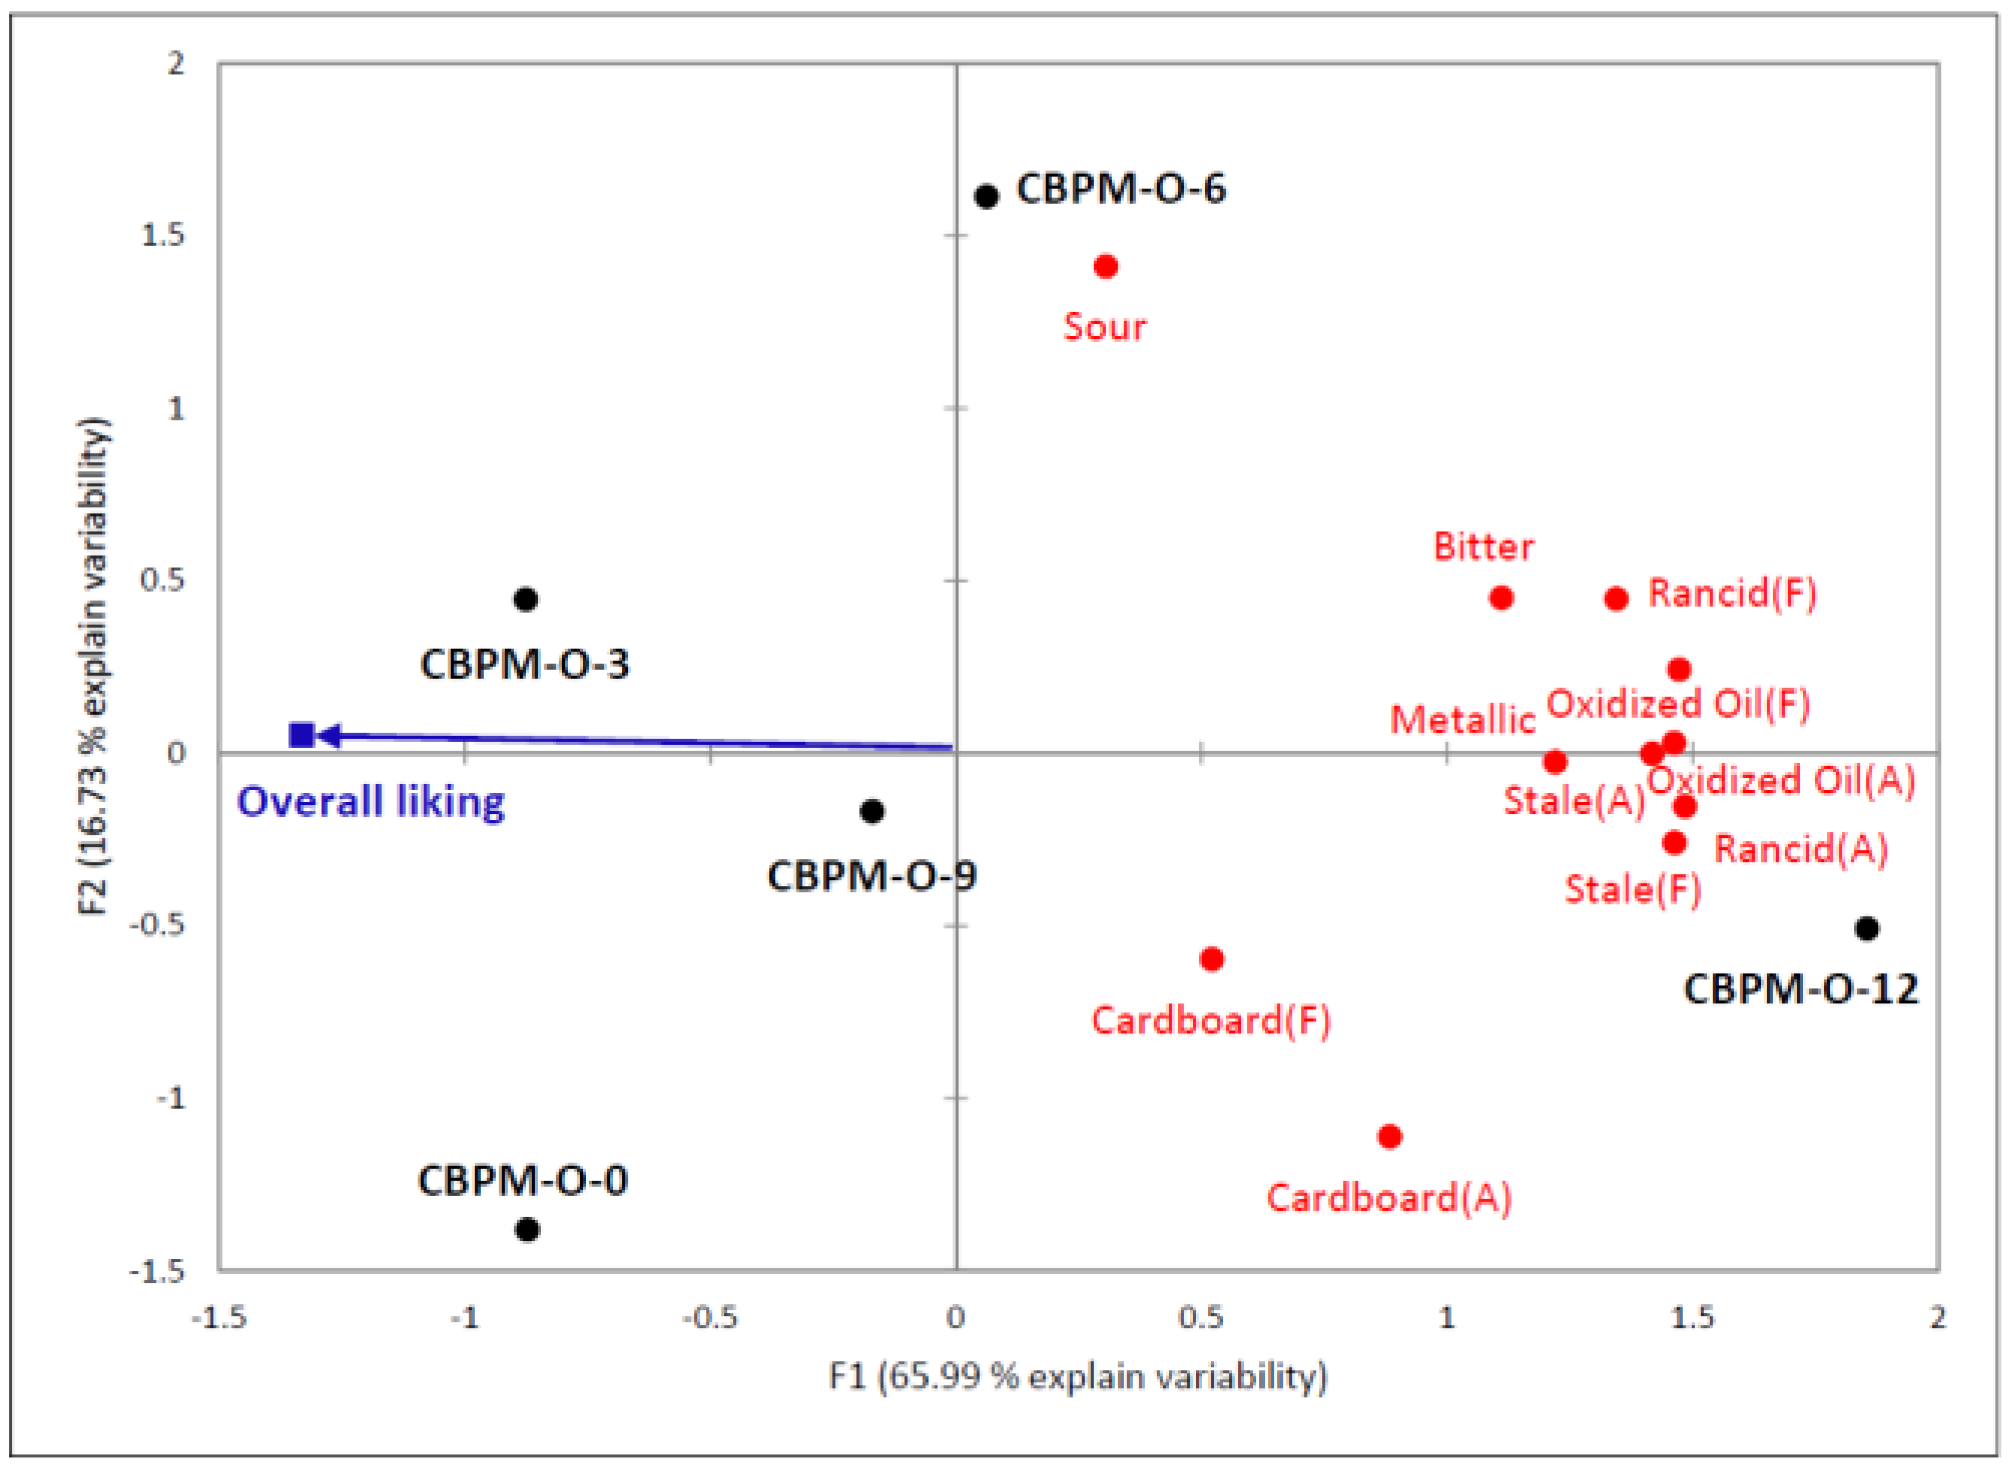
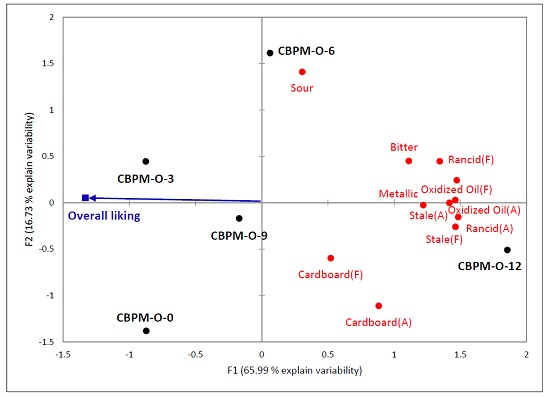
Chicken Byproduct Meal (CBPM-O)
4. Discussion
5. Conclusions
Acknowledgments
Author Contributions
Conflicts of Interest
References
- American Pet Products Association (APPA). Pet Industry Market Size and Ownership Statistics. 2015. Available online: http://www.americanpetproducts.org/press_industrytrends.asp (accessed on 28 December 2015).
- Aldrich, G. Rendered products in pet food. In Essential Rendering; Kirby Lithographic Company, Inc.: Arlington, VA, USA, 2006; pp. 159–177. [Google Scholar]
- Meeker, D.L.; Hamilton, C.R. An overview of the rendering industry. In Essential Rendering; Kirby Lithographic Company, Inc.: Arlington, VA, USA, 2006; pp. 1–16. [Google Scholar]
- Gross, K.L.; Bollinger, R.; Thawnghmung, P.; Collings, G.F. Effect of three different preservative systems on the stability of extruded dog food subjected to ambient and high temperature storage. J. Nutr. 1994, 124, 2638S–2642S. [Google Scholar] [PubMed]
- Jacobsen, C. Sensory impact of lipid oxidation in complex food systems. Eur. J. Lipid Sci. Technol. 1999, 101, 484–492. [Google Scholar] [CrossRef]
- Hilton, J.W. Antioxidants: Function, types, and necessity of inclusion in pet foods. Can. Vet. J. 1989, 30, 682–684. [Google Scholar] [PubMed]
- Gray, M. Evaluation of Oxidized Rendered Protein Meals in Pet Foods. Master’s Thesis, Kansas State University, Manhattan, KS, USA, 2015. [Google Scholar]
- Hough, G. Sensory Shelf Life Estimation of Food Products; CRC Press: Boca Raton, FL, USA, 2010; pp. 1–18. [Google Scholar]
- Lawless, T.H.; Heymann, H. Sensory Evaluation of Food: Principles and Practices, 2nd ed.; Springer: New York, NY, USA, 2010; pp. 424–425. [Google Scholar]
- Koppel, K. Sensory analysis of pet food. J. Sci. Food Agric. 2014, 94, 2148–2153. [Google Scholar] [CrossRef] [PubMed]
- Di Donfrancesco, B.; Koppel, K.; Chambers, E., IV. An initial lexicon for sensory properties of dry dog food. J. Sens. Stud. 2012, 27, 498–510. [Google Scholar] [CrossRef]
- Lin, S.; Hsieh, F.; Heymann, H.; Huff, H. Effects of lipids and processing conditions on the sensory characteristics of extruded dry pet food. J. Food Qual. 1998, 21, 265–284. [Google Scholar] [CrossRef]
- Pickering, G.J. Optimizing the sensory characteristics and acceptance of canned cat food: Use of a human taste panel. J. Anim. Physiol. Anim. Nutr. 2009, 93, 52–60. [Google Scholar] [CrossRef] [PubMed]
- Hootman, R.C. Manual on Descriptive Analysis Testing for Sensory Evaluation; ASTM: Philadelphia, PA, USA, 1992; pp. 1–9. [Google Scholar]
- Meilgaard, M.C.; Carr, B.T.; Civille, G.V. Sensory Evaluation Techniques, 5th ed.; CRC Press: Boca Raton, FL, USA, 2016; p. 172. [Google Scholar]
- Di Donfrancesco, B.; Koppel, K.; Swaney-Stueve, M.; Chambers, E., IV. Consumer acceptance of dry dog food variation. Animals 2014, 4, 313–330. [Google Scholar] [CrossRef] [PubMed]
- Koppel, K.; Gibson, M.; Alavi, S.; Aldrich, G. The effects of cooking process and meat inclusion on pet food flavor and texture characteristics. Animals 2014, 4, 254–271. [Google Scholar] [CrossRef] [PubMed]
- Koppel, K.; Monti, M.; Gibson, M.; Alavi, S.; Donfrancesco, B.D.; Carciofi, A.C. the effects of fiber inclusion on pet food sensory characteristics and palatability. Animals 2015, 5, 110–125. [Google Scholar] [CrossRef] [PubMed]
- Rousseau, B. Relating expert and consumer sensitivities. IFPress 2004, 7, 2–3. [Google Scholar]
- Chapman, K.W.; Whited, L.J.; Boor, K.J. Sensory threshold of light-oxidized flavor defects in milk. J. Food Sci. 2002, 67, 2770–2773. [Google Scholar] [CrossRef]

| Ingredient | BMBM Diet, % *** | CBPM Diet, % |
|---|---|---|
| Beef meat and bone meal | 51.37 | - |
| Chicken byproduct meal | - | 37.80 |
| Rice, Brewers | 14.38 | 18.92 |
| Corn | 14.38 | 18.92 |
| Wheat | 14.38 | 18.92 |
| Beet Pulp | 4.00 | 4.00 |
| Potassium Chloride | 0.40 | 0.40 |
| Monosodium Phosphate | 0.25 | - |
| Salt | 0.25 | 0.25 |
| Choline Chloride, 60% dry | 0.20 | 0.20 |
| Vitamin Premix * | 0.15 | 0.15 |
| Trace Mineral Premix ** | 0.10 | 0.10 |
| DL Methionine | - | 0.10 |
| Taurine | 0.05 | - |
| Nutrient Composition (as-is) | ||
| Moisture | 10.00 | 10.00 |
| Crude Protein | 30.00 | 30.00 |
| Crude Fat | 5.81 | 6.58 |
| Ash | 16.56 | 7.45 |
| Crude Fiber | 2.66 | 2.56 |
| Attribute | Definition | Reference |
|---|---|---|
| Oxidized oil | The aromatic associated with aged or highly used oil and fat. | Microwave Oven Heated Wesson vegetable oil = 6.0 (aroma), 6.0 (flavor). Preparation: Add 300 mL of oil from a newly purchased and opened bottle of Wesson vegetable oil to a 1000 mL glass beaker. Heat in the microwave oven on high power for 3 min. Remove from microwave and let sit at room temperature to cool for approximately 25 min. Then heat another 3 min, let cool another 25 min, and heat for one additional 3 min interval. Let beaker sit on counter uncovered overnight. Serve 1 tablespoon of the oil in a medium snifter, covered with a watch glass (aroma) and pour in a 30 mL cup (flavor). |
| Stale | The aromatic impression that is flat, dull and lacks freshness. | Mission tortilla white flour = 2.0 (aroma), 2.0 (flavor). Preparation: Serve 4 pieces of 1” square in a medium snifter (aroma), and a 100 mL cup (flavor). |
| Cardboard | The aromatic associated with cardboard or paper packaging. The intensity rating is only for the “cardboardy” character within the reference. | Mission tortilla white flour = 2.5 (aroma). Preparation: Serve 4 pieces of 1” square in a medium snifter and covered with a watch glass (aroma). Mama Mary’s Pizza Crust = 3.0 (flavor). Preparation: Serve 1 piece of 2” square in a 100 mL cup (flavor) Cardboard = 7.5 (aroma). Preparation: 2” cardboard square in ½ cup of water. Serve in a medium snifter and covered with a watch glass (aroma). |
| Rancid | A somewhat heavy aromatic characteristic of old, oxidized, decomposing fat and oil. The aromatics may include painty, varnish, or fishy. | Microwaved Wesson vegetable oil (4 min at high) = 2.5 (aroma), 3.0 (flavor). Preparation: microwave 1 ½ cups oil on high power for 4 min. Let cool and Serve ¼ cup in a snifter and covered with a watch glass (aroma), pour in a 30 mL cup (flavor). Microwaved Wesson vegetable oil (5 min at high) = 5.0 (aroma), 5.0 (flavor). Preparation: microwave 1 ½ cups oil on high power for 5 min. Let cool and Serve ¼ cup in a snifter and covered with a watch glass (aroma), pour in a 30 mL cup (flavor). |
| Sour | The fundamental taste factor associated with a citric acid solution. | 0.015% Citric Acid Solution = 1.5 0.050% Citric Acid Solution = 2.5 |
| Bitter | The fundamental taste factor associated with a caffeine solution. | 0.01% Caffeine Solution = 2.0 0.02% Caffeine Solution = 3.5 0.035 % Caffeine Solution = 5.0 |
| Metallic | An aromatic and mouth feel associated with tin cans or aluminum foil. | 0.10% Potassium Chloride Solution = 1.5 |
| Aroma Attribute | Storage Time (Month) | Antioxidant Treatment | p-Level 2 | ||||
|---|---|---|---|---|---|---|---|
| BMBM-O | BMBM-MT | BMBM-ET | Antioxidant (A) | Time (T) | A × T | ||
| Oxidized oil (n = 12) | 0 | 2.29 BC,3 ± 0.10 | 2.29 C ± 0.07 | 2.33 C ± 0.09 | 0.0211 | <0.0001 | 0.0329 |
| 3 | 2.42 AB,ab,4 ± 0.15 | 2.29 C,b ± 0.10 | 2.67 AB,a ± 0.07 | ||||
| 6 | 2.00 C ± 0.19 | 2.21 C ± 0.07 | 2.25 C ± 0.12 | ||||
| 9 | 2.46 AB ± 0.13 | 2.75 B ± 0.10 | 2.50 BC ± 0.06 | ||||
| 12 | 2.63 A,b ± 0.13 | 3.21 A,a ± 0.18 | 2.83 A,b ± 0.07 | ||||
| Stale (n = 12) | 0 | 2.04 B,b ± 0.11 | 2.13 B,b ± 0.09 | 2.42 B,a ± 0.06 | <0.0001 | 0.0008 | 0.0044 |
| 3 | 2.25 AB,b ± 0.10 | 2.29 AB,b ± 0.07 | 2.88 A,a ± 0.13 | ||||
| 6 | 2.04 B,b ± 0.20 | 2.29 AB,ab ± 0.10 | 2.46 B,a ± 0.11 | ||||
| 9 | 2.38 A ± 0.07 | 2.42 A ± 0.10 | 2.33 B ± 0.07 | ||||
| 12 | 2.42 A ± 0.08 | 2.54 A ± 0.10 | 2.46 B ± 0.07 | ||||
| Cardboard (n = 12) | 0 | 2.50 ± 0.06 | 2.54 B ± 0.04 | 2.71 B ± 0.07 | 0.1404 | 0.0301 | 0.0136 |
| 3 | 2.58 ± 0.08 | 2.71 AB ± 0.07 | 3.04 A ± 0.13 | ||||
| 6 | 2.58 ± 0.14 | 2.67 AB ± 0.11 | 2.50 B ± 0.11 | ||||
| 9 | 2.67 ± 0.13 | 2.71 AB ± 0.10 | 2.67 B ± 0.11 | ||||
| 12 | 2.67 ± 0.07 | 2.79 A ± 0.10 | 2.58 B ± 0.06 | ||||
| Rancid (n = 12) | 0 | 0.46 BC ± 0.17 | 0.17 C ± 0.11 | 0.08 C ± 0.08 | 0.9786 | <0.0001 | 0.0004 |
| 3 | 0.08 C ± 0.08 | 0.17 C ± 0.11 | 0.67 B ± 0.22 | ||||
| 6 | 0.33 BC ± 0.14 | 0.17 C ± 0.11 | 0.00 C ± 0.00 | ||||
| 9 | 1.04 A ± 0.25 | 0.92 B ± 0.24 | 0.79 B ± 0.23 | ||||
| 12 | 0.71 BC ± 0.22 | 1.63 A ± 0.31 | 1.33 A ± 0.20 | ||||
| Aroma Attribute | Storage Time (Month) | Antioxidant Treatment | p-Level 2 | ||||
|---|---|---|---|---|---|---|---|
| BMBM-O | BMBM-MT | BMBM-ET | Antioxidant (A) | Time (T) | A × T | ||
| Oxidized oil (n = 12) | 0 | 2.50 B,3 ± 0.09 | 2.46 B ± 0.10 | 2.42 B ± 0.08 | 0.6189 | <0.0001 | 0.0164 |
| 3 | 2.21 C ± 0.07 | 2.54 B ± 0.07 | 2.67 A ± 0.09 | ||||
| 6 | 2.50 B ± 0.12 | 2.38 B ± 0.09 | 2.38 B ± 0.09 | ||||
| 9 | 2.54 AB ± 0.10 | 2.42 B ± 0.08 | 2.54 AB ± 0.07 | ||||
| 12 | 2.75 A ± 0.12 | 2.79 A ± 0.07 | 2.75 A ± 0.12 | ||||
| Stale (n = 12) | 0 | 2.42 BC ± 0.08 | 2.25 B ± 0.08 | 2.29 C ± 0.07 | 0.0362 | 0.0027 | 0.0394 |
| 3 | 2.29 C,b,4 ± 0.10 | 2.25 B,b ± 0.08 | 2.63 A,a ± 0.11 | ||||
| 6 | 2.33 C ± 0.13 | 2.33 AB ± 0.07 | 2.38 BC ± 0.11 | ||||
| 9 | 2.58 AB ± 0.06 | 2.38 AB ± 0.11 | 2.50 ABC ± 0.06 | ||||
| 12 | 2.67 A ± 0.09 | 2.50 A ± 0.06 | 2.46 ABC ± 0.07 | ||||
| Cardboard (n = 12) | 0 | 2.67 ± 0.13 | 2.71 ± 0.07 | 2.79 ± 0.07 | 0.4397 | 0.3940 | 0.2088 |
| 3 | 2.71 ± 0.10 | 2.83 ± 0.07 | 3.00 ± 0.12 | ||||
| 6 | 2.63 ± 0.09 | 2.88 ± 0.11 | 2.67 ± 0.09 | ||||
| 9 | 2.92 ± 0.06 | 2.75 ± 0.10 | 2.71 ± 0.07 | ||||
| 12 | 2.67 ± 0.18 | 2.71 ± 0.11 | 2.79 ± 0.10 | ||||
| Rancid (n = 12) | 0 | 1.25 A ± 0.18 | 0.67 C ± 0.18 | 0.21 B ± 0.14 | 0.4879 | <0.0001 | <0.0001 |
| 3 | 0.17 B ± 0.11 | 0.42 C ± 0.15 | 0.50 B ± 0.23 | ||||
| 6 | 1.25 A ± 0.13 | 0.38 C ± 0.16 | 0.38 B ± 0.16 | ||||
| 9 | 1.04 A ± 0.25 | 1.13 B ± 0.27 | 1.67 A ± 0.14 | ||||
| 12 | 1.21 A ± 0.23 | 1.83 A ± 0.17 | 1.63 A ± 0.11 | ||||
| Sour (n = 12) | 0 | 1.54 ± 0.11 | 1.54 ± 0.13 | 1.50 ± 0.18 | 0.5611 | 0.6736 | 0.2243 |
| 3 | 1.46 ± 0.10 | 1.29 ± 0.21 | 1.54 ± 0.17 | ||||
| 6 | 1.50 ± 0.12 | 1.46 ± 0.14 | 1.38 ± 0.19 | ||||
| 9 | 1.54 ± 0.11 | 1.38 ± 0.16 | 1.63 ± 0.11 | ||||
| 12 | 1.58 ± 0.12 | 1.63 ± 0.09 | 1.33 ± 0.26 | ||||
| Bitter (n = 12) | 0 | 2.92 ± 0.20 | 2.79 ± 0.23 | 2.88 ± 0.29 | 0.1470 | 0.6056 | 0.8271 |
| 3 | 2.88 ± 0.25 | 2.96 ± 0.24 | 2.83 ± 0.26 | ||||
| 6 | 2.92 ± 0.24 | 2.83 ± 0.25 | 2.88 ± 0.28 | ||||
| 9 | 2.92 ± 0.24 | 2.79 ± 0.25 | 2.75 ± 0.27 | ||||
| 12 | 2.92 ± 0.24 | 2.71 ± 0.26 | 2.75 ± 0.26 | ||||
| Metallic (n = 12) | 0 | 1.17 ab ± 0.07 | 1.04 b ± 0.11 | 1.38 a ± 0.09 | 0.0412 | 0.1289 | 0.0032 |
| 3 | 1.38 a ± 0.09 | 0.88 b ± 0.20 | 1.29 a ± 0.07 | ||||
| 6 | 1.17 ± 0.13 | 0.92 ± 0.17 | 1.04 ± 0.17 | ||||
| 9 | 1.17 ± 0.13 | 1.17 ± 0.13 | 1.29 ± 0.07 | ||||
| 12 | 1.38 a ± 0.09 | 1.42 a ± 0.08 | 1.00 b ± 0.18 | ||||
| Aroma Attribute | Storage Time (Month) | Antioxidant Treatment | p-Level 2 | ||||
|---|---|---|---|---|---|---|---|
| CBPM-O | CBPM-MT | CBPM-ET | Antioxidant (A) | Time (T) | A × T | ||
| Oxidized oil (n = 12) | 0 | 2.29 C,3 ± 0.10 | 2.38 ± 0.14 | 2.25 ± 0.14 | <0.0001 | <0.0001 | <0.0001 |
| 3 | 2.50 BC ± 0.06 | 2.38 ± 0.09 | 2.13 ± 0.09 | ||||
| 6 | 2.88 B,a,4 ± 0.22 | 2.46 b ± 0.17 | 2.33 b ± 0.07 | ||||
| 9 | 2.50 BC ± 0.11 | 2.38 ± 0.13 | 2.13 ± 0.11 | ||||
| 12 | 4.13 A,a ± 0.29 | 2.50 b ± 0.14 | 2.17 b ± 0.15 | ||||
| Stale (n = 12) | 0 | 2.38 B,a ± 0.11 | 2.25 AB,ab ± 0.10 | 2.00 B,b ± 0.11 | <0.0001 | 0.0460 | 0.0528 |
| 3 | 2.33 B ± 0.07 | 2.46 A ± 0.07 | 2.29 A ± 0.11 | ||||
| 6 | 2.50 AB ± 0.11 | 2.33 AB ± 0.09 | 2.25 AB ± 0.08 | ||||
| 9 | 2.33 B ± 0.17 | 2.17 B ± 0.09 | 2.17 AB ± 0.07 | ||||
| 12 | 2.75 A,a ± 0.10 | 2.21 AB,b ± 0.10 | 2.21 AB,b ± 0.11 | ||||
| Cardboard (n = 12) | 0 | 2.75 a ± 0.16 | 2.54 ab ± 0.07 | 2.33 b ± 0.07 | 0.0014 | 0.7095 | 0.0739 |
| 3 | 2.54 ± 0.10 | 2.46 ± 0.10 | 2.38 ± 0.09 | ||||
| 6 | 2.54 ± 0.17 | 2.54 ± 0.10 | 2.50 ± 0.12 | ||||
| 9 | 2.58 ± 0.12 | 2.50 ± 0.11 | 2.63 ± 0.13 | ||||
| 12 | 2.83 a ± 0.09 | 2.42 b ± 0.08 | 2.21 b ± 0.10 | ||||
| Rancid (n = 12) | 0 | 0.33 C ± 0.19 | 0.63 ± 0.25 | 0.46 ± 0.25 | <0.0001 | <0.0001 | <0.0001 |
| 3 | 0.33 C ± 0.18 | 0.33 ± 0.18 | 0.58 ± 0.25 | ||||
| 6 | 1.17 B ± 0.36 | 0.83 ± 0.22 | 0.46 ± 0.20 | ||||
| 9 | 1.00 B ± 0.27 | 0.29 ± 0.22 | 0.50 ± 0.22 | ||||
| 12 | 4.21 A,a ± 0.55 | 0.71 b ± 0.22 | 0.88 b ± 0.27 | ||||
| Aroma Attribute | Storage Time (Month) | Antioxidant Treatment | p-Level 2 | ||||
|---|---|---|---|---|---|---|---|
| CBPM-O | CBPM-MT | CBPM-ET | Antioxidant (A) | Time (T) | A × T | ||
| Oxidized oil (n = 12) | 0 | 2.29 C,3 ± 0.13 | 2.50 ± 0.14 | 2.17 B ± 0.24 | <0.0001 | <0.0001 | <0.0001 |
| 3 | 2.54 C ± 0.13 | 2.42 ± 0.12 | 2.63 A ± 0.11 | ||||
| 6 | 3.08 B ± 0.14 | 2.75 ± 0.16 | 2.42 AB ± 0.18 | ||||
| 9 | 2.71 BC ± 0.14 | 2.50 ± 0.09 | 2.29 AB ± 0.10 | ||||
| 12 | 3.96 A,a,4 ± 0.26 | 2.75 b ± 0.18 | 2.46 AB,b ± 0.13 | ||||
| Stale (n = 12) | 0 | 2.33 B ± 0.09 | 2.38 ± 0.09 | 2.13 ± 0.13 | 0.0002 | 0.0338 | 0.1943 |
| 3 | 2.29 B ± 0.10 | 2.38 ± 0.14 | 2.25 ± 0.10 | ||||
| 6 | 2.42 B ± 0.10 | 2.50 ± 0.09 | 2.25 ± 0.08 | ||||
| 9 | 2.50 B ± 0.12 | 2.46 ± 0.11 | 2.29 ± 0.10 | ||||
| 12 | 2.83 A,a ± 0.17 | 2.50 b ± 0.09 | 2.21 c ± 0.10 | ||||
| Cardboard (n = 12) | 0 | 2.83 A,a ± 0.11 | 2.63 B,ab ± 0.09 | 2.38 B,b ± 0.09 | 0.0442 | 0.0046 | 0.1148 |
| 3 | 2.50 B ± 0.11 | 2.63 B ± 0.13 | 2.54 AB ± 0.11 | ||||
| 6 | 2.75 AB ± 0.12 | 2.96 A ± 0.10 | 2.75 A ± 0.08 | ||||
| 9 | 2.96 A,a ± 0.11 | 2.67 AB,b ± 0.11 | 2.75 A,ab ± 0.12 | ||||
| 12 | 2.83A ± 0.09 | 2.75 AB ± 0.08 | 2.67 A ± 0.14 | ||||
| Rancid (n = 12) | 0 | 1.04 C,b ± 0.19 | 1.88 A,a ± 0.15 | 0.79B BC,b ± 0.25 | <0.0001 | <0.0001 | <0.0001 |
| 3 | 1.58 C ± 0.27 | 1.17 B ± 0.30 | 1.25 AB ± 0.29 | ||||
| 6 | 2.83 B ± 0.23 | 1.92 A ± 0.10 | 1.00 ABC ± 0.29 | ||||
| 9 | 1.17 C ± 0.27 | 1.08 B ± 0.31 | 0.50 C ± 0.21 | ||||
| 12 | 3.92 A,a ± 0.20 | 1.13 B,b ± 0.31 | 1.50 A,b ± 0.31 | ||||
| Sour (n = 12) | 0 | 1.63 ± 0.13 | 1.75 ± 0.13 | 1.58 ± 0.17 | 0.1632 | 0.1806 | 0.7205 |
| 3 | 1.67 ± 0.13 | 1.54 ± 0.16 | 1.67 ± 0.15 | ||||
| 6 | 1.75 ± 0.17 | 1.79 ± 0.13 | 1.67 ± 0.13 | ||||
| 9 | 1.67 ± 0.20 | 1.58 ± 0.12 | 1.38 ± 0.19 | ||||
| 12 | 1.67 ± 0.15 | 1.58 ± 0.12 | 1.50 ± 0.22 | ||||
| Bitter (n = 12) | 0 | 2.92 ± 0.24 | 2.92 AB ± 0.29 | 3.00 ± 0.27 | 0.0556 | 0.0192 | 0.1458 |
| 3 | 2.92 ± 0.27 | 2.67 B ± 0.30 | 2.88 ± 0.27 | ||||
| 6 | 3.17 ± 0.25 | 3.13 A ± 0.20 | 2.92 ± 0.29 | ||||
| 9 | 3.21 ± 0.23 | 2.83 AB ± 0.32 | 3.08 ± 0.29 | ||||
| 12 | 3.21 ± 0.28 | 3.13 A ± 0.25 | 2.88 ± 0.23 | ||||
| Metallic (n = 12) | 0 | 0.92 B ± 0.20 | 1.00 AB ± 0.15 | 1.13 AB ± 0.16 | 0.5335 | 0.0055 | 0.3876 |
| 3 | 1.08A B ± 0.17 | 0.83 B ± 0.20 | 0.75 B ± 0.20 | ||||
| 6 | 1.04A B ± 0.16 | 1.25 A ± 0.14 | 1.21 A ± 0.13 | ||||
| 9 | 1.25 AB ± 0.16 | 1.00 AB ± 0.16 | 0.88 AB ± 0.20 | ||||
| 12 | 1.38 A ± 0.15 | 1.33 A ± 0.07 | 1.21 A ± 0.13 | ||||
| Demographic Information | Consumer (%) | |
| Gender | Female | 69.8% |
| Male | 30.2% | |
| Age | 18–24 | 9.4% |
| 25–34 | 18.9% | |
| 35–44 | 14.2% | |
| 45–54 | 24.5% | |
| 55–64 | 29.2% | |
| 65 or older | 3.8% | |
| Education | Some school but no degree | 1.9% |
| High school degree | 2.8% | |
| Some college but no degree | 18.9% | |
| College degree | 46.2% | |
| Graduate/Professional school degree | 30.2% | |
| Household Income (USD) | Less than 25,000 | 5.7% |
| 25,000–50,000 | 29.2% | |
| 51,000–100,000 | 47.2% | |
| Over 100,000 | 17.9% | |
| Pet owner | Dog | 58.4 |
| Cat | 20.8 | |
| Both Dog and Cat | 20.8 | |
| Dog’s breed type | Purebred | 50.0 |
| Mixed Breed | 41.7 | |
| Both | 8.3 | |
| Cat’s breed type | Purebred | 4.5 |
| Mixed Breed | 91.0 | |
| Both | 4.5 | |
| Storage and Feeding Behavior | Consumer (%) | |
| Method for storing dry pet food | Airtight containers | 49.1% |
| In the original packaging LEFT OPEN to the air | 13.2% | |
| In the original packaging RESEALED | 34.9% | |
| Other | 2.8% | |
| Time for finishing a package of dry pet food | 1 month | 68.9% |
| 1 week | 13.2% | |
| 3 months | 16.0% | |
| 6 months | 1.9% | |
| Money spending on pet food per month | Less than $100 | 86.8% |
| $100–$300 | 13.2% | |
| Sample | Time Point (Month) | Overall Liking | Appearance Liking | Aroma Liking |
|---|---|---|---|---|
| BMBM-O | 0 | 4.97 ± 0.18 | 4.66 ± 0.18 | 5.08 ± 0.18 |
| 3 | 4.81 ± 0.18 | 4.47 ± 0.18 | 5.05 ± 0.17 | |
| 6 | 4.73 ± 0.19 | 4.61 ± 0.18 | 4.99 ± 0.17 | |
| 9 | 4.87 ± 0.18 | 4.67 ± 0.18 | 5.22 ± 0.18 | |
| 12 | 5.13 ± 0.18 | 4.92 ± 0.19 | 5.29 ± 0.17 | |
| p-level 4 | 0.5227 | 0.4398 | 0.7108 | |
| CBPM-O | 0 | 5.52 a,5 ± 0.16 | 5.42 ± 0.15 | 5.53 a ± 0.17 |
| 3 | 5.39 a ± 0.16 | 5.23 ± 0.17 | 5.35 ab ± 0.16 | |
| 6 | 5.32 a ± 0.17 | 5.23 ± 0.16 | 5.22 ab ± 0.17 | |
| 9 | 5.24 a ± 0.18 | 5.25 ± 0.16 | 5.01 bc ± 0.19 | |
| 12 | 4.95 b ± 0.17 | 5.05 ± 0.15 | 4.79 c ± 0.20 | |
| p-level 2 | 0.0013 | 0.0797 | 0.0004 |
| Sample | Level | Frequencies | Consumer (%) | Mean Drops | p-Value 4 |
|---|---|---|---|---|---|
| BMBM-O | Too little | 44 | 41.51% | 0.685 | 0.048 |
| JAR 3 | 45 | 42.45% | |||
| Too much | 17 | 16.04% | 2.139 | ||
| CBPM-O | Too little | 28 | 26.42% | 0.536 | 0.240 |
| JAR | 56 | 52.83% | |||
| Too much | 22 | 20.75% | 1.166 | 0.020 |
© 2016 by the authors; licensee MDPI, Basel, Switzerland. This article is an open access article distributed under the terms and conditions of the Creative Commons Attribution (CC-BY) license (http://creativecommons.org/licenses/by/4.0/).
Share and Cite
Chanadang, S.; Koppel, K.; Aldrich, G. The Impact of Rendered Protein Meal Oxidation Level on Shelf-Life, Sensory Characteristics, and Acceptability in Extruded Pet Food. Animals 2016, 6, 44. https://doi.org/10.3390/ani6080044
Chanadang S, Koppel K, Aldrich G. The Impact of Rendered Protein Meal Oxidation Level on Shelf-Life, Sensory Characteristics, and Acceptability in Extruded Pet Food. Animals. 2016; 6(8):44. https://doi.org/10.3390/ani6080044
Chicago/Turabian StyleChanadang, Sirichat, Kadri Koppel, and Greg Aldrich. 2016. "The Impact of Rendered Protein Meal Oxidation Level on Shelf-Life, Sensory Characteristics, and Acceptability in Extruded Pet Food" Animals 6, no. 8: 44. https://doi.org/10.3390/ani6080044
APA StyleChanadang, S., Koppel, K., & Aldrich, G. (2016). The Impact of Rendered Protein Meal Oxidation Level on Shelf-Life, Sensory Characteristics, and Acceptability in Extruded Pet Food. Animals, 6(8), 44. https://doi.org/10.3390/ani6080044