3.1. Sample Collection Success
Sample collections failed to achieve 100% success (
Table 1). Overall, the ARG system had a greater number of sample losses than the NZL system (23
vs. 4). For example, for the 10-day sample collection duration, collections were fully successful for the NZL system, whereas the ARG system had only 9 out 16 acceptable samples, with one cow losing both the duplicate samples. In all cases the sample losses for the NZL system were due to blockage of the sample flow restrictors by water. In addition to blockage of flow restrictors by water, sample losses within the ARG system were due to excess vacuum loss from sample containers, a fact most likely resulting from the imposed experimental conditions (extension of sample line). During the fourth day of sampling, the eight daily samples of the ARG system were lost because the cylinders were not switched on (human error). The number of lost samples for the ARG system due to water blockage, excess vacuum loss and human error were 5, 10 and 8, respectively.
Table 1.
Number of possible (maximum number) and successful samples obtained using the Argentinean modified system (ARG) and New Zealand modified system (NZL) sample collection apparatuses, each involving three simultaneous sample collection periods (daily, 5-day and 10-day).
Table 1.
Number of possible (maximum number) and successful samples obtained using the Argentinean modified system (ARG) and New Zealand modified system (NZL) sample collection apparatuses, each involving three simultaneous sample collection periods (daily, 5-day and 10-day).
| | Daily | 5-Day | 10-Day | Total samples |
|---|
| | all | Days 1–5 | Days 6–10 | all | all |
|---|
| Maximum | 80 | 8 | 8 | 16 | 16 | 112 |
| ARG successful | 67 | 7 | 6 | 13 | 9 | 89 |
| NZL successful | 78 | 7 | 8 | 15 | 16 | 108 |
In this study, blockage of the sample flow restrictor with water occurred with both systems, but it was slightly more for the ARG system than for the NZL system. In the ARG system, the location of the flow restrictor with respect to the point source of sample (animal’s nostrils) could have had a major influence in blockages. In contrast to the NZL system where the flow restrictor (a capillary) was located away from the sample inlet, the flow restrictor in the ARG system was at the sampling point,
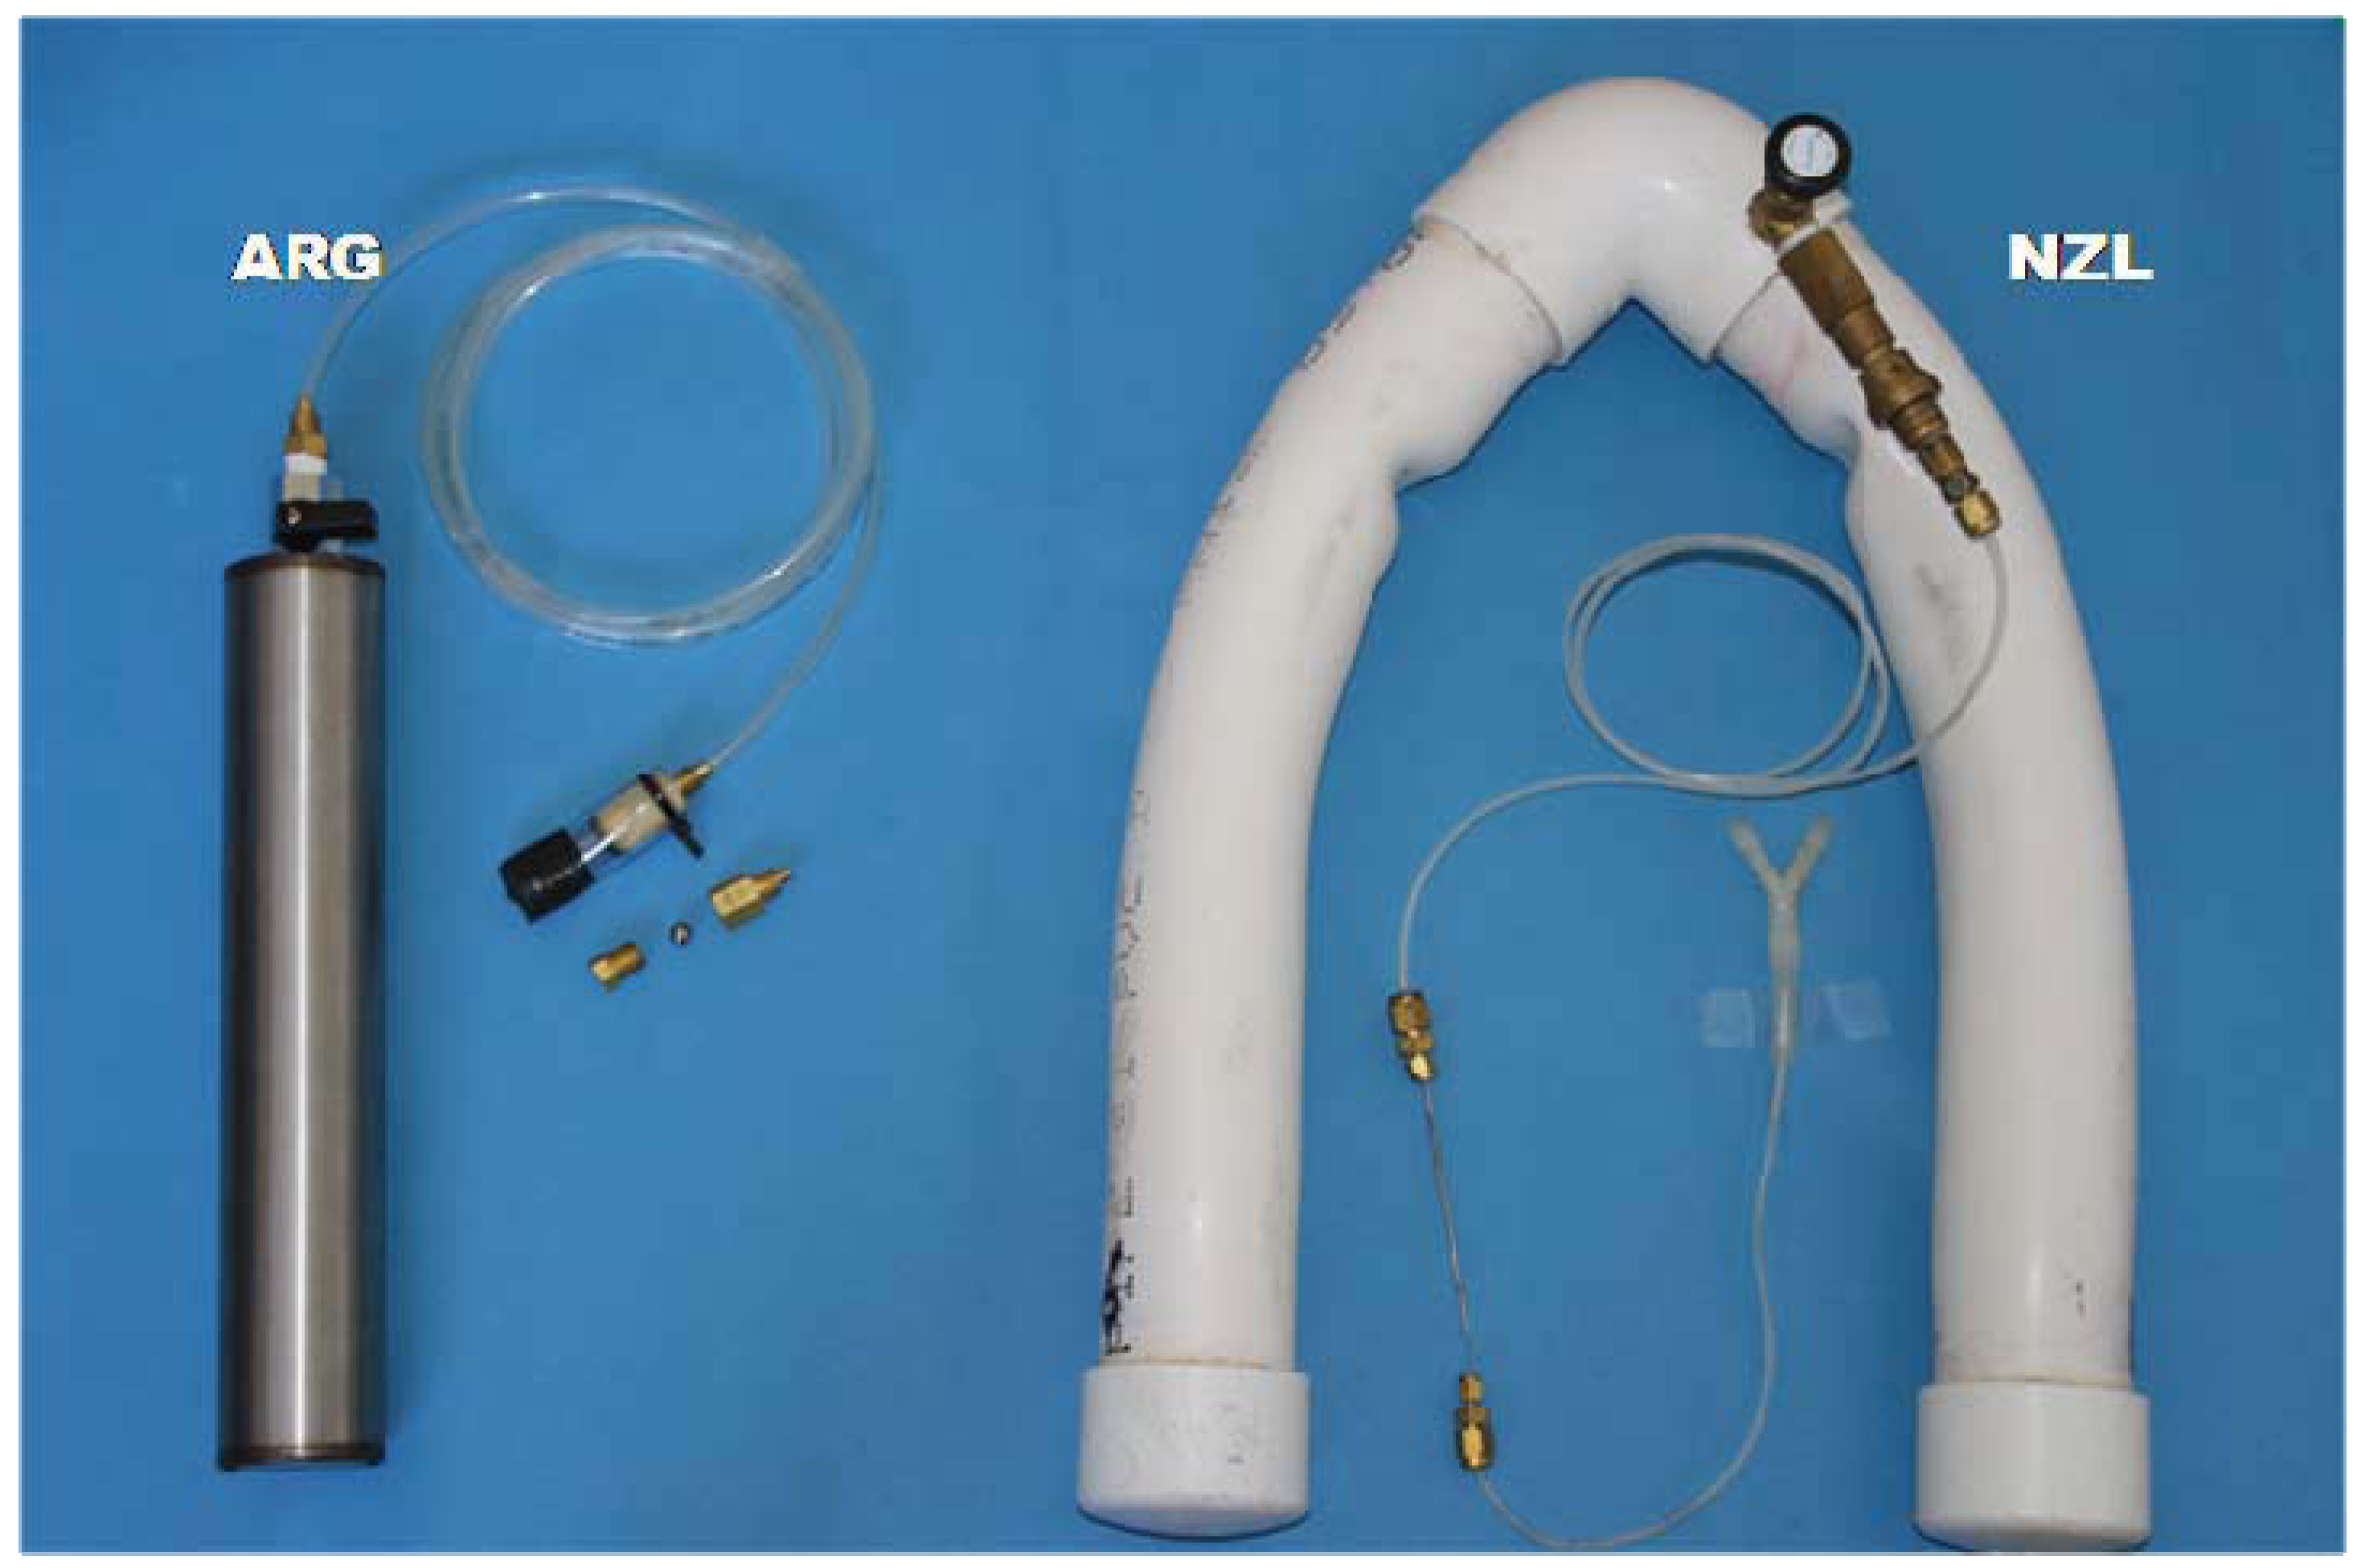
i.e., the flow restrictor constituted the inlet of the sample. Thus, the ARG system was more at risk of blockage by drinking water reaching the sample entrance. Most importantly, water blockage in the ARG system seemed to be triggered by condensation of breath moisture into the metal components of the flow restriction assembly. The ARG system uses a flow restrictor that is an assembly of a brass body housing a stainless steel ball (
Figure 3).
Excess loss of vacuum from containers (i.e., residual pressure in container equal to atmosphere) in the ARG system occurred in the extended sample collection periods (mostly the 10-day sampling), and this was despite the proper calibration of the desired flow rate of the sample. The likely reason for this phenomenon was the location of the flow restrictor with respect to the sample collection container. In fact, pressure inside the 5 m flexible tube (1/4'' o.d.) was sub-atmospheric and hence prone to air leakage from outside. Leakage may have been facilitated by twisting of the sample line and torsion of line joins due to animal movements. Small leakage events may have become significant over the extended sample collection period and hence contributed to exhaustion of vacuum. In addition, physical contacts of the flow restrictors (close to animal nostrils) to the feeding bins (during feeding times) may have gradually loosened the flow restriction assembly. In contrast, in the NZL system the sample restrictor was well protected and away from the nostrils of the animals and the smaller diameter tube extension was well protected from leakages. The ARG and NZL systems fundamentally differ in the nature of their sample flow restrictors and findings from this study cannot be extrapolated to grazing conditions, especially when sample collection duration is extended.
3.2. Mean Estimates of Methane Emission and Between-Animal and Within-Animal Variability of Estimates
The mean concentrations (by volume) of CH
4 and SF
6 in the background air samples (
Table 2) were within the range reported in the literature [
11], suggesting that the building was appropriately ventilated. The mean concentrations (by volume) of CH
4 and SF
6 in breath samples found in this study were 57 ppm and 240 ppt, respectively.
Table 2.
Mean (±standard deviation) concentrations (by volume) of methane (CH4, ppm) and sulphur hexafluoride (SF6, ppt) in the background air samples collected using the ARG and NZL sample collection apparatuses involving three simultaneous sample collection periods (daily, 5-day and 10-day). There was only one background sample for the 10-day sample duration.
| | Daily | 5-Day | 10-Day |
|---|
| | CH4 | SF6 | CH4 | SF6 | CH4 | SF6 |
|---|
| ARG | 3.07 ± 0.71 | 11.56 ± 2.91 | 3.72 ± 0.62 | 12.63 ± 0.45 | 2.69 | 10.40 |
| NZL | 3.59 ± 0.56 | 12.49 ± 1.95 | 3.44 ± 0.27 | 13.26 ± 0.88 | 3.38 | 12.81 |
Within the ARG sample collection system, the mean emission estimate from daily samplings was significantly higher (
P < 0.05) than the estimates from the extended sample collections (5-day and 10-day) (
Table 3), whereas the extended sample collections (5-day and 10-day) did not differ from each other in their emission estimates (
P > 0.05). In contrast, for the NZL system, the sample collections did not differ (
P > 0.05) in their CH
4 emission estimates (
Table 3). No differences (
P > 0.05) were found between ARG and NZL sample collection systems for their CH
4 emission estimates when compared within particular collection periods, with the exception that the ARG 5-day estimate was smaller (
P < 0.05) than that for NZL 5-day. The mean CH
4 emission estimates for the ARG and NZL systems were 106 ± 10.7 and 111 ± 13.2 g d
−1, respectively. These mean emission estimates equalled CH
4 yields of 16.5 ± 1.7 and 17.4 ± 2.0 g kg
−1 DMI for the ARG and NZL systems, respectively; values similar to that reported (17.7 g kg
−1 DMI) from a previous study using similar feed [
12]. Dry matter intake (6.40 kg d
−1) was common for all the cows throughout the experiment.
Table 3.
Mean (±standard deviation) estimates of methane emission and between-animal and within-animal variances for methane emissions using the ARG and NZL sample collection apparatuses involving three simultaneous sample collection periods (daily, 5-day and 10-day).
Table 3.
Mean (±standard deviation) estimates of methane emission and between-animal and within-animal variances for methane emissions using the ARG and NZL sample collection apparatuses involving three simultaneous sample collection periods (daily, 5-day and 10-day).
| | ARG system | NZL system |
|---|
| | Daily (1–10) | 5-day (1–5 and 6–10) | 10-day (1–10) | Daily (1–10) | 5-day (1–5 and 6–10) | 10-day (1–10) |
|---|
| Mean emission (g d−1) | 113.8 ± 7.4 a | 102.1 ± 9.1 b | 104.1 ± 12.5 b | 114.2 ± 13.0 a | 110.0 ± 12.8 a | 111.3 ± 13.5 a |
| Between-animal variance | 39.1 | n.d. | n.d. | 162.1 | n.d. | 172.8 |
| Within-animal variance | 136.1 | 81.7 | 132.5 | 78.5 | 188.8 | 20.7 |
Table 3 also shows the between-animal and within-animal variance for the CH
4 emission estimates. Sample collection losses for the 5-day sampling scheme within both the ARG and NZL systems (ARG 5-day and NZL 5-day) and also for the 10-day collection within the ARG system (ARG 10-day) precluded estimation of between-cow variances. The ARG daily sample collection (ARG daily) yielded the lowest between-cow variance. Both the NZL daily and the NZL 10-day samplings yielded similar between-animal variances. The NZL 5-day and the NZL 10-day sample collections yielded the highest and lowest within-animal variances, respectively (
Table 3).
Objectives of this study were to evaluate the effects of extended sample collections (5-day and 10-day), as well as of sample collection apparatuses (ARG vs. NZL) on CH4 emission estimates by the SF6 tracer technique. It was expected that the mean CH4 emission estimates would not differ either between the sample collection systems (ARG and NZL) or among the sample collection periods (daily, 5-day and 10-day) within sample collection systems. The above was based on the assumption that the average CH4/SF6 concentrations in samples would be similar across the sample collection systems and sample collection periods. Overall, the mean CH4 emissions estimates of the ARG and NZL systems were only numerically different, whereas when collection systems were compared within sample collection periods, the ARG 5-day collection yielded smaller CH4 emission estimates than the NZL 5-day. Reasons for the latter are unknown. If during extended sample collection period the sub-atmospheric internal pressure in the sampling line had favoured slow dilution of the sample by air leaking into the ARG collection canister through the tube connectors, its effect on emission estimates could only be exerted when the CH4/SF6 ratio of concentrations in the air leaking in, was significantly different from that in the sample inlet.
The NZL system yielded a very high sampling success; hence evaluation of effects of sample collection duration on the mean CH
4 emission estimates focuses on this system only. Within this system, the three sample collection periods yielded similar CH
4 emission estimates, with the largest numerical difference of 4.2 g d
−1 (
i.e., 3.8%) observed between NZL daily and NZL 5-day collection periods. Further, when data for the NZL 5-day was split into the corresponding two collection periods (
i.e., days 1−5 and days 6−10), their mean CH
4 emission estimates (108 and 112 g d
−1, respectively) did not differ (
P > 0.05) from the estimates based on daily samplings carried out over the same periods (113 and 116 g d
−1, respectively). Thus, under the controlled conditions of this study, the extended sample collections (5-day and 10-day) proved to yield CH
4 emission estimates similar to that from the repeated daily sample collections. The high coefficients of correlation among sample collection periods (
Table 4) support the consistency of the relationships. Observations within the NZL system suggest that extended sample collection may be an alternative to the daily sampling protocol, whereas the lack of success of the ARG system for a similar outcome may be due to some pitfalls in the sampling process arising from the assembly of the flow restrictor and extended sample line (5 m of a 1/4"o.d. tube), which was imposed by the experimental requirements.
Table 4.
Coefficients of correlation (probability value in italics) between mean CH4 emission estimates from daily, 5-day and 10-day sample collection periods. Analysis carried out separately for the ARG and NZL sample collection apparatuses.
Table 4.
Coefficients of correlation (probability value in italics) between mean CH4 emission estimates from daily, 5-day and 10-day sample collection periods. Analysis carried out separately for the ARG and NZL sample collection apparatuses.
| | ARG system | NZL system |
|---|
| | Daily (1–10) | 5-day (1–5 and 6–10) | 10-day (1–10) | Daily (1–10) | 5-day (1–5 and 6–10) | 10-day (1–10) |
|---|
| Daily | 1.00 | | | 1.00 | | |
| | 0.00 | | | 0.00 | | |
| 5-day | 0.67 | 1.00 | | 0.95 | 1.00 | |
| | 0.07 | 0.00 | | <0.001 | 0.00 | |
| 10-day | 0.86 | 0.86 | 1.00 | 0.98 | 0.96 | 1.00 |
| | 0.01 | 0.01 | 0.00 | <0.001 | <0.001 | 0.00 |
It was also expected from this study that between-animal variances would not differ between sample collection systems (ARG and NZL) or between collection periods, but within-animal variances would decrease with extended sample collection duration. Although sample losses precluded thorough interpretation, it seems that within the NZL system, the between-animal variance of the daily samplings was similar to that of the 10-day samplings. It has been suggested [
7] that time-averaging of variation of CH
4 and SF
6 mixing ratios at the sampling point (animal’s nostrils) due to micro-meteorological and particular behaviours of tracer and tracee gases would reduce variation of emission estimates when the sampling period is extended. This, however, could not be fully tested in this study as extended sample collections were not repeated enough times;
i.e., there were only two values for the 5-day sampling and duplicate samples for the 10-day sampling compared to ten values for the daily sampling. Similarly, comparisons of within-animal variances between similar collection periods (e.g., ARG daily
vs. NZL daily) were not possible due to the confounding effects of dissimilar sample losses between the systems (ARG
vs. NZL).
Studies carried out by Murray
et al. [
13] in sheep found that most (87%) of the enteric CH
4 production was accounted for by rumen fermentation and that almost all (95%) of the ruminal CH
4 was eructed, whereas about 89% of the hindgut CH
4 production was absorbed and excreted through the lungs together with the absorbed ruminal CH
4. Since the majority (70−99%) of the eructed gases are first inhaled into the lungs, and then expired along with respiratory gases [
14,
15,
16] and provided that eructated and respired gases are well mixed before expiration, the SF
6 tracer technique should account for about 98% of the total production of CH
4. Given that the cows in this study had a common fixed feed intake across sampling systems and sampling periods, it was expected that the mean CH
4 emission estimates should not differ significantly across sampling systems or sampling periods. The results in
Table 3 show that mean CH
4 emissions as measured by the NZL system during daily, 5-day and 10-day collection periods and by the ARG system as measured by daily collection periods, were not different.
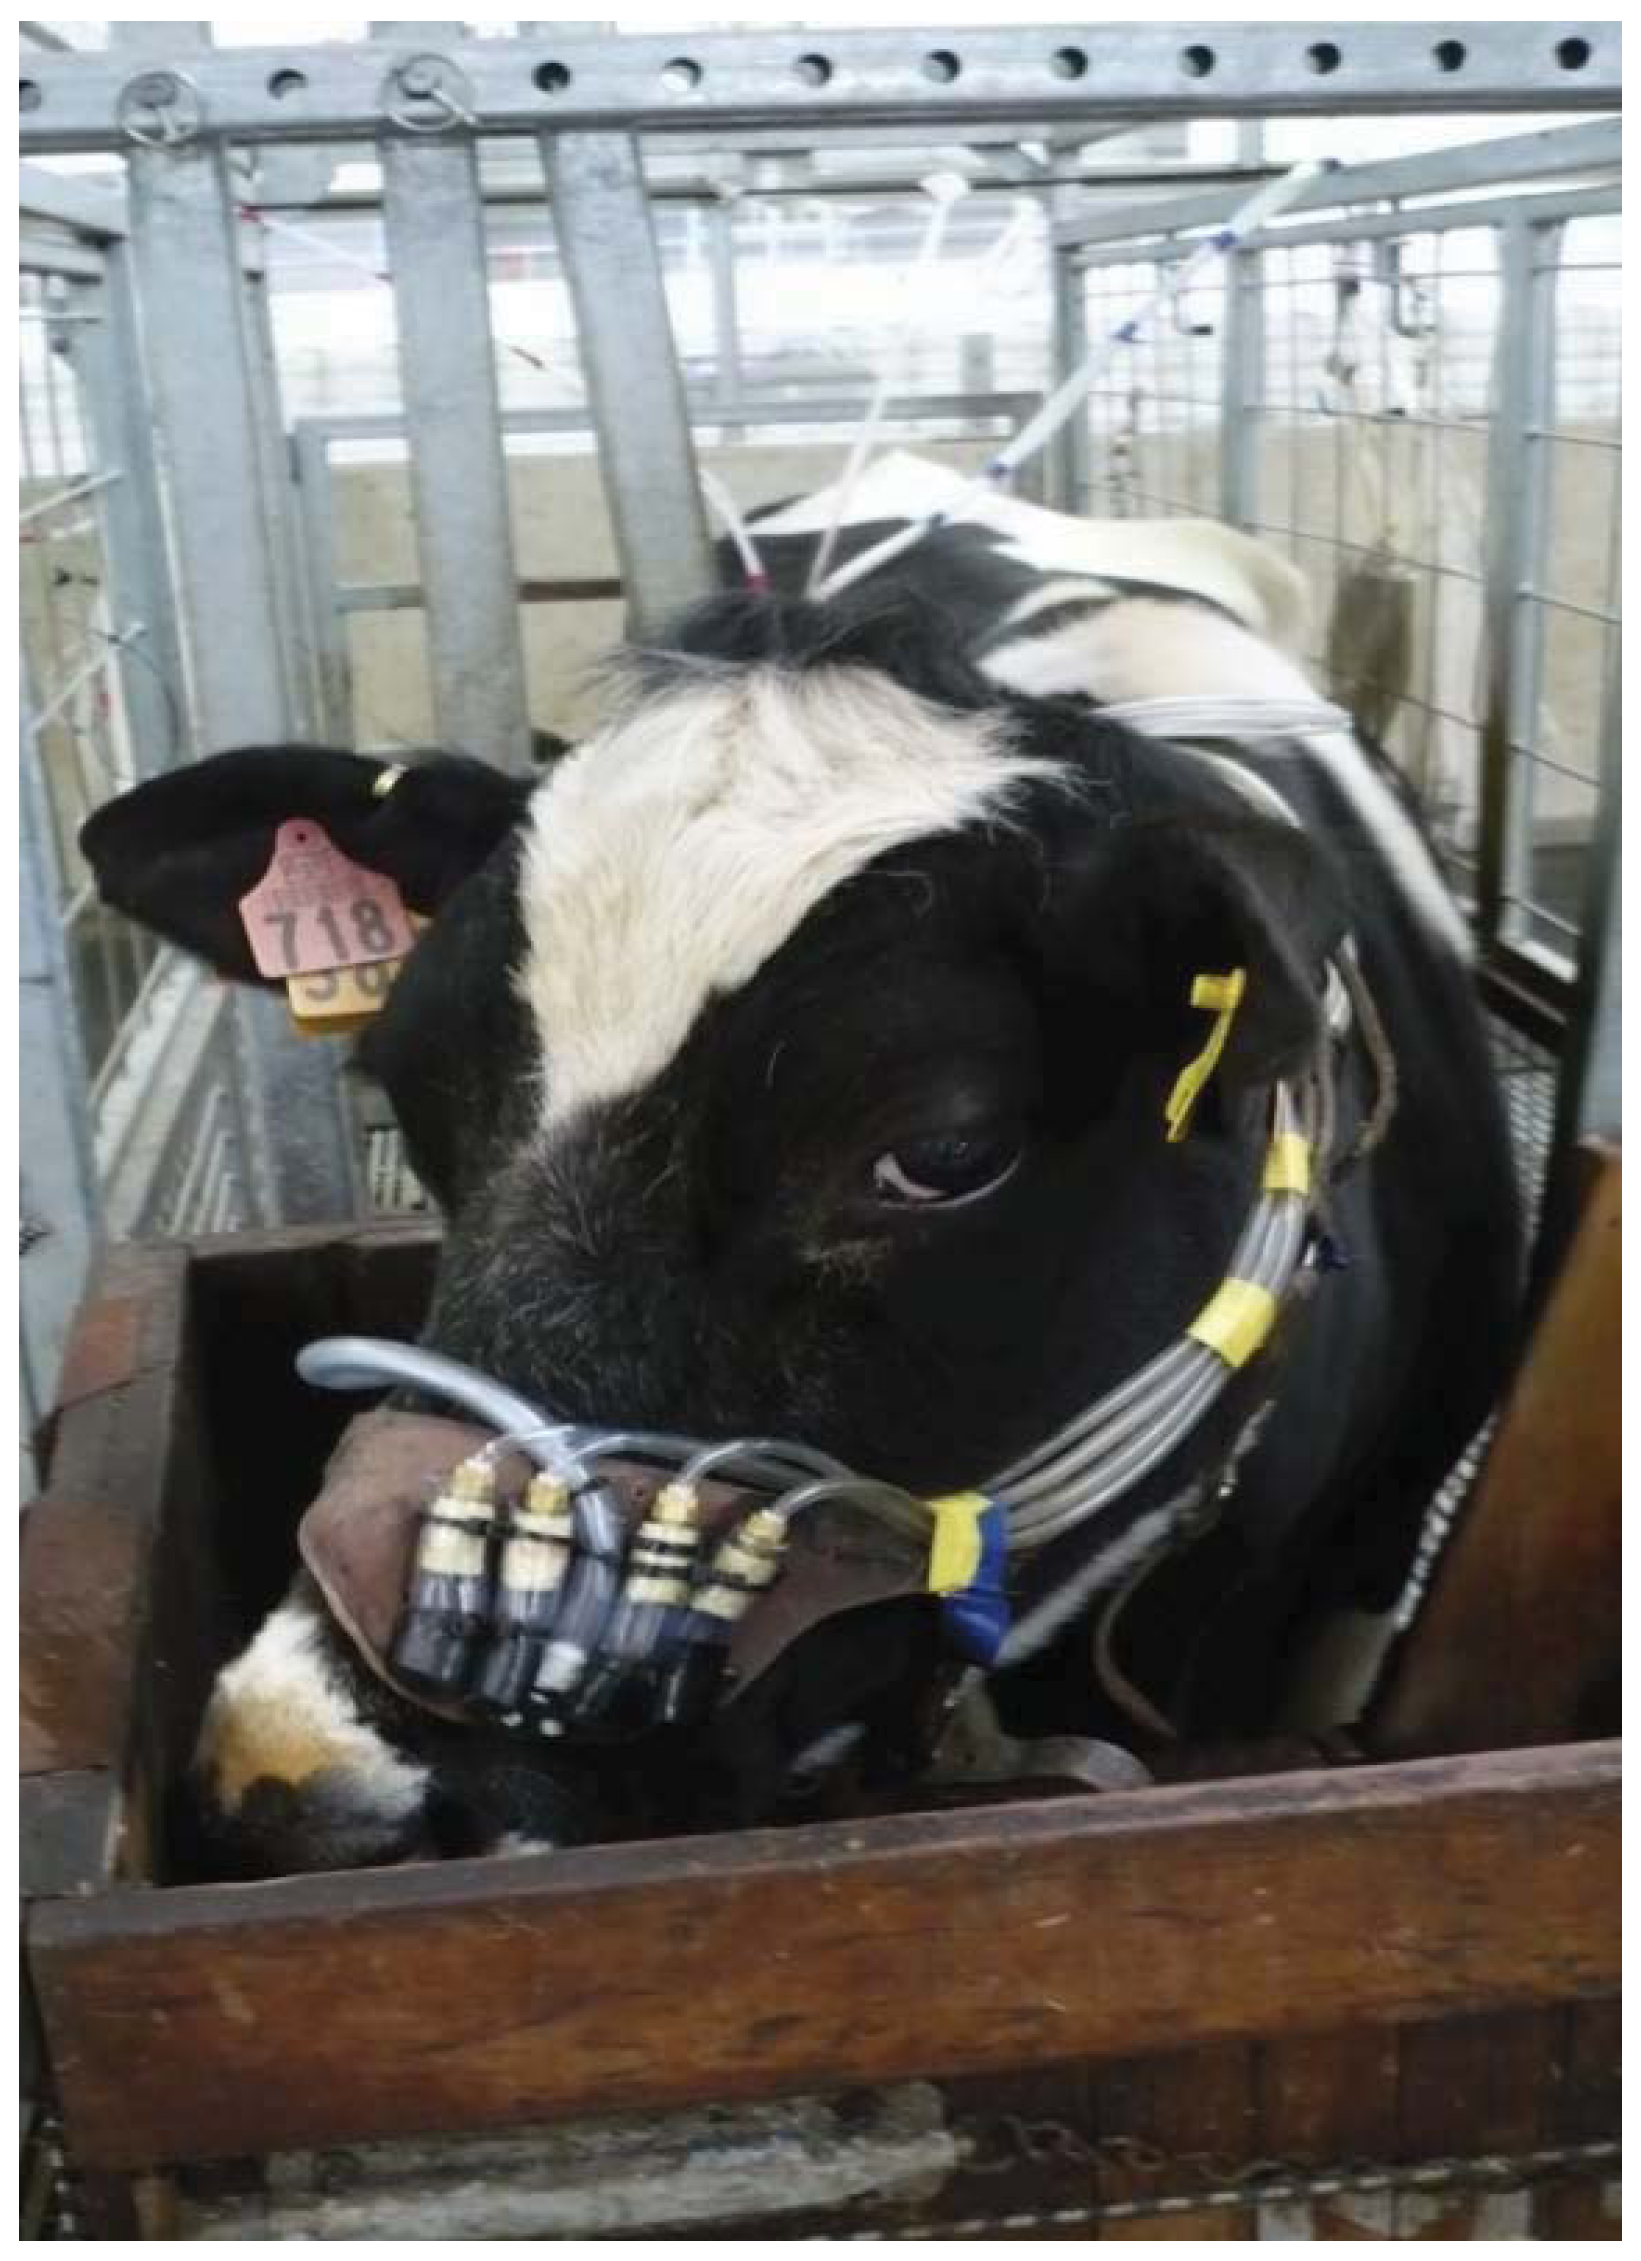
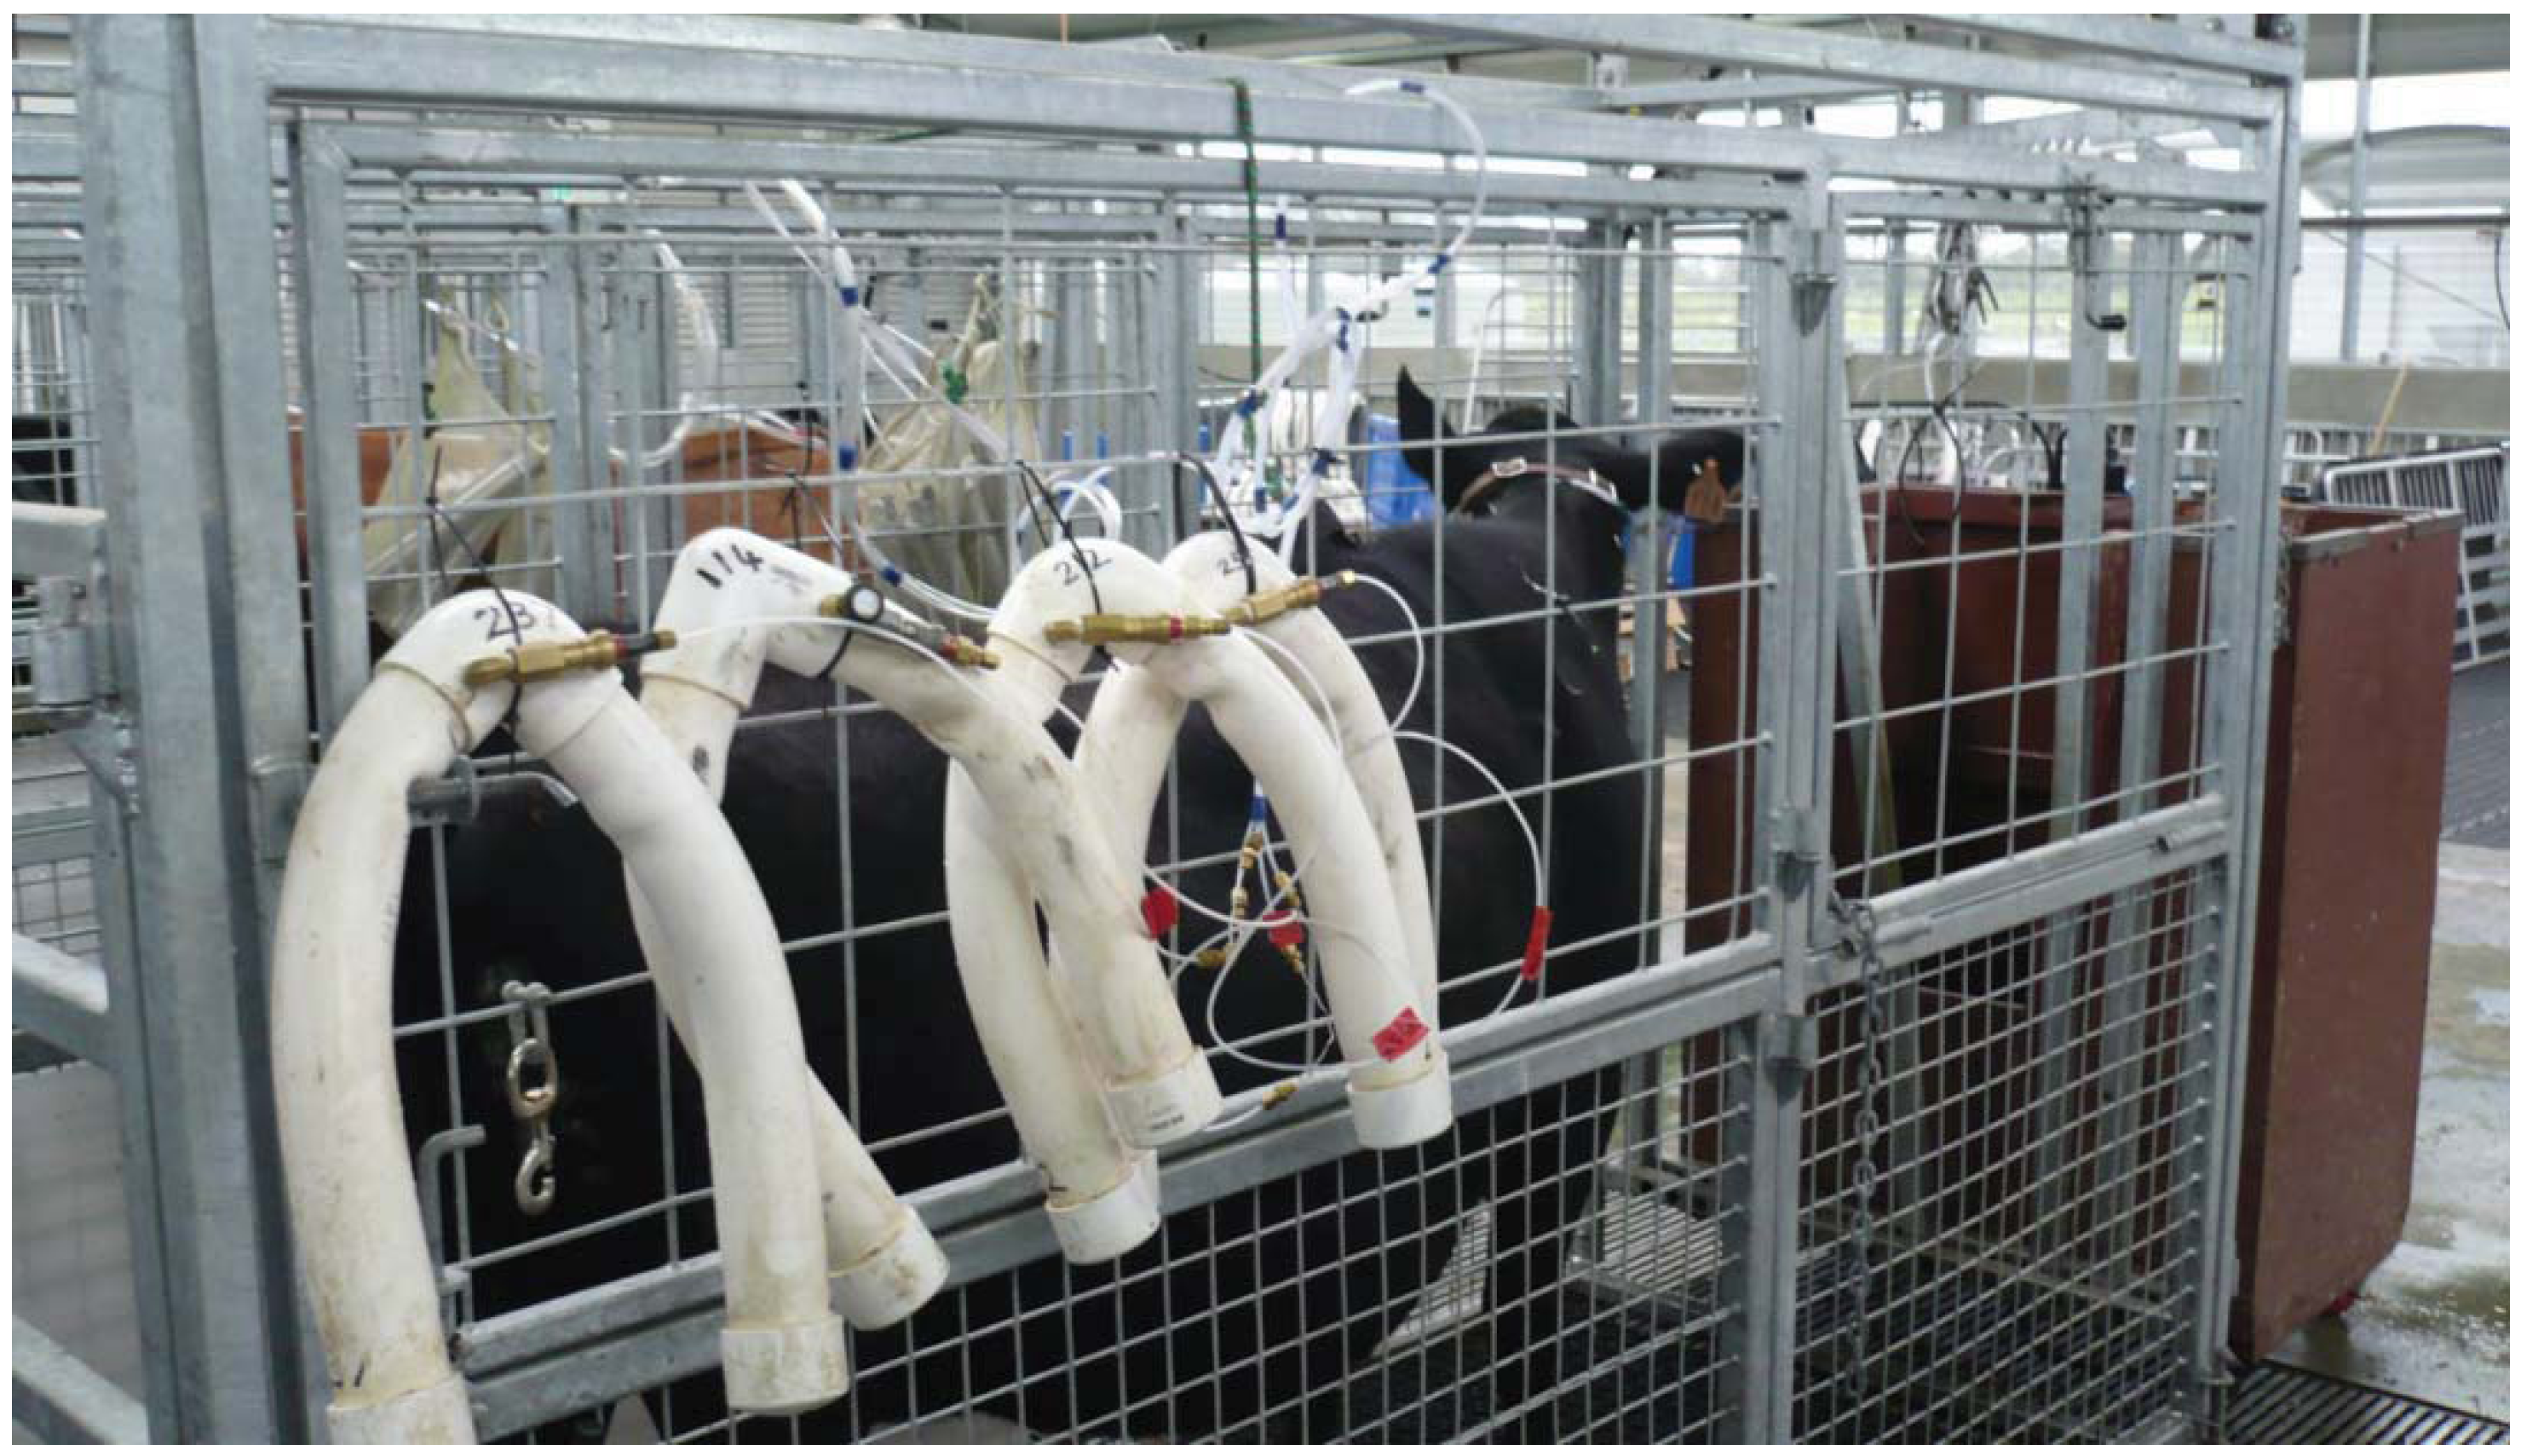
In this study, a similar sample source for all the sample collection alternatives (eight in total) was attempted by fitting all the sample inlets within an area of approximately 18 cm
2 (6 cm × 3 cm) above the nostrils of each animal. The NZL sampling lines had a common sampling area given by the area of the inverted ‘Y’ connector, to which the 1/8" sample lines were attached, whereas each of the ARG sampling lines had an inlet circumference of approx. 1.2" (corresponding to that of the flow restrictor), hence occupying a larger area than the NZL sample inlets. Consequently, the provision of similar or common breath samples to both systems during all collection periods was unlikely to have been attained. Lassey
et al. [
17] suggested that ruminal movements and turbulent eructation processes may thoroughly mix the CH
4 and SF
6 gases before they are sampled. However, it is well established that CH
4 is also exhaled with respiration gases (it is unknown whether SF
6 is exhaled) and this process seems less turbulent and much less a variable event than eructation. Therefore, exhaled gases may require a mixing action from wind and animal movement (both limited at penned conditions) to warrant a representative sampling. We speculate that the apparent difference in emission estimates between the sample collection periods within the ARG system, may have been due to an uncommon and unrepresentative sampling caused by micrometeorological conditions that were not uniform for all the sampling lines,
i.e., because of their larger size, the inlets for the ARG system were co-located in a larger area, whereas the inlets for the NZL system were close within a small area (see
Figure 1). Therefore, within the ARG system, effects of sample collection duration and location of sample inlets around the nostrils on CH
4 emission estimates were likely confounded.
The SF6 tracer technique remains the method of choice for CH4 emission estimates from free ranging ruminants. Under such circumstances extended sample collections may be advantageous in terms of their reduced variability of emission estimates ascribed to its time-averaging effect and practicability of its application, especially for grasslands of low carrying capacity. However, extended sample collection protocols may be at higher risk of sample losses than daily samplings. For example, additive action of blocking elements (e.g., dust and water) will occur over an extended period, and so will be the impact of animal behaviour (e.g., chewing of lines, interaction with peers, etc.). These potential advantages and problems together with amelioration interventions should be investigated under grazing conditions.


