Article

Adaptive Evolution of the Greater Horseshoe Bat AANAT: Insights into the Link between AANAT and Hibernation Rhythms

1
Jilin Provincial Key Laboratory of Animal Resource Conservation and Utilization, Northeast Normal University, Changchun 130117, China
2
Key Laboratory of Vegetation Ecology, Ministry of Education, Changchun 130024, China
3
School of Water Conservancy & Environment Engineering, Changchun Institute of Technology, Changchun 130012, China
4
College of Life Sciences, Henan Normal University, Xinxiang 453007, China
*
Authors to whom correspondence should be addressed.
Animals 2024, 14(10), 1426; https://doi.org/10.3390/ani14101426
Submission received: 2 March 2024 / Revised: 12 April 2024 / Accepted: 8 May 2024 / Published: 10 May 2024
(This article belongs to the Special Issue Adaptive Evolution and Trait Formation of Animals)

Abstract

:

Simple Summary

Arylalkylamine N-acetyltransferase (AANAT) is an enzyme that regulates the production of melatonin, a hormone that is essential for organisms to maintain circadian and annual rhythmic behavior. The AANAT gene has undergone gene duplication and inactivation during evolution. Nevertheless, the majority of mammals retain a solitary copy of AANAT within the biological genome, and the mechanisms by which this gene responds to environmental stimuli remain poorly understood. To address this issue, we investigated the adaptive evolution of AANAT at both the gene and protein levels. Our study revealed the presence of multiple mutation sites within the gene encoding AANAT, with variation in the structure of the AANAT protein observed across different geographic populations. We identified a positive selection of AANAT in populations residing at higher latitudes. Furthermore, individuals exhibiting longer hibernation periods displayed significantly higher catalytic efficiency of the AANAT enzyme compared to those with minimal hibernation behavior, suggesting a potential association between AANAT and hibernation rhythms. This study adds to our understanding of the adaptive evolution of AANAT and may provide molecular evidence for hibernation rhythm adaptation in bats.

Abstract

Arylalkylamine N-acetyltransferase (AANAT) is a crucial rate-limiting enzyme in the synthesis of melatonin. AANAT has been confirmed to be independently duplicated and inactivated in different animal taxa in order to adapt to the environment. However, the evolutionary forces associated with having a single copy of AANAT remain unclear. The greater horseshoe bat has a single copy of AANAT but exhibits different hibernation rhythms in various populations. We analyzed the adaptive evolution at the gene and protein levels of AANAT from three distinct genetic lineages in China: northeast (NE), central east (CE), and southwest (SW). The results revealed greater genetic diversity in the AANAT loci of the NE and CE lineage populations that have longer hibernation times, and there were two positive selection loci. The catalytic capacity of AANAT in the Liaoning population that underwent positive selection was significantly higher than that of the Yunnan population (p < 0.05). This difference may be related to the lower proportion of α helix and the variation in two interface residues. The adaptive evolution of AANAT was significantly correlated with climate and environment (p < 0.05). After controlling for geographical factors (latitude and altitude), the evolution of AANAT by the negative temperature factor was represented by the monthly mean temperature (r = −0.6, p < 0.05). The results identified the gene level variation, functional adaptation, and evolutionary driving factors of AANAT, provide an important foundation for further understanding the adaptive evolution of the single copy of AANAT in pteropods, and may offer evidence for adaptive hibernation rhythms in bats.

1. Introduction

Biological rhythms are crucial for the survival and reproduction of organisms. Many important physiological states and behavioral activities exhibit circadian rhythms; the seasonal reproduction and hibernation behaviors of mammals are examples of longer-period rhythms. In mammals, biorhythms are regulated by the rhythm control center that is primarily controlled by the synthesis and secretion of melatonin by the pineal gland [1,2,3]. Melatonin, as an important hormonal signal involved in the biological clock, can transmit circadian rhythm information to other structures and organs as it circulates in the blood [4,5]. The secretion cycle of melatonin is regulated by arylalkylamine N-acetyltransferase (AANAT), a crucial rate-limiting enzyme involved in the synthesis of melatonin. The normal expression of AANAT is essential for the periodic secretion of melatonin and the maintenance of circadian rhythms [6,7].
AANAT is a pleiotropic gene with evolutionary flexibility [8,9]. In invertebrates, AANAT acts as a detoxification agent by acetylating arylalkylamines and polyamines [10]. In vertebrates, AANAT regulates rhythmic behavior by producing and releasing melatonin [3]. AANAT functions in both circadian and annual rhythmic behavior. At night, the E-box element of the AANAT promoter binds to the Bmal1-Clock heterodimer of the biological clock, enhancing the transcription and expression of AANAT and increasing the level of melatonin [11]. The sleep duration of zebrafish (Danio rerio) decreased significantly compared to that of a control group after AANAT2 gene inactivation. However, the sleep duration returned to normal after melatonin treatment [12]. In addition to circadian behavior, AANAT regulates annual rhythmic behavior. AANAT is expressed in the corpus luteum, and knocking out the melatonin receptor MT2 significantly reduced the litter size in mice [13]. The expression of AANAT in the brains of hibernating animals is higher than in non-hibernating animals, and exogenous melatonin treatment can prolong the hibernation time [14,15,16,17].
AANAT has been demonstrated to have adaptively evolved from early invertebrates to vertebrates. This evolution involved the loss of NV-AANAT (non-vertebrates) in agnathans and the emergence and duplication of new gene copies of VT-AANAT (vertebrates) [9]. Recent studies have found double or even multiple copies of AANAT in insects [18], bony fishes [19], and even-toed ungulates [20]. The loss of AANAT has been observed in some species of cetaceans [21], xenarthrans [22], and pangolins [23]. However, with the exception of the above-mentioned species and a few mammals, AANAT in most mammals exists as a single-copy gene [24] (i.e., the DNA sequence encoding the gene occurs only once within the genome). Currently, the adaptive evolutionary significance of having a single copy of AANAT remains unclear.
In mammals that possess one copy of AANAT, chiropterans serve as ecological indicator species due to their wide distribution and high level of species diversity [25,26]. Melatonin resulting from the cascading reaction regulated by the expression on AANAT coding sequences [27,28] plays important roles in maintaining the reproductive rhythm and hibernation behaviors of chiropterans. For example, there is a negative correlation between ovarian activity and pineal mass in the bat Cynopterus sphinx that may represent an adaptive strategy to cope with unfavorable seasonal conditions [29]. Melatonin also plays a role in maintaining energy balance by regulating intracellular glucose transport, a process that helps protect bats from the risk of hypoglycemia during hibernation [30] and that cooperates with insulin to stimulate leptin synthesis. This is beneficial for regulating seasonal fluctuations in body fat levels in bats, enabling them to survive challenging conditions of seasonal weather and climate [31]. Among the chiropterans, the greater horseshoe bat, Rhinolophus ferrumequinum, is an insectivore, widely distributed from northeast China to Yunnan, and is divided into three genetic lineages: northeast (NE), central east (CE), and southwest (SW) [32]. There is variation in hibernation rhythm among these lineages. The NE lineage, represented by the Liaoning (LN) population, exhibits a strict hibernation habit, whereas the SW lineage, represented by the Yunnan (YN) population, remains in a state of perennial activity [33]. The greater horseshoe bat is thus an ideal species for exploring the adaptive evolution of the single copy of AANAT.
Therefore, the present study aimed to clarify the adaptive evolution of AANAT at both the gene and protein levels, while identifying the forces driving the evolution of this gene in combination with environmental factors. The specific goals were to (1) assess the genetic diversity of the gene through cloning and sequencing and clarify the molecular evolutionary relationships of AAANT in different populations; (2) identify the selected loci and clades through selection pressure analysis; (3) evaluate whether the gene function changed during evolution; and (4) reveal the effect of ecological selection on the evolution of the gene. The integration of both gene and protein data will also contribute to understanding the molecular evidence for hibernation adaptation in greater horseshoe bats, thus potentially providing a theoretical basis for the hibernation behavior of chiropterans.

2. Materials and Methods

2.1. Sample Collection

Wing membrane tissues of greater horseshoe bats were sampled from 77 bats from 11 geographic populations from the Jilin to Yunnan provinces, including the NE lineage from the Jilin (JL) and Liaoning (LN) provinces, the CE lineage from the Beijing (BJ), Shandong (SD), Henan (HN), Anhui (AH), Zhejiang (ZJ), Shanxi (SX), and Shaanxi (SXi) provinces, and the SW lineage from the Gansu (GS) and Yunnan (YN1, YN2) provinces (Figure 1).
Mist nets were set up at dusk in the bat habitat. After identifying the species, the captured bats were sampled using a pterygium collector with a 3 mm diameter, and one or two pieces of tissue were collected from each side. The samples were stored at −80 °C until use. All field studies were conducted according to the National Wildlife Research Code.

2.2. DNA Amplification, Cloning, and Sequencing

Genomic DNA was extracted from the samples using an Ezup Column Animal Genomic DNA Purification Kit (Sangon Biotech, Shanghai, China), and the quality and quantity of genomic DNA were assessed using 1% agarose gel electrophoresis and a Nanodrop One ultra-micro ultraviolet spectrophotometer.
Primers were designed for chromosome segmentation using Primer v5.0 and Oligo v7.0 according to the reference sequence of the greater horseshoe bat AANAT gene (https://asia.ensembl.org/index.html [Accessed on 27 October 2021]). The primers 1.1FR and 1.2FR were used for the first half of AANAT due to a mutation site in the primer sequence, while the second half was amplified using the primer 2FR. The specific primer information is listed in Table 1. The PCR reaction system comprised 25 μL, including 2 μL of genomic DNA, 1 μL of upstream primer, 1 μL of downstream primer, 12.5 μL of Ultra HiFidelity PCR Kit II (Tiangen Biotech, Beijing, China), and 8.5 μL of ddH2O.
The amplification reaction conditions included initial denaturation at 94 °C for 5 min, denaturation at 94 °C for 30 s, annealing for 30 s, extension at 72 °C, and final elongation at 72 °C for 5 min (refer to Table 1 for the annealing temperatures and extension times). The quality of the PCR products was assessed at the end of PCR using 1% agarose gel electrophoresis.
DNA fragments were purified using a SanPrep Column PCR Product Purification Kit. The purified products were then transformed into E. coli DH5α (Sangon Biotech, Shanghai, China) and cultured in LB medium overnight. At least five individual colonies were selected for each plasmid, and PCR was performed using the M13 universal primer. Positive clones were screened and Sanger-sequenced to obtain the target sequence.

2.3. Recombinant Protein Preparation

In this study, AANAT recombinases were purified and expressed from the LN population that exhibits a clear hibernation rhythm and the YN population that has an irregular hibernation pattern. The protein-coding region was synthesized based on the sequencing results (Vazyme, Nanjing, China), inserted into the bacterial expression vector pGEX4T1, and verified by Sanger sequencing, enabling the expression of the AANAT protein fused with glutathione S-transferase. The protein expression strains were selected from BL21 (DE3) pLysS (Vazyme, Nanjing, China). The expression, production, and purification methods of AANAT were based on existing related studies [34].

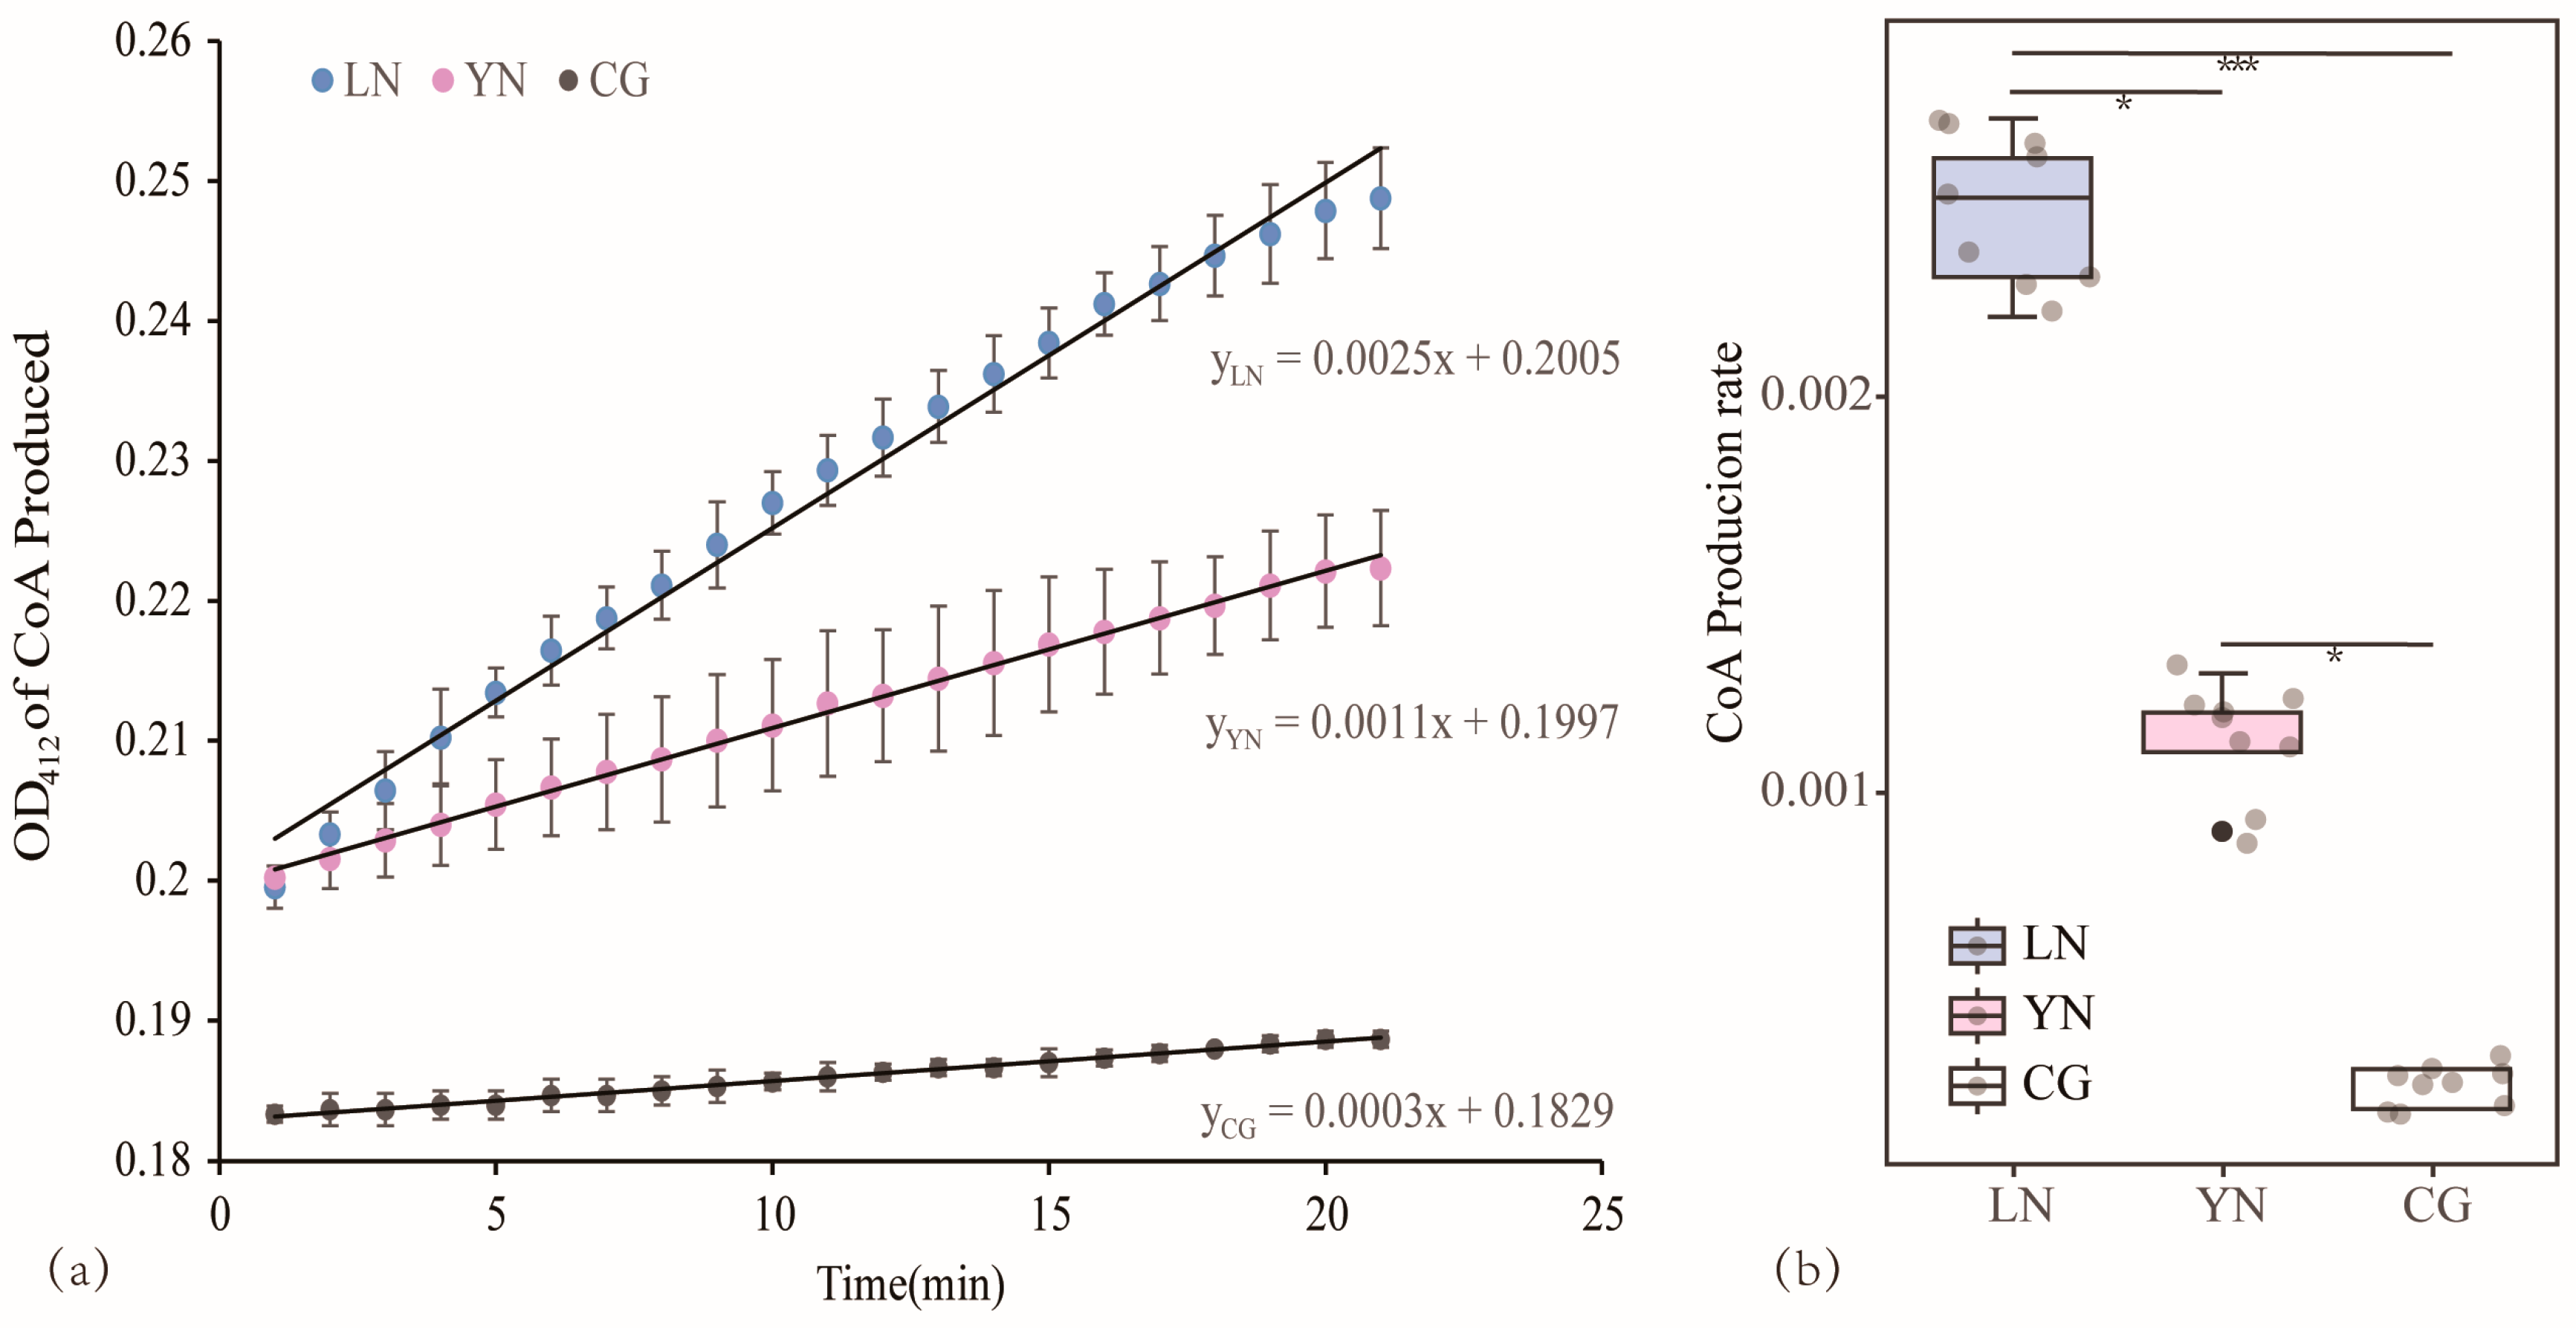
2.4. Enzymatic Activity Assays

To assess whether the evolution of the greater horseshoe bat AANAT was accompanied by functional changes, the purified recombinant protein was utilized as an enzyme to catalyze the reaction. The detection method for AANAT enzyme activity referred to a new colorimetric method for AANAT [35]. The reaction was conducted in 96-well plates with a final volume of 100 μL per well. The components included 2 mM serotonin, 1 mM AcCoA, 2 mM DTNB, 50 mM HEPES buffer (pH 7.5), 0.1 μg AANAT, and 1 mM AcCoA. An equal volume of ddH2O was added to the blank control group. The experimental group (LN, YN) and the blank control group (CG) were each set up with three experimental replicates, and three groups of technical replicates were established for each experimental replicate. The reactions were monitored at room temperature using UV-vis spectroscopy at 412 nm, with readings taken every minute for 20 min. The catalytic capacity of the AANAT enzyme was measured by the amount of CoA produced per unit of time.
Due to the non-normal distribution of the data, a nonparametric Kruskal–Wallis (K–W) test was used for statistical analysis, and the Bonferroni–Holm (B–H) method was used for p-value correction (https://CRAN. R-project. org/package = PMCMRplus [Accessed on 21 November 2023]). An additional analysis was conducted using a generalized linear mixed model (GLMM) with the glmer() function of the lme4 package that excluded the influence of technical repetitions on experimental results [36]. The response variable was enzyme reaction rate, with technical duplication as a random factor. To perform pairwise comparisons, we set CG and LN as the first groups, and the p-values were calculated using the car package.

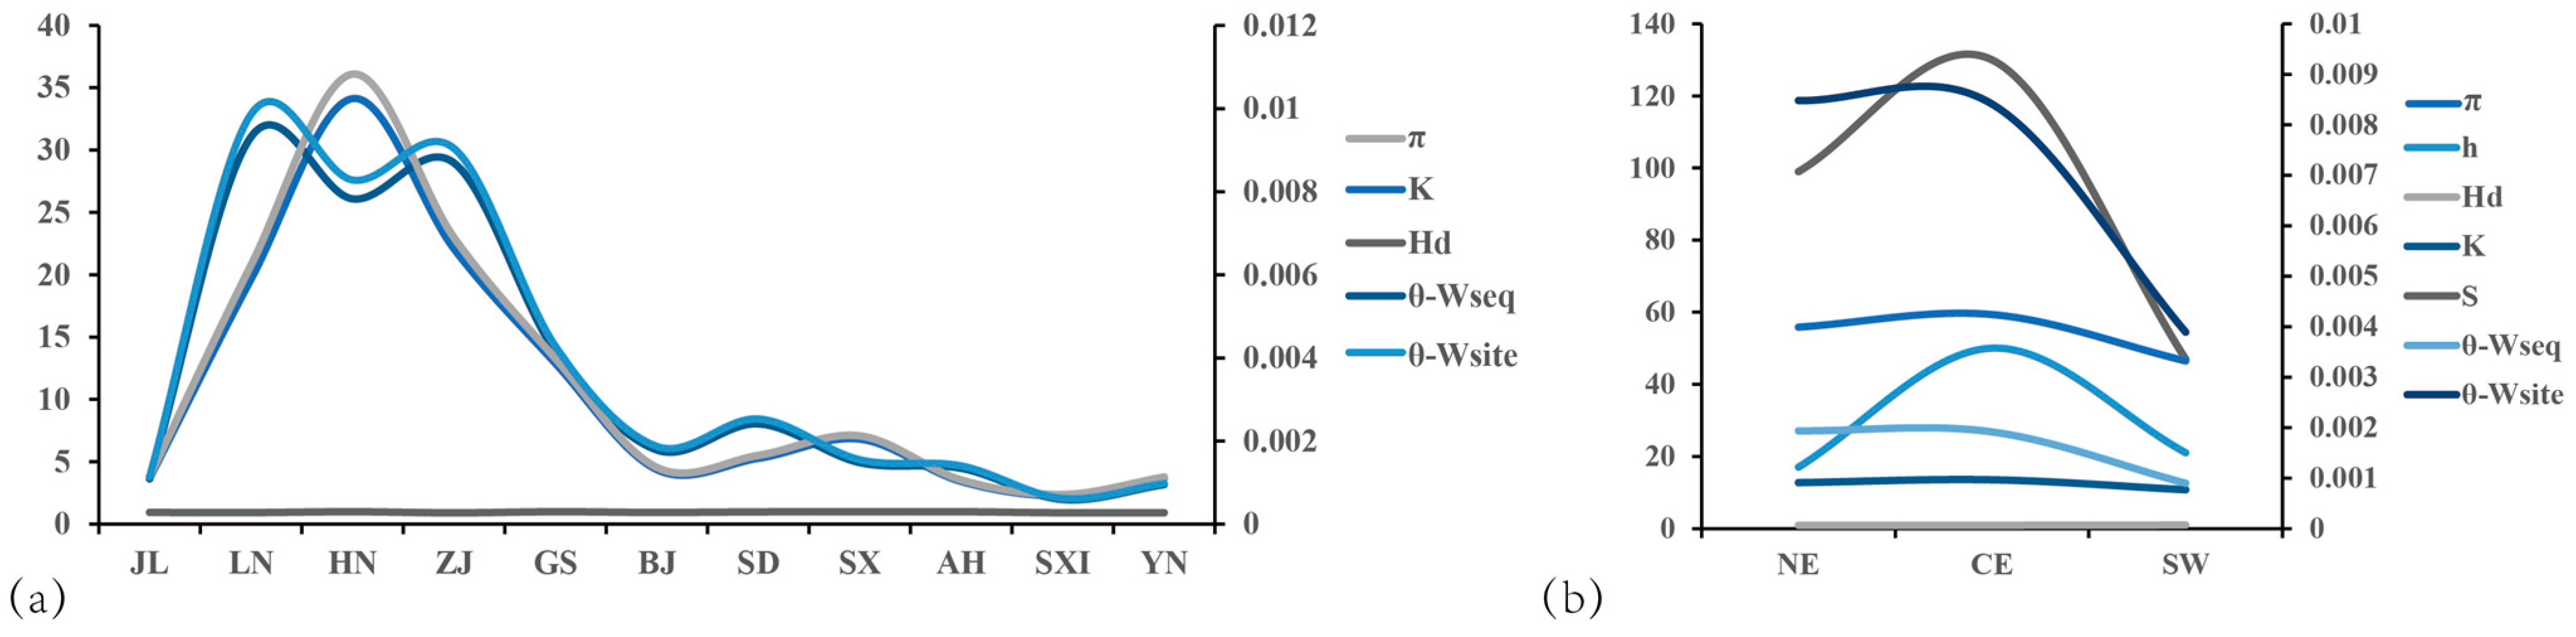
2.5. Analysis of AANAT Gene Polymorphism

The SeqMan program was used to visualize the sequencing chromatogram of the sequencing data and to correct the base sequences. The MEGA v7.0 software was utilized to remove non-target base sequences from the sequencing data using the Edit Seq program. To avoid the introduction of mutations during the PCR, five clones were tested per sample to ensure the accuracy of sequencing. The genotype of each individual was determined by the measured haplotype sequence, with two base sequences if the individual was heterozygous and only one base sequence if the individual was homozygous. Different sequences obtained from different genotype data were considered as haplotypes. The genotype and single nucleotide polymorphism (SNP) analyses were performed using DnaSP v5.0 [37].
Iqtree2 was utilized to construct an unrooted evolutionary tree for greater horseshoe bats. The optimal nucleotide replacement model was calculated as K3Pu + F + R2 using the Bayesian Information Criterion and was run 1000 times. The support rates of nodes were computed using bootstrap self-help and Shimodaira–Hasegawa (SH) approximate likelihood ratios. Evolutionary tree beautification was accomplished using the online tool Interactive Tree Of Life (iTOL) (https://itol.embl.de/ [Accessed on 26 December 2023]). We also constructed an AANAT haplotype network using the TCS algorithm implemented in PopArt v1.7 [38] to elucidate AANAT gene population genetic relationships.

2.6. Analysis of Selective Pressure

Historical recombination events were estimated using RDP v4.0 in order to avoid false-positive selection events. Selection analysis was performed after confirming that there were no recombination sequences.
In order to detect the effects of selection on AANAT, the rates of synonymous and nonsynonymous substitutions at individual codons were compared separately. MEGA v7.0 was used to extract the protein-coding regions (618 bp) from the entire sequence (the AANAT is 3419 bp). The genotype of each individual was determined by analyzing the sequencing chromatogram obtained through Sanger sequencing. Concerning the intraspecies developmental relationships established by the neutral SNPs in previous studies [39], the guide tree of the greater horseshoe bat was drawn using the User Tree function in MEGA.
The Phylogenetic Analysis by Maximum Likelihood (PAML) codeml program was utilized for multiple model analyses [40] including the site model, the branch model, and the branch–site model. A likelihood ratio test (LRT) was performed for each model, and p-values were obtained. In the site model analysis, multiple built-in models were run simultaneously, including M0 (one-ratio), M1a (neutral), M2a (selection), M3 (discrete), M7 (beta), M8 (beta and ω), and M8a (beta and ω = 1). LRTs were performed on the corresponding built-in models (M0 vs. M3, M1a vs. M2a, M7 vs. M8, and M8 vs. M8a), and the posterior probability was calculated using the Bayes Empirical Bayes (BEB) method to infer positive selection sites.
In the branch model, the northeast (NE), central east (CE), southwest (SW), and northeast and central east lineages (NE + CE) were designated as foreground branches. The analysis used the built-in “one-ratio” model, the “free-ratio” model, and the “two-ratio” model. The LRT was performed on the results of all inter-model comparisons.
In the branch–site model, the setting of foreground branches was consistent with the branch model, and the method of calculating the posterior probability to infer positive selection sites was consistent with the site model.

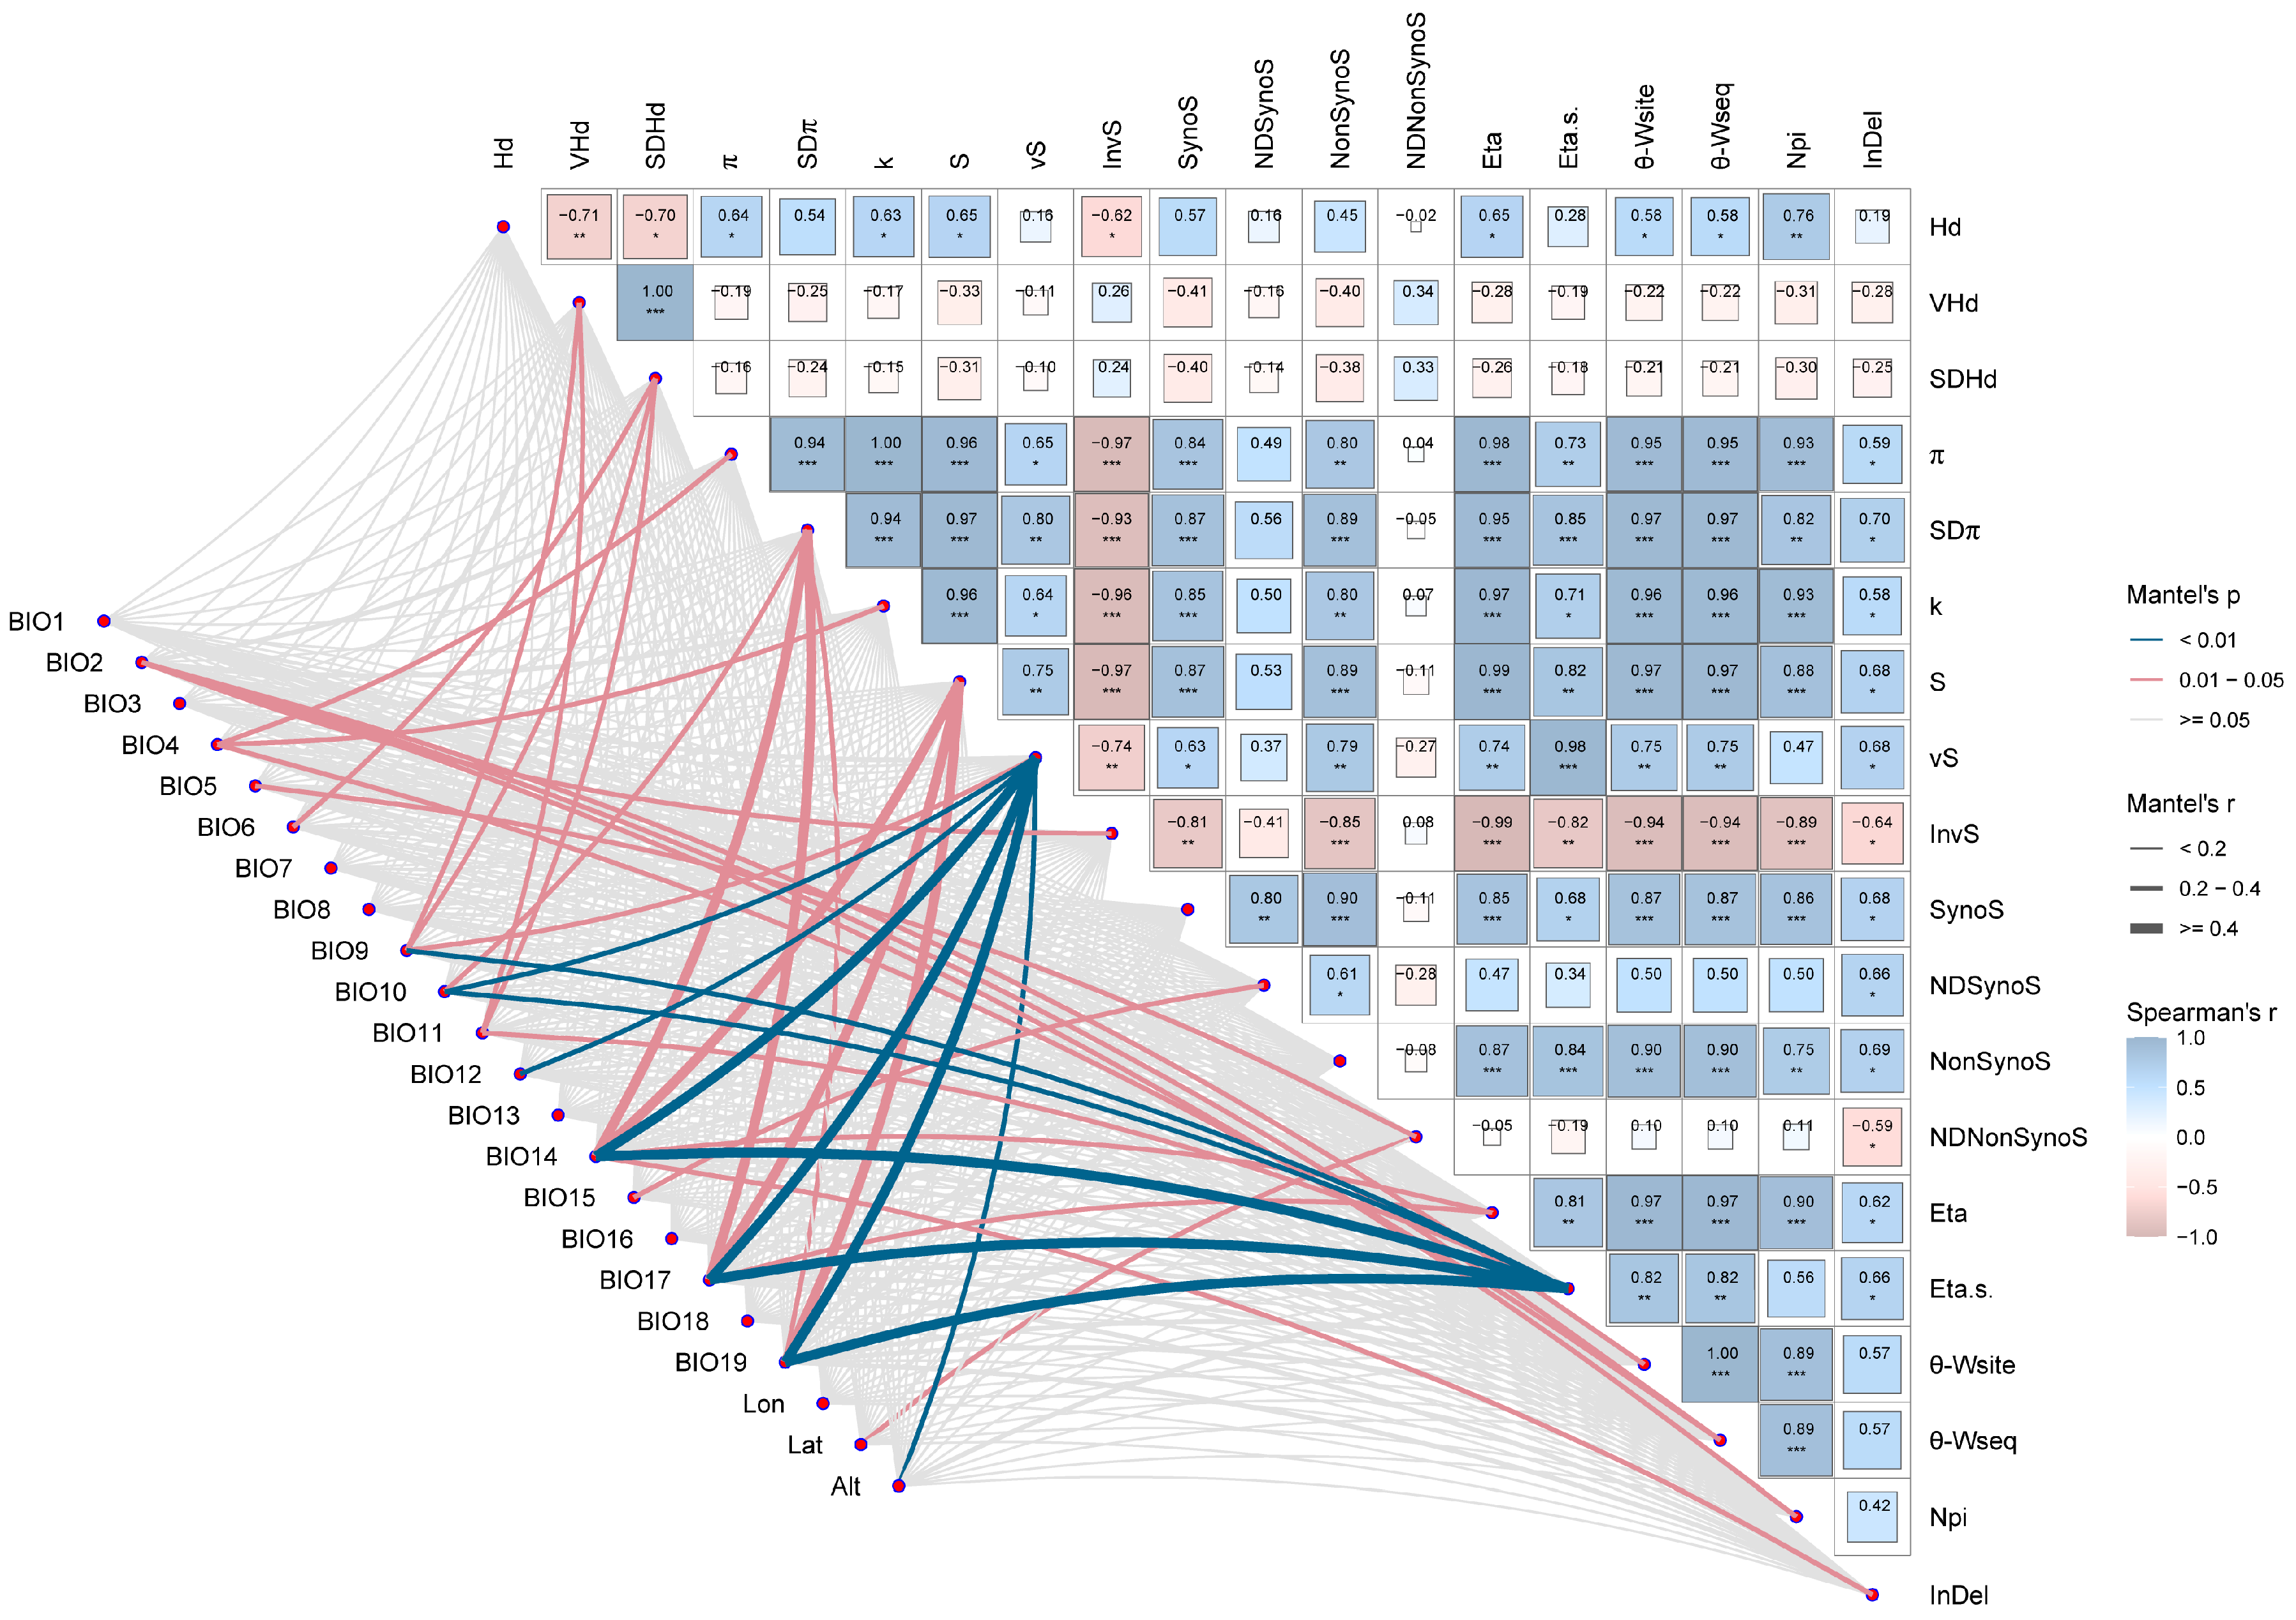
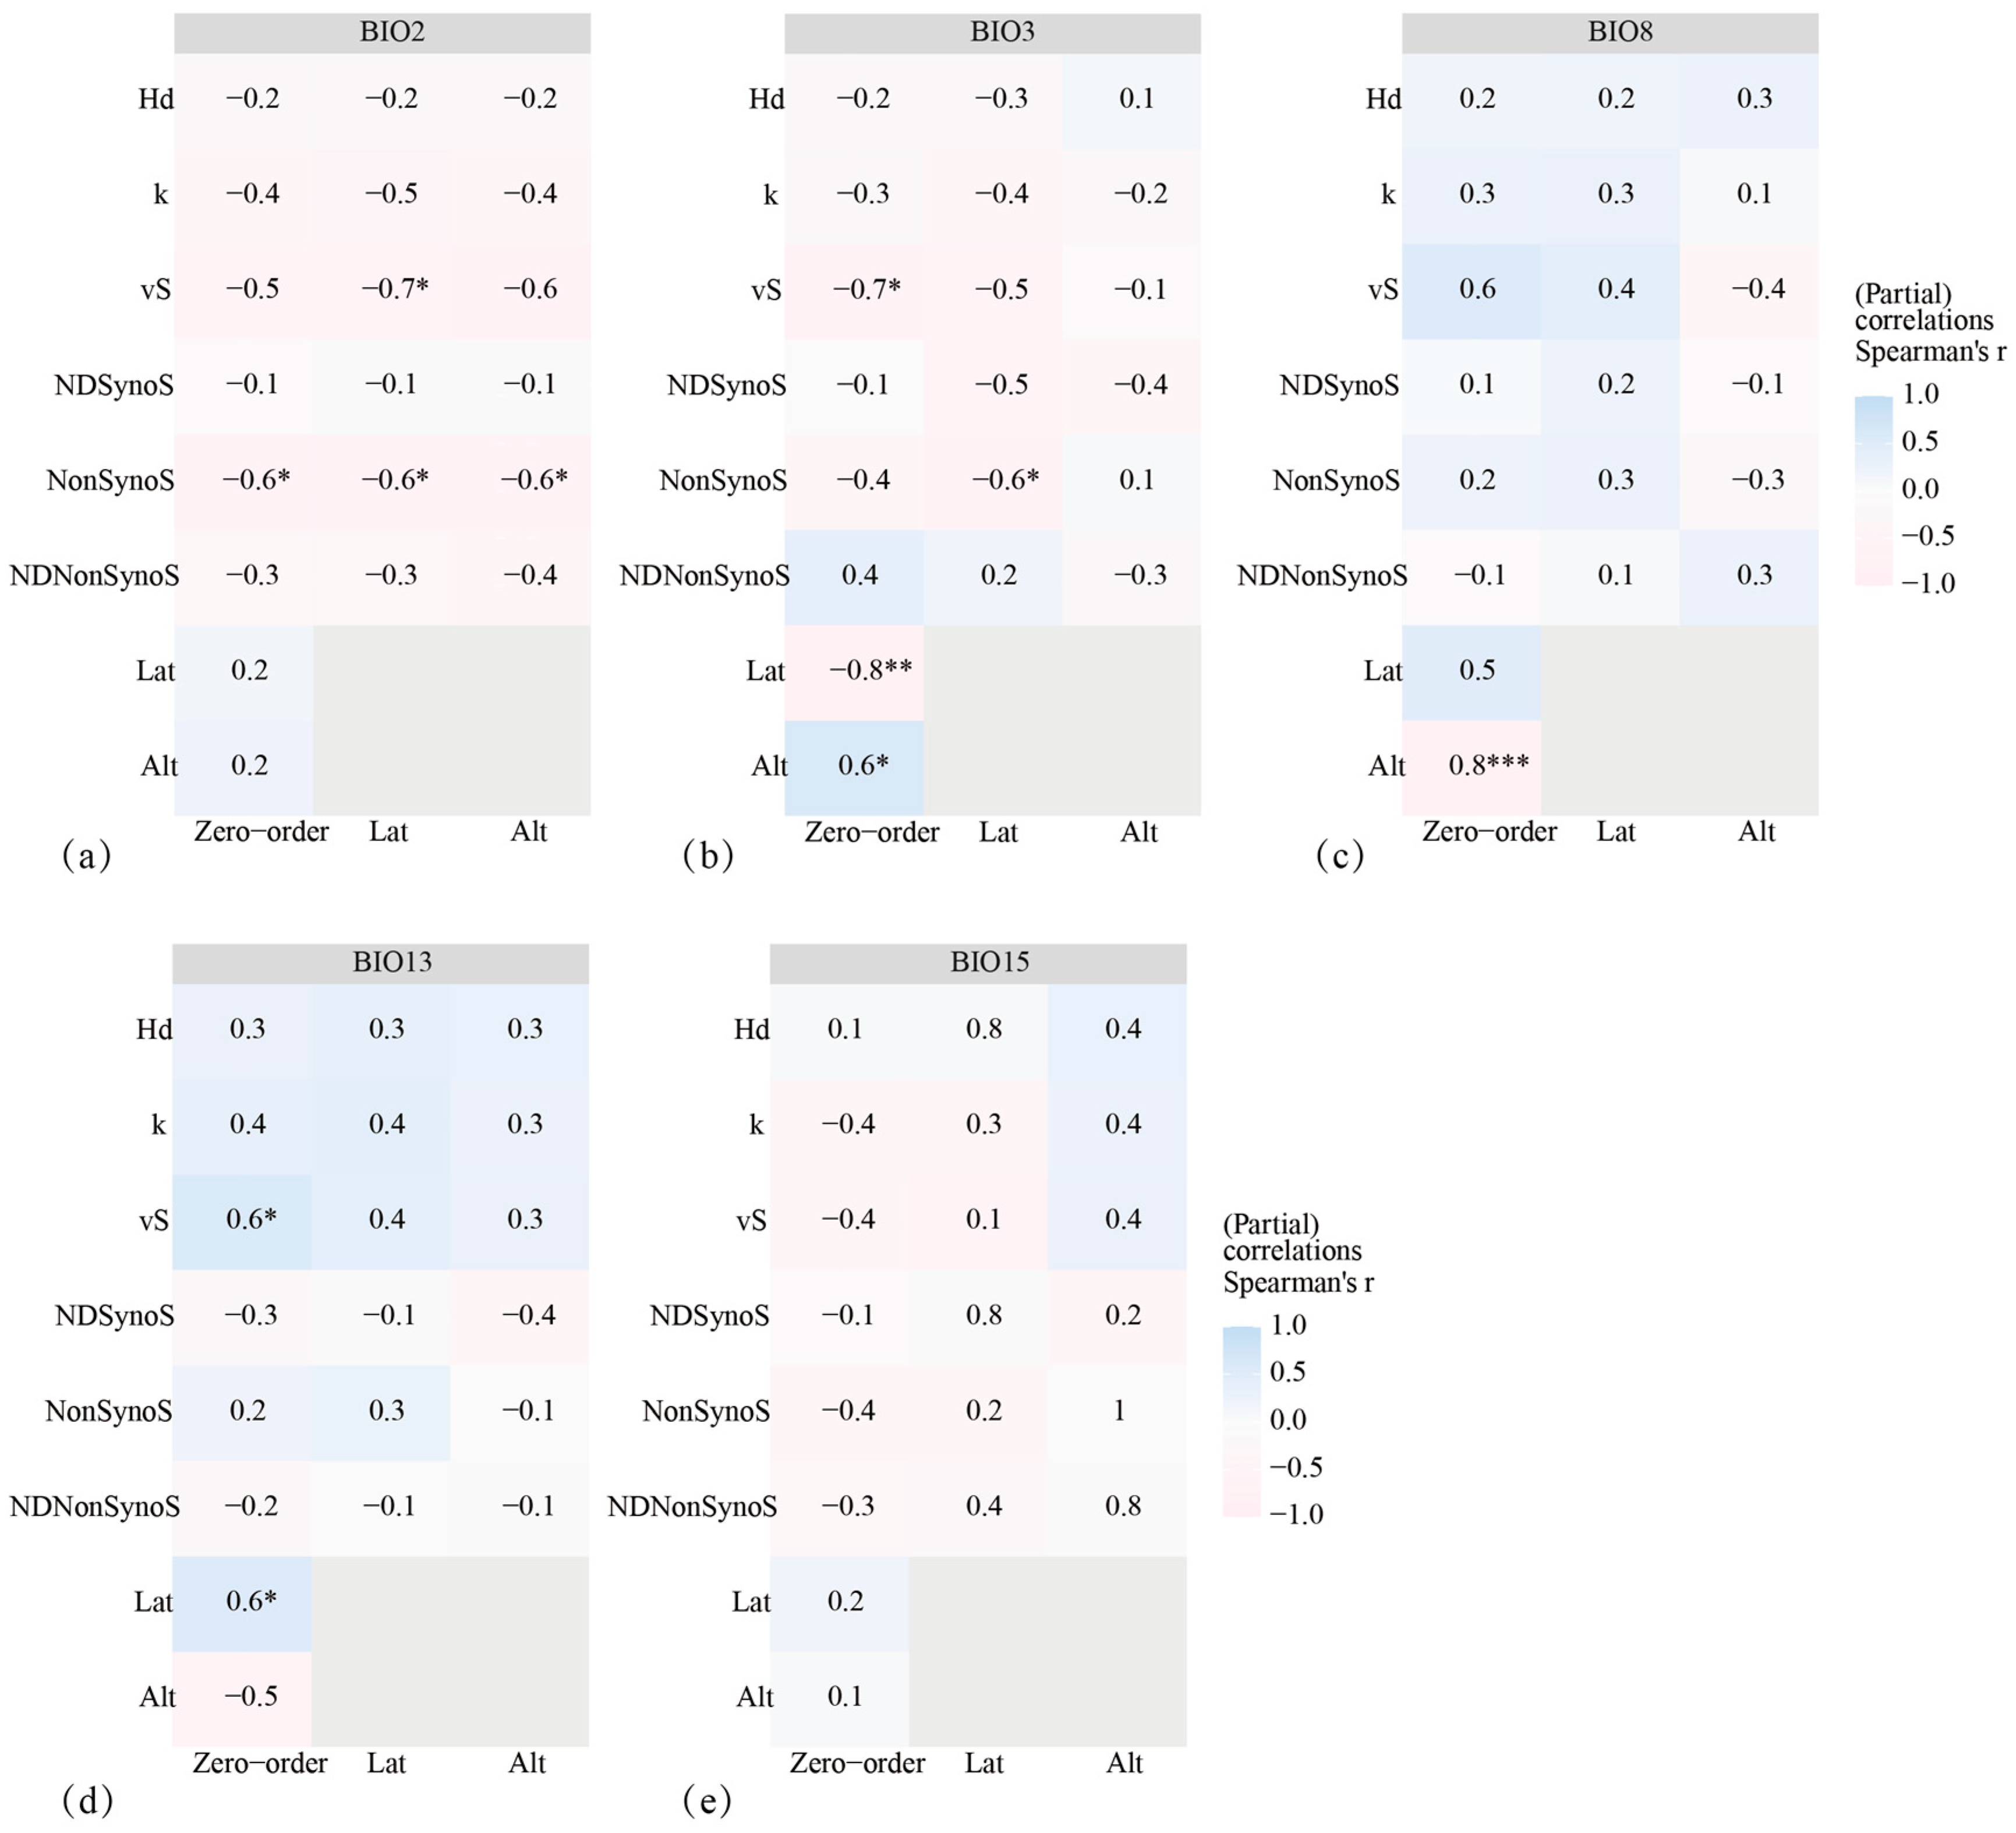
2.7. Effects of Environmental Factors on AANAT Polymorphism

To investigate whether the adaptive evolution of AANAT has been influenced by geographical distance and climate factors, 19 bioclimatic data for 30 years for each population were downloaded from the CHELSA site based on the longitude, latitude, and altitude of sampling points recorded by GPS during field sampling (resolution: 30 arcsec, ~1 km, time period: 1981–2010). The R package “raster” [41] was used to extract 19 climate factors that included temperature and precipitation (Table 2).
Correlation analyses (Spearman statistics) of population genetic diversity and environmental factors (19 bioclimatic factors, longitude, latitude, and altitude) were implemented using the linkET package (https://github.com/Hy4m/linkET [Accessed on 2 January 2024]) mantel_test() function.
To evaluate the most critical factors affecting the genetic diversity of this gene, we first performed a collinearity analysis (SPSS v26.0) of climate factors, geographic factors, and genetic diversity, and the factors with high collinearity were removed until VIF < 2.5. The five remaining climate factors were BIO2, BIO3, BIO8, BIO13, and BIO15, and the geographic factors were altitude (Alt) and latitude (Lat). Residual haplotype diversity (Hd), average number of nucleotide differences (k), number of variable sites (S), nucleotide diversity of synonymous sites (NDSynoS), nonsynonymous sites (NonSynoS), and nucleotide diversity nonsynonymous sites (NDNonSynoS) were calculated. The association between residual factors and AANAT genetic diversity was calculated using Partial Mantel tests (Spearman statistics) controlling for geographic factors. The analysis used the “hmisc” package.

3. Results

3.1. AANAT Gene Characteristics

A total of 357 AANAT sequences were obtained after correction and combination, with 18 homozygotes and 59 heterozygotes. Among the 171 SNPs, there were 18 coding region polymorphic sites (cSNPs), including four nonsynonymous mutation sites. The population fixation index (FST) was 0.35. Neutrality tests yielded negative results under both Fu and Li’s D and Fu and Li’s F models (p < 0.05).
Populations at higher latitudes exhibit greater AANAT genetic diversity, as indicated by higher values of the average nucleotide diversity (π), an average number of nucleotide differences (K), θper sequence from the total number of mutations (θ-Wseq), and θper site from the total number of mutations (θ-Wsite). This suggests that genetic diversity is greater in populations at higher latitudes (LN and HN), while populations at lower latitudes (YN) show less genetic diversity. There was little difference between populations (Figure 2a). In various lineages, the values of π, K, and polymorphic sites (S) were highest in the CE lineage, followed by NE, and lowest in SW. θ-Wseq and θ-Wsite exhibited the highest values in NE, followed by CE, and the lowest in SW (Figure 2b).

3.2. AANAT Phylogeny

The phylogenetic tree and haplotype network diagrams constructed from the AANAT sequences showed that the SW lineage of greater horseshoe bats (GS, YN) clustered separately, and the NE lineage clustered with the CE lineage (Figure 3a,b). The haplotype network diagram showed that most individuals in Yunnan shared the same haplotype, and the large number of haplotypes found in different populations may be the result of the creation of new genes during an ancient gene duplication event, and the subsequent evolution of these genes individually [42].

3.3. Selective Pressure on AANAT

Two identical positive selection sites were detected in M2a and M8 at 70 (I 0.693 V) and 187 (A 0.906 T), respectively (Table 3).
In the branch model, the NE, CE, NE + CE, and SW lineages were identified as foreground branches, and the LRT p-values for the “one-ratio” model compared to the “two-ratio” model (two-ratio vs. one-ratio) were not significant (p > 0.5). Compared with the alternative hypothesis in the “double ratio” model and the corresponding null model (two-ratio vs. two-ratio, ω1 = 1), the LRT test was significant (p < 0.001) when the NE, CE, and NE + CE lineages were used as foreground branches (Table 4). The results showed that the NE and CE lineages had a rapid evolutionary rate.
In the branch–site model, when the NE + CE lineage was taken as the foreground branch, although the p-value of the likelihood ratio test was not significant (p > 0.1), two positive selection sites were detected, which were consistent with the positive selection sites detected in the site model. These were at 70 (I 0.587 V) and 187 (A 0.811 T), respectively (Table 5), indicating that the NE and CE lineages had been subjected to positive selection pressure.

3.4. Comparison of the Catalytic Capacity of AANAT in Various Geographic Populations

The CoA production within 20 min was in the order LN > YN > blank control group (CG) (Figure 4a). There were significant differences between the three treatment groups, among which the catalytic capacity of AANAT recombinase in the LN and YN populations was significantly higher than that in the CG (Z = −6.7, padj < 0.0001; Z = −4.7, padj = 0.01). Additionally, the catalytic capacity of AANAT recombinase in the LN population was significantly higher than that in the YN population (Z = 2.2, padj = 0.02) (Figure 4b).
GLMM analysis showed that the CG was significantly different from the LN and YN populations (t = 36.45, p < 0.001; t = 23.49, p < 0.001), and there were also significant differences between LN and YN (t = −12.28, p < 0.001) (Table 6).

3.5. Prediction of the AANAT Protein Structure

The results of the secondary structure prediction revealed that the proportion of α helix in the LN population was 20%, while in the YN population, it was 21%. The main distinction was the difference in the length of the α helix, about 170 amino acids (Figure 5a). The results of tertiary structure prediction showed that the spatial folding of the LN population differed from that of the YN population, with an RMSD value of 0.203. Protein characterization predicted that leucine at position 32 of the YN population was located on the protein surface, while proline at position 33 of the LN population was also located on the protein surface (Figure 5b).

3.6. Drivers of Adaptive Evolution in AANAT

The genetic diversity of AANAT in different geographic populations was significantly correlated with climate factors related to temperature and precipitation (Figure 6). π and K were significantly correlated with BIO4 (p < 0.05). S was significantly correlated with BIO14, BIO17, and BIO19 (p < 0.05). Twelve climate-related characteristics showed significant correlations with AANAT genetic diversity. The genetic diversity of AANAT was significantly correlated with the geographic factors of latitude (Lat) and altitude (Alt). This suggests that environmental pressures, such as temperature, humidity, and changes in geographical scale have impacted the adaptive evolution of AANAT. The crucial factors were further examined using Partial Mantel analysis.
BIO2 showed a significant negative correlation with nonsynonymous sites, independent of other variables (r = −0.6, p < 0.05) (Figure 7a). This correlation remained significant even after accounting for the geographic factors of latitude and altitude (r = −0.6, p < 0.05). BIO3 and BIO13 were significantly correlated with the vS without considering other variables (r = −0.7, p < 0.05; r = 0.6, p < 0.05) (Figure 7b,d), but the correlation was not significant after controlling for geographic factors (p > 0.05). BIO8 was significantly correlated with altitude (r = 0.8, p ≤ 0.001) (Figure 7c), and BIO15 was not significantly correlated with any climatic or geographic factors (p > 0.05) (Figure 7e).

4. Discussion

The sequences of AANAT were examined, and four out of 171 SNPs were nonsynonymous mutations. The analysis indicated that genetic differentiation occurred in AANAT and did not follow a neutral model, as well as that signals of selection were present. The mismatch distribution curve of AANAT showed a bimodal distribution, indicating that the population size remained stable and did not experience expansion or continuous growth, suggesting that departure from expectations under neutrality was not caused by population expansion, but may have been influenced by selection. Studies have shown that the genetic variation of populations, as indicated by neutral markers, is consistent with the isolation-by-distance (IBD) model. This means that genetic variation gradually increases with geographic distance [43], suggesting the role of genetic drift. However, our neutrality test revealed that the gene sequences did not adhere to the neutral model of evolution, instead exhibiting signals of selective pressure.
AANAT is highly conserved in vertebrates, and it may have evolved early on through horizontal gene transfer [44] and thereafter was driven by natural selection [24]. The genetic diversity of the NE and CE lineages with longer hibernation times was greater than that of the SW lineage, indicating evolutionary potential and the ability to adapt to environmental changes [45]. Compared to the phylogenetic tree constructed using neutral markers [32], the AANAT phylogenetic tree revealed a mixed clustering of NE and CE lineages. This may be associated with the unique functions related to AANAT. The NE and CE lineages have a longer hibernation period, while the YN population of the SW lineage exhibits almost no hibernation behavior. In particular, two positively selected sites (70, I 0.693 V, 187, A 0.906 T) were detected in the NE and CE lineages, indicating the adaptive evolution of this gene. AANAT appears to be subject to specific selection pressures in different groups. For example, the functional diversification of the insect AANAT family has been shaped by positive selection [46]. The whole-gene replication process of AANAT in bony fishes may be attributed to its rapid evolution that facilitates genetic changes in response to environmental stress [47]. In a study of human delayed sleep phase syndrome (DSPS) focusing on AANAT, position 129 was identified as an SNP. The mutation of alanine to threonine at this site may be associated with differences in human sleep patterns [48]. This mutation was also identified in the present study and showed signals of positive selection, suggesting a potential relationship with differences in the timing of hibernation in the greater horseshoe bat.
The activity of AANAT is closely and positively correlated with the production of melatonin [49]. Differences in the catalytic capacity of AANAT will affect variation in the secretion of melatonin. In this study, we found that the expression of AANAT was increased following positive selection for a longer hibernation period. By regulating the secretion of melatonin, AANAT provides hibernation signals for hibernating organisms [50,51]. It also regulates neuroprotection during hibernation [52,53], and energy homeostasis [54]. The endocrine signals generated by the interaction of melatonin and photoperiod also impact the synthesis of leptin and growth hormone, both of which are related to the regulation of body weight [51] and work together to achieve the hypothermia required for hibernation, inhibiting metabolism and the endocrine response to fasting. A study of Atlantic salmon (Salmo salar) and European seabass (Dicentrarchus labrax) found that variation in melatonin production may be associated with differences in their respective marine habitats [55]. Reduced melatonin secretion weakens rhythmic behaviors in organisms, such as unihemispheric slow-wave sleep and long-term alertness behavior in cetaceans [56]. Duplication of the reindeer AANAT may have occurred in order to maintain active circadian and annual rhythms in polar regions where there is a lack of a consistent photoperiod [57,58]. By linking the physiological tolerance of organisms to evolutionary and biogeographic processes, researchers have found that AANAT duplication and loss occurred in the middle Eocene when a more seasonal climate emerged [24,59]. Based on the potential causal relationship between genetic and phenotypic adaptation [60], we hypothesized that the adaptive evolution of AANAT may be linked to its adjustment of hibernation rhythms.
It has been confirmed that the gene duplication and inactivation of AANAT were driven by environmental selection pressure [24]. AANAT exists in three copies (AANAT1a, AANAT1b, and AANAT2) in bony fishes [61]. The dynamical differences and different temperature–activity relationships exhibited by AANAT1a and AANAT1b may represent evolutionary responses to different environmental stresses [62,63]. The loss of AANAT in bottle-nosed dolphins [64] may be related to environmental factors such as a nonconstant photoperiod and limited temperature fluctuations in the ocean. The function of AANAT has evolved from a primitive detoxification role to promoting melatonin synthesis, thereby aiding in the adaptation of the eye and retina to the photoperiod. This significant change in function is believed to be the outcome of sustained stress from environmental and metabolic factors [9,65]. Furthermore, research has demonstrated that the expression of genes associated with the circadian rhythms of Daphnia magna exhibits a geographical gradient, indicating local adaptation to environmental stress [66]. Temperature may have been a selective pressure influencing the evolution of genes associated with circadian systems [67]. Obligatory diurnal and nocturnal mammals are more than twice as likely to adapt to climate change as those with flexible schedules. The response of mammals to climate change has been primarily influenced by their size and the timing of their activities [68]. In this study, we found that the variation in AANAT was primarily influenced by negative temperature factors represented by BIO2. This suggests that the genetic variation in species with a single copy of AANAT has been influenced by environmental selection pressure, similar to other functional genes such as the MHC genes that are significantly correlated with environmental temperature and humidity [69].

5. Conclusions

In this study, we cloned, sequenced, and analyzed the evolution of AANAT at the gene and protein levels in 11 geographic populations of greater horseshoe bats in China. We discovered that populations with longer hibernation periods exhibited greater levels of genetic diversity and were subject to positive selection. In vitro enzyme activity validation experiments demonstrated that the catalytic capacity of the AANAT enzyme was higher in populations undergoing positive selection. Therefore, we suggest that the variation in AANAT may be related to its role in the adaptation of hibernation rhythms and is negatively influenced by temperature factors. This study contributes to a better understanding of the evolution of AANAT and provides a theoretical basis for investigating the adaptive significance of a single copy of AANAT in chiropterans. Additionally, our results may provide evidence for the adaptation of the hibernation rhythm of greater horseshoe bats.

Author Contributions

Conceptualization, Y.X. and K.S.; methodology, L.W. and S.L.; software, Y.Z., L.W. and S.L.; validation, J.F., K.S. and Y.P.; investigation, S.L. and Y.P.; resources, Y.Z.; data curation, Y.Z.; writing—original draft preparation, Y.Z.; writing—review and editing, K.S. and Y.X.; visualization, Y.Z.; supervision, L.W.; project administration, Y.X.; funding acquisition, Y.X. All authors have read and agreed to the published version of the manuscript.

Funding

This research was funded by the National Natural Science Foundation of China (grant nos. 32171481, 32171525, 31961123001, 31870354 and 42130705).

Institutional Review Board Statement

This study adhered to the ASAB/ABS Guidelines for the Use of Animals in Research. All experimental procedures in this study were approved by the Science and Technology Ethics Committee of Northeast Normal University, China (approval number NENU-2019-04).

Informed Consent Statement

Not applicable.

Data Availability Statement

AANAT sequencing data have been deposited in the NCBI (PP358600–PP358728).

Acknowledgments

We would like to thank the experimental equipment support provided by the Engineering Research Center of Glycosome of the Ministry of Education in the Glycobiology Laboratory of Northeast Normal University.

Conflicts of Interest

The authors declare no conflicts of interest.

References

  1. Hastings, M.H.; Reddy, A.B.; Maywood, E.S. A clockwork web: Circadian timing in brain and periphery, in health and disease. Nat. Rev. Neurosci. 2003, 4, 649–661. [Google Scholar] [CrossRef] [PubMed]
  2. Wikelski, M.; Martin, L.B.; Scheuerlein, A.; Robinson, M.T.; Robinson, N.D.; Helm, B.; Hau, M.; Gwinner, E. Avian circannual clocks: Adaptive significance and possible involvement of energy turnover in their proximate control. Philos. Trans. R. Soc. B-Biol. Sci. 2007, 363, 411–423. [Google Scholar] [CrossRef] [PubMed]
  3. Reiter, R.J. The melatonin rhythm: Both a clock and a calendar. Experientia 1993, 49, 654–664. [Google Scholar] [CrossRef] [PubMed]
  4. Voultsios, A.; Kennaway, D.J.; Dawson, D. Salivary melatonin as a circadian phase marker: Validation and comparison to plasma melatonin. J. Biol. Rhythms 1997, 12, 457–466. [Google Scholar] [CrossRef] [PubMed]
  5. Wang, Z.W.; Dabrosin, C.; Yin, X.; Fuster, M.M.; Arreola, A.; Rathmell, W.K.; Generali, D.; Nagaraju, G.P.; El-Rayes, B.; Ribatti, D.; et al. Broad targeting of angiogenesis for cancer prevention and therapy. Semin. Cancer Biol. 2015, 35, S224–S243. [Google Scholar] [CrossRef] [PubMed]
  6. Klein, D.C.; Weller, J.L. Indole metabolism in the pineal gland: A circadian rhythm in N-acetyltransferase. Science 1970, 169, 1093–1095. [Google Scholar] [CrossRef]
  7. Klein, D.C.; Moore, R.Y. Pineal N-acetyltransferase and hydroxyindole-O-methyl-transferase: Control by the retinohypothalamic tract and the suprachiasmatic nucleus. Brain Res. 1979, 174, 245–262. [Google Scholar] [CrossRef] [PubMed]
  8. Ganguly, S.; Mummaneni, P.; Steinbach, P.J.; Klein, D.C.; Coon, S.L. Characterization of the Saccharomyces cerevisiae homolog of the melatonin rhythm enzyme arylalkylamine N-acetyltransferase (EC 2.3. 1.87). J. Biol. Chem. 2001, 276, 47239–47247. [Google Scholar] [CrossRef]
  9. Falcón, J.; Coon, S.L.; Besseau, L.; Cazaméa-Catalan, D.; Fuentès, M.; Magnanou, E.; Paulin, C.H.; Boeuf, G.; Sauzet, S.; Jorgensen, E.H.; et al. Drastic neofunctionalization associated with evolution of the timezyme AANAT 500 Mya. Proc. Natl. Acad. Sci. USA 2014, 111, 314–319. [Google Scholar] [CrossRef]
  10. Pavlicek, J.; Sauzet, S.; Besseau, L.; Coon, S.L.; Weller, J.L.; Boeuf, G.; Gaildrat, P.; Omelchenko, M.V.; Koonin, E.V.; Falcón, J.; et al. Evolution of AANAT: Expansion of the gene family in the cephalochordate amphioxus. BMC Evol. Biol. 2010, 10, 154. [Google Scholar] [CrossRef]
  11. Cox, K.H.; Takahashi, J.S. Circadian clock genes and the transcriptional architecture of the clock mechanism. J. Mol. Endocrinol. 2019, 63, R93–R102. [Google Scholar] [CrossRef] [PubMed]
  12. Gandhi, A.V.; Mosser, E.A.; Oikonomou, G.; Prober, D.A. Melatonin is required for the circadian regulation of sleep. Neuron 2015, 85, 1193–1199. [Google Scholar] [CrossRef] [PubMed]
  13. Wang, J.; Zhu, T.; Ma, X.; Wang, Y.; Liu, J.; Li, G.; Liu, Y.; Ji, P.; Zhang, Z.; Zhang, L.; et al. Melatonergic systems of AANAT, melatonin, and its receptor MT2 in the corpus luteum are essential for reproductive success in mammals. Biol. Reprod. 2021, 104, 430–444. [Google Scholar] [CrossRef] [PubMed]
  14. Zhang, C.; Clough, S.J.; Adamah-Biassi, E.B.; Sveinsson, M.H.; Hutchinson, A.J.; Miura, I.; Furuse, T.; Wakana, S.; Matsumoto, Y.K.; Okanoya, K.; et al. Impact of endogenous melatonin on rhythmic behaviors, reproduction, and survival revealed in melatonin-proficient C57BL/6J congenic mice. J. Pineal Res. 2021, 71, e12748. [Google Scholar] [CrossRef] [PubMed]
  15. Yu, E.Z.; Hallenbeck, J.M.; Cai, D.; McCarron, R.M. Elevated arylalkylamine-N-acetyltransferase (AA-NAT) gene expression in medial habenular and suprachiasmatic nuclei of hibernating ground squirrels. Mol. Brain Res. 2002, 102, 9–17. [Google Scholar] [CrossRef] [PubMed]
  16. Stanton, T.L.; Daley, J.C.; Salzman, S.K. Prolongation of hibernation bout duration by continuous intracerebroventricular infusion of melatonin in hibernating ground squirrels. Brain Res. 1987, 413, 350–355. [Google Scholar] [CrossRef] [PubMed]
  17. Mustonen, A.M.; Nieminen, P.; Puukka, M.; Asikainen, J.; Saarela, S.; Karonen, S.L.; Kukkonen, J.V.K.; Hyvarinen, H. Physiological adaptations of the raccoon dog (Nyctereutes procyonoides) to seasonal fasting-fat and nitrogen metabolism and influence of continuous melatonin treatment. J. Comp. Physiol. B 2004, 174, 1–12. [Google Scholar] [PubMed]
  18. Aboalroub, A.A.; Zhang, Z.; Keramisanou, D.; Gelis, I. Backbone resonance assignment of an insect arylalkylamine N-acetyltransferase from Bombyx mori reveals conformational heterogeneity. Biomol. NMR Assign. 2017, 11, 105–109. [Google Scholar] [CrossRef] [PubMed]
  19. Zilberman-Peled, B.; Benhar, I.; Coon, S.L.; Ron, B.; Gothilf, Y. Duality of serotonin-N-acetyltransferase in the gilthead seabream (Sparus aurata): Molecular cloning and characterization of recombinant enzymes. Gen. Comp. Endocrinol. 2004, 138, 139–147. [Google Scholar] [CrossRef]
  20. Kim, W.; Park, H.; Seo, S. Global metabolic reconstruction and metabolic gene evolution in the cattle genome. PLoS ONE 2016, 11, e0150974. [Google Scholar] [CrossRef]
  21. Huelsmann, M.; Hecker, N.; Springer, M.S.; Gatesy, J.; Sharma, V.; Hiller, M. Genes lost during the transition from land to water in cetaceans highlight genomic changes associated with aquatic adaptations. Sci. Adv. 2019, 5, eaaw6671. [Google Scholar] [CrossRef]
  22. Valente, R.; Alves, F.; Sousa-Pinto, I.; Ruivo, R.; Castro, L.F.C. Functional or vestigial? The genomics of the pineal gland in Xenarthra. J. Mol. Evol. 2021, 89, 565–575. [Google Scholar] [CrossRef]
  23. Emerling, C.A.; Springer, M.S.; Gatesy, J.; Jones, Z.; Hamilton, D.; Xia-Zhu, D.; Collin, M.; Delsuc, F. Genomic evidence for the parallel regression of melatonin synthesis and signaling pathways in placental mammals [version 2; peer review: 2 approved]. Open Res. Eur. 2021, 1, 75. [Google Scholar] [CrossRef]
  24. Yin, D.Q.; Zhou, R.R.; Yin, M.X.; Chen, Y.; Xu, S.X.; Yang, G. Gene duplication and loss of AANAT in mammals driven by rhythmic adaptations. Mol. Biol. Evol. 2021, 38, 3925–3937. [Google Scholar] [CrossRef] [PubMed]
  25. Teeling, E.C.; Vernes, S.C.; Dávalos, L.M.; Ray, D.A.; Gilbert, M.T.P.; Myers, E. Bat biology, genomes, and the Bat1K project: To generate chromosome-level genomes for all living bat species. Annu. Rev. Anim. Biosci. 2018, 6, 23–46. [Google Scholar] [CrossRef]
  26. Sadier, A.; Urban, D.J.; Anthwal, N.; Howenstine, A.O.; Sinha, I.; Sears, K.E. Making a bat: The developmental basis of bat evolution. Genet. Mol. Biol. 2020, 43, e20190146. [Google Scholar] [CrossRef]
  27. Iuvone, P.M.; Tosini, G.; Pozdeyev, N.; Haque, R.; Klein, D.C.; Chaurasia, S.S. Circadian clocks, clock networks, arylalkylamine N-acetyltransferase, and melatonin in the retina. Prog. Retin. Eye Res. 2005, 24, 433–456. [Google Scholar] [CrossRef]
  28. Reiter, R.J. Pineal melatonin: Cell biology of its synthesis and of its physiological interactions. Endocr. Rev. 1991, 12, 151–180. [Google Scholar] [CrossRef] [PubMed]
  29. Haldar, C.; Yadav, R.; Alipreeta. Annual reproductive synchronization in ovary and pineal gland function of female short-nosed fruit bat, Cynopterus sphinx. Comp. Biochem. Physiol. A-Mol. Integr. Physiol. 2006, 144, 395–400. [Google Scholar] [CrossRef] [PubMed]
  30. Srivastava, R.K.; Krishna, A. Melatonin modulates glucose homeostasis during winter dormancy in a vespertilionid bat, Scotophilus heathi. Comp. Biochem. Physiol. A-Mol. Integr. Physiol. 2010, 155, 392–400. [Google Scholar] [CrossRef]
  31. Banerjee, A.; Udin, S.; Krishna, A. Regulation of leptin synthesis in white adipose tissue of the female fruit bat, Cynopterus sphinx role of melatonin with or without insulin. Exp. Physiol. 2011, 96, 216–225. [Google Scholar] [CrossRef] [PubMed]
  32. Sun, K.P.; Luo, L.; Kimball, R.T.; Wei, X.W.; Jin, L.R.; Jiang, T.L.; Li, G.H.; Feng, J. Geographic variation in the acoustic traits of greater horseshoe bats: Testing the importance of drift and ecological selection in evolutionary processes. PLoS ONE 2013, 8, e70368. [Google Scholar] [CrossRef] [PubMed]
  33. Xiao, Y.H.; Wu, Y.H.; Sun, K.P.; Wang, H.; Jiang, T.L.; Lin, A.Q.; Huang, X.B.; Yue, X.K.; Shi, L.M.; Feng, J. Gene expression and adaptive evolution of ZBED1 in the hibernating greater horseshoe bat (Rhinolophus ferrumequinum). J. Exp. Biol. 2016, 219, 834–843. [Google Scholar] [PubMed]
  34. Pavlicek, J.; Coon, S.L.; Ganguly, S.; Weller, J.L.; Hassan, S.A.; Sackett, D.L.; Klein, D.C. Evidence that proline focuses movement of the floppy loop of arylalkylamine N-acetyltransferase (EC 2.3.1.87). J. Biol. Chem. 2008, 283, 14552–14558. [Google Scholar] [CrossRef]
  35. Leng, P.Q.; Zhao, F.L.; Yin, B.C.; Ye, B.C. A novel, colorimetric method for biogenic amine detection based on arylalkylamine N-acetyltransferase. Chem. Commun. 2015, 51, 8712–8714. [Google Scholar] [CrossRef] [PubMed]
  36. Bolker, B.M.; Brooks, M.E.; Clark, C.J.; Geange, S.W.; Poulsen, J.R.; Stevens, M.H.H.; White, J.S.S. Generalized linear mixed models: A practical guide for ecology and evolution. Trends Ecol. Evol. 2009, 24, 127–135. [Google Scholar] [CrossRef] [PubMed]
  37. Librado, P.; Rozas, J. DnaSP v5: A software for comprehensive analysis of DNA polymorphism data. Bioinformatics 2009, 25, 1451–1452. [Google Scholar] [CrossRef] [PubMed]
  38. Leigh, J.W.; Bryant, D. POPART: Full-feature software for haplotype network construction. Methods Ecol. Evol. 2015, 6, 1110–1116. [Google Scholar] [CrossRef]
  39. Zhao, H.B. Molecular Mechanism of Geographic Variation Inecholocation Calls of the Greater Horseshoe Bat. Ph.D. Thesis, Northeast Normal University, Changchun, China, 2020. [Google Scholar]
  40. Yang, Z.H. PAML 4: Phylogenetic analysis by maximum likelihood. Mol. Biol. Evol. 2007, 24, 1586–1591. [Google Scholar] [CrossRef]
  41. Goodchild, M.F. Geographical data modeling. Comput. Geosci. 1992, 18, 401–408. [Google Scholar] [CrossRef]
  42. Francioli, L.C.; Menelaou, A.; Pulit, S.L.; Van Dijk, F.; Palamara, P.F.; Elbers, C.C.; Neerincx, P.B.T.; Ye, K.; Guryev, V.; Kloosterman, W.P.; et al. Whole-genome sequence variation, population structure and demographic history of the Dutch population. Nat. Genet. 2014, 46, 818–825. [Google Scholar]
  43. Luo, L. Genetic Diversity and Population Structure of Rhinolophus ferrumequinum in China Based on Microsatellite. Master’s Thesis, Northeast Normal University, Changchun, China, 2011. [Google Scholar]
  44. Zhang, L.; Tang, Y.; Merkler, D.J.; Han, Q. Function, structure, evolution, regulation of a potent drug target, arylalkylamine N-acetyltransferase. Adv. Protein Chem. Struct. Biol. 2023, 134, 211–223. [Google Scholar] [PubMed]
  45. Hu, Y.B.; Fan, H.Z.; Chen, Y.H.; Chang, J.; Zhan, X.J.; Wu, H.; Zhang, B.W.; Wang, M.; Zhang, W.Y.; Yang, L.; et al. Spatial patterns and conservation of genetic and phylogenetic diversity of wildlife in China. Sci. Adv. 2021, 7, eabd5725. [Google Scholar] [CrossRef] [PubMed]
  46. Tang, Y.; Chen, H.Q.; Lin, Z.N.; Zhang, L.; Upadhyay, A.; Liao, C.H.; Merkler, D.J.; Han, Q. Evolutionary genomics analysis reveals gene expansion and functional diversity of arylalkylamine N-acetyltransferases in the Culicinae subfamily of mosquitoes. Insect Sci. 2023, 30, 569–581. [Google Scholar] [CrossRef] [PubMed]
  47. Falcón, J.; Besseau, L.; Fuentès, M.; Sauzet, S.; Magnanou, E.; Boeuf, G. Structural and functional evolution of the pineal melatonin system in vertebrates. Ann. N. Y. Acad. Sci. 2009, 1163, 101–111. [Google Scholar] [CrossRef] [PubMed]
  48. Hohjoh, H.; Takasu, M.; Shishikura, K.; Takahashi, Y.; Honda, Y.; Tokunaga, K. Significant association of the arylalkylamine N-acetyltransferase (AA-NAT) gene with delayed sleep phase syndrome. Neurogenetics 2003, 4, 151–153. [Google Scholar] [CrossRef] [PubMed]
  49. Byeon, Y.; Back, K. Low melatonin production by suppression of either serotonin N-acetyltransferase or N-acetylserotonin methyltransferase in rice causes seedling growth retardation with yield penalty, abiotic stress susceptibility, and enhanced coleoptile growth under anoxic conditions. J. Pineal Res. 2016, 60, 348–359. [Google Scholar] [PubMed]
  50. Mustonen, A.-M.; Nieminen, P. A review of the physiology of a survival expert of big freeze, deep snow, and an empty stomach: The boreal raccoon dog (Nyctereutes procyonoides). J. Comp. Physiol., B 2018, 188, 15–25. [Google Scholar] [CrossRef] [PubMed]
  51. Nieminen, P.; Mustonen, A.-M.; Asikainen, J.; Hyvärinen, H. Seasonal weight regulation of the raccoon dog (Nyctereutes procyonoides): Interactions between melatonin, leptin, ghrelin, and growth hormone. J. Biol. Rhythms 2002, 17, 155–163. [Google Scholar] [CrossRef]
  52. Schwartz, C.; Ballinger, M.A.; Andrews, M.T. Melatonin receptor signaling contributes to neuroprotection upon arousal from torpor in thirteen-lined ground squirrels. Am. J. Physiol.-Regul. Integr. Comp. Physiol. 2015, 309, R1292–R1300. [Google Scholar] [CrossRef]
  53. Reiter, R.J.; Rosales-Corral, S.; Tan, D.X.; Jou, M.J.; Galano, A.; Xu, B. Melatonin as a mitochondria-targeted antioxidant: One of evolution’s best ideas. Cell. Mol. Life Sci. 2017, 74, 3863–3881. [Google Scholar] [CrossRef] [PubMed]
  54. Willis, C.K.R.; Wilcox, A. Hormones and hibernation: Possible links between hormone systems, winter energy balance and white-nose syndrome in bats. Horm. Behav. 2014, 66, 66–73. [Google Scholar] [CrossRef]
  55. McStay, E.; Migaud, H.; Vera, L.M.; Sánchez-Vázquez, F.J.; Davie, A. Comparative study of pineal clock gene and AANAT2 expression in relation to melatonin synthesis in Atlantic salmon (Salmo salar) and European seabass (Dicentrarchus labrax). Comp. Biochem. Physiol. A-Mol. Integr. Physiol. 2014, 169, 77–89. [Google Scholar] [CrossRef] [PubMed]
  56. Ringo, J.L.; Doty, R.W.; Demeter, S.; Simard, P.Y. Time is of the essence a conjecture that hemispheric specialization arises from interhemispheric conduction delay. Cereb. Cortex 1994, 4, 331–343. [Google Scholar] [CrossRef] [PubMed]
  57. van Oort, B.E.H.; Tyler, N.J.C.; Gerkema, M.P.; Folkow, L.; Stokkan, K.-A. Where clocks are redundant: Weak circadian mechanisms in reindeer living under polar photic conditions. Naturwissenschaften 2007, 94, 183–194. [Google Scholar] [CrossRef] [PubMed]
  58. Arnold, W.; Ruf, T.; Loe, L.E.; Irvine, R.J.; Ropstad, E.; Veiberg, V.; Albon, S.D. Circadian rhythmicity persists through the Polar night and midnight sun in Svalbard reindeer. Sci. Rep. 2018, 8, 14466. [Google Scholar] [CrossRef]
  59. Kerkhoff, A.J.; Moriarty, P.E.; Weiser, M.D. The latitudinal species richness gradient in New World woody angiosperms is consistent with the tropical conservatism hypothesis. Proc. Natl. Acad. Sci. USA 2014, 111, 8125–8130. [Google Scholar] [CrossRef]
  60. Sharma, V.; Hecker, N.; Roscito, J.G.; Foerster, L.; Langer, B.E.; Hiller, M. A genomics approach reveals insights into the importance of gene losses for mammalian adaptations. Nat. Commun. 2018, 9, 1215. [Google Scholar] [CrossRef] [PubMed]
  61. Coon, S.L.; Klein, D.C. Evolution of arylalkylamine N-acetyltransferase: Emergence and divergence. Mol. Cell. Endocrinol. 2006, 252, 2–10. [Google Scholar] [CrossRef]
  62. Isorna, E.; Aliaga-Guerrero, M.; M’Rabet, A.E.; Servili, A.; Falcón, J.; Muñoz-Cueto, J.A. Identification of two arylalkylamine N-acetyltranferase1 genes with different developmental expression profiles in the flatfish Solea senegalensis. J. Pineal Res. 2011, 51, 434–444. [Google Scholar] [CrossRef]
  63. Paulin, C.H.; Cazaméa-Catalan, D.; Zilberman-Peled, B.; Herrera-Perez, P.; Sauzet, S.; Magnanou, E.; Fuentès, M.; Gothilf, Y.; Muñoz-Cueto, J.A.; Falcón, J.; et al. Subfunctionalization of arylalkylamine N-acetyltransferases in the sea bass Dicentrarchus labrax two-ones for one two. J. Pineal Res. 2015, 59, 354–364. [Google Scholar] [CrossRef] [PubMed]
  64. Lyamin, O.I.; Manger, P.R.; Ridgway, S.H.; Mukhametov, L.M.; Siegel, J.M. Cetacean sleep: An unusual form of mammalian sleep. Neurosci. Biobehav. Rev. 2008, 32, 1451–1484. [Google Scholar] [CrossRef] [PubMed]
  65. Iyer, L.M.; Aravind, L.; Coon, S.L.; Klein, D.C.; Koonin, E.V. Evolution of cell-cell signaling in animals: Did late horizontal gene transfer from bacteria have a role? Trends Genet. 2004, 20, 292–299. [Google Scholar] [CrossRef] [PubMed]
  66. Schwarzenberger, A.; Handke, N.H.; Romer, T.; Wacker, A. Geographic clines in Daphnia magna’s circadian clock gene expression: Local adaptation to photoperiod. Zoology 2021, 144, 12856. [Google Scholar] [CrossRef] [PubMed]
  67. Moreno, J.M.; Jesus, T.F.; Coelho, M.M.; Sousa, V.C. Adaptation and convergence in circadian-related genes in Iberian freshwater fish. BMC Ecol. Evol. 2021, 21, 38. [Google Scholar] [CrossRef] [PubMed]
  68. McCain, C.M.; King, S.R.B. Body size and activity times mediate mammalian responses to climate change. Glob. Chang. Biol. 2014, 20, 1760–1769. [Google Scholar] [CrossRef]
  69. Li, X.L.; Liu, T.; Li, A.Q.; Xiao, Y.H.; Sun, K.P.; Feng, J. Diversifying selection and climatic effects on major histocompatibility complex class II gene diversity in the greater horseshoe bat. Evol. Appl. 2023, 16, 688–704. [Google Scholar] [CrossRef]
Figure 1. Sampling distribution map of Rhinolophus ferrumequinum. The numbers in parentheses are the number of samples. The bottom left color diagram explains the colors in the accumulated temperature heat map. Acctemp = accumulated temperature. Different populations belong to different genetic lineages, where red represents the northeast (NE), black indicates the central east (CE), and green indicates the southwest (SW).
Animals 14 01426 g001
Figure 2. AANAT genetic diversity parameters of various (a) populations and (b) lineages. π, θ-Wseq, and θ-Wsite refer to the secondary coordinates, and the remaining parameters refer to the primary coordinates. π = average nucleotide diversity; K = average number of nucleotide differences; S = number of polymorphic sites; h = number of haplotypes; Hd = haplotype diversity; θ-Wseq = θper sequence from the total number of mutations; θ-Wsite = θper site from the total number of mutations. The population and lineage abbreviations are shown in Figure 1.
Animals 14 01426 g002
Figure 3. Molecular evolutionary relationships of the AANAT. (a) Unrooted evolutionary tree for AANAT based on the maximum likelihood method. The purple circles of different sizes indicate bootstrap values for the evolutionary trees. (b) AANAT nucleotide level haplotype network diagram. The size of the circle indicates the size of the sample. Nodes are proportional to the number of bats carrying each haplotype and are colored according to the bat population (see the illustration).
Animals 14 01426 g003
Figure 4. Comparison of catalytic efficiency of AANAT recombinase in different geographical populations. (a) Time curve of CoA production between the experimental group (YN, LN) and the blank group (CG). (b) Comparison of catalytic capacities of AANAT recombinase in different geographical populations. YN = YN population, LN = LN population, CG = blank control group. The * symbol means 0.01 < p < 0.05, and the *** symbol means p ≤ 0.001.
Animals 14 01426 g004
Figure 5. AANAT protein prediction results. (a) Areas of the secondary structure of the AANAT protein with differences between LN and YN. The green helix in the diagram indicates an alpha helix and the blue arrow indicates a beta fold. (b) Prediction results of AANAT protein interface characterization in YN and LN. The red color in the diagram indicates residues located on the surface of the protein and the blue color indicates residues located inside the protein.
Animals 14 01426 g005
Figure 6. Correlations between genetic diversity and climate factors. The color gradient and edge width in the heat map represent Spearman correlation coefficients. The pink line indicates that there is a significant correlation between AANAT genetic diversity and climate factors, and the blue line indicates that there is a significant correlation between AANAT genetic diversity and climate factors. Hd = haplotype diversity; VHd = variance of haplotype diversity; SDHd = standard deviation of haplotype diversity; π = average nucleotide diversity; SDπ = standard deviation of π; k = average number of nucleotide differences; S = number of polymorphic sites; vS = singleton variable sites; InvS = invariable sites; SynoS = synonymous sites; NDSynoS = nucleotide diversity synonymous sites; NonSynoS = nonsynonymous sites; NDNonSynoS = nucleotide diversity nonsynonymous sites; Eta = total number of mutations; Eta.s. = total number of singleton mutations; θ-Wsite = θper site from Eta; θ-Wseq = θper sequence from Eta; Npi = number of parsimony informative sites; InDel = indel diversity. The * symbol means 0.01 < p < 0.05, the ** symbol means 0.001 < p ≤ 0.01, and the *** symbol means p ≤ 0.001.
Animals 14 01426 g006
Figure 7. Partial Mantel test for climatic factors and genetic diversity. (a) Monthly mean temperature (BIO2); (b) isothermality (Bio2/Bio7) (×100) (BIO3); (c) mean temperature of wettest quarter (BIO8); (d) precipitation of the wettest month (BIO13); and (e) precipitation seasonality (coefficient of variation) (BIO15). The horizontal coordinate represents the control variable. Pink-colored blocks in the heatmap indicate a negative correlation between AANAT genetic diversity and climate factors, and blue-colored blocks indicate a positive correlation. * 0.01 < p < 0.05; ** 0.001 < p ≤ 0.01; *** p ≤ 0.001. Hd = haplotype diversity; k = average number of nucleotide differences; S = number of polymorphic sites; NDSynoS = nucleotide diversity synonymous sites; NonSynoS = nonsynonymous sites; NDNonSynoS = nucleotide diversity nonsynonymous sites; Lat = latitude; Alt = altitude.
Animals 14 01426 g007
Table 1. Primer design and PCR information.
NameBase Sequence (5′-3′)AnnealingExtendingProducts
1.1FTCAACACCTAGCAAGAGC55 °C2 min1981 bp
1.1RGTCCCAAAGTGAACCGAT
1.2FCTGTTACCTGCGGCTCAAC57 °C2.5 min2394 bp
1.2RTGTCACCTCTGCGGATACCT
2FTGCCGCAGCCTTCATCTCTGTCTCG57 °C1.8 min1712 bp
2RCCTCAGGAAGAATGAAAGCTGGAACCTT
Table 2. Abbreviations of 19 bioclimatic factors downloaded from CHELSA.
AbbreviationBioclimatic Variable
BIO1Annual Mean Temperature
BIO2Monthly Mean Temperature
BIO3Isothermality (Bio2/Bio7) (×100)
BIO4Temperature Seasonality (standard deviation) (×100)
BIO5Max Temperature of Warmest Month
BIO6Min Temperature of Coldest Month
BIO7Temperature Annual Range (Bio5-Bio6)
BIO8Mean Temperature of Wettest Quarter
BIO9Mean Temperature of Driest Quarter
BIO10Mean Temperature of Warmest Quarter
BIO11Mean Temperature of Coldest Quarter
BIO12Annual Precipitation
BIO13Precipitation of Wettest Month
BIO14Precipitation of Driest Month
BIO15Precipitation Seasonality (Coefficient of Variation)
BIO16Precipitation of Wettest Quarter
BIO17Precipitation of Driest Quarter
BIO18Precipitation of Warmest Quarter
BIO19Precipitation of Coldest Quarter
Table 3. The positive selection analyses for the site model.
ModelParameters EstimateLn Ldf2ΔLn L p-ValuePositively Selected Sites
M0 (one-ratio)ω = 0.05305−1010.615442 29 None
M1a (neutral)p0 = 0.95691, p1 = 0.04309
ω0 = 0.00000, ω1 = 1.00000
−1002.789947 30 None
M2a (selection)p0 = 0.97461, p1 = 0.00000, p2 = 0.02539
ω0 = 0.00490, ω1 = 1.00000, ω2 = 1.93757
−1002.481582 32 70I (0.573), 187A (0.800)
M3 (discrete)p0 = 0.29208, p1 = 0.68253, p2 = 0.02539
ω0 = 0.00490, ω1 = 0.00490, ω2 = 1.93760
−1002.481582 33 None
M7 (beta)p = 0.01000, q = 0.17324−1004.096785 30 None
M8 (beta and ω > 1)p0 = 0.97460, p = 0.51911, q = 99.00000
(p1 = 0.02540), ω = 1.93628
−1002.482059 32 70I (0.693), 187A (0.906)
M8a (beta and ω = 1)p0 = 0.95691, p = 0.00500, q = 2.54319
(p1 = 0.04309), ω = 1.00000
−1002.789924 31 None
LRT of variable ω values among branches
M0 vs. M3 416.26772 0.05 < p < 0.1
M1a vs. M2a 20.61673 0.5 < p < 0.9
M7 vs. M8 23.229452 0.1 < p < 0.5
M8 vs. M8a 10.61573 0.1 < p < 0.5
Significant value of p < 0.05 for LRT.
Table 4. The positive selection analysis for the branch model.
ModelForeground BranchParameter EstimatesLn Ldf2ΔLn L p-Value
One-ratio ω = 0.05304−1010.615442 30
Free-ratio −1009.141884 57
Two-ratioNEω0 = 0.05688, ω1 = 0.04539−1010.584015 31
CEω0 = 0.04230, ω1 = 0.05905−1010.545700 31
SWω0 = 0.05438, ω1 = 0.00010−1010.459894 31
NE + CEω0 = 0.00010, ω1 = 0.05438−1010.459894 31
Two-ratio, ω = 1NEω0 = 0.05686, ω1 = 1.00000−1024.101938 30
CEω0 = 0.04229, ω1 = 1.00000−1034.724656 30
SWω0 = 0.05305, ω1 = 1.00000−1010.615980 30
NE + CEω0 = 0.00010, ω1 = 1.00000−1048.017833 30
LRT of variable ω values among branches
Free-ratio vs. one-ratio 272.947116 1
LRT of ω at specific lineages
Two-ratio vs. one-ratioNE 10.062854 0.5 < p < 0.9
CE 10.139484 0.5 < p < 0.9
SW 10.311096 0.5 < p < 0.9
NE + CE 10.311096 0.5 < p < 0.9
Two-ratio vs. two-ratio (ω1 = 1)NE 127.035846 p < 0.001
CE 148.357912 p < 0.001
SW 10.312172 0.5 < p < 0.9
NE + CE 175.115878 p < 0.001
The branches that were defined as the foreground branches are shown in the Section 2. Significant values of p < 0.05 for LRT.
Table 5. The positive selection analyses for the branch–site model.
Foreground BranchParameter EstimatesLn Ldf2ΔLn Lnpp-ValueSelected Sites
NENull−1001.92697410.134988320.9 < p < 0.97None
p0 = 0.96733, p1 = 0.03267, p2a = 0.00000, p2b = 0.00000
Background:
ω0 = 0.00000, ω1 = 1.00000, ω2a = 0.00000, ω2b = 1.00000
Foreground:
ω0 = 0.00000, ω1 = 1.00000, ω2a = 1.00000, ω2b = 1.00000
Aternative−1001.859480 33
p0 = 0.96160, p1 = 0.02817, p2a = 0.00994, p2b = 0.00029
Background:
ω0 = 0.00000, ω1 = 1.00000, ω2a = 0.00000, ω2b = 1.00000
Foreground:
ω0 = 0.00000, ω1 = 1.00000, ω2a = 1.00000, ω2b = 1.00000
CENull−1001.92697410321None
p0 = 0.96733, p1 = 0.03267, p2a = 0.00000, p2b = 0.00000
Background:
ω0 = 0.00000, ω1 = 1.00000, ω2a = 0.00000, ω2b = 1.00000
Foreground:
ω0 = 0.00000, ω1 = 1.00000, ω2a = 1.00000, ω2b = 1.00000
Aternative−1001.926974 33
p0 = 0.96733, p1 = 0.03267, p2a = 0.00000, p2b = 0.00000
Background:
ω0 = 0.00000, ω1 = 1.00000, ω2a = 0.00000, ω2b = 1.00000
Foreground:
ω0 = 0.00000, ω1 = 1.00000, ω2a = 1.00000, ω2b = 1.00000
NE + CENull−1002.65038910.666436320.1 < p < 0.570I (0.587)
187A (0.811)
p0 = 0.95622, p1 = 0.00000, p2a = 0.04378, p2b = 0.00000
Background:
ω0 = 0.00000, ω1 = 1.00000, ω2a = 0.00000, ω2b = 1.00000
Foreground:
ω0 = 0.00000, ω1 = 1.00000, ω2a = 1.00000, ω2b = 1.00000
Aternative−1002.317171 33
p0 = 0.97334, p1 = 0.00000, p2a = 0.02666, p2b = 0.00000
Background:
ω0 = 0.00396, ω1 = 1.00000, ω2a = 0.00396, ω2b = 1.00000
Foreground:
ω0 = 0.00396, ω1 = 1.00000, ω2a = 1.93612, ω2b = 1.93612
SWNull−1002.78994710321None
p0 = 0.95691, p1 = 0.04309, p2a = 0.00000, p2b = 0.00000
Background:
ω0 = 0.00000, ω1 = 1.00000, ω2a = 0.00000, ω2b = 1.00000
Foreground:
ω0 = 0.00000, ω1 = 1.00000, ω2a = 1.00000, ω2b = 1.00000
Aternative−1002.789947 33
p0 = 0.95691, p1 = 0.04309, p2a = 0.00000, p2b = 0.00000
Background:
ω0 = 0.00000, ω1 = 1.00000, ω2a = 0.00000, ω2b = 1.00000
Foreground:
ω0 = 0.00000, ω1 = 1.00000, ω2a = 1.00000, ω2b = 1.00000
Table 6. The results of the estimation of the effect of the group in the GLMM on the catalytic rate of the AANAT enzyme.
Fixed EffectsEstimateStd. Errort-Valuep-Value
Intercept 1−8.234000.05266−156.35<0.001 ***
LN vs. CG2.233740.0612936.45<0.001 ***
YN vs. CG1.442370.0614123.49<0.001 ***
Intercept 2−6.000390.04563−131.51<0.001 ***
YN vs. LN−0.792050.06452−12.28<0.001 ***
CG vs. LN−2.229120.06452−34.55<0.001 ***
LN = LN population, YN = YN population, CG = blank control group. The *** symbol indicates p ≤ 0.001.
Disclaimer/Publisher’s Note: The statements, opinions and data contained in all publications are solely those of the individual author(s) and contributor(s) and not of MDPI and/or the editor(s). MDPI and/or the editor(s) disclaim responsibility for any injury to people or property resulting from any ideas, methods, instructions or products referred to in the content.

