Simple Summary
In livestock agriculture, increasing muscle growth and meat output has been a continual hot subject. A few natural compounds have proved to have the ability to accelerate muscle growth. Sulforaphane (SFN), abundant in cruciferous vegetables, has previously been shown to enhance skeletal muscle growth. In this work, we found that SFN could activate the skeletal muscle stem cell amplification. Furthermore, the underlying mechanisms were investigated. This work contributes to our understanding of how organisms interact with environmental cues such as nutrition and indicates a potential technique to boost animal output by managing feed. Meanwhile, our research is taking us one step closer to understanding how green vegetables, such as broccoli, enhance fitness and health while reducing calorie intake.
Abstract
Satellite cells take an indispensable place in skeletal muscle regeneration, maintenance, and growth. However, only limited works have investigated effects of dietary compounds on the proliferation of porcine satellite cells (PSCs) and related mechanisms. Sulforaphane (SFN) at multiple levels was applied to PSCs. The PSCs’ viability and HDAC activity were measured with a WST-1 cell proliferation kit and Color-de-Lys® HDAC colorimetric activity assay kit. Gene expression and epigenetics modification were tested with qRT-PCR, Western blot, bisulfite sequencing, and ChIP-qPCR. This study found that SFN enhanced PSC proliferation and altered mRNA expression levels of myogenic regulatory factors. In addition, SFN inhibited histone deacetylase (HDAC) activity, disturbed mRNA levels of HDAC family members, and elevated acetylated histone H3 and H4 abundance in PSCs. Furthermore, both mRNA and protein levels of the Smad family member 7 (SMAD7) in PSCs were upregulated after SFN treatment. Finally, it was found that SFN increased the acetylation level of histone H4 in the SMAD7 promoter, decreased the expression of microRNAs, including ssc-miR-15a, ssc-miR-15b, ssc-miR-92a, ssc-miR-17-5p, ssc-miR-20a-5p, and ssc-miR-106a, targeting SMAD7, but did not impact on the SMAD7 promoter’s methylation status in PSCs. In summary, SFN was found to boost PSC proliferation and epigenetically increase porcine SMAD7 expression, which indicates a potential application of SFN in modulation of skeletal muscle growth.
Keywords:
pig; sulforaphane; muscle growth; skeletal muscle stem cell; histone acetylation; microRNA 1. Introduction
Satellite cells are skeletal muscle stem cells that are found between the plasma membrane and the basal lamina of myofibers, where they are kept in a mitotically quiescent condition until they are activated to form myoblasts [1]. Myoblasts are incorporated into existing myofibers or other myoblasts as myogenesis progresses, supporting muscle growth and regeneration. Myonuclei accumulation is closely related to the increase in myofiber size and muscle mass [2]. Multiple components, such as myogenic regulatory factors and myocyte enhancer factor 2 (MEF2) family members, help to organize and drive myogenesis [3]. Porcine satellite cells (PSCs) serve as a good model to study skeletal muscle stem cell activity [4].
SMAD family member 7 (SMAD7) is an important regulator of skeletal muscle development and regeneration by blocking transforming growth factor β (TGF-β) signaling [5]. In mice, overexpression of SMAD7 reverses myostatin-induced skeletal muscle atrophy and causes skeletal muscular growth. [6]. SMAD7-null mice, on the other hand, have a deficiency in myoblast proliferation and have a low muscle mass [7]. Adeno-associated virus mediated SMAD7 administration alleviates cancer-related muscular atrophy in mice [6]. SMAD7 also can induce myogenesis by interacting directly with MYOD in the nucleus [8]. As a critical modulator of TGF-β signaling, the expression and stability of SMAD7 are modulated in multiple ways, including lysine residue acetylation [9], promoter methylation [10], and microRNA (miRNA) post-transcriptional regulation [11].
Sulforaphane (SFN) suppresses histone deacetylase (HDAC) activity while also being a strong inducer of phase II enzyme via nuclear factor E2-related factor-2 (NFE2L2, also termed Nrf2) signaling [12]. SFN shows a lot of promise as a cancer chemoprevention agent. Meanwhile, diet supplemented with SFN is shown to suppress the delayed onset muscle soreness in humans through Nrf2 activation [13], increases the amount of skeletal muscle satellite cell for muscle homeostasis, hypertrophy, or repair in mice [14], and alleviates muscle atrophy through the Nrf2 and Akt/Foxo1 pathway [15,16]. Furthermore, in recent years, the potential use of SFN in the agriculture business has gained a lot of attention [4,17]. As previously established, SFN epigenetically decreases myostatin expression in PSCs [4]. However, there have been few investigations on the impact of SFN on PSCs. The current study looks into the influence of SFN on PSCs as well as the underlying processes.
2. Materials and Methods
2.1. Porcine Skeletal Muscle Satellite Cell Culture
The semimembranosus muscles of 21 days old purebred Pietrain male piglets were used for PSC isolation, where Pietrain was selected mainly due to the breed advantages in the growth performance, body composition, and muscle microstructure [18,19]. The isolation of PSCs followed the method detailed in our last report [4]. Briefly, the isolated PSCs were seeded in cell culture plate at Day 1 (D1). Cell culture medium was changed at D3 and then refreshed every day. PSCs were treated with DMSO vehicle control (Ctrl) or SFN (5, 10, 15, or 20 μM, LKT, Hamburg, Germany) dissolved in DMSO at D4 and D5 with three independent assays for each treatment, and harvested at D6 for multiple PSC assays, as shown in Figure 1.
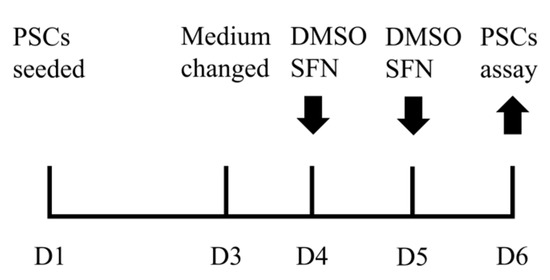
Figure 1.
PSC culture and SFN treatment procedure.
2.2. PSC Viability Assay
The viability of PSCs treated by DMSO or SFN (5, 10, 15, or 20 μM) in 96-well plates was determined using a WST-1 cell proliferation assay kit (Cayman Chemical, Hamburg, Germany). For each well, 10 µL WST-1 reagent was added and cells were cultured at 37 °C for two hours. The absorbance at 450 nm was assessed and all readouts were normalized with the background value.
2.3. HDAC Activity Assay
HDAC activity was assessed with a Color-de-Lys® HDAC colorimetric activity assay kit (Enzo Life Science, Lörrach, Germany). PSC nuclear extract was mixed with 25 µL assay buffer, 25 µL 37 °C pre-warmed Color-de-Lys® substrate was added, and the mixture was incubated at 37 °C for one hour. Then, 50 µL of Color-de-Lys® developer containing 2 µM Trichostatin A was added to stop the reaction followed by 37 °C incubation for 15 min. The results of absorbance reading at 405 nm wavelength were analyzed after being normalized to a no-enzyme control.
2.4. MiRNAs Targeting Porcine SMAD7
TargetScan [20] was used to predict miRNAs targeting porcine SMAD7. The predicted interaction between miRNA and 3′ UTR of porcine SMAD7 was further verified by RNAHybrid [21] and RNA22 [22].
2.5. Quantitative Real-Time PCR (qRT-PCR) of mRNA and miRNA
Total RNA including miRNA was isolated using an AllPrep DNA/RNA/miRNA Universal Kit (Qiagen, Hilden, Germany). A First Strand cDNA Synthesis Kit (Thermo Scientific, Dreieich, Germany) and miScript PCR Starter Kit (Qiagen, Hilden, Germany) were used to synthesis mRNA and miRNA cDNA, respectively. The qRT-PCR was carried out using iTaq SYBR Green Supermix (Bio-Rad, Feldkirchen, Germany) or miScript PCR Starter Kit (Qiagen, Hilden, Germany) to quantify expression levels of mRNA and miRNA, respectively. Primer3 was utilized to design all primers for qRT-PCR [23] and the primer sequences were shown in Table 1. The Ct value from qRT-PCR was analyzed using the 2−ΔΔCt method [24], and hypoxanthine phosphoribosyltransferase 1 (HPRT1) and U6 small nuclear RNA were used as endogenous references for mRNA and miRNA, respectively.

Table 1.
The sequences of primers used in this study.
2.6. Western Blot
Western blot was performed following our routine method [18]. The primary antibodies utilized in this work included these for acetyl-histone H4 (06-866, Millipore, Burlington, MA, USA), acetyl-histone H3 (06-599, Burlington, MA, USA), SMAD7 (sc-11392, Santa Cruz, Dallas, TX, USA), and TGFB1 (sc-146, Santa Cruz, Dallas, TX, USA). The applied secondary antibodies were goat anti-rabbit (sc-2004, Santa Cruz, Dallas, TX, USA) and donkey anti-goat (sc-2020, Santa Cruz, Dallas, TX, USA). The blot signals were visualized using Clarity Western ECL Substrate (Bio-Rad, Feldkirchen, Germany) and acquired by ChemiDoc XRS system (Bio-Rad, Feldkirchen, Germany). Coomassie-Brilliant Blue staining was used as a loading control.
2.7. Bisulfite Sequencing
Genomic DNA was isolated using an AllPrep DNA/RNA/miRNA Universal Kit (Qiagen, Hilden, Germany). The 2 kilobases (kb) (NC_010443.5:c98545924-98543925) 5′ upstream of the porcine SMAD7 (Gene ID: 100521305) transcription start site were used for CpG island detection and bisulfite sequencing PCR primer design with aid of Methprimer [25]. Following the manual of the EZ DNA Methylation-Direct Kit (Zymo Research, Irvine, CA, USA), bisulfite treated PSCs’ genomic DNA was used as the template for PCR amplification. The amplicon was inserted into a pGEM T-easy vector (Promega, Heidelberg, Germany). At least six positive clones were sequenced using the sequencer CEQ8000 (Beckman Coulter, Miami, FL, USA). BiQ Analyzer was applied in bisulfite sequencing results analysis [26].
2.8. Chromatin Immunoprecipitation (ChIP) Assay
The ChIP assay was performed according to the manual of the ChIP Assay Kit (Millipore, Darmstadt, Germany) with acetyl-histone H4 antibody (06-866, Millipore, Burlington, MA, USA), which was followed by quantitative PCR (ChIP-qPCR) using porcine SMAD7 promoter-specific primers (Table 1). ChIP assay performed with normal rabbit IgG (2729S, Cell Signaling Technology, Danvers, IL, USA) was taken for the negative control. According to the percentage input method, the qPCR signal obtained from the ChIP DNA with acetyl-histone H4 antibody was normalized with a signal obtained from the 5% input DNA sample: 100 × 2^(Ct of ChIP(input)—log2 20—Ct of ChIP(acH4)). The ChIP-qPCR data are expressed as the relative enrichment fold change of the SFN group compared to the Ctrl group with three independent replications for each group.
2.9. Statistical Analysis
Student’s t test was applied to determine the statistical significance of differences between the Ctrl and SFN treatment groups. The data are expressed as mean ± standard error (SE) of three independent assays. * p < 0.05, ** p < 0.01, and *** p < 0.001 were utilized as levels of significance.
3. Results
3.1. SFN Modulated PSC Proliferation and Myogenic Genes Expression
SFN influenced PSC proliferation in a dose-dependent manner. SFN at 5, 10, and 15 μM increased PSC proliferation, whereas SFN at 20 μM had the reverse effect (Figure 2A). As a consequence, 10 μM SFN was used in the following study. SFN inhibited the expression of MYOD1 mRNA, which is consistent with our prior findings [4]. SFN also reduced the levels of myogenic factor 5 (MYF5) and Myogenin (MYOG) mRNA expression (Figure 2B). In PSCs treated with SFN, however, MEF2 family members’ (MEF2A and MEF2C but not MEF2D) mRNA levels were elevated (Figure 2C).
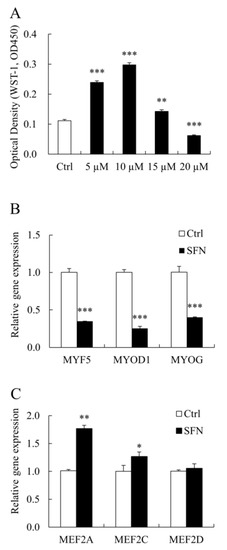
Figure 2.
SFN modulated PSC proliferation and myogenic transcription factors (TFs). (A): The viability of PSCs treated with Ctrl or SFN at different concentrations (5, 10, 15, or 20 μM). (B,C): qRT-PCR results of PSC proliferation and differentiation associated genes in Ctrl and SFN (10 μM) groups. Data were shown as the mean ± SE and assays were done in triplicates. * p < 0.05, ** p < 0.01, *** p < 0.001.
3.2. SFN Inhibited HDAC Activity and Elevated Global Histone Acetylation Level
SFN dramatically reduced the activity of HDAC in PSCs (Figure 3A) and had an effect on HDAC family members’ mRNA levels. There are four classes (I–IV) of HDAC family members in the classical HDAC family. HDAC1 and HDAC8 of Class I, as well as HDAC7 and HDAC10 of Class II, had higher mRNA levels in the SFN group than those in the Ctrl group, while HDAC9 of Class II and HDAC11 of Class IV had lower mRNA levels (Figure 3B). Meanwhile, global acetylated histone H3 and H4 levels were significantly higher in SFN-treated PSCs (Figure 3C), with Coomassie-Brilliant Blue staining serving as a loading control (Figure 3D).
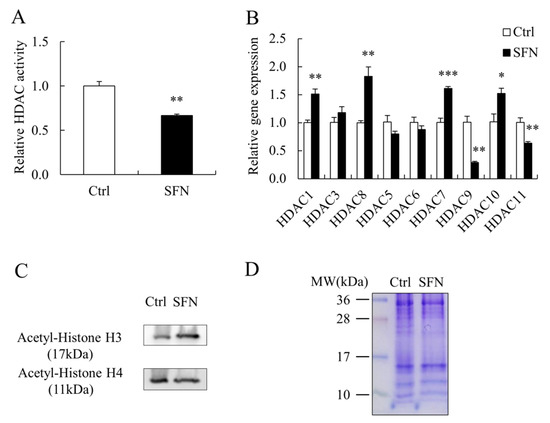
Figure 3.
SFN increased global histone acetylation in PSCs. (A): The HDAC activity in Ctrl and SFN treated PSCs; (B): HDAC family members’ relative mRNA expression levels; (C,D): Western blot results of acetylated histone H3 and H4 in PSCs treated with Ctrl and SFN, and Coomassie-Brilliant Blue staining as loading control. Data are shown as the mean ± SE and assays were done in triplicates. * p < 0.05, ** p < 0.01, *** p < 0.001.
3.3. SFN Increased SMAD7 Expression in PSCs
SFN treatment increased the abundance of SMAD7 mRNA and protein, as well as the level of TGFB1 mRNA (Figure 4A,B), while decreasing the amount of TGFB1 protein (Figure 4B). SFN treatment had no effect on SMAD2 or SMAD3 mRNA levels (Figure 4A).
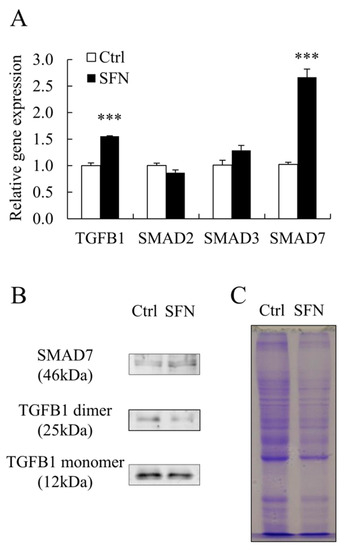
Figure 4.
The expression of SMAD7 was upregulated by SFN treatment. (A): Relative mRNA expression levels of TGFB1, SMAD2, SMAD3, and SMAD7; (B,C): The protein levels of TGFB1 and SMAD7 with Coomassie-Brilliant Blue staining as loading control. Data are shown as the mean ± SE and assays were done in triplicates. *** p < 0.001.
3.4. SFN Altered the Expression of TFs and miRNAs Involved in Regulating SMAD7
SFN enhanced STAT5A, CEBPB, and Nrf2 mRNA levels in PSCs but reduced SP1 mRNA expression (Figure 5A), whereas PROMO [27] and TFSEARCH [28] demonstrated that all these TFs bind to the porcine SMAD7 promoter.
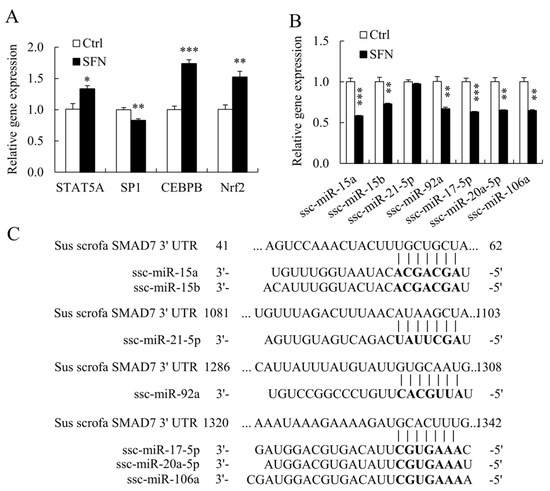
Figure 5.
TFs and miRNAs regulating SMAD7 were remodeled by SFN treatment. (A): Relative mRNA expression levels of porcine SMAD7 TFs; (B): Relative expression levels of porcine miRNAs targeting SMAD7; (C): The alignments of porcine miRNAs and corresponding binding sites in SMAD7 3′ UTR. Data are shown as the mean ± SE and assays were done in triplicates. * p < 0.05, ** p < 0.01, *** p < 0.001.
Multiple miRNAs target SMAD7 in humans, including hsa-miR-15b, hsa-miR-20a, hsa-miR-21, hsa-miR-92a, and hsa-miR-106b [11,29]. TargetScan also predicts that ssc-miR-15a and ssc-miR-17-5p will target SMAD7 [20]. Figure 5C showed the alignments of porcine miRNAs and their associated binding sites in the porcine SMAD7 3′ UTR. SFN inhibited the expression of ssc-miR-15a, ssc-miR-15b, ssc-miR-92a, ssc-miR-17-5p, ssc-miR-20a-5p, and ssc-miR-106a in porcine miRNAs (Figure 5B).
3.5. SFN Elevated Histone H4 Acetylation Level at SMAD7 Promoter
As previously stated, SFN raised global histone acetylation levels in PSCs. We also used ChIP-qPCR to look at the degree of histone H4 acetylation in the porcine SMAD7 promoter. To amplify five areas throughout the 2 kb promoter of porcine SMAD7, five pairs of primers (Table 1) were utilized for ChIP-qPCR (Figure 6A). The levels of histone H4 acetylation at promoter areas were dramatically increased by SFN (Figure 6B).
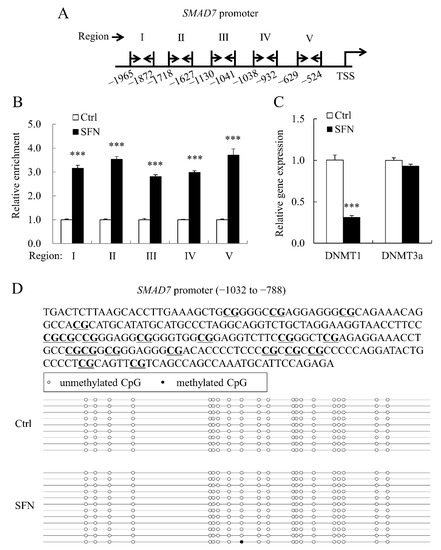
Figure 6.
Histone H4 acetylation in porcine SMAD7 promoter was enriched by SFN. (A): The schematic map shows the locations of primer sets (forward primer: right arrow and reverse primer: left arrow) used in ChIP-qPCR; (B): Relative enrichment fold change of histone H4 acetylation of five regions across porcine SMAD7 promoter; (C): DNMT1 and DNMT3a relative mRNA expression levels in Ctrl and SFN groups; (D): The methylation status of CpG island (−1032 to −788 bp) in the SMAD7 promoter. CpG sites are highlighted with underline in the upper panel. Data are shown as the mean ± SE and assays were done in triplicates. *** p < 0.001.
The mRNA level of DNA methyltransferase 1 (DNMT1) was decreased by SFN (Figure 6C), which is consistent with our previous findings [4]. Bisulfite sequencing was used to investigate the methylation status of the porcine SMAD7 promoter. All CpG sites in the SMAD7 promoter region studied (Figure 6D) were unmethylated and SFN administration had no effect on this pattern.
4. Discussion
Satellite cells have been a hot topic of research since their discovery in 1960 [4]. Satellite cells are essential for muscle development, maintenance, and regeneration since they are the skeletal muscle’s stem cells. SFN dramatically boosted PSC proliferation and SMAD7 mRNA and protein expression.
SFN is abundant in cruciferous vegetables such as broccoli and Brussels sprouts. We discovered that SFN can control the growth of PSCs. PSC proliferation was boosted by SFN at 5, 10, and 15 µM, whereas PSC proliferation was hindered by SFN at 20 µM. In mice, satellite cell population in the muscle fiber of extensor digitorum longus is enlarged with SFN as diet supplement [14]. SFN has similar dosage-dependent effects on human mesenchymal stem cells (MSCs) [30], where low-dose SFN (0.25 and 1 µM) promotes MSC proliferation as an antioxidant but high-dose SFN (20 µM) kills MSCs. The transformation of SFN from a mitogen to a cytotoxin implies that the underlying processes induced by low and high levels of SFN are likely to vary. SFN mitogenic impact on PSCs was the focus of the current study.
MYOD transcription is stimulated in active satellite cells, and MYF5 protein begins to accumulate. Until the differentiation program is started, MYOG is not transcribed [31]. SFN inhibited the myogenic pathway of PSCs by inhibiting MYF5, MYOD1, and MYOG mRNA levels. Similar findings were reported in research using the mouse myoblast C2C12 cell line, in which SFN (2 µM) reduced the protein abundances of MYOD and MYOG [32]. Although SFN raised MEF2 mRNA levels in PSCs, low levels of MYOD1 and MYOG reduced MEF2’s transcriptional capacity. As a result, SFN inhibits myogenic differentiation.
The MEF2-dependent transcription is inhibited by class IIa HDACs, which interfere with the myogenic program [33]. Increased Class IIa HDAC expression suppresses MEF2C expression and reduces myoblast differentiation [34]. The reduced activity of HDACs in PSCs caused by SFN might alleviate the suppression of MEF2 and MEF2-dependent myogenic gene transcription by class IIa HDACs. In the current study, SFN has a variety of impacts on HDAC members. SFN, for example, reduces HDAC3 and HDAC6 protein levels in HeLa cells [35], but has no effect on nuclear HDAC abundance in human embryonic kidney 293 cells. It was also discovered that HDAC members’ mRNA levels did not respond evenly to SFN exposure in our study.
SFN dramatically enhanced global histone H3 and H4 acetylation levels in PSCs. This is consistent with the majority of earlier studies [12]. There are, however, a few works that make different observations. SFN treatment has little effect on global histone acetylation in RT4 and UMUC3 human bladder cancer cells, despite the fact that HDAC activity is dramatically reduced [36].
SFN was observed to lower TGFB1 protein levels while increasing SMAD7 mRNA and protein levels in this study, which was associated with increased PSC proliferation. Excess TGF-β slows satellite cell multiplication and decreases satellite cell stemness [37]. HDAC inhibitors increase SMAD7 expression in fibroblasts [38] and breast cancer cells [39]. SMAD7 deficiency in mice causes reduced satellite cell proliferation and differentiation, as well as a reduction in muscle mass [7].
We examined the expression of multiple important TFs for pig SMAD7. SFN raised the levels of STAT5A, CEBPB, and Nrf2 mRNA, while decreasing the levels of SP1 mRNA. SFN promotes Nrf2 signaling, which leads to the induction of SMAD7 [40]. In addition to transcriptional regulation, various miRNAs inhibit SMAD7 expression at a post-transcriptional level [11,29], and SFN downregulates multiple miRNAs targeting porcine SMAD7.
Bisulfite sequencing was also employed to determine the methylation status of the porcine SMAD7 promoter. According to our findings, all CpG sites in the SMAD7 promoter examined area were unmethylated, and this state was unaffected by SFN therapy. SFN, on the other hand, greatly enhanced the local histone H4 acetylation level of the SMAD7 promoter in PSCs. Enriched histone acetylation is normally linked with active promoters.
5. Conclusions
In conclusion, SFN promotes the proliferation of PSCs and inhibits myogenic differentiation. Our findings reveal that SFN influences the expression of myogenic regulator factors and MEF2. Furthermore, SFN upregulates SMAD7 expression in PSCs via histone acetylation and the miRNA route (Figure 7). These findings update our understanding of how skeletal muscle stem cell activity interacts with dietary supplements. Our work indicates that SFN supplementation in the diet can help with muscle growth and repair through satellite cell proliferation enhancement.
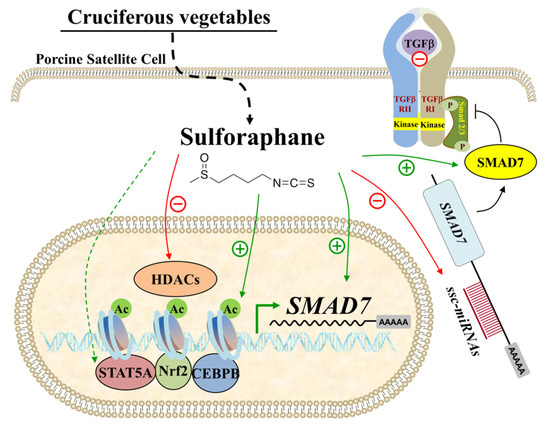
Figure 7.
SFN upregulated SMAD7 expression in PSCs. SFN enriched the histone H4 acetylation level in the SMAD7 promoter and suppressed the expression of miRNAs targeting SMAD7, which led to increased mRNA and protein abundance of SMAD7 in PSCs.
Author Contributions
Conceptualization, R.Z. and K.S.; data curation, C.N., M.U.C. and M.J.U.; formal analysis, R.Z.; funding acquisition, R.Z. and K.S.; investigation, R.Z., C.N., Q.Y., M.U.C. and M.J.U.; methodology, R.Z.; project administration, C.N., M.U.C. and M.J.U.; resources, K.S. and D.T.; software, R.Z.; supervision, K.S. and D.T.; validation, R.Z., C.N., M.U.C. and M.J.U.; visualization, R.Z.; writing—original draft, R.Z.; writing—review and editing, C.N., Q.Y., M.U.C., M.J.U., E.T., K.S. and D.T. All authors have read and agreed to the published version of the manuscript.
Funding
This work was supported by the German Research Foundation (DFG) project Drip (grant number 753) and the Special Project for Local Science and Technology Development with China Central Government Guidance (grant number 2020ZYD067).
Institutional Review Board Statement
The study was conducted in accordance with the standard protocol with the approval number “84-02.04.2011.A066” from the National Office for Nature, Environment and Consumer Protection, North Rhine-Westphalia, Germany.
Informed Consent Statement
Not applicable.
Data Availability Statement
The data presented in this study are available on request from the corresponding author.
Acknowledgments
Authors give thanks to Stephan Baader at Bonn University for the utilization of laboratory facilities. Authors are also indebted to Nadine Leyer for technical assistance and Ludger Buschen at the research station ‘Frankenforst’ of Bonn University for organizing sample collection during the experiments.
Conflicts of Interest
The authors declare no conflict of interest.
References
- Mauro, A. Satellite cell of skeletal muscle fibers. J. Biophys. Biochem. Cytol. 1961, 9, 493–495. [Google Scholar] [CrossRef]
- Moss, F.P. The relationship between the dimensions of the fibres and the number of nuclei during normal growth of skeletal muscle in the domestic fowl. Am. J. Anat. 1968, 122, 555–563. [Google Scholar] [CrossRef] [PubMed]
- Molkentin, J.D.; Black, B.L.; Martin, J.F.; Olson, E.N. Cooperative activation of muscle gene expression by MEF2 and myogenic bHLH proteins. Cell 1995, 83, 1125–1136. [Google Scholar] [CrossRef] [Green Version]
- Fan, H.; Zhang, R.; Tesfaye, D.; Tholen, E.; Looft, C.; Hölker, M.; Schellander, K.; Cinar, M.U. Sulforaphane causes a major epigenetic repression of myostatin in porcine satellite cells. Epigenetics 2012, 7, 1379–1390. [Google Scholar] [CrossRef] [PubMed] [Green Version]
- Hayashi, H.; Abdollah, S.; Qiu, Y.; Cai, J.; Xu, Y.Y.; Grinnell, B.W.; Richardson, M.A.; Topper, J.N.; Gimbrone, M.A., Jr.; Wrana, J.L.; et al. The MAD-related protein Smad7 associates with the TGFbeta receptor and functions as an antagonist of TGFbeta signaling. Cell 1997, 89, 1165–1173. [Google Scholar] [CrossRef] [Green Version]
- Winbanks, C.E.; Murphy, K.T.; Bernardo, B.C.; Qian, H.; Liu, Y.; Sepulveda, P.V.; Beyer, C.; Hagg, A.; Thomson, R.E.; Chen, J.L.; et al. Smad7 gene delivery prevents muscle wasting associated with cancer cachexia in mice. Sci. Transl. Med. 2016, 8, 348ra398. [Google Scholar] [CrossRef] [Green Version]
- Cohen, T.V.; Kollias, H.D.; Liu, N.; Ward, C.W.; Wagner, K.R. Genetic disruption of Smad7 impairs skeletal muscle growth and regeneration. J. Physiol. 2015, 593, 2479–2497. [Google Scholar] [CrossRef] [Green Version]
- Miyake, T.; Alli, N.S.; McDermott, J.C. Nuclear function of Smad7 promotes myogenesis. Mol. Cell. Biol. 2010, 30, 722–735. [Google Scholar] [CrossRef] [Green Version]
- Grönroos, E.; Hellman, U.; Heldin, C.H.; Ericsson, J. Control of Smad7 stability by competition between acetylation and ubiquitination. Mol. Cell 2002, 10, 483–493. [Google Scholar] [CrossRef]
- Wei, L.; Zhao, S.; Wang, G.; Zhang, S.; Luo, W.; Qin, Z.; Bi, X.; Tan, Y.; Meng, M.; Qin, J.; et al. SMAD7 methylation as a novel marker in atherosclerosis. Biochem. Biophys. Res. Commun. 2018, 496, 700–705. [Google Scholar] [CrossRef]
- Smith, A.L.; Iwanaga, R.; Drasin, D.J.; Micalizzi, D.S.; Vartuli, R.L.; Tan, A.C.; Ford, H.L. The miR-106b-25 cluster targets Smad7, activates TGF-beta signaling, and induces EMT and tumor initiating cell characteristics downstream of Six1 in human breast cancer. Oncogene 2012, 31, 5162–5171. [Google Scholar] [CrossRef] [PubMed] [Green Version]
- Myzak, M.C.; Karplus, P.A.; Chung, F.L.; Dashwood, R.H. A novel mechanism of chemoprotection by sulforaphane: Inhibition of histone deacetylase. Cancer Res. 2004, 64, 5767–5774. [Google Scholar] [CrossRef] [PubMed] [Green Version]
- Komine, S.; Miura, I.; Miyashita, N.; Oh, S.; Tokinoya, K.; Shoda, J.; Ohmori, H. Effect of a sulforaphane supplement on muscle soreness and damage induced by eccentric exercise in young adults: A pilot study. Physiol. Rep. 2021, 9, e15130. [Google Scholar] [CrossRef]
- Bose, C.; Alves, I.; Singh, P.; Palade, P.T.; Carvalho, E.; Borsheim, E.; Jun, S.R.; Cheema, A.; Boerma, M.; Awasthi, S.; et al. Sulforaphane prevents age-associated cardiac and muscular dysfunction through Nrf2 signaling. Aging Cell 2020, 19, e13261. [Google Scholar] [CrossRef] [PubMed]
- Son, Y.H.; Jang, E.J.; Kim, Y.W.; Lee, J.H. Sulforaphane prevents dexamethasone-induced muscle atrophy via regulation of the Akt/Foxo1 axis in C2C12 myotubes. Biomed. Pharmacother. 2017, 95, 1486–1492. [Google Scholar] [CrossRef]
- Moon, J.Y.; Kim, D.J.; Kim, H.S. Sulforaphane ameliorates serum starvation-induced muscle atrophy via activation of the Nrf2 pathway in cultured C2C12 cells. Cell Biol. Int. 2020, 44, 1831–1839. [Google Scholar] [CrossRef] [PubMed]
- Yang, Q.; Proll, M.J.; Salilew-Wondim, D.; Zhang, R.; Tesfaye, D.; Fan, H.; Cinar, M.U.; Grosse-Brinkhaus, C.; Tholen, E.; Islam, M.A.; et al. LPS-induced expression of CD14 in the TRIF pathway is epigenetically regulated by sulforaphane in porcine pulmonary alveolar macrophages. Innate Immun. 2016, 22, 682–695. [Google Scholar] [CrossRef] [PubMed]
- Zhang, R.; Grosse-Brinkhaus, C.; Heidt, H.; Uddin, M.J.; Cinar, M.U.; Tesfaye, D.; Tholen, E.; Looft, C.; Schellander, K.; Neuhoff, C. Polymorphisms and expression analysis of SOX-6 in relation to porcine growth, carcass, and meat quality traits. Meat Sci. 2015, 107, 26–32. [Google Scholar] [CrossRef]
- Wimmers, K.; Murani, E.; Ngu, N.T.; Schellander, K.; Ponsuksili, S. Structural and functional genomics to elucidate the genetic background of microstructural and biophysical muscle properties in the pig. J. Anim. Breed Genet. 2007, 124 (Suppl. S1), 27–34. [Google Scholar] [CrossRef]
- Lewis, B.P.; Burge, C.B.; Bartel, D.P. Conserved seed pairing, often flanked by adenosines, indicates that thousands of human genes are microRNA targets. Cell 2005, 120, 15–20. [Google Scholar] [CrossRef] [Green Version]
- Kruger, J.; Rehmsmeier, M. RNAhybrid: microRNA target prediction easy, fast and flexible. Nucleic Acids Res. 2006, 34, W451–W454. [Google Scholar] [CrossRef] [PubMed]
- Miranda, K.C.; Huynh, T.; Tay, Y.; Ang, Y.S.; Tam, W.L.; Thomson, A.M.; Lim, B.; Rigoutsos, I. A pattern-based method for the identification of MicroRNA binding sites and their corresponding heteroduplexes. Cell 2006, 126, 1203–1217. [Google Scholar] [CrossRef] [PubMed] [Green Version]
- Koressaar, T.; Remm, M. Enhancements and modifications of primer design program Primer3. Bioinformatics 2007, 23, 1289–1291. [Google Scholar] [CrossRef] [PubMed] [Green Version]
- Livak, K.J.; Schmittgen, T.D. Analysis of relative gene expression data using real-time quantitative PCR and the 2(-Delta Delta C(T)) Method. Methods 2001, 25, 402–408. [Google Scholar] [CrossRef]
- Li, L.C.; Dahiya, R. MethPrimer: Designing primers for methylation PCRs. Bioinformatics 2002, 18, 1427–1431. [Google Scholar] [CrossRef] [Green Version]
- Bock, C.; Reither, S.; Mikeska, T.; Paulsen, M.; Walter, J.; Lengauer, T. BiQ Analyzer: Visualization and quality control for DNA methylation data from bisulfite sequencing. Bioinformatics 2005, 21, 4067–4068. [Google Scholar] [CrossRef]
- Messeguer, X.; Escudero, R.; Farre, D.; Nunez, O.; Martinez, J.; Alba, M.M. PROMO: Detection of known transcription regulatory elements using species-tailored searches. Bioinformatics 2002, 18, 333–334. [Google Scholar] [CrossRef]
- Heinemeyer, T.; Wingender, E.; Reuter, I.; Hermjakob, H.; Kel, A.E.; Kel, O.V.; Ignatieva, E.V.; Ananko, E.A.; Podkolodnaya, O.A.; Kolpakov, F.A.; et al. Databases on transcriptional regulation: TRANSFAC, TRRD and COMPEL. Nucleic Acids Res. 1998, 26, 362–367. [Google Scholar] [CrossRef] [Green Version]
- Chang, Y.; Liu, C.; Yang, J.; Liu, G.; Feng, F.; Tang, J.; Hu, L.; Li, L.; Jiang, F.; Chen, C.; et al. miR-20a triggers metastasis of gallbladder carcinoma. J. Hepatol. 2013, 59, 518–527. [Google Scholar] [CrossRef]
- Zanichelli, F.; Capasso, S.; Cipollaro, M.; Pagnotta, E.; Carteni, M.; Casale, F.; Iori, R.; Galderisi, U. Dose-dependent effects of R-sulforaphane isothiocyanate on the biology of human mesenchymal stem cells, at dietary amounts, it promotes cell proliferation and reduces senescence and apoptosis, while at anti-cancer drug doses, it has a cytotoxic effect. Age 2012, 34, 281–293. [Google Scholar] [CrossRef] [Green Version]
- Cusella-De Angelis, M.G.; Lyons, G.; Sonnino, C.; De Angelis, L.; Vivarelli, E.; Farmer, K.; Wright, W.E.; Molinaro, M.; Bouche, M.; Buckingham, M.; et al. MyoD, myogenin independent differentiation of primordial myoblasts in mouse somites. J. Cell Biol. 1992, 116, 1243–1255. [Google Scholar] [CrossRef] [PubMed] [Green Version]
- Whitman, S.A.; Long, M.; Wondrak, G.T.; Zheng, H.; Zhang, D.D. Nrf2 modulates contractile and metabolic properties of skeletal muscle in streptozotocin-induced diabetic atrophy. Exp. Cell Res. 2013, 319, 2673–2683. [Google Scholar] [CrossRef] [PubMed] [Green Version]
- Lu, J.; McKinsey, T.A.; Nicol, R.L.; Olson, E.N. Signal-dependent activation of the MEF2 transcription factor by dissociation from histone deacetylases. Proc. Natl. Acad. Sci. USA 2000, 97, 4070–4075. [Google Scholar] [CrossRef] [PubMed] [Green Version]
- Adler, K.; Molina, P.E.; Simon, L. Epigenomic mechanisms of alcohol-induced impaired differentiation of skeletal muscle stem cells; role of Class IIA histone deacetylases. Physiol. Genom. 2019, 51, 471–479. [Google Scholar] [CrossRef]
- Rajendran, P.; Kidane, A.I.; Yu, T.W.; Dashwood, W.M.; Bisson, W.H.; Lohr, C.V.; Ho, E.; Williams, D.E.; Dashwood, R.H. HDAC turnover, CtIP acetylation and dysregulated DNA damage signaling in colon cancer cells treated with sulforaphane and related dietary isothiocyanates. Epigenetics 2013, 8, 612–623. [Google Scholar] [CrossRef]
- Abbaoui, B.; Telu, K.H.; Lucas, C.R.; Thomas-Ahner, J.M.; Schwartz, S.J.; Clinton, S.K.; Freitas, M.A.; Mortazavi, A. The impact of cruciferous vegetable isothiocyanates on histone acetylation and histone phosphorylation in bladder cancer. J. Proteom. 2017, 156, 94–103. [Google Scholar] [CrossRef] [Green Version]
- Carlson, M.E.; Hsu, M.; Conboy, I.M. Imbalance between pSmad3 and Notch induces CDK inhibitors in old muscle stem cells. Nature 2008, 454, 528–532. [Google Scholar] [CrossRef] [Green Version]
- Cho, J.S.; Moon, Y.M.; Park, I.H.; Um, J.Y.; Moon, J.H.; Park, S.J.; Lee, S.H.; Kang, H.J.; Lee, H.M. Epigenetic regulation of myofibroblast differentiation and extracellular matrix production in nasal polyp-derived fibroblasts. Clin. Exp. Allergy 2012, 42, 872–882. [Google Scholar] [CrossRef]
- Salot, S.; Gude, R. MTA1-mediated transcriptional repression of SMAD7 in breast cancer cell lines. Eur. J. Cancer 2013, 49, 492–499. [Google Scholar] [CrossRef]
- Song, M.K.; Lee, J.H.; Ryoo, I.G.; Lee, S.H.; Ku, S.K.; Kwak, M.K. Bardoxolone ameliorates TGF-beta1-associated renal fibrosis through Nrf2/Smad7 elevation. Free Radic. Biol. Med. 2019, 138, 33–42. [Google Scholar] [CrossRef]
Publisher’s Note: MDPI stays neutral with regard to jurisdictional claims in published maps and institutional affiliations. |
© 2022 by the authors. Licensee MDPI, Basel, Switzerland. This article is an open access article distributed under the terms and conditions of the Creative Commons Attribution (CC BY) license (https://creativecommons.org/licenses/by/4.0/).