Article

Seroprevalence Estimates of Latent and Acute Toxoplasma Infections in HIV+ People—Call for Action in Underprivileged Communities

by
Ali Rostami
1,2,*,
Seyed Mohammad Riahi
3,
Shayan Abdollahzadeh Sagha
1,
Ali Taghipour
4,
Mahdi Sepidarkish
5,
Mousa Mohammadnia-Afrouzi
2,
Soheil Ebrahimpour
1,
Peter J. Hotez
6,
Ray Gamble
7 and
Robin B. Gasser
8,*
1
Infectious Diseases and Tropical Medicine Research Center, Health Research Institute, Babol University of Medical Sciences, Babol, Iran
2
Immunoregulation Research Center, Health Research Institute, Babol University of Medical Sciences, Babol, Iran
3
Cardiovascular Diseases Research Center, Department of Epidemiology and Biostatistics, School of Medicine, Birjand University of Medical Sciences, Birjand, Iran
4
Zoonoses Research Center, School of Medicine, Jahrom University of Medical Sciences, Jahrom, Iran
5
Department of Biostatistics and Epidemiology, School of Public Health, Babol University of Medical Sciences, Babol, Iran
6
Texas Children’s Center for Vaccine Development, Department of Pediatrics and Molecular Virology and Microbiology, National School of Tropical Medicine, Baylor College of Medicine, Houston, TX 77030, USA
7
National Academy of Sciences, Washington, DC 20001, USA
8
Department of Veterinary Biosciences, Melbourne Veterinary School, The University of Melbourne, Parkville, VIC 3010, Australia
*
Authors to whom correspondence should be addressed.
Microorganisms 2021, 9(10), 2034; https://doi.org/10.3390/microorganisms9102034
Submission received: 9 September 2021 / Revised: 19 September 2021 / Accepted: 23 September 2021 / Published: 26 September 2021
(This article belongs to the Special Issue HIV Co-infections)

Abstract

:
We undertook a comprehensive, systematic review of observational studies to estimate respective seroprevalences of latent and acute Toxoplasma gondii infections in HIV+ people at the global, regional and country levels; related seroprevalence to socio-economic variables and CD4+ cell counts; and assessed temporal changes in prevalence and risk factors for this group. We systematically searched international databases for seroepidemiological surveys between 1 January 1980 and 31 July 2020. We used a random effects model to calculate pooled seroprevalences with 95% confidence intervals (CI), and estimated the numbers of HIV+ people inferred to harbour latent and acute T. gondii infections (LT or AT). We grouped seroprevalence data according to the geographic regions defined by the World Health Organization (WHO) and conducted subgroup and meta-regression analyses of the data. Of a total of 4024 studies identified, 150 and 65 of them met the inclusion criteria for LT and AT in HIV+ people, respectively. The overall, pooled seroprevalences of LT and AT were 37.4% (95% CI, 33.4–41.4) and 1.3% (95% CI, 0.9–1.8%), equating to ~14.2 and 0.5 million HIV+ people, respectively. Most HIV+ people with T. gondii infections originated from Africa, and the highest seroprevalences were in low-income countries with low human development indices. Significant risk factors for toxoplasmosis in HIV+ patients included the consumption of raw/undercooked meat, frequent contact with soil, a low CD4+ T lymphocyte number (<200 cells per μL) and age. Overall, the finding of high seroprevalences of particularly latent T. gondii infection in HIV+ people in underprivileged regions of the world, such as parts of Africa, calls for preventative action. Programs that include routine serological monitoring, counselling, care, animal control and/or prophylactic treatment measures are needed to prevent severe toxoplasmosis from developing in people living with HIV infection. Our study highlights the potential importance of parasite chemoprophylaxis in resource-poor settings, particularly in low-income countries.

1. Introduction

Toxoplasma gondii infection can lead to life-threating toxoplasmosis in human immunodeficiency virus (HIV)-infected people [1]. In HIV+ people, ‘toxoplasmic encephalitis’ is a common complication, particularly in individuals with CD4+ T lymphocyte counts of <200 cells per μL [2,3]. This form of toxoplasmosis can be associated with headache, drowsiness, disorientation, hemiparesis, retinochoroiditis and/or epilepsy [4,5], and can become generalised and fatal.
Primary T. gondii infection is acquired through the ingestion of sporulated oocysts in soil or water contaminated with cat faeces, or on contaminated fruits and vegetables; the ingestion of infective stages (‘zoites) within raw or undercooked meats; by vertical transmission from an infected mother to the foetus; and, in rare cases, by blood transfusion or organ transplantation [6,7,8,9,10]. While primary T. gondii infection is mostly asymptomatic in immunocompetent people [11], such an infection could lead to severe toxoplasmosis in HIV+ people due to their immunodeficiency [12]. More often, however, toxoplasmosis appears to result from the reactivation of a latent T. gondii infection [5,13,14]. Although a low CD4+ T cell count (<200 per µL) is a risk factor for opportunistic infections in HIV+ people, severe toxoplasmosis occurs in people with advanced AIDS [13], when CD8 T cell deficiency allows a reactivation of latent T. gondii infection [14].
Serological tools are useful to monitor and characterise T. gondii infections. Specific anti-Toxoplasma IgM and/or IgG serum antibody levels (titres) provide an indication of the status of a T. gondii infection and its clinical relevance. Latent infection (sometimes referred to as ‘latent toxoplasmosis’—although not always a disease state) [9] is usually associated with the presence of relatively low levels of specific IgG serum antibodies, whereas a subacute or acute infection linked to disease (‘acute toxoplasmosis’) [9,15] is associated with an initial increase in specific anti-Toxoplasma IgM serum antibody, followed by a four to 16-fold increase in specific IgG serum antibody over a period of 2–4 weeks [7,16,17]. Thus, serological tools underpin epidemiological investigations of the prevalence, status and/or dynamics of T. gondii infection and toxoplasmosis in human populations.
Estimating the prevalence and distribution of T. gondii infection using serodiagnostic tools and assessing associated risk factors for HIV+ people will assist the development and implementation of measures/programs to prevent toxoplasmosis in this risk group [18]. Previous investigations to estimate the prevalence of T. gondii infections in HIV+ people were limited to particular countries or geographical regions over short study periods (usually one year) [19,20,21,22,23]. Perhaps the most comprehensive investigation of HIV+ people was a meta-analysis of studies published from 1987 to 2016 [24], which considered latent infection/toxoplasmosis, but not acute toxoplasmosis; furthermore, it did not assess risk factors linked to toxoplasmosis and its prevalence.
In the present study, we undertook a comprehensive, systematic review of observational studies to (i) estimate respective seroprevalence rates for latent and acute T. gondii infections in HIV+ people at the global, regional and country levels; (ii) relate prevalence to socio-economic variables and CD4+ cell counts; and (iii) assess temporal changes in prevalence as well as risk factors for this group of people.

2. Materials and Methods

We followed the recommendations established by the Preferred Reporting Items for Systematic Reviews and Meta-Analyses (PRISMA) [25]. All procedures, including the literature search, the critical appraisals of full articles/reports and of data quality as well as the analyses of data were performed by experienced researchers. Disagreements regarding study selection, data extraction and quality assessment were resolved in discussion with the first author (A.R.) to reach a consensus decision.

2.1. Search Strategy and Selection Criteria

A systematic review of the literature was performed using PubMed (through OVID), Scopus, Web of Science, SciELO and Embase to identify all peer-reviewed articles reporting data on the prevalence of latent and acute T. gondii infections in HIV+ people, published between January 1980 and July 2020, without language or geographical restriction. We used relevant keywords for the searching of databases (Figure S1). The search strategy was discussed with an expert medical librarian for optimal inclusion-sensitivity. To ensure that we identified ‘grey’ literature, such as papers in languages other than English, conference proceedings, and technical or governmental reports, we searched the Google Scholar database, and scrutinised reference lists of reviews and original articles.
The inclusion criteria were: (i) observational studies with original data used to estimate the seroprevalence of latent or acute T. gondii infection/toxoplasmosis in HIV+ people; (ii) studies with a sample size of >30 individuals; and (iii) investigations to measure specific anti-Toxoplasma serum antibodies (IgM and/or IgG) or Toxoplasma antigens. For case-control studies, data were extracted only for HIV+ individuals. Excluded were studies that (a) were not representative of a ‘general population’ of people with HIV infection (e.g., encephalitis cases, particularly those with toxoplasmic encephalitis, psychiatric patients and drug users); (b) lacked a detailed description of serodiagnostic method(s) used; (c) were comparative investigations of diagnostic methods; (d) had overlapping participation in multiple studies; and/or (e) were experimental studies, case-reports, case-series, reviews, systematic reviews or meta-analyses.
Here, HIV+ people were assigned to two groups according to their specific anti-Toxoplasma serological profiles: Those who (i) were test-positive for specific anti-Toxoplasma IgG antibody with low avidity, (ii) were test-positive for both specific anti-Toxoplasma IgM and IgG antibodies, (iii) had a seroconversion with a four to 16-fold increase in specific IgG titre over a period of 2–4 weeks, or (iv) were test-positive for circulating Toxoplasma antigen in serum, were assigned to the “acute T. gondii infection” (AT-) group [7]. Those who were test-positive for specific anti-Toxoplasma IgG serum antibody in the absence of IgM serum antibody [26] were assigned to the “latent T. gondii infection” (LT-) group.

2.2. Data Extraction and Assessment of Quality

We extracted the following variables from each study: first author’s name, country, city, year of publication, study design, number of participants, number of seropositive HIV+ people in each of the AT- and LT-groups, and the type of diagnostic method(s) used. Countries were grouped according to the WHO-defined regions [27], income per capita and the human development index [HDI]. In order to identify associated risk factors for toxoplasmosis in HIV+ people, we extracted data/information including: place of residence (urban/rural), gender (male or female), close contact with dogs or cats, contact with soil, and consumption of raw/undercooked meat, raw/unwashed vegetables and/or untreated drinking water. To evaluate the quality of the methodologies used in studies, we employed the Joanna Briggs Institute (JBI) prevalence critical appraisal tool [28].

2.3. Statistical Analysis

Analyses were performed using Stata statistical software (v.16 Stata Corp., College Station, TX, USA). For each individual study, prevalence was defined as the number of HIV+ individuals in either the AT- or LT-group, divided by the total number of HIV+ people studied. We used the variance of the study-specific prevalence estimates with the Freeman–Tukey double arcsine transformation prior to the pooling of data, employing the DerSimonian-Laird random-effects meta-analysis model to minimise the effect of studies with an extremely low or high reported prevalence [29,30,31]. The random-effects model [30] was selected in anticipation of significant variation in seroprevalence estimates among studies included here. Heterogeneity between studies was evaluated using Cochran’s Q test and the I2 index. I2 values of 25%, 50% and 75% represented low, medium and substantial heterogeneities, respectively [32]. To explore factors that might influence heterogeneity, several subgroup and meta-regression analyses were performed, considering the following study features: (i) WHO region, (ii) country, (iii) type of diagnostic method employed, (iv) study design, (v) income level in a country, and (vi) HDI level in a country. Moreover, to calculate the global number of seropositive HIV+ people in each of the AT- and LT-groups, we employed an established method [24] and used data from the WHO on the number of HIV+ people worldwide and in different countries/regions in 2019 [33]. Subsequently, we multiplied this number by the calculated percentages of HIV+ people in the AT- and LT-groups (95% CI) at the global and national levels. We did not undertake an assessment of publication bias, as this is not relevant for prevalence studies [34]. In all comparisons, a p-value of <0.05 was considered statistically significant.

3. Results

3.1. Study Characteristics

Of 4024 published scientific reports or papers, 150 and 65 studies met the inclusion criteria for analyses of the seroprevalences in the AT- and LT-groups, respectively (Figure S2). The 150 studies (155 data sets) surveyed 44,473 HIV+ people from 49 countries, whereas the 65 studies (65 datasets) investigated 17,705 HIV+ people from 32 countries. Relevant study characteristics are listed in Table S1. Most studies (n = 45) were from Africa, followed by the Western Pacific (n = 24) and the Eastern Mediterranean (n = 23). The lowest number of studies were from North America and the Caribbean (n = 12).

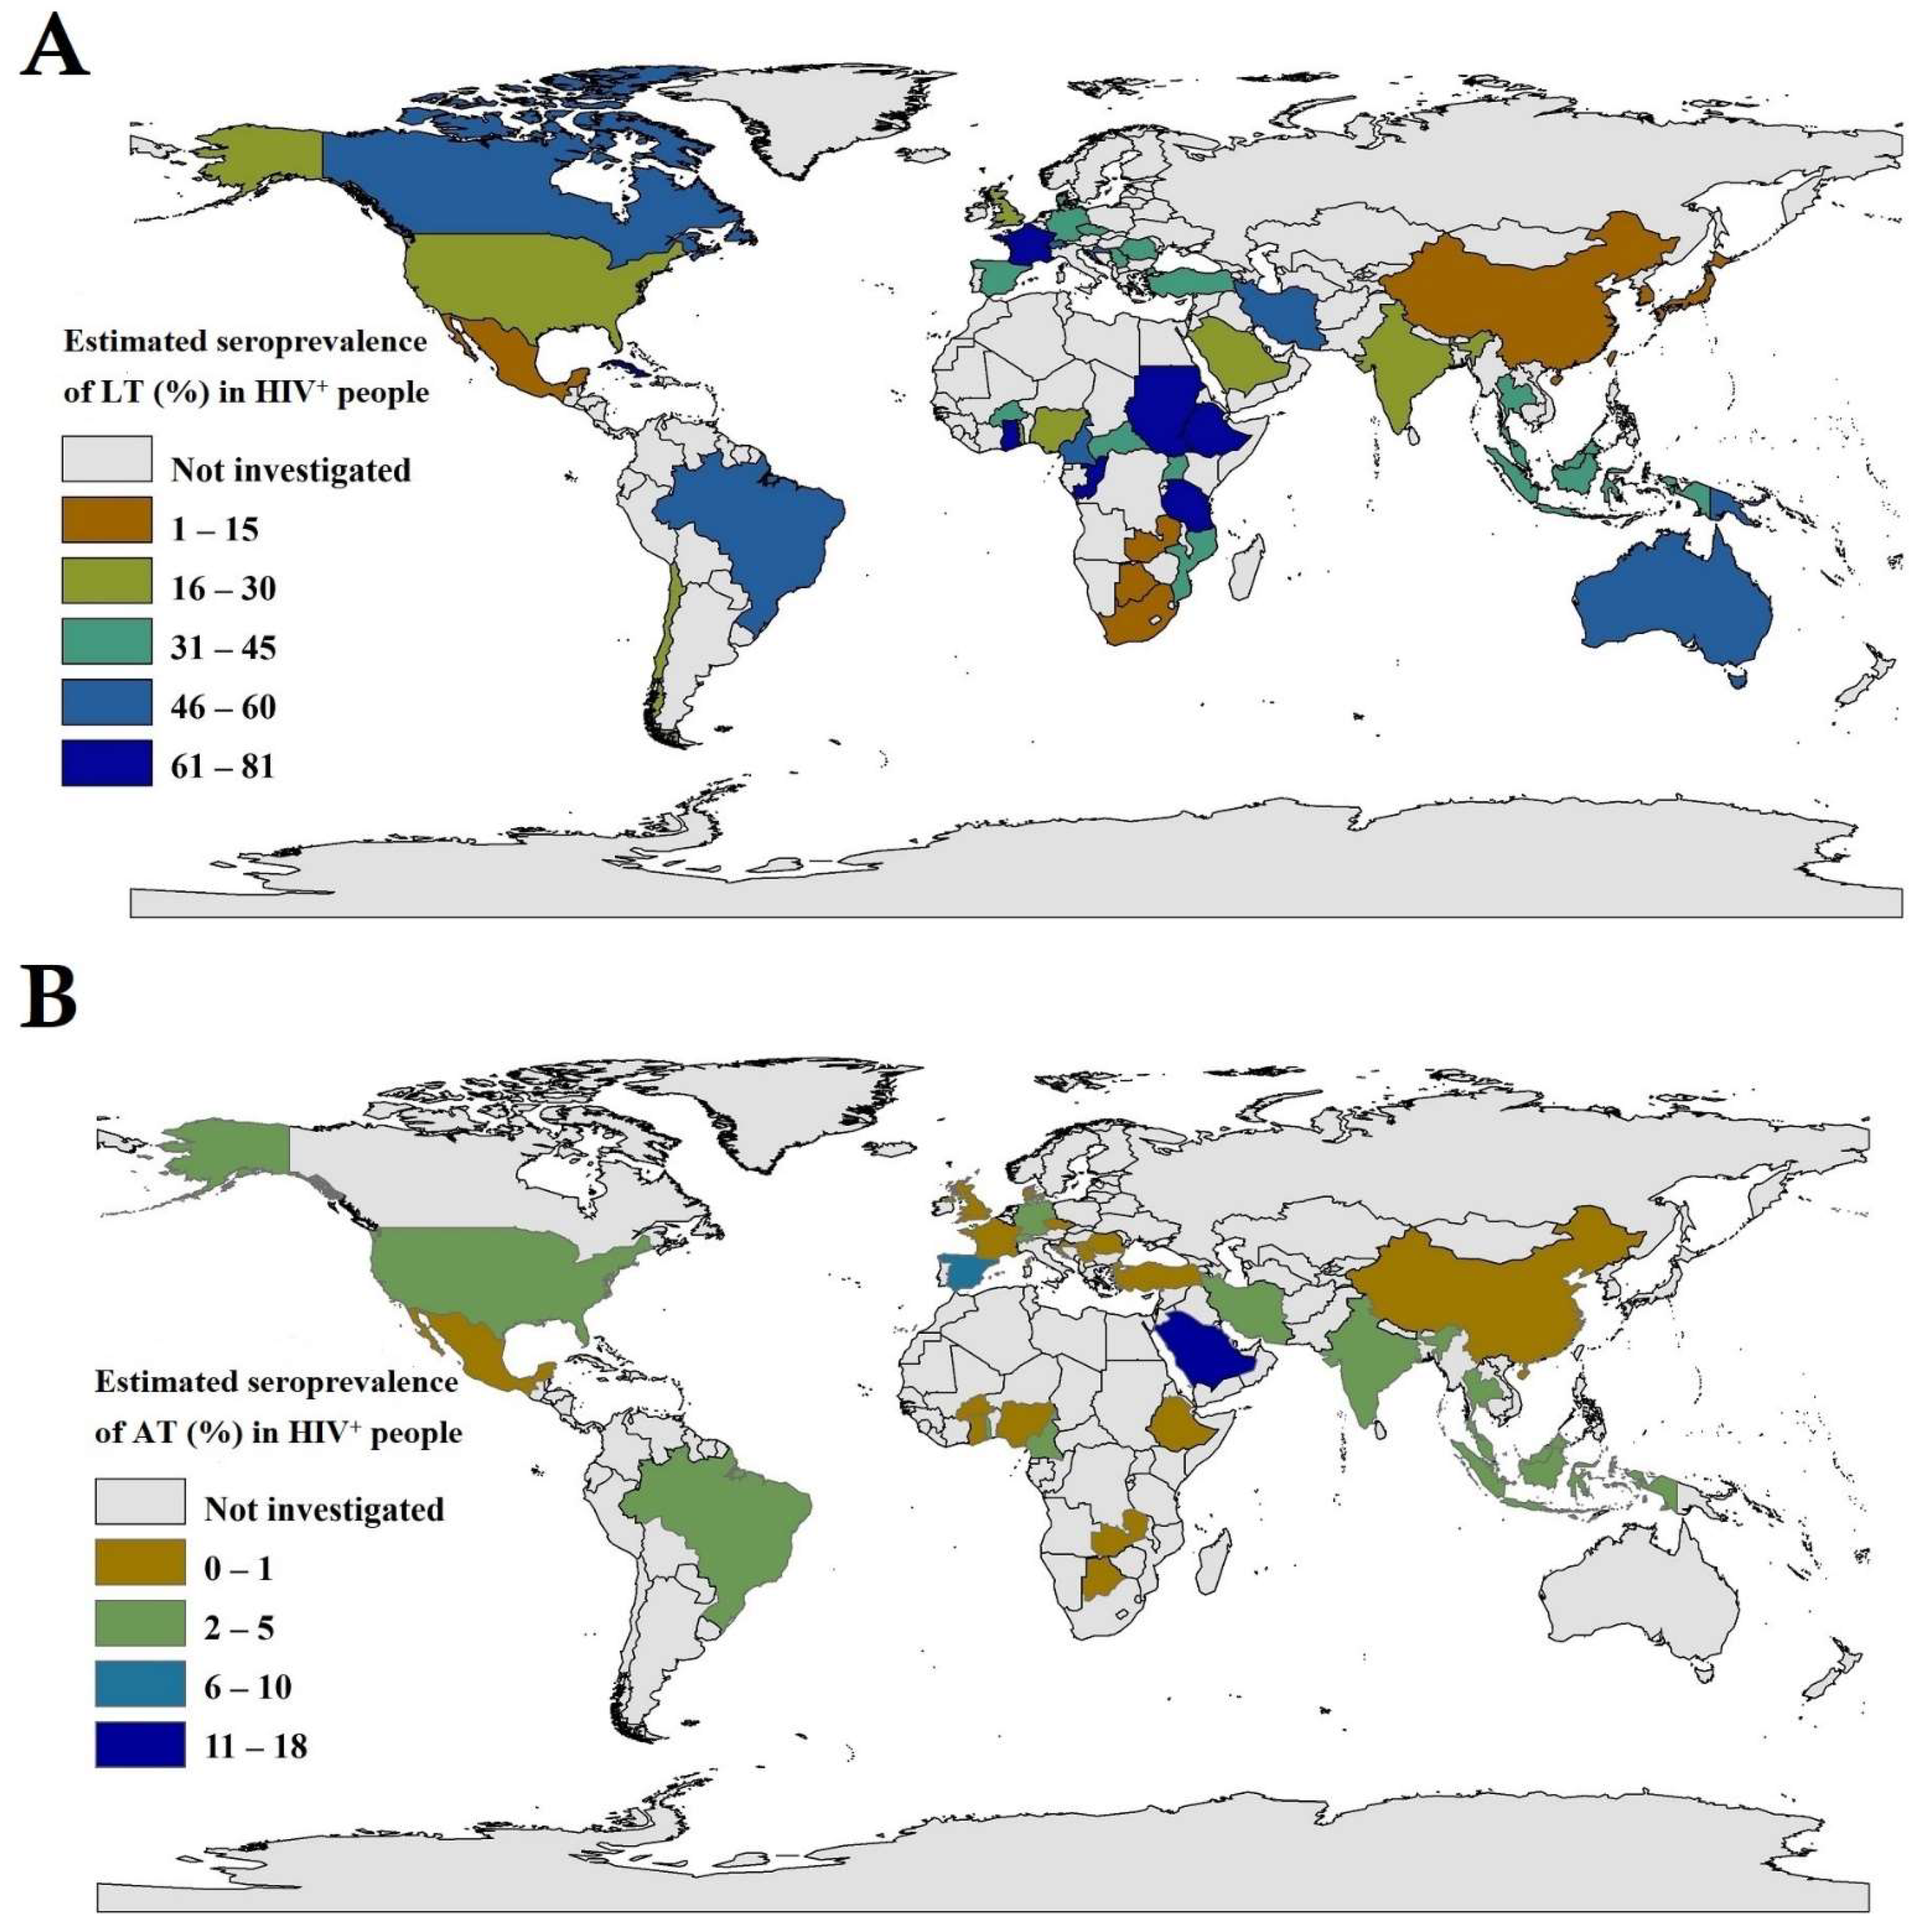
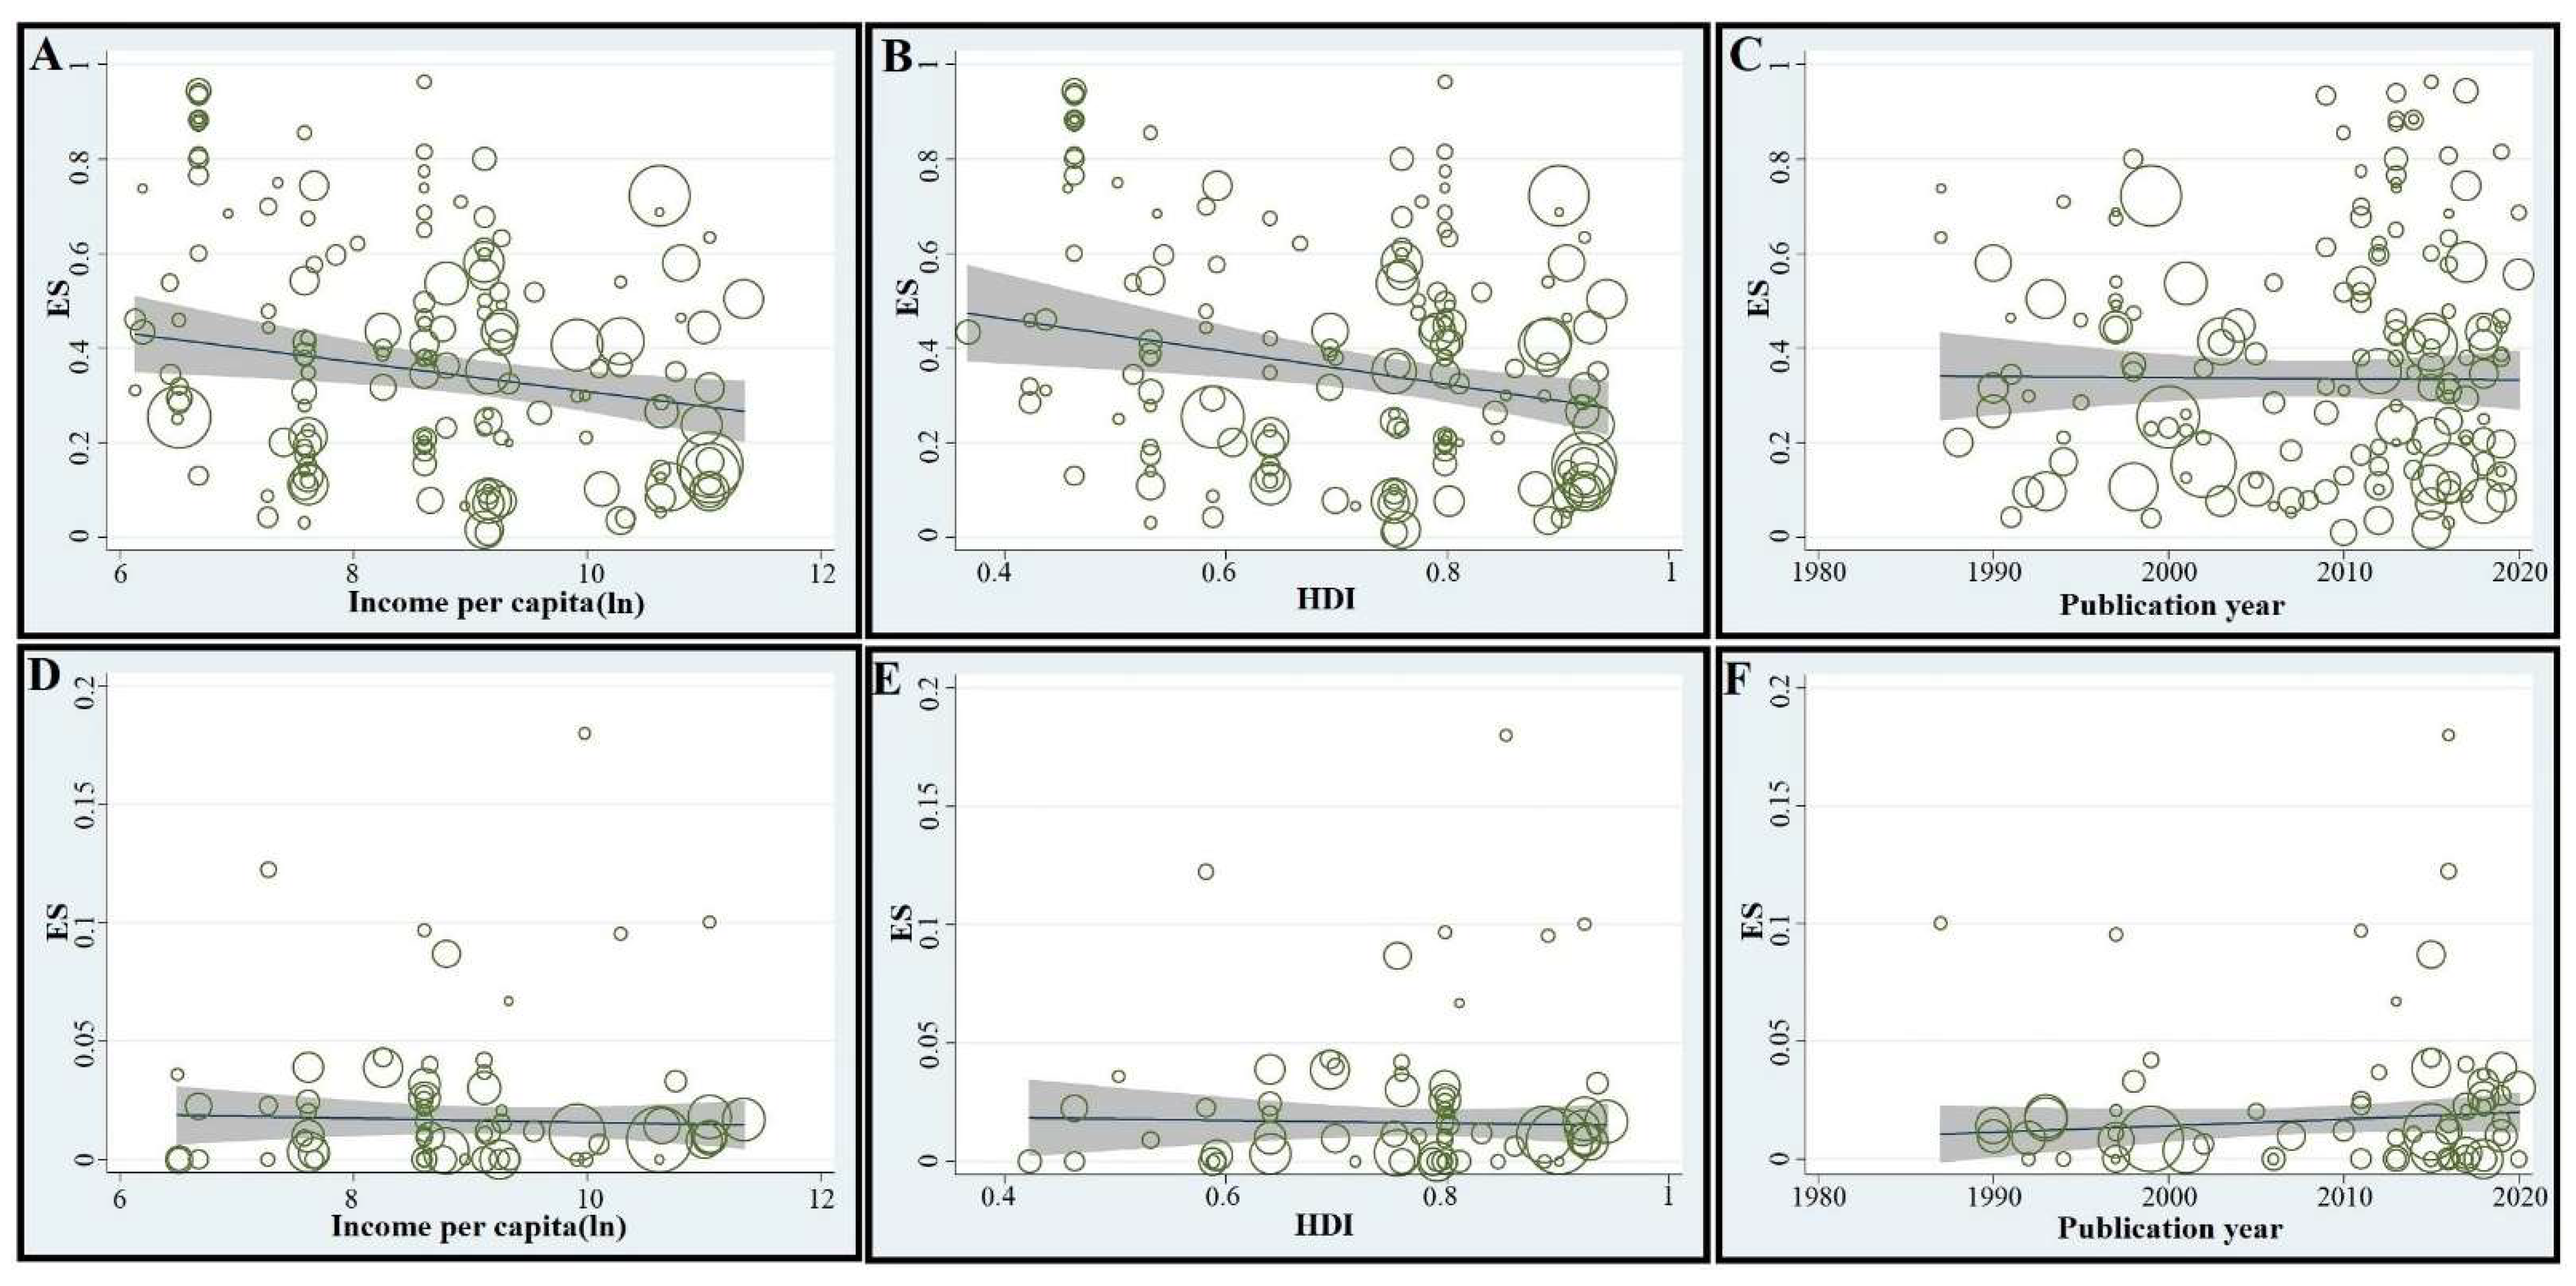
3.2. Global and Regional Seroprevalence Estimates in the LT-Group of HIV+ People, and Associated Socio-Demographic Aspects and Risk Factors

Of the 44,473 HIV+ persons from 49 countries, 14,913 had specific anti-T. gondii IgG serum antibody profiles consistent with latent T. gondii infection (LT-group). Based on this evidence, we estimated an overall, pooled global prevalence of 37.4% (95% CI, 33.4–41.4) (Table 1; Figure 1A), with heterogeneity among studies (I2 = 98.7%, p < 0.001). For WHO regions, pooled seroprevalence rates (95% CI) were: 46.2% (37.7–54.7%) in Africa, 46.2% (29.6–62.6%) in South America, 45.8% (36.3–55.5%) in the Eastern Mediterranean region, 41.1% (33.0–49.4%) in Europe, 29.9% (22.0–38.3%) in South-East Asia, 25.5% (19.2–32.4%) in North America and 18.4% (12.4–25.3%) in the Western Pacific. For countries for which there were two or more eligible studies, Ethiopia (80.5%), Ghana (70.6%) and Cameroon (54.5%) in Africa; Iran (45.7%) in the Middle East; France (72.5%) and Austria (57.3%) in Europe; Brazil (48.8%) in South America; and Indonesia (38.5%), Thailand (37.5%) and Malaysia (36.1%) in East Asia exhibited some of the highest seroprevalences (Table 1 and Figure 1A). Extrapolating to the global population, we estimated that 14,174,600 (12,658,600–15,690,600) of HIV+ people had specific anti-T. gondii IgG serum antibody titres consistent with those expected of people with latent T. gondii infection (LT-group). These findings indicate clearly that countries in Africa have 11,873,400 (9,688,900–14,057,900) HIV+ people with latent T. gondii infection, equating to ~84% of HIV+ people worldwide. Details pertaining to estimated seroprevalences in distinct WHO-regions and countries are given in Table 1 and Figure 1A.
In subgroup analyses, with respect to income level and HDI, the highest predicted seroprevalence for the LT-group was in low-income countries (58.2%, 46.2–69.8%) and the lowest in high-income countries (28.0%, 21.3–35.2%). The pooled prevalence in HIV+ people in the LT-group in countries with low, medium, high and very high HDIs were 51.9% (42.8–60.8%), 29.3% (20.9–38.4%), 38.0% (22.6–33.1%) and 27.6% (22.6–33.1%), respectively (Table 2). Meta-regression analyses revealed a significant decreasing trend in seroprevalence in countries with increasing levels of income per capita (C = −2.97 × 10⁻⁶; p-value = 0.004) and/or increasing HDI (C = −0.473; p-value < 0.001) (Figure 2A,B). Studies published after 2005 indicated slightly higher seroprevalences than before, although the increasing trend observed from 1980 to 2020 was non-significant upon meta-regression analysis (C = 0.0016; p-value = 0.46) (Table 2 and Figure 2C).
In subgroup analyses, according to the type of study, the highest and lowest seroprevalences were estimated in case-control investigations (40.4%; 30.7–50.6%) and retrospective cohort studies (26.5%; 17.1–37.2%), respectively. With respect to serological method used, subgroup analysis revealed the lowest (30.5%, 14.9–48.9%) and highest (57.2%, 47.0–67.1%) seroprevalences in studies that used the Sabin–Feldman (SFT) and immunofluorescence (IFAT) methods, respectively. The seroprevalence obtained in studies using ELISA (the most commonly used method) was 35.5% (31.1–40.1%). Further analyses and details are given in Table 2.
With respect to age, seroprevalences in the LT-group were 13.8% (11.8–15.7%), (39.5%, 38.7–40.4%), (46.3%, 44.9–47.7%) and (43.7%, 37.1–50.3%) in HIV+ people of < 20, 20–40, 40–60 and > 60 years of age, respectively (Table 3). With respect to the CD4+ lymphocyte counts, seroprevalences were 18.4% (16.8–20.0%), 33.8% (32.6–34.9%) and 21.9% (20.5–23.3%) in HIV+ people with CD4+ counts of <200, 200–500 and >500 per µL, respectively (Table 3).
Regarding risk factors, the findings showed that HIV+ people who consumed raw/undercooked meat (odds ratio [OR], 2.01; 95% CI, 1.19–3.9) and/or were in frequent contact with soil (OR, 3.01; 95% CI, 1.5–6.04) were more likely to be seropositive than those who consumed cooked meat and had limited contact with soil (Figures S3 and S4). Seroprevalence was significantly higher in HIV+ people who were older and had lower CD4+ cell counts. HIV+ people of 20–40 (OR, 1.63; 95% CI, 1.15–2.61), 40–60 (OR, 2.49; 95% CI, 1.62–3.82) and >60 (OR, 2.39; 95% CI, 1.56–3.66) years of age (Figures S5–S7) and those with CD4+ cell counts of 200–500 (OR, 1.71; 95% CI, 1.08–2.72) and <200 (OR, 1.04; 95% CI, 0.79–1.37) cells per µL were more likely to be seropositive (Figures S8 and S9). Other findings (Table 3 and Tables S10–S15) showed that females, people who lived in rural areas, consumed raw/unwashed vegetables or untreated water and/or were cat or dog owners were at a greater (but insignificant) risk of acquiring infection. No significant publication bias was seen, based on results achieved using the Egger’s test (Table 3).

3.3. Global and Regional Seroprevalence Estimates in the AT-Group of HIV+ People, and Associated Socio-Demographic Aspects

When the data from all 65 studies/datasets representing 32 countries were pooled, the global prevalence of acute T. gondii infection (AT) in HIV+ people was estimated at 1.3% (95% CI, 0.9–1.8%; 289 of 17,705). The heterogeneity between studies was significant (I2 = 79.1%, p < 0.001). The highest seroprevalences were indicated in South America (2.0%; 0.1–5.4%) and the Eastern Mediterranean region (1.8%; 0.7–3.3%), and the lowest prevalence in the European region (0.6%; 0.2–1.3%). The pooled seroprevalence rates in other WHO regions were: 1.6% (0.5–3.1%) in North America, 1.3% (0.9–1.8%) in South-East Asia, 1.2% (0.2–2.6%) in the Western Pacific and 0.9% (0.2–1.2%) in Africa (Table 4 and Figure 1B). We estimated that ~492,700 (341,100–682,200) HIV+ people worldwide were afflicted by acute T. gondii infection/toxoplasmosis. Our estimates demonstrated that Africa has the highest number of HIV+ people with acute infection (231,300; 51,400–308,400), accounting for ~47% of all such cases worldwide. Details pertaining to estimated seroprevalences in distinct WHO-regions and countries are given in Table 4 and Figure 1B. When the pooled seroprevalence was stratified according to income-level in a country, the highest prevalence estimates were in countries with lower-middle income levels (1.8%, 0.7–3.2%) and the lowest in those with low income-levels (0.4%, 0.0–1.9%). In relation to HDI, the highest prevalence rates were in countries with low HDIs (1.4%, 0.1–1.3%) and the lowest rates in countries with high HDIs (1.3%, 0.7–2.0%) (Table 2). Subsequent meta-regression analyses revealed an insignificant decreasing trend in prevalence in countries with increasing per capita incomes (C = −0.00082; p-value = 0.88) and HDIs (C = −0.0056; p-value = 0.92) in a country (Figure 2D,E). Considering study year, sub-group analysis showed higher prevalence rates from 2010 to 2020 than 1980 to 2009. This increasing trend was insignificant in meta-regression analysis (C = 0.0002; p-value = 0.7) (Figure 2F). Considering study-type, subgroup analysis showed the highest prevalence rates in case-control investigations (2.6%, 0.8–5.0%), followed by prospective cohort studies (2.6%, 0.8–5.0%), with the lowest seroprevalences estimated in retrospective cohort investigations (1.0%, 0.3–2.0%). Considering the serodiagnostic approach, subgroup analysis revealed that Toxoplasma seroprevalences estimated using IgG and IgM-based tests (1.2%, 0.7–1.8%) and seroconversion evaluation (1.2%, 0.8–1.7%) were almost the same. Additional subgroup analyses and results are given in Table 2.

4. Discussion

This investigation provides seroprevalence estimates to infer burdens of latent or acute T. gondii infection in HIV+ people at the global, regional and country levels, and sheds light on key socio-economic and immunological variables as well as risk factors for toxoplasmosis in this cohort of people.
The pooled seroprevalence rates estimated separately for latent (37.4; ~14.2 million people) and acute (1.3%; 0.5 million people) T. gondii infections in HIV+ people are similar to those reported (33.8% and 1.1%, respectively) for pregnant women worldwide [7,8]. The estimate for latent toxoplasmosis (37.4%) is slightly higher than the 35.8% reported previously for HIV+ people by Wang et al. [23], who used data from a total of 74 studies of 25,989 HIV+ people—i.e., 51% fewer studies and 42% fewer individuals than in the present investigation.
Here, the overall seroprevalence estimates for latent or acute T. gondii infection varied among regions, with the highest estimates in African and South-American countries and the lowest in the Western Pacific region, in agreement with previous global investigations of pregnant women [7,8]. The very high prevalence (up to ~ 84%) of latent infection in countries or regions of Africa (particularly sub-Sahara), Latin America and the Caribbean compared with other parts of the world (Table 1) likely relates to socioeconomic factors (income and HDI status) and climatic factors (high environmental temperature and humidity); the public health and sanitary situation; the prevalence of stray cats and the extent of environmental contamination with T. gondii oocysts (i.e., soil and water); cultural or culinary habits, particularly the consumption of semi-cooked or raw meat; and the infectivity/virulence of particular T. gondii genotypes present [7,11,35,36].
The present study showed that the key risk factors for latent T. gondii infection in HIV+ people are low CD4+ lymphocyte counts, age, frequent contact with soil, and the consumption of raw/undercooked meat, consistent with those proposed or documented in numerous previous publications and reviews [37,38,39,40,41]. Raw/undercooked meat is assumed to be a major source of T. gondii infection; however, as a risk factor, this depends on the kind of meat consumed and local culinary habits of meat preparation in a particular country or region; for example a report from China [42] indicated that the anti-T gondii seroprevalence in people who consumed beef or duck was higher than in than those who consumed pork, lamb and/or chicken. In European and American countries, lamb and pork are major dietary risk factors, whereas in the Middle East lamb is reported to be a key risk factor [37,40,43,44].
The increase in seroprevalence in HIV+ people with age is simply explained by an increased probability of infection with, or exposure to, Toxoplasma over time [19,36]. We expect that one of the most important risk factors for toxoplasmosis in HIV+ is a low CD4+ lymphocyte count. It is well documented that a decline in this count is a key reason for the reactivation of toxoplasmosis in HIV+ individuals with latent T. gondii infection, ultimately leading to severe or fatal disease [13,14]. Clearly, this scenario applies also to other immunodeficiencies caused by transplantation, malignant cancers and/or chemotherapy [17,45,46], where accidental or subclinical infections with opportunistic pathogens can have devastating consequences.
While the findings of the present study are insightful, some results need to be interpreted cautiously. First, we found significant heterogeneity between studies, which is a common issue in epidemiological studies such as this one, and could not be adequately explained by the subgroup and meta-regression analyses. The sources of heterogeneity likely relate to study characteristics, including differences in study design, season, geographical distribution, sample size and/or detection methods, including differences in the quality and performance of these methods. Second, the vast majority of studies in the literature have used serological methods to detect latent or acute T. gondii infection; however, serum antibody responses to T. gondii in immunodeficient individuals with HIV infection might be low in some or many cases, indicating or suggesting that the prevalence rates calculated here might actually be an under representation of the actual prevalence status globally and regionally. While bioassays (in mice or cats) are considered as the gold standard for the definitive diagnosis of toxoplasmosis [47], these assays are usually not used for diagnosis in humans. Moreover, DNA-based methods do not commonly complement routine diagnosis in humans. Thus, serodiagnosis is the mainstay, but variation in the performance of serological assays (including diagnostic specificity and sensitivity; reproducibility and repeatability of results) will influence prevalence estimates. Third, relatively few studies met the selection criteria for inclusion; many studies lacked critical data and/or information or were clinically focused on individual toxoplasmosis cases. Thus, the prevalence rates estimated here should be considered as apparent, not actual. In addition, we acknowledge that, despite undertaking a comprehensive systematic search, published studies and data sets are not available for many parts of the world.

5. Conclusions

In spite of some limitations, this is the most comprehensive review and meta-analysis of available data sets to estimate the seroprevalence of T. gondii infections in HIV+ people, and to identify associated risk factors. The inference that more than one third of all people with HIV infection likely have a latent T. gondii infection indicates that many of these individuals are at risk of developing ‘reactivated’ toxoplasmosis as a consequence of their immunodeficiency, and that a small percentage (~ 1%) are at risk of acquiring primary Toxoplasma infection. Current international guidelines [48] recommend that all HIV+ individuals should be tested for specific anti-Toxoplasma IgG serum antibodies immediately after being diagnosed as having HIV infection, and that particularly individuals with no detectable anti-Toxoplasma serum antibodies should be counselled about the risks of them acquiring Toxoplasma and/or other opportunistic infections. These guidelines also emphasise that Toxoplasma-seropositive patients with CD4+ counts of <100 cells/µL should receive prescribed, routine treatment with trimethoprim + sulfamethoxazole or atovaquone to prevent toxoplasmic encephalitis and Pneumocystis jirovecii-associated pneumonia. However, it is noteworthy that a 2017 systematic review of toxoplasmosis chemoprophylaxis failed to identify any studies from Africa [49], while a recent study from Mozambique highlights the aspects of this illness that are comparable to a neglected tropical disease at the treatment, prevention and policy levels [50]. The high seroprevalence rates of T. gondii infection in lesser developed countries and regions of the world, including those in sub-Saharan Africa, call for action by governments and health authorities to introduce the routine serological monitoring, counselling, care and/or prophylactic treatment measures needed to prevent severe toxoplasmosis from developing in highly susceptible people living with HIV infection.

Supplementary Materials

The following are available online at https://www.mdpi.com/article/10.3390/microorganisms9102034/s1, Figure S1: Search strategy in databases, Figure S2: Flow diagram of the search strategy and study selection process, Figure S3: Forest plots of pooled odds ratio (OR) for latent T. gondii infection in HIV+ people with respect to consumption of raw/under-cooked meat. HIV+ people who did not consume raw/under-cooked meat were considered as the reference category to estimate OR, Figure S4: Forest plots of pooled odds ratio (OR) for latent T. gondii infection in HIV+ people with respect to contact with soil. HIV+ people without contact with soil were considered as the reference category to estimate OR, Figure S5: Forest plots of pooled odds ratio (OR) for latent T. gondii infection in HIV+ people with respect to ages of 20–40 years compared to ages <20, Figure S6: Forest plots of pooled odds ratio (OR) for latent T. gondii infection in HIV+ people with respect to the ages of 40–60 years compared to ages <20, Figure S7: Forest plots of pooled odds ratio (OR) for latent T. gondii infection in HIV+ people with respect to ages >60 years compared to ages <20, Figure S8: Forest plots of pooled odds ratio (OR) for latent T. gondii infection in HIV+ people with respect to age and number of CD4+ cells 200–500 compared to age and number of CD4+ cells >500, Figure S9: Forest plots of pooled odds ratio (OR) for latent T. gondii infection in HIV+ people with respect to age and number of CD4+ <200 compared to age and number of CD4+ >500, Figure S10: Forest plots of pooled odds ratio (OR) for latent T. gondii infection in HIV+ people with respect to gender (male and female). Female gender was considered as the reference category to estimate OR, Figure S11: Forest plots of pooled odds ratio (OR) for latent T. gondii infection in HIV+ people with respect to type of residence (rural and urban). Living in an urban area was considered as the reference category to estimate OR, Figure S12: Forest plots of pooled odds ratio (OR) for latent T. gondii infection in HIV+ people with respect to cat ownership. HIV+ people who were not cat owners were considered the reference category to estimate OR, Figure S13: Forest plots of pooled odds ratio (OR) for latent T. gondii infection in HIV+ people with respect to dog ownership. HIV+ people who were not dog owners were considered the reference category to estimate OR, Figure S14: Forest plots of pooled odds ratio (OR) for latent T. gondii infection in HIV+ people with respect to consumption of raw/unwashed vegetables. HIV+ people who did not consume raw/unwashed vegetables were considered as the reference category to estimate OR, Figure S15: Forest plots of pooled odds ratio (OR) for latent T. gondii infection in HIV+ people with respect to drinking untreated water. HIV+ people who drank treated water were considered as the reference category to estimate OR, Table S1: Main features of studies included on the seroprevalences of latent and acute Toxoplasma gondii infection (LT and AT, respectively) in HIV+ people worldwide.

Author Contributions

A.R., S.A.S. and R.G. conceived the study. A.R., A.T., S.A.S., M.M.-A., and S.E. conducted the searches and collected data. A.R., M.S., and S.M.R. analysed and interpreted results. A.R. and R.B.G. drafted and edited the manuscript. All other authors—S.M.R., S.A.S., A.T., M.S., M.M.-A., S.E., P.J.H., R.G.—contributed to the manuscript by editing and/or commenting on drafts. The final version of the manuscript was approved by all authors. All authors have read and agreed to the published version of the manuscript.

Funding

A.R.’s research is supported by the Health Research Institute of Babol University of Medical Sciences, Iran (IR.MUBABOL.REC.1399.037) is gratefully acknowledged (A.R.), and R.B.G.’s research is presently supported by the Australian Research Council (ARC), Yourgene Health Singapore and Melbourne Water.

Institutional Review Board Statement

Not applicable.

Informed Consent Statement

Not applicable.

Data Availability Statement

All data are available in main manuscript and supplementary files. Further data would be provided by the first corresponding author as/if requested.

Acknowledgments

Sincere thanks to Malihe Nourollahpour Shiadeh for critical reading of the draft manuscript and for comments.

Conflicts of Interest

The authors declare no conflict of interest. The funders had no role in the design of the study; in the collection, analyses, or interpretation of data; in the writing of the manuscript, or in the decision to publish the results.

References

  1. Belanger, F.; Derouin, F.; Grangeot-Keros, L.; Meyer, L.; HEMOCO and SEROCO Study Groups. Incidence and risk factors of toxoplasmosis in a cohort of human immunodeficiency virus-infected patients: 1988–1995. Clin. Infect. Dis. 1999, 28, 575–581. [Google Scholar] [CrossRef] [Green Version]
  2. Luft, B.J.; Remington, J.S. Toxoplasmic encephalitis in AIDS. Clin. Infect. Dis. 1992, 15, 211–222. [Google Scholar] [CrossRef]
  3. Richards, F.O.; Kovacs, J.A.; Luft, B.J. Preventing toxoplasmic encephalitis in persons infected with human immunodeficiency virus. Clin. Infect. Dis. 1995, 21, S49–S56. [Google Scholar] [CrossRef]
  4. Robert-Gangneux, F.; Dardé, M.-L. Epidemiology of and diagnostic strategies for toxoplasmosis. Clin. Microbiol. Rev. 2012, 25, 264–296. [Google Scholar] [CrossRef] [PubMed] [Green Version]
  5. Basavaraju, A. Toxoplasmosis in HIV infection: An overview. Trop. Parasitol. 2016, 6, 129–135. [Google Scholar] [CrossRef] [Green Version]
  6. Foroutan, M.; Rostami, A.; Majidiani, H.; Riahi, S.M.; Khazaei, S.; Badri, M.; Yousefi, E. A systematic review and meta-analysis of the prevalence of toxoplasmosis in hemodialysis patients in Iran. Epidemiol. Health 2018, 40, e2018016. [Google Scholar] [CrossRef] [PubMed]
  7. Rostami, A.; Riahi, S.M.; Contopoulos-Ioannidis, D.G.; Gamble, H.R.; Fakhri, Y.; Shiadeh, M.N.; Foroutan, M.; Behniafar, H.; Taghipour, A.; Maldonado, Y.A. Acute Toxoplasma infection in pregnant women worldwide: A systematic review and meta-analysis. PLoS Negl. Trop. Dis. 2019, 13, e0007807. [Google Scholar] [CrossRef] [Green Version]
  8. Rostami, A.; Riahi, S.M.; Gamble, H.R.; Fakhri, Y.; Shiadeh, M.N.; Danesh, M.; Behniafar, H.; Paktinat, S.; Foroutan, M.; Mokdad, A.H. Global prevalence of latent toxoplasmosis in pregnant women: A systematic review and meta-analysis. Clin. Microbiol. Infect. 2020, 26, 673–683. [Google Scholar] [CrossRef] [PubMed]
  9. Shiadeh, M.N.; Esfandyari, S.; Ashrafmansouri, M.; Mirzapour, A.; Taghipour, A.; Spotin, A.; Arefkhah, N.; Gamble, R.; Safa, A.; Rostami, A. The prevalence of latent and acute toxoplasmosis in HIV-infected pregnant women: A systematic review and meta-analysis. Microb. Pathog. 2020, 149, 104549. [Google Scholar] [CrossRef]
  10. Nourollahpour Shiadeh, M.; Rostami, A.; Pearce, B.; Gholipourmalekabadi, M.; Newport, D.J.; Danesh, M.; Mehravar, S.; Seyyedtabaei, S. The correlation between Toxoplasma gondii infection and prenatal depression in pregnant women. Eur. J. Clin. Microbiol. Infect. Dis. 2016, 35, 1829–1835. [Google Scholar] [CrossRef]
  11. Hill, D.; Dubey, J. Toxoplasma gondii: Transmission, diagnosis and prevention. Clin. Microbiol. Infect. 2002, 8, 634–640. [Google Scholar] [CrossRef] [Green Version]
  12. Munoz, M.; Liesenfeld, O.; Heimesaat, M.M. Immunology of Toxoplasma Gondii. Immunol. Rev. 2011, 240, 269–285. [Google Scholar] [CrossRef] [PubMed]
  13. Shearer, G.; Bernstein, D.; Tung, K.; Via, C.; Redfield, R.; Salahuddin, S.; Gallo, R. A model for the selective loss of major histocompatibility complex self-restricted T cell immune responses during the development of acquired immune deficiency syndrome (AIDS). J. Immunol. 1986, 137, 2514–2521. [Google Scholar] [PubMed]
  14. Khan, I.A.; Hwang, S.; Moretto, M. Toxoplasma gondii: CD8 T cells cry for CD4 help. Front. Cell. Infect. Microbiol. 2019, 9, 136. [Google Scholar] [CrossRef] [PubMed] [Green Version]
  15. Nissapatorn, V.; Lee, C.; Quek, K.F.; Leong, C.L.; Mahmud, R.; Abdullah, K.A. Toxoplasmosis in HIV/AIDS patients: A current situation. Jpn. J. Infect. Dis. 2004, 57, 160–165. [Google Scholar] [PubMed]
  16. Dzitko, K.; Staczek, P.; Gatkowska, J.; Dlugonska, H. Toxoplasma gondii: Serological recognition of reinfection. Exp. Parasitol. 2006, 112, 134–137. [Google Scholar] [CrossRef]
  17. Wang, Z.-D.; Liu, H.-H.; Ma, Z.-X.; Ma, H.-Y.; Li, Z.-Y.; Yang, Z.-B.; Zhu, X.-Q.; Xu, B.; Wei, F.; Liu, Q. Toxoplasma gondii infection in immunocompromised patients: A systematic review and meta-analysis. Front. Microbiol. 2017, 8, 389. [Google Scholar] [CrossRef] [Green Version]
  18. Kaplan, J.E.; Benson, C.; Holmes, K.K.; Brooks, J.T.; Pau, A.; Masur, H.; National Institutes of Health; Centers for Disease Control and Prevention (CDC); HIV Medicine Association of the Infectious Diseases Society of America. Guidelines for prevention and treatment of opportunistic infections in HIV-infected adults and adolescents. MMWR Recomm. Rep. 2009, 58, 1–207. [Google Scholar]
  19. Rostami, A.; Keshavarz, H.; Shojaee, S.; Mohebali, M.; Meamar, A.R. Frequency of Toxoplasma gondii in HIV positive patients from West of Iran by ELISA and PCR. Iran. J. Parasitol. 2014, 9, 474–481. [Google Scholar]
  20. Sari, Y.; Haryati, S.; Raharjo, I.; Prasetyo, A.A. Toxoplasma and viral antibodies among HIV patients and inmates in central Java, Indonesia. Southeast Asian J. Trop. Med. Public Health 2015, 46, 977–985. [Google Scholar]
  21. Mirambo, M.M.; Kivambe, C.; Mushi, M.F.; Zinga, M.; Mngumi, E.B.; Mtebe, M.; Mshana, S.E. High seroprevalence of specific Toxoplasma gondii IgG antibodies among HIV/AIDS patients with immunological failure attending a tertiary hospital in northwestern Tanzania. Tanzan. J. Health Res. 2016, 18, 1–4. [Google Scholar]
  22. Zeleke, A.J.; Melsew, Y.A. Seroprevalence of Toxoplasma gondii and associated risk factors among HIV-infected women within reproductive age group at Mizan Aman General Hospital, Southwest Ethiopia: A cross sectional study. BMC Res. Notes 2017, 10, 70. [Google Scholar] [CrossRef] [Green Version]
  23. Hoshina, T.; Horino, T.; Saiki, E.; Aonuma, H.; Sawaki, K.; Miyajima, M.; Lee, K.; Nakaharai, K.; Shimizu, A.; Hosaka, Y. Seroprevalence and associated factors of Toxoplasma gondii among HIV-infected patients in Tokyo: A cross sectional study. J. Infect. Chemother. 2020, 26, 33–37. [Google Scholar] [CrossRef]
  24. Wang, Z.-D.; Wang, S.-C.; Liu, H.-H.; Ma, H.-Y.; Li, Z.-Y.; Wei, F.; Zhu, X.-Q.; Liu, Q. Prevalence and burden of Toxoplasma gondii infection in HIV-infected people: A systematic review and meta-analysis. Lancet HIV 2017, 4, e177–e188. [Google Scholar] [CrossRef]
  25. Moher, D.; Shamseer, L.; Clarke, M.; Ghersi, D.; Liberati, A.; Petticrew, M.; Shekelle, P.; Stewart, L.A. Preferred reporting items for systematic review and meta-analysis protocols (PRISMA-P) 2015 statement. Syst. Rev. 2015, 4, 1. [Google Scholar] [CrossRef] [Green Version]
  26. Villard, O.; Cimon, B.; L’ollivier, C.; Fricker-Hidalgo, H.; Godineau, N.; Houze, S.; Paris, L.; Pelloux, H.; Villena, I.; Candolfi, E. Serological diagnosis of Toxoplasma gondii infection: Recommendations from the French National Reference Center for Toxoplasmosis. Diagn. Microbiol. Infect. Dis. 2016, 84, 22–33. [Google Scholar] [CrossRef] [Green Version]
  27. World Health Organization (WHO). List of Member States by WHO Region and Mortality Stratum. 2003. Available online: https://www.who.int/mental_health/neurology/annexes_neuro_disorders_public_h_challenges.pdf (accessed on 15 December 2020).
  28. Munn, Z.; Moola, S.; Riitano, D.; Lisy, K. The development of a critical appraisal tool for use in systematic reviews addressing questions of prevalence. Int. J. Health Policy Manag. 2014, 3, 123–128. [Google Scholar] [CrossRef] [PubMed] [Green Version]
  29. DerSimonian, R.; Laird, N. Meta-analysis in clinical trials. Control. Clin. Trials 1986, 7, 177–188. [Google Scholar] [CrossRef]
  30. DerSimonian, R.; Kacker, R. Random-effects model for meta-analysis of clinical trials: An update. Contemp. Clin. Trials 2007, 28, 105–114. [Google Scholar] [CrossRef] [PubMed]
  31. Barendregt, J.J.; Doi, S.A.; Lee, Y.Y.; Norman, R.E.; Vos, T. Meta-analysis of prevalence. J. Epidemiol. Commun. Health 2013, 67, 974–978. [Google Scholar] [CrossRef] [PubMed]
  32. Higgins, J.P.; Thompson, S.G. Quantifying heterogeneity in a meta-analysis. Stat. Med. 2002, 21, 1539–1558. [Google Scholar] [CrossRef] [PubMed]
  33. World Health Organization (WHO). Number of People (All Ages) Living with HIV Estimates by WHO Region. 2019. Available online: https://apps.who.int/gho/data/view.main.22100WHO?lang=en (accessed on 15 December 2020).
  34. Hunter, J.P.; Saratzis, A.; Sutton, A.J.; Boucher, R.H.; Sayers, R.D.; Bown, M.J. In meta-analyses of proportion studies, funnel plots were found to be an inaccurate method of assessing publication bias. J. Clin. Epidemiol. 2014, 67, 897–903. [Google Scholar] [CrossRef] [PubMed]
  35. Dubey, J. Toxoplasma gondii oocyst survival under defined temperatures. J. Parasitol. 1998, 84, 862–865. [Google Scholar] [CrossRef]
  36. Rostami, A.; Seyyedtabaei, S.J.; Aghamolaie, S.; Behniafar, H.; Lasjerdi, Z.; Abdolrasouli, A.; Mehravar, S.; Alvarado-Esquivel, C. Seroprevalence and risk factors associated with Toxoplasma gondii infection among rural communities in Northern Iran. Rev Inst. Med. Trop. São Paulo 2016, 58, 70. [Google Scholar] [CrossRef] [Green Version]
  37. Kapperud, G.; Jenum, P.A.; Stray-Pedersen, B.; Melby, K.K.; Eskild, A.; Eng, J. Risk factors for Toxoplasma gondii infection in pregnancy: Results of a prospective case-control study in Norway. Am. J. Epidemiol. 1996, 144, 405–412. [Google Scholar] [CrossRef] [PubMed] [Green Version]
  38. Baril, L.; Ancelle, T.; Goulet, V.; Thulliez, P.; Tirard-Fleury, V.; Carme, B. Risk factors for Toxoplasma infection in pregnancy: A case-control study in France. Scand. J. Infect. Dis. 1999, 31, 305–309. [Google Scholar]
  39. Boyer, K.M.; Holfels, E.; Roizen, N.; Swisher, C.; Mack, D.; Remington, J.; Withers, S.; Meier, P.; McLeod, R.; Group, T.S. Risk factors for Toxoplasma gondii infection in mothers of infants with congenital toxoplasmosis: Implications for prenatal management and screening. Am. J. Obstetr. Gynecol. 2005, 192, 564–571. [Google Scholar] [CrossRef]
  40. Jones, J.L.; Dargelas, V.; Roberts, J.; Press, C.; Remington, J.S.; Montoya, J.G. Risk factors for Toxoplasma gondii infection in the United States. Clin. Infect. Dis. 2009, 49, 878–884. [Google Scholar] [CrossRef] [Green Version]
  41. Gao, X.-J.; Zhao, Z.-J.; He, Z.-H.; Wang, T.; Yang, T.-B.; Chen, X.-G.; Shen, J.-L.; Wang, Y.; Lv, F.-L.; Hide, G. Toxoplasma gondii infection in pregnant women in China. Parasitology 2012, 139, 139–147. [Google Scholar] [CrossRef]
  42. Li, M.; Wu, J. Toxoplasma infection among pregnant women in Zhoushan city, Zhejiang Province. Chin. J. Health Educ. 2002, 18, 734–735. [Google Scholar]
  43. Cook, A.; Holliman, R.; Gilbert, R.; Buffolano, W.; Zufferey, J.; Petersen, E.; Jenum, P.; Foulon, W.; Semprini, A.; Dunn, D. Sources of Toxoplasma infection in pregnant women: European multicentre case-control study Commentary: Congenital toxoplasmosis—further thought for food. BMJ 2000, 321, 142–147. [Google Scholar] [CrossRef] [Green Version]
  44. Mahami-Oskouei, M.; Moradi, M.; Fallah, E.; Hamidi, F.; Akbari, N.A.R. Molecular detection and genotyping of Toxoplasma gondii in chicken, beef, and lamb meat consumed in Northwestern Iran. Iran. J. Parasitol. 2017, 12, 38–45. [Google Scholar]
  45. Jiang, C.; Li, Z.; Chen, P.; Chen, L. The seroprevalence of Toxoplasma gondii in Chinese population with cancer: A systematic review and meta-analysis. Medicine 2015, 94, e2274. [Google Scholar] [CrossRef] [PubMed]
  46. Robert-Gangneux, F.; Meroni, V.; Dupont, D.; Botterel, F.; Garcia, J.M.A.; Brenier-Pinchart, M.-P.; Accoceberry, I.; Akan, H.; Abbate, I.; Boggian, K.; et al. Toxoplasmosis in transplant recipients, Europe, 2010–2014. Emerg. Infect. Dis. 2018, 24, 1497–1504. [Google Scholar] [CrossRef] [PubMed]
  47. Rostami, A.; Karanis, P.; Fallahi, S. Advances in serological, imaging techniques and molecular diagnosis of Toxoplasma gondii infection. Infection 2018, 46, 303–315. [Google Scholar] [CrossRef] [PubMed]
  48. National Institutes of Health (NIH). Guidelines for the Prevention and Treatment of Opportunistic Infections in Adults and Adolescents with HIV, Toxoplasma gondii Encephalitis. Available online: https://clinicalinfo.hiv.gov/en/guidelines/adult-and-adolescent-opportunistic-infection/Toxoplasma-gondii-encephalitis?view=full (accessed on 22 June 2021).
  49. Rajapakse, S.; Weeratunga, P.; Rodrigo, C.; de Silva, N.L.; Fernando, S.D. Prophylaxis of human toxoplasmosis: A systematic review. Pathog. Glob. Health 2017, 111, 333–342. [Google Scholar] [CrossRef] [PubMed]
  50. Manuel, L.; Santos-Gomes, G.; Noormahomed, E.V. Human toxoplasmosis in Mozambique: Gaps in knowledge and research opportunities. Parasites Vectors 2020, 13, 1–10. [Google Scholar] [CrossRef] [PubMed]
Figure 1. Seroprevalence estimates for latent or acute T. gondii infections ((A)—LT and (B)—AT) in HIV+ people in different countries around the world using the geographic information system (GIS).
Microorganisms 09 02034 g001
Figure 2. Meta-regression analyses of the seroprevalence rates of latent and acute T. gondii infections (LT and AT, respectively) in HIV+ people. For LT, there was a statistically significant downward trend in prevalence in countries with higher income levels or higher human development index (HDI), and an upward trend (statistically insignificant) from 1980 to 2020 (AC, respectively). For AT, there was a downward trend (statistically insignificant) in seroprevalence in countries with higher income levels or higher HDIs, and an upward trend (statistically insignificant) from 1980 to 2020. ES: estimated seroprevalence (DF).
Microorganisms 09 02034 g002
Table 1. Global, regional and national pooled seroprevalences of latent T. gondii infection (LT) in HIV+ people (results from 155 datasets performed in 48 countries).
WHO Region/CountryNo. of DatasetsNo. of HIV+ People Screened (Total)No. of HIV+
People with LT
Pooled Sero- Prevalence
(95% CI)
Estimated No. of HIV+
People with LT *
Global15544,47314,91337.4 (33.4–41.4)14,174,600 (12,658,600–15,690,600)
South Americas92905127046.2 (23.6–69.6)877,800 (448,400–1,322,400)
Brazil8650120348.8 (23.5–74.5)439,200 (211,500–670,500)
Chile12556726.3 (21.0–32.1)18,673 (14,910–22,791)
Africanregion499504396746.2 (37.7–54.70)11,873,400 (9,688,900–14,057,900)
Ethiopia 121778139680.5 (66.3–91.6)555,450 (457,740–632,040)
Nigeria 12214970930.3 (19.2–42.7)575,700 (364,800–811,300)
Burkina Faso5254869130.7 (25.5–36.2)29,472 (24,480–34,752)
Cameroon329316754.5 (37.5–71.1)294,300 (202,500–383,940)
Ghana 251936570.6 (66.6–74.4)232,980 (219,780–245,520)
Uganda231613442.3 (36.9–47.8)592,200 (516,600–669,200)
South Africa24076213.5 (10.3–17.0)1,039,000 (793,100–1,309,000)
Zambia2256145.2 (2.7–8.4)62,400 (32,400–100,800)
Mozambique225811042.5 (36.5–47.7)935,000 (803,000–1,049,400)
Tanzania 1382668.4 (51.3–82.5)1,094,400 (820,800–1,320,000)
Canary island (Spain)11575635.7 (28.2–43.7)49,000 (39,480–61,180)
Botswana14636.5 (1.4–17.9)24,050 (5180–66,230)
Togo1561425.0 (14.4–38.4)27,500 (15,840–42,240)
Congo13757522.0 (19.1–26.4)19,580 (16,999–23,496)
Congo (Democratic Republic of the)1382873.6 (52.5–94.6)331,200 (236,250–425,700)
Central African Republic127011743.3 (37.3–49.5)47,630 (41,030–54,450)
Eastern Mediterranean233151127145.8 (36.3–55.5)183,200 (145,200–222,000)
Iran 192886114845.7 (35.3–56.3)27,877 (21,533–34,343)
Saudi Arabia1501530.0 (17.9–44.6)3,900 (2327–5798)
Bahrain1761621.1 (12.5–31.9)55 (32–83)
Morocco1955962.1 (51.6–71.9)13,041 (10,836–15,099)
Sudan1443375.0 (59.7–86.8)44,250 (35,223–51,212)
European region208786410941.1 (33.0–49.4)1,027,500 (825,000–1,235,000)
Spain 4170756230.7 (9.4–57.7)46,050 (14,100–86,550)
Turkey 278835245.2 (41.7–48.7)6690 (6172–7207)
United Kingdom260916426.9 (23.4–30.5)27,330 (23,774–30,988)
France21715123772.5 (70.3–74.6)130,500 (126,540–134,280)
Austria 265937757.3 (53.5–61.1)5157 (4815–5499)
Romania 22246930.5 (24.6–36.8)5490 (4428–6624)
Czech Republic 213022040.0 (37.4–42.7)1760 (1645–1879)
Croatia11668651.8 (43.9–59.6)829 (702–953)
Germany11836435.0 (28.1–42.4)30,450 (24,447–36,888)
Denmark150322344.3 (39.9–48.8)2746 (2474–3025)
Switzerland171536050.3 (46.6–54.1)10,060 (9320–10,820)
Serbia 128812744.1 (38.3–50.0)1323 (1149–1500)
South-East AsianRegion185232158229.8 (22.0–38.3)1,132,400 (836,000–1,455,400)
India 10277353224.1 (16.8–32.2)530,200 (369,600–708,400)
Indonesia 4113144738.5 (32.2–45.0)246,400 (206,080–288,000)
Thailand3132860337.5 (20.8–56.0)180,000 (99,840–268,800)
North America and the Caribbean127202115025.5 (19.2–32.4)433,500 (326,400–550,800)
USA8586288918.3 (13.3–23.9)201,300 (146,300–262,900)
Mexico21879110.6 (8.8–12.6)24,380 (20,240–25,980)
Canada 110741448.7 (41.5–55.9)30,681 (26,148–35,217)
Cuba 1795670.9 (59.6–80.6)21,979 (18,476–24,986)
Western PacificRegion247630153018.4 (12.4–25.3)349,600 (235,600–480,700)
China 10376859812.2 (5.5–20.9)109,800 (49,500–188,100)
Malaysia6150751136.1 (18.4–56.1)31,407 (16,008–48,807)
Japan4680679.9 (6.4–14.0)2970 (1920–4200)
Taiwan 15505610.2 (7.8–13.0)4896 (3744–6240)
South-Korea117374.0 (1.6–8.2)1800 (720–3690)
Singapore177118323.7 (20.8–26.9)1872 (1643–2125)
Papua New Guinea118110859.7 (52.1–66.9)26,865 (23,445–30,105)
WHO regions are sorted according to prevalence rate, and countries according to the number of studies included. * Estimates of the numbers of HIV+ people in individual regions were obtained from a WHO report from 2019 [33].
Table 2. Seroprevalence estimates for latent or acute T. gondii infections (LT and AT, respectively) in HIV+ people according to a priori defined subgroups.
Variable/SubgroupsNo. of DatasetsTotal No. of HIV+ People ScreenedNo. of HIV+ People with LT Pooled Sero-Prevalence
% (95% CI)
No. of HIV+ People with ATPooled Sero-Prevalence
% (95% CI)
LTATLTAT
Income
Low 2755950973267558.2 (46.2–69.8)80.4 (0.0–1.9)
Lower middle351371683389235034.5 (27.0–42.3)721.8 (0.7–3.2)
Upper middle552813,9805764468236.0 (29.2–43.1)1051.4 (0.7–2.3)
High 382017,3757579520628.0 (21.3–35.2)1041.2 (0.6–1.9)
HDI
Low42879691307353351.9 (42.8–60.8)231.4 (0.1–3.7)
Medium221255563462155429.3 (20.9–38.4)641.5 (0.6–2.6)
High 472513,40568584526938.0 (22.6–33.1)1091.3 (0.6–2.2)
Very high442117,5436078455727.6 (22.6–33.1)931.3 (0.7–2.0)
Type of study
Cross sectional954424,5768739794138.7 (33.6–44.0)1481.2 (0.7–1.8)
Case-control 321052041895205940.4 (30.7–50.6)362.6 (0.8–5.0)
Prospective cohort9435341591115136.6 (19.1–56.1)342.1 (1.1–3.4)
Retrospective cohort19811,1595480376226.5 (17.1–37.2)711.0 (0.3–1.0)
Criteria for AT
IgG and IgMna50na9872nana1661.2 (0.7–1.8)
Seroconversionna12na6715nana881.2 (0.8–1.7)
IgG avidity na2na961nana281.7 (1.0–2.7)
Antigen detectionna2na157nana73.5 (1.0–7.2)
Year
1980–2000351711,9205894428237.5 (29.4–46.0)821.2 (0.6–1.9)
2000–200514363661095182326.2 (17.3–36.2)60.5 (0.0–1.6)
2006–2010174289372680328.7 (15.7–43.8)50.4 (0.0–1.2)
2011–2015491612,3864212447545.3 (37.4–53.3)901.7 (0.7–3.2)
2016–2020402610,9085688353035.6 (27.8–43.9)1061.5 (0.7–2.5)
Sample size
≤99452029871338126941.5 (33.7–49.6)552.9 (1.2–5.1)
100–300652711,5264782480743.1 (36.3–50.1)771.0 (0.4–1.8)
301–500221083724016206722.0 (14.5–30.7)721.6 (1.0–2.4)
501–100016711,1324651353029.9 (19.7–41.1)57 0.9 (0.3–2.0)
>10007210,4562918324129.8 (14.7–47.7)281.0 (0.6–1.3)
Risk of bias
Low 1185042,22716,73613,98436.1 (31.6–40.6)2491.2 (0.8–1.6)
Moderate3716224696996741.8 (33.4–41.4)402.8 (1.0–5.4)
Serological methods
ELISA125na35,286na11,73635.5 (31.1–40.1)nana
IFAT9na2828na148657.2 (47.0–67.1)nana
LAT5na658na39561.9 (40.9–80.8)nana
MEIA5na1631na32130.1 (14.3–48.8)nana
SFT6na3199na70630.5 (14.9–48.9)nana
Other (MAT, CFT, ELFA or DAT)5na871na26940.2 (15.4–68.0)nana
Abbreviations: HDI: human development index; ELISA: enzyme-linked immunosorbent assay; IFAT: indirect immunofluorescence; LAT: latex agglutination; MEIA: microparticle enzyme immunoassay; SFT: Sabin-Feldman test; MAT: modified agglutination test; CFT: complement fixation test; ELFA: enzyme-linked fluorescence assay; DAT: direct agglutination test.
Table 3. Risk factors associated with HIV+ people inferred to have Toxoplasma gondii infection based on their serological profile.
Variables
(Number of Studies)
No. of
HIV+ People
No.
Seropositive for T. gondii
Pooled Sero-
Prevalence
(95% CI)
OR (95% CI)Heterogeneity
I2 (%)
Publication Bias p Value |t|
Gender (34) 89.10.25
Female58062106 35.16 (34.28, 36.03)1
Male78262363 29.44 (28.60, 30.28)0.78 (0.55–1.12)
Residence (9) 36.90.44
Urban 147282059.73 (57.61, 61.84)1
Rural 28316667.29 (63.16, 71.42)1.45 (0.76–2.75)
Close contact with dog (3) 90.10.98
No53114117.47 (14.89, 20.05)1
Yes2355616.36 (12.46, 20.26)2.69 (0.55–13.18)
Close contact with cats (15) 84.00.31
No 175391976.52 (74.94, 78.10)1
Yes103961175.39 (73.13, 77.64)1.79 (0.91–3.50)
Contact with soil (5) 67.20.5
No44221946.84 (43.18, 50.49)1
Yes 31623683.92 (80.26, 87.58)3.01 (1.50–6.04)
Consumption of raw meat (15) 78.50.88
No162689268.09 (66.65, 69.53)1
Yes 101669985.28 (83.54, 87.02)2.01 (1.19–3.39)
Consumption of raw/unwashed vegetable (8) 13.70.26
No49341188.79 (86.14, 91.43)1
Yes 75665395.28 (93.82, 96.74)1.04 (0.68–1.6)
Drinking untreated water (5) 45.50.19
No83561282.19 (79.95, 84.44)1
Yes 29820783.64 (80.24, 87.03)1.19 (0.67–2.11)
Number of CD4+ cells (29)
≥ 500173344018.48 (16.88, 20.09)1
200–5003625120133.82 (32.68, 34.97)1.71 (1.08–2.72)50.90.71
< 200251170021.97 (20.57, 23.36)1.04 (0.79–1.37)77.20.51
Age (36)
< 20106418113.81 (11.86, 15.77)1
20–406824239339.59 (38.70, 40.47)1.63 (1.15–2.61)42.30.06
40–602968129546.33 (44.93, 47.74)2.49 (1.62–3.82)54.20.09
>601817543.78 (37.19, 50.36)2.39 (1.56–3.66)00.48
Table 4. Global, regional and national pooled seroprevalence rates for acute Toxoplasma gondii infection (AT) in HIV+ people (results from 65 studies performed in 31 countries).
WHO Regions/CountryNo. of Datasets No. of HIV+ People Screened (Total)No. of HIV+ People Estimated to Have AT Pooled Prevalence (95% CI)Estimated No. of HIV+ People with AT *
Global6517,7052891.3 (0.9–1.8)492,700 (341,100–682,200)
South Americas4863202.0 (0.1–5.4)38,000 (1900–102,600)
Brazil4863202.0 (0.1–5.4)38,000 (1900–102,600)
Africanregion152505320.9 (0.2–1.2)231,300 (51,400–308,400)
Burkina Faso249700.1 (0.0–0.4)96 (0–384)
Cameroon2223145.4 (2.7–8.9)29,160 (14,580–48,060)
Ghana 251910.1 (0.0–0.8)330 (0–2640)
South Africa240771.4 (0.4–2.9)107,800 (30,800–223,300)
Ethiopia 115001.1 (0.2–2.4)7590 (1380–16,560)
Nigeria 111110.9 (0.1–4.9)17,100 (1900–93,100)
Zambia16900.1 (0.0–5.2)1200 (0–62,400)
Canary island (Spain)115710.6 (0.0–3.5)840 (0–4900)
Botswana14600.1 (0.0–7.7)370 (0–28,490)
Togo15623.6 (0.4–12.3)3960 (440–13,530)
Eastern Mediterranean152125511.8 (0.7–3.3)7200 (2800–13,200)
Iran 131999421.5 (0.6–2.7)915 (366–1647)
Saudi Arabia150918.0 (8.6–31.4)2340 (1118–4082)
Bahrain17600.1 (0.0–4.7)2 (0–12.2)
European region156447670.6 (0.2–1.3)15,000 (5000–32,500)
Turkey 278800.1 (0.0–0.2)15 (0–29.6)
France21715140.3 (0.0–0.7)540 (0–1260)
Romania 222420.1 (0.0–1.0)18 (0–180)
Czech Republic 21302140.8 (0.3–1.4)35 (13–61)
Spain 16369.5 (3.6–19.6)14,250 (5400–29,400)
United Kingdom150071.4 (0.6–2.9)1422 (609–2946)
Croatia116621.2 (0.1–4.3)19 (2–69)
Germany118363.3 (1.2–7.0)2871 (1044–6090)
Denmark150340.8 (0.2–2.0)49 (12–124)
Switzerland1715121.7 (0.9–2.9)340 (180–580)
Serbia 128800.1 (0.0–1.3)3 (0–39)
North America and the Caribbean51729281.6 (0.5–3.1)27,200 (8500–52,700)
USA41637271.7 (0.5–3.6)18,700 (5500–39,600)
Mexico19211.1 (0.1–5.9)2530 (230–13,570)
South-East Asian Region93605851.3 (0.9–1.8)49,400 (34,200–68,400)
India 51730271.6 (0.4–3.4)35,200 (8800–74,800)
Indonesia 3737293.9 (2.5–5.4)24,960 (16,000–34,560)
Thailand21138291.5 (0.8–2.3)7200 (3840–11,040)
Western Pacific Region344161.2 (0.2–2.6)22,800 (3800–49,400)
Malaysia218231.5 (0.1–4.1)1305 (87–3567)
China 125931.2 (0.2–3.3)10,800 (1800–29,700)
WHO regions are sorted according to prevalence rate, and countries according to the number of studies included. * Estimates of the numbers of HIV+ people in individual regions were obtained from a WHO report from 2019 [33].
Publisher’s Note: MDPI stays neutral with regard to jurisdictional claims in published maps and institutional affiliations.

