Article

Fire Resistance of In-Plane Compressed Log-House Timber Walls with Partial Thermal Insulation

1
Department of Engineering and Architecture, University of Trieste, Piazzale Europa 1, 34127 Trieste, Italy
2
Department of Civil, Architecture and Building and Environmental Engineering, University of L’Aquila, Via Giovanni Gronchi 18, 67100 L’Aquila, Italy
*
Author to whom correspondence should be addressed.
Buildings 2018, 8(10), 131; https://doi.org/10.3390/buildings8100131
Submission received: 29 August 2018 / Revised: 14 September 2018 / Accepted: 18 September 2018 / Published: 21 September 2018

Abstract

:
This paper presents the full-scale experimental assessment of a log-house timber wall with partial thermal insulation under in-plane compression and exposed to fire on one side. A key aspect of the current design application for log-house systems is represented by geometrical details, like cross-sectional properties of logs (typically characterised by high depth-to-width ratios) and outriggers. The latter provides restraint condition for the examined walls and hence markedly affects their overall load-carrying capacity. As a result, careful consideration should be given to the choice of these details, compared to fully monolithic timber walls (i.e., made from cross-laminated timber), due to the possible occurrence of local structural and/or thermo-mechanical mechanisms. This is the case of exceptional loading conditions like fire load, as the fire resistance of these systems could be affected by a multitude of variables, including the presence (even though limited to few surfaces only) of thermal insulation panels. To this aim, the results of a full-scale furnace test are discussed in the paper for a log-wall with partial thermal insulation, namely thermal insulation applied on the outriggers only, under the effects of EN/ISO standard fire conditions. The results of Finite Element (FE) numerical studies are also reported, to further explore the load-carrying performance of the reference log-house specimen and compare it with the experimental observations. Several thermal insulation configurations are finally numerically investigated, showing their effects on the overall fire resistance of the assembly. In accordance with literature, the test shows that the log house’s timber wall is suitable to obtain a fire resistance of about 60 min under relevant loading. The FE results are in rather close agreement with the temperature measurements within the section of logs, as well as a qualitative correlation with respect to the mechanical behaviour observed in the full-scale furnace experiment. The key role of outriggers and their thermo-mechanical boundaries, finally, is emphasised.

1. Introduction and State-of-the-Art

The fire resistance of timber structures and building systems is an open issue for designers, especially when novel technologies, materials and methods are used. Structural fire guidance can be found in international codes for timber elements and assemblies [1,2]. However, full-scale tests and specific investigations are frequently required to assess their response under fire exposure conditions (see for example [3,4,5]), loading configurations, as well as to explore the reliability and potential of simplified design methods [6,7,8,9], novel timber-composite systems [10,11], modified material treatments [12], or thermal insulation methods [13,14]. Finite Element (FE) numerical modelling, in this regard, can offer robust support to full-scale testing, at least for preliminary fire resistance considerations [15,16,17,18,19].
This is the case of traditional structural solutions like log-house (or log-haus, or Blockhaus) systems that are not specifically considered by design codes (see for example [20,21]), particularly in fire conditions [22]. So far, research studies have been focused on their structural performance under various loading configurations, including seismic events [23,24,25,26,27], buckling [28] and thermal exposure [29].
In this paper, the fire resistance of log-house walls under in-plane compression is assessed via a full-scale standard test, carried out on a partially insulated sample (see Section 2.1, ‘W80’ specimen), including FE studies able to capture test observations and provide a further insight on the topic, via parametric simulations (Section 3 and Section 4). The current investigation follows and extends an earlier research project [29], where the in-plane compressive buckling response of a vertically loaded, thermally unprotected log-house wall was investigated, under the effects of a standard EN/ISO fire exposure. In Section 2.1, major features outcomes for the past ‘W90’ sample are hence briefly summarised from [29], for qualitative comparative purposes. Differing from [29], the key novel aspects and variations of the actual investigation are represented by (i) the geometrical properties of the full-scale specimen (i.e., cross-section of logs, total length of outriggers); (ii) the mechanical loading ratio (i.e., imposed in-plane compression); and (iii) the presence—even though on outriggers only, hence on a limited portion of the fire-exposed surface—of gypsum fibreboard panels.
The test results are first described in detail and critically discussed, so as to highlight the load-carrying behavior and possible issues in such systems when exposed to fire. Special care is then taken for the thermo-mechanical boundary conditions of timber logs, due to the presence of gypsum fibreboard claddings. A set of thermocouples positioned at different depths of the specimen, as well as close to the critical regions of the full-scale specimen (namely in the corner joint components and in the insulation layers), allow the user to draw significant conclusions. Given the actual role of outriggers, acting as mechanical restraints for the main timber logs, their exposure to time-temperature loading has in fact direct effects on the overall performance of log-house assemblies (see also [28,29]).
Subsequently, a full 3D solid, FE model is also implemented in ABAQUS [30], to further analyse the W80 experimental specimen. The input modelling assumptions and basic features of the FE model are derived from [29], with appropriate modifications, so to account for specific test setup and geometrical details. As shown, even in the presence of intrinsic simplifications in the FE method for uncoupled thermo-mechanical analyses of timber structural systems, the presented numerical model offers a reasonable agreement with the full-scale test. The comparisons also highlight the limited number of available experimental data, hence suggesting the use of additional control points for fire resistance assessment purposes. In conclusion, the effect of several thermal insulations is also investigated via parametric FE simulations, giving evidence of the sensitivity of the fire resistance of such assemblies to even minor variations in their thermal and mechanical restraints (see Section 4).

2. Testing

2.1. The Examined ‘W80’ Log-House Wall

The full-scale test presented in this paper was carried out in Germany in November 2016 (laboratory facilities of MFPa Leipzig GmbH, fire test center of Laue), under the commission of Holzforschung Austria, Wien.
The tested log-house wall (denoted as ‘W80’, in the following) consisted of 16 main timber logs, with 3 m nominal length and 80 mm × 190 mm (width b × depth h) cross-sectional dimensions with the exception of the top main log, which was 150 mm deep, obtained by gluing together two lamellas of C24 strength class spruce [31], see Figure 1a. Such a set of overlapping logs was selected to realise an H = 3 m tall wall, so as to qualitatively reproduce the overall dimensions of the W90 log-house specimen, previously investigated in [29] under an EN/ISO standard time-temperature loading and an imposed in-plane compression (see Table 1). The unprotected W90 sample proved to sustain the imposed thermo-mechanical restraints for 60 min, with a global collapse mechanism being derived from the total charring of the lateral outriggers, hence from the lack of bracings on the main timber logs.
Later, the W80 sample was experimentally investigated to assess its fire performance in the presence of partial insulation for outriggers only, resulting in a partly different thermal configuration for full-scale assembly, with respect to the W90 wall. From a structural point of view, additional differences between the actual W80 and the past W90 specimens were represented by the cross-sectional features of logs (90 mm × 160 mm in [29], in place of the actual 80 mm × 190 mm profiles) as well as by the mechanical boundaries, including variations in the geometrical size and position of the outriggers (see Figure 1a). This means that given the geometrical features summarised in Table 1, a different buckling performance can be rationally expected from the W80 and W90 full-scale samples, even at room temperature (see also [28]). Further influencing parameters are then represented by the thermal restraints, hence requiring detailed investigations.
As shown in Table 1, the lateral bracings for the W80 assembly were made of two symmetrical, short log-walls having the same 80 × 190 mm cross-sectional features of main timber logs, but a total length Lorto = 500 mm and an actual distance from the wall ends D = 140 mm, see Figure 1a. Such a choice resulted in an actual bending span L0 = 2.64 m. The corner joints (similar in typology for both the W80 and W90 specimens) were then realised via a set of ‘Standard’ systems; a detailed view is presented in Figure 1b,c. In accordance with the analytical formulation proposed in [28], a mean critical buckling compression of Ncr,E,mean = N20 = 258 kN/m can be estimated for the W80 specimen (with 180 kN/m the corresponding design Euler’s critical value).
At the time of the full-scale experiment, its fire performance was investigated under the effects of an in-plane compression load Ntest = 30 kN/m, corresponding to RN = Ntest/N20 = 0.11 ≈ 1/9th the design resistance at ambient conditions. In this regard, it is important to highlight that the theoretical formulation presented in [28] for the reliable calculation of the Ncr,E,mean value was not available at the time of the furnace test.
As such, the imposed Ntest load was roughly estimated as mostly twice the compression that the given log-house wall should conventionally sustain, as a part of a 1-to-2 story residential building. This comment extends also to the past W90 sample, where the imposed compression ratio was set equal to RN = Ntest/N20 = 0.13 ≈ 1/7th.

2.2. Experimental Setup and Methods

The W80 specimen was tested within a large-scale vertical furnace (3.04 × 3 m (height by width) the mouth opening internal size, 1.3 m the furnace depth), by exposing the full sample to a constant in-plane compression Ntest and a standard fire curve according to EN/ISO regulations. Thermal exposure was controlled by eight plate thermometers (EN 1363-1 [1]), installed at a distance of 100 mm from the surface of timber logs exposed to fire (Figure 2b). Given the actual nominal dimensions of the W80 specimen (Figure 2c), the lateral gaps along the mouth edges were then properly filled with mineral wool layers (20 mm in thickness, 1000 °C the melting point, in accordance with EN 1365-1 [32]); see Figure 2a,b. During the assembly stage, before the application of thermo-mechanical loads, the outriggers were insulated on lateral-internal surfaces via 12.5 mm-thick gypsum fibreboard layers (Fermacell® type [33]; see Figure 2a).
Two hydraulic cylinders and a rigid steel beam were used to apply and uniformly distribute the in-plane compression load Ntest on the timber logs, 15 min before the fire test (EN 1365-1, Section 4.3). The full-scale sample and load-distributing rigid beam, in particular, were positioned in the testing furnace so that ≈1/3rd of the top surface of the specimen (i.e., the full upper face of the top main log and a small portion of the top orthogonal members—80 mm on the internal and external side of the wall) could be uniformly compressed. A schematic cross-sectional view of the mechanical loading setup is proposed in Figure 2d. The prefixed vertical load Ntest = 30 kN/m was kept constant during the full fire test, up to the collapse / test conclusion.
Before the test initiation, the base logs (main and orthogonal members) of the W80 specimen were clamped to the setup (EN 1365-1), to reproduce the design restraint configuration in use for log-house buildings. For the top logs, point clamp fixings were imposed to the outriggers’ top members, according to the compressive loading area (see also Figure 2d), so as to brace the main logs ends against possible out-of-plane deformations. For the main top log, finally, vertical displacements were allowed, with horizontal deformations and rotations prevented by the presence of the steel contrast beam, and lateral ‘standard’ joints acting as end clamps (see also [28]).
The experimental results were assessed with the performance criteria provided by EN 1365, EN 1363 and classified using the EN 13501 document [34] for load-carrying, room-enclosing heat-insulating walls exposed to one-side fire exposure.
A set of type K, NiCr-Ni thermocouples (22 in total) according to EN 1363-1, clause 4.5.1.2 and EN 1365-1, was used to measure the surface temperature on a set of key control points for the specimen, including various positions on the wall surface (see Figure 2c) and different depths in the specimen logs, with respect to the fire-exposed side. The final layout for the thermocouples was defined, at the time of the W80 experiment, to optimise the experimental outcomes from the number of available instruments. As is known (see also [35]), however, that timber is a low conductive material and temperature measurements during fire testing can be highly sensitive to instrument type and position. In particular, for the main logs, twelve thermocouples (see T1-to-T12 instruments in Figure 2c) were positioned along the middle vertical axis (T2, T5, T8, T11, Figure 2e) and close to the corner joints of the timber members (T1&T3, T4&T6, T7&T9, T10&T12, see Figure 2f, with thermocouples installed at a distance of 15 mm from each log end notch). To monitor temperature distribution within the thickness of the main specimen components, this set of thermocouples was installed at different distances from the unexposed side of the log-wall, and specifically at a distance of 40 mm (in the case of T2 and T5 instruments), 0 mm (T5, T11) and 15 mm, respectively, from the logs’ external surface (see also Figure 2e,f).
Careful consideration was then given to the lateral outriggers, where 8 additional thermocouples (T13&T17, T14&T18, T15&T19, T16&T20, see the ‘lateral view’ of Figure 2c) were incorporated within the test specimen (15 mm in the thickness of logs and 20 mm from the intercepting main logs). The orthogonal walls in fact provide actual lateral restraints for the in-plane compressed wall, being primarily responsible of its overall stability under standard fire exposure. Finally, special attention was also paid to monitoring the temperature within the insulation panels, where the TE1 and TE2 thermocouples of Figure 2a were installed on the internal side of the specimen, within the gypsum fibreboard layers at a distance of 0.5 H = 1500 mm from the ground. The ambient temperature—in the range of 18.5 °C before and during the experiment—was continuously monitored by additional lateral measurements, carried out at about 1 m of distance from the specimen. Pressure measurement in the furnace was performed in accordance with EN 1363-1 (clauses 4.5.2 and 5.2), by using a differential pressure transducer (PU ± 100 Pa type) installed at 2900 mm from the floor surface of the furnace.
In terms of structural performance assessment of the W80 specimen, potentiometric displacement sensors were finally installed on the main timber logs (five in total, see Figure 2c), to check the evolution of out-of-plane (with three different control points on mid-height L8 log, see U1-to-U3 in Figure 2c) and in-plane vertical displacements (two control points at the base of the W80 assembly, see U4–U5 in Figure 2c). All the experimental measurements (combustion chamber temperature, specimen temperature, pressure in the furnace, specimen deformations, and applied load Ntest) were recorded at a time interval of 5 s.

2.3. Experimental Results

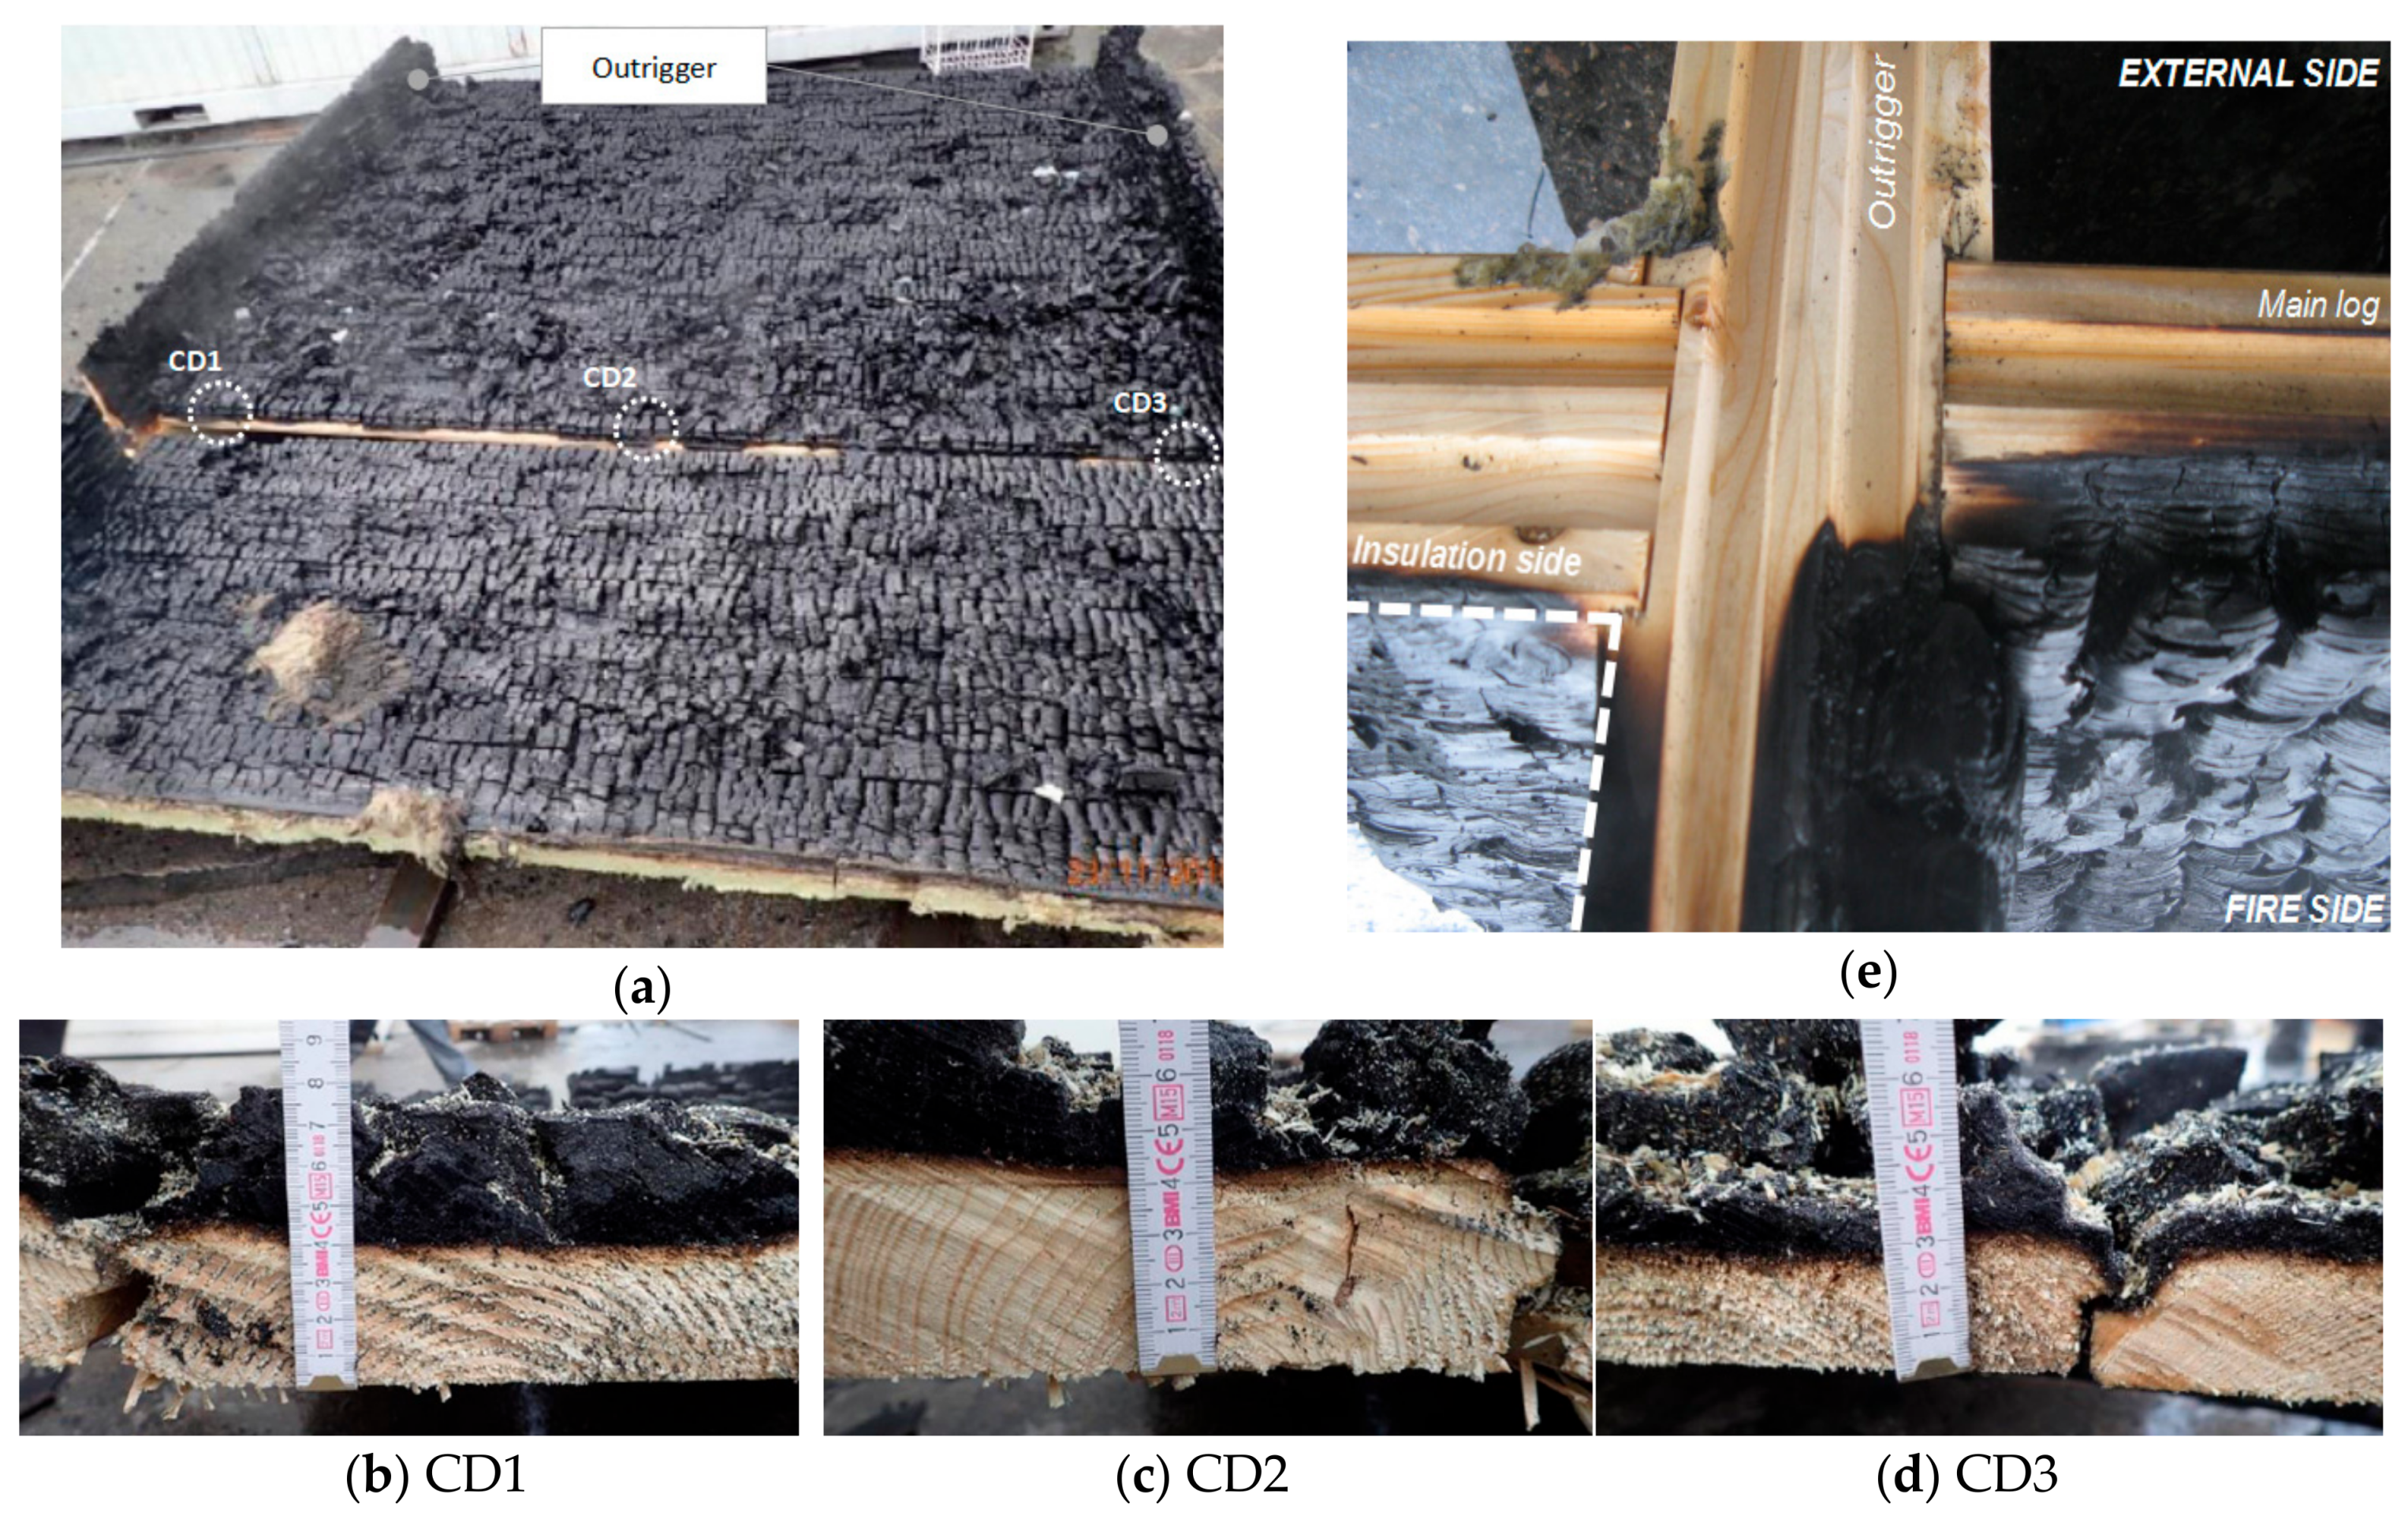
2.3.1. Visual Observations and Qualitative Comments

The fire experiment was stopped after 57 min, due to a marked and abrupt increase in out-of-plane and in-plane deformations of main logs (>80 mm and 30 mm, respectively). The W80 specimen (see Table 2 and Figure 3) globally proved to have a relatively high fire resistance and a qualitatively stable behavior, even though minor phenomena (i.e., smoke propagation from corners, etc.) occurred just after few minutes of EN/ISO 834 standard time-temperature loading. The failure mechanism was global buckling with separation of some main logs, hence confirming—as also in accordance with [28,29]—the high susceptibility of these systems to stability losses, as well as the need of specific regulations for safe design purposes.

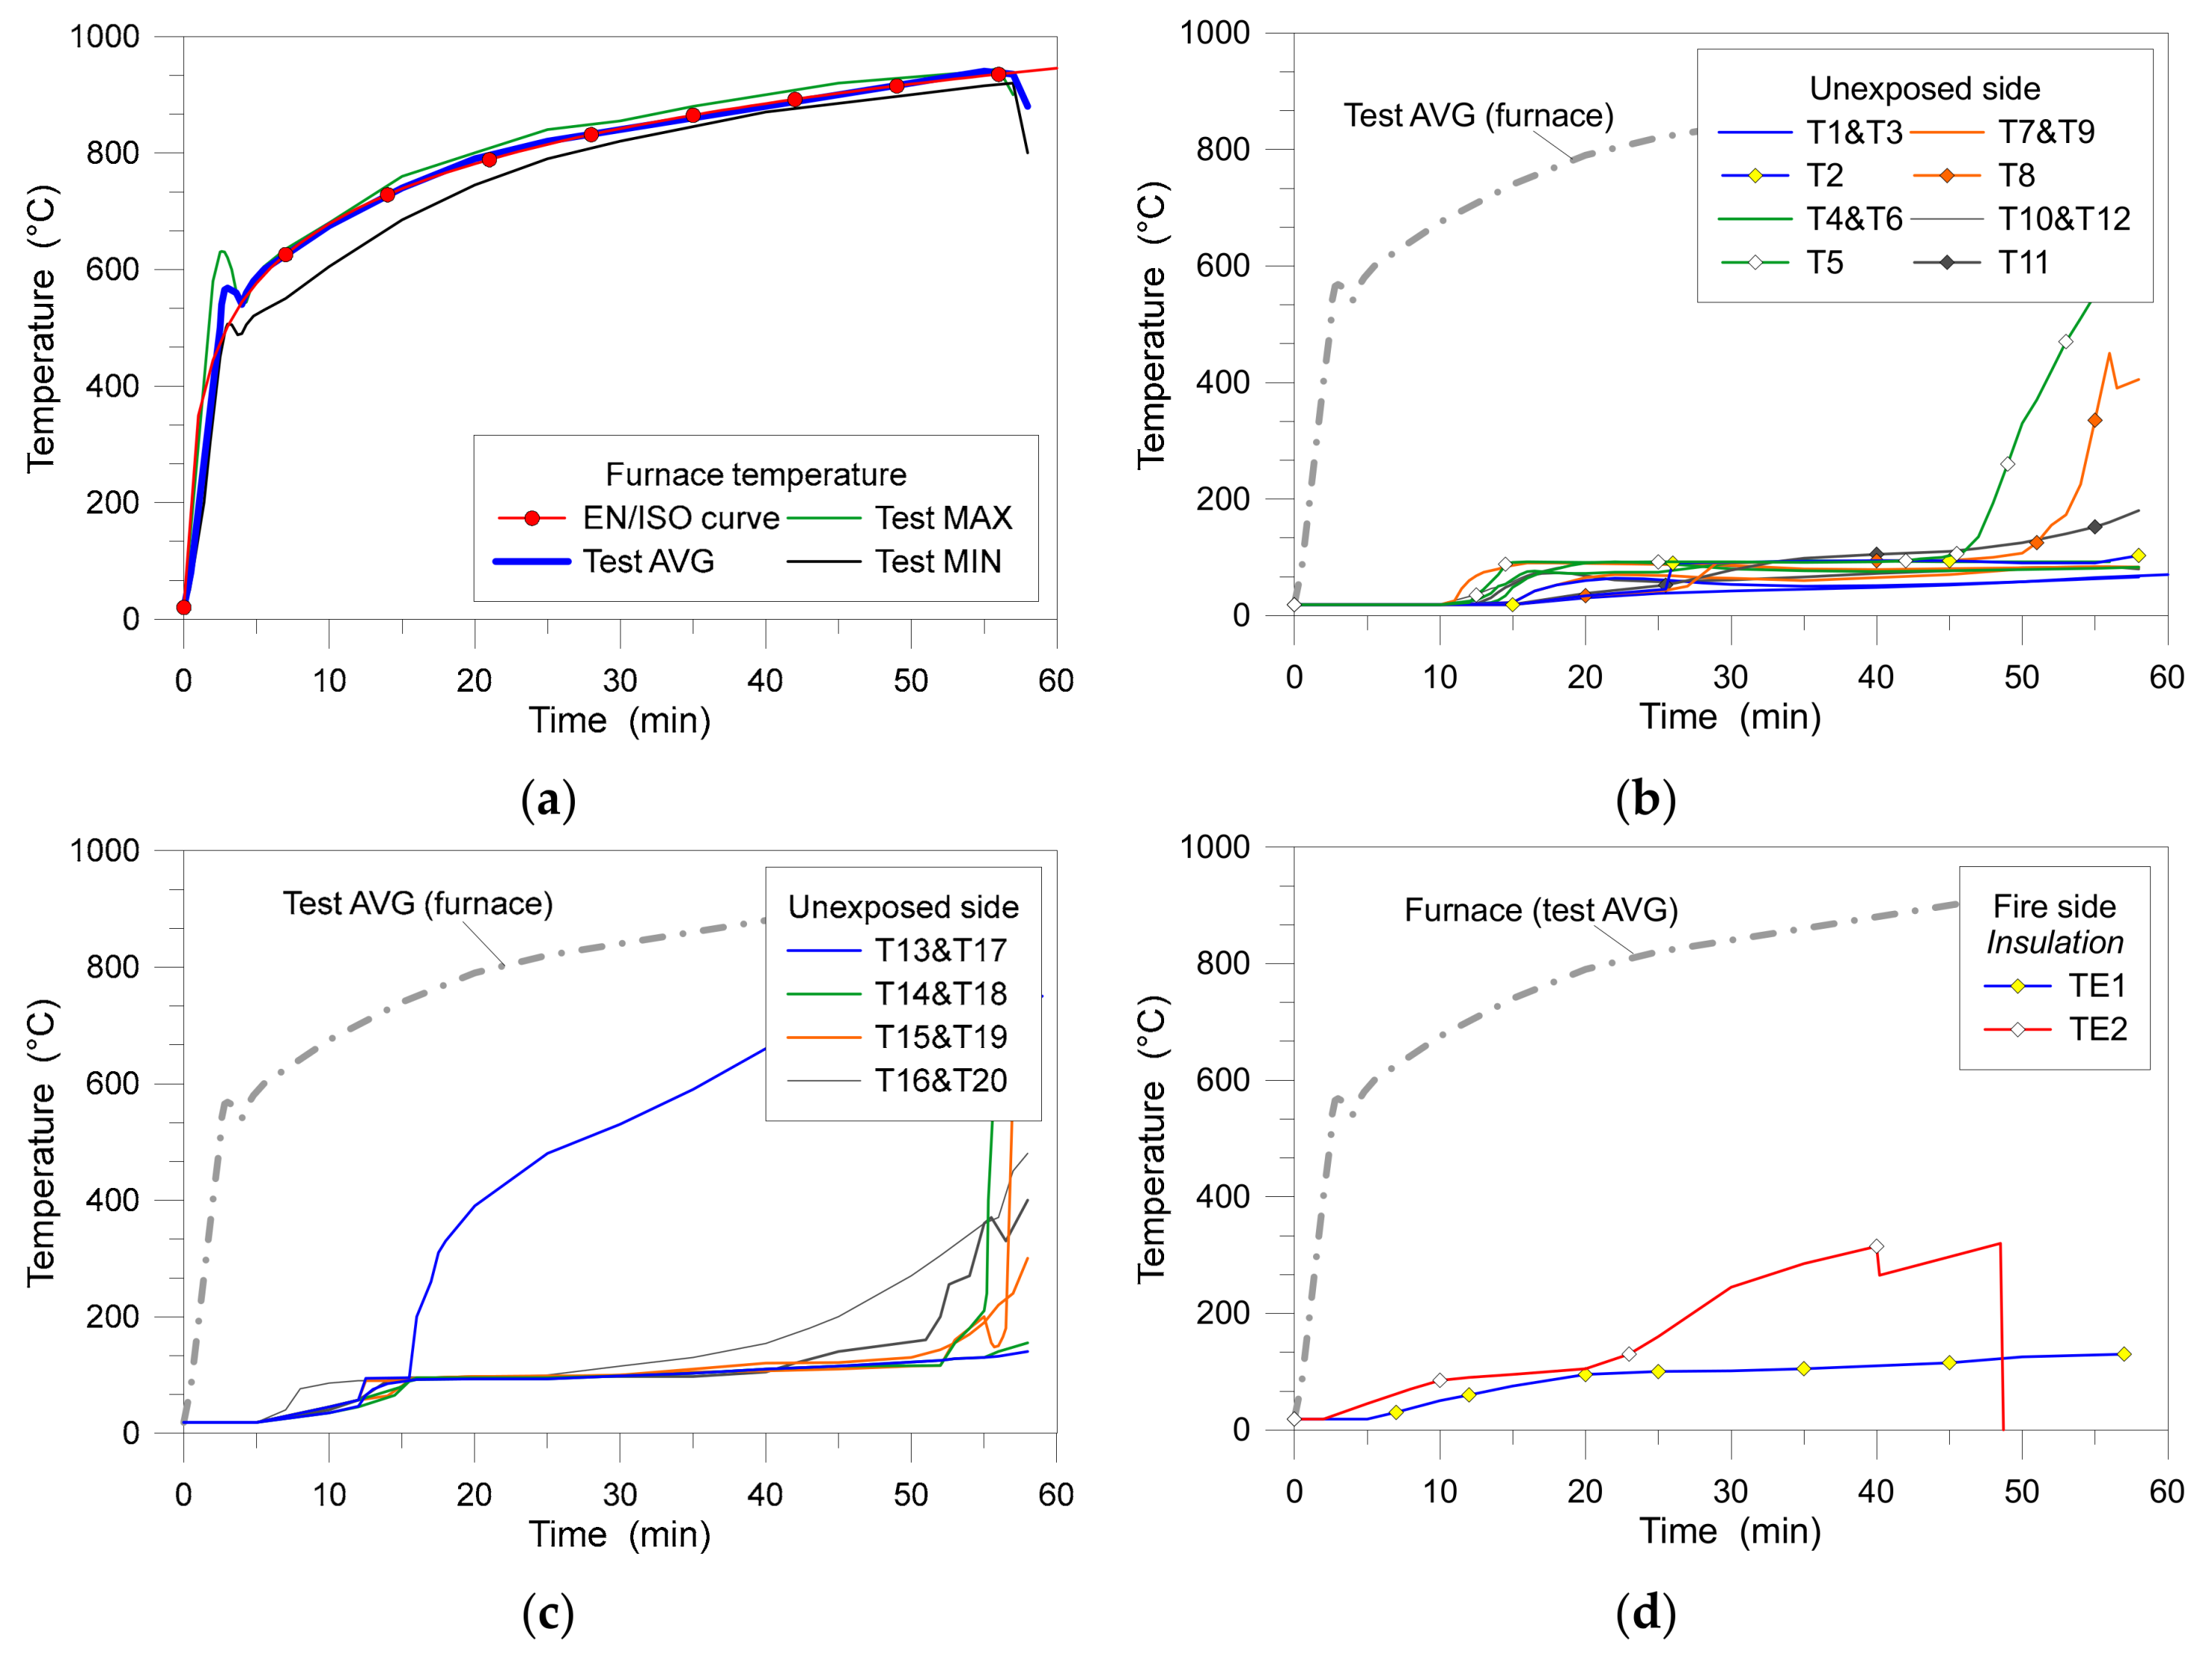
2.3.2. Temperature Measurements

In terms of temperature increase and evolution on both the exposed and unexposed timber wall sides (see Figure 4), test measurements collected during the fire experiment gave evidence of a rather stable insulation capacity, even with limited exceptions. Within the furnace (see Figure 4a), scatters up to 100 °C were recorded in the first 20 min of the experiment. Such a scatter of temperatures within the furnace reduced to 20–30 °C only in the final part of the experiment, hence resulting in a non-uniform temperature distribution for the W80 specimen.
Figure 4b,c display temperature variation on the external side of the wall, as recorded on the main logs and outriggers, respectively, in accordance with the instrumentation labels provided in Figure 2c. The external temperatures are compared with the average thermal measurements within the furnace.
Worth of interest, in both figures, is that the main timber logs can ensure a certain thermal insulation to the specimen (Figure 4b), with a temperature increase in the order of 100 °C after 15–30 min from the onset of the experiment, depending on the position of the reference control point. Based on Figure 2c, given a main timber log, it is also possible to notice a certain scatter among the thermocouple measurements collected on the external face, rather than in internal positions. By comparing the T2 test results (40 mm within the thickness of the wall and 570 mm from the ground—middle section) and the T1&T3 measurements (15 mm from the unexposed external surface and 570 mm from the ground—in the vicinity of the corner joint), for example, the recorded T2 temperature exceeds 95 °C after 35 min and is mostly twice the T1&T3 measurements (45 °C and 50 °C, respectively). Even at the end of the experiment (57 min), T1&T3 temperature values are in the order of 60° and half the T2 data (105 °C). Moving to higher control points (i.e., T5 vs. T4&T6 thermocouples, at a distance of 1.20 m from the ground), even faster increase of temperatures can be noticed in the centre of the specimen (T5 results exceeding 90 °C after 15 min). Higher scatter can be also perceived between the lateral T4&T6 control points (56 °C and 70 °C, respectively, after 15 min), with maximum temperatures in the log exceeding 90 °C (T4&T6) and 690 °C (T5) at the end of the test.
Mostly identical trends and temperature rates can be observed when moving towards the top logs of the specimen (i.e., T8 vs. T7&T9 control points, 1900 mm from ground). Close to the top of the furnace, finally, for the T11 vs. T10&T12 control points (2700 mm from ground), temperatures in agreement with measurements at the bottom of the specimen were found (i.e., T2 vs. T1&T3). The main timber logs were found to be subjected to a faster temperature increase (in the specimen centre as well as close to the lateral corner joints) for ≈2/3rd of the exposed surface (i.e., L5 to L13 logs of Figure 2).
When the lateral regions of the W80 specimen are taken into account, and in particular the outrigger timber components (see Figure 4c), even more sensitivity to temperature variations was experimentally detected, with a pronounced increase of the monitored temperatures in the first 15 min of fire exposure, and a further important and progressive increase after ≈45 min.
Compared to the main timber logs observations discussed above for Figure 2c, mostly uniform temperature records were obtained for each outrigger, when moving from the base of the sample towards its top logs. On the left outrigger, for example, 100 °C were exceeded after ≈20 min of fire exposure for the T14, T15 and T16 control points, being placed at a height of 1330 mm, 1900 mm and 2470 mm, respectively. The progressive increase of temperatures leads to >300 °C after 55 min only, i.e., at the end of the test. The exception is represented by the base control point (T13, at 760 mm from the ground), where 300 °C is exceeded after 18 min only (750 °C at the end of the experiment).
On the right side of the sample, for the other outrigger timber logs (i.e., T17-to-T20 control points), a more stable and uniform evolution of temperature was observed, with 100 °C exceeded after 35 min of loading. At the end of the experiment, 300 °C was achieved for the top logs only (T19 and T20, 1900 mm and 2470 mm, respectively, from the ground), while less than 150 °C was recorded for the bottom-middle logs (T17 and T18 points, at 760 mm and 1330 mm from the ground, respectively).
Such a lack of uniform thermal measurements between the overlapping main and orthogonal logs could be possibly justified by the possible presence of small gaps between the timber members.
In Figure 4d, time-temperature data are finally proposed for the TE1 and TE2 control points on the protected side of the orthogonal logs (1500 mm their height from ground), giving evidence of the actual protective contribution of gypsum fibreboard panels. At the same time, however, it should be noticed that the protective contribution of the insulation layers could have been further increased by the furnace test setup, since the same control points—due to their vicinity to the furnace external walls—could have been affected by a limited fire exposure only, compared to the main timber logs. In any case, for the TE1 thermocouple, being protected by a double-layer insulation panel, maximum temperatures in the order of 100 °C were recorded during the full fire experiment (starting from ≈25 min of exposure), which is in close correlation with the unexposed surface of main logs (i.e., Figure 4b). At the end of the experiment, up to 130 °C were recorded at the TE1 control point.
Regarding the TE2 measurements, the recorded temperatures were noticed to first exceed 100 °C after ≈15 min of fire exposure, due to the presence of a single gypsum layer only. The TE2 temperature values mostly doubled the TE1 measurements in less than 30 min of fire exposure, and then increased to a maximum of 320 °C after ≈40 min; see Figure 4d.
At the end of the experiment, selected portions of main logs were further investigated in terms of the charred surface. In Figure 5, photos of the charred section are shown for three reference cross-sections of main logs, as observed close to the lateral edges (‘CD1’ and ‘CD3’ labels in Figure 5) and at the mid-span section of the wall (‘CD2’). Given the actual 80 mm-wide nominal section of logs, in particular, it can be noticed in Figure 5 that a non-uniform residual section was found along the full specimen, with a variable width for the residual section in the order of ≈30 mm-to-45 mm within the same log (i.e., ≈38 to 56% its nominal resisting section). After 57 min of EN/ISO standard time-temperature loading, a rather close correlation was indeed observed in terms of the charred section for the exposed side of both main logs and lateral logs composing the outriggers, suggesting an average ≈50% reduction in the actual timber members’ section, leading the W80 specimen to large out-of-plane deformations and buckling collapse mechanisms; see Section 2.3.3. The protective gypsum fibreboard layers (see Figure 5e) proved to offer a certain delay for the charring propagation on the lateral side of the short orthogonal logs.

2.3.3. Fire Resistance

Further measurements related to the main log deformations were then examined, to detect and quantify the load-carrying capacity of the W80 specimen.
In accordance with EN 1363-1, such a performance parameter is defined (with the exception of the first 10 min of test) as the simultaneous exceedance of a certain limit deflection and limit deflection rate. It was shown in [29] that careful attention and specific assessment methods should be used for log-house walls, associated with specific structural phenomena that can hardly match the current standards classification, where the main distinction is made between (see also Table 3):
(a)
Structural systems mainly loaded in bending
(b)
Structural systems mainly loaded in-plane
Figure 6 shows the experimentally measured out-of-plane and in-plane histories of displacements of the W80 specimen, including the corresponding deformation rates. Positive displacement values in Figure 6a,b denote outward deflections and shortening of the main timber logs, respectively. The global deformation is mostly associated with lateral deformations of the wall towards the external (unexposed) side of the furnace, due to the reduction of logs nominal sections. According to Figure 6a, a slightly non-symmetrical response of the main log wall to standard fire exposure can be noticed, with maximum lateral displacements in the middle U3 control point for the L8 log. Even though only few measurements are available, such a deformed configuration is in good correlation with past studies [29]. The occurrence of lateral displacements at the lateral edges of the L8 log, furthermore, indicates the progressive effects on the lateral outriggers of the imposed EN/ISO standard time-temperature loading, being primarily responsible for lateral bracing effects of the main logs. Regarding the out-of-plane deformations of the wall and the EN performance parameters, it is finally possible to notice in Figure 6a that—at least for 40 to 45 min of fire exposure—limited deformations in the order of ≈10 mm (i.e., H/300) only were experimentally recorded, hence suggesting a certain global stability of the specimen. An abrupt increase in lateral deformations (i.e., from ≈H/150 to ≈H/30) can be noticed in the range of 53 to 56 min of fire exposure, when the experiment was finally stopped due to incipient buckling mechanisms. Such an observation is confirmed by the out-of-plane deformation rates displayed in Figure 6a, being calculated from the test displacement values. The EN reference limit of 9 mm/min for lateral deformations was largely exceeded around the 55th min of fire exposure. The global lateral overturning and loss of stability of the W80 wall occurred together with high vertical deformations of the main logs; see U4 and U5 curves in Figure 6b. Compared to the EN performance limits for vertical displacements of in-plane compressed walls, the W80 specimen load-carrying capacity should be associated with the first condition exceeded, namely, the maximum in-plane deformations, with the attainment of the reference limit condition of 30 mm shortening after ≈55 min of fire exposure. Deformation rates in the order of 4 mm/min were indeed only recorded close to collapse (see Figure 6b), being approximately equal to half the limit condition of 9 mm/min.
The full-scale experimental observations and measurements still gave evidence—see also [29]—of the actual load-carrying performance of log-house walls and systems in fire conditions, compared to monolithic solid timber panels or other timber structural typologies. In particular, the test results confirmed the importance of bending deformations for timber logs (see Table 3), as well as of the possible modification of the reference performance parameters (both in terms of displacements and deformation rates) for the investigated structural typology.

3. Finite Element Numerical Assessment of Experimental Results

3.1. Modelling Approach

The standard test described in Section 2 was properly reproduced in ABAQUS/Standard, by taking into account the modelling strategy and solving approach reported in [29]. Due to the symmetry of the W80 specimen, only half the nominal geometry was modeled, with appropriate loading and thermo-mechanical boundary conditions, assuming an ideal uniform distribution of geometrical and mechanical properties for timber material, nominal dimensions of logs and insulation panels, as well as an EN/ISO standard time-temperature loading in the furnace.
Full three-dimensional 8-node solid elements were used to describe the full specimen and the gypsum fibreboard insulation panels along the lateral surfaces of the specimen. Two separate FE models were developed in ABAQUS, so as to perform the uncoupled thermo-mechanical analysis of the wall.
In doing so, the notches and protrusions along the top and bottom surfaces of each log were neglected, assuming a nominal 80 mm × 190 mm rectangular cross-section for the timber members (Figure 7). Corner joints were indeed geometrically reproduced by accounting for their nominal features, so as to reproduce the actual contact mechanisms between each log. At this stage of the FE study, possible horizontal gaps due to production tolerances (i.e., at the interface between main and orthogonal logs) were disregarded, assuming the timber members were in contact. Such a modelling assumption can be justified by the loading and boundary condition under investigation for the thermo-mechanical performance of the tested wall. On the other hand, however, it is also known that the same FE assumption could lead to partial underestimation of temperature scenarios on the external side of logs, especially in the region of carpentry joints. Such a choice was considered to have minor effects on the overall performance of the W80 specimen object of analysis. In the vertical direction (see Figure 7), the nominal geometry of logs was finally defined so as to create small vertical gaps (19 mm in thickness) between the main and orthogonal notches at the logs’ ends.

3.2. Thermal Analysis in Fire Conditions

The reference thermal analysis was carried out in the form of a heat transfer step, so as to describe the thermal state of the protected log-house wall subjected to the EN/ISO fire exposure displayed in Figure 4a, from one side.
The thermal effect of insulating panels along the lateral edges of the wall was also accounted for, where the protective layers depicted in Figure 3 were numerically described in the form of 3D solid elements (heat transfer DC3D8 type from ABAQUS library). A structured mesh pattern was then chosen for the 8-node elements, composing both the timber members and the insulating layers. The average size of brick elements was set in the range of 5 mm to 50 mm (depending on their position within the full FE assembly), so as to ensure the accuracy of thermal predictions (especially with respect to local thermal effects) but preserving the computational cost of modelling and simulation phases. The maximum size was limited to 100 mm (outriggers), based on preliminary sensitivity studies. In particular, careful consideration was spent on ensuring a certain stability of temperature gradient predictions, over the depth of the timber logs. Similarly, especially for the outriggers, the mesh consistency at the interface between timber logs and the adjacent gypsum fibreboard panels was taken into account.
Three different regions were separately detected in the lateral surfaces of the full FE model (see the ‘BC1’, ‘BC2’ and ‘BC3’ surfaces of Figure 8a), and properly restrained, depending on the fire exposure of the experimental specimen, on FE symmetry assumptions and on materials. Specific input properties were assigned to the BC1 and BC2 surfaces exposed to the EN/ISO fire curve of Figure 4a, being related to timber and gypsum fibreboard properties, respectively. Ambient temperature and thermal boundaries were defined on the unexposed, external face of timber logs (BC3), with 18.5 °C as the reference input temperature.
Emissivity and convection coefficients for timber were set to 0.8 and 25 W/m2K, as suggested by Eurocode 1 [36]. Such an assumption, generally accepted for the fire resistance assessment of structural engineering systems and assemblies, should implicitly account—together with input thermo-physical features of materials—for complex phenomena occurring during the fire exposure (see [37,38]). Past literature efforts proved that the so-defined heat-transfer simulations can adequately predict the load-carrying behavior of timber members and assemblies exposed to standard fire exposure [39]. However, some dependency of numerical results to input features and/or software assumptions can be also expected [40,41].
The same input features for emissivity and convection of timber were then assigned to the gypsum fibreboard panels, as also recommended by the European technical guideline [36]. The presence of mineral wool panels enabling the propagation of fire on the lateral face of main logs was accounted for by assuming timber members fully protected from fire. Symmetry constraints along the vertical mid-span axis of the main logs were also considered, due to modelling assumptions. In terms of thermo-physical characterisation of timber, conductivity and specific heat at ambient temperature were set equal to 0.12 W/mK and 1.53 kJ/kgK, respectively [36]. Following the Eurocode provisions, a variation of these reference properties p with temperature T was considered in the reference heat transfer simulation, see Figure 8b, where the input curves are provided as the p(T) to p(20 °C) ratio versus temperature T, for each p property. In the case of gypsum fibreboard insulation panels, conductivity and specific heat variations with temperature were derived from [2], see Figure 8c, with 0.40 W/mK and 0.96 kJ/kgK the ambient temperature reference values.

3.3. Mechanical Analysis in Fire Conditions

The thermal analysis of the W80 specimen was followed by an uncoupled, nonlinear mechanical simulation carried out on a FE model able to capture its stress-strain response, as a function of the assigned vertical compression Ntest and time-temperature field.
Compared to Section 3.2, variations in the FE model included the selected element type (C3D8R type, linear brick elements with reduced integration solid elements, instead of DC3D8 heat transfer elements), as well as the definition of mechanical boundaries and the implementation of a set of surface-to-surface contact interactions, see also [29], so as to allow the progressive separation and sliding of timber logs at the interface between the overlapping or adjacent timber members.
At this stage, the mechanical contribution of gypsum fibreboard panels was fully disregarded, as their load-carrying capacity was mostly negligible for the investigated log-house system, compared to their thermal insulation effects.
Given the time-temperature nodal input derived from the thermal analysis, the compressive load Ntest was described in the form of a uniform pressure, according to the test setup of Figure 2d. Self-weight of timber logs—as obtained from material density—was also automatically assigned to the FE model.
Fix nodal restraints were considered at the base logs (main and orthogonal members), to reproduce the actual clamped support of the experimental sample. For the main/orthogonal top logs of the FE assembly, vertical deformations were allowed during the full loading stage, so to account for the in-plane deformations due to thermo-mechanical loading. Possible out-of-plane displacements and rotations were indeed restrained, according to Figure 2d. As also extensively discussed in [28], the conventional boundary condition for the top members of log-house systems can be detected to lie between the ‘fully restrained’ or ‘unrestrained’ configurations, with respect to possible lateral deformations and rotations. These limit conditions can manifest in important variations—even at room temperature—on the observed deformed shape and buckling resistance, hence requiring specific calculation methods.
C24 spruce anisotropy at ambient temperature was accounted for via engineering constants representative of the longitudinal (MOE) and shear moduli along the principal directions of the resisting members. Nominal mean values at room temperature provided in [31] were used, with E0,mean = 11,000 MPa, E90,mean = 370 MPa and G = 500 MPa. The governing material strength was assumed equal to the compressive resistance of spruce in the direction perpendicular to the grain, with fc,90 = 3.57 MPa the mean value. Spruce anisotropy was then accounted, in terms of resistance values, in the form of Hill plastic law (see [26,27]). The material density at 20 °C was finally set to the nominal value of 420 kg/m3. A decrease in the timber properties with temperature was also considered, in accordance with the Eurocode 5 provisions for standard fire exposures [37], whereby the MOE and strength reduce to zero at 300 °C.

4. Discussion of FE Results

4.1. Thermal Simulations

The FE results of heat transfer simulation were first compared with the corresponding test measurements, to further explore the experimental behaviour.
For the fire exposed side of the specimen, a uniform distribution of the input EN/ISO temperatures according to Figure 4a was numerically predicted, given the assumption of ideal fire exposure for all the internal timber surfaces, hence rather close correlation was found with average test measurements within the furnace. As far as the external distribution of temperatures on the unexposed side of the wall is concerned, a certain agreement with recorded test data can be still observed, even with some scatter in the initial phases of fire propagation.
In Figure 9 and Figure 10, comparisons are proposed for main logs and outriggers respectively, showing the actual correlation between experimental and numerical temperature variations under the assigned thermal scenario.
Given the uncertainties in the experimental measurements and variables affecting the test predictions, compared to the idealised modelling assumption for the FE heat transfer analysis of the W80 specimen, a rather good qualitative agreement can be observed in terms of temperature distribution and evolution on the external surface of the main wall, as well as in the thickness of logs, see Figure 9a. The FE model typically resulted in a slight underestimation of the expected temperatures on the unexposed side of the wall. Compared to the experimental measurements, a uniform distribution was in fact numerically predicted on all the timber surfaces—due to uniform boundary conditions—while this is not the case of the temperature-time curves derived from the full-scale test. Due to the limited width of timber logs exposed to fire loading, the FE simulation also gave evidence—as expected—of a marked sensitivity of temperature evolution in time even to small distance variations from the fire-exposed surface, see Figure 9b. This Figure displays the time-temperature curves numerically predicted in the thickness of main logs, as observed for a set of control points at different widths in the resisting cross section. Defined D0 as the surface exposed to fire, the ‘Dn’ labels are used to indicate the distance (in mm) of the control point from D0. Since the reference temperature of 300 °C is considered to detect the charred section of logs, the numerical simulation gave evidence of a progressive reduction of the actual resisting section, with half charred depth after ≈50 min of fire exposure, hence suggesting a further correlation with the experimental load-carrying capacity of the full-scale specimen. At the 60th min of fire exposure, the timber logs are in fact expected to offer less than 50% of residual section, hence giving evidence of large deflection increase and possible buckling phenomena.
Additional comparisons and FE analysis of results were then carried out by taking into account the thermal performance of orthogonal logs. A temperature distribution mostly similar to that of the main logs was observed, even with some variations due to the presence of gypsum fibreboard panels on the internal-lateral sides of short timber members.
In terms of temperature evolution, good agreement can be observed in Figure 10a for the unexposed side of orthogonal logs. Careful consideration, due to the presence of partial insulation, was indeed given on the internal side of the furnace, for the same logs. In Figure 10b, in particular, time-temperature data are compared for the TE1 and TE2 control points within the gypsum fibreboard insulation layers, demonstrating the accuracy of FE estimations, especially for the internal (TE1) thermocouple. As shown, major scatter in the TE2 test results and FE predictions can be noticed after 25-to-30 min of fire exposure, where an increase of recorded temperatures can be perceived for both the experimental sample and the FE model. In the latter case, however, the FE estimations are in the order of 100 °C higher than the corresponding experimental data. Such an effect can be rationally justified in terms of charred section propagation in the adjacent timber logs, with the possible detachment of instruments and gypsum layers in contact with them. This is not the case of the FE model, where a fully rigid interaction is assumed at the gypsum-to-timber interface.
Accordingly, in Figure 10c the charred section evolution is shown for selected orthogonal logs, in the vicinity of corner joints, as observed at the interception between two orthogonal and one main logs (in the figures, only a portion of the latter is drawn). The FE results are shown, for several time instants, both in the form of 3-D view and transversal cross-section, so as to emphasise the temperature evolution and effects in the corner joint components. The residual section is displayed in red colour, giving evidence of the crucial role of outriggers. For the lateral surfaces of timber protected by the gypsum fibreboard panels, it is possible to notice that the charred depth starts increasing after 30 min of fire exposure. Such a thermal loading leads the orthogonal logs to half their resisting section in 40 min, with mostly null residual section (on the internal side of the furnace) after 45-to-50 min of fire exposure. In this sense, the heat transfer simulation proved to offer a certain reliability of results, compared to the full-scale experiment, where the loss of stability derived from charring of outriggers and lack of appropriate lateral restraints for the main logs.

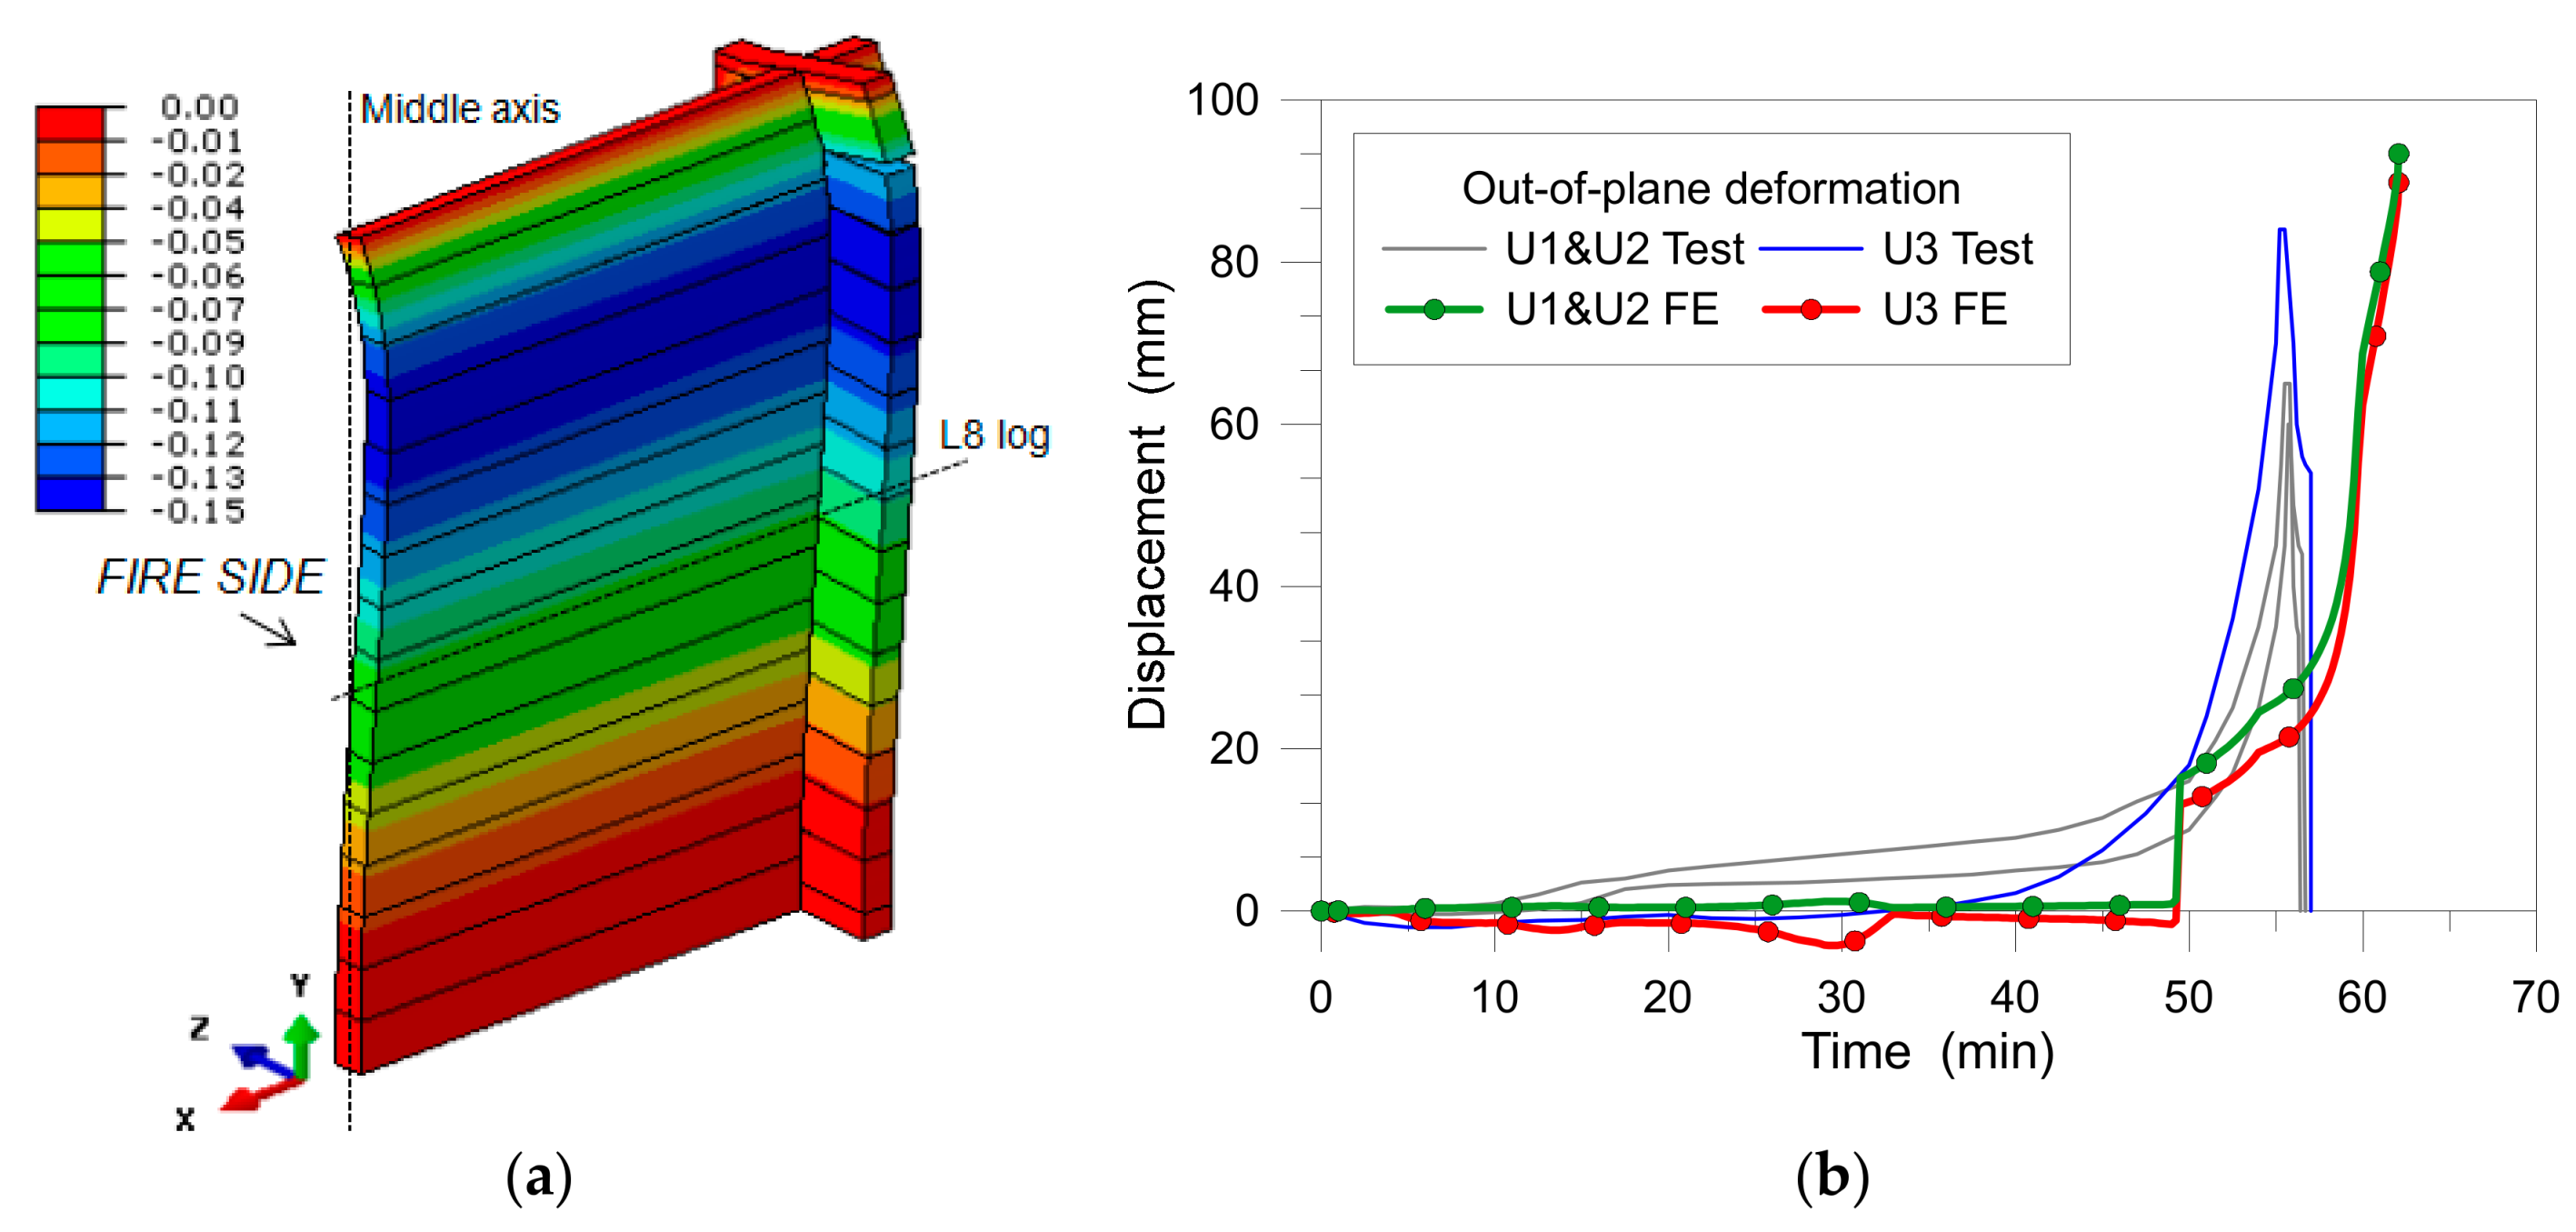
4.2. Mechanical FE Simulations in Fire Conditions

The numerically predicted deformations of the W80 sample, given the thermo-mechanical loading conditions earlier described, generally resulted in a qualitative structural performance and deformation in close correlation with the experimental observations. The main logs proved to undergo large lateral deformations once exceeded a certain charred depth of the logs nominal section, as a major effect due to:
(a)
limited residual stiffness of charred main logs, and
(b)
lack of robust lateral restraints for the same main logs, due to charring of outriggers and vanishing of the bracing system, see Figure 11a.
Worth of interest in Figure 11a is the key role of the surface-to-surface contact interactions, being responsible of partial overturning of logs as bending effects are predominant, compared to the pure in-plane compression load. The same local effects can be responsible—compared to a fully monolithic timber wall—of premature collapse mechanisms that have been previously investigated for log-house systems at ambient and fire conditions respectively [28,29].
Beside the qualitative correlation of experimental and numerical deformations, partial scatter was observed in terms of time-displacement results for the control points of interest, see Figure 11b. Such an outcome could also derive from possible geometrical imperfections of the experimental sample, that—due to detailed measurements—have been disregarded in the forresponding FE assembly (see [28,29]). In any case, the FE simulation gave evidence of some important aspects for the structural system subject of investigation, namely represented by:
(i)
the high sensitivity of log-house walls to buckling phenomena,
(ii)
the predominant role of out-of-plane deformations in the assessment of their actual load-carrying capacity in fire conditions, as well as
(iii)
the lack of an appropriate number of experimental control points, to describe and monitor the global deformations of similar specimens (i.e., mid-height measurements only for out-of-plane deformations).
As shown in Figure 11b, the loss of stability for the FE model was achieved after ≈50 min of fire exposure, namely coinciding—see Figure 10—with a mostly fully charred section for the internal portion of outriggers.

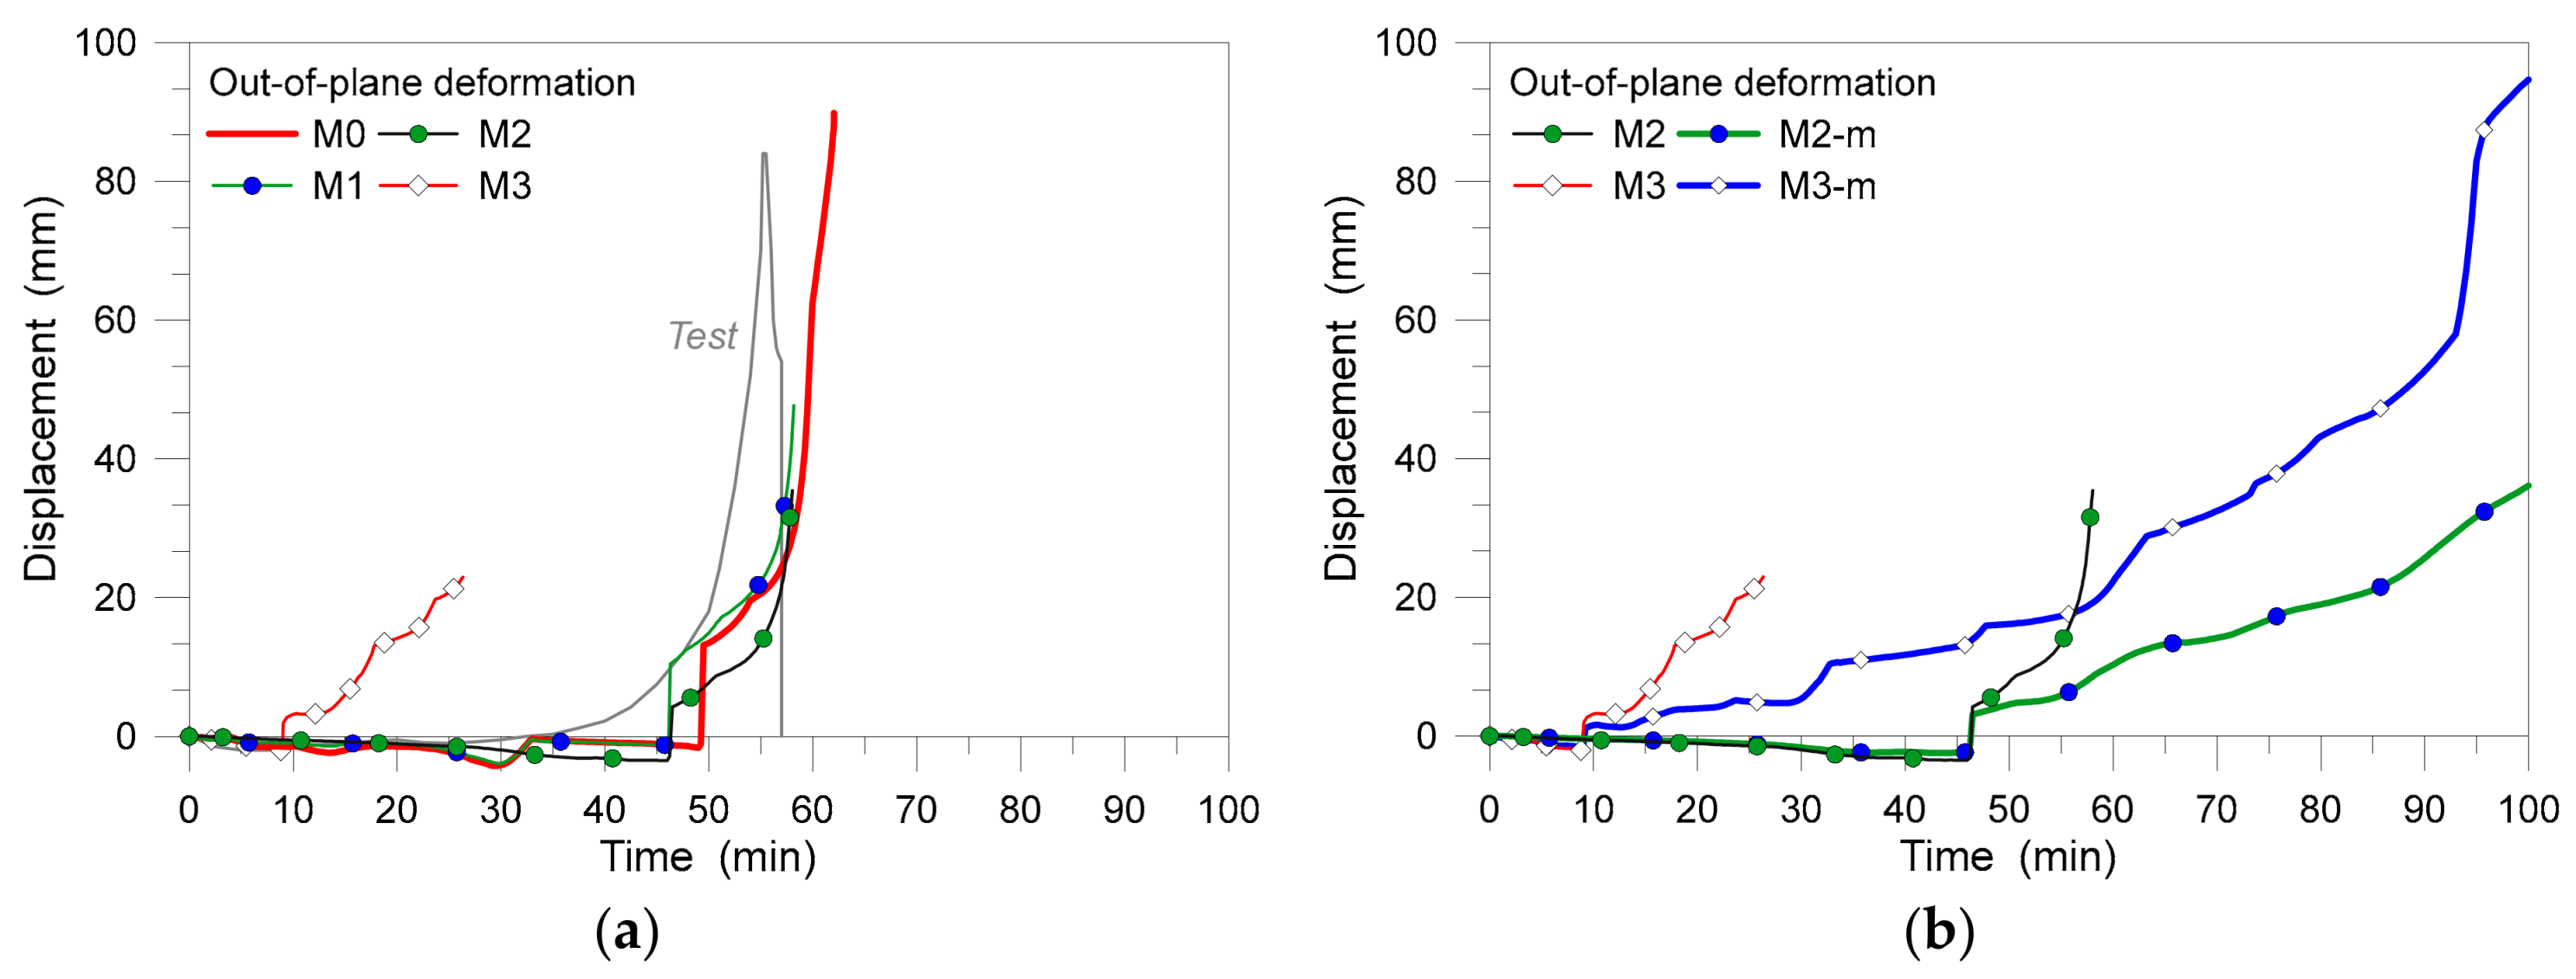
4.3. Parametric Study

Given the rather good correlation between FE and experimental data for the W80 sample, parametric numerical simulations were carried out on the same log-house assembly, to further assess its fire resistance under different thermal boundary conditions. To this aim, three variations in the insulation system layout were considered.
Differing from the reference FE model representative of the nominal test configuration (‘M0’, in the following), additional thermo-mechanical numerical models were taken into account, being characterised by (see also Figure 12):
M1 = full thermal insulation of the lateral outriggers,
M2 = full thermal insulation of the fire-exposed timber surface (outriggers and main logs),
M3 = fully unprotected specimen.
In accordance with Section 3, the uncoupled thermo-mechanical analysis of the selected systems was carried out by exposing the timber surfaces to the EN/ISO 834 curve of Figure 4a, up to 100 min of standard fire exposure. The overall performance of the so detected M0-to-M3 log-house walls were hence compared.
In terms of thermal distribution, marked variations were found at the selected control points, for the M0-to-M3 models. In Figure 13, some of the comparative FE results are proposed, both in terms of charred section (Figure 13a) and time-temperature plots. Special care is spent for the temperature evolution in the outriggers, where the reference labels for the control points (i.e., on the external surfaces and within the thickness of logs) are defined in the schematic drawing of Figure 13a.
As expected, major sensitivity to fire was observed for the fully unprotected M3 model, where a residual resisting cross-section was found (for the internal portion of outriggers) after a few minutes of fire exposure only. Due to the assigned loading and thermal boundary conditions, both the M1 and M2 configurations proved to offer a certain delay in the propagation of high temperatures within the thickness of orthogonal logs. Mostly negligible sensitivity, for the selected configurations, was finally observed for the timber notch composing the corner joints of the examined specimens (see ‘Dnotch’ plots in Figure 13), where maximum temperatures in the order of 200 °C were generally predicted for 60-to-70 min of fire exposure.
Major variations were indeed obtained from the mechanical analysis of the same FE models under standard fire exposure. The so obtained FE results are proposed in Figure 14, where the ‘m’ label denotes a given FE model without possible separation of logs. While the overall deformed shapes for the M0-to-M3 models were found to agree with Figure 12a, marked variations were noticed in the load-carrying performance of the same systems. In Figure 14a, the out-of-plane measurements are shown for the U3 control point of the L8 timber log. As shown, premature out-of-plane bending was predicted for the fully unprotected system (M3), due to propagation of fire in the lateral logs. Limited variations in the L8 deformations were indeed observed for the M0, M1 and M2 systems, even in presence of different insulation configurations. The selected FE models gave evidence of major local deformations in the orthogonal and main logs, i.e., due to lack of mechanical connection between the overlapping logs, hence resulting in mostly coincident failure scenarios. In this regard, as also in accordance with the thermal boundary scenarios schematised in Figure 12, the mechanical parametric studies were also carried out by taking into account—for the same M0-to-M3 thermal insulation configurations—the intrinsic features of log-house systems, compared to fully monolithic, solid timber assemblies (i.e., limit assumption of rigidly connected logs).
The M0-to-M3 systems were numerically investigated by means of FE models still derived from Section 3, but without the set of surface-to-surface contact interactions at the interface between timber logs, being replaced by fully ‘tie’ rigid contacts enabling possible relative rotations and displacements at the logs interfaces. Selected comparisons are proposed in Figure 14b, giving evidence of the fire performance for the ‘limit’ conditions of fully protected (M2) and unprotected (M3) models. There, the label ‘m’ is used to denote the monolithic systems, compared to their corresponding log assembly. As shown, as far as local mechanical effects due to local deformations of logs are disregarded, a more stable behaviour can be offered by the corresponding monolithic timber wall, hence confirming the importance of additional studies and specific investigations for log-house systems.
Such an outcome is further highlighted in Table 4, where the fire performance of the M0-to-M3 models is assessed in terms of failure time. While 100 min of fire exposure is only considered in the FE study, for qualitative comparisons, from Table 4 it is possible to observe that a given log-house system can offer a fire resistance that is mostly half the capacity of a fully monolithic wall, with identical nominal dimensions and thermo-mechanical boundaries. The scatter further increases for the fully unprotected M3 configuration, due to the premature charring of the outriggers and the associated loss of stability for the main timber members. In the same table, the numerically predicted failure times are compared with the reference EN 1361-1 limit conditions mentioned in Section 2. In some cases (i.e., M0 and M1 log-house systems), the numerically predicted loss of stability mostly coincides with the in-plane deformation limits given by the EN standard (i.e., M0 and M1 log-house systems). Interestingly as long as local mechanisms are predominant (i.e., M2 and M3 log-house systems), the EN limit conditions are not achieved by numerical simulations, even in presence of large out-of-plane deformations (up to ≈L/30, compared to the ≈L/13 reference EN value), hence suggesting the need for specific fire resistance criteria for log-house timber systems.

5. Conclusions

In this paper, the in-plane compressive performance of timber log-house walls in fire conditions was investigated via full-scale standard testing and Finite Element numerical modelling. In doing so, a partially insulated log-house specimen was taken into account.
As an extension of a past research project focused on unprotected timber walls only, careful consideration was given in this paper to the assessment of temperature effects in the region of carpentry joints, as well as to the effect of (even partial) thermal insulation systems. The examined full-scale sample proved to offer a rather stable performance and fire resistance for about 60 min, under the assigned thermal and mechanical loads. The experimental study herein summarised, however, pointed out that:
  • The actual EN 1361-1 standard provisions for the assessment of the load-carrying capacity of timber structures in fire conditions do not properly account for the typical behaviour of log-house walls Specific deflection and deformation rate limit values should be provided to assess their fire performance, especially in terms of out-of-plane phenomena.
  • A key role is generally played by the corner joint components, where appropriate instrumentation should be used to account for thermal local phenomena, and related mechanical effects. Thermocouples should be placed within the thickness of logs (at least one in the mid thickness), close to the corner joints, and also at different heights of the sample.
  • When thermal insulation layers are used, additional thermocouples should be placed also in their thickness (at least one), and at the interface with the timber assembly (possibly, at different heights of the wall).
  • Careful consideration should be finally given to the accurate experimental analysis of the sample deformations, where critical displacements could be achieved at the mid-height as well as on the top logs. The recommendation is to monitor the out-of-plane deformations of a given log-house wall at 1/3rd height, mid-height, and top.
Extending a previous research study, a Finite Element numerical study was also presented for the investigated full-scale specimen. An interesting correlation between test and FE results was generally observed, hence suggesting the reliability and potential of FE methods for predicting the fire resistance of timber log-house systems. In this regard, the FE results further highlighted the key role of orthogonal logs, since providing—when exposed to fire—only a partial lateral bracing for the main logs.
To this aim, a short FE parametric study was also presented, by taking into account the effects of several configurations for the thermal insulation layers on the timber surfaces exposed to the assigned standard EN/ISO time-temperature curve. As shown, even minor variation in the thermal boundaries of the examined systems (i.e., thickness and position of gypsum fibreboard panels) can result in marked modifications of both the thermal and mechanical response in fire conditions, for a given log-house assembly. As far as the timber logs are in fact progressively subjected to charring, the actual mechanical restraints for the logs will also change, hence leading to the premature occurrence of possible local mechanisms (i.e., overturning and separation of logs, etc.). The same FE parametric study, in this regard, further emphasised the actual criticalities of log-house systems, with respect to fully monolithic assemblies. In accordance with earlier research efforts, the crucial role of outriggers was still pointed out, hence suggesting the need for additional specific studies on the subject.

Author Contributions

The research paper resuslts from a joint collaboration between the involved authors. C.B. carried out the FE numerical investigations and take care of the post-processing of experimental and numerical results. M.F. supervised the full project.

Funding

This research paper received no external funding. The APC was supported by MDPI (discount vouchers for the first author, acting as a reviewer for MDPI journals).

Acknowledgments

The research project was carried out within a scientific collaboration between the authors and Rubner Haus AG Spa (www.haus.rubner.com). In this respect, Mr. Daniel Gasser, Mr Theodor Guggenberger and Ms. Annalisa Battisti are gratefully acknowledged for providing technical data related to fire experiments, as well as support for the interpretation of test results. The EU-COST Action FP1404 “Fire Safe Use of Bio-Based Building Products” (www.costfp1404.com, 2014–2018) is also acknowledged for facilitating and providing financial support to scientific networking opportunities.

Conflicts of Interest

The authors declare no conflict of interest.

References

  1. EN 1363-1. Fire Resistance Tests—Part 1: General Requirements; European Committee for Standardization (CEN): Brussels, Belgium, 2012. [Google Scholar]
  2. Östman, B.; Esko, M.; René, S.; Andrea, F. Fire Safety in Timber Buildings—Technical Guideline for Europe; SP Report 19; RISE—Research Institutes of Sweden: Göteborg, Sweden, 2010. [Google Scholar]
  3. Suzuki, J.; Mizukami, T.; Naruse, T.; Araki, Y. Fire resistance of timber panel structures under standard fire exposure. Fire Technol. 2016, 52, 1015–1034. [Google Scholar] [CrossRef]
  4. Mindeguia, J.C.; Cueff, G.; Dréan, G.; Auguin, G. Simulation of charring depth of timber structures when exposed to non-standard fire iso-curves. J. Struct. Fire Eng. 2018, 9, 63–76. [Google Scholar] [CrossRef]
  5. Schmid, J.; Santomaso, A.; Brandon, D.; Wickstrom, U.; Frangi, A. Timber under real fire conditions—The influence of oxygen content and gas velocity on the charring behavior. J. Struct. Fire Eng. 2017. [Google Scholar] [CrossRef]
  6. Schnabl, S.; Turk, G.; Planinc, I. Buckling of timber columns exposed to fire. Fire Saf. J. 2011, 46, 431–439. [Google Scholar] [CrossRef]
  7. Lineham, S.A.; Thomson, D.; Bartlett, A.I.; Bisby, L.A.; Hadden, R.M. Structural response of fire-exposed cross-laminated timber beams under sustained loads. Fire Saf. J. 2016, 85, 23–34. [Google Scholar] [CrossRef]
  8. Schmid, J.; Klippel, M.; Just, A.; Frangi, A. Review and analysis of fire resistance tests of timber members in bending, tension and compression with respect to the Reduced Cross-Section Method. Fire Saf. J. 2014, 68, 81–99. [Google Scholar] [CrossRef]
  9. Franzoni, L.; Dhima, D.; Lyon, F.; Laebée, A.; Foret, G. A Stiffness-based Approach to Analyze the Fire Behaviour of Cross-Laminated Timber Floors. Struct. Eng. Int. 2017, 27, 238–245. [Google Scholar] [CrossRef]
  10. Ekr, J.; Caldova, E.; Vymlatil, P.; Frantisek, W.; Kuklikova, A. Timber steel-fibre-reinforced concrete floor slabs subjected to fire. Eur. J. Wood Wood Prod. 2018, 76, 201–212. [Google Scholar] [CrossRef]
  11. Frangi, A.; Knobloch, M.; Fontana, M. Fire design of timber-concrete composite slabs with screwed connections. J. Struct. Eng. 2010, 136. [Google Scholar] [CrossRef]
  12. Yue, K.; Chen, Z.; Lu, W.; Liu, W.; Li, M.; Shao, Y.; Tang, L.; Wan, L. Evaluating the mechanical and fire-resistance properties of modified fast-growing Chinese fir timber with boric-phenol-formaldehyde resin. Constr. Build. Mater. 2017, 154, 956–962. [Google Scholar] [CrossRef]
  13. Tiso, M.; Just, A. Design criteria for insulation materials applied in timber frame assemblies. J. Struct. Fire Eng. 2017. [Google Scholar] [CrossRef]
  14. Pásztory, Z.; Mohácsiné, I.R.; Börcsök, Z. Investigation of thermal insulation panels made of black locust tree bark. Constr. Build. Mater. 2017, 147, 733–735. [Google Scholar] [CrossRef]
  15. Zhang, J.; Xu, Q.; Xu, Y.; Wang, B.; Shang, J. A numerical study on the fire endurance of wood beams exposed to three-side fire. Appl. Phys. Eng. 2012, 13, 491–505. [Google Scholar] [CrossRef]
  16. Thi, V.D.; Khelifa, M.; Oudjene, M.; El Ganaoui, M.; Rogaume, Y. Finite element analysis of heat transfer through timber elements exposed to fire. Eng. Struct. 2017, 143, 11–21. [Google Scholar] [CrossRef]
  17. Du, H.; Hu, X.; Zhang, B.; Minli, Y. Numerical simulation on behaviour of timber-concrete composite beams in fire. IOP Conf. Ser. Earth Environ. Sci. 2017, 81, 012148. [Google Scholar] [CrossRef] [Green Version]
  18. Zhang, J.; Wang, Y.; Li, L.; Xu, Q. Thermo-mechanical behaviour of dovetail timber joints under fire exposure. Fire Saf. J. 2017. [Google Scholar] [CrossRef]
  19. Menis, A.; Fragiacomo, M.; Clemente, I. Numerical Investigation of the Fire Resistance of Protected Cross-Laminated Timber Floor Panels. Struct. Eng. Int. 2012, 22, 523–532. [Google Scholar] [CrossRef]
  20. EN 1995-1-1. Eurocode 5—Design of Timber Structures—Part 1-1: General Rules, Seismic Actions and Rules for Buildings; European Committee for Standardization (CEN): Brussels, Belgium, 2004. [Google Scholar]
  21. EN 1998-1. Eurocode 8—Design of Structures for Earthquake Resistance—Part 1: General Rules, Seismic Actions and Rules for Buildings; CEN (European Committee for Standardization): Brussels, Belgium, 2004. [Google Scholar]
  22. EN 1995-1-2. Eurocode 5—Design of Timber Structures—Part 1-2: General—Structural Fire Design; CEN (European Committee for Standardization): Brussels, Belgium, 2004. [Google Scholar]
  23. Branco, J.; Araújo, J.P. Structural behaviour of log timber walls under lateral in plane loads. Eng. Struct. 2012, 40, 371–382. [Google Scholar] [CrossRef] [Green Version]
  24. Bedon, C.; Fragiacomo, M.; Amadio, C.; Sadoch, C. Experimental study and numerical investigation of Blockhaus shear walls subjected to in-plane seismic loads. J. Struct. Eng. 2015, 141. [Google Scholar] [CrossRef]
  25. Piazza, M. Seismic Performance of Multi-Storey Timber Buildings—Rusticasa Building—Final Report, SERIES 227887 Timber Buildings Project. Available online: http://www.series.upatras.gr/dev (accessed on 20 September 2018).
  26. Bedon, C.; Fragiacomo, M. Numerical investigation of timber log-haus walls with steel dovetail reinforcements under in-plane seismic loads. Adv. Civ. Eng. 2018, 2018, 6929856. [Google Scholar] [CrossRef]
  27. Sciomenta, M.; Bedon, C.; Fragiacomo, M.; Luongo, A. Shear performance assessment of timber log-house walls under in-plane lateral loads via numerical and analytical modelling. Buildings 2018, 8, 99. [Google Scholar] [CrossRef]
  28. Bedon, C.; Fragiacomo, M. Derivation of buckling design curves via FE modelling for in-pane compressed timber log-walls in accordance with the Eurocode 5. Eur. J. Wood Wood Prod. 2016. [Google Scholar] [CrossRef] [Green Version]
  29. Bedon, C.; Fragiacomo, M. Experimental and numerical analysis of in-plane compressed unprotected log-haus timber walls in fire conditions. Fire Saf. J. 2018. [Google Scholar] [CrossRef]
  30. Simulia. ABAQUS v.6.14 Computer Software; Dassault Systèmes: Providence, RI, USA, 2018. [Google Scholar]
  31. EN 338. Structural Timber-Strength Classes; European Committee for Standardization (CEN): Brussels, Belgium, 2009. [Google Scholar]
  32. EN 1365-1. Fire Resistance Tests for Load Bearing Elements—Walls—Part 1: General Requirements; CEN (European Committee for Standardization): Brussels, Belgium, 2012. [Google Scholar]
  33. Fermacell® Gypsum Fibreboard, Technical Data Sheet. Available online: https://www.fermacell.com/fermacell_gypsum_fibreboard_1236.php (accessed on 20 September 2018).
  34. EN 13501. Fire Classification of Construction Products and Building Elements—Classification Using Test Data from Reaction to Fire Tests; CEN (European Committee for Standardization): Brussels, Belgium, 2007. [Google Scholar]
  35. Fahrni, R.; Schmid, J.; Klippel, M.; Frangi, A. Investigation of different designs and installations of temperature measurements in wood as low conductive materials. In Proceedings of the 10th International Conference on Structures in Fire (SIF’18), Belfast, UK, 6–8 June 2018. [Google Scholar]
  36. EN 1991-1. Eurocode 1—Actions on Structures—Part 1-5: General Actions—Thermal Actions; European Committee for Standardization (CEN): Brussels, Belgium, 2004. [Google Scholar]
  37. Palma, P. Fire behaviour of timber connections. Ph.D. Thesis No. 24032, ETH Zurich, Zurich, Switzerland, 2016. [Google Scholar] [CrossRef]
  38. König, J. Structural fire design according to Eurocode 5—Design rules and their background. Fire Mater. 2005, 29, 147–163. [Google Scholar] [CrossRef]
  39. König, J.; Walleij, L. One-Dimensional Charring of Timber Exposed to Standard and Parametric Fires in Initially Unprotected and Postprotection Situations; Technical Report (No. 9908029); RISE—Research Institutes of Sweden: Göteborg, Sweden, 1999; ISSN ISSN 1102-1071. [Google Scholar]
  40. Laplanche, K.; Dhima, D.; Racher, P. Predicting the behaviour of dowelled connections in fire: Fire test results and heat transfer modelling. In Proceedings of the 8th World Conference on Timber Engineering—WCTE2004, Lahti, Finland, 14–17 June 2004. [Google Scholar]
  41. Werther, N.; O’Neill, J.W.; Spellman, P.M.; Abu, A.K.; Moss, P.J.; Buchanan, A.H.; Winter, S. Parametric study of modelling structural timber in fire with different software packages. In Proceedings of the 7th International Conference on Structures in Fire, Zurich, Switzerland, 6–8 June 2012. [Google Scholar]
Figure 1. W80 log-house timber wall with ‘standard’ carpentry joints: (a) nominal geometrical properties and (b,c) specimen photos, during the assembly stage ((b) corner detail, (c) view of the full specimen, from the top).
Buildings 08 00131 g001
Figure 2. W80 fire test: (a) thermal insulation of outriggers (top view, cross-sectional detail at an height of 0.5 H = 1500 mm from the ground); (b) plate thermometers within the furnace; (c) mechanical loading and instrumentation layout (in brackets, the labels for the symmetrical instruments); with (d) schematic cross-section of the compressed region; (e,f) Top view photos of the positioning detailing of selected thermocouples.
Buildings 08 00131 g002
Figure 3. Fire test observations for the W80 specimen, after (a) 2 min (internal side); (b) 35 min (external side) and (c) 50 min (external) of EN/ISO standard time-temperature loading.
Buildings 08 00131 g003
Figure 4. Experimental distribution of temperatures, as recorded during the fire test (a) within the furnace and (b,c) on the unexposed side of the W80 specimen ((b) = main logs, (c) = outriggers), with (d) temperature evolution within the gypsum fibreboard insulation layers.
Buildings 08 00131 g004
Figure 5. Photo of the W80 specimen at the end of the fire test. (a) Charred internal surface, with (bd) cross-sectional details in the main logs and (e) top view detail of the left outrigger (in evidence, the different charred thickness on the insulated or unprotected surfaces).
Buildings 08 00131 g005
Figure 6. Experimental history of (a) out-of-plane and (b) in-plane deformations/deformation rates for the W80 specimen, with evidence of the reference performance limits (EN 1363-1).
Buildings 08 00131 g006
Figure 7. FE modelling and schematisation of timber logs (ABAQUS), corner joint assembly detail (3D view).
Buildings 08 00131 g007
Figure 8. (a) Boundary conditions for the thermo-mechanical analysis of the W80 specimen, with (b,c) timber and gypsum fibreboard variation of thermo-physical properties, as a function of temperature.
Buildings 08 00131 g008
Figure 9. FE heat transfer results (ABAQUS). Numerical evolution of temperatures in the main timber logs (middle section), as observed (a) by comparison with test results (with grey plots representing the ecperimental temperature variation in time, on the unexposed side of the main timber logs) or (b) in the thickness of the wall.
Buildings 08 00131 g009
Figure 10. FE heat transfer results (ABAQUS). (a) Experimental and numerical evolution of temperature in the region of carpentry joints, with (b) temperature variation within the gypsum fibreboard layers and (c) residual section evolution in selected logs (charred section in gray), after t = 15-to-60 min of fire exposure.
Buildings 08 00131 g010
Figure 11. FE mechanical results (ABAQUS). (a) Deformed shape after 50 min of EN/ISO standard time-temperature exposure (out-of-plane deformations in meters—mesh pattern hidden from the 3D view); with (b) experimental-numerical evolution of out-of-plane displacements, as a function of time, as obtained from the U1, U2 and U3 control points.
Buildings 08 00131 g011
Figure 12. Reference thermal boundary conditions for the M1-to-M3 parametric numerical models, by changing the layout of the insulation layers (top view detail of the corner joint region).
Buildings 08 00131 g012
Figure 13. FE heat transfer results (ABAQUS). (a) Residual section evolution in selected logs, after t = 15-to-60 min of EN/ISO standard time-temperature loading, as obtained for the M3 model; (be) time-temperature comparative plots for selected control points (M0-to-M3 models).
Buildings 08 00131 g013
Figure 14. FE mechanical results (ABAQUS). (a) Out-of-plane displacements for the mid-height L8 log (U3 control point), as a function of time, for different thermal boundary configurations; (b) time-displacement comparisons for log-house and fully monolithic (‘m’) assemblies, under identical thermo-mechanical boundaries.
Buildings 08 00131 g014
Table 1. Reference geometrical and mechanical features for the partially insulated W80 specimen, as compared with the unprotected W90 sample reported in [29].
Geometry
TestLogOutriggersMain WallIn-Plane Compression
LortoDHLL0N20NtestRN
(mm)(m)(m)(m)(m)(m)(kN/m)(kN/m)-
W8080 × 190 (h/b = 2.38)0.5 (0.21 symm)0.14332.64258300.11
W9090 × 160 (h/b = 1.78)0.59 (unsym; 0.1 ext; 0.4 int)0.102.9632.71349450.13
Table 2. Experimental visual observations for the W80 full-scale test.
Time (min)Observed PhenomenaSpecimen Side
−15Application of the in-plane compressive load (30 kN/m)-
0Fire test started-
2Blackening of timber surface (see Figure 2a)I
7Uniform charring of the timber surfaceI
8Persistent crackling pops perceivedE
10Smoke propagating from corner jointsE
14Crackling pops endedE
28Soot precipitation in the vicinity of corner jointsE
32Limited visibility within the furnace, minor propagation of smoke and blackening in the region of joints (see Figure 3b)I/E
40Isolated crackling popE
41Moisture propagates from notches and protrusions of main logsE
44Isolated gas leaks close to joints of main logs, in the upper third of the wall (Figure 3c)E
55Abrupt increase in out-of-plane deformation of the main wall due to buckling-
57Fire test stopped, due to large out-of-plane deformations-
Key: I = internal (fire exposed) side; E = external (unexposed) side.
Table 3. Reference performance parameters for the W80 specimen, in accordance with EN 1363-1 provisions (in brackets, the time of maximum measurements from the test onset).
Out-of-Plane/BendingIn-Plane
Displacement (mm)Displacement Rate (mm/min)Displacement (mm)Displacement Rate (mm/min)
ENTESTENTESTENTESTENTEST
20584910.6303094.5
(57 min) (52 min) (56 min) (57 min)
Exceeded: NOExceeded: YESExceeded: YESExceeded: NO
Table 4. Numerical estimation of the fire resistance of the W80 assembly, for different thermal insulation configurations and mechanical interaction between the timber members.
Failure Time (min)
FE ModelNumerical Analysis *EN 1361-1 Regulations (mm)
Log-HouseFully Monolithic Log-HouseFully Monolithic
M057.3>100V & VR56.5V86.2
M157.8>100V & VR56.8V88.7
M258.3>100n.a.n.a.n.a.n.a.
M321.0>100n.a.n.a.OR94.7
* 100 min of standard EN/ISO fire exposure (RN = 0.11). Key = EN 1361-1 failure limit conditions due to first exceedance of V = in-plane deformations; O = out-of-plane deformations; VR/OR = deformation rates; n.a. = not achieved. Failure time = numerical loss of stability.

