1. Introduction
Mobile technology involving the use of hand-held devices such as smartphones and tablets has changed everyday lives and also pervaded into our professional lives. Previous studies [
1,
2,
3] suggest that information and communication technology (ICT) could improve productivity. Professional work environments comprise of social, communal, technological, computational, managerial and governmental sides among others, since different levels of information related tasks are involved. Moreover, the construction professionals (CPs) workspaces are not confined to specific office locations. With CPs being on-the-move, mobile computing can offer them a quick, simple and easy-to-carry platform to help communicate relevant on-site information to other stakeholders situated in different locations. Moreover, mobile devices (e.g., smartphone, tablet) not only provide communication and computing functions but also provide image and video capturing capabilities which could be put to use for record keeping and documentation purposes. Construction industry related apps currently available in the market offer many functionalities ranging from simple calculations to detailed architectural renderings [
4]. It is estimated that there may be nearly 13,000 construction related development and design apps presently in the market [
5]. Yet the attitude of uptake of such apps by construction industry in New Zealand is unknown. The aim of this study is to examine the types of phone, application areas and perceived benefits of the uptake apps in the New Zealand construction sector. The construction industry operates in a traditional brick and mortar space involving hardware fittings, heavy machinery, work-bench tools and physical implements. The use of mobile technology in construction professionals’ work environments is unknown. An exploratory study has thus been conducted to investigate this problem. The next sections discuss relevant literature, including an overview of the New Zealand construction sector and existing mobile technologies. Subsequently discussions are focused on the research method adopted. The findings of the study are discussed in relation to the research objectives.
2. Literature Review
The construction sector is a key driver of economic growth in New Zealand with annual revenues of
$30 billion plus. Currently it is one of the largest sectors in the New Zealand economy employing 194,000 people; that is, one in 12 jobs are probably in construction [
6]. Unfortunately productivity within construction industry is low compared to other economic sectors such as agriculture, forestry manufacturing and service industry [
7]. Productivity performance trend of the construction industry has been flat-lining since 2004; it has dragged down New Zealand’s aggregate productivity growth performance [
8]. As a result, the New Zealand government has identified productivity growth as a priority [
6]. The term “productivity” expresses the association between outputs and inputs [
9]. Productivity is a measurement of outputs relative to inputs of resources. Generally, productivity refers to the efficiency with which people or firms convert productive resources such as labour and capital into outputs of goods and services [
8]. There are three measures of productivity from an economy aspect: Labour productivity, Capital productivity and Multi-factor productivity [
7].
If we produce more or better goods from the same resources, we increase productivity. Or if we produce the same goods from lesser resources, we also increase productivity. By “resources”, we mean all human and physical resources, i.e., the people who produce the goods or provide the services, and the assets with which professionals can produce the goods or provide the services [
10]. So improvements in productivity could be interpreted as allowing a given quantity of output to be produced using fewer resources or more and better output to be produced from the same resource base [
8]. In other words, high productivity is the intensive and/or efficient use of scarce resources converting input into output, which leads to more profit [
11].
The mobile operating system determines the functions and features available on smartphone. It governs the user interface and provides access to the applications and files stored on the device. For the purpose of this research, a smartphone type is defined by the mobile operating system running on the smartphone. According to the IDC smartphone OS market share research, Android captured 85% of worldwide smartphone market while iOS occupied 14.7% worldwide smartphone market in the first quarter of 2017 [
12].
Android phone: running Google’s Android mobile operating system (Android)
iPhone: running Apple’s iPhone operating system (iOS)
Windows phone: running Microsoft’s Windows mobile operating system (Windows)
BlackBerry: running BlackBerry operating system developed by Research In Motion
Smartphone can provide more opportunities for faster data collection and exchange, and improve workflow efficiency [
13]. Smartphones can increase productivity by reducing the time spent on many related support functions [
2]. The available smartphone apps in construction sector range from project management, calculators, safety, integrated construction cost and accounting, construction site operations, computer aided design, 2D and 3D designs and drawings, estimating, and building information modelling (BIM) [
1]. These apps have been developed for the purposes of increasing productivity and efficiency and for managing workflow.
Despite increasing proliferation of apps within the construction industry, little information is available on the perceptions of the CPs on the value of the apps [
14]. Previous studies in the construction ICTs have focused on areas such as BIM for managing essentials of building design and project data throughout the building’s life-cycle [
15,
16], information management at construction sites [
17], data visualization and CAD [
18], security and safety infrastructure for wireless networks [
19], construction defect management [
20], Enterprise resource planning (ERP) in improving the effectiveness of UK construction industry [
21], construction activity monitoring system [
22], and overall use of apps/ICT in the construction industry [
23,
24]. Hence there is the need to explore the perspectives of New Zealand CPs who are the real hands-on people working on construction industry. Research conducted on USA job sites found that the mobile solutions have impact on quality, subcontractor management, site coordination, safety, productivity, material procurement, project duration, and budget [
25]. Bedard [
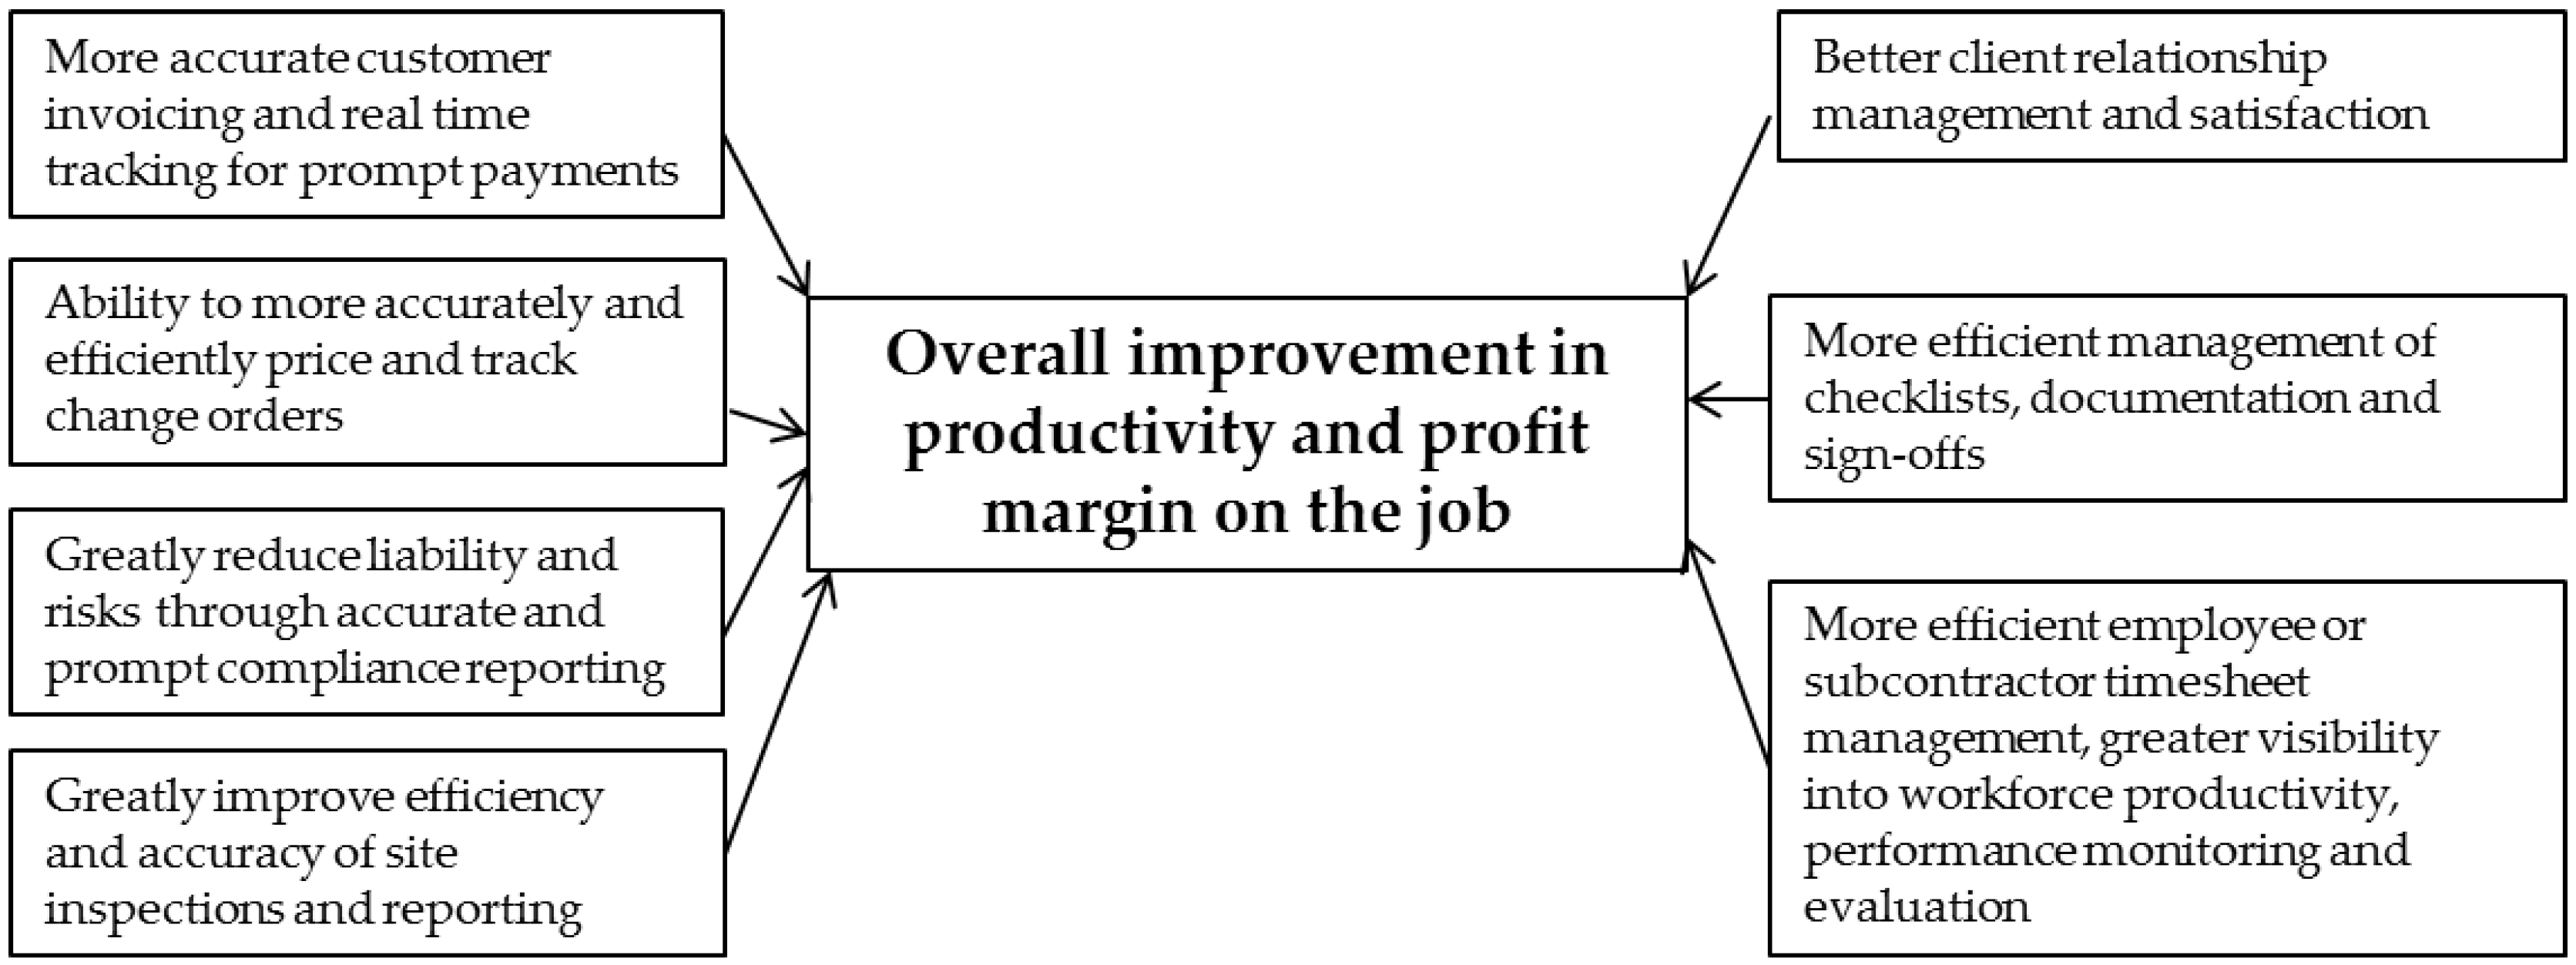
26], director of Global Enterprise Data Solutions and Verizon Enterprise Solutions, suggests mobile technologies can help all phases of the construction process to work seamlessly and keeping costs under control. The claimed benefits of using apps in construction industry are listed in in
Table 1:
On the basis of insights gained from the literature [
13], we propose that productivity and profit margin could be improved, if apps could achieve these benefits listed in
Table 1.
3. Research Questions and Survey Methods Used
The key questions driving the research are as follows:
What are the types of smartphone used in New Zealand construction industry?
What are the application areas the apps used in New Zealand construction industry?
What are the perceived benefits of the use of apps in New Zealand construction industry?
Which of the perceived benefits of the apps is the best predictor of the overall productivity improvement in New Zealand construction industry?
Answers to the above research questions are not known. To provide answers to the research questions, two stages of descriptive survey method were carried out. In the first stage an exploratory survey method was adopted to explore the key constructs embodied in the research questions. The choice of this research method was justified on two grounds. Firstly, exploratory surveys are suitable for research where the aim is to generate constructs or theories which will be validated in future quantitative research [
31]. Secondly, the method is suitable for empirical data that are qualitative in nature and for which scale of measurement is ordinal [
32]. Therefore the qualitative components of the empirical data for the research were obtained through in-depth interviews conducted with 14 members of the New Zealand Registered Master Builders (RMB)—the study sampling frame that represents the majority of the construction professionals in New Zealand. RMB has over three thousand members. The convenience sample of 14 members was in line with the exploratory nature of the study—i.e., to explore social phenomenon as against quantitative experimentation. While the sample size used was small, the interview-based in-depth qualitative exploration of the answers to the research questions provided rich insights on CPs’ views regarding use of apps in the construction sector. In the second stage of data gathering, questionnaire was designed based on feedback from the in depth interviews. The interview data were supplemented with insights gained from previous related research studies [
24,
25]. Rather than basing the required number of survey participants on the representative minimum sample size, this study adopted census survey of all members in each sampling frame. This is also due to the fact that most trade and professional organisations are reluctant to provide contact information of their members due to privacy reasons. Use of census survey also gives all subjects within the sampling frame equal opportunity to participate and hence minimize response bias. The questionnaire was hosted online and a link was provided in emails requests to all the members that comprised each sampling frame via the circulars issued by their organizational secretariats. Prior to administering the questionnaire to the study sampling frames, it was pre-tested by 8 industry professionals. The pre-test detected problems in the wording of some questions. These were rephrased for clarity and relevance with a view to improving its ability to generate good responses. A specific format of survey was followed which began with a brief description of the aims and objectives of the study and the benefits for participating in the research. The questionnaire was divided into two sections. The first section was used to collect data about the respondents’ perceptions of the benefits of the use of apps in the New Zealand construction industry. Those survey questions were ranked using the Likert scale from largest (5-strongly agree) to smallest (1-strongly disagree): degree of agreement and disagreement. The data thus collected from Likert scale is ordinal, as it refers to ranked data. The second section of the questionnaire was for demographics. Information gathered included the respondents’ experience, status in the company and focused areas of practice. The questionnaire was designed with questions that the construction professional would understand easily and complete within no more than 20 min. The construction professionals were assured that we would maintain their confidentiality and anonymity and only the researchers had access to their survey responses. The questionnaire was hosted online and links were provided in emails sent to all the members of the New Zealand Registered Master Builders (RMB), Licensed Building Practitioners (LBP), New Zealand Institute of Building (NZIOB) and New Zealand Institute of Architects (NZIA) by their organizational secretariats. In total 228 responses were received. Although the number of surveyed may seem small, all the members of those construction affiliations were given the chance to reply.
5. Results and Discussion
This section presents the results of the questionnaire survey. Among the 228 responses, 130 respondents actually completed the status and experience questions. Of these 56.92% of the responses were in the higher tier of management having roles such as CEO or director in their company, while 30% were project, construction or site manager. Further, about 86.67% of the participants had more than 5 years of work experience in the construction industry while 49.63% of the participants had more than 21 years of work experience in the construction industry. The surveyed participants worked in business areas such as general contracting, project management, earthworks and civils, architect, consultancy, design, joinery and sub construction across differing functional areas (carpentry, roofing, painting, plasterboard linings, concreting, glazing, plumbing, drainage, gas fitting, mechanical, heating air conditioning and ventilation, electrical and tiling).
5.1. Mobile Devices Used in the Construction Industry
Among the 228 responses, 227 respondents completed the question asking if they use mobile technologies. Majority of the respondents (i.e., 209 or 92%) use mobile technologies. 14 respondents (6.17%) said they did not use mobile technologies while 4 respondents (1.76%) stated that they have no idea about mobile technologies. Among the 228 responses, 141 respondents actually answered the question about mobile devices they or their company use. They can choose more than one devices. iPhone and Android phone are most popular devices in New Zealand construction industry. The results are shown in
Table 2.
5.2. Areas of Apps Use in the Construction Industry
Among the 228 responses, 139 respondents completed the question about the areas of apps use. Survey results indicated that the respondents were using mobile solutions for multiple application areas as shown in
Table 3. The top five applications are site photos (94.24%), Health and Safety reporting (37.41%), Timekeeping (34.53%), RFI’s (30.22%) and Progress Tracking (29.50%).
5.3. Perceived Benefits of App Use
Among the 228 responses, 138 respondents completed the question about the benefits of apps. The questionnaire listed potential benefits offered by smartphone apps and respondents were asked to rank their agreement or disagreement over a 5 point Likert scale: 5 = “strongly agree”; 4 = “agree”; 3 = “neither agree nor disagree”; 2 = “disagree” and 1 = “strongly disagree”. In relation to the hypotheses, we tested if the means of responses for the benefits of mobile technology were within the average value.
Table 4 shows that the
p-values of the mean ratings are less than the critical alpha value of 0.01 in each case. The critical alpha value <0.01 implies that there is only less than 1% chance that the null hypothesis was in fact true. Therefore there was no statistical basis for accepting the null hypothesis that the people neither agree nor disagree that mobile technology can bring benefits.
Based on the results, all the mean values are greater than 3, we could conclude on above seven perceptions of respondents in relation to benefits from the use of mobile apps in construction.
Perceived Benefits Towards Overall Productivity
As a second measure of consistency check, we examined the causal relationship between the perceived benefits of the technology and the overall improvement in productivity and profit that could be achieved by its use. Spearman’s correlation coefficient (
s) method was used to analyse the significance of the relationship between the two diverse data sets. Relationships are first described as positive or negative, and then ranked in the following order: perfect (
= 1), strong (
>= 0.7), substantial (
>= 0.5), moderate (
>= 0.3), weak (
>= 0.1) or none (
>= 0.0) [
37,
38]
It was found that all the perceived benefits of using mobile technology has positive relationship with overall productivity improvement while “better client relationship management and satisfaction” has substantial correlation with using mobile technology to ensuring overall improvement in productivity and profit as shown in
Table 5.
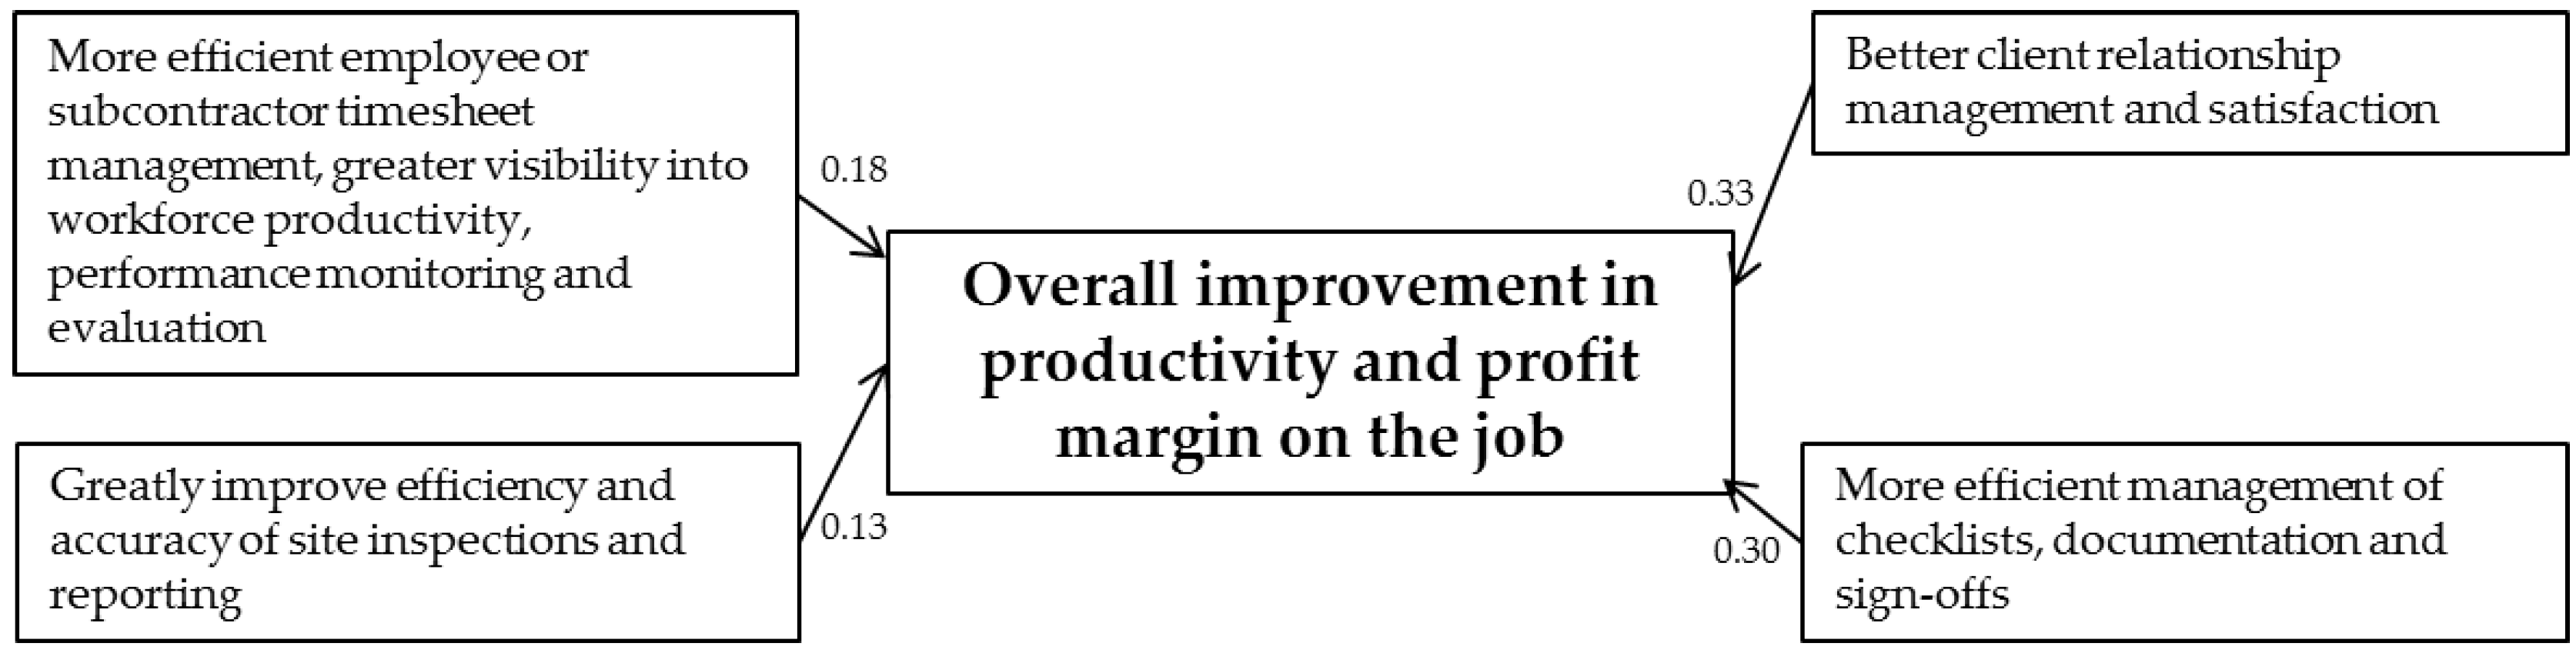
Lastly, we use the analysis of moment of structures (AMOS)-based structural equation modeling (SEM) routine to model and validate the causal relationships between the perceived benefits as independent variables and the overall productivity improvement as the dependent variable. Validity was checked by examining the extent to which developed model fitted the estimated covariance matrices of the dataset.
Figure 2 shows the structural equation model developed for this purpose. Out of 7 benefits, only 4 benefits listed in
Figure 2 have
p-value is less than 0.05. In the majority of statistical analysis, the
p-value of 0.05 is used as the cut-off for significance. The significance is found in those 4 benefits. The other 3 benefits have
p-values are larger than 0.05. Their significant do not exists. So they are removed from the model.
The output of the regression weights of the perceived benefits of the use of mobile app in
Table 6 showed that ‘better client relationship management and satisfaction’ is best predictor of the overall improvement in productivity and profit than other benefits.


