1. Introduction
Construction-related energy use and associated emissions of greenhouse gases (GHG) is a major concern globally [
1]. Environmental measures are therefore becoming an increasingly important collective indicator for evaluating the performance of construction projects [
2]. To reduce GHG emissions in construction processes, there is a need to compare alternatives in the planning stage in order to identify and implement the most favorable one [
3,
4].
Of the current environmental measures, many focus only on individual phases of the life cycle [
5], although several of the life cycle phases of a construction project have substantial energy use and GHG emissions. In buildings, for instance, the embodied energy—meaning the energy used for the necessary activities prior to the operational phase [
6]—ranges from a few percent up to about half of the total life cycle energy use, whereas the operational energy use accounts for most of what remains [
7]. The embodied energy in infrastructure such as roads is even higher, and constitutes almost all of the total life cycle energy for roads that lack lighting and traffic signals [
8].
There are, however, approaches that take life cycle perspectives into consideration, e.g., the Life Cycle Assessment (LCA) [
9], Life Cycle Energy Assessment (LCEA) [
10] and the Environmental Product Declaration (EPD) [
11]. Most Conventional LCA approaches are static, and disregard the dynamic evolution of construction projects [
12], resulting in location-independent evaluation and erroneous assumptions of homogenous effects [
13].
To adapt the assessments to specific construction settings, Building Information Modeling (BIM) can offer a source for generating rich data such as project-specific material quantities [
14]. Discrete Event Simulation (DES) allows for the modeling of uncertainties, for instance in terms of probability distributions and dynamic relations between resources and processes that are inherent to construction projects and can thereby incorporate variation into the schedules generated [
15].
This study presents a model that incorporates project-specific data into the assessment of embodied energy use and associated GHG emissions of construction projects. Whereas previous research has used the connection between BIM and DES to assess construction performance in terms of time [
16], this study uses BIM and DES to assess energy use and GHG emissions. The proposed model is demonstrated and tested in the construction of a bridge superstructure. The model only evaluates the energy used during the upstream flow of the project,
i.e., the embodied energy, and associated GHG emissions as this phase constitutes most of the life cycle energy use in infrastructure projects of this kind.
This study is organized as follows. First, a literature review is presented that highlights the weakness of generality related to conventional LCA-based approaches in construction and suggests the use of BIM and DES to create project-specific data. A model is then proposed that shows how BIM and DES can aid the estimation of embodied energy and associated GHG emissions. This model is then demonstrated on a bridge superstructure to explore its practical usefulness. Next, the discussion section highlights limitations and suggestions for future research. Finally, conclusions are presented and the contribution of the study is summarized.
2. Previous Research
2.1. Life Cycle Assessments on Construction
The energy used in construction and its related processes originates from fossil fuels, renewables, and other sources. Whereas all energy systems cause GHG emissions during their life cycle [
17], fossil fuel based systems cause GHG emissions per unit of produced energy in considerably higher quantities than other sources [
18]. To meet the threats to the environment from global warming due to GHG emissions, several environmental impact assessment tools have been developed [
19]. LCA-based tools are used to quantify the environmental burdens of products or processes from cradle to grave. An LCA is carried out according to a framework defined in the ISO 14040 series [
20]. Four primary steps are included in an LCA, namely goal and scope definition, inventory analysis, impact assessment, and interpretation [
21]. LCA-based tools such as LCEAs [
10] and EPDs [
11] are used to assess and communicate environmental impacts. In the construction industry, LCAs and EPDs are commonly divided into specific life cycle phases or stages. However, current research provides not one single definition, but rather a multitude of definitions and labels of these life cycle stages and phases [
22]. For instance, in some studies the embodied energy includes not only the energy used until the project completion but also what is called recurrent embodied energy, which occurs during renovation and refurbishment, and demolition energy, which is used for deconstruction and final disposal [
23,
24].
While creating LCAs has become more elementary with the help of specific software and databases [
25], there still remain uncertainties regarding the issue of their overall accuracy [
14,
26]. Whereas construction projects are undertaken in uncertain environments where resources and activities interact in a complex manner [
16]; conventional LCA approaches are static and do not take into consideration these dynamic interactions and uncertainties at the construction site [
12]. Instead, many current LCA approaches make general assumptions regarding locations and effects [
13].
2.2. Discrete Event Simulation and Building Information Modeling
DES, which was first applied to construction with the introduction of the CYCLic Operations NEtwork (CYCLONE) [
27] can specifically take into account the inherent uncertainties and dynamic interactions related to construction, and evaluate the performance of the project from several perspectives [
28]. Recent development in the field has expanded DES towards evaluating environmental performance in construction projects. For instance, by optimizing the allocation of resources with DES, the fugitive and exhaust emissions of construction processes can be minimized [
29]. Data from static models such as the NONROAD emissions inventory model [
30] can be combined with DES to estimate emissions from construction equipment to reflect uncertainty, randomness, and the dynamics of construction [
31]. Compared with other existing approaches, DES-based estimating enables the estimation of emissions at a microscopic level using project-specific data [
32].
The large amount of data required to build and maintain a simulation model has been identified as a challenge for the utilization of DES to quantify the environmental impacts related to construction [
33]. However, by linking databases containing necessary input data to DES, the simulation process can be facilitated. Consequently, BIM—which serves as a repository of life cycle information of buildings—provides a possible data source to parameterize the DES model. Building information models are data-rich parametric digital representations of facilities, from which relevant data, such as material quantities, can be extracted to perform environmental assessments [
34]. BIM has successfully been integrated and used by other analytical tools—for instance BIM-assisted material quantification and cost estimates—that have achieved better performance over traditional methods [
35]. An extension of BIM has been to enable the generation of construction tasks and activity duration by connecting BIM to a database containing productivity rates [
36]. BIM has also been used for thermal simulation and analysis, which has allowed for exploration of the thermal performance in different phases of the life cycle of the building [
37]. Operational energy simulation software has successfully been combined with BIM to semi-automate Building Energy Performance (BEP) simulation, which results in faster implementation compared with traditional methods of processing the same data [
38]. Lu and Olofsson [
16], developed a BIM–DES framework in which BIM provides the product and process information to DES, facilitating the building of the DES model. The DES model evaluates the construction performance in terms of time and provides valuable feedback to the BIM process for decision support.
This study aims to mitigate weaknesses identified with current LCA approaches by incorporating project-specific data, generated by BIM and DES, into a proposed model. Based on previous research [
16], this study intends to quantify environmental performance with project-dependent specific evaluation using the proposed model. The system boundary of the evaluation is the embodied energy and associated GHG of construction projects, meaning off-site material production, transportation, and on-site construction.
3. Proposed Model
To facilitate the estimation of embodied energy and GHG emissions in infrastructure construction, a model is proposed which can be seen in
Figure 1.
Figure 1.
The model for assessing embodied energy associated emissions.
Figure 1.
The model for assessing embodied energy associated emissions.
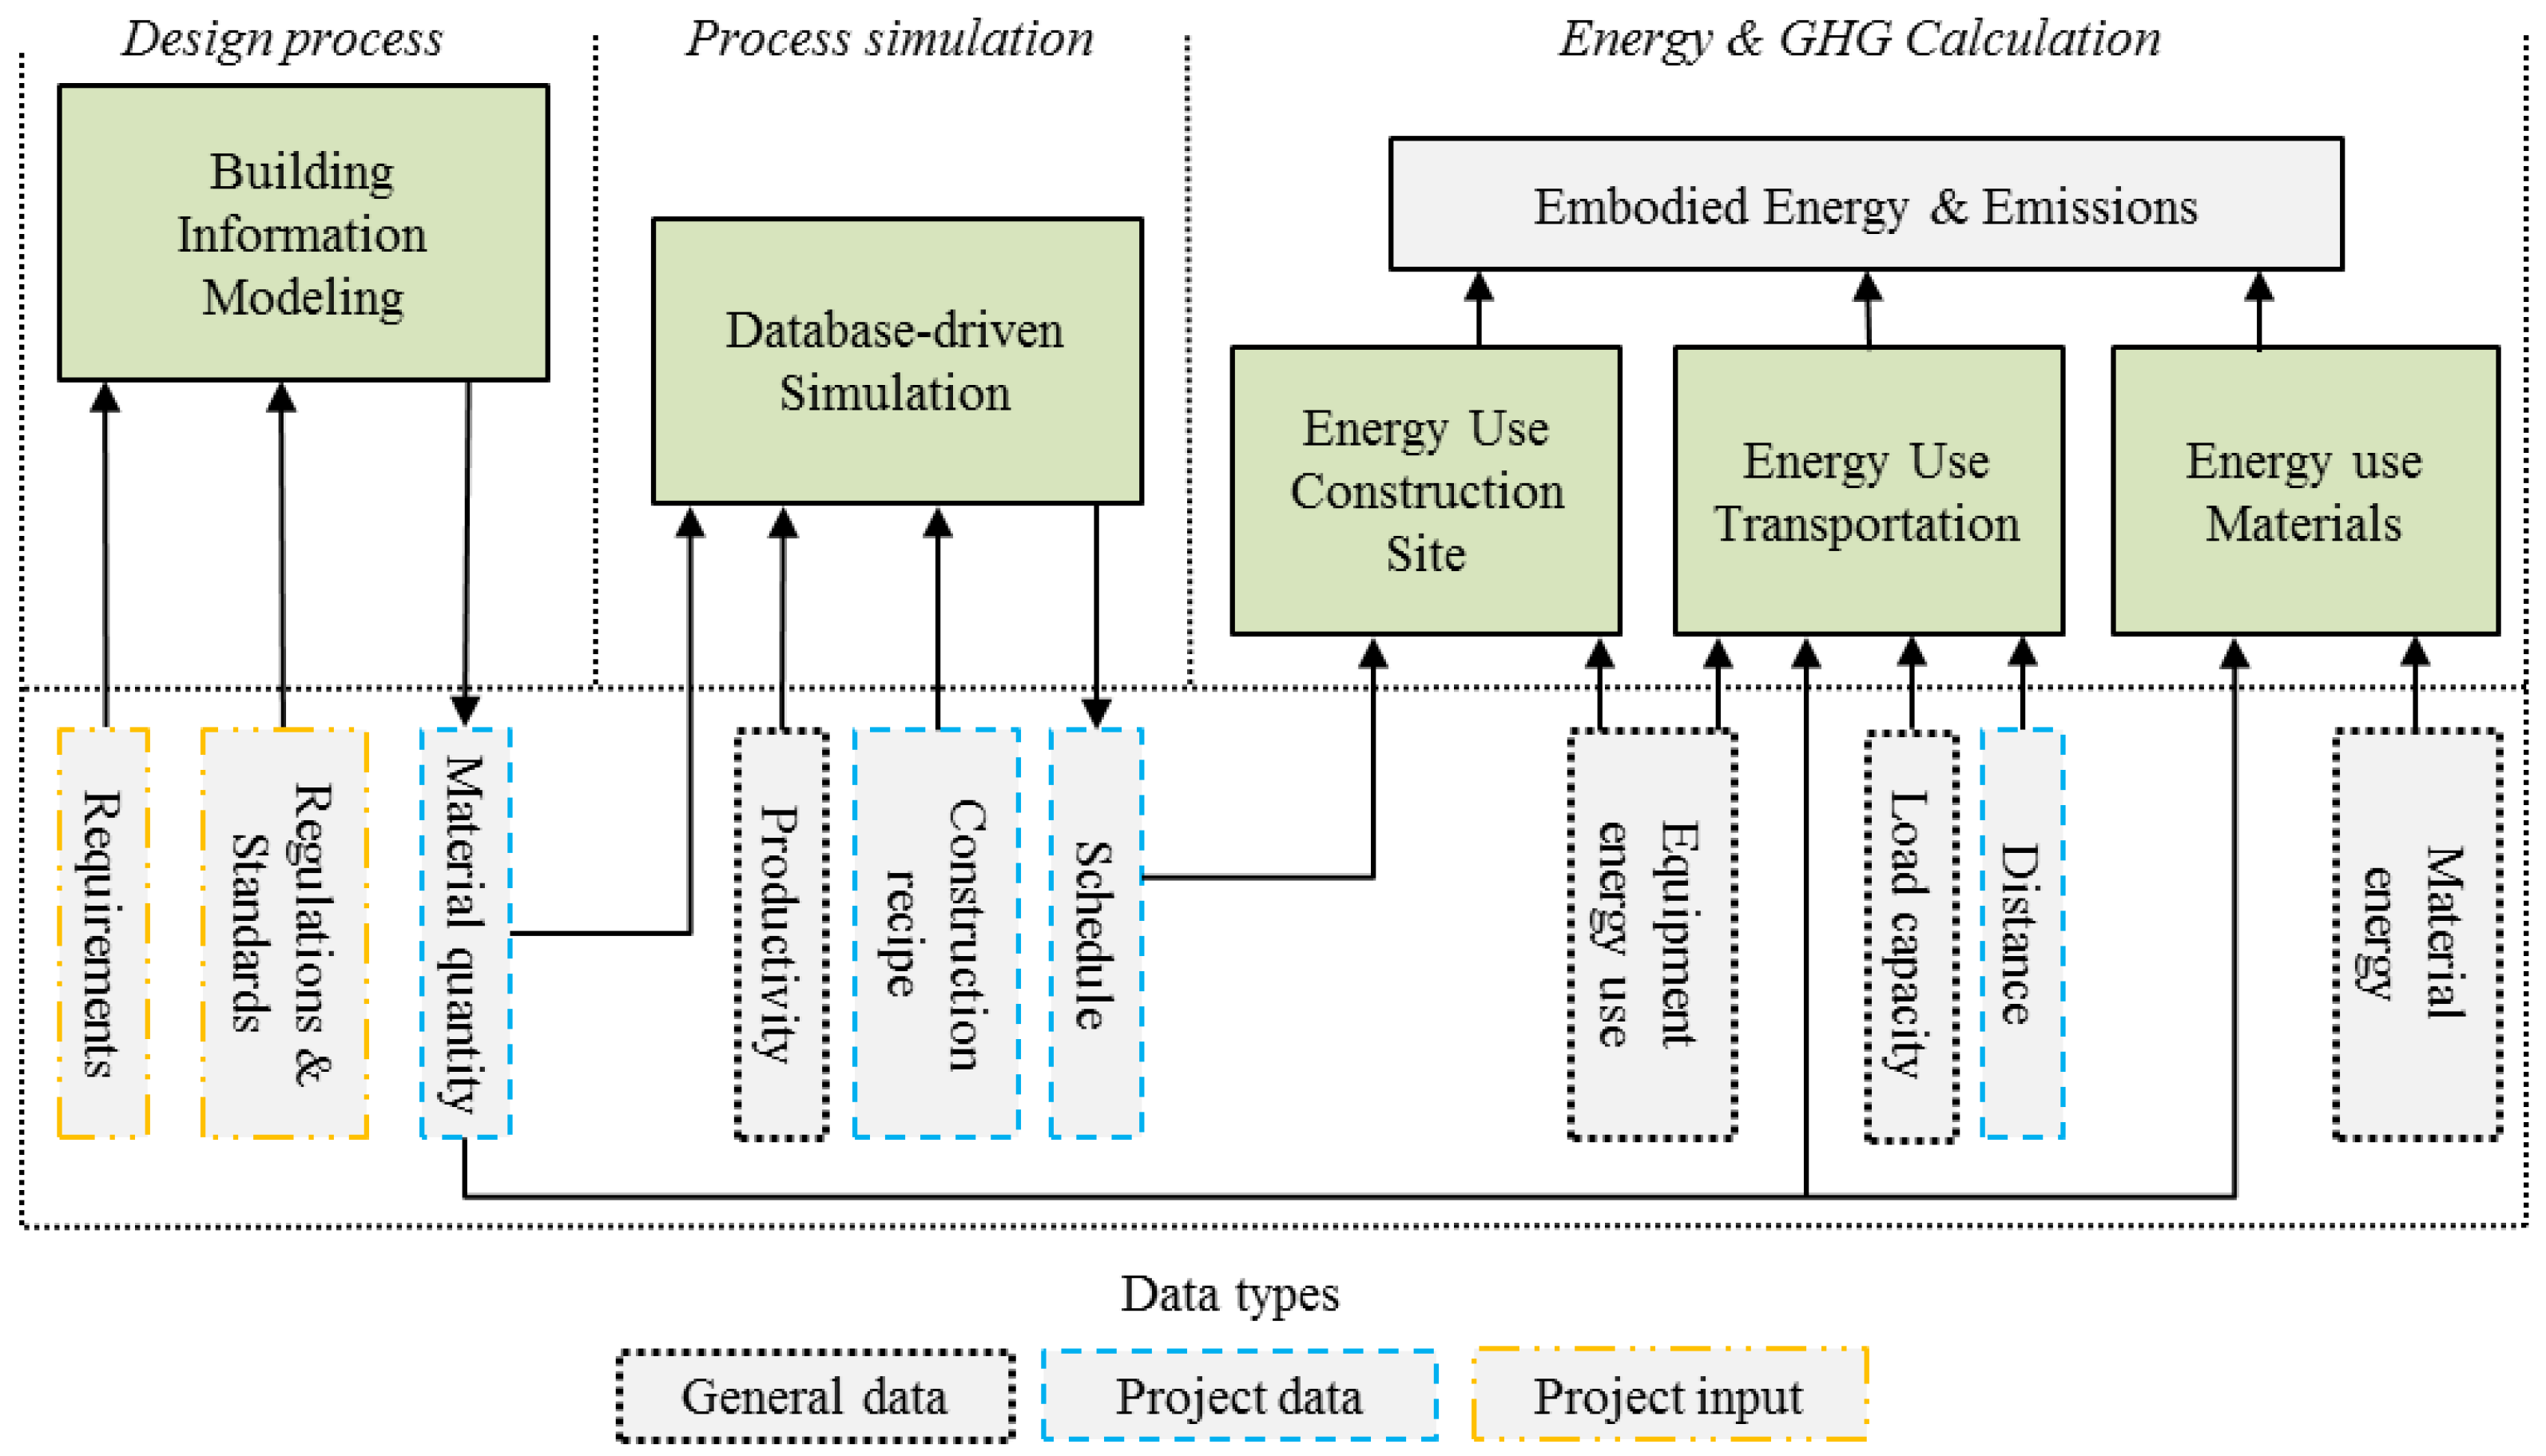
The purpose of the model is to allow for project-specific estimation of embodied energy and GHG emissions using BIM and DES. The top portion of the model details the activities needed to calculate the embodied energy and GHG emissions. The lower part shows the data types that are needed as well as created during the process. General data is information of a general nature that is stored long term in a relational database and can be used in multiple projects. Project data, on the other hand, comes from the specific project or construction, and so changes for each project and is therefore unnecessary to store (long term) in a database. Project inputs are the specific customer requirements, regulations and standards that dictate the course of the construction project.
3.1. Design Process
In the design process, which is the first step in constructing the model, the requirements of the customer, as well as existing regulations and standards dictating the product model, which is represented as a specific BIM. BIM generates the material types and quantities of the product, which are extracted and stored in a relational database for further use. The data is used both in the process simulation and during calculations of energy use and GHG emissions.
3.2. Process Simulation
A database-driven simulation approach similar to that proposed by Lu and Olofsson [
16] is used to build the process simulation. A DES model in a database-driven simulation is parameterized by data provided through a set of sources such as data forms, tables, spreadsheets, and relational databases [
39]. This type of simulation is particularly suitable for construction projects where knowledge is stored and maintained in a database. The simulation engine is used for the on-site construction processes and can model uncertainties, for instance by including probability distributions to allow for more realistic construction settings.
The previously generated material quantity data, as well as productivity data and construction recipes are used as input data for the process simulation and are stored in a database. The internal process of the simulation starts with each activity requesting the database for the status of preceding activities and the necessary resources (machines, workers, materials) for the activity. Each activity “competes” with other activities in the schedule for available resources in this process. If the requested resource is available it sends a confirmation to the activity. If not, it tells the activity to hold and monitor the system for the status to change.
If all the required resources are available, and if preceding activities are finished, the activity can start. When an activity is completed it is marked as finished together with a time stamp. The system status is changed and all remaining activities are checked to determine whether their prerequisites for starting are fulfilled. This process is repeated until all activities in the schedule are completed and the time data from the simulation is reported.
3.3. Energy and GHG Calculation
In the next step, the energy use and GHG emissions for the materials, transportation, and construction are calculated. Energy and fuel data from each piece of construction equipment and the scheduling data are used for the calculation of construction site energy use. The energy use of transportation is calculated based on vehicle fuel data, load capacity of the vehicle, material quantity, and transportation distance. Finally, the energy use connected to the off-site material manufacturing and extraction is calculated based on the material quantity and the embodied energy of each material type. The energy use of materials may be acquired from the manufacturer of the material or by consulting published EPDs, and includes the energy used from cradle to factory gate,
i.e., modules A1 to A3 [
40,
41].
4. Demonstration
The superstructure of a semi-prefabricated beam bridge was selected to assess the usefulness of the proposed model. To gain greater knowledge and understanding of the product and its corresponding production processes, a construction project was observed in order to gather data. This approach was selected since it is appropriate for obtaining a rich contextual understanding of a system such as a construction site [
42]. In the demonstrated scenario, the locations of the suppliers and the construction site are not specified and transportation distances are therefore hypothetical (see
Table 1). The bridge has a length of 18 meters and the width is eight meters. The superstructure of the bridge is constructed by both traditional on-site construction methods and the use of prefabricated parts manufactured at a factory. Being a standardized product, the bridge enables an assessment to be made of the effects of scalability of the product and process performance.
Table 1.
Project-specific data of distances, material quantities and workers.
Table 1.
Project-specific data of distances, material quantities and workers.
| Parameters | Quantity | Unit |
|---|
| Distance |
|---|
| Precast supplier | 100 | km |
| Concrete pump | 50 | km |
| Reinforcement | 50 | km |
| Construction site cabin | 50 | km |
| Construction Material |
| Beam | 7 | Qty a |
| Edge beam | 2 | Qty b |
| Plate | 48 | Qty c |
| Concrete | 35.1 | m3 |
| Reinforcement | 5.4 | tonne |
| Tasks | Workers | Crane | Concrete Pump |
| Establish crane | 1 | – | – |
| Mount precast components | 3 | 1 | – |
| Fill joints | 2 | – | – |
| Reinforcement work | 2 | 1 | – |
| Pump concrete | 1 | – | 1 |
| Concreting | 4 | – | – |
| Coverage and water treatment | 2 | 1 | – |
| After treatment | 3 | – | – |
Before the implementation of the proposed model could take place, it was necessary to hold discussions with the product manager (Contractor 1) and inspect support documents, e.g., drawings and schedules, of the bridge. Data of the product and production process were then collected by two weeks of observations of the work conducted at the construction site.
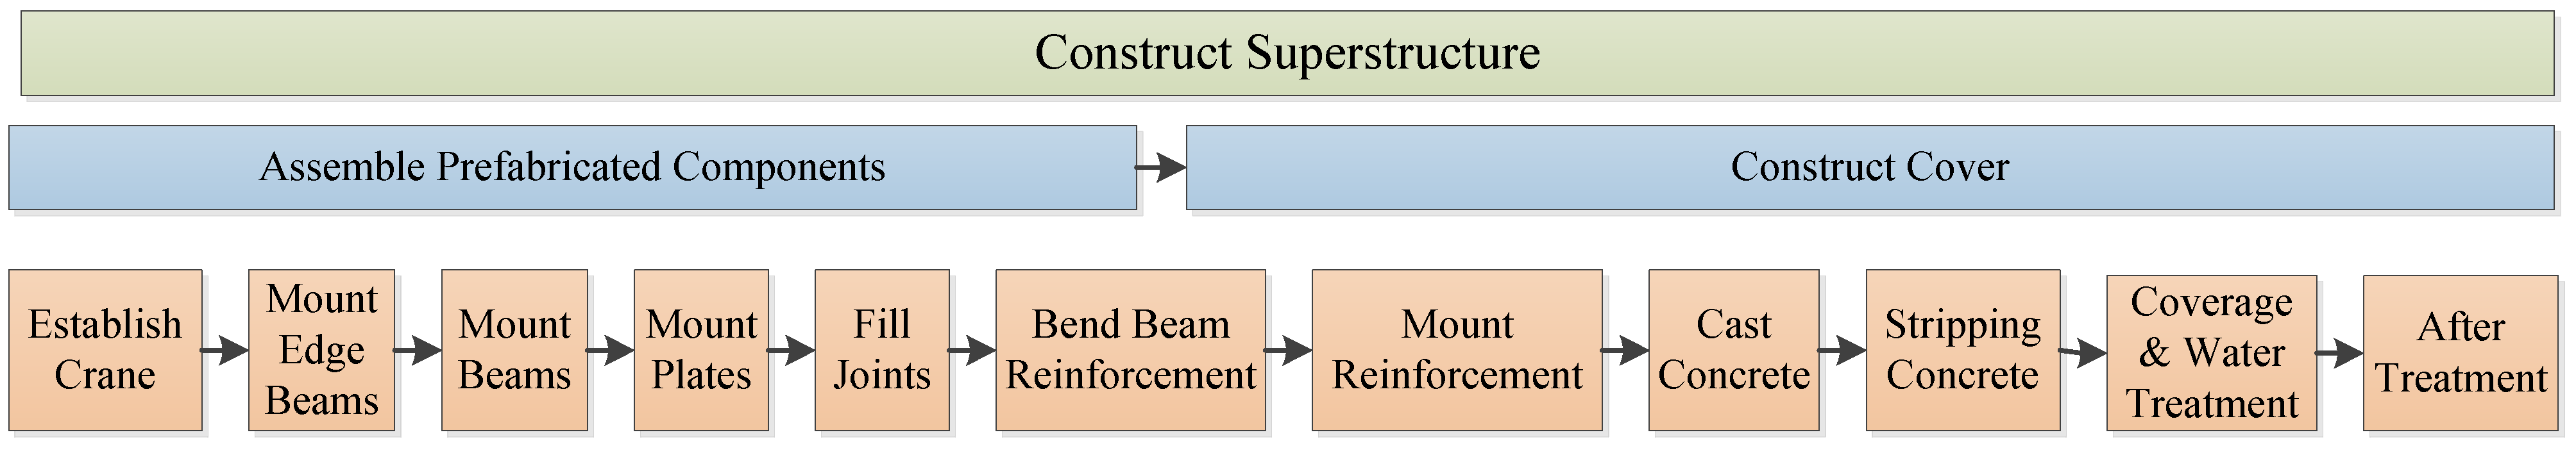
After observing the construction at site, the construction process was mapped. The construction process starts with the mounting of the prefabricated beams—firstly the edge beams and after the internal beams—on top of the on-site constructed substructure (
Figure 2). Prefabricated plates are mounted between the beams, and joints are filled to create a left formwork enabling construction of the cover. Finally, the cover is constructed, which consists of reinforcement that is assembled into the formwork and concrete is poured into the formwork to create a continuous superstructure.
Figure 2.
Construction process of the bridge superstructure.
Figure 2.
Construction process of the bridge superstructure.
4.1. Model Implementation
The design process is the initial step in implementing the model. A BIM of the bridge is made in Revit [
43] that enables the quantity take offs to quantify the materials used in the bridge superstructure.
Figure 3 illustrates the BIM model of the bridge, including components in the studied superstructure. The material quantities that are generated from the BIM and used during the demonstration can be seen in
Table 1.
Figure 3.
(Left) BIM of the bridge; (Right) superstructure components 1 = Edge beam, 2 = Beam, 3 = Plate, 4 = Cover.
Figure 3.
(Left) BIM of the bridge; (Right) superstructure components 1 = Edge beam, 2 = Beam, 3 = Plate, 4 = Cover.
The next step in implementing the model is the process simulation where a Simio DES engine [
44] was used. In order to simulate the construction processes shown in
Figure 2, the previously acquired material quantities, productivity data, and detailed construction recipes are needed. The productivity values for each task seen in
Table 2 are collected and stored in a relational database that the simulation engine reads. To include uncertainty aspects in the simulation, the productivity values are expressed in terms of triangular probability distributions. While
Figure 2 shows the sequence of each task in the construction of the bridge superstructure, some non-sequential dependencies also exist. Stripping concrete is e.g., performed parallel with casting concrete but with a delayed start of 0.5 h, and after treatment cannot start before the concrete has hardened for at least four days. This information was specified in the simulation engine.
Table 2.
General data added to the database.
Table 2.
General data added to the database.
| Category Material | Energy Use MJ/FU | GWP CO2 Equivalent/FU | Functional Unit (FU) | Source |
|---|
| Concrete | 1495 | 188 | m3 | [45] |
| Reinforcement | 11 556 | 785 | tonne | [46] |
| Edge beam | 64 473 | 2599 | qty | Supplier 1 |
| Beam | 53 781 | 2168 | qty | Supplier 1 |
| Plate | 1518 | 61 | qty | Supplier 1 |
| Transportation | Diesel Use | Capacity | Source |
| Concrete | 0.45 L/km | 7 m3 | Contractor 2 |
| Reinforcement | 0.45 L/km | 10 tonnes | Contractor 2 |
| Edge beam | 0.52 L/km | 1 Qty | Contractor 2 |
| Beam | 0.52 L/km | 2 Qty | Contractor 2 |
| Plate | 0.45 L/km | 48 Qty | Contractor 2 |
| Construction site cabin | 0.45 L/km | 1 Qty | Contractor 2 |
| Construction | Energy Use | Energy Carrier | Source |
| Mobile crane | 26.8 L/h | diesel | [47] |
| Concrete pump | 29.2 L/h | diesel | [48] |
| Construction site cabin | 50.4 MJ/day | electricity | [49] |
| Task | Scheduled Mean Productivity | Source |
| Establishment of crane | 2 h/Qty | Contractor 1 |
| Mount edge beam | 0.5 h/Qty | Contractor 1 |
| Mount beam | 0.36 h/Qty | Contractor 1 |
| Mount plate | 0.11 h/Qty | Contractor 1 |
| Fill joint | 0.05 h/m | Contractor 1 |
| Bend beam reinforcement | 0.4 h/m | Contractor 1 |
| Mount reinforcement | 20 h/tonne | Contractor 1 |
| Pour concrete | 0.5 h/m3 | Contractor 1 |
| Pump concrete | 0.05 h/m3 | Contractor 1 |
| Stripping of concrete | 0.1 h/m2 | Contractor 1 |
| Coverage and water treatment | 0.8 h/m2 | Contractor 1 |
| After treatment | 0.1 h/m2 | Contractor 1 |
The number of workers and construction equipment in every task, as well as materials used during the construction process, are also specified in the simulation engine. These values are presented in
Table 1.
Lastly, the energy use and GHG emissions are assessed. In this step, the database is populated with the remaining general data, which includes equipment energy data, load capacities of transportation vehicles, and material energy data, meaning the cradle to factory gate energy use of all the materials included in the construction project. All of these values are listed in
Table 2.
Building materials used during construction of the superstructure, besides the prefabricated components, are concrete and reinforcement. Material production, which consists of raw material extraction, transportation, and manufacturing, has Global Warming Potential (GWP) data based on the materials’ EPDs from cradle to factory gate [
45,
46]. The prefabricated components are manufactured by Supplier 1. Besides energy use data, each type of component in the superstructure has a GWP datasheet listing the emissions from cradle to factory gate. Supplier 1 has used an EPD tool, developed by the Swedish Cement and Concrete Research Institute, to calculate the energy use and GWP associated with the extraction and manufacturing of input materials, transportation to the factory, and the energy used at the factory for manufacturing the components. However, since no actual EPDs of the components manufactured by Supplier 1 have been published, the data has not been verified by a third party. The energy use of the crane and the concrete pump is calculated based on a model that uses the equipment’s rated power, brake-specific fuel consumption, and load factor [
50].
The building materials, prefabricated components, and on-site facilities need to be transported to the construction site. For each type of transport, the fuel consumption and load capacity is needed. The load capacity is described for each functional unit of the particular goods transported. The diesel use data is based on average values for trucks fully loaded for half of the total distance and unloaded for the other half. The on-site construction process requires a mobile crane and a concrete pump. The workers need two construction site cabins, one with a kitchen and one with shower and dressing room facilities. This assertion is based on discussions with the site manager and observations at site. Standardized productivity values are gathered through observations at the construction site and later validated by the site manager. The productivity of each task is represented with a triangular distribution with each extreme value being 20% higher and lower than the scheduled mean productivity. As all general data is gathered and populated into the relational database, the project-specific data values are used to interrogate the database in order to get the results calculated.
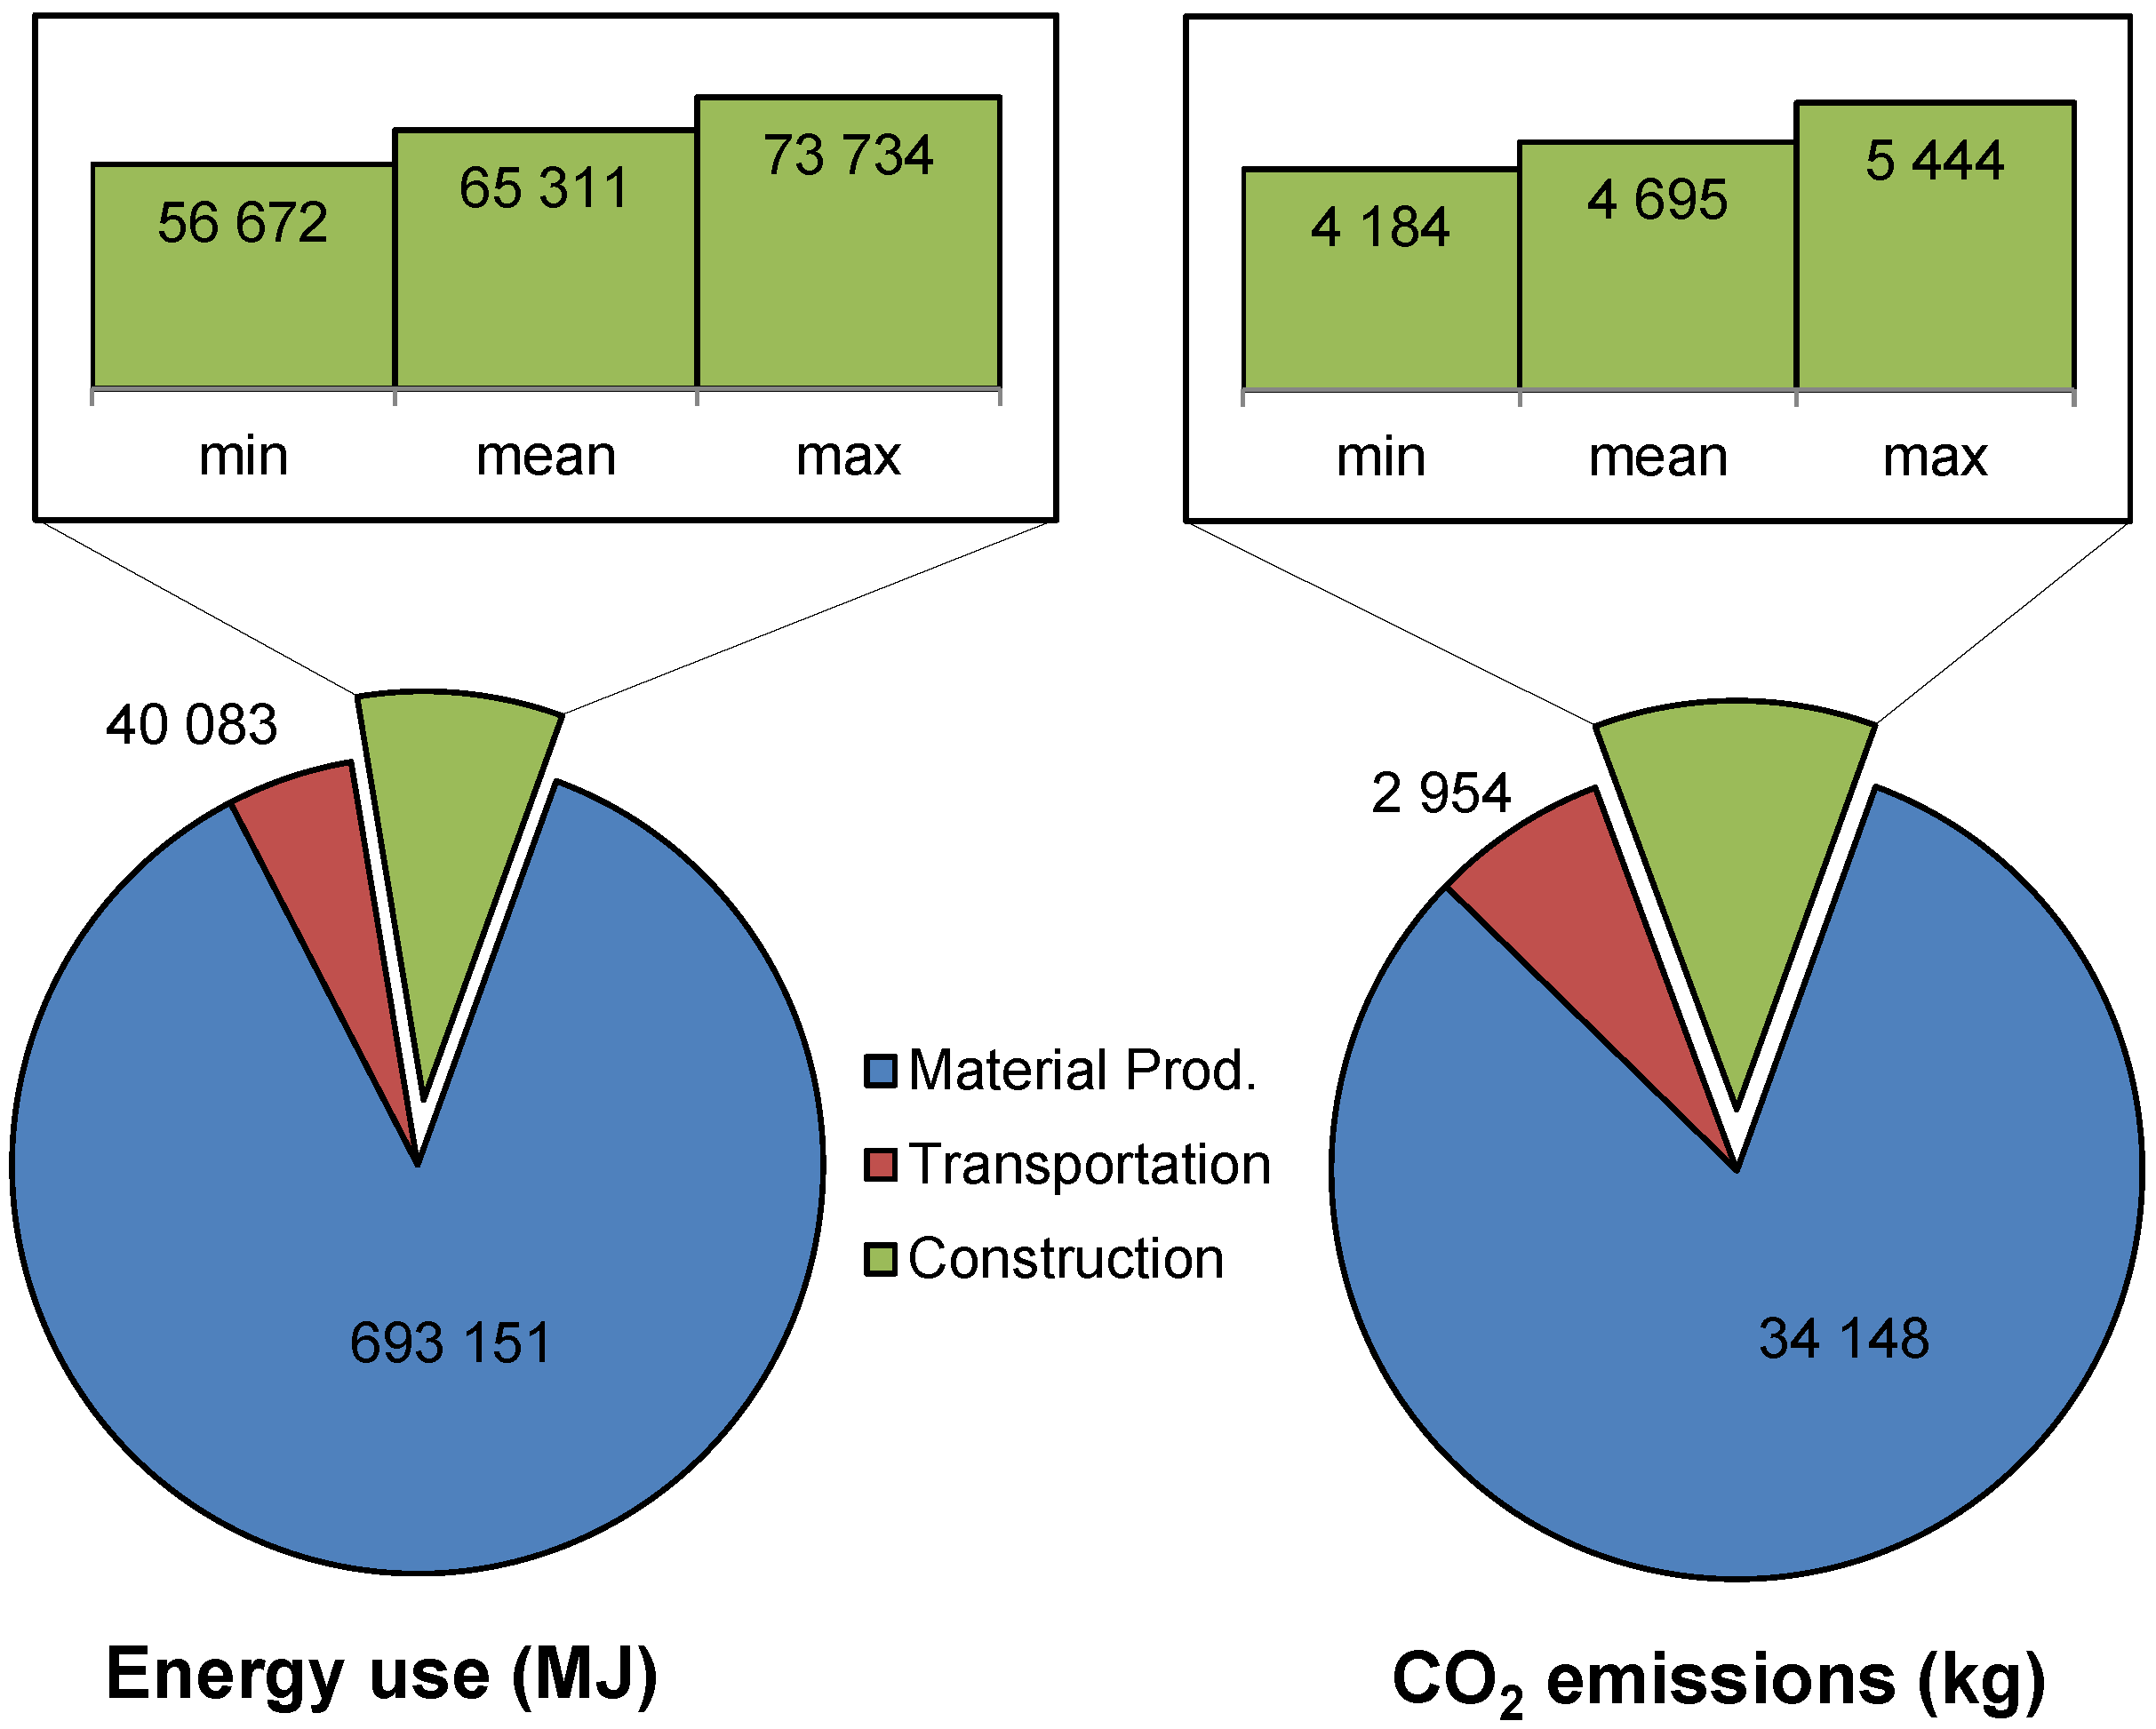
4.2. Results
With the given parameters in this demonstration, the energy use and associated CO
2 equivalent emissions are calculated and divided into three categories, namely
material production,
transportation and
construction. Furthermore, the results from
construction are divided into the mean, maximum and minimum values, which are a result from the process simulation. The results are presented in
Figure 4.
Figure 4.
The energy use and CO2 equivalent emissions of each category.
Figure 4.
The energy use and CO2 equivalent emissions of each category.
The energy used for material production is considerably higher than for transportation and construction. Furthermore, the energy use in each category roughly corresponds to the CO2 equivalent emissions caused. Although the energy use is simply expressed in megajoules (MJ), there are several energy carriers used in the project, both renewable and non-renewable based on the information in the material EPDs.
5. Discussion
If nothing else, the proposed model offers a possibility for mitigating limitations that exist in many of the current LCA-based methods used in construction [
12,
26] by being adapted for usage in construction projects. The model incorporates both general data and project-specific data into the assessment of embodied energy use and associated GHG emissions of a construction project. BIM is used for efficient generation of input data, such as bill of quantities of components, and material used in the construction process. DES is used to model the on-site construction processes and to generate project-specific schedules. For instance, by including probability distributions for work productivity, material use, and deliveries, on and off-site uncertainties can be addressed [
16]. Relational databases are used in several steps during the model implementation. First of all there is short-term storage of project data used in the database-driven simulation process, and secondly, there is the long-term storage of both explicit and experience-based knowledge of product and process data. The proposed process facilitates reuse of the information in multiple projects, as well as comparing alternatives within a project in order to be able to identify and select the most suitable options in the construction stage [
3,
4]. The case study shows that energy and GHG assessments can be made project-specific, whereas generally accepted LCA approaches often disregard the dynamics of on-site construction [
12].
Previous construction management literature has mostly assessed the construction process from the perspectives of time, cost, and quality [
51]. The model proposed here contributes by adding an environmental indicator for measuring construction success [
2]. Project-specific LCAs, incorporating both project-specific data and general data into the assessment, could allow contractors to develop more environmentally friendly products and processes. As a complement to existing approaches that use time as a factor for assessing project performance [
16], this approach allows clients to also consider proposals with respect to energy use and GHG emissions.
In this study, several limitations have been recognized. All may be viewed as possible subjects for future research. Firstly, the model only considers the embodied energy from cradle to gate, i.e., material production, transportation, and on-site construction. While this can be justified in many infrastructure projects, as other life cycle phases have comparatively low energy use and emissions, it cannot be assumed in all cases. Further, if the scope of the model is expanded beyond infrastructure to include e.g., buildings, there are particularly good reasons for including more phases—or indeed the whole life cycle—of these construction projects.
Secondly, the data-gathering process and the generation of input data is a relatively complex and time-consuming process, which can limit the application of this type of model in traditional construction. The standardized product used in the demonstration, however, allows for the reuse of data in multiple projects as products and processes are similar to a large extent. The collected information and input data can be stored in a relational database, which is easily accessible to new projects. The proposed model is therefore more suited for products and processes that are composed of more standardized components. Furthermore, standardized products and processes offer the possibility to automatize data generation, for instance with sensors on equipment, to provide reference data for future projects. This type of approach can also support a continuous improvement process as knowledge and experience from previous projects can be used to improve future projects. While relational databases are helpful in simplifying procedures by allowing a more automated process, they do not solve all the attendant problems. The data generated using BIM and DES is often project-specific, and cannot be reused in most cases. Consequently, the process becomes time consuming. Part of the problem with data gathering comes from the fact that good data is not readily available. EPDs are still uncommon and quite often they do not exist for all materials and components from a specific supplier, that are used in the construction industry. However, EPDs from other suppliers that might be based in other countries could be used as substitutes, albeit with the effect that these do not completely reflect actual conditions.
Thirdly, the calculation of energy use associated with transportation of materials and equipment needs to consider how many functional units of a given material can be transported on a specific transportation vehicle. While this information could partly be acquired from the material manufacturers directly, it is not specified in EPDs, a situation which then might require some assumptions. A systematization that connects a functional unit of the EPD, or similar material data, with certain options of transportation vehicles would simplify the data gathering further. The main challenge lies in the fact that load capacities of transportation vehicles are often expressed in volume or mass, but materials and products can have more complex units such as areas, length, or number of the specific material or product. The geometric shape of the material and product further complicates how many functional units can fit in a specific transportation vehicle. In addition, the fuel use of the transportation vehicles is dependent on how much material is loaded onto the vehicle, specifically in terms of mass, which needs to be highlighted. By categorizing or classifying material types, functional units and transportation vehicles and defining rules for how these interact, the transportation of materials can be modeled with higher accuracy. This could have implications not only in the field presented in this study, but also in fields dealing with transportation logistics.
Finally, the small-scale and exploratory nature of this study means that some important aspects have been left out. Since the findings have not been validated or compared to those found in related studies, the results of this study must be used with caution. Furthermore, no investigations into appropriate system boundaries have been carried out. However, the findings in this study indicate that the proposed model has the ability to function as an application for producing more project-specific assessments of the increasingly important LCA, especially during the design and planning phases of a project.
6. Conclusions
This study demonstrates, in a small-scale study, a model for assessing the embodied energy and associated GHG emissions in infrastructure construction projects. The model contributes to making these assessments more project-specific by including BIM and DES to generate the necessary input data of material quantities, realistic schedules of work activities, and transportation associated with the construction process. By collecting and storing data in a relational database for future use, the data-gathering process can be simplified. The proposed model is particularly useful in settings where new projects are similar to previous ones, or in projects that use standardized products.
The findings presented in this study may have implications for the advancement of LCAs in general, but particularly within construction processes, as it offers a new approach that can make more project-specific assessments. As environmental concerns are being adopted as an important project evaluation criterion, this study could also have implications within construction management. Ideally, this type of model could provide project managers with a tool to assess construction designs, schedules and supply chains from an environmental perspective. However, further research is needed to integrate the environmental assessment of the project with other important criteria for project success such as time, cost and quality.
Overall, this study demonstrates that there is the potential to generate environmental input data in the design and planning stage of a construction project and therefore make the assessments of embodied energy and associated GHG emissions more project-specific. This is beneficial for the development of more environmentally-friendly products and processes in the project-based construction industry.


