1. Introduction
The long-term moisture performance of exterior wall assemblies is a critical consideration for energy-efficient building envelopes. Designers and builders have many options in contemporary wood-frame wall construction for selecting materials such as exterior cladding, insulation, and vapor retarders. Consumer demand has grown for energy-efficient, high-performance buildings. Recent changes to model energy codes, particularly the 2012 International Energy Conservation Code (IECC) [
1], have increased minimum insulation levels and tightened air leakage requirements for all light-frame wood wall systems (relative to the 2009 IECC [
2]), and continuous exterior insulation may be an option or a requirement, depending on climate zone. With moisture performance increasingly becoming a concern and a design consideration, practical guidance is needed that will minimize the risk of moisture performance and durability problems in wood-frame buildings. Research-based design guidance is particularly needed as various industry groups are advocating specific wall design solutions based on incomplete information.
Climate characteristics must be considered in relation to wall system moisture performance. Mixed-humid climates, as defined by Lstiburek [
3] (and adopted by the U.S. Department of Energy [
4]), have the following characteristics: (1) more than 0.5 m (20 in.) of annual precipitation; (2) 3000 or fewer annual heating degree days (base 18 °C) (5400 or fewer annual heating degree days (base 65 °F)); and (3) an average monthly winter temperature below 7 °C (45 °F). The mixed-humid climate typically results in moisture migration from the building interior to exterior during winter and from the exterior to interior during summer. The moisture response of the building envelope depends on the local environmental conditions, such as wind-driven rain, solar radiation, temperature, and humidity, as well as interior moisture loads.
The need for vapor diffusion control depends on climate; in mixed-humid climates, outward vapor diffusion during winter is not as significant as in cold climates, so higher interior vapor permeance is recommended in mixed-humid climates, which also allows inward drying during summer [
3]. The International Residential Code (IRC) [
5], for example, does not require an interior vapor retarder in Climate Zone 4A. This is in accord with work by Karagiozis
et al. [
6], who evaluated vapor retarder recommendations for wood-frame wall systems using a calibrated hygrothermal model for a number of North American locations, including several mixed-humid climate locations. Wood-frame walls were simulated with either brick veneer or vinyl siding, building paper, OSB, glass fiber cavity insulation, and interior gypsum board with latex primer and paint. Four vapor retarder options were evaluated: polyethylene sheet, asphalt-coated kraft paper (a common facing on batt insulation), polyamide sheet (so-called “smart” vapor retarder, having vapor permeance that is dependent on relative humidity), and no vapor retarder. The vapor permeance of the interior latex primer and paint coating was selected as 460 ng/(Pa·s·m
2) (8 perms). In Climate Zone 4A locations, walls with polyamide film gave the best performance, followed by walls with kraft vapor retarder. For walls with no vapor retarder, simulated OSB moisture content (MC) did not exceed 16% for more than 30 days when interior humidity levels were low but did reach 18%–25% MC in some cases for more than 30 days when interior humidity levels were high. Although the study did not evaluate potential for mold growth, it can be noted that wood moisture content exceeding 20% has traditionally been considered potentially at risk for decay [
7].
Measured values of the vapor permeance of gypsum board with interior latex primer and paint vary. Values listed for paint films and for gypsum board with one coat of primer and two coats of latex paint are less than 570 ng/(Pa·s·m
2) (10 perms) below 60% relative humidity [
8,
9]. The IRC [
5] considers latex paint a Class III vapor retarder, having a dry cup vapor permeance in the range from 57 to 570 ng/(Pa·s·m
2) (1 to 10 perms). However, several studies have measured considerably higher values [
10,
11,
12]. This suggests that interior gypsum board with latex primer and paint might not reliably provide sufficient vapor diffusion resistance to avoid moisture accumulation, particularly when interior humidity levels are high. The emphasis here on vapor diffusion should not be taken in isolation: Air leakage has long been recognized as a more important mechanism for water vapor transfer than vapor diffusion [
13,
14,
15]. Nonetheless, moisture control strategies need to address both mechanisms.
Although moisture performance of conventional wood-frame building envelopes has been studied extensively in North America since the 1940s [
16], such research on wall assemblies with increased insulation levels is limited to the past five years. For this article, “conventional” walls are considered to have cavity insulation of 140 mm depth (nominal 2 × 6) in cold climates and 89 mm depth (nominal 2 × 4) in mixed-humid climates; “energy-efficient” walls have higher insulation levels than conventional walls. Various methods of constructing energy-efficient walls have been in use since the 1970s, such as double-stud and truss walls; more recent variations include wood-frame walls with continuous exterior rigid insulation. Monitoring studies investigating moisture conditions in energy-efficient wood-frame wall assemblies have recently been conducted in cold climates [
17,
18,
19,
20,
21,
22] and marine climates [
23]. In some cases, studies examined the response to controlled levels of air leakage or controlled wetting by liquid water. A recent study [
24] monitored energy-efficient walls in 22 houses located in six different climate zones. Before this study, data were lacking for energy-efficient walls in mixed-humid climates. Prior moisture research on conventional wood-frame walls in mixed-humid climates is minimal [
16], comprising a survey of occupied houses in the 1960s and a few exploratory studies in the 1940s and 1970s. More recently, conventional wood-frame wall assemblies with a range of cladding materials have been monitored in test structures near Washington, DC [
12,
25,
26]; the present study builds on this work.
The project described here involves monitoring of exterior wall assemblies with specific design characteristics installed in two test structures on the campus of Home Innovation Research Labs, located in Upper Marlboro, MD, approximately 30 km east of Washington, DC (IECC Climate Zone 4A). The overarching goal of this research is to identify design and construction practices for durable exterior wood-frame walls in a mixed-humid climate. Six configurations of energy efficient walls are studied: four with exterior rigid foam insulation installed over oriented strand board (OSB) structural panel sheathing, with the study variables including different levels of cavity insulation and types of water-resistive barrier; and two with 38 mm × 140 mm (nominal 2 × 6) framing with different interior vapor retarders (kraft-facing
vs. gypsum with interior paint only). In addition, six conventional 38 mm × 89 mm (nominal 2 × 4) wood-frame wall systems with varying cladding materials including stucco, manufactured stone, vinyl siding, brick, and fiber cement siding are monitored to provide continuity with previous work [
12,
25,
26]. Specifically, the impact of the interior vapor retarder on the performance of these conventional systems is evaluated under elevated levels of interior relative humidity. Cedar siding is added in the present monitoring phase to expand the range of cladding systems. Additionally, the study evaluates the capability of hygrothermal modeling software to predict the moisture performance of various wall systems under known climatic conditions.
2. Experimental Methods
2.1. Description of Test Structures
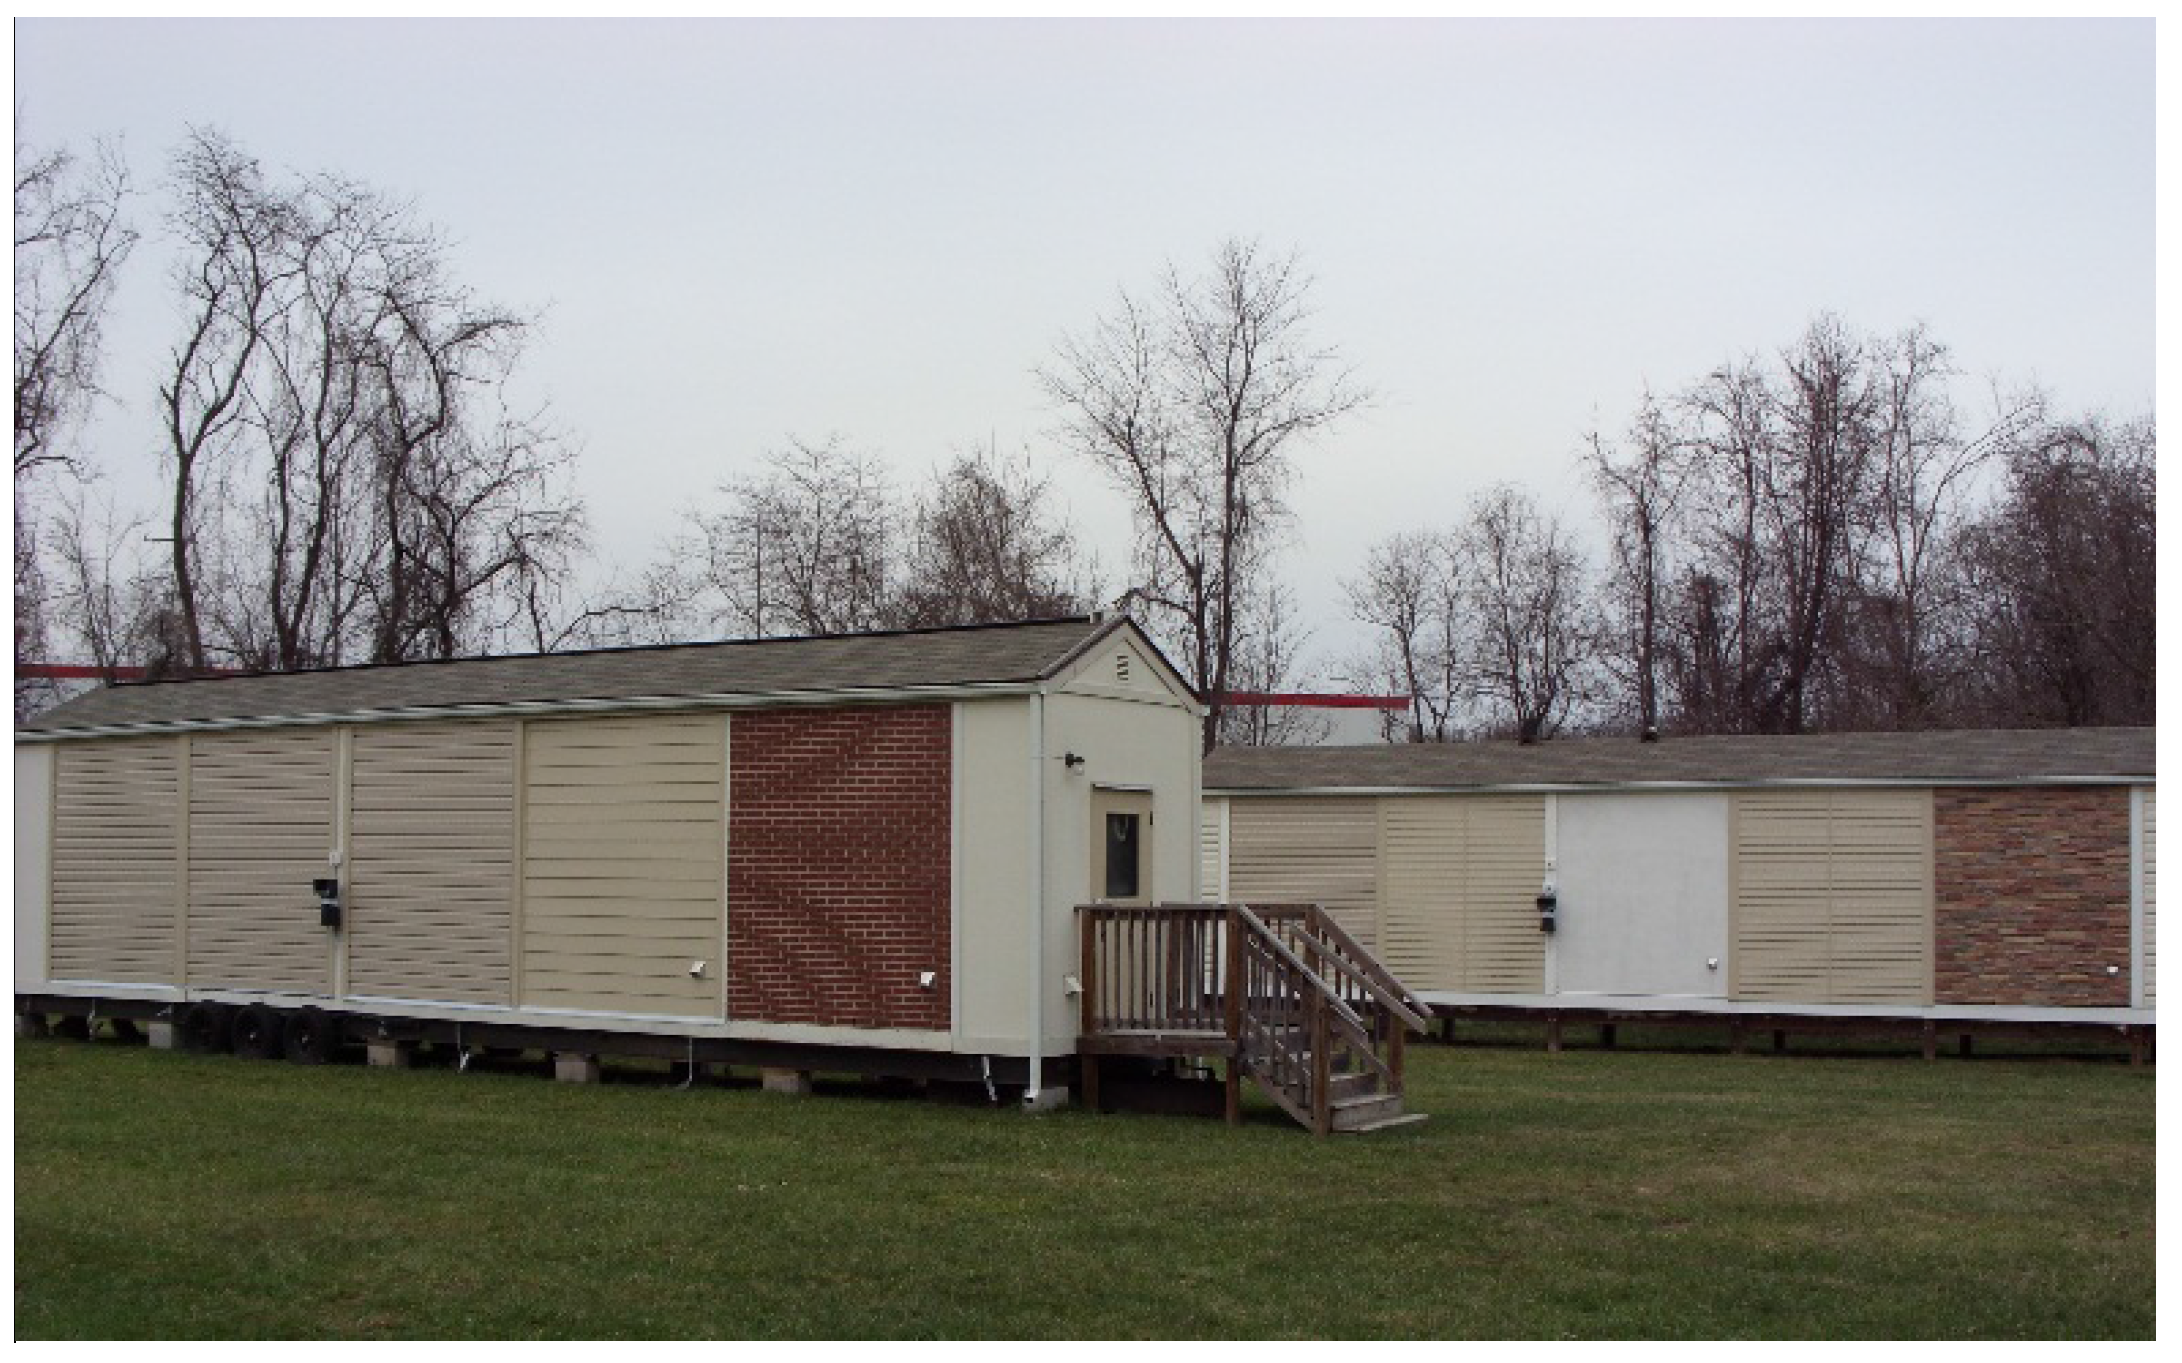
Two outdoor test structures (depicted in
Figure 1) have been in use since 2008 on the campus of Home Innovation Research Labs (formerly NAHB Research Center), located in Upper Marlboro, Maryland, approximately 30 km east of Washington, DC (IECC Climate Zone 4A). Each structure has a nominal footprint of 2.4 m × 14.6 m (8 ft × 48 ft), and each long side features five pairs of 2.4 m (8 ft) wide by 2.7 m (9 ft) high bays for installation of test wall sections. The structures are oriented with the long axis aligned east to west. Wall assemblies are tested in pairs with each wall configuration in north- and south-facing orientation.
In both structures the underside of the floor joists is approximately 0.75 m (2.5 ft) above grade and insulated with 160 mm (6.25 in.) glass fiber batt insulation. The roof is shingled on 4/12 pitch trusses (slope of 18.4°) and insulated with 230 mm (9 in.) glass fiber batt insulation at the attic-ceiling interface. The roof overhang is limited to a 100 mm (4 in.) gutter leading to appreciable exposure of test walls to the elements. One door is installed on the east-facing end wall of each structure with a window on the west-facing end wall.
Figure 1.
Test structures showing south-facing wall assemblies.
Figure 1.
Test structures showing south-facing wall assemblies.
2.2. Interior and Exterior Conditions
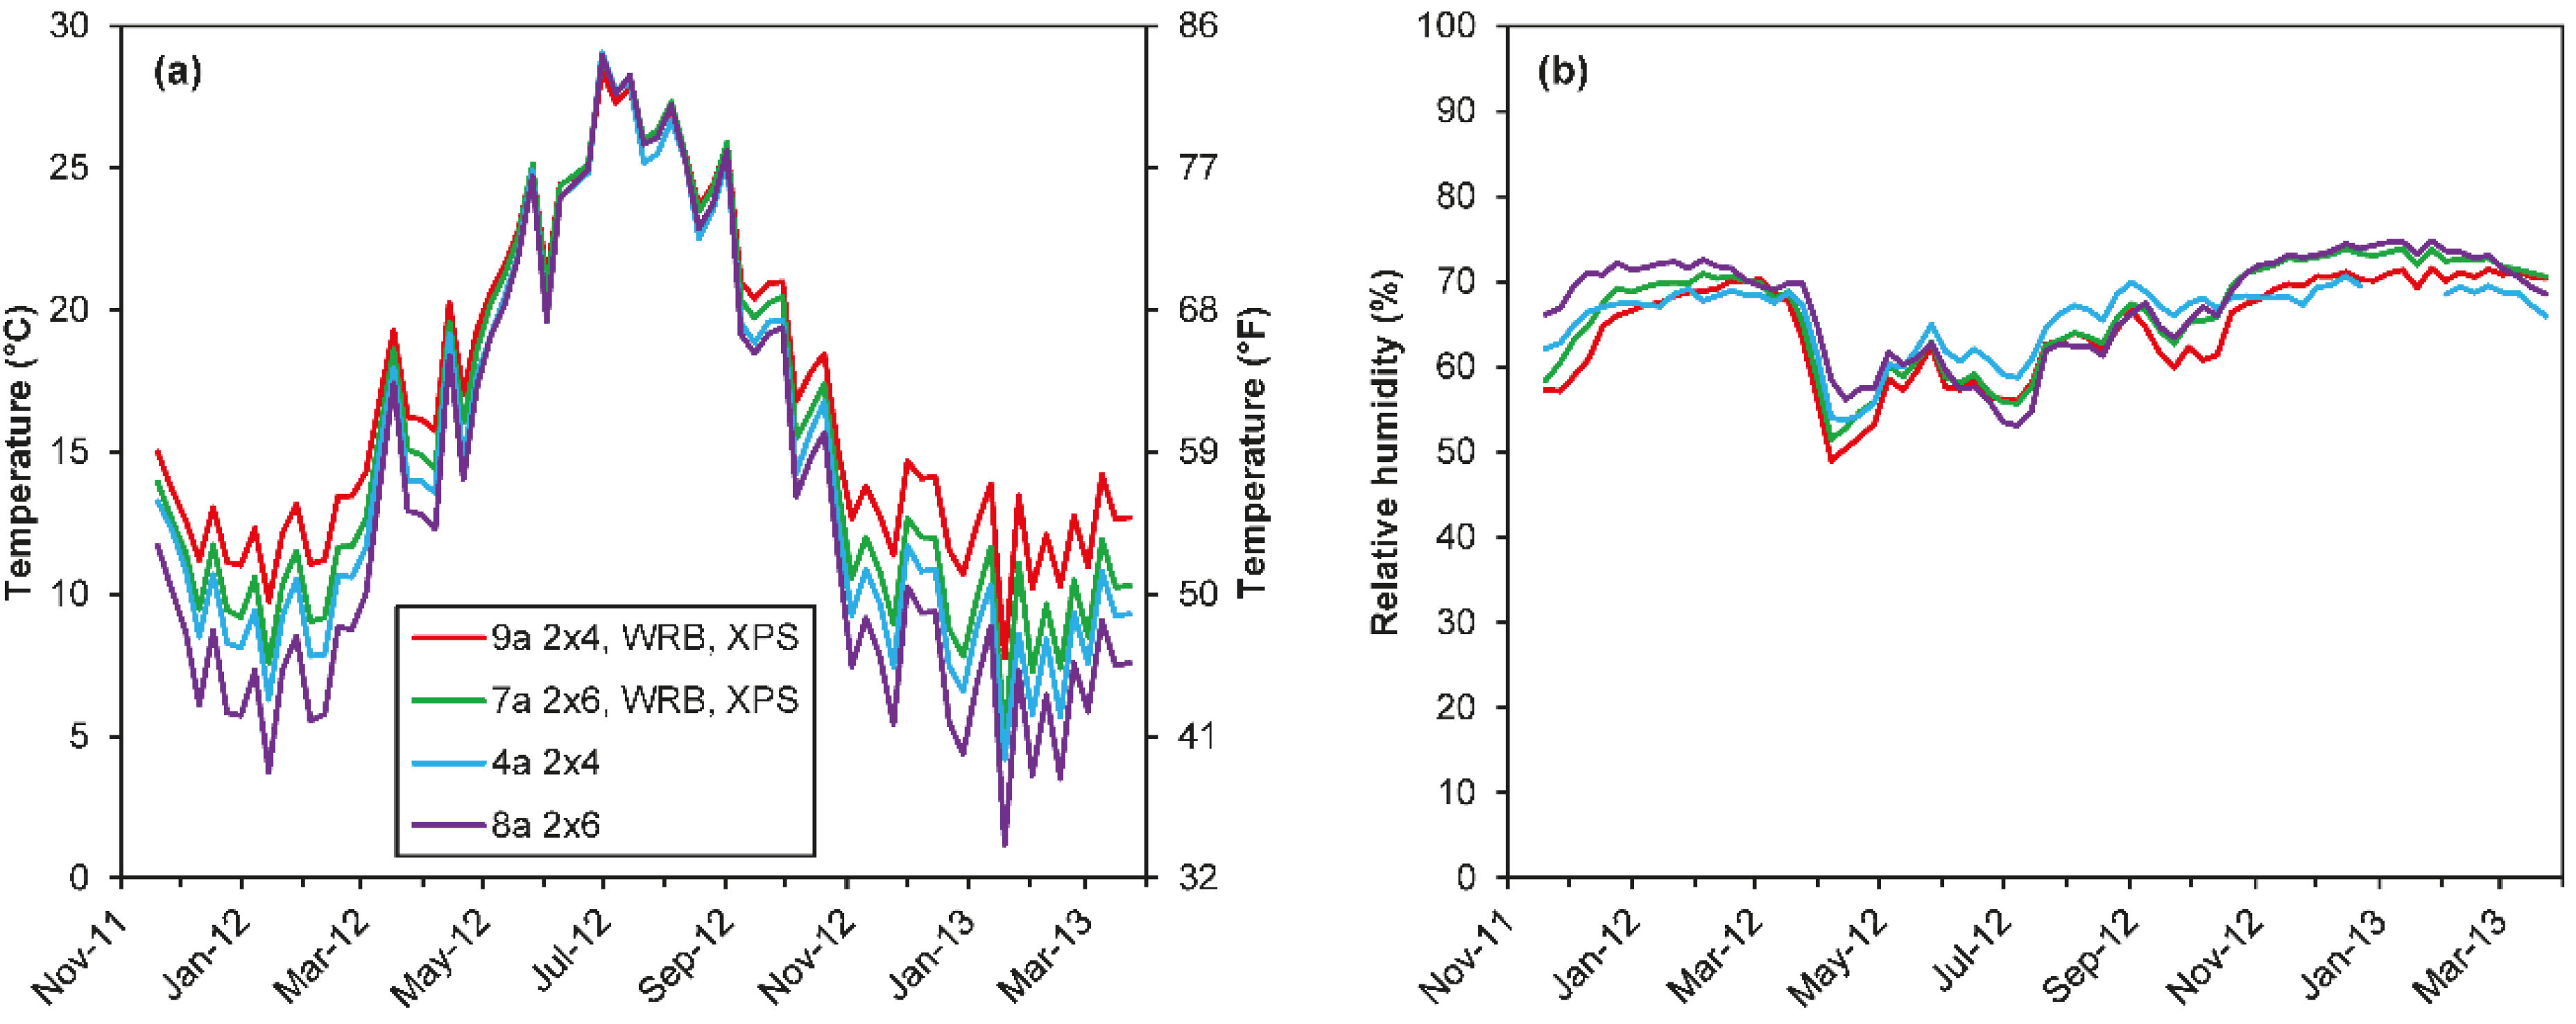
Interior temperatures within the test structures were maintained using portable air conditioners during summer, in the range 25.6–26.7 °C (78–80 °F), and using electrical resistance heating during winter, in the range 21.1–22.2 °C (70–72 °F). Each test structure included six type-T thermocouples and two probes measuring temperature and relative humidity.
Interior relative humidity (RH) was maintained using humidifiers during the heating season at a moving set point calculated as a function of the daily average exterior temperature (
Figure 2a), an adaptation of the Simplified Method for Indoor Design Humidity in ASHRAE Standard 160–2009 [
27]. The probes used to monitor interior temperature and RH included capacitance-type humidity sensors, accurate within 2% from 0% to 98% RH. Target and measured interior RH levels are depicted in
Figure 2b. The average interior relative humidity over the two winters was 55% RH. This value is considerably higher than typical levels in residential buildings in this climate. By comparison, winter average values in five houses in Maryland and Delaware (same climate zone 4A) were between 31% and 48% [
24]. The winter average in 10 houses in Knoxville, Tennessee (also 4A), was 40% (with a standard deviation of 8%) [
28]. The rationale for maintaining such indoor RH levels was to stress the wall assemblies with a high interior moisture load; differences in moisture conditions between wall configurations may not be evident with low or typical interior humidity levels [
29]. The interior RH levels from April to September were considerably lower than target values because the humidifiers were turned off; interior RH levels were then dependent on exterior vapor pressure, air exchange rates, and dehumidification as a result of air-conditioner operation. The difference between interior and exterior vapor pressures is shown in
Figure 2c. The vapor drive is outward during the heating season and inward during the cooling season.
Figure 2.
(a) Target interior relative humidity as a function of outdoor temperature; (b) Target and measured monthly average interior relative humidity over the monitoring period; (c) Difference between monthly average interior and exterior water vapor pressure over the monitoring period.
Figure 2.
(a) Target interior relative humidity as a function of outdoor temperature; (b) Target and measured monthly average interior relative humidity over the monitoring period; (c) Difference between monthly average interior and exterior water vapor pressure over the monitoring period.
A weather station was mounted on the roof of one test structure. The station included an anemometer to measure wind speed and direction, a temperature and humidity sensor, a tipping-bucket rain gauge, and a horizontally installed spectral pyranometer to measure solar radiation. Vertically positioned spectral pyranometers were installed on the north and south walls of the test hut to better understand the conditions at the wall surface.
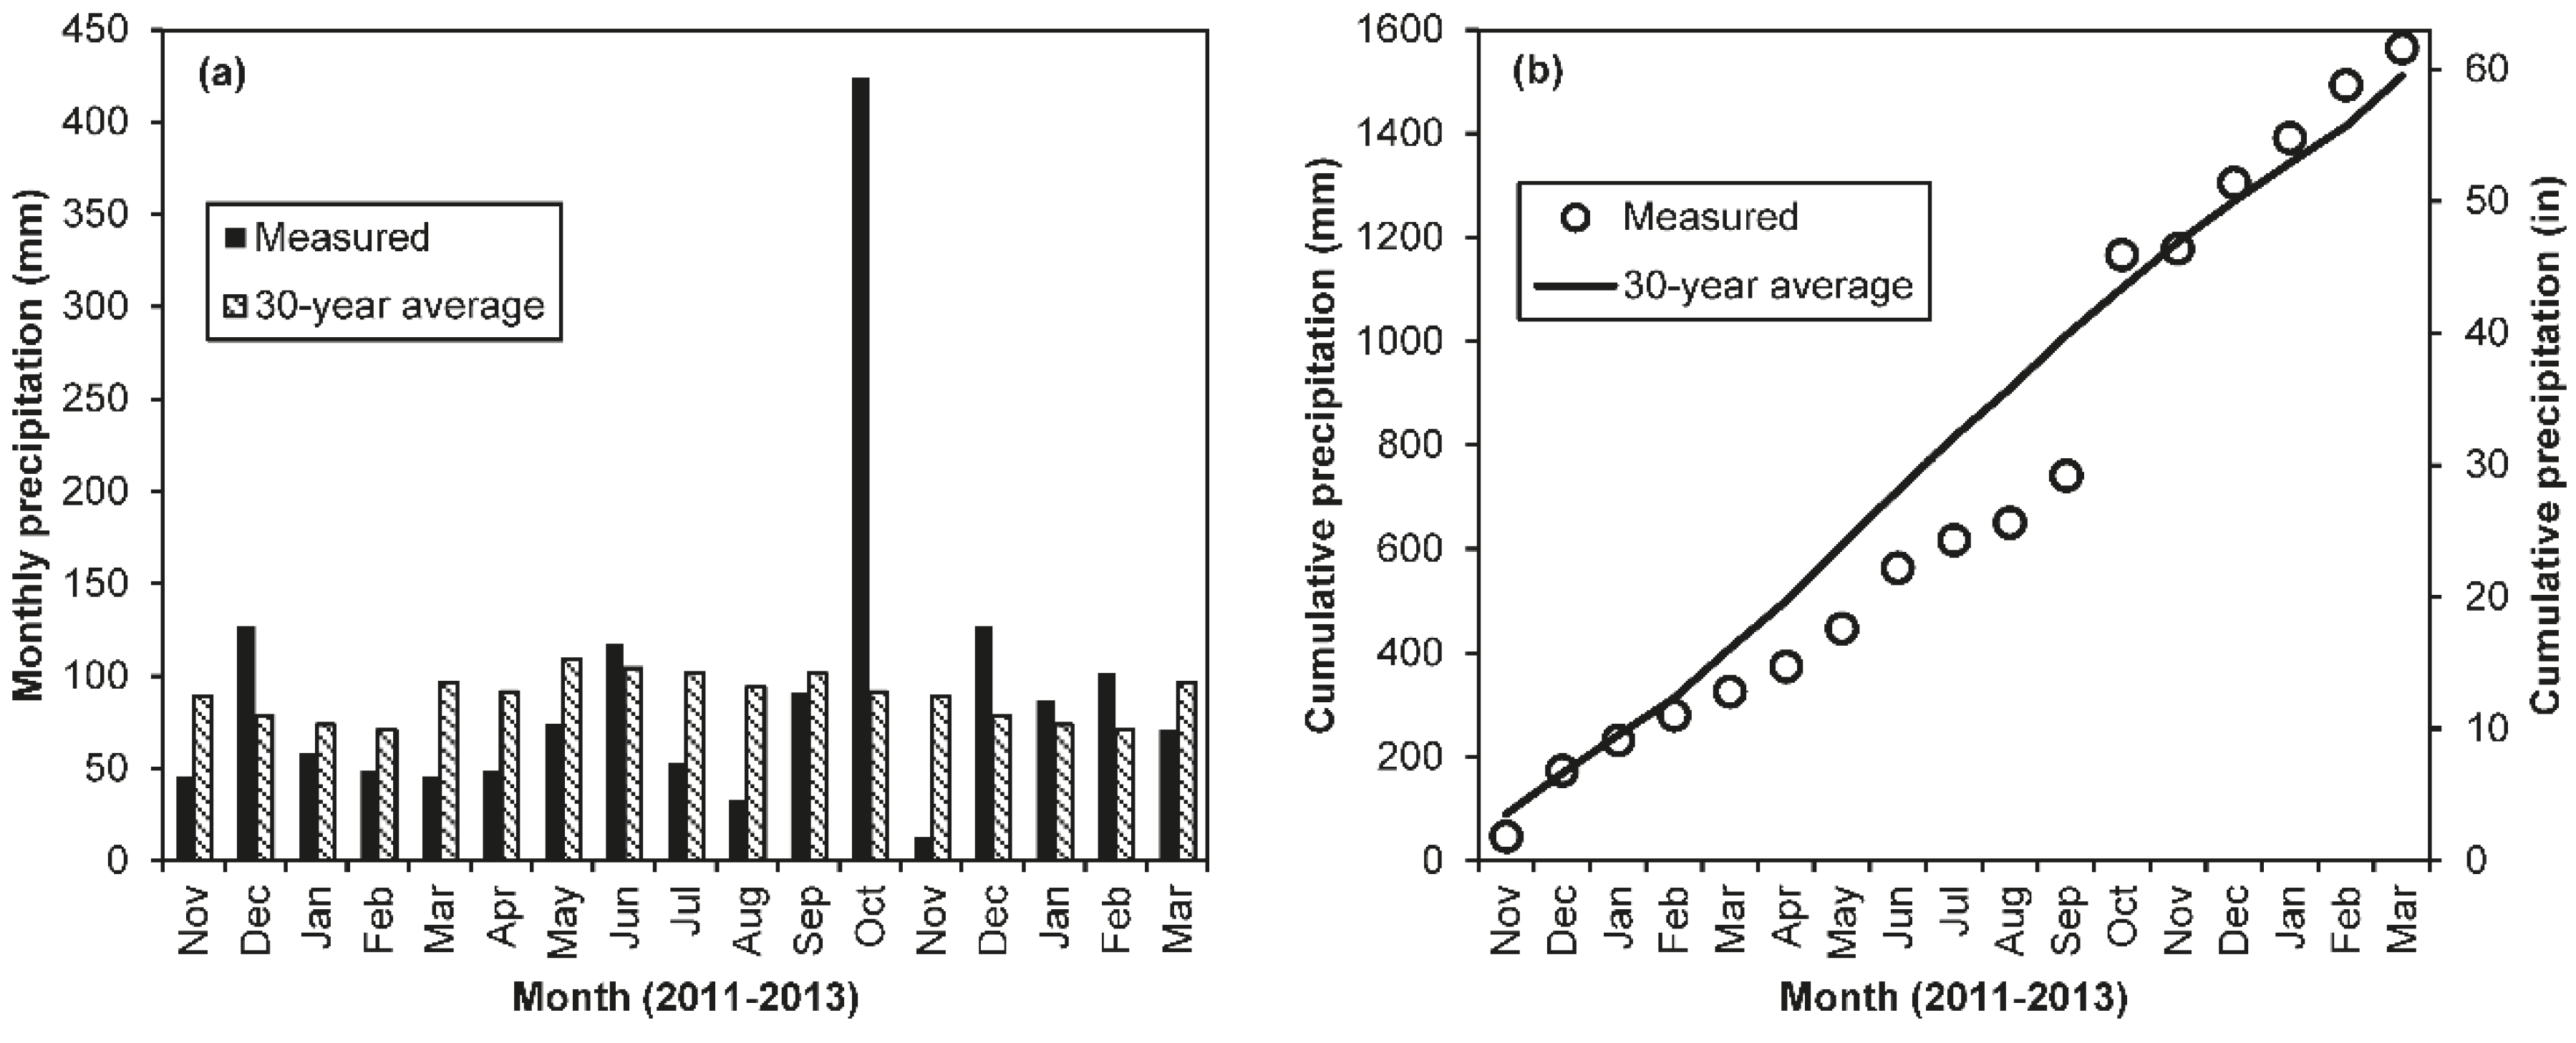
Exterior temperature and precipitation measured onsite are depicted in
Figure 3 and
Figure 4, and are compared with 30-year average values from Andrews Air Force Base, located roughly 15 km (10 mi) from the site. All months were warmer than the historical average except November 2012 and March 2013 (
Figure 3). Although precipitation measured onsite varied significantly from historical average values on a monthly basis (
Figure 4a), cumulative precipitation measured over the monitoring period (1565 mm (61.6 in.)) was similar to the sum of historical monthly average data (1511 mm (59.5 in.);
Figure 4b). Rainfall in the wake of Hurricane Sandy contributed to the anomaly in October 2012. However, OSB moisture content measurements reported below did not indicate any definitive increase following the high rainfall.
Figure 3.
Monthly average exterior temperature measured onsite compared with 30-year average values.
Figure 3.
Monthly average exterior temperature measured onsite compared with 30-year average values.
Figure 4.
Precipitation measured onsite compared with 30-year average values: (a) Monthly total precipitation; (b) Cumulative precipitation over the monitoring period.
Figure 4.
Precipitation measured onsite compared with 30-year average values: (a) Monthly total precipitation; (b) Cumulative precipitation over the monitoring period.
2.3. Wall Configurations
Nine primary wall configurations were monitored (
Table 1). Each assembly was duplicated in north and south orientations. Cladding systems included manufactured stone veneer, stucco, cedar siding, vinyl siding, brick veneer, and fiber cement siding; these are described in further detail below. Each primary wall configuration included a subcategory designated in the matrix by (a) or (b) to study the specific effect of one of the assembly features: cladding, water-resistive barrier (WRB), or interior vapor retarder. Wall assemblies were constructed with either 38 mm × 89 mm (nominal 2 × 4) or 38 mm × 140 mm (nominal 2 × 6) softwood lumber framing, in all cases with studs spaced 0.4 m (16 in.) on center and with single bottom plates and double top plates. All assemblies had structural panel sheathing consisting of 11 mm (7/16 in.) oriented strand board (OSB) on the exterior of the framing and 12.5 mm (1/2 in.) interior gypsum board, which was finished with a latex primer and two rolled-on coats of latex paint. Cavity insulation was glass fiber batt insulation in all cases, either with kraft facing or no facing; nominal thermal resistance was 2.3 m
2·K/W (13 h·ft
2·°F/Btu) for 89 mm (3.5 in.) thickness and 3.7 m
2·K/W (21 h·ft
2·°F/Btu) for 140 mm (5.5 in.) thickness.
Table 1.
Test wall configurations.
Table 1.
Test wall configurations.
| Label | Cladding | Exterior CI a | WRB b | Cavity Depth | Vapor Retarder |
|---|
| 1 | a | Manufactured stone veneer | None | 2 layers #15 felt | 89 mm | Kraft facing |
| b | None |
| 2 | a | Portland cement stucco | None | 2 layers #15 felt | 89 mm | Kraft facing |
| b | None |
| 3 | a | Solid cedar siding c | None | Corrugated SBPO d | 89 mm | Kraft facing |
| b | Finger-jointed cedar siding c |
| 4 | a | Vinyl siding | None | Conventional SBPO | 89 mm | Kraft facing |
| b | None |
| 5 | a | Brick veneer e | None | Conventional SBPO | 89 mm | Kraft facing |
| b | None |
| 6 | a | Fiber cement siding | None | Conventional SBPO | 89 mm | Kraft facing |
| b | None |
| 7 | a | Vinyl siding | XPS f | Corrugated SBPO | 140 mm | Kraft facing |
| b | Taped XPS joints |
| 8 | a | Vinyl siding | None | Conventional SBPO | 140 mm | Kraft facing |
| b | None |
| 9 | a | Vinyl siding | XPS | Corrugated SBPO | 89 mm | Kraft facing |
| b | Taped XPS |
Wall sections were separated by structural posts. On the exterior, the posts were covered with trim pieces to separate the different cladding systems (
Figure 1). On the interior, gypsum board was installed with two sheets per wall section and one vertical taped seam. The gypsum board was caulked to the posts at each side and to the beam at the top edge. The bottom edge of the gypsum board was raised about 13 mm (1/2 in.) from the floor and not caulked or sealed, as is typical in common practice.
Manufactured stone veneer was cast concrete composed of Portland cement, aggregate, and pigments. Type S mortar mix was used for the scratch coat and grout. The stone was darker in color than the other claddings with the exception of brick veneer. The thickness of the stone varied between 25 mm (1 in.) and 67 mm (2.6 in.).
The stucco cladding was constructed with a Portland cement-based material that was designed to be both a scratch and finish coat. Final stucco thickness varied between 13 mm (1/2 in.) and 16 mm (5/8 in.). The Portland cement-based stucco was placed over ASTM D226 compliant [
30] No. 15 felt and wire lath. The felt was stapled to the sheathing with 9.5 mm (3/8 in.) length and 25 mm (1 in.) crown staples; the wire lath was stapled using 12.7 mm (1/2 in.) crown and 19 mm (3/4 in.) length staples at 0.4 m (16 in.) on center.
The stucco-clad wall assembly was not constructed according to Section R703.6.3 of the 2009 IRC [
5], which requires two layers of Grade D paper. However, it did have two layers of ASTM D 226 [
30] Type 1 felt (No. 15 felt paper). The two materials differ primarily in vapor permeance: Grade D paper has a permeance in excess of 570 ng/(Pa·s·m
2) (10 perms), whereas No. 15 felt usually has a permeance of around 290 ng/(Pa·s·m
2) (5 perms). The felt used in the test, however, had a wet cup permeance of over 740 ng/(Pa·s·m
2) (13 perms). Some jurisdictions have amended Section R703.6.3 to include No. 15 felt as being acceptable under Portland cement exterior claddings. With this construction, the inner layer of felt functions as the drainage plane while the outer layer bonds to the stucco and thus is unable to function effectively as a drainage plane.
The cedar siding was 150 mm (6 in.) factory-primed planks attached to 19 mm (3/4 in.) thick by 38 mm (1.5 in.) wide vertical furring strips over the WRB. It is noted that the wall specimens were inset into the Test Hut such that there was no ventilation opening at the top or bottom of the cladding interface. The cedar siding was finished with two coats of acrylic flat paint. All site-cut edges were hand-primed prior to installation with latex primer. Siding planks were hand-nailed using stainless steel ring-shank nails (the edge nails were installed into pre-drilled holes). The 150 mm (6 in.) planks were overlapped by 32 mm (1.25 in.). Every second row of siding included a butt joint that was not caulked. Flashing was used only below the starter strip, and caulking was placed only on the vertical trim. This exterior cladding was subdivided into two halves: finger jointed planks and solid planks.
Vinyl siding was chosen for comparison because it is the most frequently installed cladding on new single-family houses in the U.S. [
31]. Furthermore, due to its non-absorptive properties, its performance was expected to contrast with the absorptive cladding systems investigated on the other wall panels. The siding in Walls 4 and 8 was installed directly over a single layer of spun-bonded polyolefin (SBPO) WRB, representative of common vinyl siding installation practices in the United States. In Walls 7 and 9, the siding was nailed through the exterior extruded polystyrene (XPS) rigid foam insulation into the framing members. For configurations 7a and 9a, a corrugated (“drainage”) house wrap was installed between the OSB sheathing and XPS insulation. For configurations 7b and 9b, house wrap was not installed and the exterior XPS joints were taped to provide a drainage plane.
The brick veneer wall was constructed with a 25 mm (1 in.) air cavity behind the brick. A 13 mm (1/2 in.) slot at the top of the wall allowed the air space to vent into the attic. The nominal 100 mm (4 in.) bed depth brick was laid in Type N masonry cement mortar. Flashing was installed under the first course of brick, and open head joint weep holes were installed at 0.6 m (24 in.) on center immediately above the flashing.
Factory-primed 150 mm (6 in.) fiber cement planks were installed directly over a single layer of SBPO WRB with face nails into the framing (no furring strips or ventilation openings). Only the vertical trim was caulked. The siding was finished with two coats of latex primer and acrylic latex semi-gloss exterior paint.
2.4. Laboratory Material Property Measurements
Laboratory tests were conducted to measure water vapor permeance and density of the materials used in construction of the test wall sections. The measured properties were also used as inputs for hygrothermal modeling (
Section 4). All materials were taken from the same batch of the product that was used to construct wall assemblies. Test methods for water vapor transmission included the desiccant method (dry cup) and the water method (wet cup) of ASTM E96 [
32]. For both methods, the environmental chamber was set at 23 °C (73 °F) and 50% RH. Specimens were cut to 180 mm × 180 mm (7 in. × 7 in.); edges were sealed with foil tape and then sealed to a metal dish with wax. Three specimens of each material were tested. Density of each specimen was determined gravimetrically with volume calculated from measured dimensions [
33].
Measured property values (
Table 2) for most materials were in general concurrence with published values [
8,
9]. However, our measured vapor permeance of gypsum board with one coat of primer and two coats of latex paint are substantially higher than the values listed by ASHRAE [
8] for paint films, or by Kumaran
et al. [
9] for gypsum board with one coat of primer and two coats of latex paint. Our measured permeance is also considerably higher than the value assumed by the IRC [
5] of less than 570 ng/(Pa·s·m
2) (10 perms). This study is not, however, the first to measure higher values [
10,
11]. Our measured values are similar to those reported by Drumheller and Carll [
12]. For asphalt-coated kraft paper, the observed increase in permeance from dry cup to wet cup is consistent with literature values, and the measured values are intermediate between those of Gatland [
34] and Burch
et al. [
35]. Literature data for permeance of OSB, while spanning a considerable range, generally exhibit an increase in vapor permeance with increasing RH [
36]; however, the opposite trend is observed in the measured dry cup and wet cup values here. The reason for this anomaly is unknown.
Table 2.
Measured material properties.
Table 2.
Measured material properties.
| Material | Thickness, mm (in.) | Density, kg/m3 (lb/ft3) | Vapor Permeance, ng/(Pa·s·m2) (perms) |
|---|
| Dry Cup | Wet Cup |
|---|
| Interior gypsum board | 12.4 (0.489) | 500 (31) | 2800 (49) | 2600 (45) |
| Interior gypsum board, one coat primer and two coats latex paint | 12.5 (0.493) | - | 2000 (35) | 2000 (35) |
| Asphalt-coated kraft paper | 0.2 (0.007) | 580 (36) | 33 (0.6) | 60 (1.0) |
| Oriented strand board | 11.0 (0.435) | 680 (42) | 110 (2.0) | 80 (1.4) |
| Conventional spun-bonded polyolefin | 0.1 (0.004) | 540 (34) | 3000 (52) | 2500 (44) |
| Corrugated spun-bonded polyolefin | 0.1 (0.004) | 690 (43) | 3000 (53) | 2600 (45) |
| Extruded polystyrene | 24.9 (0.979) | 27 (1.7) | 61 (1.1) | 57 (1.0) |
| Cedar | 4.4 (0.173) | 336 (21) | 120 (2.1) | 570 (10) |
| Cedar, one coat primer and two coats paint | 4.6 (0.182) | - | 35 (0.6) | 190 (3.2) |
2.5. Wall Moisture Content Measurements
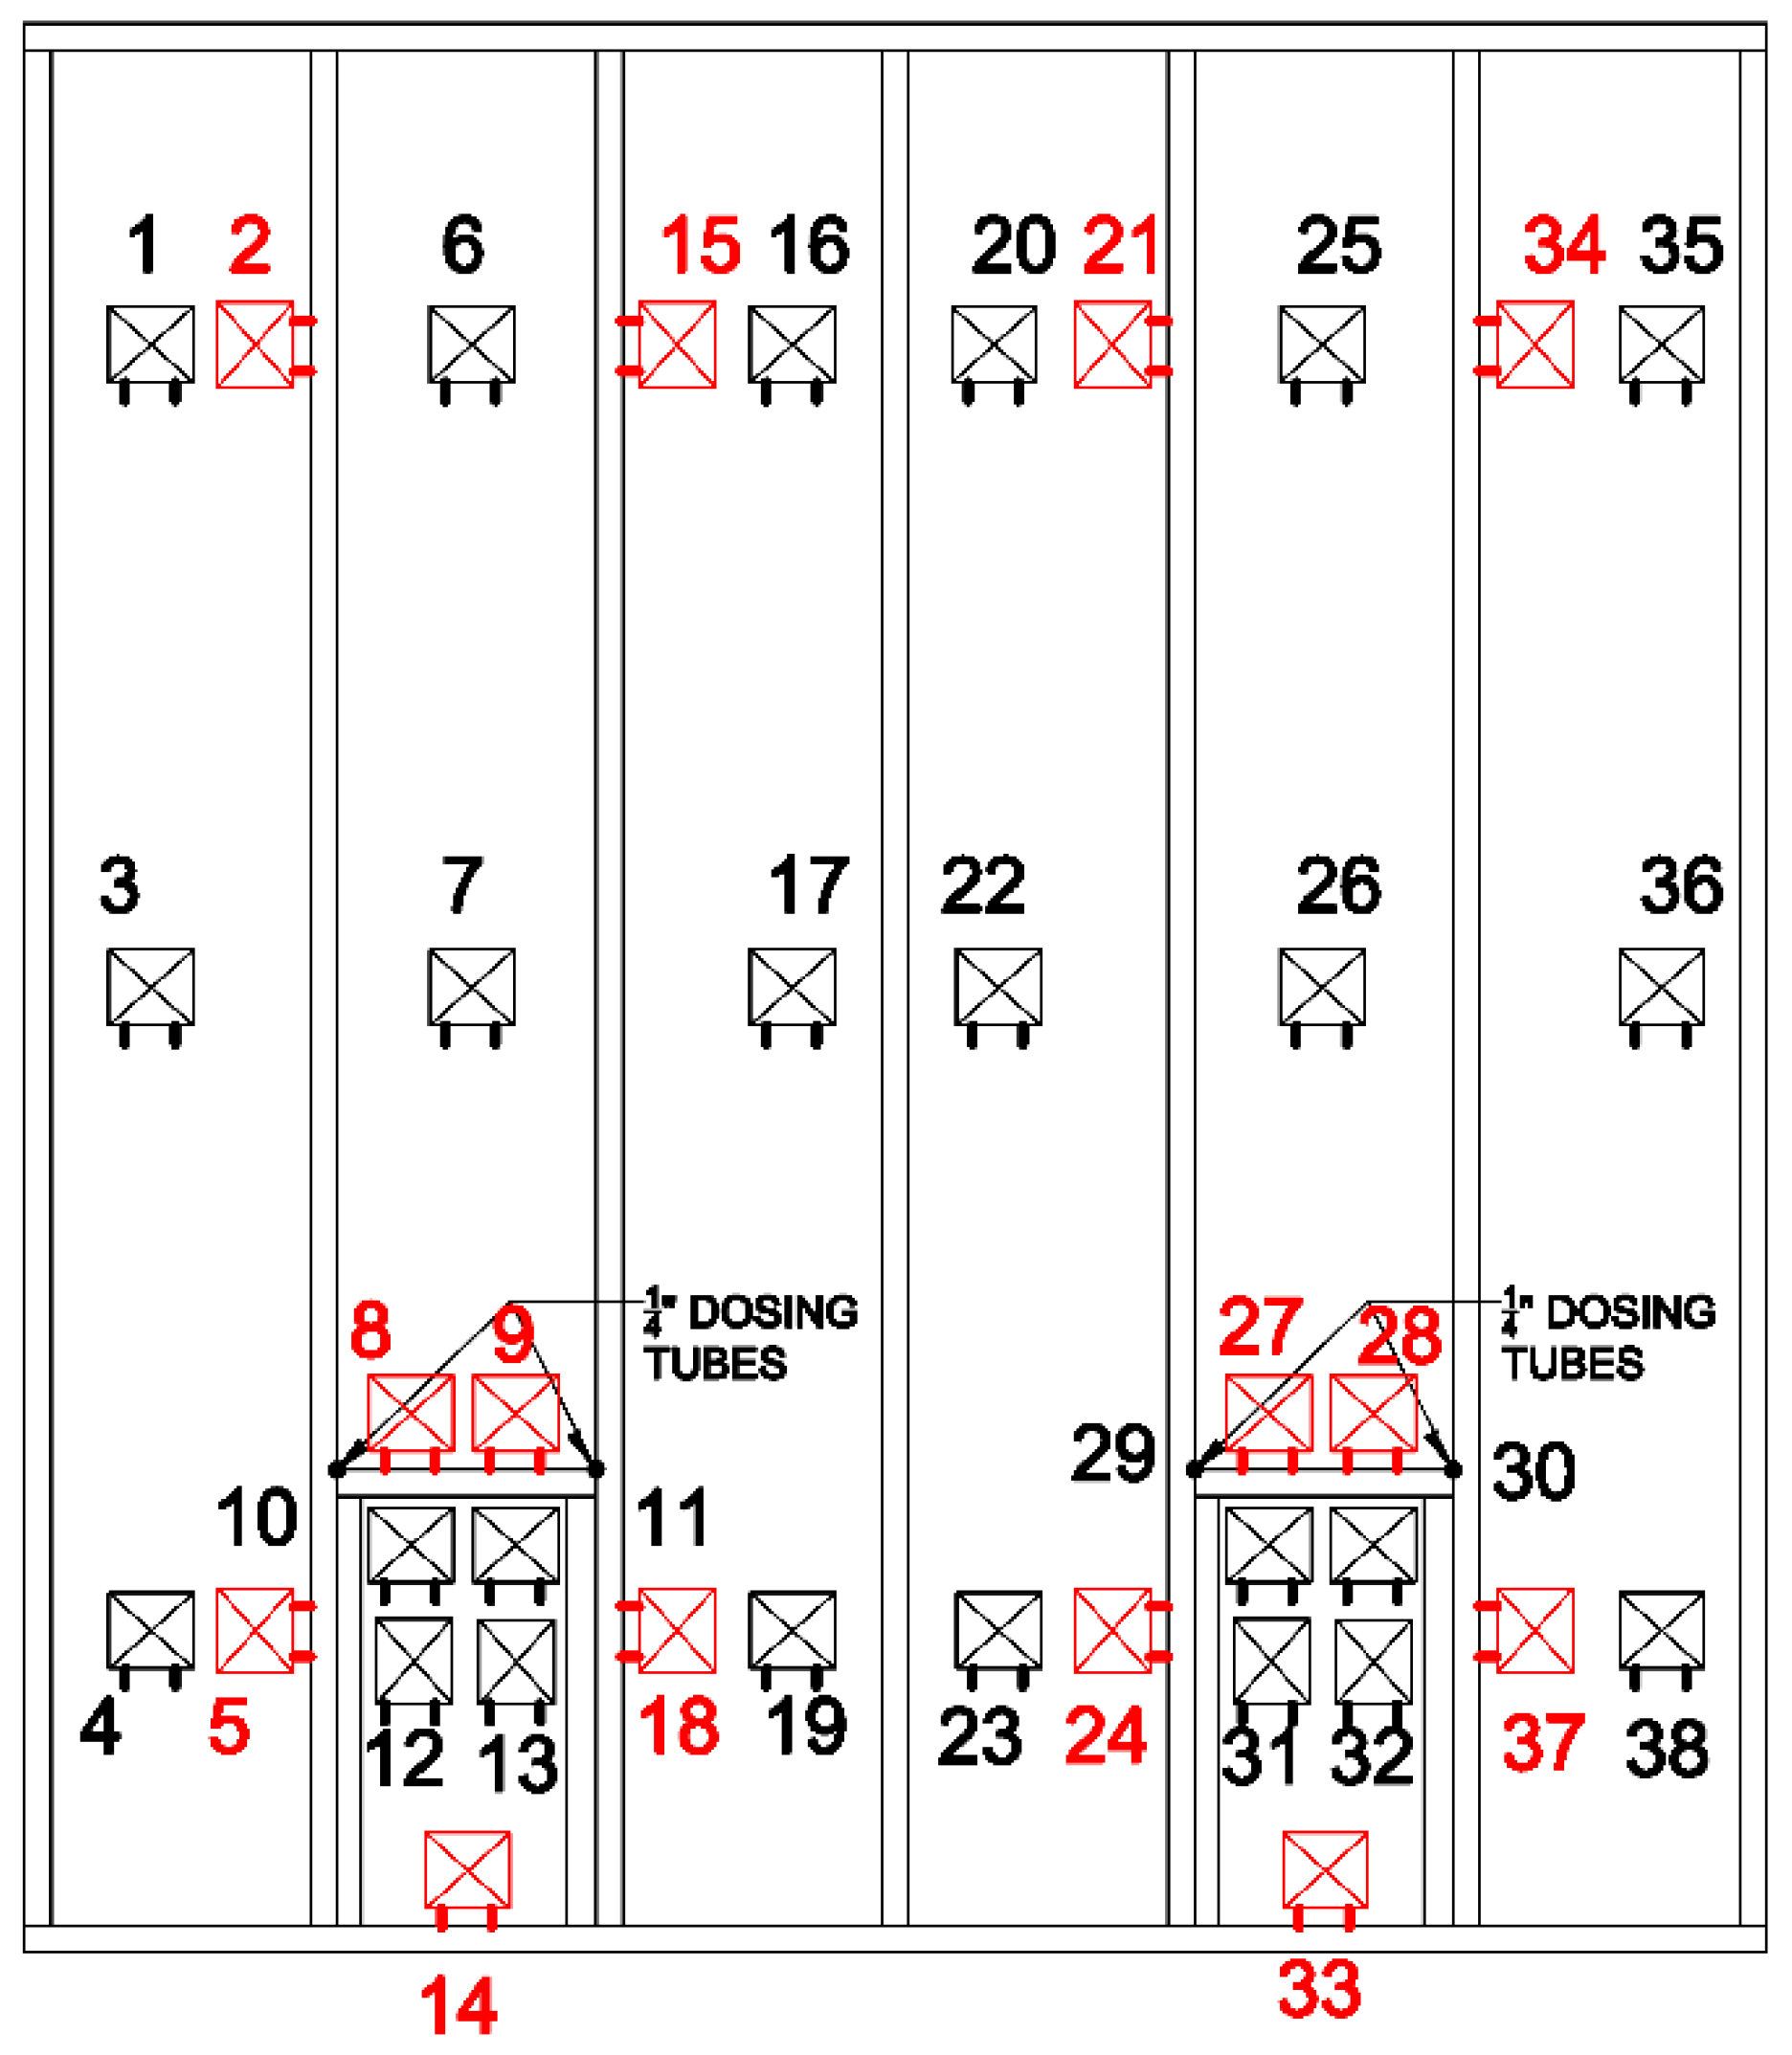
Each wall section had about 40 wireless sensors installed (
Figure 5) that measured temperature, relative humidity, and wood moisture content at programmable time intervals (set to 30 min) [
12]. Each sensor includes two 50 mm (2 in.) uninsulated stainless steel screws that secure it to wood framing or OSB sheathing. The screws penetrate the wood member by 10 mm (0.4 in.) to obtain an electrical conductance reading related to substrate moisture content. The sensors have a moisture content measurement range (initially calibrated to Douglas fir) of 7% to 40% MC; a temperature range of −40 °C to 85 °C (−40 °F to 185 °F), and a relative humidity range of 0% to 100%. Data were transmitted wirelessly from the sensors every 30 min to a local gateway that periodically transmitted the data by Internet to a server maintained by the sensor manufacturer.
Figure 5.
Typical sensor layout for 2.4 m (8 ft) wide by 2.7 m (9 ft) high wall section.
Figure 5.
Typical sensor layout for 2.4 m (8 ft) wide by 2.7 m (9 ft) high wall section.
The sensor accuracy for temperature was ±0.4 °C (±0.7 °F) and for relative humidity was ±3.5% RH. All moisture content readings were gravimetrically calibrated to wood framing and OSB (inclusive of resin mass) at room temperature. For OSB the maximum moisture content the sensors could read was about 25% MC. The calibration resulted in corrected sensor readings with a measurement uncertainty of about ±2% MC at room temperature. The manufacturer provided temperature compensation of the conductance readings obtained from the screw electrodes based on Douglas fir (temperature compensation for OSB is not known). The temperature reading that was used for compensation was, however, taken at a location within the sensor housing separated from the screw tips by roughly 35 mm (1.4 in.). Cavity insulation was installed over the sensor such that there was an air pocket between the sensor and the OSB sheathing. For conductance readings taken in sheathing, the temperature compensation may have been less than ideal. For comparison, a temperature offset of 6 °C (10 °F) would translate into a moisture content offset typically of less than 1% MC for Douglas fir [
37]. The air pockets between sensors and OSB sheathing may also have permitted air convection.
4. Hygrothermal Simulation Approach
The test wall assemblies described above were simulated using WUFI
® Pro 5.2 Software (Fraunhofer Insitute for Building Physics, Holzkirchen, Germany) for one-dimensional transient heat and moisture transfer [
38,
39] (“WUFI” stands for wärme und feuchtetransport instationär, German for “transient heat and moisture transport”). This software has been used extensively in North America for simulation of wood-frame wall assemblies [
18,
36,
40,
41,
42,
43,
44,
45,
46,
47]. One-dimensional hygrothermal simulations are often used by practitioners in North America for building envelope design analysis. In such cases actual material properties are not known with precision ahead of time, and practitioners rely on material properties from the literature or databases incorporated into simulation software. One objective of running these simulations was to evaluate the ability of the hygrothermal simulations to capture the observed differences between north- and south-facing walls and between walls with and without a kraft vapor retarder, particularly with elevated indoor humidity levels during winter using mainly generic material properties. Measured interior and exterior conditions and some select measured material properties were used as available. This was not a model validation exercise because the project scope did not allow for full measurement of all model input parameters. A second objective of running the simulations was to investigate the reliability of interior latex primer and paint on gypsum board for vapor diffusion control in this climate. Model parameters are described below.
4.1. Wall Configurations
Wall configurations are listed in
Table 1. Each configuration was modeled as a multi-layer assembly, taking a one-dimensional section through the insulated cavity (rather than the framing). Each configuration was simulated in both north-facing and south-facing orientations.
4.2. Material Properties
Material properties for most materials were assigned from the WUFI North America Database [
38]. Many of the properties in this database are taken from the work of Kumaran
et al. [
9]. Property values used in the simulations are tabulated in the
Supplementary Materials. Certain material properties were adjusted based on measured values (
Table 2) as indicated in the
Supplementary Materials.
Interior primer and paint layers on gypsum board were modeled as an interior surface diffusion resistance based on measured permeance values. Exterior primer and paint layers on cedar siding and fiber cement siding were modeled as a single layer having an RH-dependent vapor permeance curve calculated from the difference between measurements on uncoated cedar and cedar with exterior primer and paint (
Table 2).
Thermal resistance values of insulation materials in the simulations were equivalent to typical nominal values at 24 °C (75 °F). R-values of glass fiber insulation were 2.3 m2·K/W (13 h·ft2·°F/Btu) for 89 mm (3.5 in.) thickness and 3.7 m2·K/W (21 h·ft2·°F/Btu) for 140 mm (5.5 in.) thickness. R-value of extruded polystyrene was 0.9 m2·K/W (5 h·ft2·°F/Btu) at 25 mm (0.98 in.) thickness.
4.3. Initial Conditions
The initial moisture content of OSB was set to correspond with measured values in each of the wall assemblies. For materials other than OSB, the initial moisture content was set at equilibrium with 65% RH. Initial temperature in all materials was set to 21 °C (70 °F).
4.4. Interior and Exterior Conditions
Interior and exterior conditions were taken from onsite measurements (
Section 2.2) with the exception of rainfall data. The onsite data were collected at half-hour intervals and were averaged to obtain hourly values. Hourly rainfall data were obtained from the nearest weather station, Andrews Air Force Base. Wind-driven rain on the walls was calculated according to ASHRAE Standard 160 [
27], using measured horizontal rainfall, wind speed, and wind direction. A rain exposure factor of 1.0 (medium exposure for buildings less than 10 m (33 ft)) and a rain deposition factor of 0.35 (for walls below a steep-slope roof) were assumed.
4.5. Surface Transfer Coefficients
The exterior surface heat transfer coefficient was the sum of a radiative component (6.5 W/(m2·K)), a convective constant (4.5 W/(m2·K)), and the product of the wind velocity and a coefficient (1.6 W·s/(m3·K) for windward conditions and 0.33 W·s/(m3·K) for leeward conditions). Standard values were used for short-wave radiation absorptivity and long-wave radiation emissivity (depending on the cladding type). Standard values were used for the adhering fraction of rain (0.7) and the interior surface heat transfer resistance (0.125 m2·K/W). Cavity ventilation was simulated only for brick veneer with a constant air exchange rate of 2 h−1 in the 25 mm (1 in.) air cavity.
4.6. Simulation Period and Numerical Parameters
Simulations had a start date corresponding to 1 December, 2011, a one-hour time step, and an end date corresponding to 31 March, 2013. Default values were used for numerical calculation parameters except that adaptive time step control was enabled, which in combination with a fine numerical grid minimized convergence failures.
5. Hygrothermal Simulation Results and Discussion
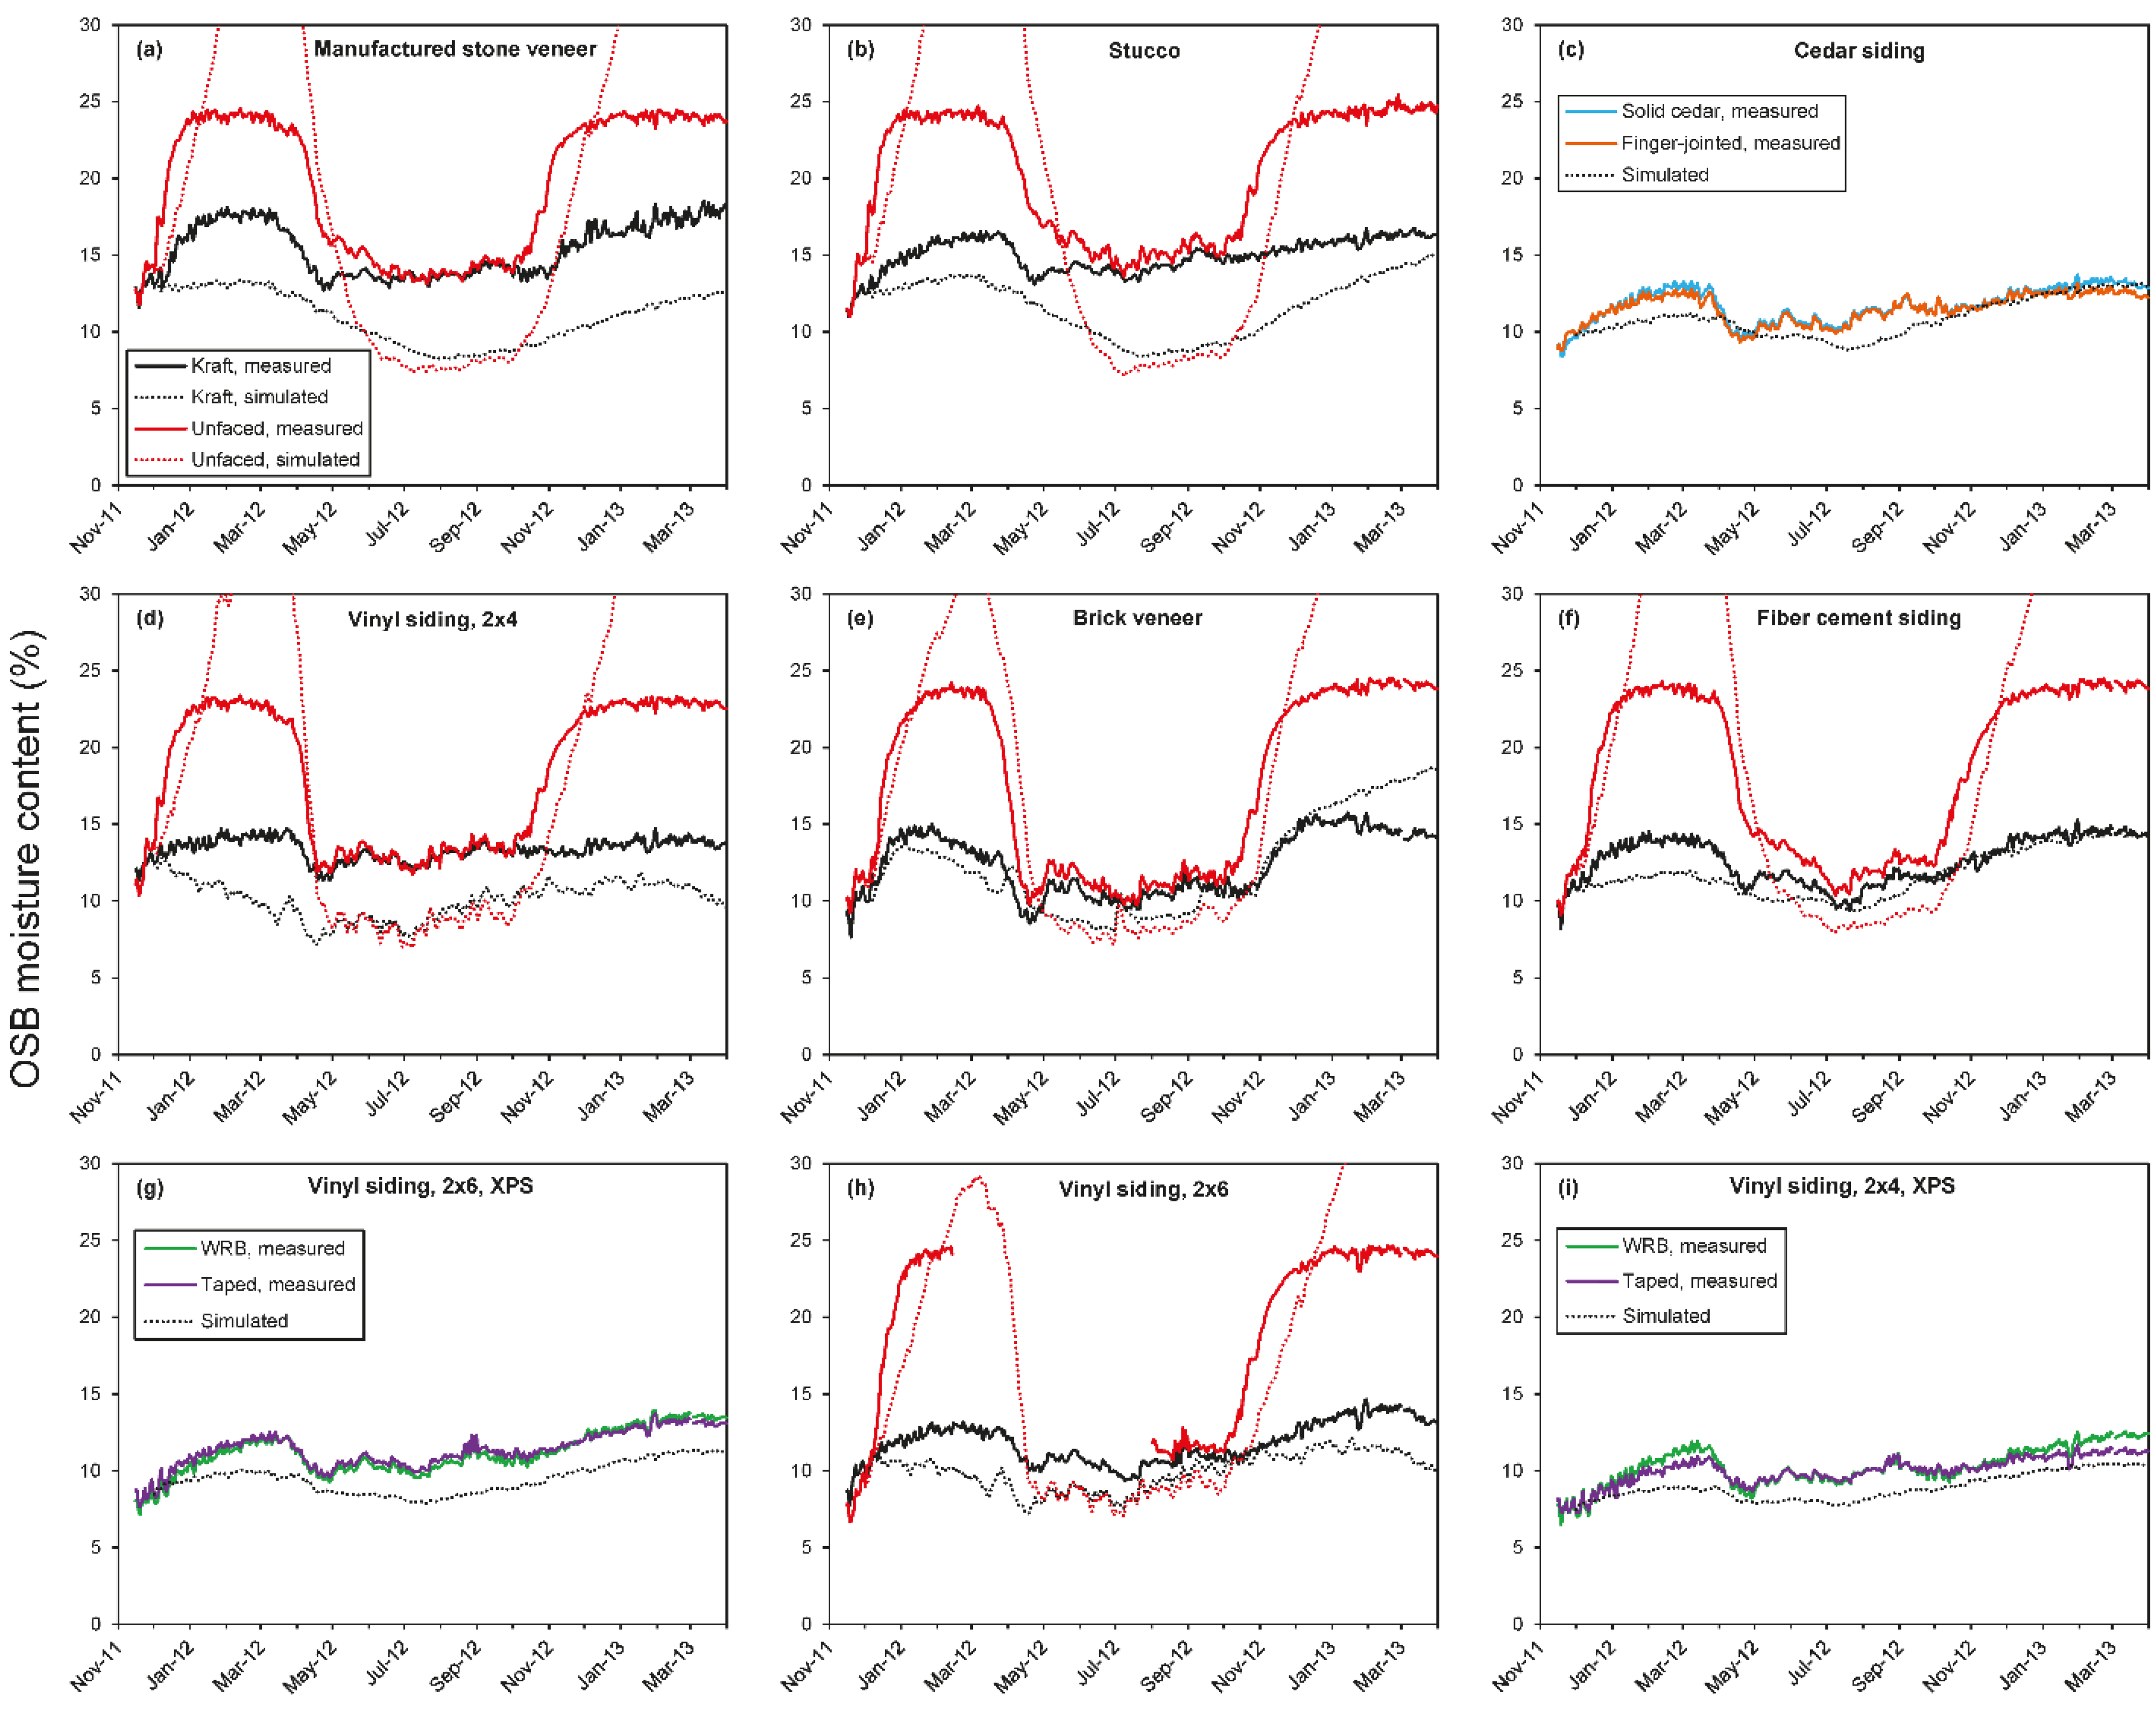
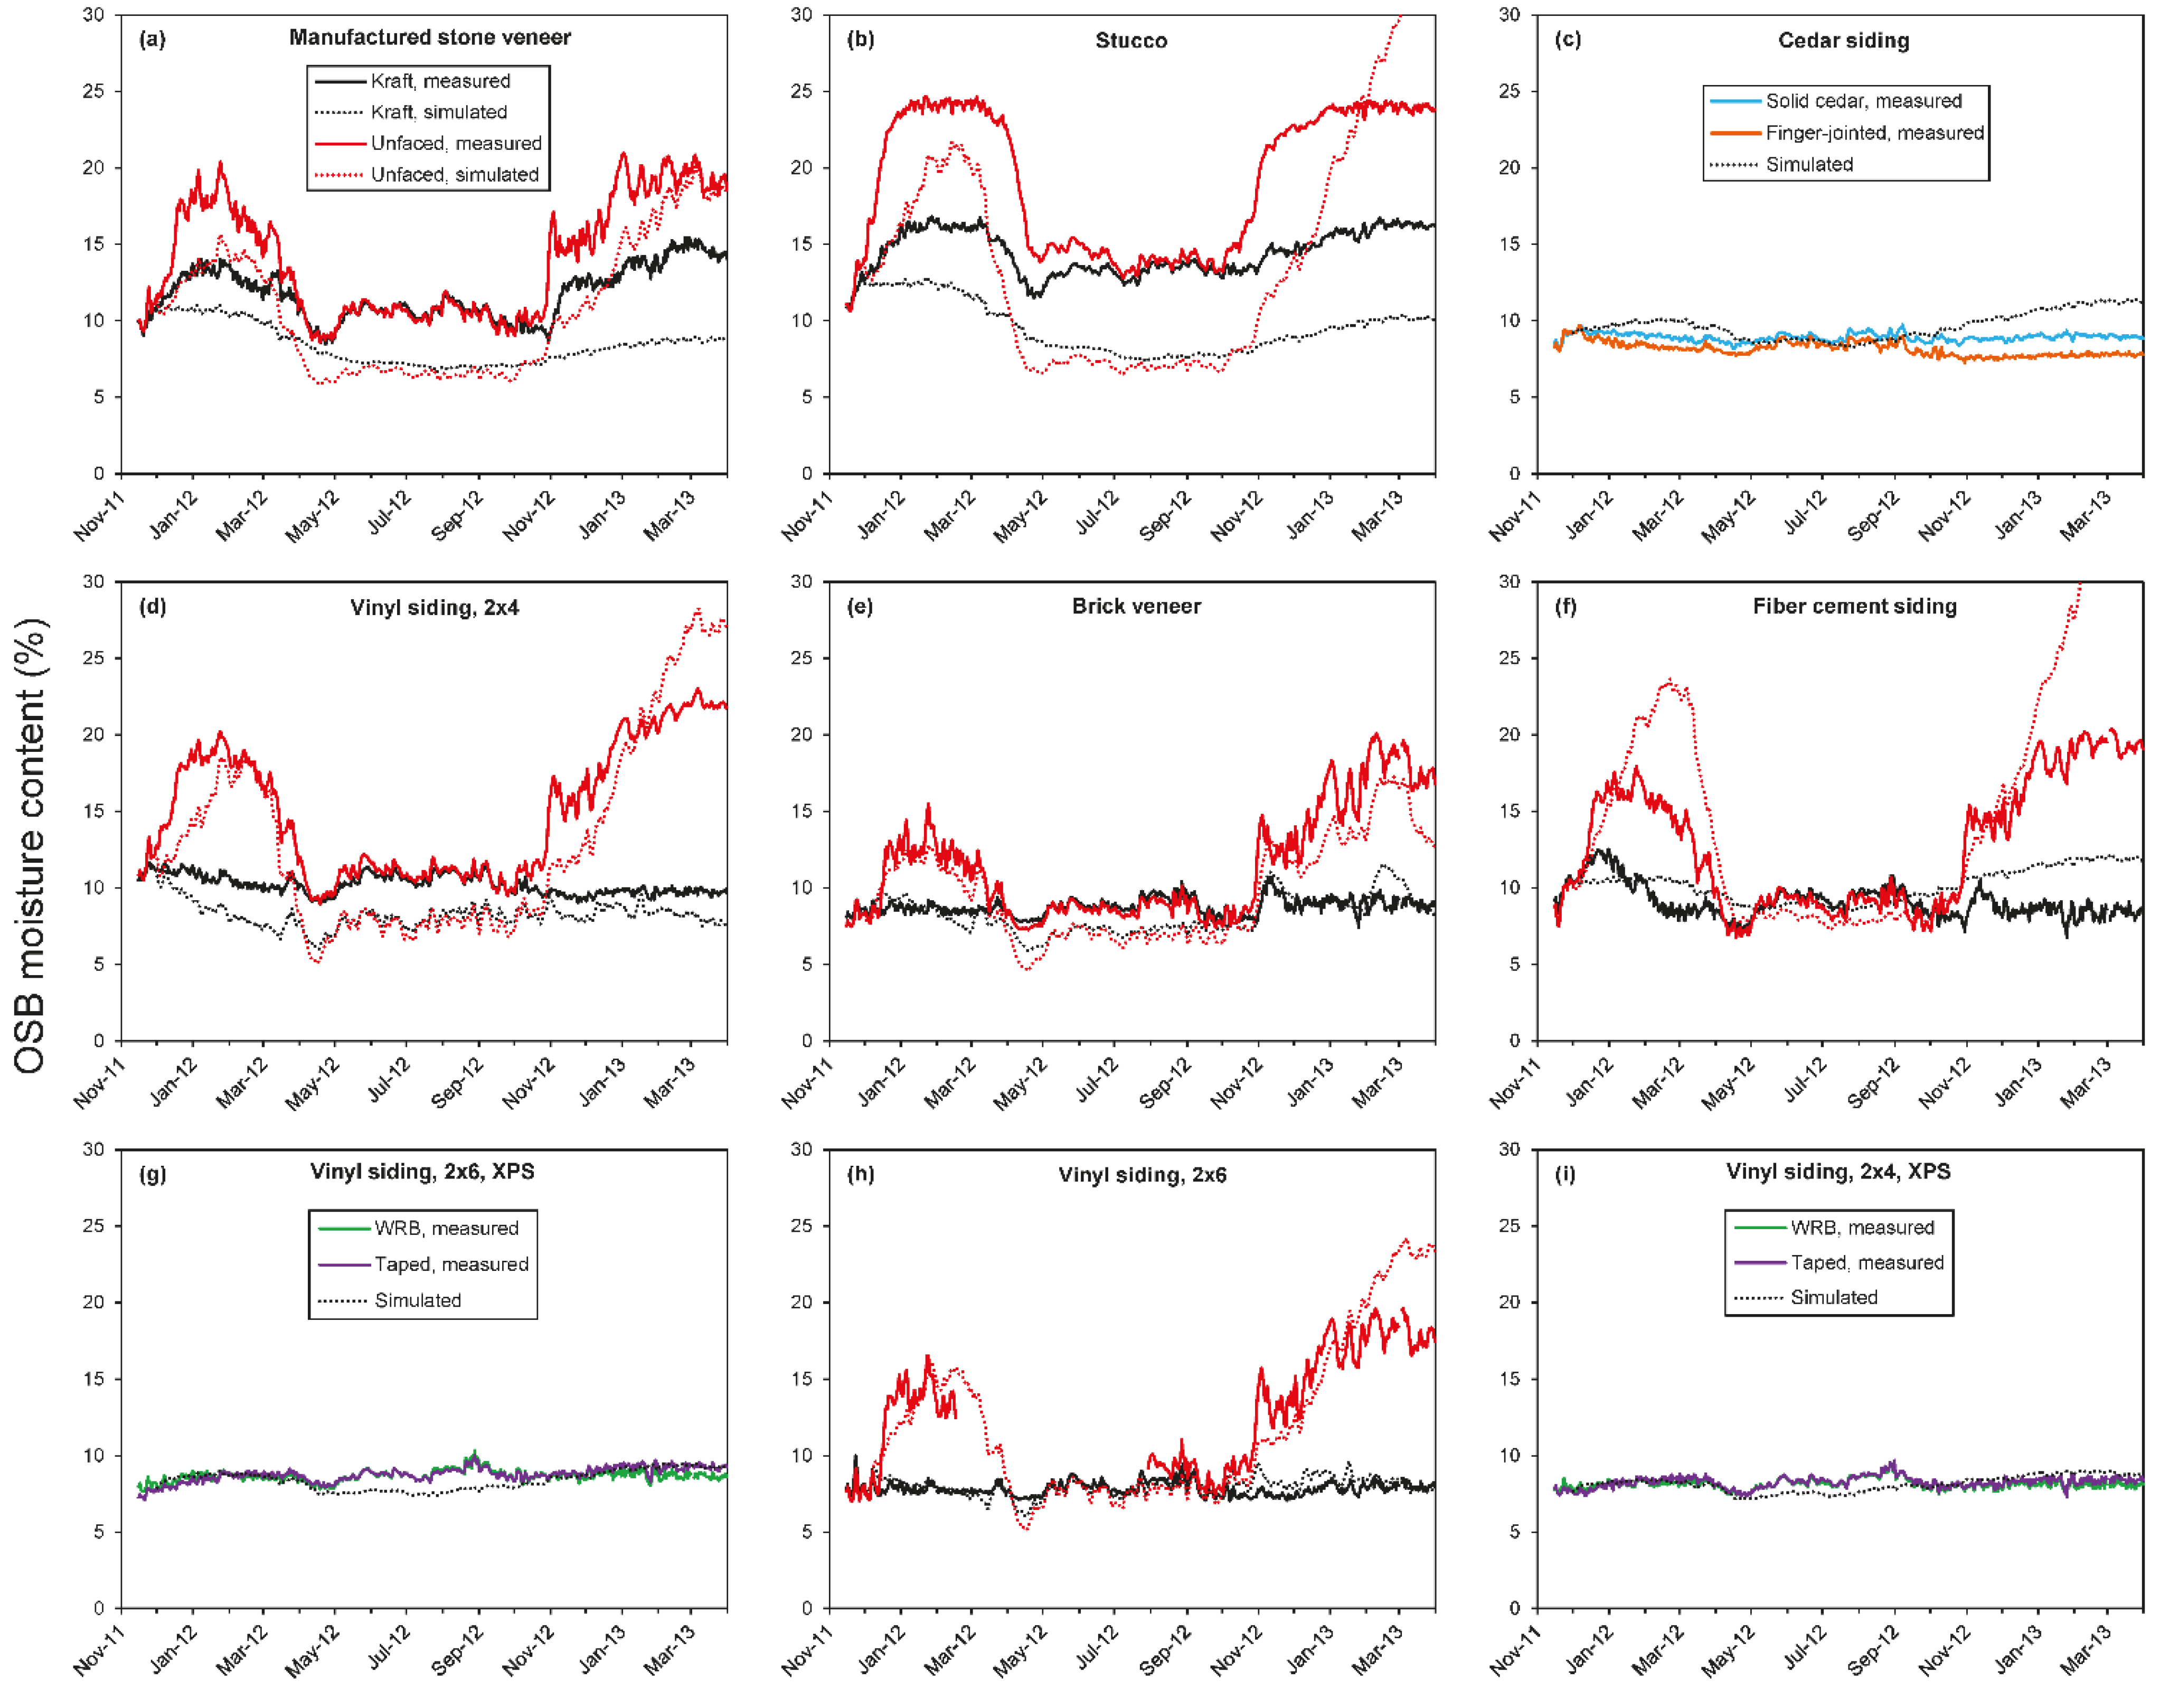
Measured OSB moisture contents from the north-facing test walls are compared with simulated values in
Figure 11. In general, the simulations correctly predicted the seasonal trends in OSB moisture content and the differences between walls with and without kraft vapor retarders. However, the simulations often differed considerably from measured values. Fair to good agreement between measured and simulated values was found for several assemblies with interior kraft facing (
Figure 11c,e–i). The maximum differences between measured and simulated values were 2.5% MC (
Figure 11c); 4.5% (
Figure 11e); 3.1% (
Figure 11f); 3.8% (
Figure 11g); 4.2% (
Figure 11h); and 3.2% (
Figure 11i). The root-mean-square errors (RMSEs) for these assemblies were 2.1% MC or less. In contrast, simulated OSB moisture contents in walls with a kraft vapor retarder and either manufactured stone veneer (
Figure 11a) or stucco (
Figure 11b) were significantly lower than measured values, the differences being as large as 7% MC. Large under-prediction (almost 6% MC) was also seen for the 2 × 4 wall with vinyl siding (
Figure 11d).
The largest apparent discrepancies between measured and simulated values were observed for north-facing walls without a kraft vapor retarder during winter months. The y-axis in
Figure 11 is limited to 30% MC, but simulated values in some cases exceeded 60% MC as a result of vapor diffusion, given the high interior humidity levels and the high vapor permeance of painted gypsum. As mentioned previously, the sensors were not capable of determining moisture content above approximately 25% MC (
i.e., sensors read 25% MC even if the actual moisture content was higher). Therefore, meaningful comparisons between measured and simulated moisture levels cannot be made in this range. However, simulations approximately predicted the duration of excessive OSB moisture content during winter, though simulated values tended to lag behind the measured values when the OSB MC increased sharply in fall/winter and decreased rapidly in spring.
Figure 11.
Measured and simulated OSB moisture content in north-facing walls.
Figure 11.
Measured and simulated OSB moisture content in north-facing walls.
Measured and simulated values for south-facing walls are compared in
Figure 12. Several walls with a kraft vapor retarder again showed good agreement, with maximum differences of 3.7% MC (
Figure 12c); 3.6% (
Figure 12d); 3.0% (
Figure 12e); 2.5% (
Figure 12g); 2.1% (
Figure 12h); and 1.9% (
Figure 12i). The RMSEs for these assemblies were 2.1% MC or less. In contrast, simulated OSB moisture contents in walls with a kraft vapor retarder and either manufactured stone veneer (
Figure 12a) or stucco cladding (
Figure 12b) were significantly lower than measured values, the differences being as large as 7% MC, similar to the corresponding north-facing walls.
In general, measured OSB moisture content in walls without interior kraft facing had a lower winter peak in the south orientation relative to the north orientation. This trend was captured by the simulations, though significant over-prediction was seen in a few instances, particularly in February to March 2013 (
Figure 12b,d,f,h). In walls without a kraft vapor retarder with either manufactured stone veneer or stucco cladding, the simulations under-predicted OSB MC during summer by up to 7% MC in south-facing walls (
Figure 12a,b).
The discrepancies between measured and simulated OSB moisture contents discussed above may stem from several sources. Previous research has shown that simulation results may depend strongly on material properties [
48]. In this case, the liquid diffusivity and moisture retention properties of absorptive claddings like stucco and manufactured stone veneer may be important; these were not measured in this study. In addition, air leakage within wall assemblies can contribute to wetting and drying but was not included in simulations because airflow is very difficult to predict and the air permeance of the test wall sections was not tested. Measurement error in OSB moisture content could come from calibration uncertainty (about 2% MC) or error in temperature compensation (likely less than 1% MC). In addition, the moisture sensors in this study displaced insulation in the wall cavities, whereas the simulations assumed the cavities were fully insulated. The sensors also used bare stainless steel screws as electrodes, which read the highest moisture content through the OSB thickness, whereas the simulation output was average moisture content across the OSB layer.
Figure 12.
Measured and simulated OSB moisture content in south-facing walls.
Figure 12.
Measured and simulated OSB moisture content in south-facing walls.
The simulation results here for assemblies that rely on interior gypsum board with latex primer and paint can be compared with previous simulations for similar mixed-humid climate locations (
Table 3). Together these simulations give a consistent picture of the sensitivity of north-facing walls to moisture accumulation with increasing interior humidity and interior vapor permeance.
Table 3.
Comparison of hygrothermal simulations.
Table 3.
Comparison of hygrothermal simulations.
| Reference | Wintertime Interior RH | Interior Vapor Permeance, ng/(Pa·s·m2) (perms) | Peak OSB Moisture Content |
|---|
| This work | 55% | 2000 (35) | >30% (north-facing) |
| Karagiozis et al. [6] | “high” | 460 (8) | 18%–25% |
| “low” | <16% |
| Glass [36] | 35% | 570 (10) | 16% (north-facing) |
| 45% | 290 (5) | 17% (north-facing) |
| 45% | 570 (10) | 22% (north-facing) |
| 45% | 1100 (20) | 27% (north-facing) |
6. Conclusions
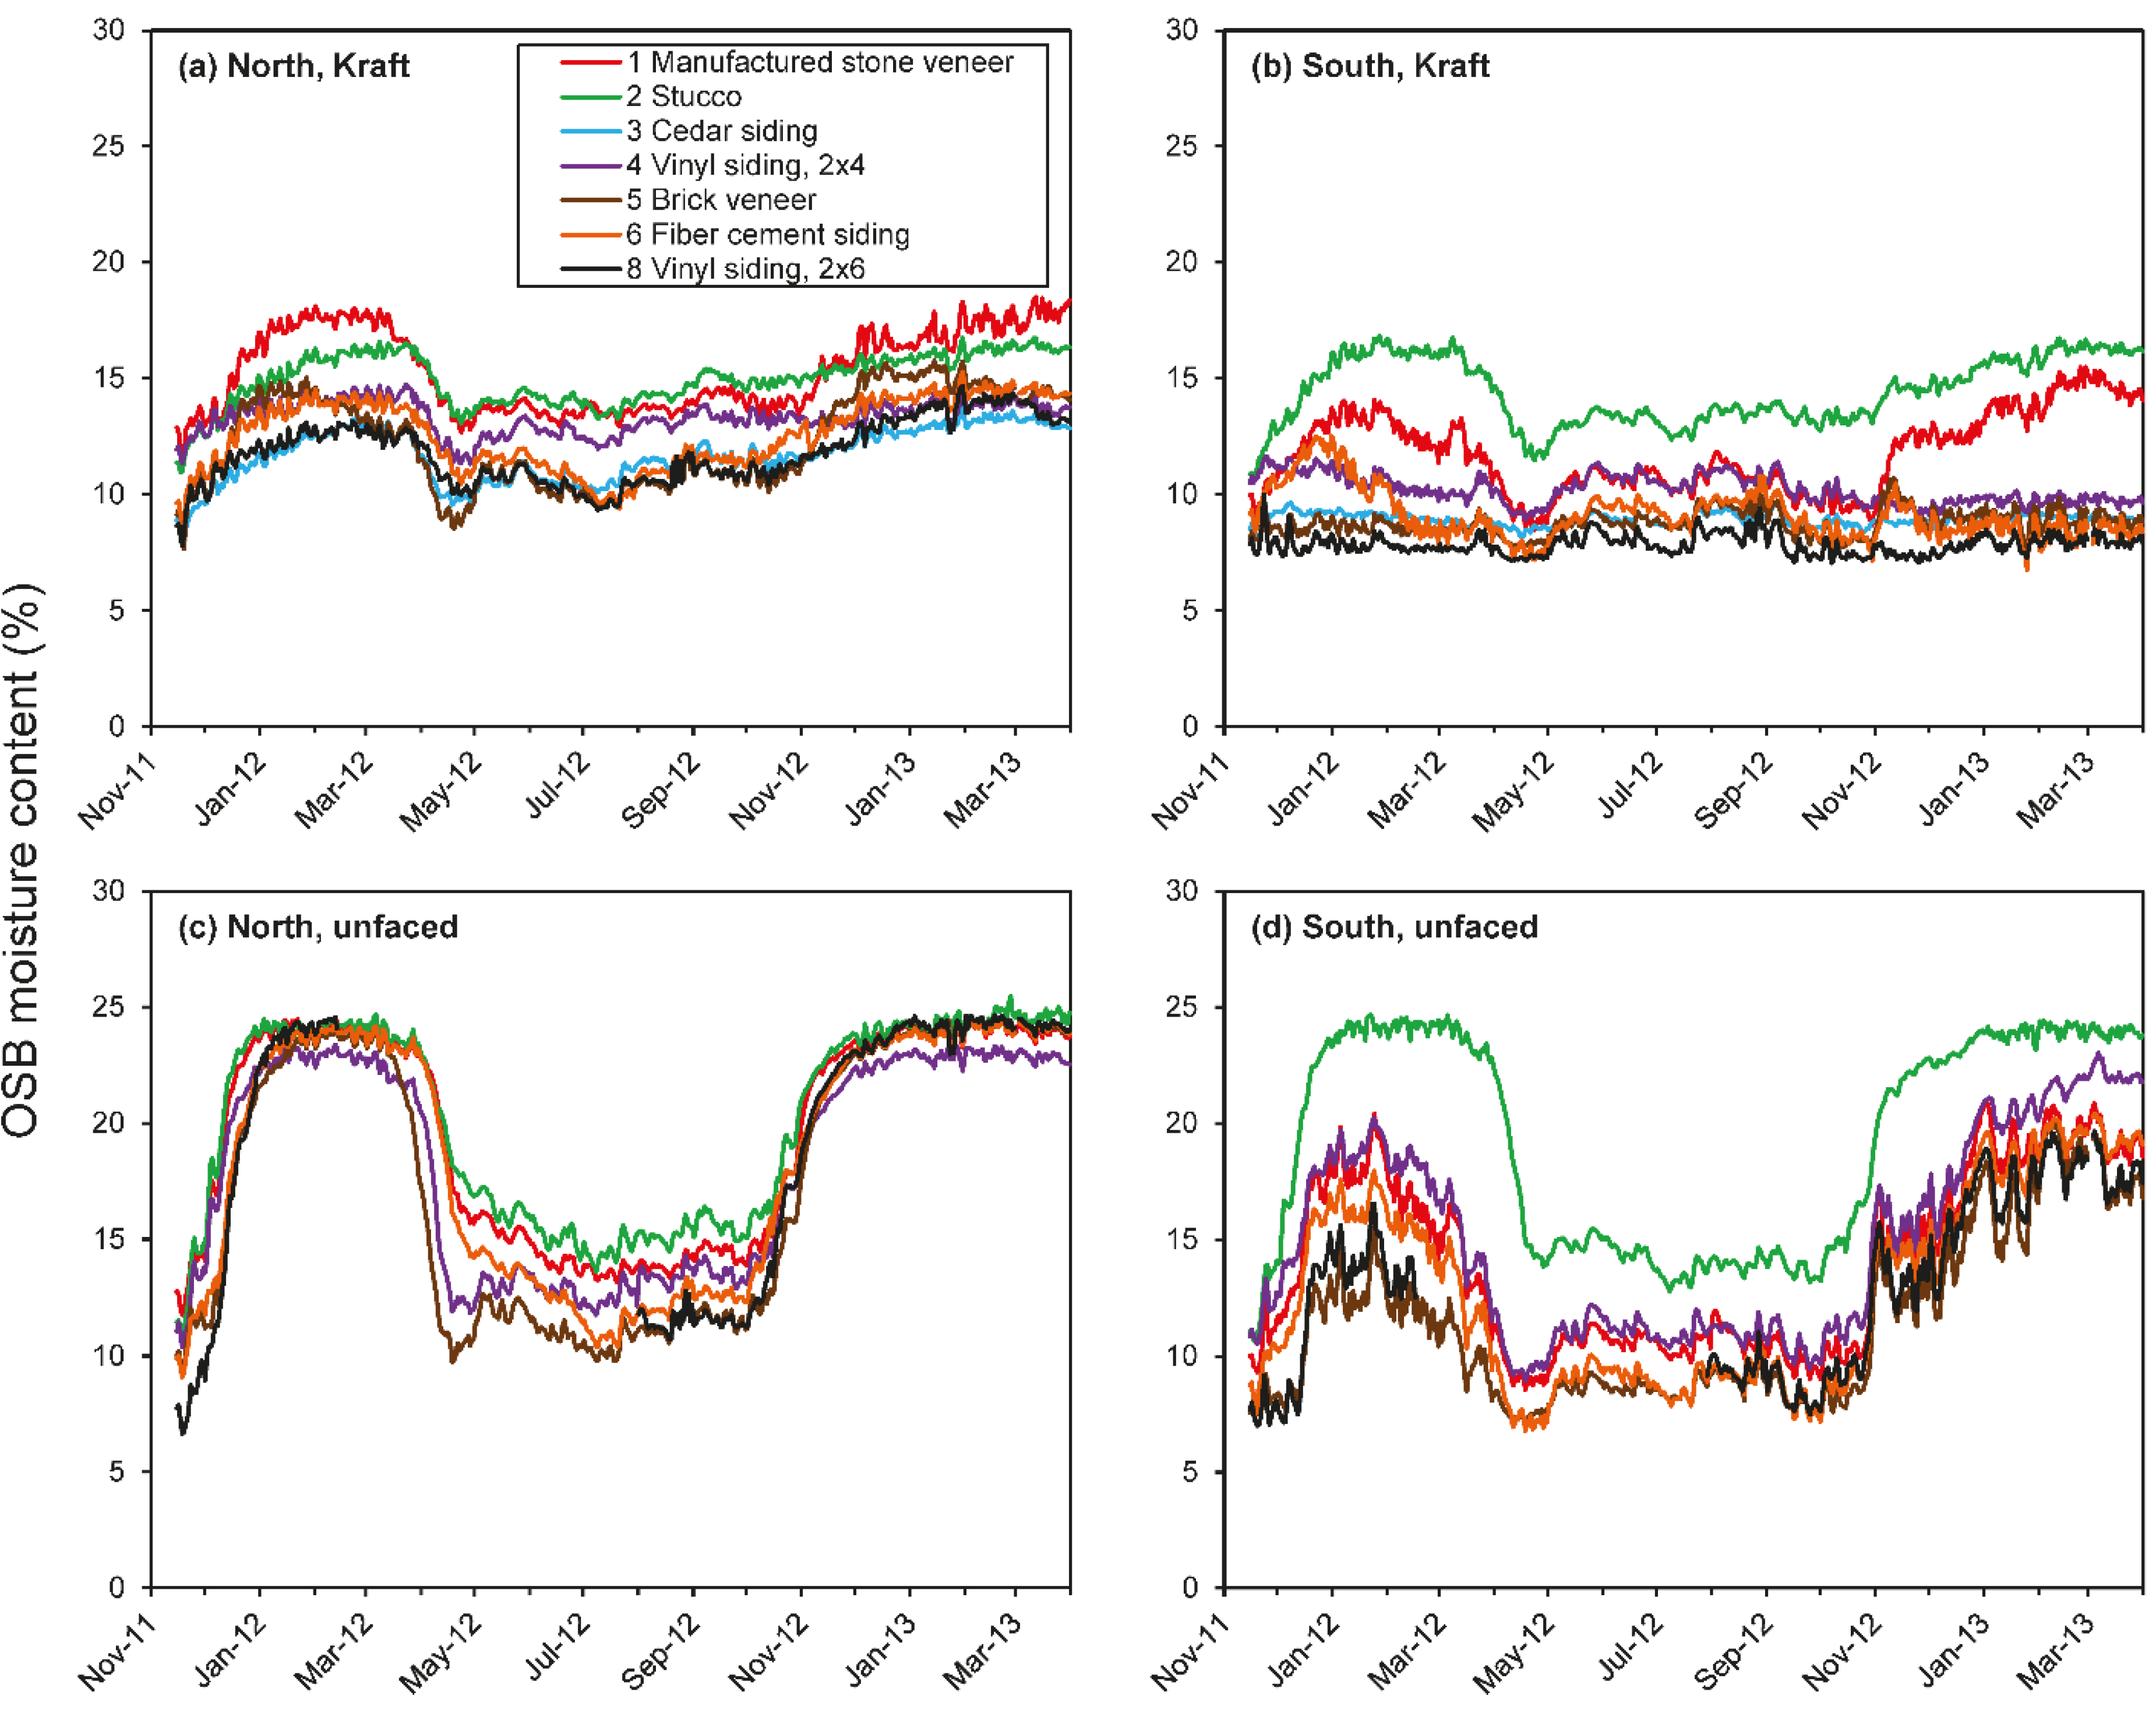
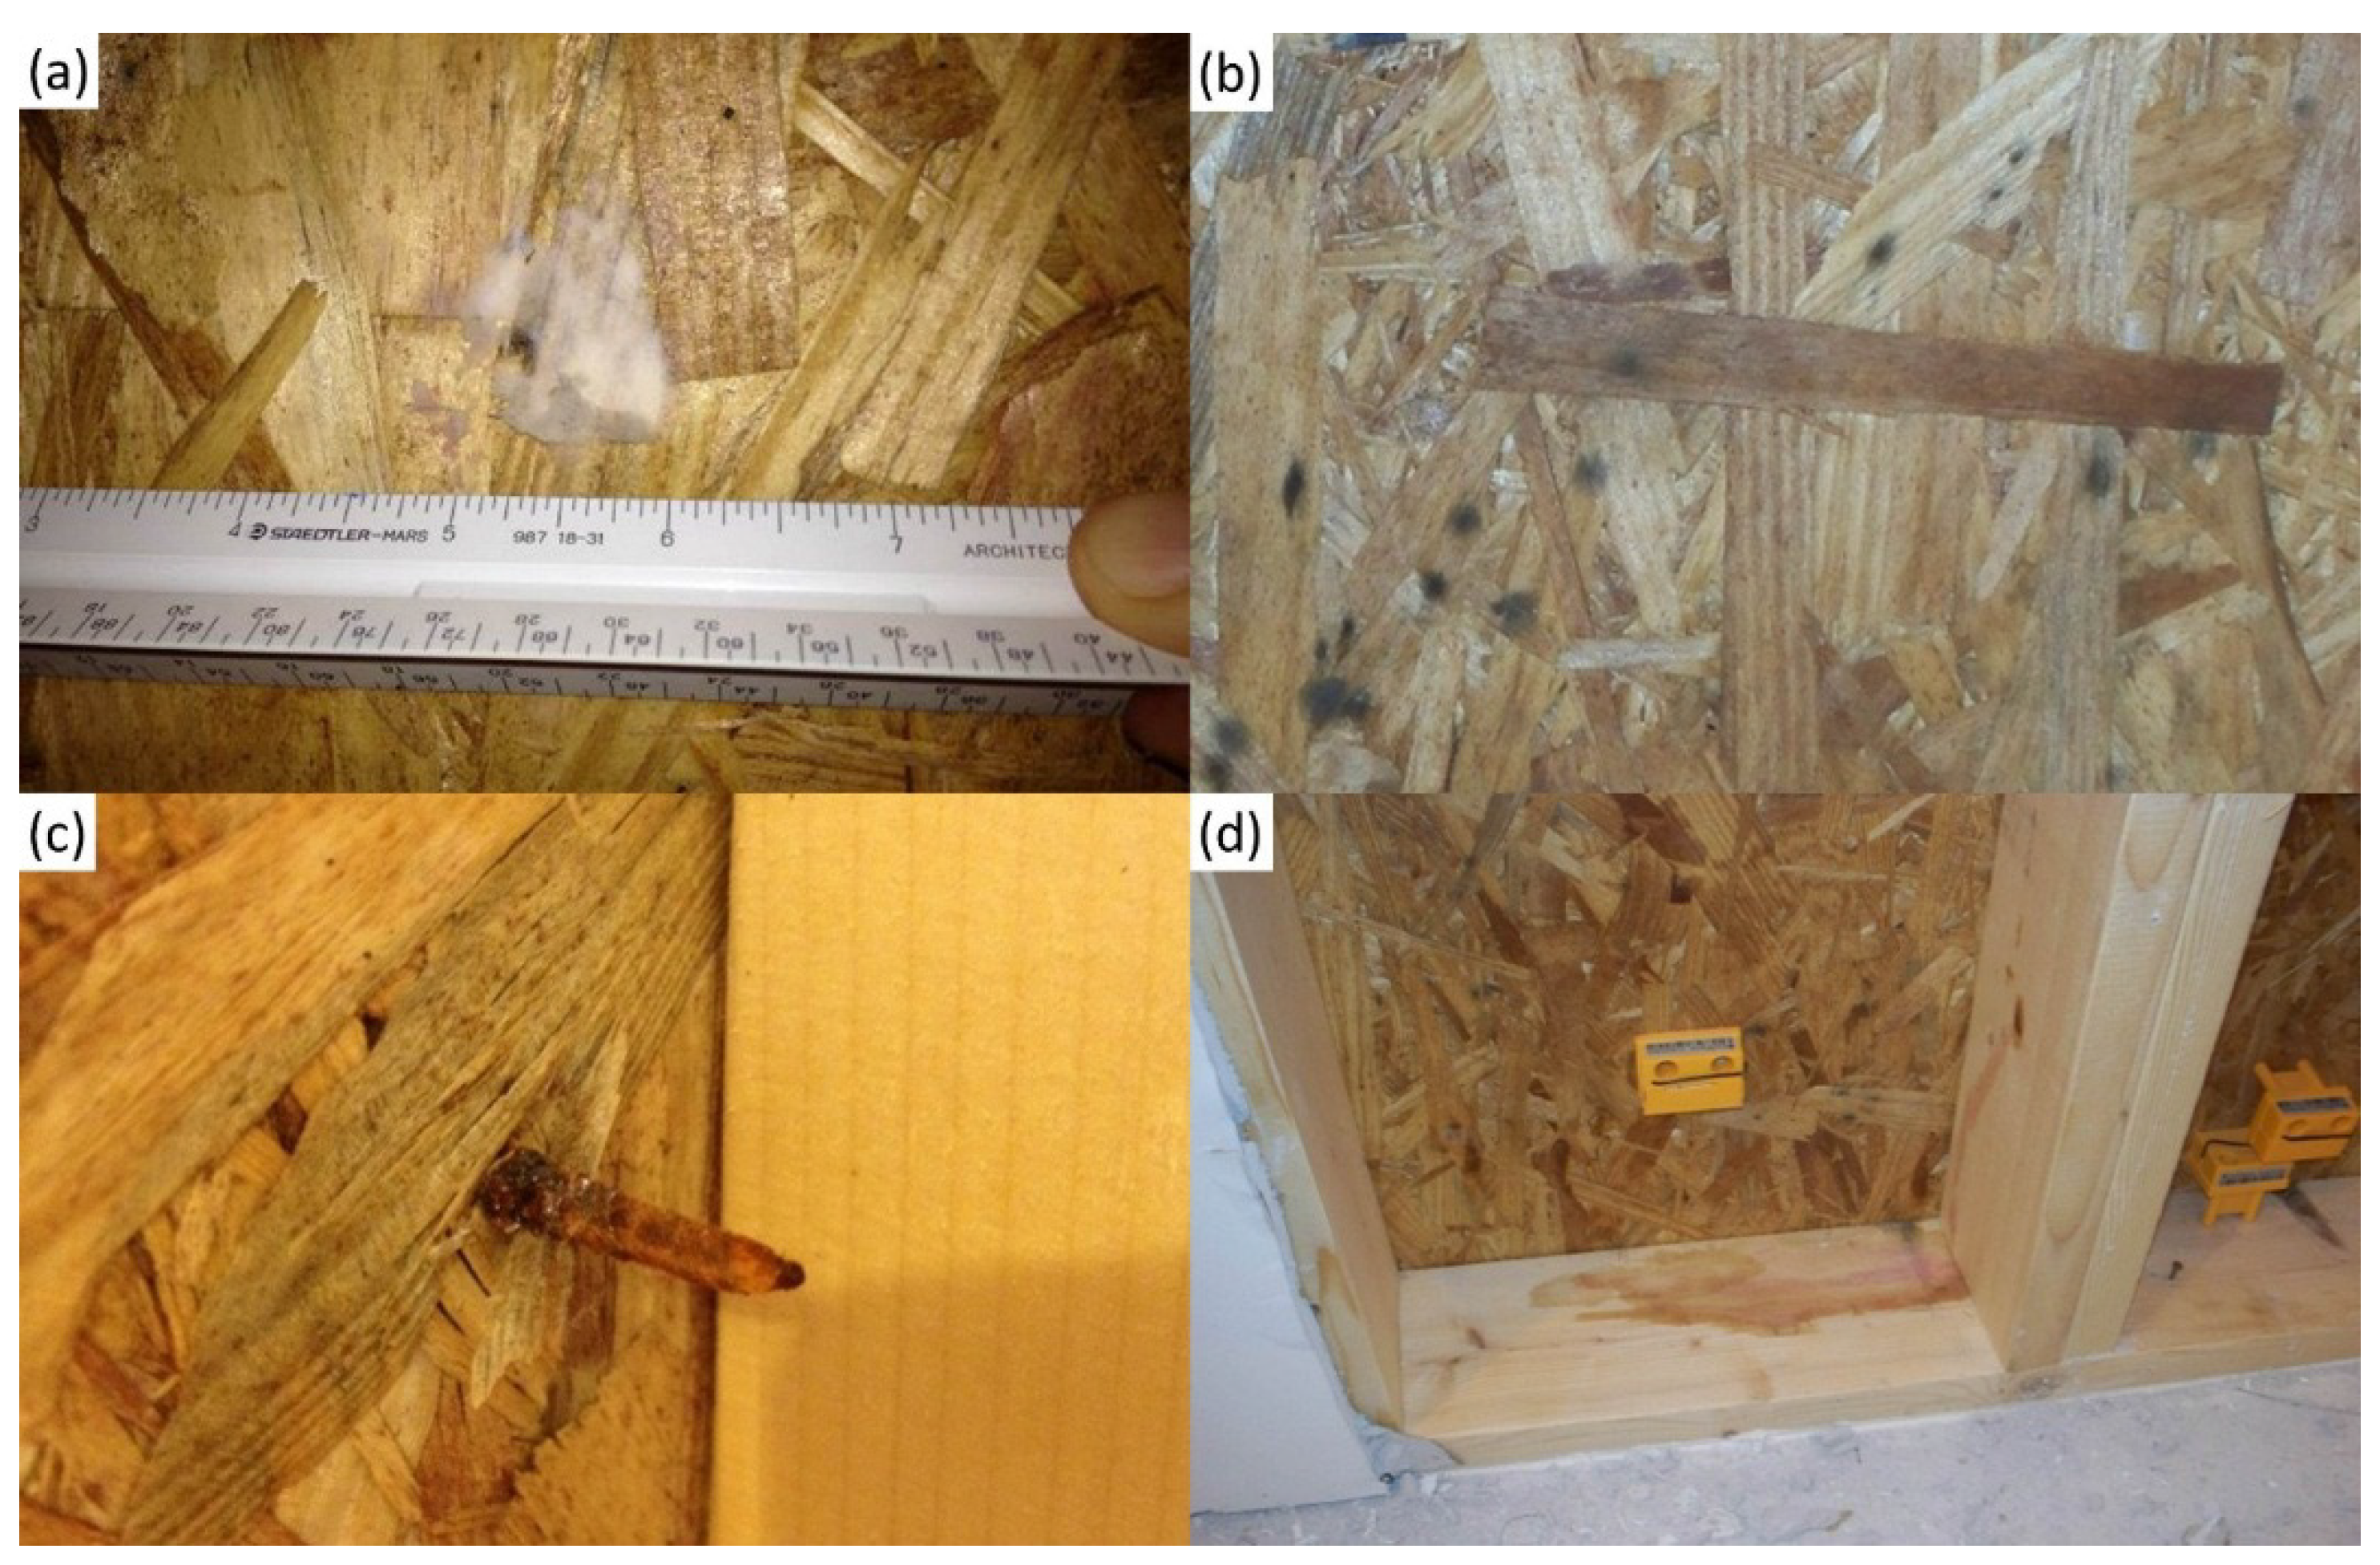
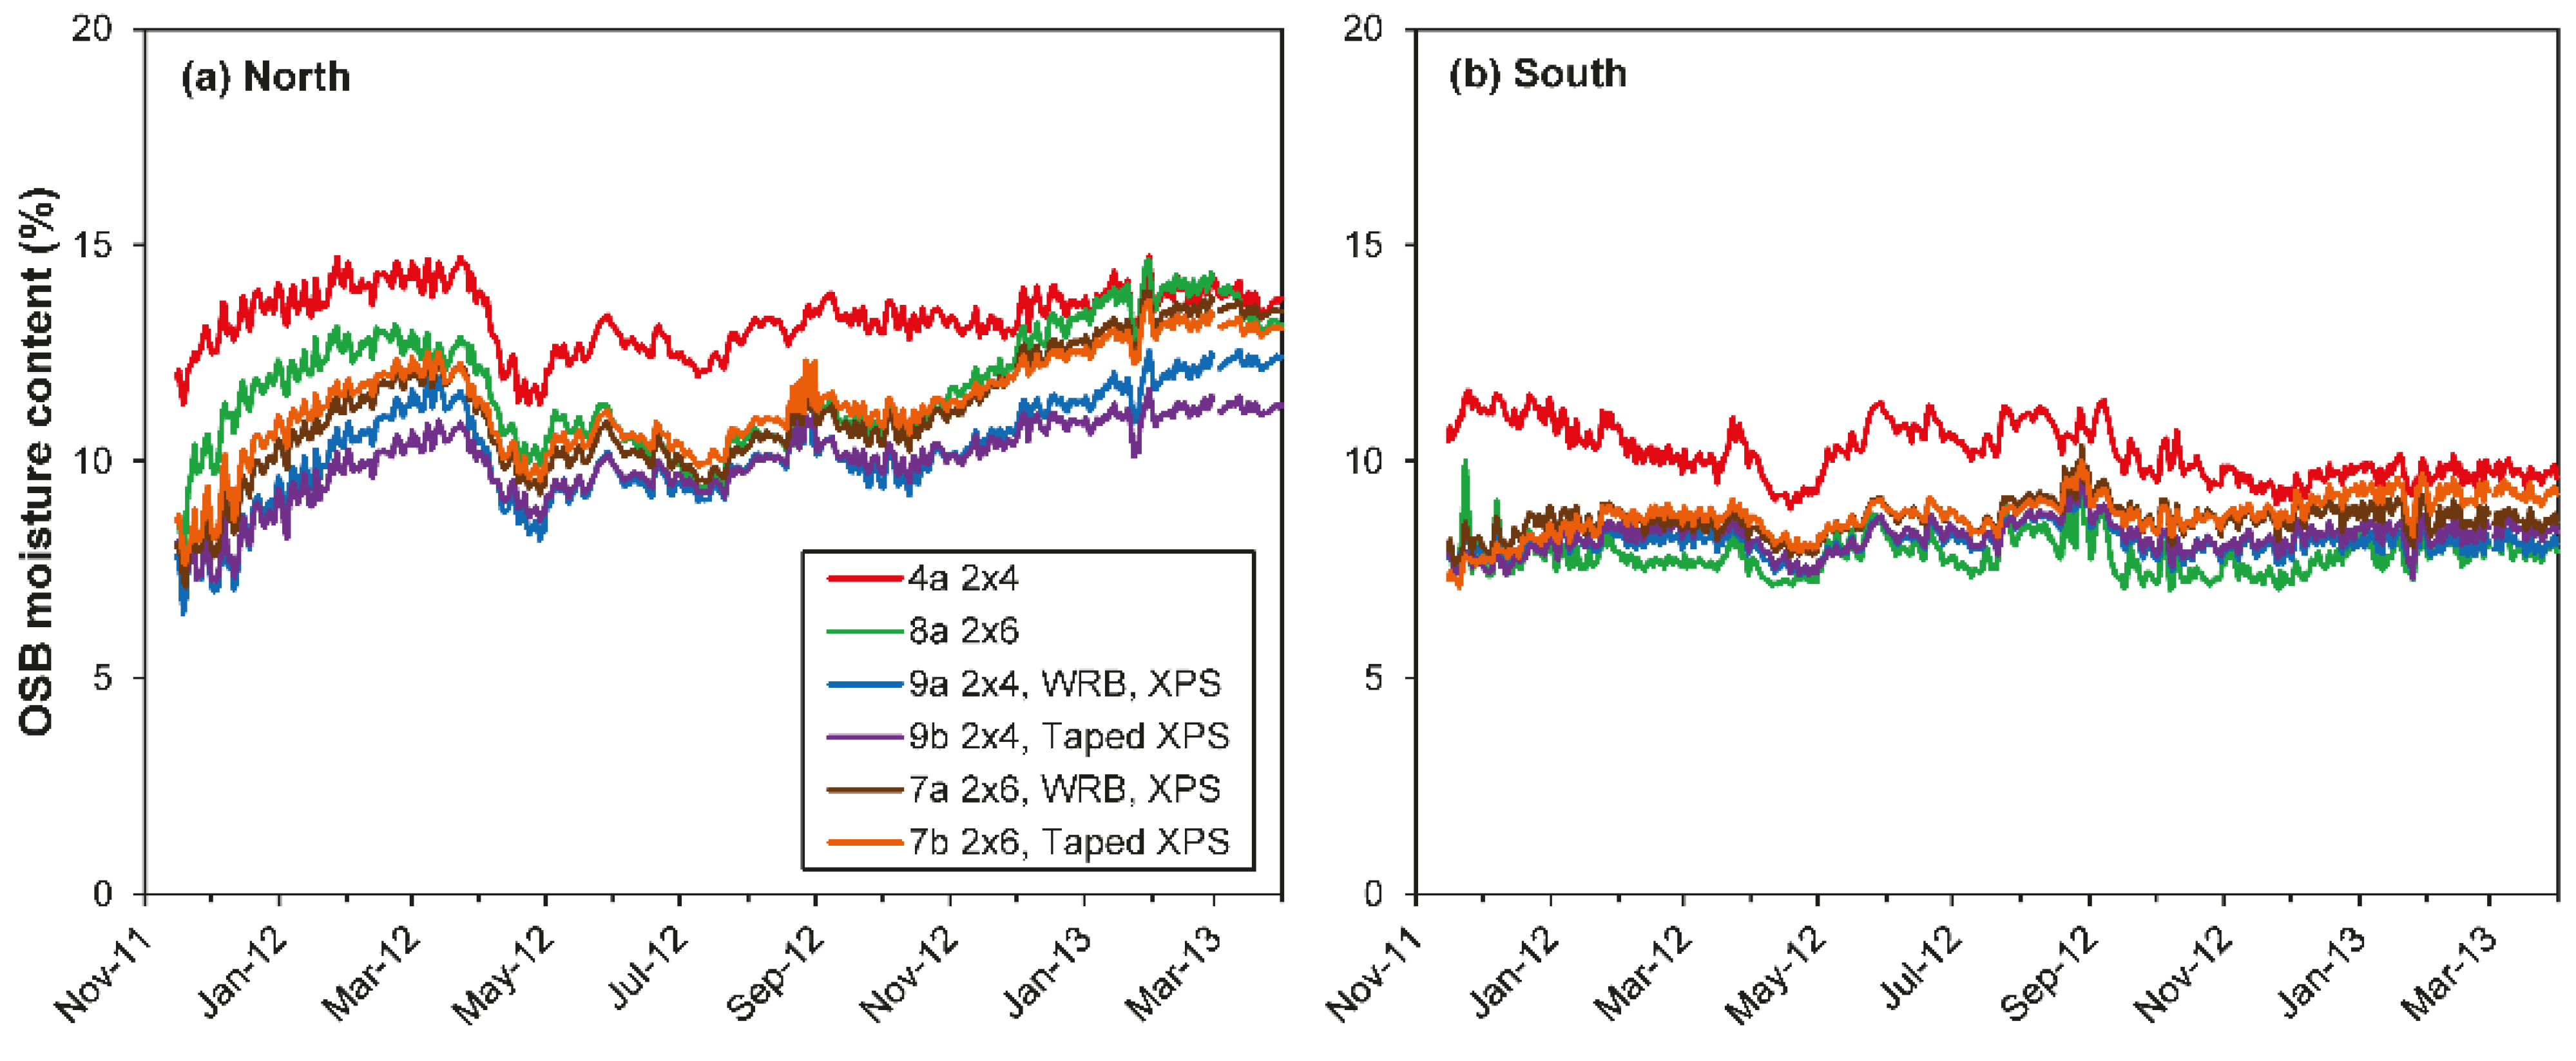
Measurements in exterior walls of two test structures located near Washington, DC (IECC Climate Zone 4A) showed that north-facing walls generally reached higher OSB moisture contents than south-facing walls in winter, and all walls dried out in spring. The combination of high interior humidity and high vapor permeance of painted gypsum board led to significant moisture accumulation in exterior OSB sheathing during winter in walls without a vapor retarder. Laboratory measurements indicated that the vapor permeance of gypsum board with latex primer and paint was considerably higher than other measurements and the value assumed by the IRC. Inspection of a wall in which sensors had failed revealed water stains, mold growth, and corrosion of siding nails. In contrast, wintertime moisture accumulation was not significant in walls with an interior kraft vapor retarder. XPS exterior rigid insulation of 25 mm (1 in.) thickness had a predictable effect on wall cavity temperature but a marginal impact on cavity RH levels and OSB moisture content in walls with vinyl siding and interior kraft vapor retarder.
Simulations with a one-dimensional hygrothermal model using measured interior and exterior conditions and some select measured material properties approximately captured the timing of seasonal increases and decreases in OSB moisture content, the differences between north- and south-facing walls, and the differences between walls with and without an interior kraft vapor retarder. Agreement between simulation and measurement was fair to good in many cases. However, simulated OSB moisture contents tended to be considerably lower than measured values during summer, particularly for walls clad with manufactured stone veneer and stucco. The 25% MC limit of the moisture sensors precluded meaningful comparisons above this level, which occurred consistently for north-facing walls without a kraft vapor retarder during winter months.
The impact of air leakage on wetting and drying was not assessed in this project. Further research is needed to uncouple the effects of air leakage from vapor diffusion. The interior humidity levels maintained in the test structures were based on ASHRAE Standard 160 [
27], simplified method, and led to sheathing moisture contents in wall assemblies with interior latex primer/paint as the only vapor retarder that were considerably higher than those measured in occupied single-family homes in the same climate zone. Further research is needed to evaluate the appropriateness of this method for indoor humidity and the reliability of interior latex primer/paint to serve as a Class III vapor retarder.


