1. Introduction
Buildings are one of the world’s largest energy-consuming sectors, accounting for nearly 30% of final global energy consumption, reaching 40% in the European Union (EU) [
1]. With new constructions adding at most 1% a year to the EU existing stock [
2], there is large potential for improving the energy performance of the other 99% of the building stock, making “energy refurbishment” a top priority in current EU and national policies. In the last decade, a remarkable number of studies have focused on quantifying the environmental improvement potential of buildings. Some of these studies [
3] focus on the quantification of energy consumption during the use phase of the building, without taking into account the environmental impacts, resources needed and the waste and emissions generated from the building processes. In the cases in which a life cycle approach has been applied on an assessment, there is a general consensus that the use phase contributes more than 80%–85% share in the total life cycle energy use of buildings [
4,
5,
6,
7]. The study carried out by Karimpour
et al. [
8] shows that when considering the time value of carbon, in relation to emission targets, the embodied energy (total energy required for the extraction, processing and manufacture of building materials) can represent up to 35% of the future emissions target of a building in a mild climate. In buildings with a very low energy use in the operational phase, logically other phases of the life cycle like raw materials supply, product manufacturing, transport and installation, and end of life would have a much larger relative impact, becoming the only energy related impact in the so called “zero energy buildings”. In that sense, Cellura
et al. [
9] have emphasized the embodied energy of the building as a key issue to not be neglected in the exhaustive evaluation of the primary energy demand of low energy buildings, whereas according to Lützkendorf
et al. [
10] the embodied energy of a passive house with PV installation could be 44% higher than its operation energy for a 60 years lifespan.
From these observations it is clear and generally accepted that when undertaking an environmental assessment of a new building, it is necessary to evaluate all its phases with a life cycle approach, and recent standardization efforts from ISO TC 59/SC17 [
11] or CEN TC 350 [
12] have developed a methodology and standards to apply this approach in a structured way. However, the effort needed for such analysis is relatively large, and the discussion about whether the evaluation of all building phases is also necessary in building energy refurbishment projects arises. As buildings are extremely complex systems entailing an enormous amount of products, systems, stages and processes, a fully-fledged application of the life cycle assessment (LCA) methodology is still not widely applied, and analysts usually apply some simplifications to reduce the amount of time and facilitate the interpretation of the results. Cabeza
et al. [
13] and
Chau et al. [
14], provided a review on comparing life-cycle-based methodologies in the building sector.
In this context and based on a building case study, the main objective of this paper is to verify whether different simplified methodologies currently applied for analyzing building refurbishment strategies are sufficiently reflective of a comprehensive application of the LCA, in terms of reducing resource use and environmental impacts of existing residential buildings. Several sensitivity analyses trying to capture a wide range of potential scenarios have been developed in order to assess the influence of key parameters in the comparison between the different methodologies.
2. Methodology and Case Study
With the aim of identifying to what extent simplifications may influence the results of a decision-making process, three different methodologies, namely LCA, simplified life cycle assessment (LCA-Si) and operational stage assessment (OSA), are applied to the same case study, an existing block of apartments in San Sebastian (Spain).
Section 2.1 explains LCA, LCA-Si and OSA methodologies and how are they used by the authors to assess each refurbishment strategy. The case study context, including climate conditions and existing building construction characteristics, are evaluated in
Section 2.2, also presenting a diagnosis of the baseline energy performance.
Section 2.3 analyzes the selected refurbishment strategies, which have been designed with the objective of decreasing the final heating consumption of the building. Finally,
Section 2.4 presents the calculation details for each life cycle phase of the refurbishment strategy.
2.1. Difference between LCA, LCA-Si and OSA Methodologies
According to the European Commission Communication on Resource Efficiency Opportunities in the Building Sector [
15], the LCA methodology is currently the best framework available to assess the potential environmental impacts of any activity, product or service without geographical, functional or time limits, since it quantifies the environmental impact of the inputs and outputs along its whole life cycle, including the extraction of raw materials, production process, use and end of life stages.
LCA is standardized by ISO 14040 [
16] and 14044 [
17] standards, and consists of four phases. The first phase is to define the goal and scope of the assessment, which serves as a description of the type of study. The scope of the study determines which processes should be included in the inventory phase of the assessment. In the second phase, the life cycle inventory (LCI) includes information on all of the environmental inputs and outputs associated with a product or service,
i.e., material and energy requirements, as well as emissions and waste. The third phase is the impact assessment, where the potential contribution of each substance to predefined environmental impact categories is calculated. Once the impact has been calculated, the fourth and final step of the assessment is the interpretation, where the results of the calculations are summarized and discussed. LCA can choose from several methods to quantify the environmental performance of a product, system or process. For example, the CML method (Centrum voor Milieukunde Leiden) [
18] uses indicators at midpoint level showing direct potential impact on the environment situated halfway along the chain of causes and effects. On the other hand, the Eco-indicator method [
19] includes endpoint indicators, which represent the ultimate consequences of the environmental impact for humans and ecosystems.
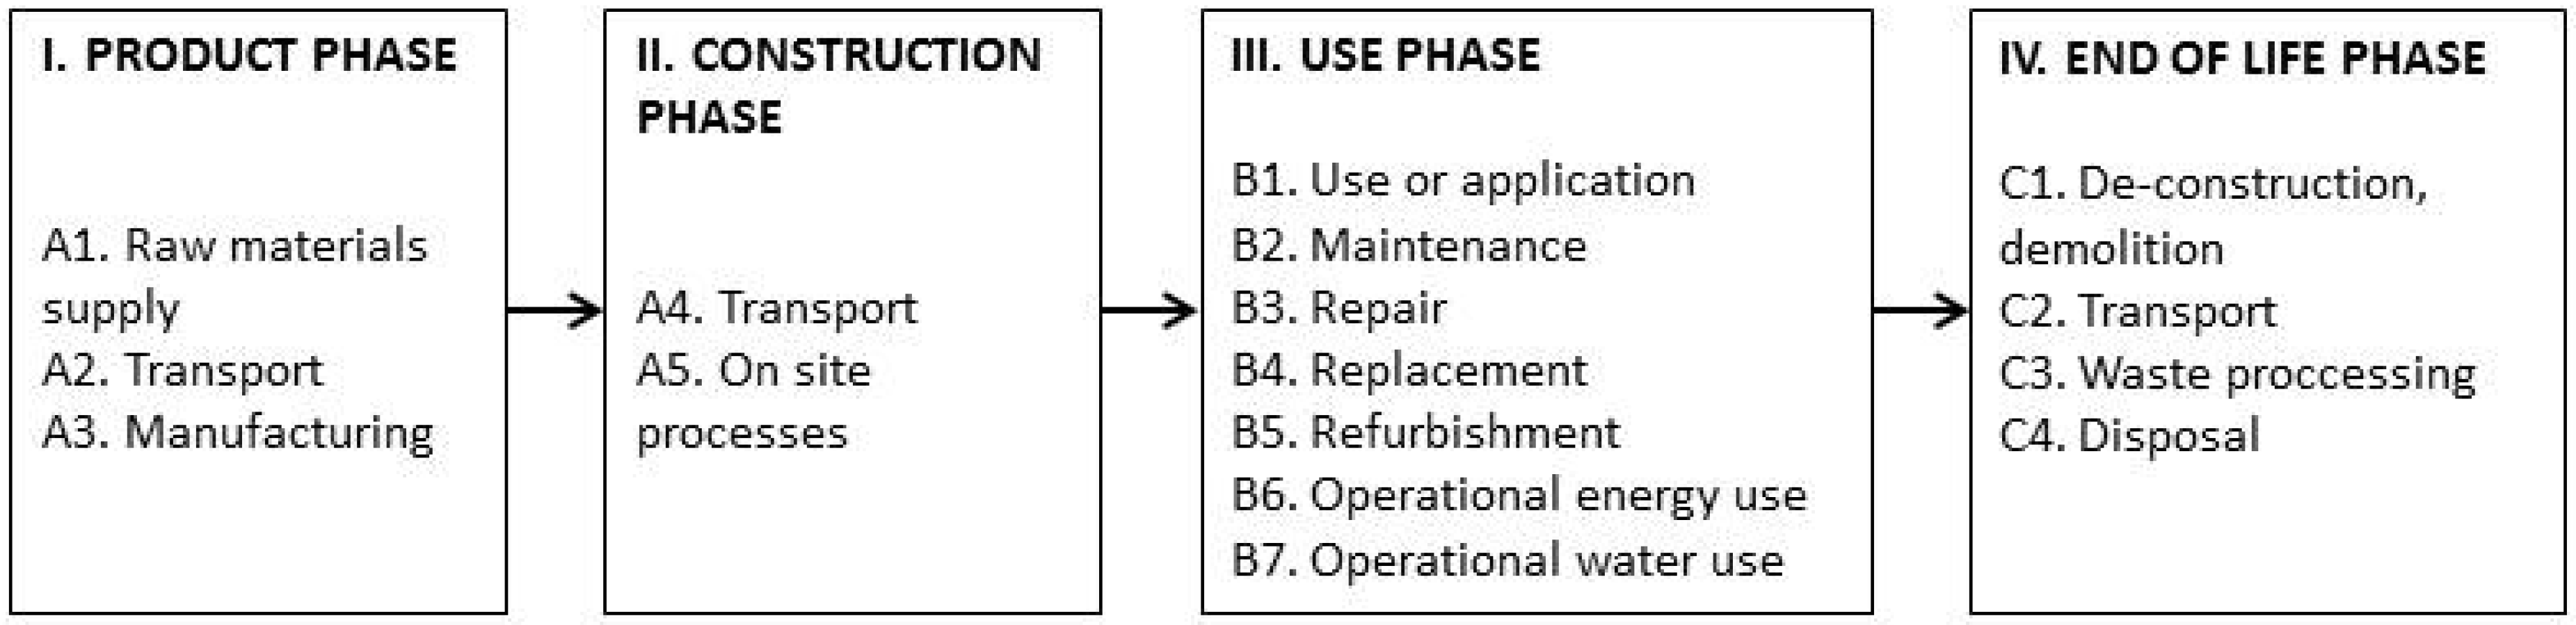
Specifically for the construction sector, new standards, such as EN 15978:2011 [
20], already define the different phases of a building life cycle and a number of indicators and methods used to declare the results of the analysis, which are midpoint level (e.g., Global Warming Potential in kg CO
2 equivalent, or Non Renewable Primary Energy Use, in MJ). A description of the building stages defined by EN 15978 is shown in
Figure 1.
Figure 1.
Building stages defined by EN 15978 [
20].
Figure 1.
Building stages defined by EN 15978 [
20].
Despite the standardization efforts, it is difficult to find published work including all the described life cycle stages, and instead most studies have focused on just some of the stages,
i.e., product phase (A1-3) and operational energy use stage (B6).
Table 1 shows that very few authors considered all the LCA phases in their studies, being a general trend the omission of some life cycle modules such as on site processes (A5) or maintenance (B2). These omissions are due mainly to the lack of information, the difficulty of predicting future scenarios and the relatively low impact in comparison to the whole life cycle, which according to previous studies [
21,
22] is less than 1% for the life cycle energy use. Only some studies assess the replacement phase (B4), which is directly related to the estimated service life (ESL) of each product used which may have a remarkable influence in achieving Life Cycle Zero Energy Buildings (LC-ZEB) [
23]. Regarding the calculation method used, it is worth mentioning that a process LCI approach is generally used, except for few studies such us Stephan
et al. [
24,
25] or Kofoworola
et al. [
26], which use the hybrid LCI analysis.
In order to evaluate the relation between different simplifications and to analyze the influence of these simplifications in the evaluation of a building energy refurbishment, the authors will compare three calculation methodologies: the first methodology is the full LCA methodology (see
Table 2), which obviously considers all life cycle stages. The second methodology is a simplified LCA (LCA-Si), focusing only on the evaluation on the product, replacement and operational energy use phases, as applied by Hernandez
et al. [
23] prior to the definition of the concept of Zero Energy Building with a life cycle approach. Finally, the third methodology is an operational stage assessment (OSA), where the evaluation focuses only on the reduction of the impact during the operational stage of the building. This third methodology is much simpler and generally more accessible to a wider range of technicians, as can be linked with building energy performance evaluation and with building energy rating schemes.
Table 1.
Building Life Cycle Stages in relation to existing studies.
Table 1.
Building Life Cycle Stages in relation to existing studies.
| Building Life Cycle Stages | Erlandsoona et al., 2004 [27] | Junnilla, 2004 [28] | Citherlet et al., 2007 [29] | Zabalza et al., 2009 [30] | Utama et al., 2009 [31] | Kofoworola et al., 2009 [26] | Blom et al., 2010 [32] | Blengini et al., 2010 [33] | Gustavsoon et al., 2010 [34] | Hernandez et al., 2010 [23] |
|---|
| Product phase (A1-3) | X | X | X | X | X | X | X | X | X | X |
| Transport (A4) | - | X | X | - | X | X | X | X | X | - |
| On site processes (A5) | - | X | - | - | X | X | - | X | - | - |
| Maintenance (B2) | - | X | X | - | - | X | X | X | - | - |
| Replacement (B4) | - | - | X | - | X | - | X | X | - | X |
| Operational energy use (B6) | X | X | X | X | X | X | X | X | X | X |
| End of life phase (C1-4) | - | X | X | - | - | X | X | X | - | - |
| Building Life Cycle Stages | Oritz et al., 2010 [35] | Dodoo et al., 2010 [36] | Malmqvist et al., 2011 [37] | Rossi et al., 2012 [38] | Stephan et al., 2012 [24] | Ramesh et al., 2012 [39] | Stephan et al., 2013 [25] | Mosteiro et al., 2014 [40] | Dodoo et al., 2014 [41] | - |
| Product phase (A1-3) | X | X | X | X | X | X | X | X | X | - |
| Transport (A4) | X | X | - | X | X | X | X | X | | - |
| On site processes (A5) | X | X | - | - | X | X | X | X | X | - |
| Maintenance (B2) | X | - | - | - | - | - | - | - | - | - |
| Replacement (B4) | - | - | - | - | X | X | X | X | - | - |
| Operational energy use (B6) | X | X | X | X | X | X | X | X | X | - |
| End of life phase (C1-4) | X | X | - | X | - | - | - | X | X | - |
Table 2.
Building Life Cycle Stages in relation to the three methods considered: Life Cycle Assessment (LCA), simplified LCA (LCA-Si) and Operational Stage Assessment (OSA).
Table 2.
Building Life Cycle Stages in relation to the three methods considered: Life Cycle Assessment (LCA), simplified LCA (LCA-Si) and Operational Stage Assessment (OSA).
| Building Life Cycle Stages | Building Stages | LCA | LCA-Si | OSA |
|---|
| A1–3 | Product phase | X | X | - |
| A4 | Transport | X | - | - |
| A5 | On site processes | X | - | - |
| B2 | Maintenance | X | - | - |
| B4 | Replacement | X | X | - |
| B6 | Operational energy use | X | X | X |
| C1–4 | End of life phase | X | - | - |
2.2. Case Study
In order to assess to what extent simplifications in the life cycle calculations may help or mislead decision-making processes, the three methodologies are applied for selecting the best energy refurbishment option for the same building: A residential building built in 1962 in San Sebastian (Spain).
The analysis takes into account the different life cycle phases of the building, starting from the existing scenario and considering a range of refurbishment strategies. A Reference Service Life (
RSLb) of 50 years from the date of refurbishment is considered, a value often used by default, since it is generally difficult to foresee the real life span of a building [
37].
The functional equivalent used to compare the different options is the building itself and the results are expressed per year and per unit of useful heated floor area, meeting the conditions of design requirements (thermal comfort, etc.).
From the range of environmental and resource indicators that are used on common LCA, this study will focus for simplicity on one indicator, which is “Use of non-renewable primary energy resources” (in MJ-Eq/functional unit) according to the CML method [
18]. A sensitivity analysis for using a range of other environmental indicators on the evaluation is presented in
Section 4 of this paper.
2.2.1. Building Context
With a total net floor area of 9484 m
2 and a heated surface of 8574 m
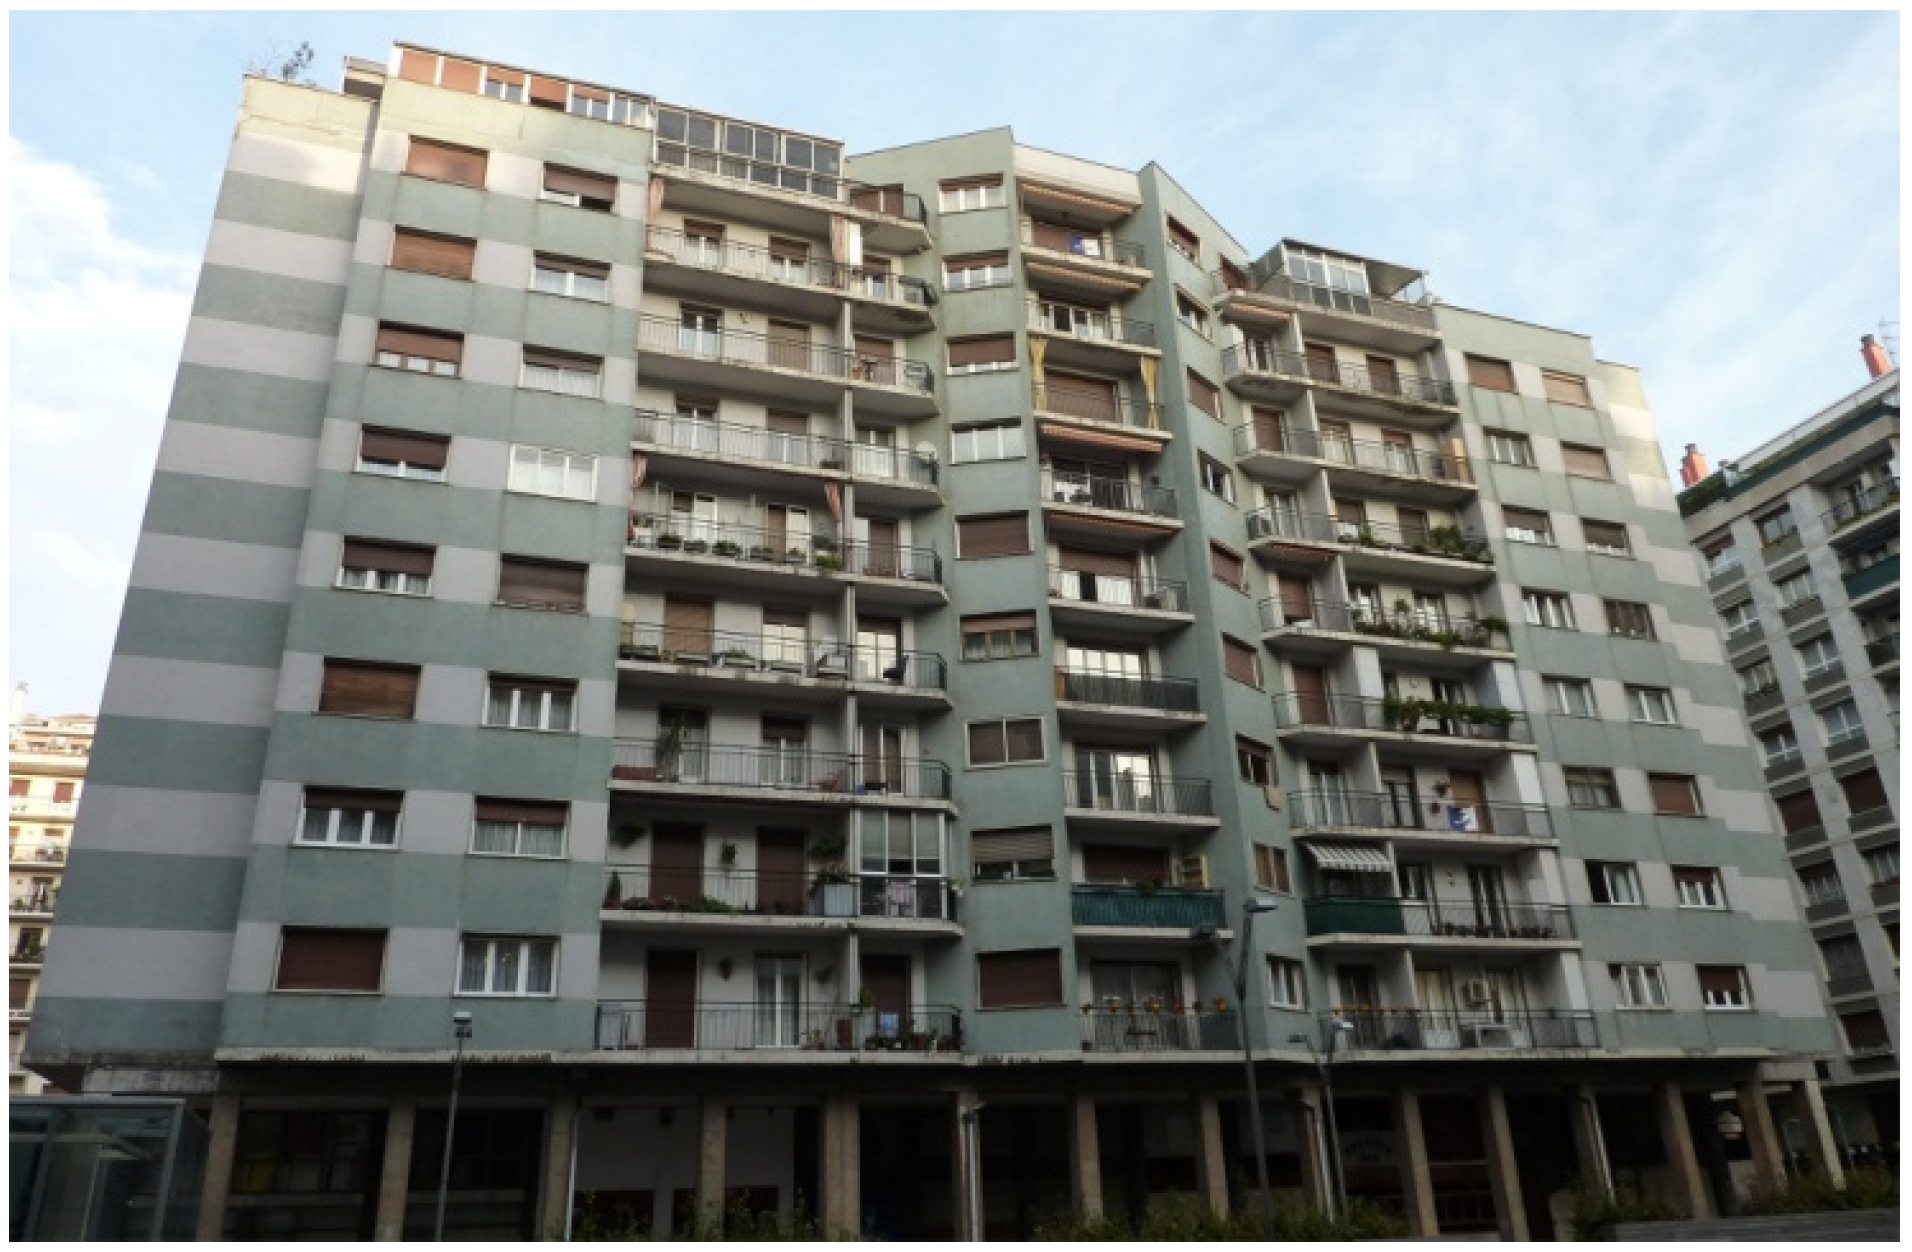
2, the building consists of a commercial ground floor and 9 residential floors (with 12 apartments on each floor), which are heated by a centralized natural gas heating system (see
Figure 2). All apartments are naturally ventilated and no cooling or renewable energy systems are installed.
U-values (W/(m
2·K)) of the building envelope before its refurbishment include cavity wall façade 1.12 W/(m
2·K), reinforced concrete deck with ceramic finish 2.34 W/(m
2·K), reinforced concrete first floor slab 1.79 W/(m
2·K), monolithic glazing 5.77 W/(m
2·K) and aluminum frame 4.2 W/(m
2·K). These values do not meet the minimum requirements [
42] specified by the current national building regulations.
The building is located in San Sebastian, where the annual average temperature is 14 °C. In summer, the daily average temperature is below 20 °C, so cooling systems are generally unnecessary, particularly if measures such as solar shading or night cooling are implemented. In winter, the daily average temperature is about 10 °C, justifying the need for heating systems.
Figure 2.
Picture of the case study building.
Figure 2.
Picture of the case study building.
2.2.2. Baseline Operational Energy Use
During their use phase, buildings require operational energy for meeting the demand for heating, cooling, hot water, ventilation, lighting and the use of appliances. However, refurbishment projects such as the one discussed in this paper are focused on the building envelope and aimed at reducing the operational energy use of buildings for heating and cooling, and do not directly affect other building end-uses.
Using the Design Builder [
43] software and the International Weather Files for Energy Calculation [
44] for the city of San Sebastian, the final energy demand for heating the building before refurbishment was estimated. Being an interface for Energy Plus, Design Builder is a dynamic energy simulation tool that generates detailed data about the energy performance of a building during 1 year by using real weather data as well as temporal aspects such as solar radiation, thermal mass or user occupancy. The building model developed replicates the real geometry, including overhangs, setbacks and the surrounding buildings. Parameters like occupancy rate, schedules, and internal gains have been estimated following current Spanish regulations [
42]. For example, a general occupancy value of 0.03 people/m
2 was considered and the common areas (stairs and portals) and ground floor were treated as unheated without occupation or internal gains.
The heating system is composed of a centralized natural gas installation with a nominal performance of 0.92. Thermostats are set at 21 °C from 4 p.m. until 11 p.m. for the heating period (from 30 September to 31 May). The baseline operational heating demand calculated according to these parameters is 264 MJ/(m
2·a). This demand is multiplied by the system performance and by 1.13, which is the conversion factor from natural gas to Non-Renewable Primary Energy use (NRPE) in Spain, taken from the Ecoinvent 3.0 database [
45]. The resulting baseline operational Non Renewable Primary Energy (NRPE) use for the building is 324 MJ/(m
2·a). For the variables in Equation (1), refer to
Table 3.
Table 3.
Variables applied during the calculation of the Non Renewable Primary Energy (NRPE) of each building life cycle phase.
Table 3.
Variables applied during the calculation of the Non Renewable Primary Energy (NRPE) of each building life cycle phase.
| Acronym | Description | Unit |
|---|
| BB6 | Operational energy use of the baseline building | NRPE (MJ) |
| CEA5 | Energy use associated to construction waste treatment of each refurbishment strategy | NRPE (MJ) |
| CFm | Conversion factor of the energy source m (MJ non renewable primary energy/MJ final energy) | NRPE (MJ) |
| Dm | Transport distance of product m | km |
| DWm | Transport distance of waste m from site to waste management facility | km |
| EDb | Baseline operational annual energy demand | MJ |
| EDm | Operational annual energy demand for the refurbished building | MJ |
| EEm | Embodied energy of material or system m applied during the refurbishment, expressed per unit of material or system (in kg, m2 or m3) | NRPE (MJ) |
| ESLm | Estimated service life of the material m | years |
| HS | Heated surface | m2 |
| IAt | Energy used in the transportation per t and km | NRPE (MJ) |
| IEEA1–3 | Initial embodied energy of each refurbishment strategy | NRPE (MJ) |
| IEA4 | Initial energy used in the transportation of each refurbishment strategy | NRPE (MJ) |
| IEC1–4 | Energy use associated to the end of life stage of each refurbishment strategy | NRPE (MJ) |
| RBB6 | Operational energy use of the refurbished building | NRPE (MJ) |
| REEB4(A1–3) | Recurrent embodied energy of each refurbishment strategy | NRPE (MJ) |
| REB4(A4) | Recurrent energy use associated to the transport of each refurbishment strategy | NRPE (MJ) |
| RSLb | Reference service life of the building | years |
| Qm | Quantity of materials and systems in each refurbishment strategy | kg-m2-m3 |
| Qmt | Quantity of material and system in each refurbishment strategy | t |
| WPm | percentage of waste generated in each refurbishment strategy | % |
| WTm | Energy use of the waste treatment process per kg | NRPE (MJ) |
| ρ
m | Performance of the energy generation system m | % |
2.3. Energy Refurbishment Strategies
In order to reduce the environmental impact related to the building’s heating, different energy refurbishment strategies have been evaluated during this study, taking into account that the area where the case study is located shows no historic, urban or architectonic restrictions, allowing direct refurbishment actions on all the envelope elements.
Refurbishment strategies will be applied to the case study in two efficiency levels. The basic efficiency level is based on restoration strategies that enforce the minimum thermal requirements determined by the existing regulations and standards. The advanced efficiency level strategies improve the thermal properties adding insulation to very high values such as those used in standards like the Passive House [
46].
Another variable considered for defining refurbishment strategies has been the type of material used, which is important for the life cycle performance particularly in relation to their embodied energy. The strategies have been subsequently divided also by the employment of low and high embodied energy materials.
Table 4 details the strategies chosen.
Table 4.
Set of energy refurbishment strategies applied in the case study.
Table 4.
Set of energy refurbishment strategies applied in the case study.
| Strategy | Efficiency Level | Embodied Energy of Construction Products | Strategy ID |
|---|
| Window replacement (1) | Basic (b) | 1b |
| Advanced (a) | 1a |
| Ventilated façade (2) | Basic | Low (l) | 2bl |
| High (h) | 2bh |
| Advanced | Low | 2al |
| High | 2ah |
| External Insulation System (3) | Basic | Low | 3bl |
| High | 3bh |
| Advanced | Low | 3al |
| High | 3ah |
| Internal (4) | Basic | Low | 4bl |
| High | 4bh |
| Advanced | Low | 4al |
| High | 4ah |
The first strategy focuses on the replacement of all existing windows with a new frame and glazing. The windows for the basic energy efficiency level (1b) consist of a double glazing (2.7 W/(m2·K)) and aluminum frame (2.9 W/(m2·K)), meeting the minimum thermal requirements for refurbishments in Spain. The windows for advanced level (1a) consist of a low-emissivity coated glazing (1.4 W/(m2·K)) and wooden frames (1.2 W/(m2·K)). The second solution is a ventilated facade system, which is composed of an aluminum substructure, a layer of insulation and a ceramic outlayer. The third strategy is an external insulation system composed of an insulation layer and mortar outlayer. Finally, the fourth strategy is an indoor thermal improvement solution consisting of a layer of insulation and plasterboard.
According to the efficiency level parameter, different insulation thicknesses are proposed for basic and advanced levels. The projected insulation thicknesses for the basic efficiency energy level are 5 cm for the façade, 8 cm for the deck and 6 cm for the first floor slab. The thicknesses proposed for the advanced energy efficiency level are 25, 30 and 15 cm, respectively. Regarding the aluminum profile of the ventilated façade, 10.2 cm2 of aluminum per m2 is projected for the basic level and 49.6 cm2 for the advanced level. Strategies with low embodied energy insulation apply wooden fiber and high embodied energy strategies apply Extruded Polystyrene (XPS) insulation. Regarding the other products that make up the three systems (outlayer, mortar and plasterboard), their properties and quantities are maintained in all cases. It should also be highlighted that secondary products that form part of these strategies, such as screws, sealants, glues are not considered within the scope of the study.
2.4. Calculation of Non Renewable Primary Energy (NRPE) Use for Each Life Cycle Phase
2.4.1. Input Data
Product Phase (A1–3), Initial Embodied Energy. The embodied energy or initial energy input associated with the production phase of each product and system has been calculated applying Equation (2) (for variables, refer to
Table 3) using process data from Ecoinvent [
45] and GaBi [
47] databases as well as Environmental Product Declarations (EPDs) issued by manufacturers (see
Table 5).
Transportation from Production Unit to Point of Use (A4). The transportation of building materials to construction sites involves a variety of transportation modes. Equation (3) describes the calculation of the NRPE use for this stage (for variables, refer to
Table 3). Due to the lack of detailed transportation data for each of the materials used to the building site, three different distances are considered (see
Table 5): 50 km (distribution within the province), 120 km (distribution within the region) and 300 km (distribution within the same country). The 300 km value is based on a standard parameter defined in EeB Guide [
48], which sets up an average transportation distance in Europe.
Construction Process (A5). Energy use associated with the construction stage of a new envelope is not considered since it typically represents less than 1% of the life cycle energy demand of the building [
21]. However the transportation and end of life treatment processes of the inert and non-hazardous wastes that will be managed in a landfill are considered. For this case study, it is considered that 3% of the total final product will be wasted during their placement and transported 50 km to the landfill.
Replacement (B4). Recurrent Embodied Energy (A1–3). As described in Equation, the recurrent embodied energy represents the sum of energy inputs associated with the energy required to manufacture and replace refurbishment materials across the building’s service life. Service life and durability of materials are among the most important factors affecting the recurrent embodied energy. In accordance with ISO 15686-8:2008 [
49], construction materials and systems usually do not possess the same Estimated Service Life (
ESLm) as the building Reference Service Life (
RSLb) and may require one or multiple replacements over the building’s service life. The lower the service life of a material, the greater the quantity of material required for ongoing maintenance and repair and therefore the greater the embodied energy associated with manufacturing and installing replacement materials throughout a building’s life.
Table 5 shows the values of
ESLm applied in this case study, selected according to the information obtained by different EPDs or databases such as National Association of Home Builders (NABH) [
50].
RSLb/ESLm = 1, No replacement (same or longer material SL than the RSLb).
RSLb/ESLm > 1, Replacement is necessary.
Replacement (B4). Recurrent Transportation from Production Site to Point of Use (A4). Due to the replacement of some products during the
RSLb of the case study, the environmental impact related with the transportation process of the additional products is estimated using Equation (6). The same transport distances of the initial transport phase have been used.
Operational Energy Use (B6). As explained before, in this case study focused on refurbishment of the building envelope, the operational energy use only includes the heating of the building during its useful life (see Equation (7)). Other end-uses (hot water production, use of appliances, illumination,
etc.), despite being very relevant in an overall building energy use evaluation will not be affected by the proposed refurbishment. The new heating demands of the refurbished building scenarios have been calculated with the same methodology as the baseline operational energy use,
i.e., through building energy simulations with Design Builder software.
End of Life (C1–4). Energy consumption of the end-of-life stage is usually not considered since it typically represents less than 1% of the life cycle energy of buildings [
51]. However, in order to assess all building phases, during this study the transportation of the products (initial and recurrent) to the waste treatment facility and their management is evaluated (see Equation (8)). For this case study, road transportation during 50 km to the landfill for inert and non-hazardous waste is considered. Being beyond the scope of the study, potential recycling or reuse of the aluminum used in the frame of the windows (strategy 1) and in the ventilated facade sub-structure (strategy 2) is not included.
Table 5 shows information about the parameter applied to evaluate the NRPE use for each product and process that participates in different refurbishment strategies, allowing the calculation of the impact of each Life Cycle Phase.
Table 5.
Non Renewable Primary Energy (NRPE), Transport characteristics, and Estimated Service Life of the materials (ESLm) for products and processes included in the analysis.
Table 5.
Non Renewable Primary Energy (NRPE), Transport characteristics, and Estimated Service Life of the materials (ESLm) for products and processes included in the analysis.
| Product/Process | Non Renewable Primary Energy Use | Transport (km) | ESLm |
|---|
| Value | Data Source | Years | Data Source |
|---|
| Double glazed | 463 (MJ/m2) | INIES—FDES SGG Climaplus [52] | Truck-120 | 30 | Environmental Product Declaration (EPD) |
| Triple glazed | 707 (MJ/m2) | INIES—FDES. SGG Climatop [53] | Truck-300 | 30 | EPD |
| Aluminum frame | 1852 (MJ/m2) | GaBi. Aluminum wing profile, powder coated PE (2010) | Truck-50 | 20 | National Association of Home Builders (NAHB) |
| Wood frame | 206 (MJ/m2) | ENVIRONDEC-Cormo [54] | Truck-300 | 30 | EPD |
| Aluminum sub-structure | 118 (MJ/kg) | GaBi. Aluminum extrusion profile PE (2010) | Truck-120 | 50 | NAHB |
| Insulation (high) | 92.4 (MJ/kg) | Ecoinvent. Polystyrene, extruded (XPS), at plant | Truck-50 | 50 | NAHB |
| Insulation (low) | 5 (MJ/m3) | GaBi. Lightweight wood fibers panel PE (2010) | Truck-300 | 50 | NAHB |
| Outlayer | 256 (MJ/m2) | GaBi. Ceramic façade panels—NBK Ceramic PE (2008) | Truck-120 | 50 | NAHB |
| Mortar | 1.3 (MJ/kg) | Ecoinvent. Cement mortar, at plant | Truck-50 | 35 | NAHB |
| Plasterboard | 54 (MJ/m2) | Ecoinvent. Gypsum plaster board, at plant | Truck-120 | 30 | NAHB |
| Transport-truck | 0.8 (MJ/(t·km)) | GaBi. Articulated lorry (40t) incl. fuel ELCD (2005) | - | - | - |
| Landfill | 0.2 (MJ/kg) | GaBi. Landfill for inert matter (construction waste) (2010) | - | - | - |
2.4.2. Sample Calculation of Non Renewable Primary Energy (NRPE) Use for one of the Energy Refurbishment Strategies
As an example, in this section, the environmental calculation of a proposed rehabilitation strategy (1a + 2ah) is explained. This strategy focuses on replacing existing windows with 204 m
2 of new wooden frames (11,526 kg) and 1018 m
2 of triple glazing (34,917 kg). The façade will be refurbished with a ventilated façade system, which consists of 5581 m
2 of 25 cm XPS insulation (60,275 kg), 12,830 kg of Aluminum sub-structure with a section of 49.6 cm
2 and 4409 m
2 of ceramic façade panels (60,274 kg). Through this information, and the values previously defined in
Table 5 (
BB6,
RSLb,
ESLm,
EEm,
Dm,
Qm,
Qmt,
IAt,
DWm,
CFm and ρ
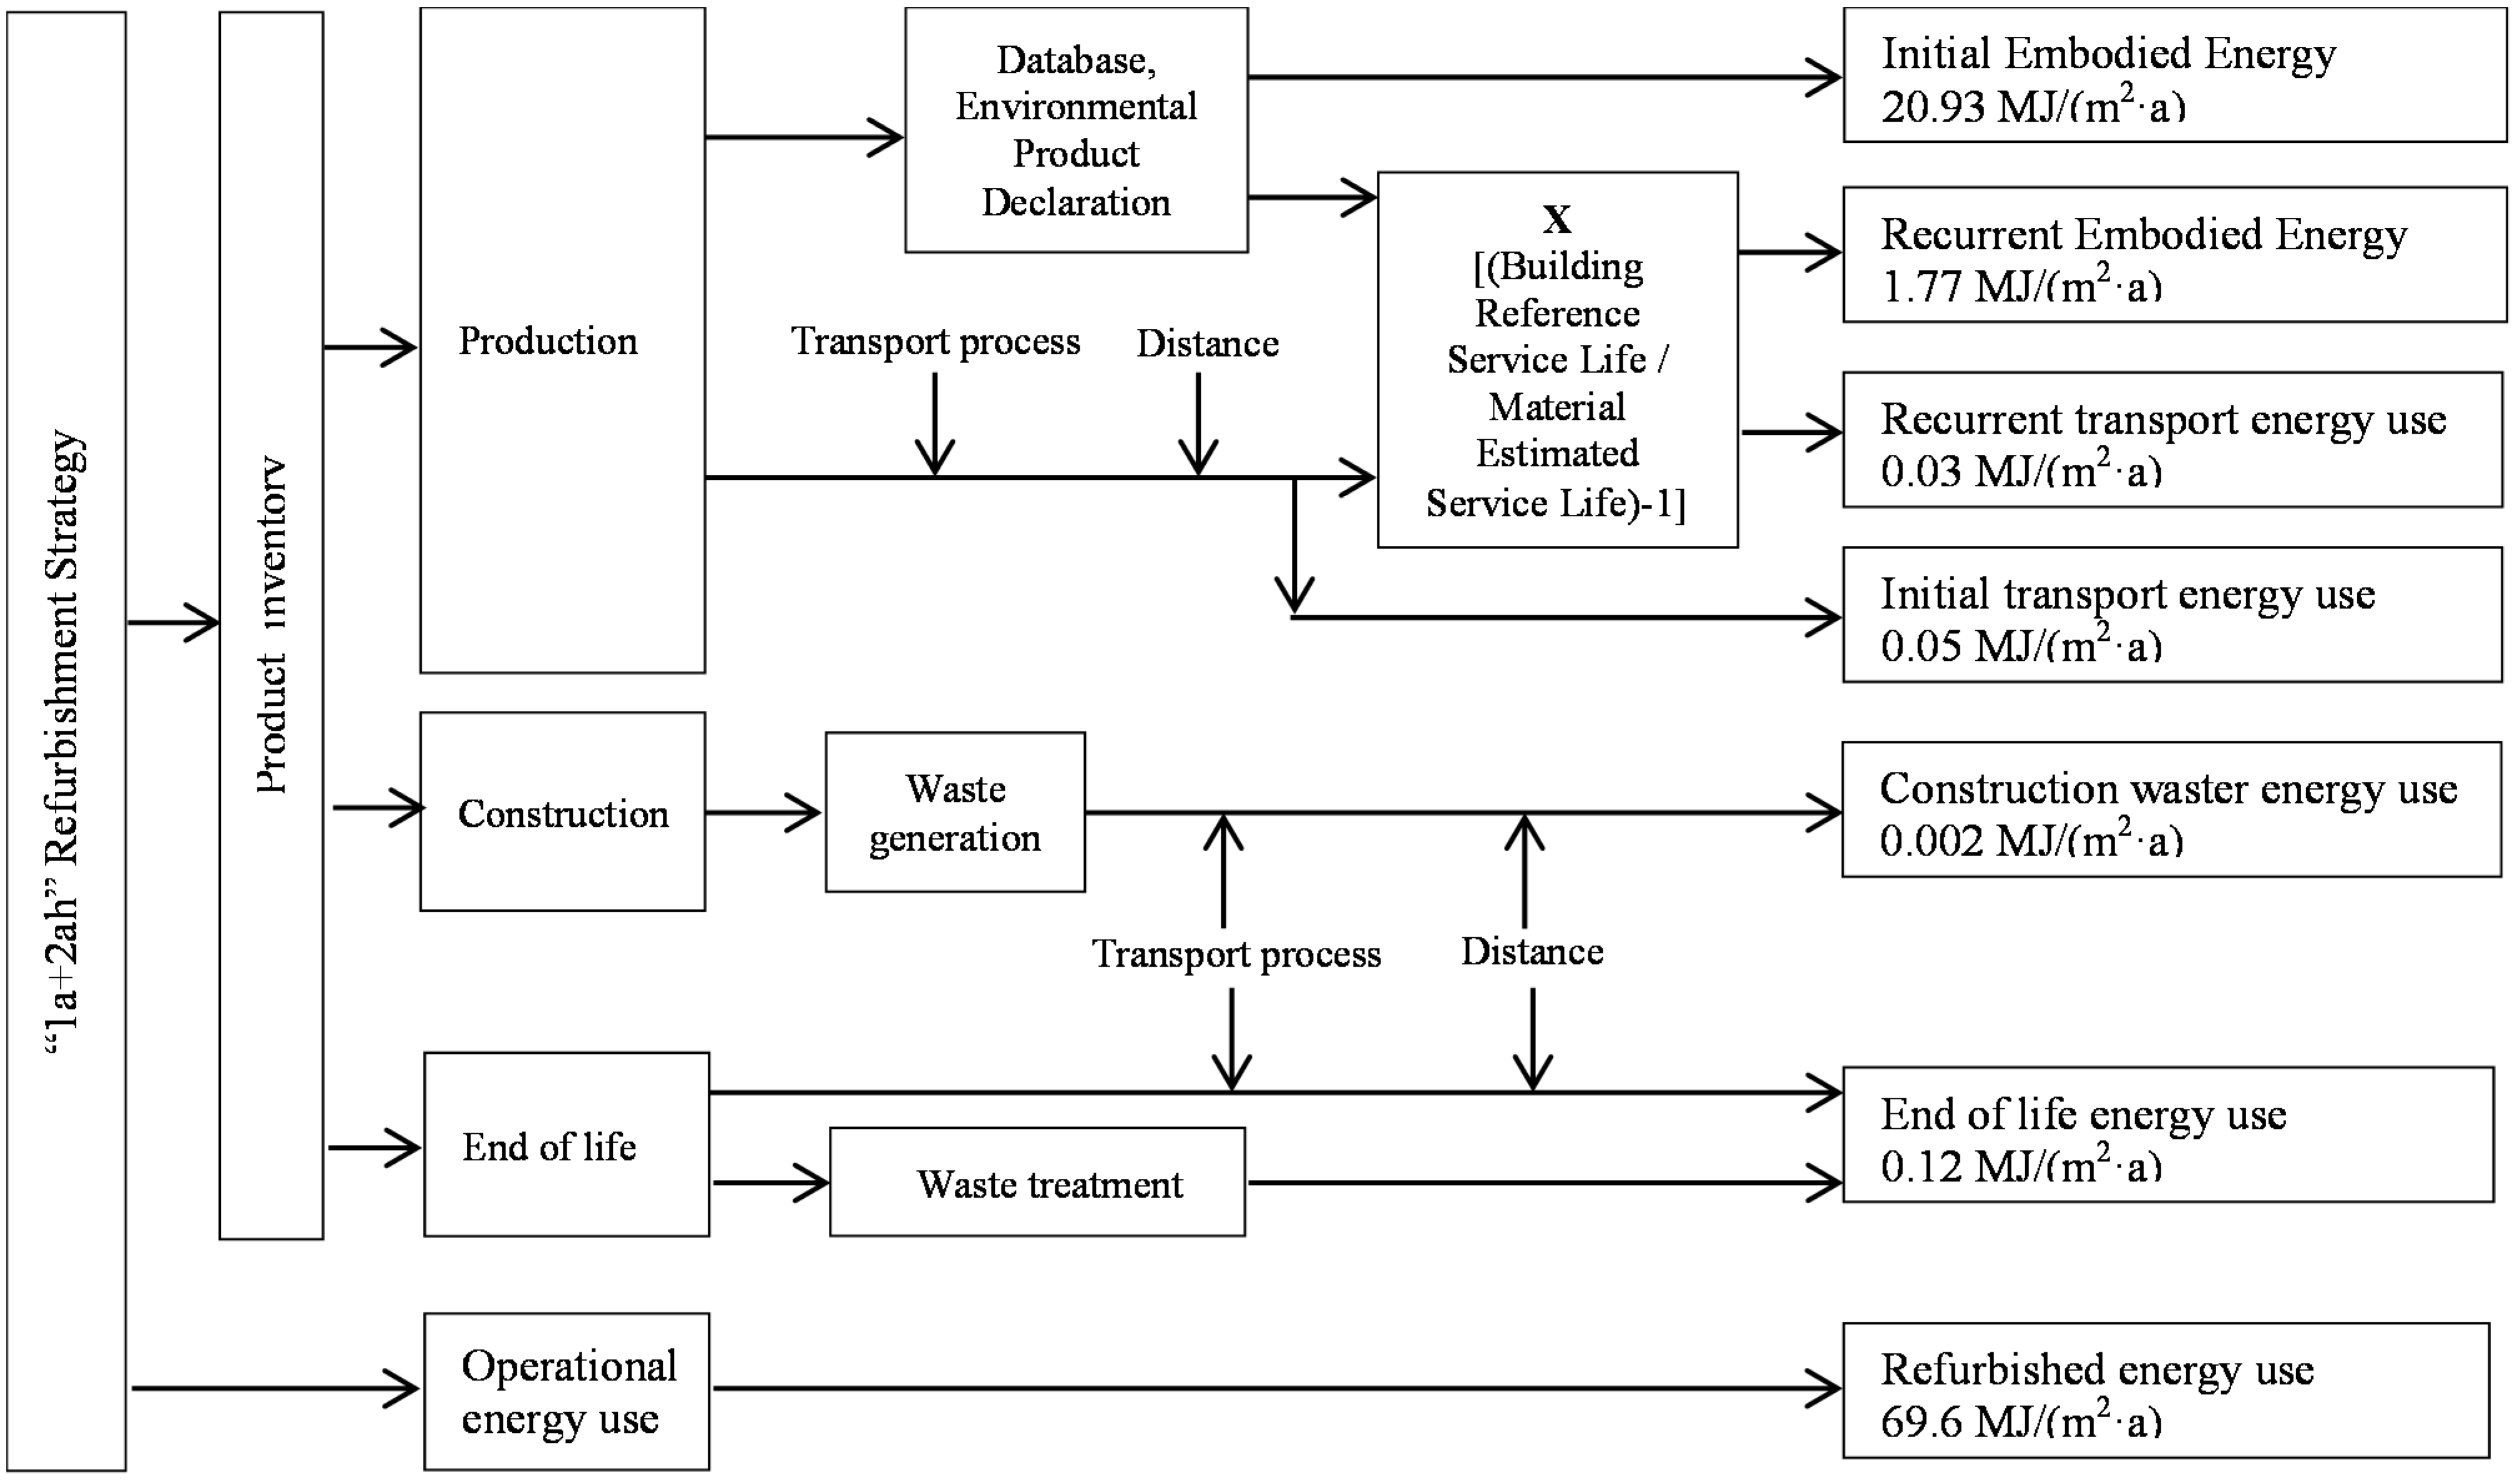
m), the authors have performed the calculation of the NRPE use of each of the life cycle phases of this strategy.
Figure 3 shows that the NRPE use of the building after applying the refurbishment strategy 1a + 2ah is reduced from 324 MJ/(m
2·a) to 92 MJ/(m
2·a), reaching a reduction of 72%, which is mostly due to the operational energy use phase (69.6 MJ/(m
2·a)) and the Initial Embodied Energy phase (20.93 MJ/(m
2·a)).
Figure 3.
Scheme of inputs and Non Renewable Primary Energy (NRPE) use of each life cycle phase of the 1a + 2ah energy refurbishment strategy.
Figure 3.
Scheme of inputs and Non Renewable Primary Energy (NRPE) use of each life cycle phase of the 1a + 2ah energy refurbishment strategy.
3. Results
3.2. Comparison of LCA, LCA-Si and OSA Methodologies
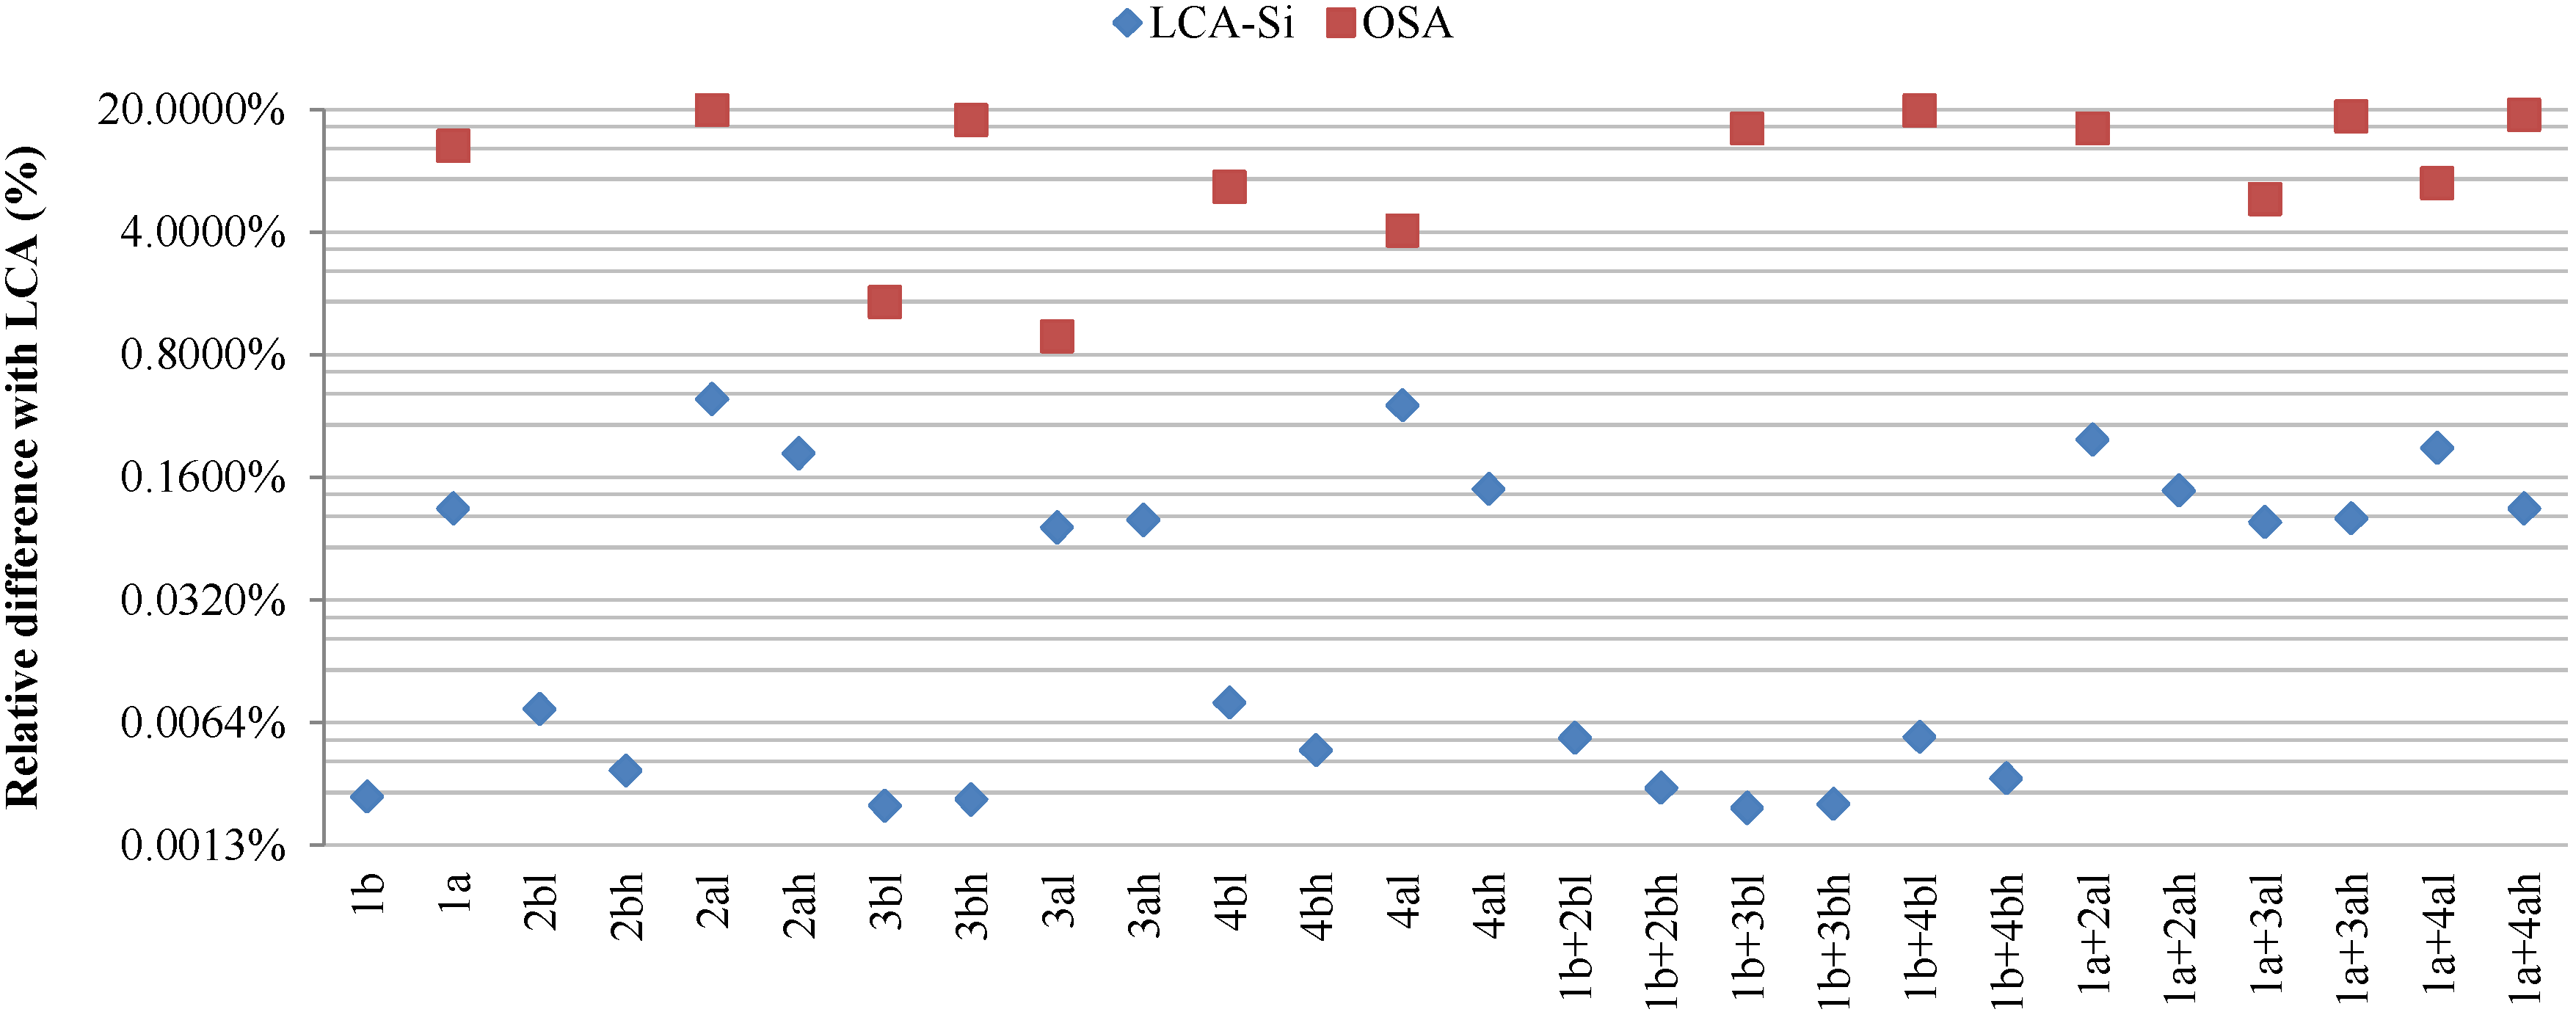
In order to evaluate the influence of the methodological simplifications in a building energy refurbishment decision making process, the difference between the OSA and LCA-Si from a full LCA is expressed as a relative difference (see Equations (9) and (10)) in
Figure 5.
Figure 5.
Relative difference of LCA-Si and OSA with LCA.
Figure 5.
Relative difference of LCA-Si and OSA with LCA.
The values of
Figure 5 shows that for this case study and for the selected NRPE indicator, the difference between the results obtained with LCA and LCA-Si methodologies is below 0.39%. However, the results obtained with the OSA methodology in comparison with LCA present differences varying from 0.34% (for 3al strategy) to 15% (for 2ah strategy). Higher differences occur in the case of strategies using products with higher embodied energy associated.
4. Sensitivity and Uncertainty Evaluation
With the aim of drawing a general conclusion that offers an overview of residential building refurbishment actions, a sensitivity analysis tackling different relevant aspects is conducted in this section. In order to simplify and facilitate the reading of the results, the study only reflects the results for the strategies 2ah and 3al, which presented the largest and lowest percentage differences on the results when analyzed respect the LCA methodology.
4.1. Reference Service Life of the Building (RSLb)
The annualized NRPE use has been assessed for different
RSLb values: 25, 50 (current scenario), 75 and 100 years.
Table 7 shows that the difference between the results obtained by LCA and OSA methodologies increases when
RSLb is lower, up to a difference of 30.24% in strategy 2ah. This difference falls to 0.36% for strategies applying products with lower embodied energy and when the same
RSLb (25 years) is applied. Regarding the difference between the LCA and LCA-Si methodologies, the lower
RSLb value, and the greater the difference. However differences between these two methodologies are in all cases below 1%.
Table 7.
Sensitivity analysis results for refurbishment strategies 2ah (advanced efficiency level ventilated façade system with high embodied energy products and 3al (advanced efficiency level external insulation system with low embodied energy products).
Table 7.
Sensitivity analysis results for refurbishment strategies 2ah (advanced efficiency level ventilated façade system with high embodied energy products and 3al (advanced efficiency level external insulation system with low embodied energy products).
| Non Renewable Primary Energy use Reduction (MJ/(m2·a)) |
|---|
| Variable | 2ah Strategy | Variable | 3al Strategy |
|---|
| LCA | LCA-Si | OSA | LCA | LCA-Si | OSA |
|---|
| Reference Service Life Building (RSLb) |
| RSL25 | 89.1 | 89.1 | 127.4 | RSL25 | 127.1 | 127.1 | 127.4 |
| RSL50 | 108.2 | 108.3 | 127.4 | RSL50 | 127.0 | 127.1 | 127.4 |
| RSL75 | 114.5 | 114.7 | 127.4 | RSL75 | 127.0 | 127.1 | 127.4 |
| RSL100 | 117.8 | 117.9 | 127.4 | RSL100 | 127.1 | 127.2 | 127.4 |
| Estimated Service Life Materials (ESLm) |
| ESLhalf | 88.9 | 89.1 | 127.4 | ESLhalf | 126.8 | 126.9 | 127.4 |
| ESLcurrent | 108.2 | 108.3 | 127.4 | ESLcurrent | 127.0 | 127.1 | 127.4 |
| ESL50 years | 108.2 | 108.3 | 127.4 | ESL50 years | 127.2 | 127.3 | 127.4 |
| Product Transport Distance (Dm) |
| Dm50 | 108.2 | 108.3 | 127.4 | Dm50 | 127.1 | 127.1 | 127.4 |
| Dm120 | 108.2 | 108.3 | 127.4 | Dm120 | 127.0 | 127.1 | 127.4 |
| Dm300 | 108.1 | 108.3 | 127.4 | Dm300 | 127.0 | 127.1 | 127.4 |
| Dm500 | 108.1 | 108.3 | 127.4 | Dm500 | 126.9 | 127.1 | 127.4 |
| Dm1000 | 107.9 | 108.3 | 127.4 | Dm1000 | 126.8 | 127.1 | 127.4 |
| Dm2000 | 107.7 | 108.3 | 127.4 | Dm2000 | 126.6 | 127.1 | 127.4 |
| Dm5000 | 106.8 | 108.3 | 127.4 | Dm5000 | 125.8 | 127.1 | 127.4 |
| Climate Zone |
| Current | 108.2 | 108.3 | 127.4 | Current | 127.0 | 127.1 | 127.4 |
| Cold | 233.8 | 233.9 | 253.1 | Cold | 252.7 | 252.8 | 253.1 |
| Warm | 59.3 | 59.4 | 78.6 | Warm | 78.1 | 78.2 | 78.6 |
| Life Cycle Inventory |
| LCI-Process | 108.2 | 108.3 | 127.4 | LCI-Process | 127.0 | 127.1 | 127.4 |
| LCI-Hybrid | 49.7 | 50.2 | 127.4 | LCI-Hybrid | 125.6 | 126.2 | 127.4 |
| Operational Energy Use |
| +20% | 131.7 | 131.8 | 151.0 | +20% | 150.6 | 150.7 | 151.0 |
| −20% | 72.8 | 72.9 | 92.1 | −20% | 91.7 | 91.8 | 92,1 |
4.2. Estimated Service Life of the Products (ESLm)
ESLm values for each product and system where defined for the baseline scenario (see
Table 5). However, depending on the real use and maintenance practices, these values may be reduced or increased and, therefore, two additional
ESLm are assessed: Reducing the lifetime of all products by half and increasing their life by up to 50 years.
Table 7 shows that the reduction of the
ESLm increases the difference between the LCA and OSA methodologies, obtaining a difference of up to 30.2% in 2ah strategy. On the other hand, for the same strategy,
ESLm 50 year values reduce the difference to 15.11%. For those refurbishment strategies using products with a lower embodied energy the difference decreases but continues below 0.5%.
4.3. Transportation Distance
Transportation distance values from the production gate to the building site have been changed to 50, 120, 300, 500, 1000, 2000 and 5000 km.
Table 7 clearly shows that except in very long distances (5000 km or more), the transportation distance of the products does not alter the initial results obtained from the different methodologies. Furthermore, although all products and systems are transported from 5000 km, the overall NRPE use of the building will only be 0.01% higher than in a scenario where all products and systems are transported within a distance of 50 km. Although these results reflect that transport distance is practically irrelevant for reducing the NRPE use, it is worth noting that transport may have remarkable contributions to other environmental impact categories related to air quality or noise, as well as in economic terms where transport costs are also relevant.
4.4. Climate Zone
In order to check the influence of applying the same refurbishment strategies in other climate zones, two additional climate zones are evaluated: Warm climate (south of Italy, Palermo) and cold climate (Norway, Oslo). Due to the relevance of cooling consumption in warm climates, in this case the operational energy includes energy consumption for both heating and cooling indoor spaces (see Equation (7)). The cooling system consists of individual air-air electric installations with a nominal performance of 3 (ρ
m value). Thermostats are set at 26 °C from 12 a.m. until 8 p.m. for the cooling period (from 1 June to 31 August). To calculate the cooling related Non-Renewable Primary Energy use (NRPE), the demand is multiplied by the system performance and by a conversion factor value of 2.34 corresponding to an average value for the electricity mix in Europe [
55].
Table 7 shows that in countries with a cold climate, refurbishment strategies lead to high reductions of NRPE during the use phase, and therefore the influence of other life cycle stages is reduced. The maximum difference between LCA and OSA results to 8.5% (strategy 2ah) for cold climates. In warm climates with a lower heating demand, the difference between LCA and OSA results to 32% (strategy 2ah), because the NPRE increase due to the use of products is relatively higher.
4.5. Uncertainty on Data on Embodied Energy of Products
Most current studies, including the present one, use environmental data from LCI databases and/or environmental product declarations, which are based on the LCA methodology for calculating the environmental inputs and outputs of each process involved in the corresponding supply chain (bottom-up technique). This process based LCA approach may conduct to a large associated uncertainty [
56] due to the truncation error derived from data scarcity at a certain point of the upstream supply chain. Crawford [
57] has shown that this error can be up to 87% of the embodied energy of building products, and has proposed the use of input-output LCA analysis, a top-down technique that establishes a link between economic transactions and the energy intensity of economic sectors, or hybrid LCA analysis, combining process and input-output analysis, to capture all the upstream processes. Crawford [
58], Crawford and Stephan [
59] and Stephan and Stephan [
60] have shown that input-output-based hybrid analysis can produce embodied energy figures around four times higher than process analysis, for the same building. In order to assess the effect of a potential underestimation of the embodied energy values, a new scenario has been calculated multiplying the energy values by an average coefficient of 4.03 [
60].
When data derived from hybrid LCA studies is used instead of process-based data, the difference between LCA and OSA increases, reaching a maximum difference of 60.5% for strategies with highest embodied energy values. This large difference on the results respond to the much high values of NRPE for building products that are obtained through LCI-hybrid methods. With these values, the overall reduction of NRPE for the LCI-Hybrid method is less than half the reduction obtained with the LCI-Process method for the LCA and LCA-Si.
4.6. Uncertainty in Relation to Occupancy Schedules and User Behavior
Occupancy schedules may significantly vary the results of operational energy use. This parameter adds a remarkable uncertainty to the results, as it has a critical role when estimating energy loads in residential buildings, as shown for example by Topouzi [
61]. Indeed, Pettersen [
22] and Juodis
et al. [
62] have shown that user behavior could vary the primary operational energy associated with space heating by ±15%–20%. Therefore, two new scenarios have been added to take these issues into account, assuming that the heating demand of the baseline scenario can be 20% higher and 20% lower than initially calculated due to occupancy and behavioral issues.
Table 7 shows that when the operational energy consumption increases, the difference between LCA and OSA decreases, and
vice versa.
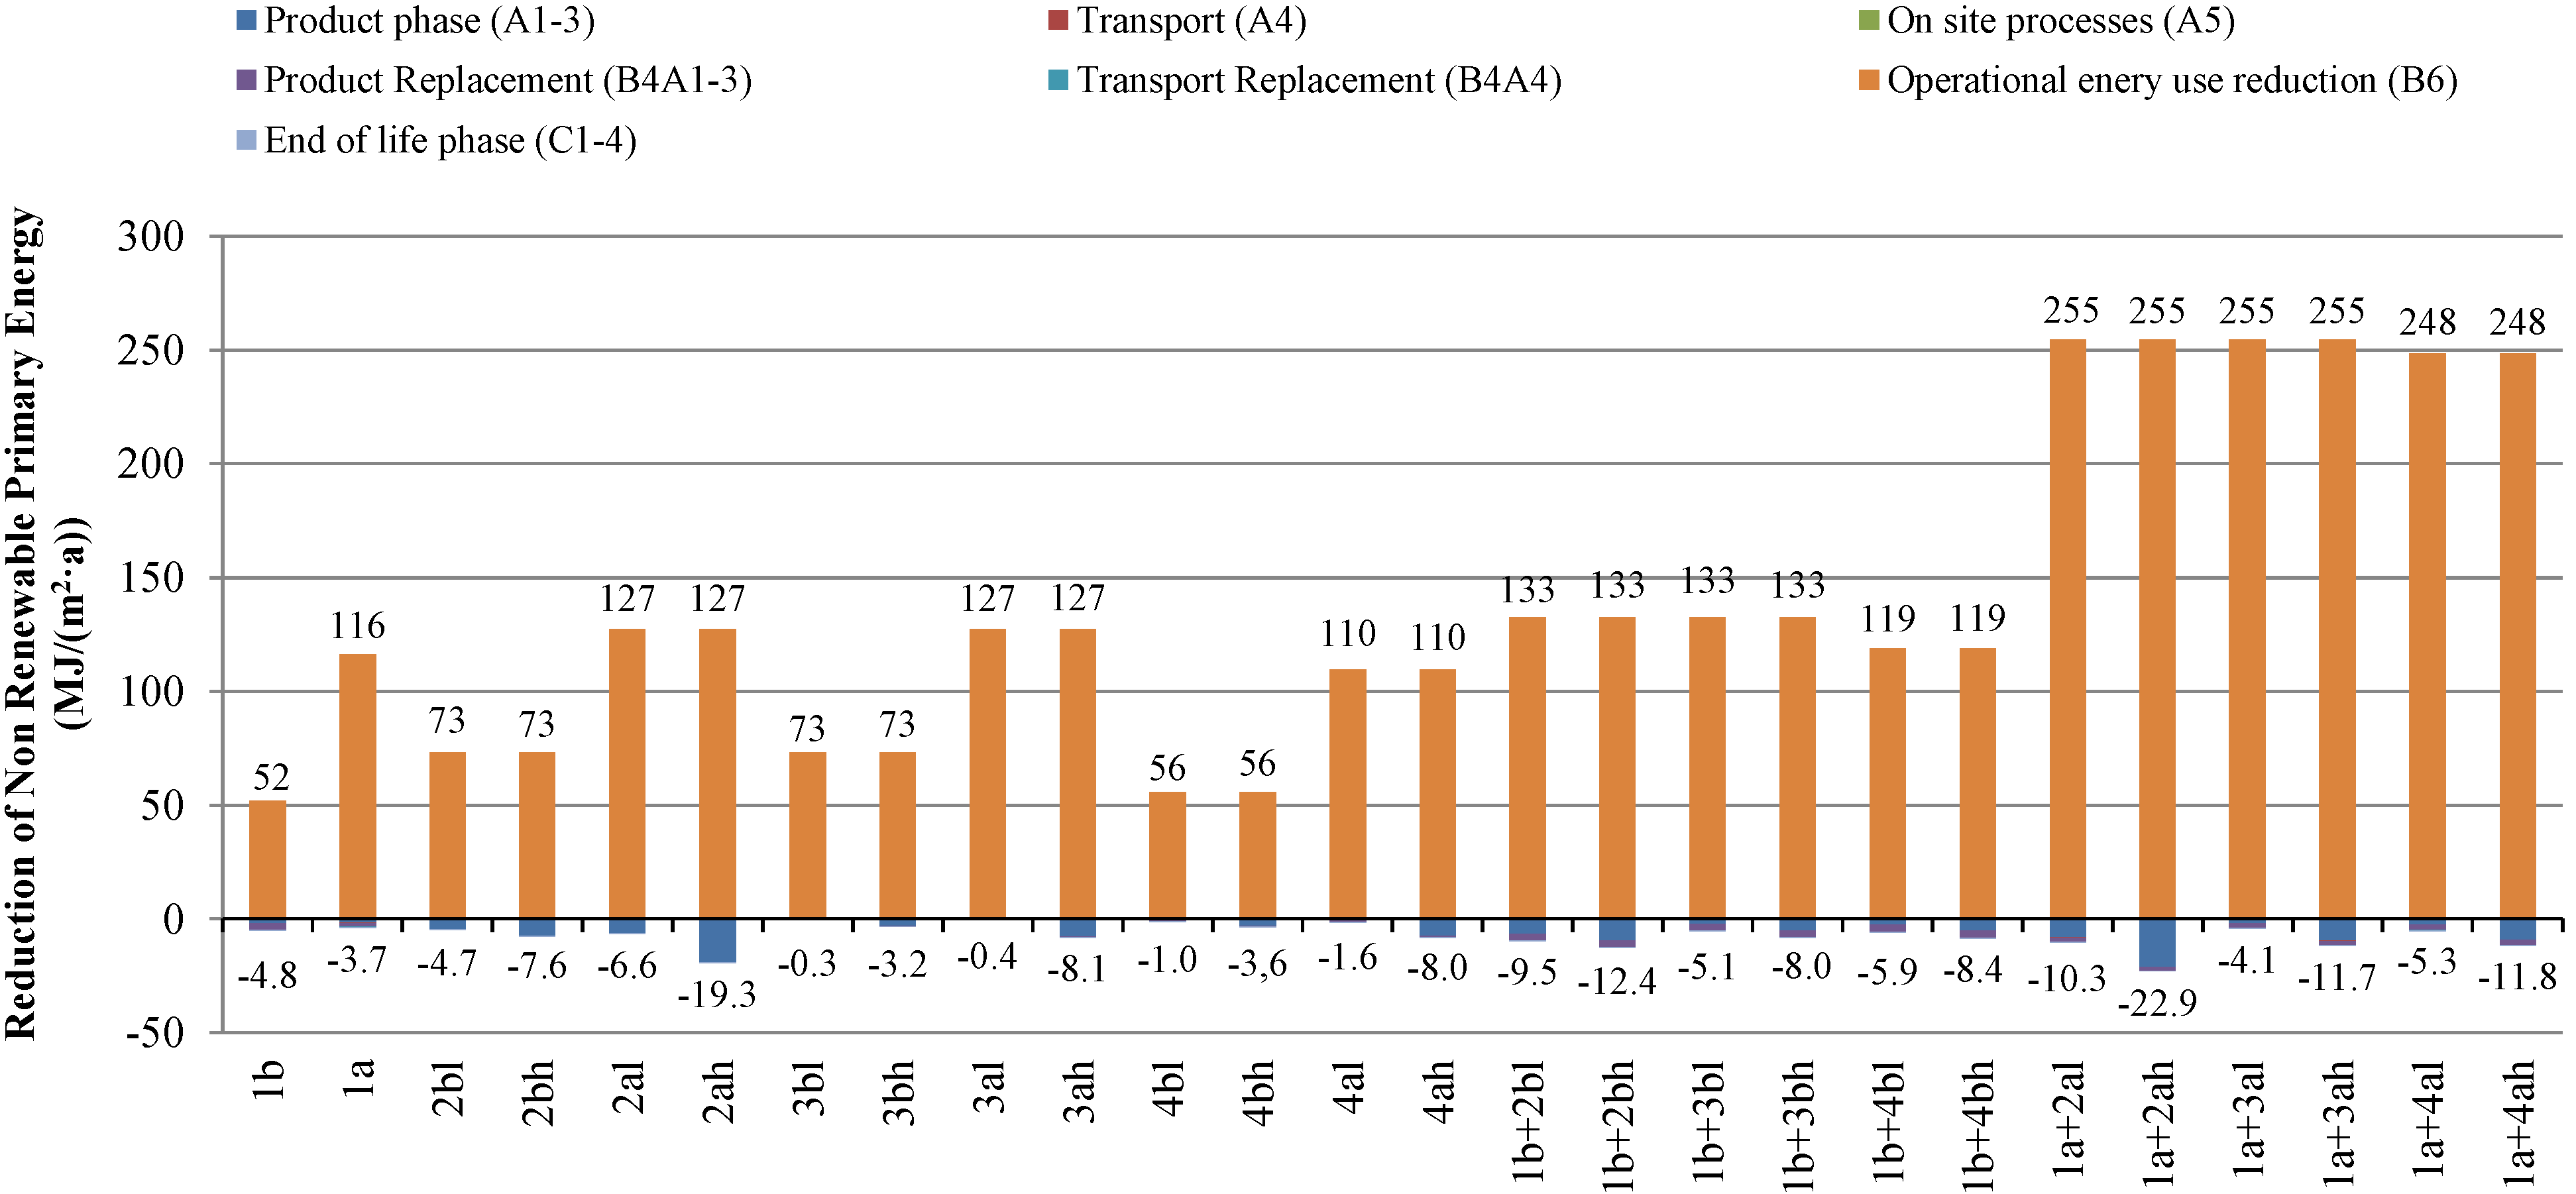
4.7. Sensitivity Analysis for a Combination of Different Factors
In order to explore additional potential situations, 32 new refurbishment scenarios were assessed by combining extreme values for the different parameters evaluated separately in the previous sections (see
Table 8). Taking into account the low influence of the material transportation distance (less than 0.01%), this parameter was not included in the combination of different factors.
For simplicity,
Figure 6 shows the relative difference with LCA of the results obtained with LCA-Si and OSA for those refurbishment strategies with the highest and the lowest difference in their parameter values: 2ah and 3al, respectively.
As presented in
Figure 6, for almost all the additional scenarios differences obtained using LCA and LCA-Si methodologies are lower than 3%. However, new scenarios highlight the differences between LCA/LCA-Si with OSA, which can reach up to 319% in buildings located in warm climates and by the application of hybrid embodied energy data. The second lecture of the
Figure 6 is related to the embodied energy of applied products. The results show that the relative difference between LCA and OSA in refurbishment strategies with low embodied energy products is lower that 4%, except in scenarios such as C1 and C9 (with a relative difference of 4.1%, 5.4% respectively). However, in refurbishment strategies with high embodied energy, the difference between LCA and OSA in considerable, increasing the importance of obtaining objective and actual information about each product, and therefore showing the relevance of the application of hybrid data, which can have much higher embodied energy values.
Regarding service life, in energy refurbishment projects with high RSLb and low ESLm values, the difference between these LCA and OSA methodologies is greater than 35% (C1, C3, C5, C17 and C51). However, in climate zones with high operational heating energy demand, this difference is decreased to 5.6% (C23).
Table 8.
Definition of new energy refurbishment scenarios by the combination of different Reference Service Life of buildings (RSLb), Estimated Service Life of material (ESLm), Climate zone (Cl), type of Embodied Energy data (EE) and Operational Energy use uncertainties (OE).
Table 8.
Definition of new energy refurbishment scenarios by the combination of different Reference Service Life of buildings (RSLb), Estimated Service Life of material (ESLm), Climate zone (Cl), type of Embodied Energy data (EE) and Operational Energy use uncertainties (OE).
| Scenario ID | RSLb (years) | ESLm (years) | Cl | EE | OE |
|---|
| 100 | 25 | Half | 50 | Warm | Cold | Hybrid | Process | −20% | +20% |
|---|
| C1 | X | - | X | - | X | - | X | - | X | - |
| C2 | X | - | - | X | X | - | X | - | X | - |
| C3 | X | - | X | - | - | X | X | - | X | - |
| C4 | X | - | - | X | - | X | X | - | X | - |
| C5 | X | - | X | - | X | - | - | X | X | - |
| C6 | X | - | - | X | X | - | - | X | X | - |
| C7 | X | - | X | - | - | X | - | X | X | - |
| C8 | X | - | - | X | - | X | - | X | X | - |
| C9 | - | X | X | - | X | - | X | - | X | - |
| C10 | - | X | - | X | X | - | X | - | X | - |
| C11 | - | X | X | - | - | X | X | - | X | - |
| C12 | - | X | - | X | - | X | X | - | X | - |
| C13 | - | X | X | - | X | - | - | X | X | - |
| C14 | - | X | - | X | X | - | - | X | X | - |
| C15 | - | X | X | - | - | X | - | X | X | - |
| C16 | - | X | - | X | - | X | - | X | X | - |
| C17 | X | - | X | - | X | - | X | - | - | X |
| C18 | X | - | - | X | X | - | X | - | - | X |
| C19 | X | - | X | - | - | X | X | - | - | X |
| C20 | X | - | - | X | - | X | X | - | - | X |
| C21 | X | - | X | - | X | - | - | X | - | X |
| C22 | X | - | - | X | X | - | - | X | - | X |
| C23 | X | - | X | - | - | X | - | X | - | X |
| C24 | X | - | - | X | - | X | - | X | - | X |
| C25 | - | X | X | - | X | - | X | - | - | X |
| C26 | - | X | - | X | X | - | X | - | - | X |
| C27 | - | X | X | - | - | X | X | - | - | X |
| C28 | - | X | - | X | - | X | X | - | - | X |
| C29 | - | X | X | - | X | - | - | X | - | X |
| C30 | - | X | - | X | X | - | - | X | - | X |
| C31 | - | X | X | - | - | X | - | X | - | X |
| C32 | - | X | - | X | - | X | - | X | - | X |
Finally, climate zone and operational energy use demand is analyzed together because are directly linked. Generally, when the baseline operational energy demand is lower (warmer climates), the possibility to improve the energy performance by the refurbishment strategies is lower, increasing the importance of other building life cycle phases, and therefore increasing the relative difference between LCA and OSA methodologies.
Figure 6.
Relative difference with LCA for 2ah (advanced efficiency level ventilated façade system with high embodied energy products) and 3al (advanced efficiency level external insulation system with low embodied energy products) refurbishment strategies.
Figure 6.
Relative difference with LCA for 2ah (advanced efficiency level ventilated façade system with high embodied energy products) and 3al (advanced efficiency level external insulation system with low embodied energy products) refurbishment strategies.
4.8. Other Indicators and Environmental Impact Categories
For simplicity, previous sections have presented only the NRPE results for the different refurbishment scenarios and using different calculation methodologies. However, as previously mentioned, a number of indicators need to be used in LCA to avoid potential shifting of impacts between different categories. Various previous studies as shown in
Table 9 have studied different environmental impact categories.
Table 10 presents the results for additional environmental impact categories calculated for the case study. Differences between LCA and simplified methodologies are similar to the previously calculated for NRPE for indicators ADP and GWP, as it could be expected taking into account the strong correlations between these categories. For other frequently used environmental indicators such as ODP, POCP or AP, which are part of the indicators set in the CEN TC 350 standards [
12], there is also a large similarity on the differences between methodologies, as the life cycle impacts on these categories are still strongly linked to the use of fossil fuels. For other impact categories not considered in this study or in the recent standardization efforts, for example those related to toxicity, further research is needed on the impact of all the different life cycle phases as there is currently not enough data available and results could differ in this case.
Table 9.
Environmental impact categories used in previous studies.
Table 9.
Environmental impact categories used in previous studies.
| Environmental impact categories | Erlandsoona et al., 2004 [27] | Junnilla, 2004 [28] | Citherlet et al., 2007 [29] | Zabalza et al., 2009 [30] | Utama et al., 2009 [31] | Kofoworola et al., 2009 [26] | Blom et al., 2010 [32] | Blengini et al., 2010 [33] | Gustavsoon et al., 2010 [34] | Hernandez et al., 2010 [23] |
|---|
| Resource use, primary energy, PE | - | - | - | X | X | X | - | X | X | X |
| Depletion of Abiotic resources, elements, ADP-elements. | - | - | - | - | - | - | X | - | - | - |
| Global warming, GWP | X | X | X | X | - | - | X | X | X | - |
| Ozone Depletion, ODP | - | - | - | - | - | - | X | X | - | - |
| Photochemical Ozone Creation, POCP | X | - | X | - | - | - | X | X | - | - |
| Acidification for soil and water, AP | X | X | X | - | - | - | X | X | - | - |
| Eutrophication, EP | X | X | - | - | - | - | X | X | - | - |
| Environmental impact categories | Oritz et al., 2010 [35] | Dodoo et al., 2010 [36] | Malmqvist et al., 2011 [37] | Rossi et al., 2012 [38] | Stephan et al., 2012 [24] | Ramesh et al., 2012 [39] | Stephan et al., 2013 [25] | Mosteiro et al., 2014 [40] | Dodoo et al., 2014 [41] | - |
| Resource use, primary energy, PE | - | X | - | - | X | X | X | X | X | - |
| Depletion of Abiotic resources, elements, ADP-elements. | X | - | - | - | - | - | - | - | - | - |
| Global warming, GWP | X | - | X | X | - | - | - | X | - | - |
| Ozone Depletion, ODP | X | - | - | - | - | - | - | X | - | - |
| Photochemical Ozone Creation, POCP | - | - | - | - | - | - | - | - | - | - |
| Acidification for soil and water, AP | X | - | - | - | - | - | - | X | - | - |
| Eutrophication, EP | - | - | - | - | - | - | - | X | - | - |
Table 10.
Results of the analysis for other impact indicators expressed for m
2 and year. For abbreviations, refer to
Table 9.
Table 10.
Results of the analysis for other impact indicators expressed for m2 and year. For abbreviations, refer to Table 9.
| Environmental impact reduction |
|---|
| Environmental Impact Indicators (EII) | 2ah Strategy | EII | 3al Strategy |
|---|
| LCA | LCA-Si | OSA | LCA | LCA-Si | OSA |
|---|
| ADP fossil fuels (MJ/(m2·a))
| 95 | 96 | 110 | ADP | 110 | 110 | 110 |
| GWP (kg CO2/(m2·a))
| 5.5 | 5.6 | 8.2 | GWP | 8.1 | 8.1 | 8.2 |
| ODP (kg CFC 11/(m2·a))
| 2.5 × 10⁻⁷ | 2.5 × 10⁻⁷ | 2.1 × 10⁻⁶ | OPD | 2.1 × 10⁻⁶ | 2.1 × 10⁻⁶ | 2.1 × 10⁻⁶ |
| POCP (kg ethene/(m2·a))
| 1.3 × 10⁻³ | 1.3 × 10⁻³ | 1.8 × 10⁻³ | POCP | 1.8 × 10⁻³ | 1.8 × 10⁻³ | 1.8 × 10⁻³ |
| AP (kg SO2-eq/(m2·a))
| 2.4 × 10⁻² | 2.4 × 10⁻² | 2.9 × 10⁻² | AP | 2.9 × 10⁻² | 2.9 × 10⁻² | 2.9 × 10⁻² |
5. Discussion
Simplifications of the LCA methodology can have important implications in decision-making process for selecting the most appropriate energy refurbishment solutions of existing buildings. The exercise previously developed, and especially the results obtained from the sensitivity analysis, provide useful information about how simplifications can bring insignificant or very remarkable uncertainties in comparison to a fully-fledged LCA methodology.
Differences between LCA and Simplified LCA are negligible in the case of assessing the use of Non-Renewable Primary Energy (NRPE) when comparing different refurbishment solutions oriented to reduce the energy consumption of existing buildings. The use of OSA does, however, have important limitations. For warm climates and ambitious goals for reducing the energy consumption of buildings by using materials and systems with a high energy embodied values, OSA is an oversimplified methodology and can mislead the decision making for choosing solutions with the best life cycle environmental performance. If products with low embodied energy are used, OSA, which studies only the reduction on energy use during the operational stage of the building, might be of sufficient accuracy. Of course, it should then be decided and benchmarked which materials are considered low embodied energy. In the case of colder climates or situations with drastic reductions on operational energy use due to a refurbishment strategy, values obtained with the OSA methodology will be very similar to those yielded by an LCA, as relative importance of products and other building life cycle phases is lower. In addition, OSA is not recommended if construction products and systems with short Estimated Service Life are used.
Regarding the quantity and type of environmental indicators used on the analysis, it has to be considered that when applying LCA to compare different options, commonly there is not a specific alternative that scores the best in all the impact categories. Therefore, the decision maker needs to select the best option according to his/her environmental values and objectives and apply some kind of weighting among the different impact categories. This study is focused on the NRPE Indicator as it generally offers a good correlation with other related impact categories (such as Global Warming and Abiotic Depletion of fossil fuels) and, on the other hand, captures the consequences of applying energy efficiency strategies. Other environmental impact categories not so correlated to the use of fossil use (such as toxicity) are not well represented by this indicator.
The source of data used in the LCA has a remarkable influence increasing the uncertainty of the results, as significant differences exist in the calculations using data derived from process inventories (e.g., from Ecoinvent and GaBi databases, for instance, or from EPDs) or from hybrid Input-Output analysis This observation is in line with previous studies from Crawford [
57] and Stephan
et al. [
25] which have demonstrated that the truncation error associated to process-based life cycle inventories may significantly affect the final results.
Regarding data associated to the construction stage, the main barrier is again related to the lack and uncertainty of environmental information, which largely depends on project specific parameters and are difficult to assess for a set of different strategies. As for data associated for transportation, technicians usually have information on the exact location of the distributor of the product or system applied in the refurbishment project, but in many cases the manufacturing location is unknown, being the impacts associated to transport from manufacturer to distributor difficult to calculate. Due to the lack of information about future waste management processes, the uncertainty of the end of life stage is also very large.
Finally, it is important to mention that despite heating being one of the major contributors to the operational energy consumption of buildings, cooling of indoor spaces (especially in warm climate zones) should not be left out of the scope of the assessment of energy refurbishment in any case (LCA, LCA-Si or OSA) as, for some scenarios, it can have a significant influence on the decision-making process.
6. Conclusions
The refurbishment of the existing building stock with the aim of reducing its operational energy consumption is being fostered for different reasons and by different actors in the EU. The intense standardization efforts on the assessment of the sustainability of buildings carried out by the European Committee for Standardization Technical Committee 350 [
12] suggests that the application of the life cycle approach will be more common in the near future. In this context, simplified LCA (LCA-Si) could be seen as a first step towards a comprehensive and extensive application of LCA within the construction sector. On the other hand, depending on the objectives pursued and the resources available, the practical application of the LCA methodology could be neither necessary nor possible, and in some circumstances an analysis of the energy reduction derived from the refurbishment during the operational stage (OSA) could be sufficient. As proved through a complete case study, in the case of assessing different refurbishment strategies oriented to reduce the energy consumption of buildings, a simplified LCA study may underestimate the absolute energy values, but it generally allows identifying the most (life-cycle) efficient solution. However, considering only the operational energy use (OSA) may lead to the selection of less efficient solutions.
The application of the fully-fledged LCA methodology still faces important challenges, and the construction industry needs to play a key role in the calculation and publication of data to facilitate accurate assessments of building energy refurbishment projects.


