Performance Evaluation of Modern Building Thermal Envelope Designs in the Semi-Arid Continental Climate of Tehran

Abstract
:1. Introduction
2. Envelope Thermal Properties
2.1. The Role of Thermal Mass

| Element | Y-value (W/m2 K) | U-value (W/m2 K) |
|---|---|---|
| Typical heavyweight wall (brick/blockwork with cavity insulation) | 4.0 | 0.6 |
| Typical lightweight wall (cladding, insulation, lining) | 1.0 | 0.6 |
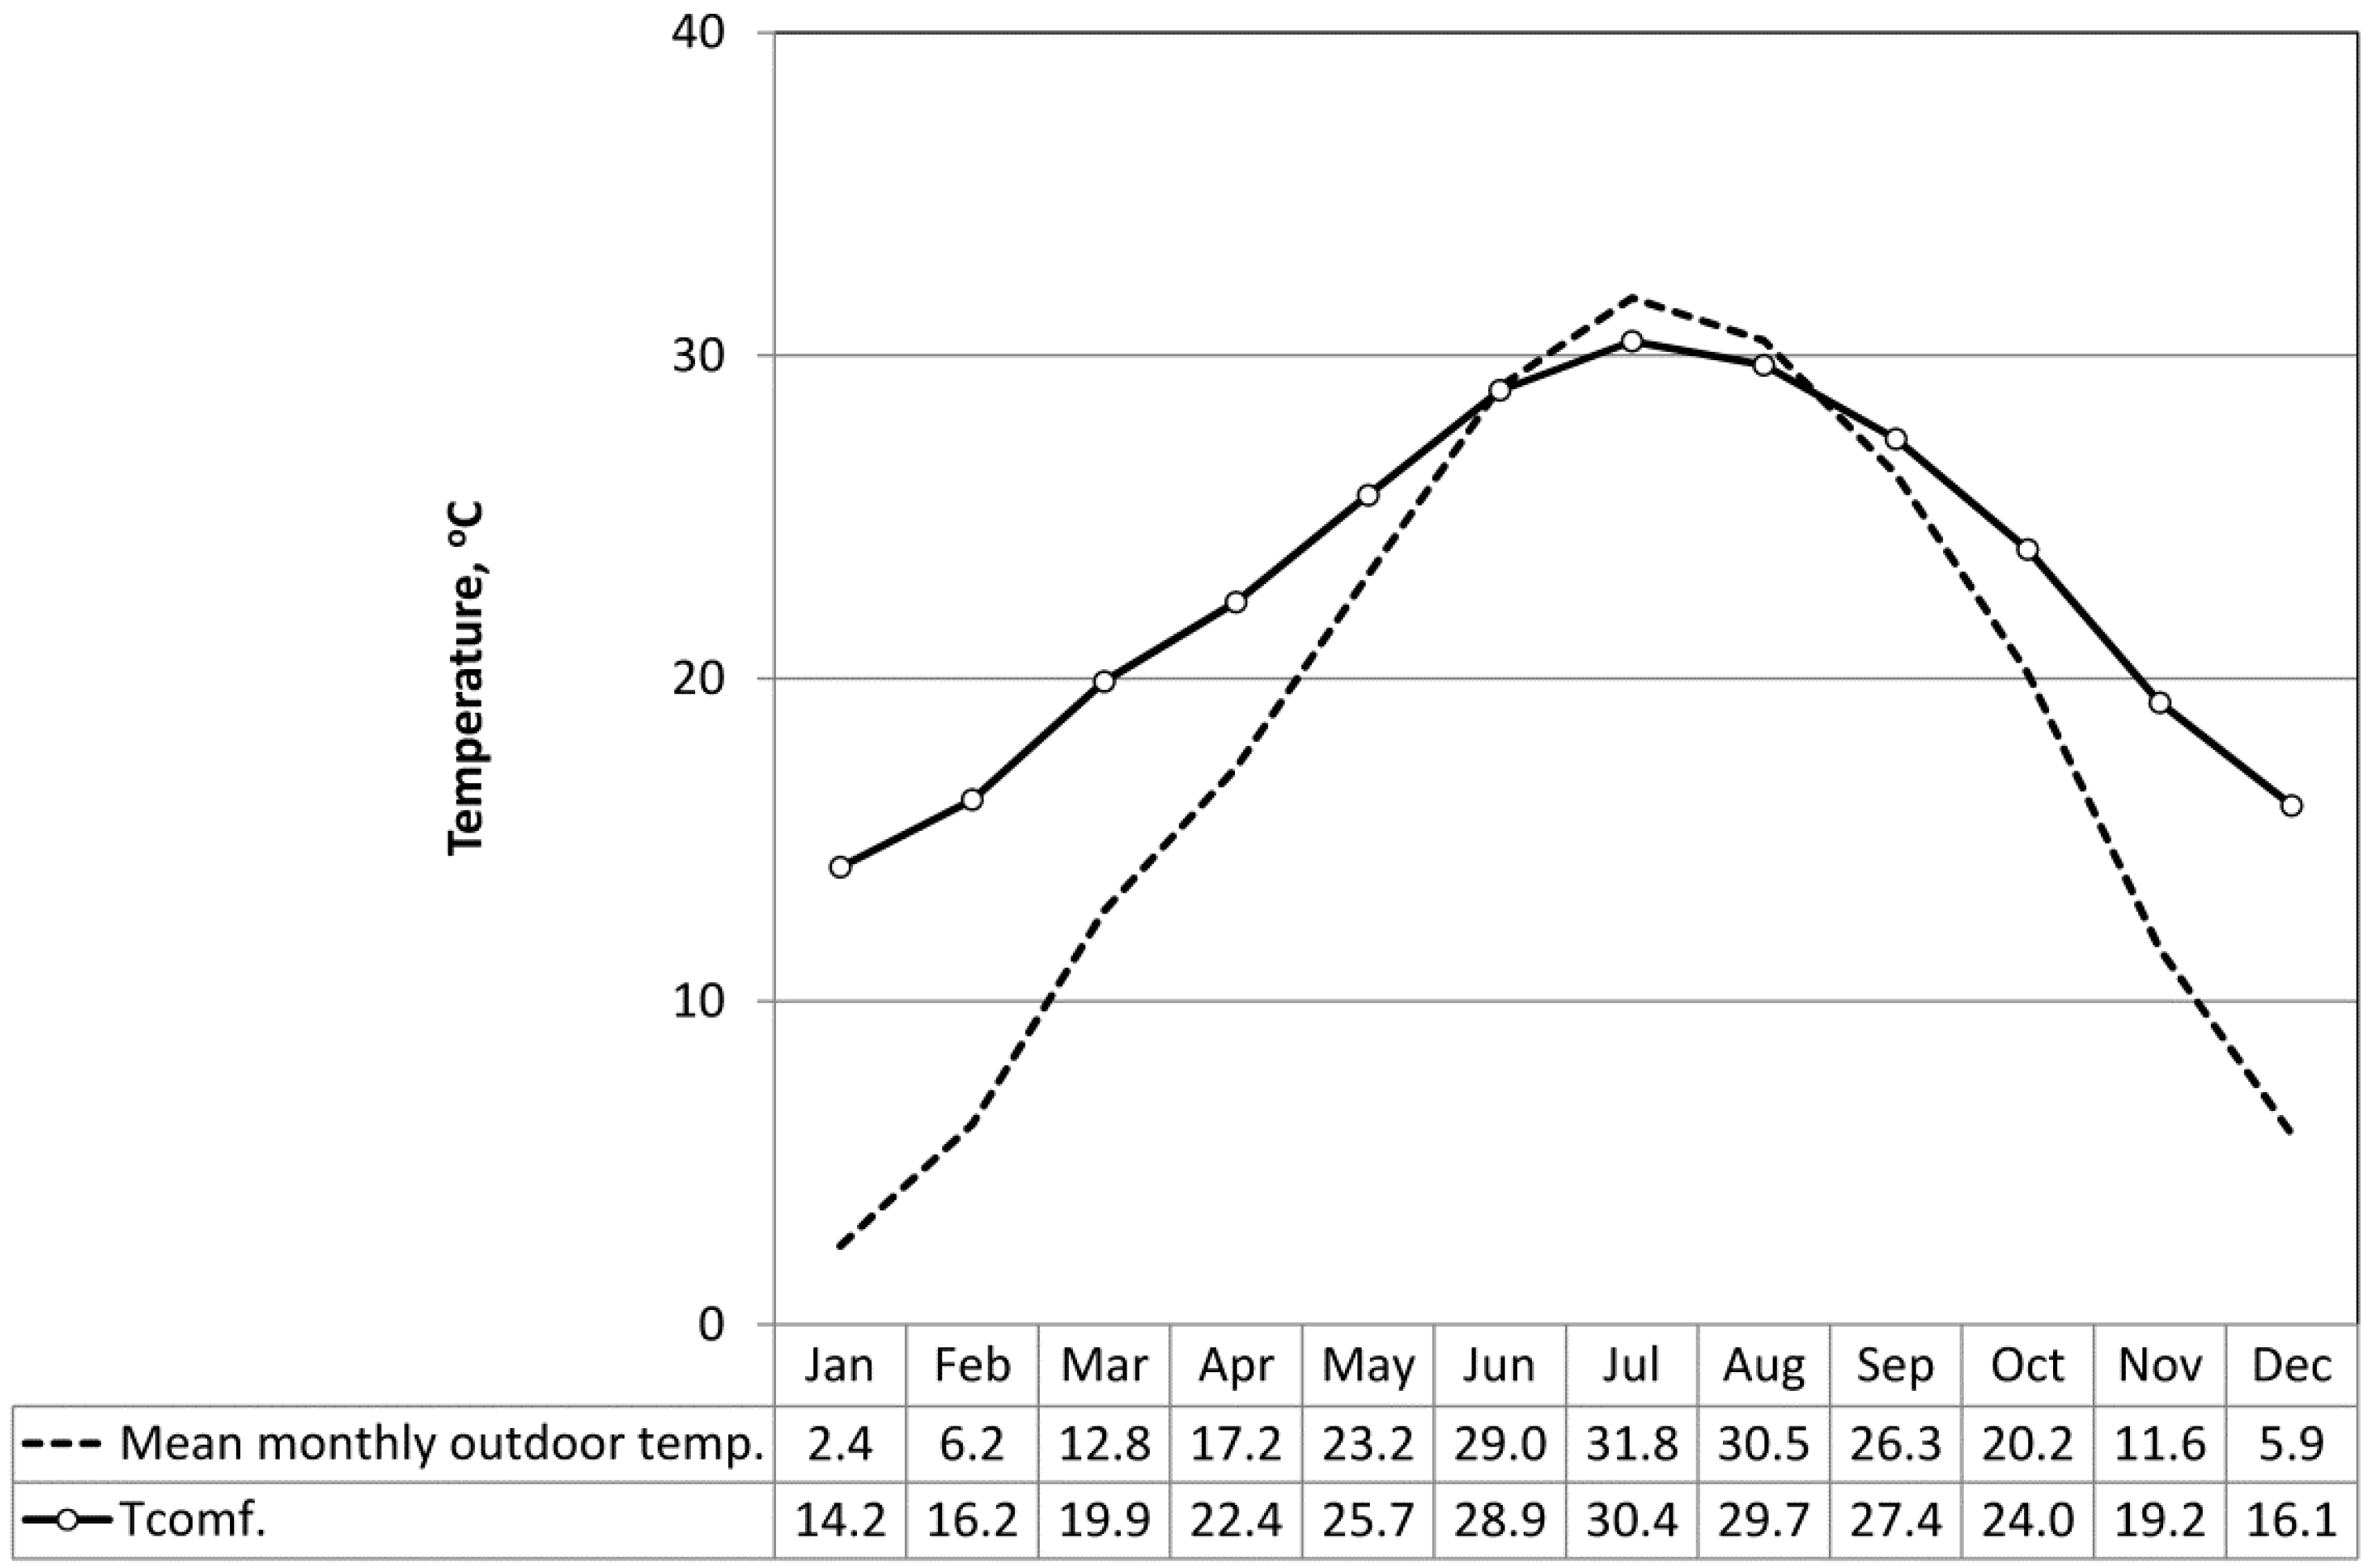
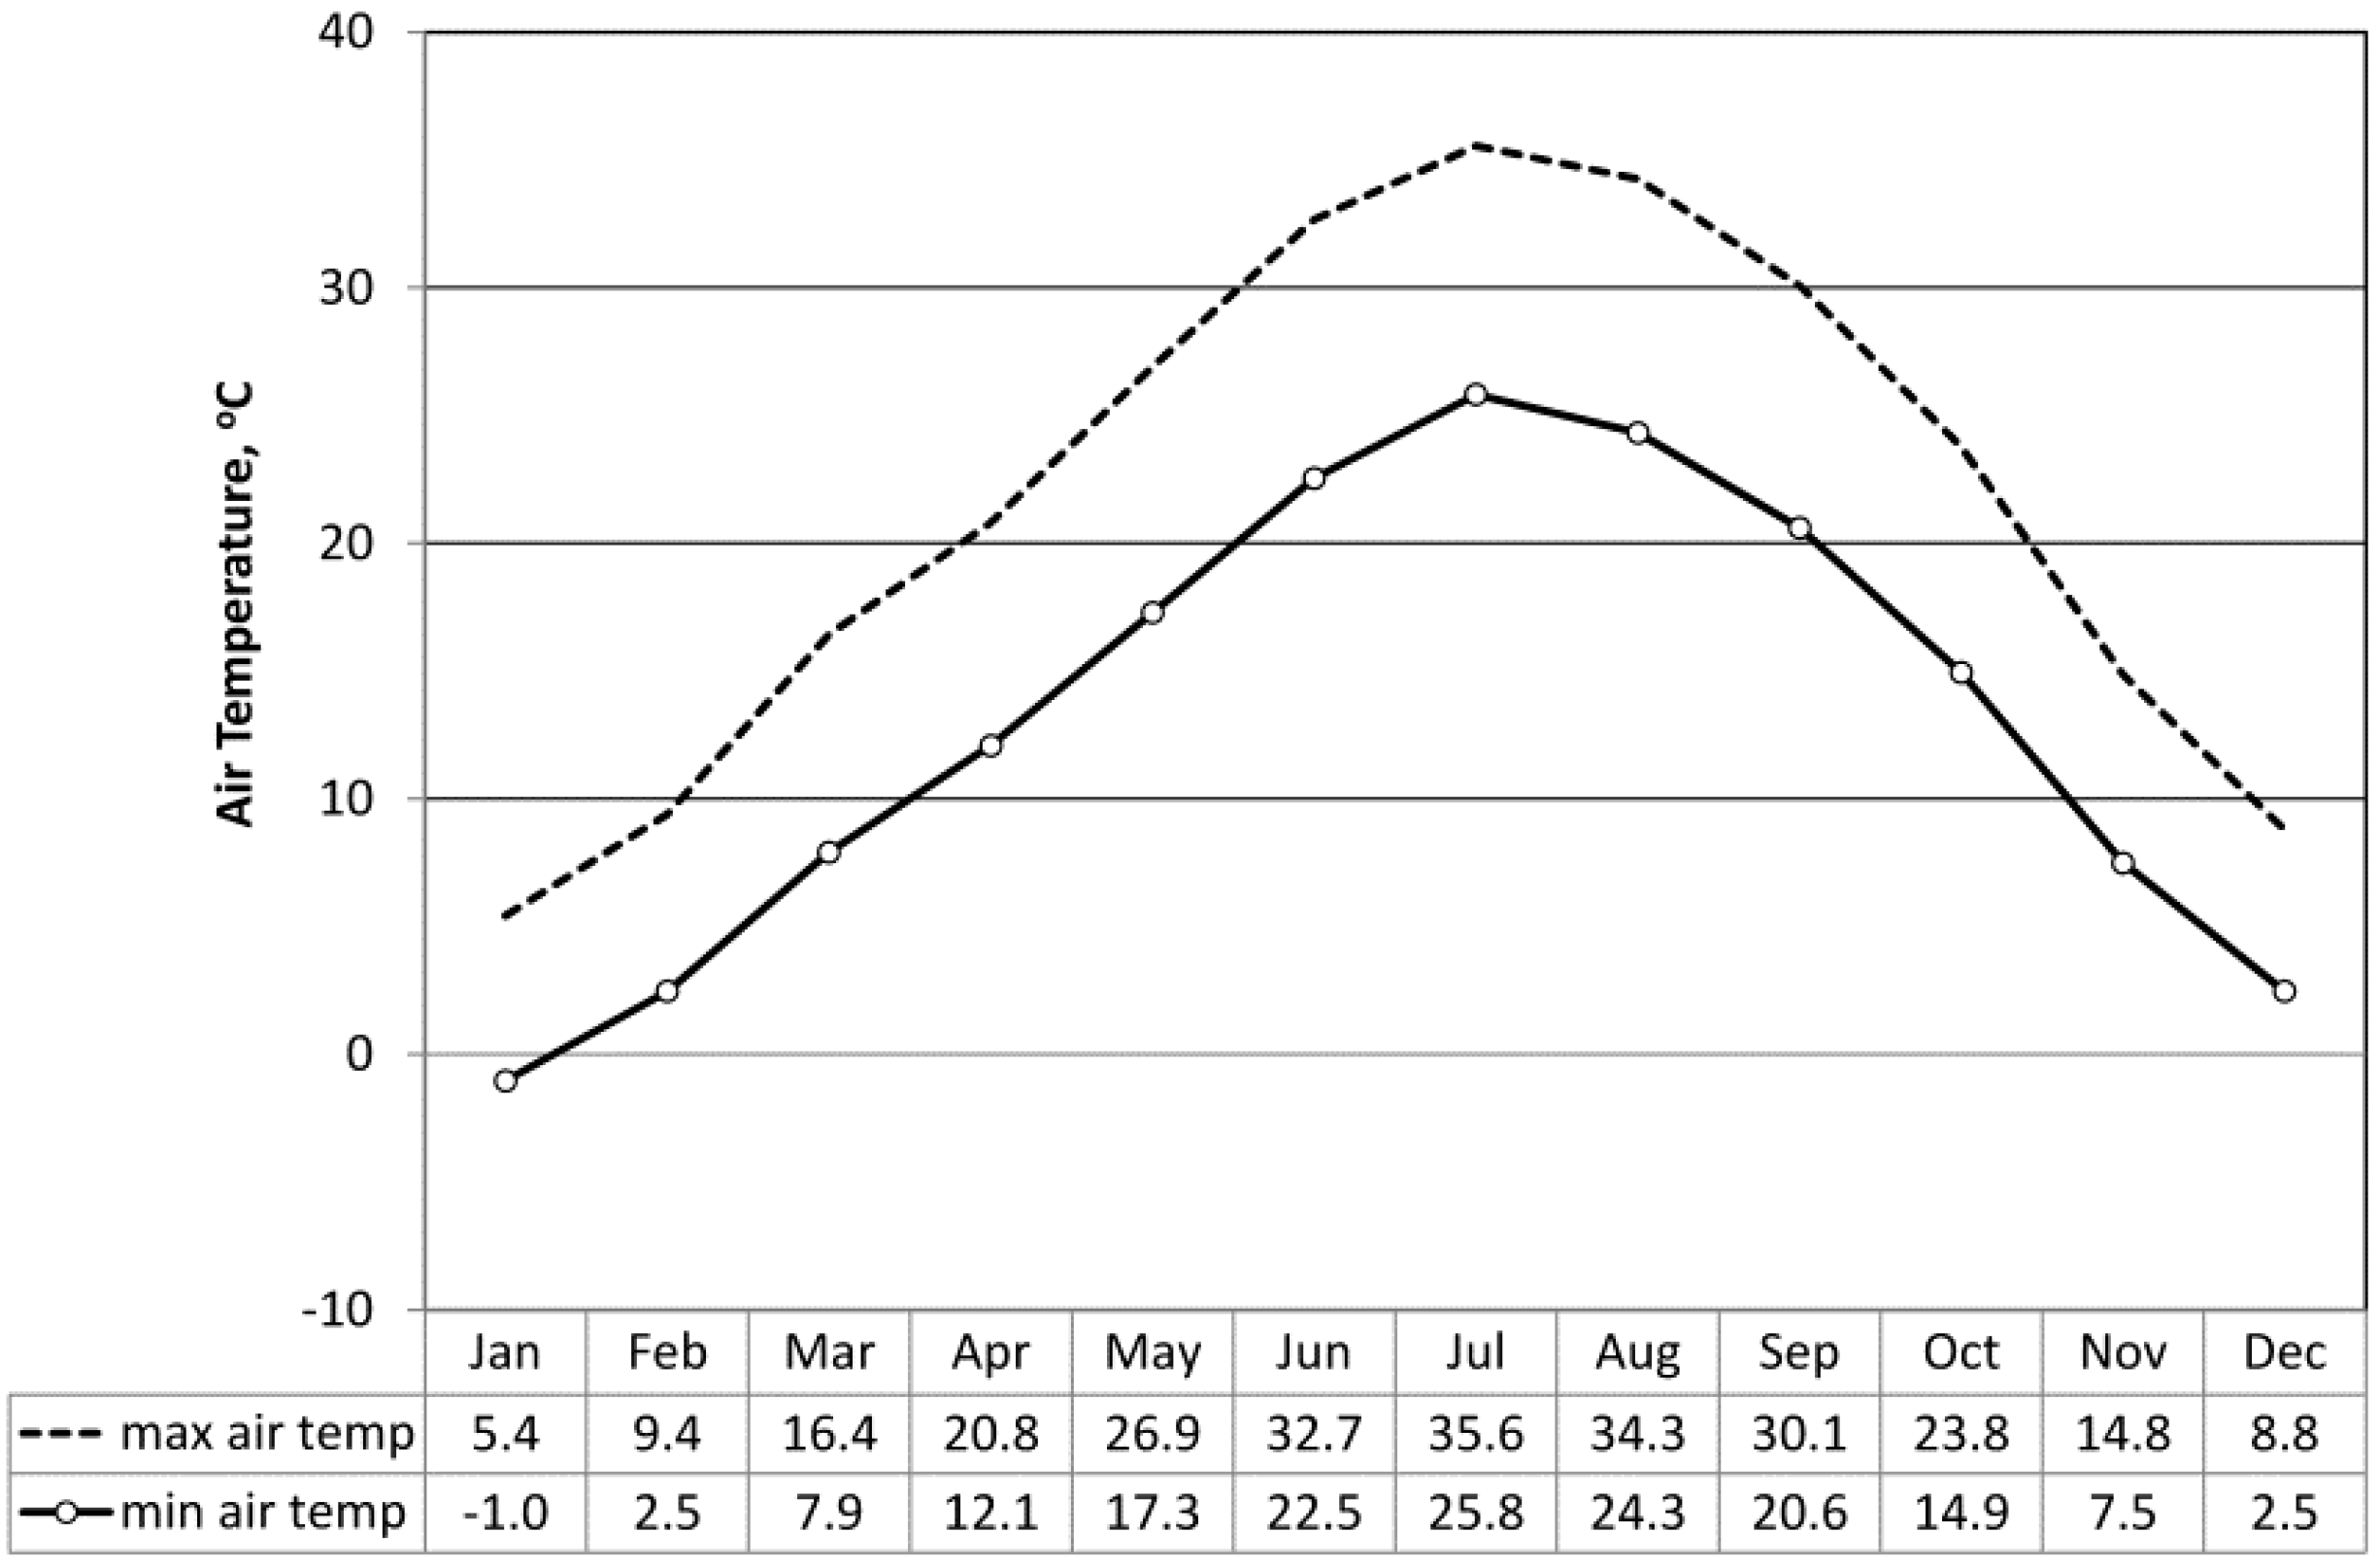
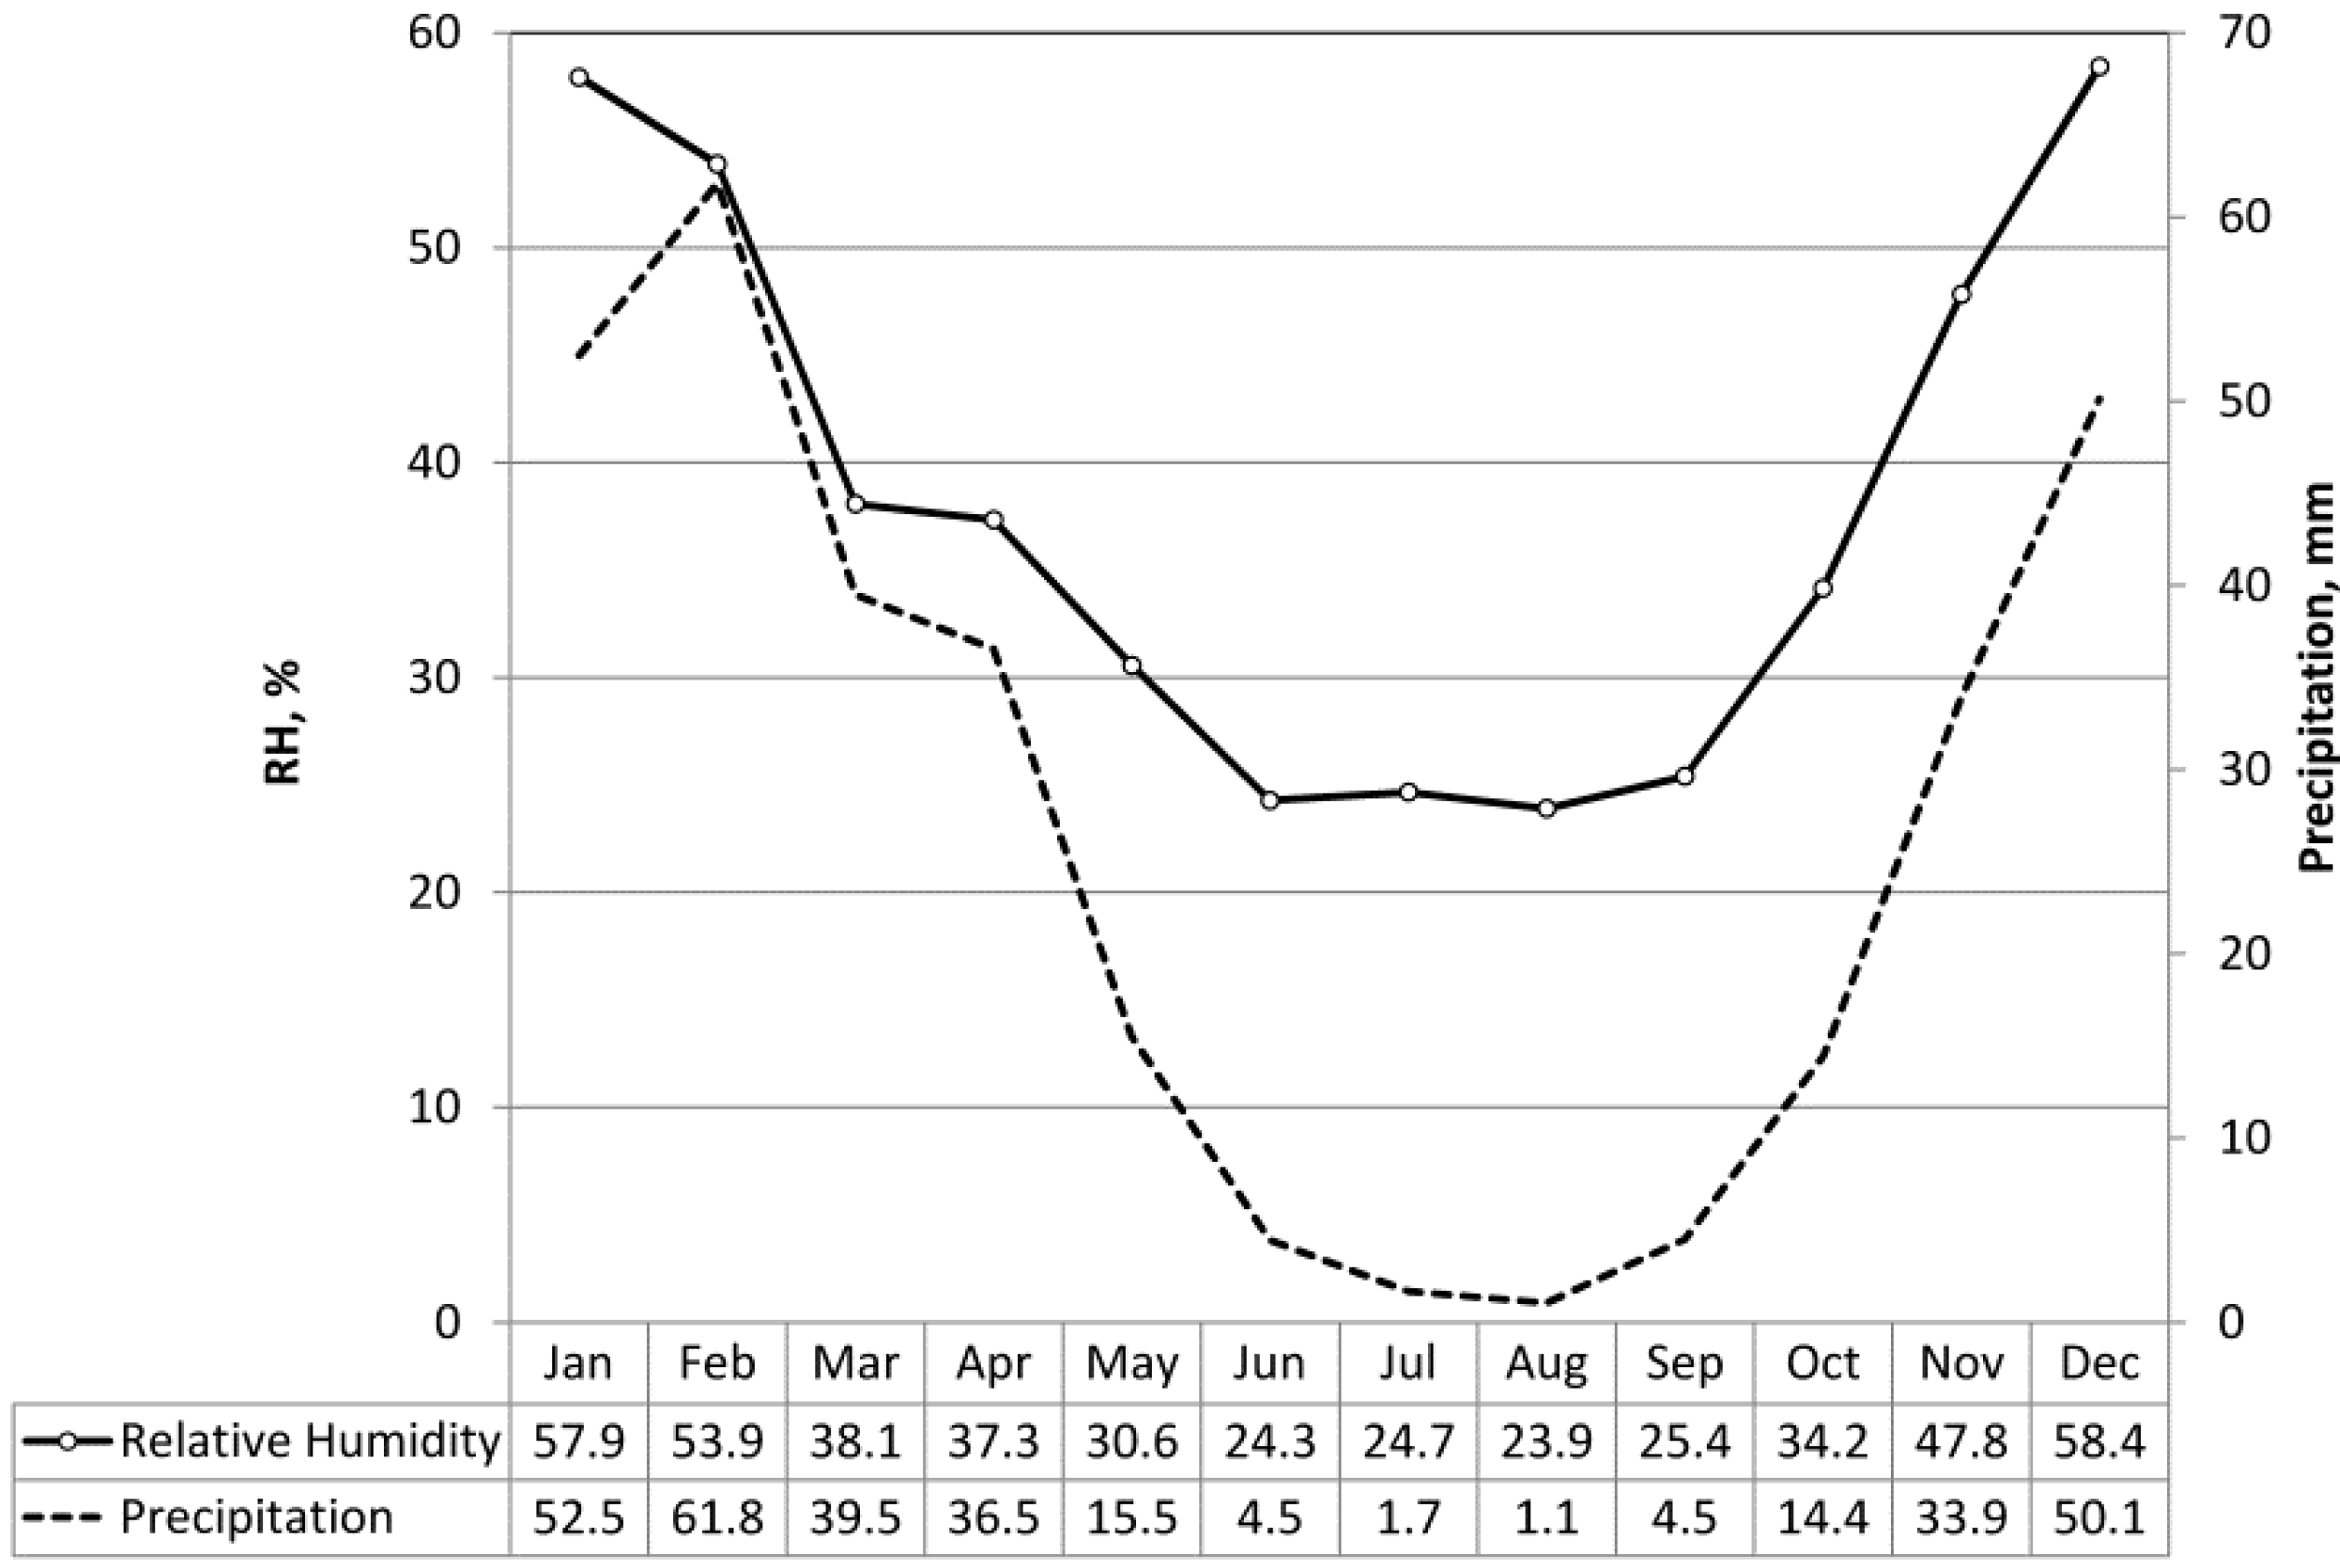
2.2. Local Climatic Context
| Wall reference and type | Construction materials | Detail | U-value (W/m2 K) | Thickness (cm) | Image of material |
|---|---|---|---|---|---|
| HCB1 Hollow clay block | Plaster lining (3 cm) Clay block (15 cm) Sand & cement mortar (3 cm) Exterior stone finishing (2 cm) | 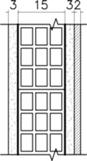 | 1.3 | 21 |  |
| HCB2 Hollow clay block | Plaster lining (3 cm) Clay block [15 cm with 2 cm expanded polystyrene (EPS)] Sand & cement mortar (3 cm) Exterior stone finishing (2 cm) | 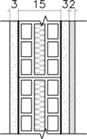 | 1.08 | 21 |  |
| L1 LECA block | Plaster lining (3 cm) LECA block (20 cm) Sand & cement mortar (3 cm) Exterior stone finishing (2 cm) | 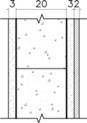 | 1.34 | 28 |  |
| L2 LECA block | Plaster lining (3 cm) LECA block (10 cm) Cavity filled with expanded polystyrene (EPS) (5 cm) LECA block (10 cm) Sand & cement mortar (3 cm) Exterior stone finishing (2 cm) | 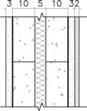 | 0.41 | 33 |  |
| A1 AAC block | Plaster lining (3 cm) AAC block (20 cm) Sand & cement mortar (3 cm) Exterior stone finishing (2 cm) | 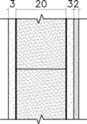 | 0.71 | 28 | 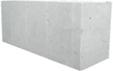 |
| A2 AAC block | Plaster lining (3 cm) AAC block (10 cm) Cavity filled with expanded polystyrene (EPS) (5 cm) AAC block (10 cm) Sand & cement mortar (3 cm) Exterior stone finishing (2 cm) |  | 0.37 | 33 |  |

3. Simulation
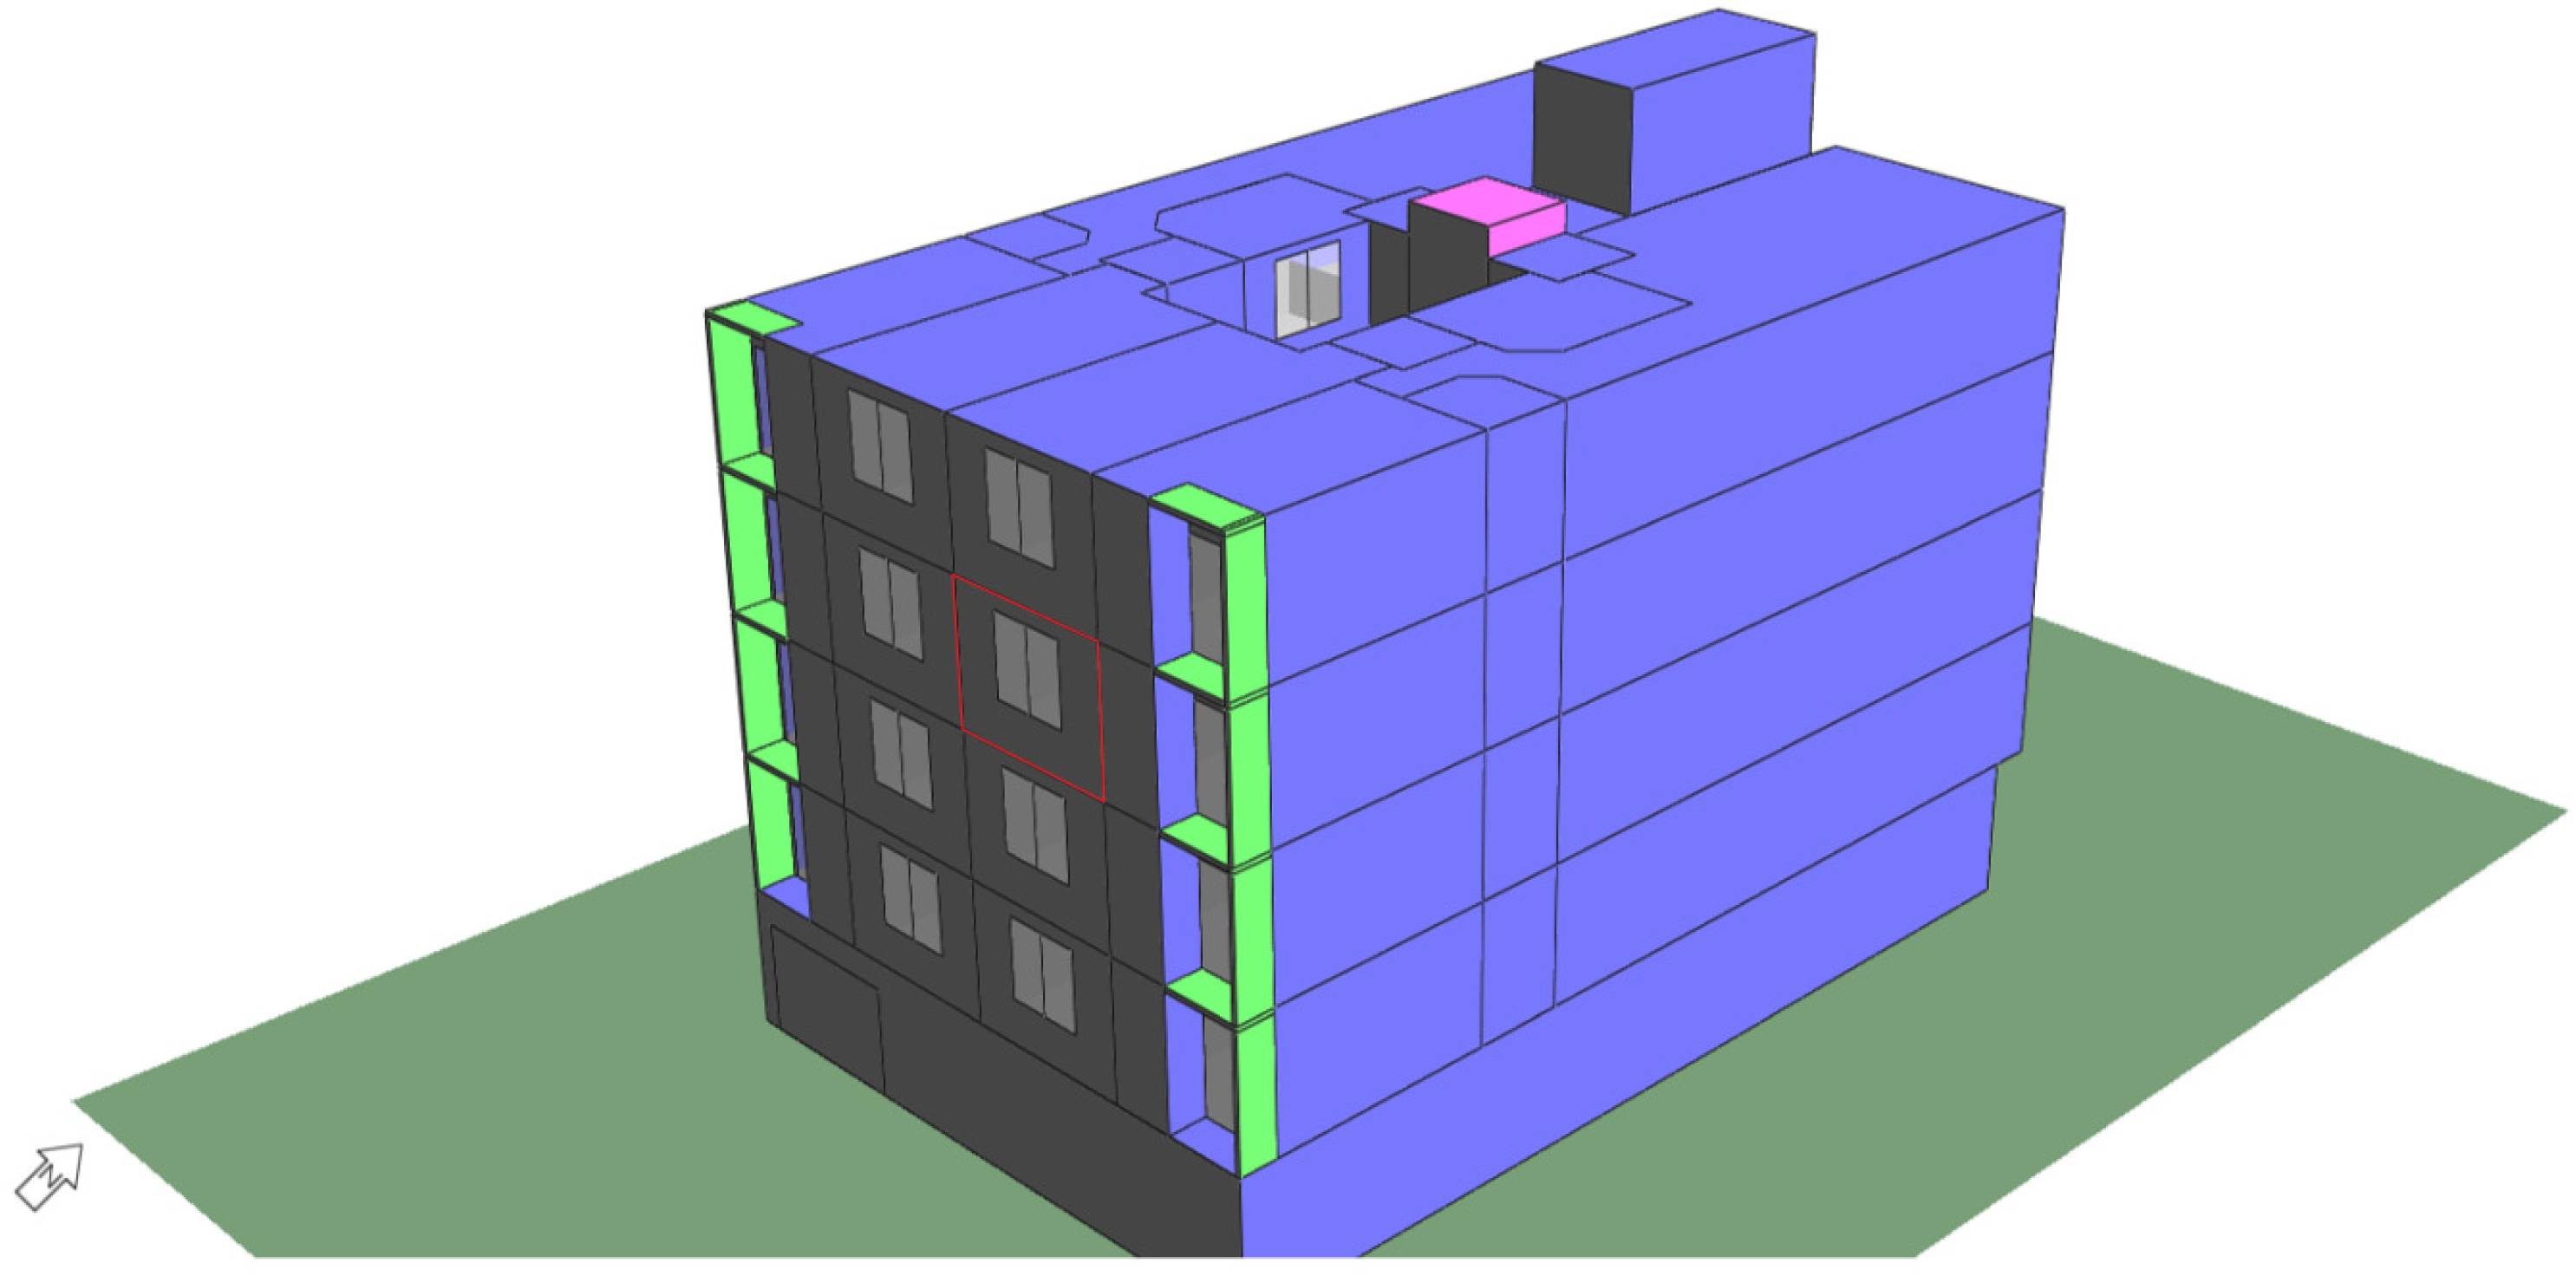
3.1. Simulation Scenario

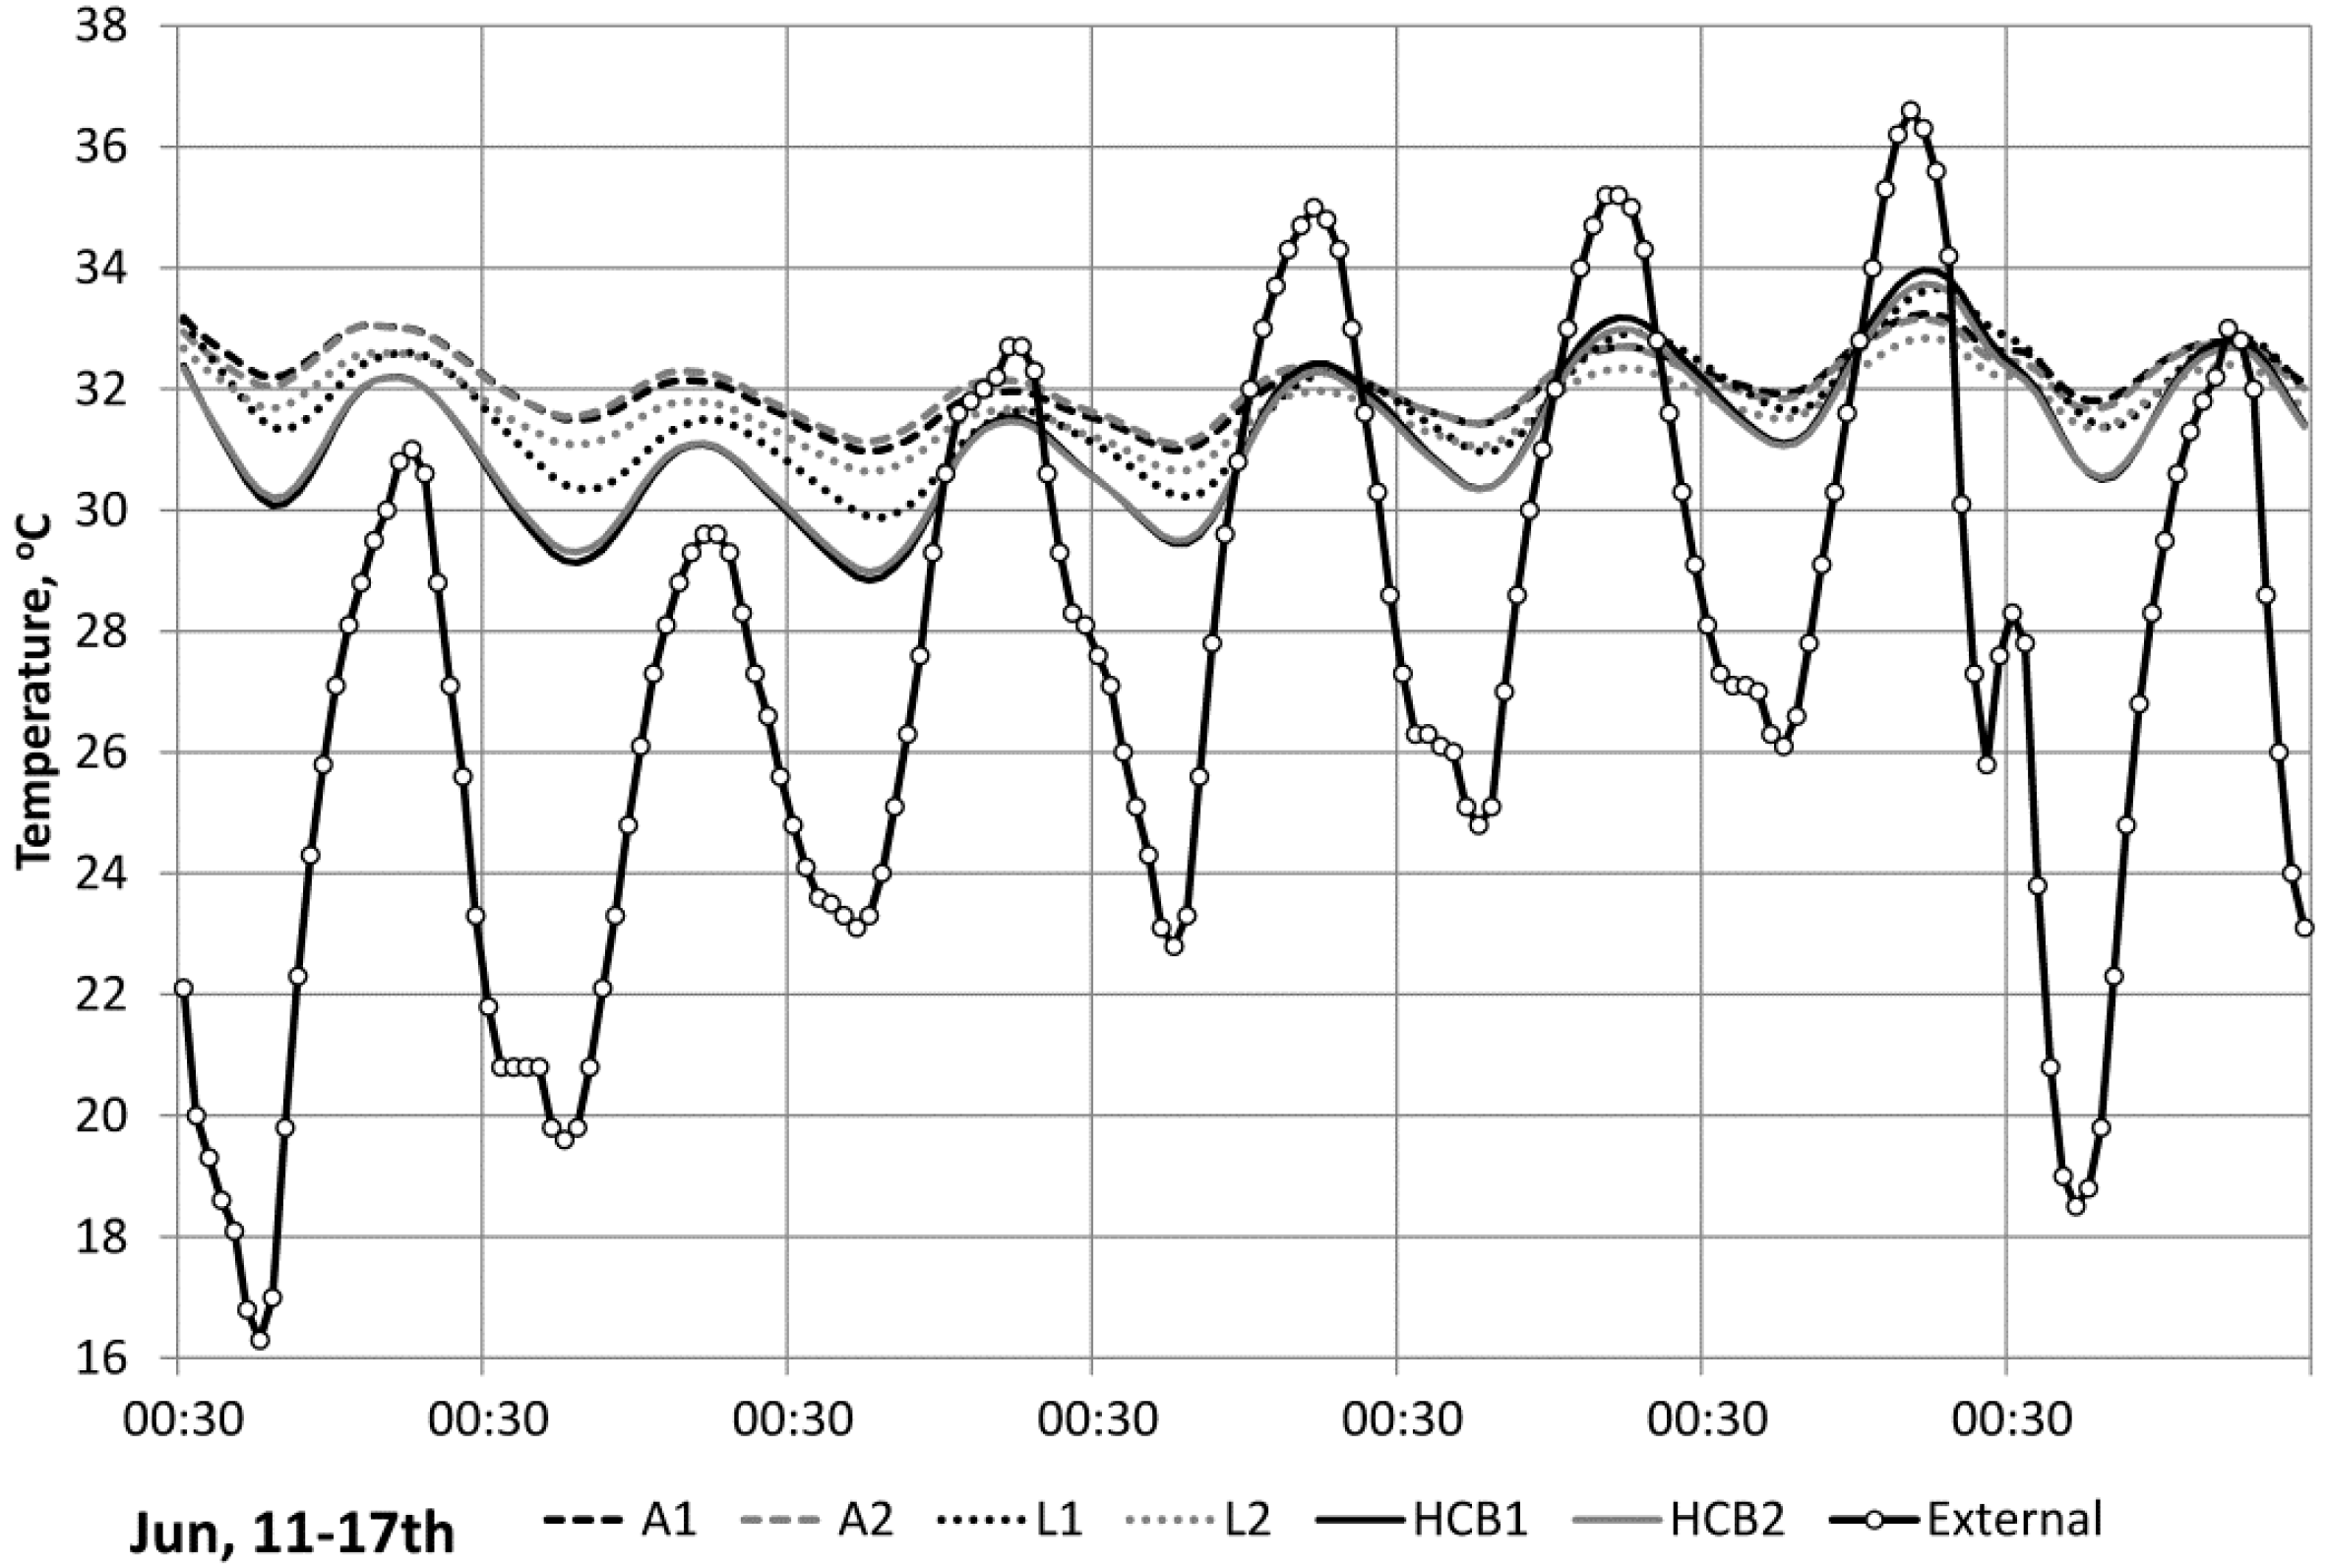
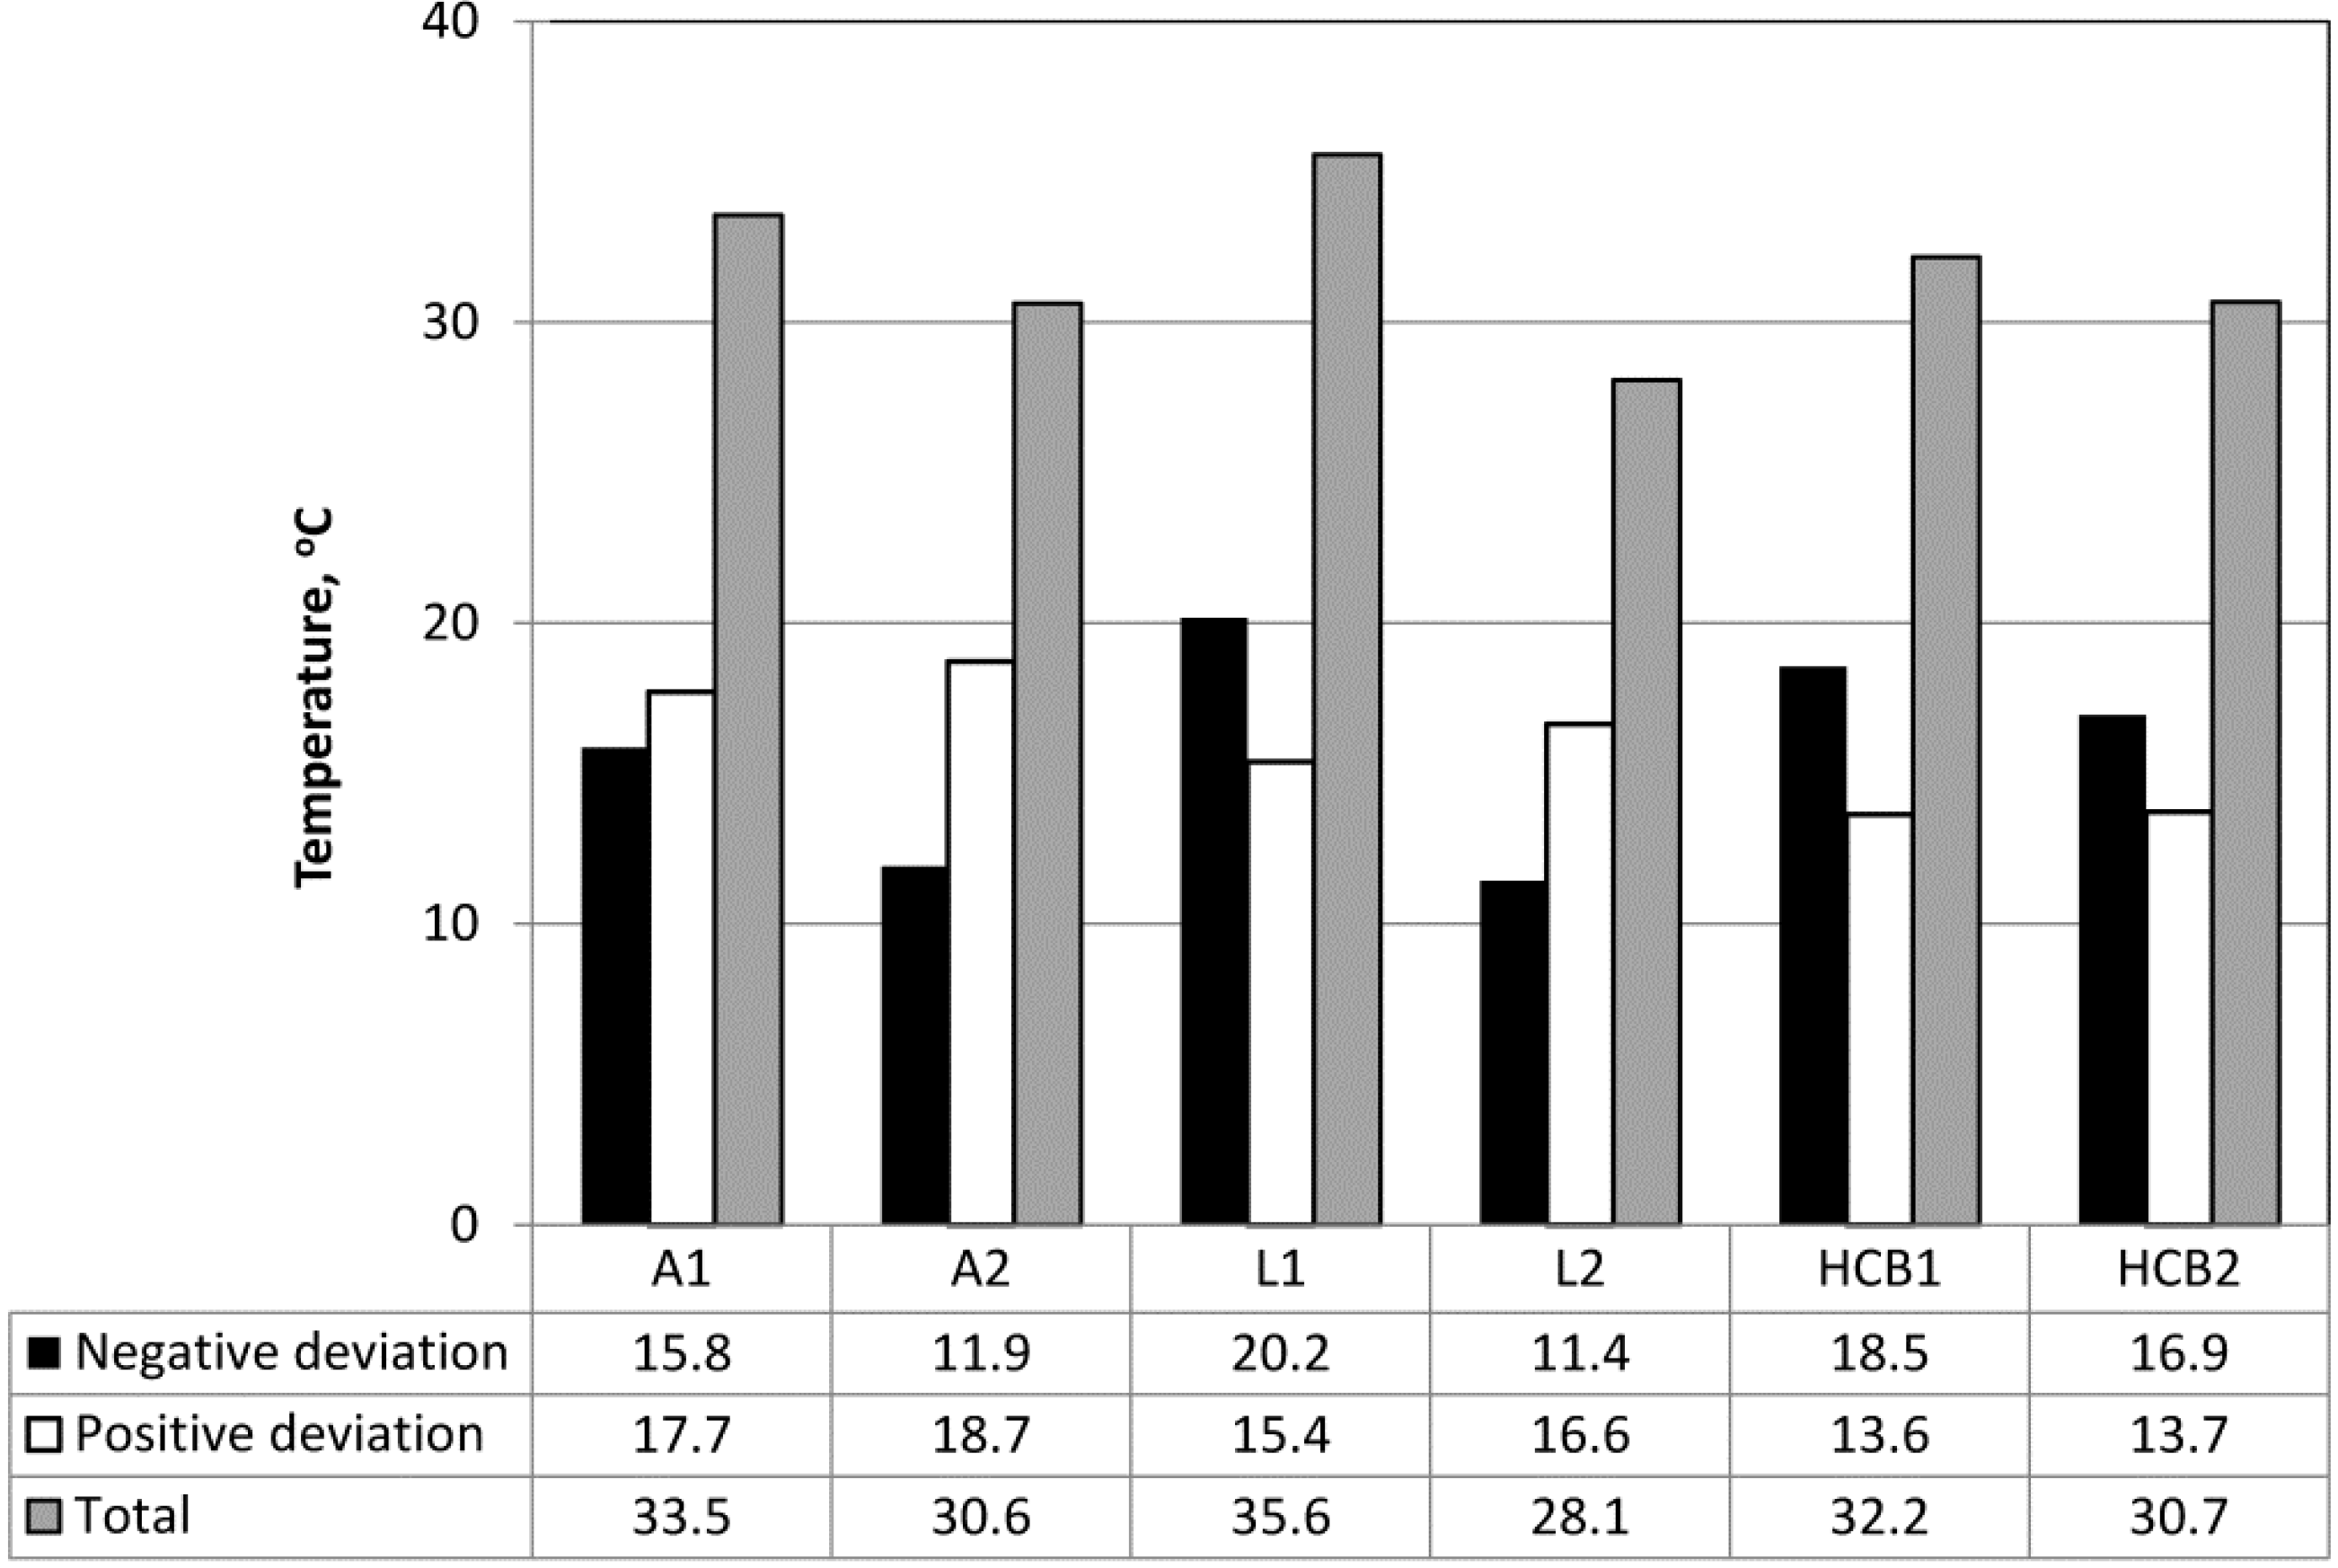
4. Results and Discussion
| Material | ρ (kg/m3) | λ (W/m K) | C (J/kg K) | Diffusivity α, (m2/s) |
|---|---|---|---|---|
| Brick | 1700 | 1 | 840 | 7.00 × 10⁻⁷ |
| Clay | 1300 | 0.5 | 837 | 4.60 × 10⁻⁷ |
| LECA | 900 | 0.23 | 1000 | 2.56 × 10⁻⁷ |
| AAC | 700 | 0.17 | 1000 | 2.43 × 10⁻⁷ |
| EPS | 15 | 0.04 | 1340 | 1.99 × 10⁻⁶ |
| Wall ref. | U-value (W/m2 K) | Cm (kJ/m2 K) | Admittance (W/m2 K) | f | F | Thickness (m) |
|---|---|---|---|---|---|---|
| HCB1 | 1.30 | 71.5 | 3.52 | 0.81 | 0.72 | 0.21 |
| HCB2 | 1.09 | 71.7 | 3.64 | 0.80 | 0.73 | 0.21 |
| L1 | 1.34 | 72.5 | 3.57 | 0.81 | 0.71 | 0.26 |
| L2 | 0.41 | 72.5 | 4.01 | 0.44 | 0.70 | 0.31 |
| A1 | 0.71 | 94.5 | 3.77 | 0.39 | 0.69 | 0.26 |
| A2 | 0.38 | 94.5 | 3.86 | 0.29 | 0.68 | 0.31 |
| f: Decrement factor | ||||||
| F: Surface factor | ||||||
| Cm: Effective thermal mass a | ||||||


5. Conclusions
Conflicts of Interest
References
- Energy & Electricity Planning Committee, Energy Database for Iran for Year 2011–2012; Department of Energy: Tehran, Iran, 2013.
- Tehran: Electric Demand Management Bureau Online Reports. 2013. Available online: http://edsm.tavanir.org.ir/motaleaate_modireyyate_masraf/olgoo-khanegi.asp (accessed on 12 July 2013).
- Tehran: Statistical Centre of Iran Online Reports. 2011. Available online: http://www.sci.org.ir/SitePages/report_90/population_report.aspx (accessed on 12 July 2013).
- Building and Housing Research Centre (BHRC). New Construction Technologies. BHRC: Tehran, Iran, 2010. Available online: http://www.bhrc.ac.ir/portal/Default.aspx?tabid=668 (accessed on 12 July 2013).
- Khabar Online (Iranian News Website). Available online: http://www.khabaronline.ir/detail/218221/ (accessed on 12 July 2013).
- Nasrollahi, F. Urban and Architectural Criteria for Reducing Building Energy Consumption; National Energy Committee of Iran: Tehran, Iran, 2012. [Google Scholar]
- Bureau for Compiling and Promoting National Regulations for Buildings; Code No. 19: Energy Efficiency; Ministry of Housing and Urbanism IRI: Isfahan, Iran, 2010.
- Fayaz, R.; Mohammadkari, B. Comparison of energy conservation building codes of Iran, Turkey, Germany, China, ISO 9164 and EN 832. Appl. Energy 2009, 86, 1949–1955. [Google Scholar] [CrossRef]
- Crawley, D.B.; Jon, W.H.; Kummert, M.; Griffith, B.T. Contrasting the capabilities of building energy performance simulation programs. Build. Environ. 2008, 43, 661–673. [Google Scholar] [CrossRef] [Green Version]
- Building Research Establishment (BRE). UK National Calculation Method; BRE: Watford, UK. Available online: http://www.ncm.bre.co.uk/ (accessed on 12 July 2013).
- ASHRAE Standard 55: Thermal Environmental Conditions for Human Occupancy; ASHRAE: Atlanta, GA, USA, 2010.
- ISO 7730: Ergonomics of the Thermal Environment—Analytical Determination and Interpretation of Thermal Comfort Using Calculation of the PMV and PPD Indices and Local Thermal Comfort Criteria; ISO: Brussels, Belgium, 2005.
- Heidari, Sh. Comfort temperature for Iranian people in the city of Tehran. Honar-Ha-Ye-Ziba 2009, 1, 5–14. [Google Scholar]
- McMullan, R. Environmental Science in Buildings, 6th ed.; Palgrave Macmillan: New York, NY, USA, 2007. [Google Scholar]
- Clay Brick and Paver Institute, The Role of Thermal Mass in Energy-Efficient House Design; Austral Bricks: Langford, Australia, 2006.
- Gregory, K.; Moghtaderi, B.; Sugo, H.; Page, A. Effect of thermal mass on the thermal performance of various Australian residential constructions systems. Energy Build. 2008, 40, 459–465. [Google Scholar] [CrossRef]
- Balaras, C.A. The role of thermal mass on the cooling load of buildings: An overview of computational methods. Energy Build. 1996, 24, 1–10. [Google Scholar] [CrossRef]
- Chartered Institution of Building Services Engineers (CIBSE), Environmental Design: CIBSE Guide A, 7th ed.; CIBSE: London, UK, 2006.
- De Saulles, T. Thermal Mass Explained; CentER (The Concrete Centre): Camberley, UK, 2011. [Google Scholar]
- Kruger, E.; Cruz, E.G.; Givoni, B. Effectiveness of indirect evaporative cooling and thermal mass in a hot arid climate. Build. Environ. 2010, 45, 1422–1433. [Google Scholar] [CrossRef]
- Laughton, M.A.; Warne, D.F. Eectrical Engineer’s Reference Book; Newnes: Oxford, UK, 2003. [Google Scholar]
- Nicol, J.F.; Humphreys, M.A. Adaptive thermal comfort and sustainable thermal standards for buildings. Energy Build. 2002, 34, 563–572. [Google Scholar] [CrossRef]
- Hegger, M.; Fuchs, M.; Stark, Th.; Zeumer, M. Energy Manual: Sustainable Architecture; Birkhauser: Berlin, Germany, 2008. [Google Scholar]
- Givoni, B. Climate Considerations in Building and Urban Design; Van Nostrand Reinhold: New York, NY, USA, 1998. [Google Scholar]
© 2013 by the authors; licensee MDPI, Basel, Switzerland. This article is an open access article distributed under the terms and conditions of the Creative Commons Attribution license (http://creativecommons.org/licenses/by/3.0/).
Share and Cite
Mohammad, S.; Shea, A. Performance Evaluation of Modern Building Thermal Envelope Designs in the Semi-Arid Continental Climate of Tehran. Buildings 2013, 3, 674-688. https://doi.org/10.3390/buildings3040674
Mohammad S, Shea A. Performance Evaluation of Modern Building Thermal Envelope Designs in the Semi-Arid Continental Climate of Tehran. Buildings. 2013; 3(4):674-688. https://doi.org/10.3390/buildings3040674
Chicago/Turabian StyleMohammad, Shaghayegh, and Andrew Shea. 2013. "Performance Evaluation of Modern Building Thermal Envelope Designs in the Semi-Arid Continental Climate of Tehran" Buildings 3, no. 4: 674-688. https://doi.org/10.3390/buildings3040674