Assessment of Seismic Vulnerability of a Historical Masonry Building

Abstract
: A multidisciplinary approach for assessing the seismic vulnerability of heritage masonry buildings is described throughout the paper. The procedure is applied to a specific case study that represents a very common typology of masonry building in Italy. The seismic vulnerability of the examined building was assessed after the following: (a) historical investigation about the building and the surrounding area, (b) detailed geometrical relieves, (c) identification of materials by means of surveys and literature indications, (d) dynamic in-situ tests, (e) foundation soil characterization, (f) dynamic identification of the structure by means of a refined Finite Element (FE) model. After these steps, the FE model was used to assess the safety level of the building by means of non-linear static analyses according to the provisions of Eurocode 8 and estimate of the q-factor. Some parametric studies were also carried out by means of both linear dynamic and non-linear static analyses.1. Introduction
The assessment of safety and, in general, of the structural behavior of existing masonry buildings is often a complex issue due to the inevitable uncertainness regarding geometry, typologies and mechanical properties of materials, effects of age and past loading history referring both to service and accidental loads (earthquake, fire, explosion, etc.), presence of architectonical and structural interventions with different techniques or materials, interaction with surrounding buildings and foundations, knowledge of foundation soil properties. Thus, for an existing masonry building, a complete knowledge is needed before starting any study of its structural safety or designing an eventual retrofitting intervention.
A complete knowledge needs detailed in situ inquiries according to a multidisciplinary approach providing both traditional and innovative investigation techniques. A detailed knowledge of the structure, even if it could appear expensive and time-consuming in the initial stage, in the later stages allows optimizing an eventual repairing design; such an approach reduces the costs of intervention and is in agreement with the ‘minimum intervention’ philosophy for heritage buildings [1,2]. Indeed, the knowledge level of the geometrical and structural characteristics of the examined building strictly influences the definition of the numerical models and, thus, the reliability of the building response prediction. The Italian Guidelines for cultural heritage [2] suggest to use methods characterized by different levels of knowledge and detail for the assessment of the seismic safety of historical buildings in function of the aim of such studies. The final level of knowledge of the structure depends on quality, quantity and deepening of in situ relieves, historical investigations, and experimental tests. The knowledge phases are aimed to define a model able to predict qualitatively the structural behavior or to carry out more refined structural analyses. Clearly, the reliability of each type of model, qualitative or quantitative, depends on the deepening level of the inquiries and on the amount of available data.
Simple approaches, based on indexes related both to a simplified estimation of the seismic resistance of the structure and the expected seismic action [2], can be useful instruments to develop seismic vulnerability maps functional to define a priority scale for further detailed analysis.
More refined analyses request a larger and more detailed database of information about the examined structure (geometry, mechanical properties in the linear and non-linear field, variability of parameters and anomalies in the constituent elements, etc.…) that can be collected by several fonts. Furthermore, for historical buildings the simplified methods can give useful indications particularly when detailed experimental in situ investigations cannot be carried out, i.e., in presence of strong preservation requirements, so that detailed approaches become unreliable. Note that the simplified methods are in general reliable only for regular and symmetrical buildings, stiff floors and predominant shear failure modes in the walls.
Historical investigations can be useful to characterize and analyze the origin of the structure and its vicissitudes. In particular, the following topics can be assessed by means of this type of investigation:
(a) the reasons for earlier structural interventions: severe damages or collapse due to catastrophic events (earthquake, explosion, fire) or normal use of the building, change of use destination, change of owners, change of architectonic features related to the current architectonic style;
(b) the overall evolution of the examined building as well as of the surrounding buildings related to the urban evolution of the area;
(c) the presence of not contemporaneous construction phases characterized by different materials and techniques;
(d) the individuation in coeval buildings placed in the same area of typical construction materials and techniques. Indeed, the choice of the construction materials, especially if natural carved stones are used, was often related to the geographical location of the building and the local availability of quarries in the neighborhood.
Most of this information can be collected only by means of archival and bibliographical documentations and their importance should be not neglected.
Successively, detailed surveys of geometry and materials make it possible to detect characteristic features such as type and configuration of floors, disposition of resistant masonry walls, nature and dimensions of masonry component elements (i.e., type and dimensions of masonry blocks), wall texture (i.e., disposition of blocks and mortar joints, thickness of joints, presence of a single or double panel with chopped materials in the central cavity), construction details (connections between the floors and the vertical resistant elements, local connections between parallel walls as steel chains or between orthogonal walls in the corners along their height for improving the global behavior of the building, etc....). These aspects can be better assessed and/or integrated by means of information collected by historical investigations and the knowledge of the construction techniques typical of that area. Indeed, thanks to the comparison with similar buildings, the amount of the specific investigations to be realized in situ can be reduced.
The assessment of the mechanical properties of the various constituent materials (i.e., masonry blocks, mortar) and of their assembling has to be investigated by means of detailed in situ testing [3]. The original mechanical properties of the construction materials often have been modified by the age of the building and by loading and environmental effects over time. Thus, the detection of crack patterns and/or of decay conditions of the materials is a first check for individuating potential troubles in structural elements. The mechanical properties of masonry blocks and mortar joints are usually assessed by means of destructive tests in situ, even if in the last years, a significant effort has been spent to use non-destructive testing techniques [4,5,6,7,8] in order to limit destructive tests to only a few points.
Investigation techniques based on in situ dynamic tests carried out through ambient or forced vibrations [9,10,11,12,13,14,15] represent an innovative and useful instrument to observe different aspects of historical buildings thanks to the study of their dynamic response in terms of frequencies and modal shapes [2].
Firstly, based on the comparisons of experimental evidence (mainly consisting of the principal modal shapes and the related frequencies) and predictions given by linear dynamic models, the values of elastic constants and unit weight of masonry can be easily assessed, taking into account the overall assembly of stones/bricks and mortar.
Moreover, dynamic in situ tests can be aimed at studying the response of the structure under seismic actions and at investigating the interaction of the examined building with adjacent constructions or with the foundation soil. This latter topic in particular is rarely accounted for in common structural modeling because in most cases, type and dimensions of the foundations or properties of the subsoil are unknown. When the foundation soil is soft, the hypothesis of a fixed-base condition for the superstructure is no longer valid and the effect of Soil-Structure-Interaction (SSI) should be accounted for. If dynamic in situ monitoring is carried out, the role of SSI should be properly accounted for, because measures acquired in different parts of a building may contain the effect of coupling between soil and structure.
Finally, a periodical control of the main dynamic parameters of the building by in situ dynamic tests is useful to verify if some changes in the building have occurred, especially in the case of historical ones [2].
The information collected in these preliminary steps are functional to the structural model; it is clear that, if the amount of information is huge, the modeling can be more refined and the results more reliable. For example, models by Finite Elements (FE) allow understanding the structural behavior for a fixed action, identifying the original causes of the current damage patterns, individuating the resisting mechanisms, and predicting the behavior for exceptional actions (i.e., seismic action).
After the building has been modeled, linear analyses under gravity loads are useful instruments to verify the accuracy of the geometrical layout and the reliability of the values of unit weight by comparing the theoretical stress distributions with the experimental data obtained in situ in some significant points (i.e., by means of flat jacks). Moreover, a 3D model allows identifying local problems related to stress concentration by comparing them with actual situations and taking into account a rehabilitation design. As previously cited, FE modeling techniques are also a useful support to develop linear dynamic analyses and to assess the mechanical parameters of materials by means of comparison with in situ dynamic tests.
Modern code provisions advise to assess the safety of masonry buildings taking into account the non-linear behavior for masonry, by means of ‘push-over analysis’ carried out thanks to more or less refined models (methods based on storey mechanisms, equivalent frame approaches, two- or three-dimensional continuum approaches [16,17,18,19,20,21,22]. Moreover, pushover analyses are frequently used to assess the seismic vulnerability of historical masonry constructions [23] because the effort spent for the detailed modeling is compensated by the relevance of the structure.
However, the post-elastic behavior of masonry materials is quite uncertain to define, but it is a key aspect to simulate the non-linear behavior of the structure and, thus, needs to be assessed especially for seismic verifications. However, because affordable non-linear FE analyses applied to a continuum require high expertise and should be used when the knowledge of the structure is very detailed, several methods based on simplified element meshing have been developed. The reliability of these approaches for the prediction of the actual behavior of each structure strictly depends on its geometrical configuration. Moreover, in structures endowed of particular architectures (churches, arches, domes, etc.…) it is often possible to identify sub-structures characterized by well-defined resistant mechanisms, so that single parts of the building are verified separately [22,24,25].
In this paper a complete approach for the study of an existing masonry building with the final aim to evaluate its safety conditions is followed by analyzing a typical case study: a historical building (Palazzo Bosco Lucarelli) located in Benevento (Italy), a zone of high seismic hazard in the core of the Apennine.
2. The Case Study of a Historical Building
2.1. History and Description of the Structure
For the examined building, ‘Palazzo Bosco Lucarelli’, an old noble palace located in Benevento (Italy), research in the archives of City Hall and in public libraries allowed collecting information about the different construction phases of the building thanks to historical reports, maps, urban plans and, for the XX century, photos.
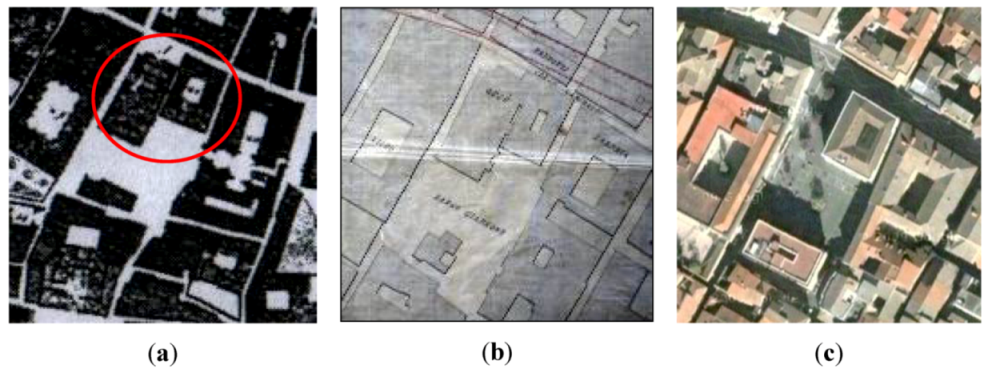
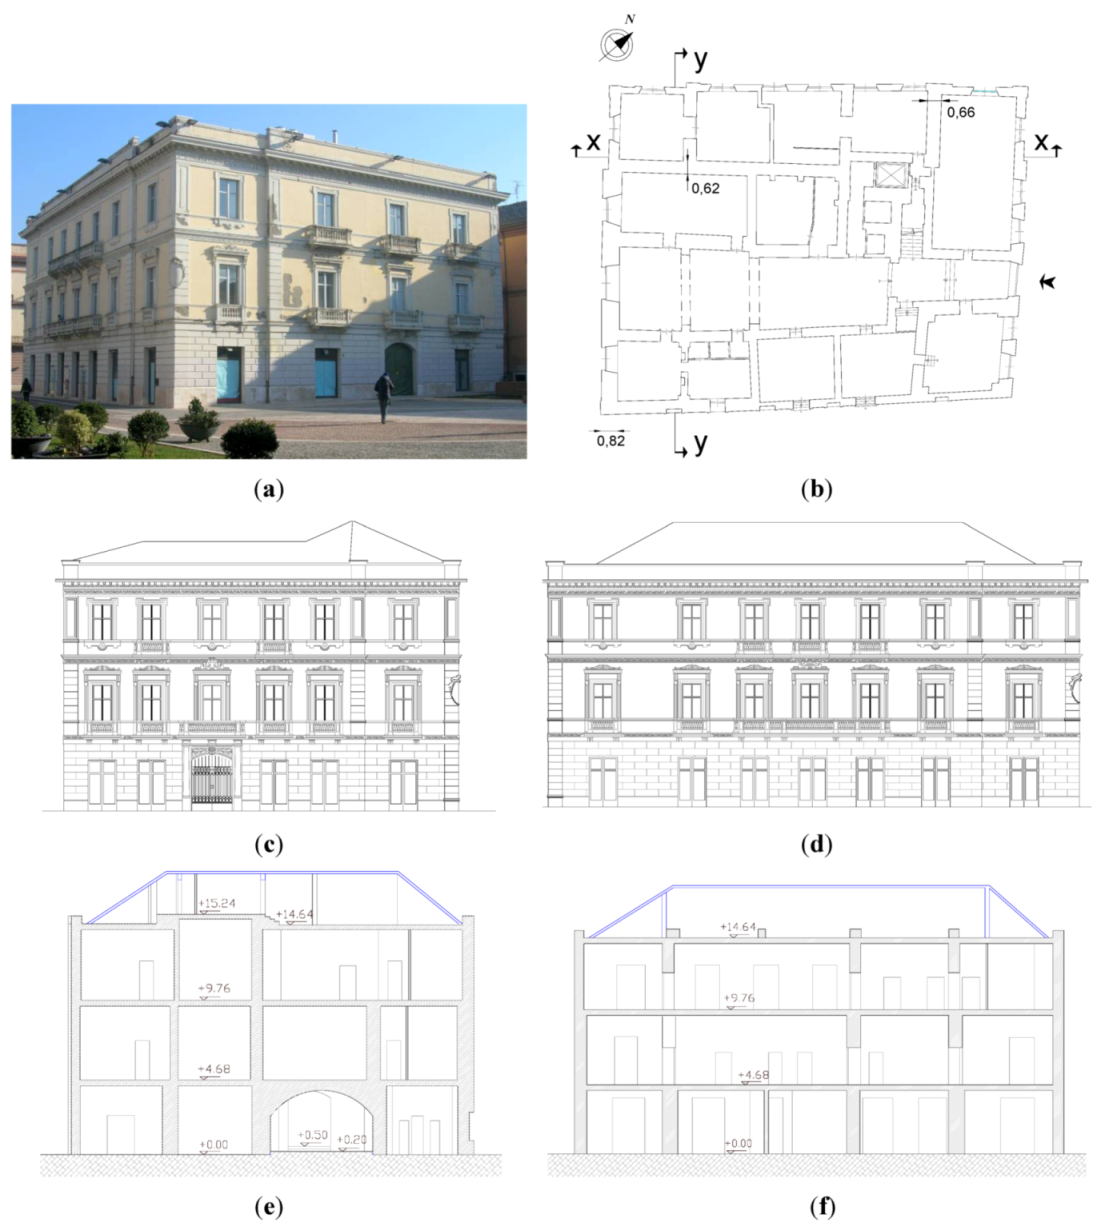
The original nucleus of the current building probably goes back to the XI century; successively, some documents of XIII and XIV century confirm the presence of a construction with an adjacent church in the same site of the current palace. This building was severely damaged during the strong earthquake of 1702, after that it was rebuilt and amplified assuming the present ‘palace’ structure with an internal closed court. Some maps of Benevento of XVIII century (Figure 1a) show a central hallway, the entrance on the current back prospect of the palace (South-West prospect), and the adjacent church. In the years 1768–1774 the building was retrofitted and part of the church was incorporated in the construction, such as indicated in some maps of the beginning of XIX century and in the urban plan of the town dating back to 1880 (Figure 1b). At the end of XIX century, another floor was added and in 1926, when the church was completely demolished, the west wing of the building was doubled and the current geometrical configuration was assumed (Figure 1c, Figure 2a). Nowadays the court is not central anymore, but is located asymmetrically with respect to the west wing that is double the size compared to the east one (see the plan of the ground floor in Figure 2b).
The last interventions were carried out at the end of the 90s when the building became the headquarters of the Engineering Faculty of the University of Sannio. No substantial modifications were carried out in the structural or external architectural layout, only a functional redistribution of the rooms was realized.
Nowadays the structure has a rectangular holed floor plan (Figure 2b), consisting of an underground floor, which is not completely accessible, a ground floor, two upper levels, and an attic under the pitched roof. The largest dimensions in the plan are 20 m and 16 m, the total height is 18.2 m.
The thickness of the walls varies in the range of 0.3 m–1.0 m with the greatest values attained at the ground floor (Figure 2b). A complete geometrical and structural stwo main façades (northeast and northwest prospects, Figure 2c,d) and two orthogonal sections (Figure 2e,f) are reported to illustrate the geometry of the building.

The original floors in most cases have been substituted by double standard 'T' shaped steel profiles with a height of 200 mm (standard type IPE 200) and spaced at a distance of 0.85 m interspersed with bricks and covered by a concrete deck 100 mm thick. Only the ceilings of the staircase and of some rooms in the entrance hall on the ground floor are still made of the original masonry vaults. The floors can be considered as rigid diaphragms and some local tests evidenced a good connection with the vertical masonry walls (reinforced concrete joists are present along the upper perimeter), so that out-of-plane mechanisms can be neglected. The connections were probably improved when the old original floors were substituted by the current steel-concrete ones. Moreover, some steel chains are present below the first floor between the outside walls and the internal walls of the closed court; these chains were positioned at the beginning of the XX century when the last significant structural and geometrical changes of the building were performed (doubling of the west wing and construction of a new level) in order to improve the global behavior of the masonry walls between the ground and the first floor. Nowadays no sign of out-of-plane mechanism can be observed in the structure.
The roof is made of a steel truss that is supported on a perimetric reinforced concrete joist. A profiled steel sheeting, externally covered with brick tiles, closes the structure.
2.2. Assessment of Masonry Properties
The in situ surveys allowed detecting a masonry structure made of different materials and textures at the three levels, due to the several construction phases of the building.
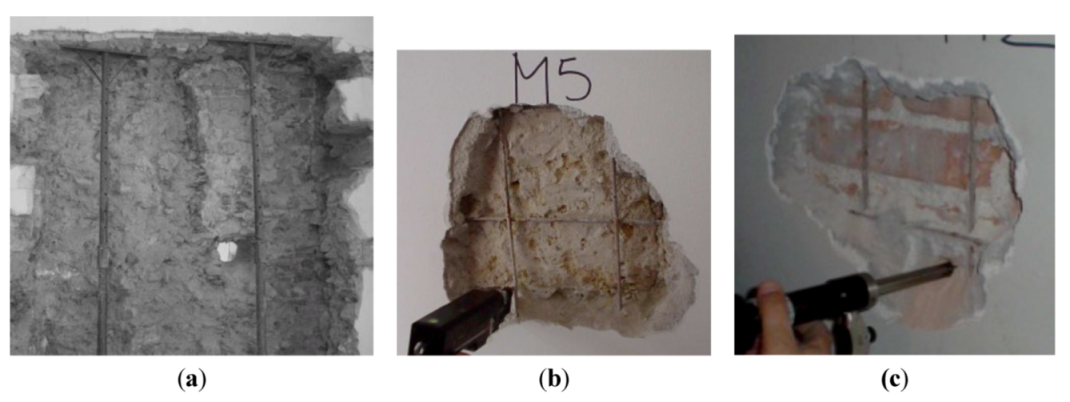
At the underground and ground levels, the walls are made of irregular blocks of limestone and conglomerates (Figure 3a) with some inclusions of tuff (Figure 3b) or bricks, probably used in the past to close existing openings. At the underground level, blocks are greater and more irregular suggesting that the underlying foundations were realized as further enlargement of the masonry walls. The first two levels probably date back the construction age of the original nucleus in the IX century, since the masonry texture is typical of coeval palaces present in Benevento and dating to the same period.
At the higher levels, the walls are made of clay bricks (Figure 3c) and were probably built at the end of XIX century, as confirmed by similar masonry textures evidenced in other coeval fabrics and by the information collected about the history of the building.
At each level the walls are covered by a reinforced cement plaster (with a thickness of 50 mm and with a grid of steel bars with a diameter of 4 mm and spaced at a distance of 150 mm in two orthogonal directions, see Figure 3b,c) which can be dated back to the XX century.
Few coring examples of masonry were extracted from the walls and endoscope tests were carried out in the corresponding drilling holes; the images evidence that the walls are made of blocks along the entire thickness, without spacing between the external panels.
Compressive tests were carried out on some single blocks extracted from the masonry. The compressive test on a calcareous stone sample (cube with a side length of 50 mm) extracted at the ground floor level provided a strength of 11.6 MPa, while tests on cubes made of bricks (side length of 60 mm) extracted from the walls at the first and second levels provided strengths of 3.7 MPa and 2.7 MPa (mean values of two tests), respectively. Penetrometer tests on the mortar of the joints gave a compressive strength of about 0.65 MPa for the ground floor and 0.40 MPa for the superior levels; these values allow to classify the mortar as being of a poor typology [27,28].
However, because these data refer to single stones and, thus, are not sufficient for a complete mechanical characterization of the whole masonry assembling, the main mechanical properties (compressive strength, fm, shear strength without vertical loads, τo,m, and tensile strength, ftm) were assessed based on the indications given by some recent national guidelines [28] (Table 11.D1, Appendix 11.D) because they provide lower values compared with the ones indicated in the applicative document [29] joined to the current Italian code [27]. The mechanical properties are provided as function of the masonry typology identified in situ by the surveys of materials (Table 1). In particular, the masonry of the ground and underground floors has been identified in the category “Cut stone masonry with good bonding”, while for the higher levels of the building, the masonry has been identified as being made of “clay bricks with lime mortar”. Considering an intermediate level of knowledge [27,28,30], achieved thanks to the in situ surveys, the central value of the interval reported in [28] was adopted for the compressive and shear strength. Then, an amplifying factor of 1.5 due to the beneficial effect of the reinforced plaster [27,29] and a reduction factor of 1.2 (confidence factor for taking into account the knowledge level) were considered to calculate the final values reported in Table 1.

| Floor | Masonry | fm | τo,m | ftm=1.5 τo,m | W | E | E∙1.5 |
|---|---|---|---|---|---|---|---|
| Typology | [MPa] | [MPa] | [MPa] | [kN/m3] | [MPa] | [MPa] | |
| Ground | Cut stone masonry with good bonding | 2.19 | 0.081 | 0.122 | 20 | 1500–1980 | 2250–2970 |
| (1740) | (2610) | ||||||
| 1st–2nd | Clay bricks with lime mortar | 2.88 | 0.095 | 0.143 | 24 | 1200–1800 | 1800–2700 |
| (1500) | (2250) |
For the estimation of the unit weight, the samples extracted from masonry provided values of 26 kN/m3, 17 kN/m3 and 19 kN/m3 for the calcareous stone, the bricks and the mortar, respectively; moreover, for the reinforced plaster a unit weight of about 24 kN/m3 can be assumed. Based on these values and on the observed brick texture, for the masonry of the first and second floors the unit weight has been estimated to be about 17.5 kN/m3, which is similar to the value of 18 kN/m3 suggested in both the Italian guidelines [28] and code [29]. If the layer of reinforced plaster is considered too, the unit weight increases up to about 20 kN/m3.
Similarly, for the irregular masonry of the ground and underground floors, the unit weight was estimated to be 22 kN/m3, which is comparable with the value of 21 kN/m3 suggested in both the Italian guidelines [28] code [29]. If the layer of reinforced plaster is considered too, the unit weight increases up to about 24 kN/m3.
On the contrary, it was not possible to develop an experimental evaluation of the Young’s modulus, E, of the masonry. Literature studies [31] show that the Young’s modulus of masonry assembling is affected by a large variability even within the same type of stone (values of CoV also greater than 40%). Some attempts have been made to furnish empirical correlations between the Young’s modulus and the compressive strength, but these correlations are a function of the stone type [32,33]. Both national guidelines and code [28,29] were considered for the assessment of Young’s modulus. The same range of values (1500–1980 MPa) is given for the “Cut stone masonry with good bonding” of the ground floor. Conversely, for the “clay bricks with lime mortar”, [28] and [29] suggest the ranges of 1800–2400 MPa and 1200–1800 MPa, respectively. The lower range suggested by [29] was considered for the “clay bricks with lime mortar”. Moreover, both codes specify that in case of historical masonry, the suggested values refer to masonry with poor characteristics, thick mortar joints, lack of regular horizontal layers and tidy texture, lack of transversal connecting elements between the internal and external panels of the same wall. Thus, the provided values should be reduced or increased, depending on the current conditions of the masonry. In particular, for the examined masonry types, the presence of the reinforced plaster hence also allows the use of an amplifying factor of 1.5 for the elastic modulus, as is done for the strength. In Table 1 the ranges of E for both types of masonry are reported together with the corresponding central values, assuming an intermediate level of knowledge (2610 MPa and 2250 MPa for the masonry of the ground and the upper floors, respectively). Note that these values represent the starting points for the numerical linear dynamic analyses, aimed at back-calculating the values of E by comparison between experimental and predicted values of frequencies. The above-mentioned values refer to un-cracked condition for the masonry and, thus, should be reduced considering the effective building loading history.
2.3. Characterization of the Foundation Soils
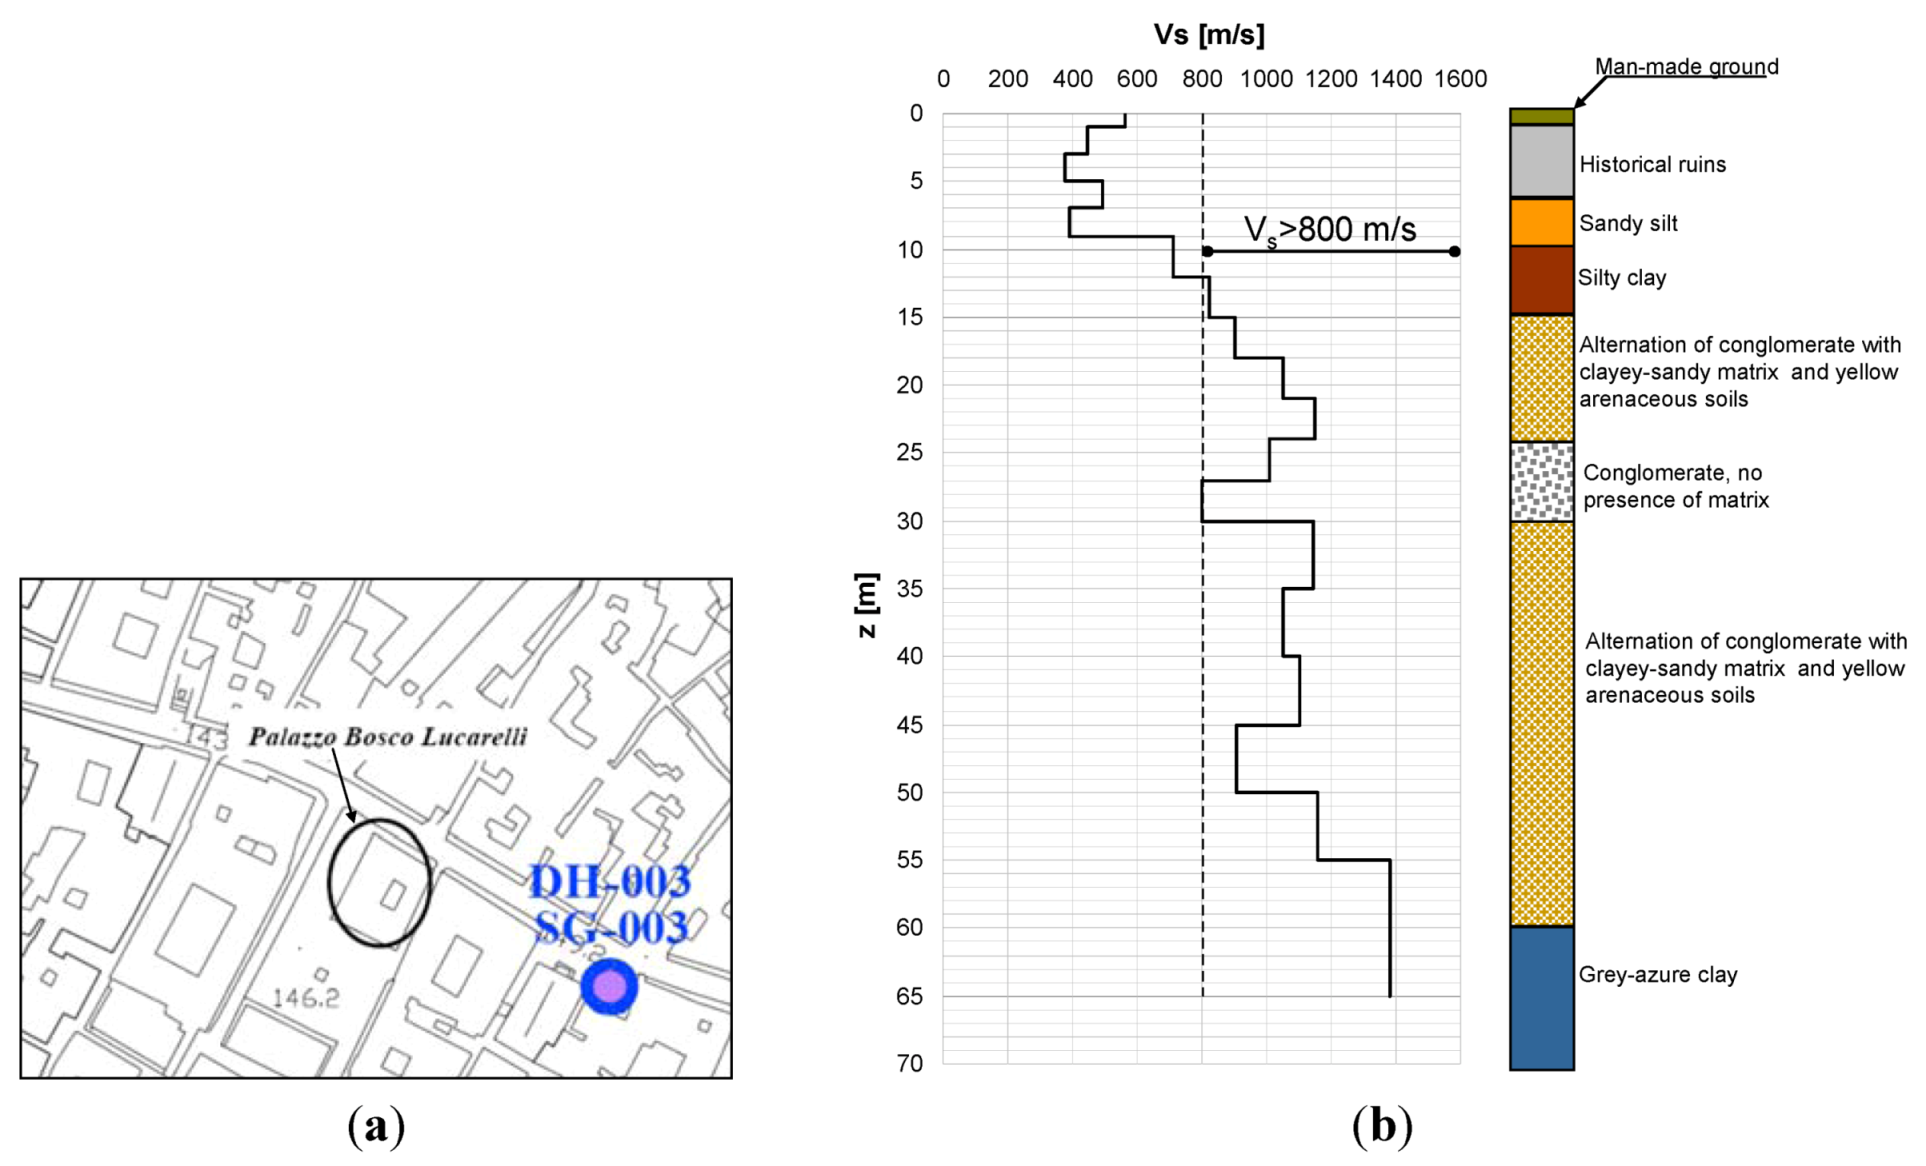
To characterize the foundation soil, a few in situ tests carried out near the building were interpreted. In particular, the following tests were considered: (i) a borehole carried out by the local administration very close to the building (SG-003, Figure 4a); (ii) one standard penetration test (SPT) and (iii) one down-hole test (DH). The borehole SG-003 is very deep and reaches a maximum depth of 70 m below ground level (Figure 4b). After the first six to seven meters of man-made ground and historical ruins, the subsoil is made of almost nine meters of fine-grained materials (silt and clay) followed by an alternation of coarser soils, i.e., conglomerate and sandstone up to 60 meters below ground level. The succession ends with grey-azure clay (Pliocenic Age), which is typical of the Benevento area [34] and represents the bedrock formation from the viewpoint of seismic wave propagation. With the velocity of the S-waves in the first 30 meters of the subsoil, VS30, was estimated around 700 m/s. This value allows classifying the site where Palazzo Bosco is located into the category B [27,30].
2.4. In Situ Dynamic Monitoring
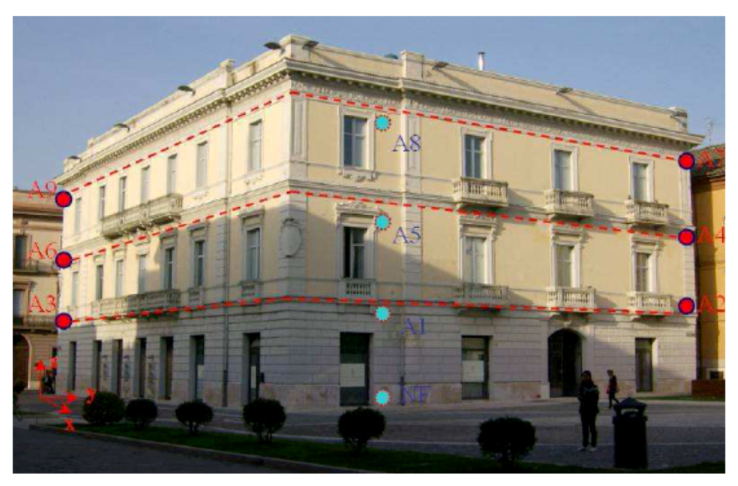
A continuous monitoring system made of nine couples of mono-axial accelerometers was placed on the three floors of the building and a three-axial accelerometer was located on the ground floor. Each couple of sensors is able to measure separately along the X and Y direction. The position of the instruments is reported in Figure 5. The sensors were aligned as accurately as possible along three vertical lines: one corresponding approximately to the center of the building and the other two to the external edges (see Figure 5). On the first floor, the sensors were placed at about 100 mm from the first floor intrados, on the second floor at about 100 mm from the second floor extrados, and on the third floor at about 100 mm from the third floor extrados.
Different sets of accelerometric recordings are available caused by ambient noise and impulsive sources (i.e., the fall of 1 m3 concrete block on a truck placed close to the building, the rapid braking of the truck along the Y direction of the building, some knocks of an instrumented hammer).
In particular, the fall of the concrete block originated vibrations in the building with well-defined peaks that were used to have a first rough estimation of the building’s dynamic response. The frequency domain representation of such recordings (acquired with a sampling frequency of 500 Hz) was carried out by performing the Fast Fourier Transform (FFT) during a signal-window of eight seconds, centered on the peak value. The energy content of the recorded signals was low at frequencies higher than 50 Hz; for this reason, a low-pass FIR (Finite Impulse Response) filter was adopted in correspondence of 50 Hz. A standard baseline correction was also carried out on the original accelerometric data.
| Sensors | Eigenfrequencies [Hz] | |
|---|---|---|
| X | Y | |
| A1 | 4.8 | 4.2 |
| A2 | 4.8 | 4.2 |
| A3 | 4.5 | 4.3 |
| A4 | 4.8 | 4.2 |
| A5 | 4.8 | 4.2 |
| A6 | 4.5 | 4.3 |
| A7 | 4.8 | 4.2 |
| A8 | 4.7 | 4.2 |
| A9 | 4.5 | 4.4 |
| Mean | 4.69 | 4.24 |
| St. Dev. | 0.15 | 0.07 |
| CoV | 3.1% | 1.7% |
The values of the first two frequencies of the building (in X and Y direction) identified by each couple of sensors are listed in Table 2 together with the mean value, the standard deviation and the Coefficient of Variation (CoV) of the measured data for each direction.
The frequencies are low scattered among the measures of the nine sensors in both X and Y direction with very small CoVs (3.1% and 1.7% for the X and Y direction, respectively). The frequency identified for the X direction is slightly greater (4.69 Hz vs. 4.24 Hz, +10%) than the one associated with the Y direction.
3. 3d fe Model and Numerical Analyses
Linear dynamic analyses can be a useful instrument for identifying the first vibration modes of a building in order to better evaluate the distribution of equivalent horizontal seismic forces in case of the design of a new structure or the assessment of existing ones based on linear static analyses.
Moreover, for historical buildings, the choice of a reliable behavior factor [27,30] for linear static analysis can be very difficult and aleatory, so that non-linear static analysis can prove useful in numerically estimating the actual behavior factor.
In the following sections, both linear dynamic analyses, aimed at assessing the dynamic behavior of the building, and non-linear static analysis (pushover analysis), aimed at estimating the capacity displacement of the building and its behavior factor, will be illustrated.
3.1. Model Description of and Definition of the Loading Conditions
Based on the geometrical survey of the building, a three-dimensional Finite Element Model was implemented with the software DIANA TNO (release 9.4 [35]). The model is made of three-dimensional ‘brick’ elements, about square shaped in the X-Y plane. The side dimension in the X-Y plane is about 0.3 m which corresponds to half, the third or the whole thickness of each masonry wall, with the masonry thickness variable being in the range of 0.3–1.0 m. The third dimension along the Z-axis is at maximum equal to 1.0 m and allows having a maximum shape ratio between the sides of about three.
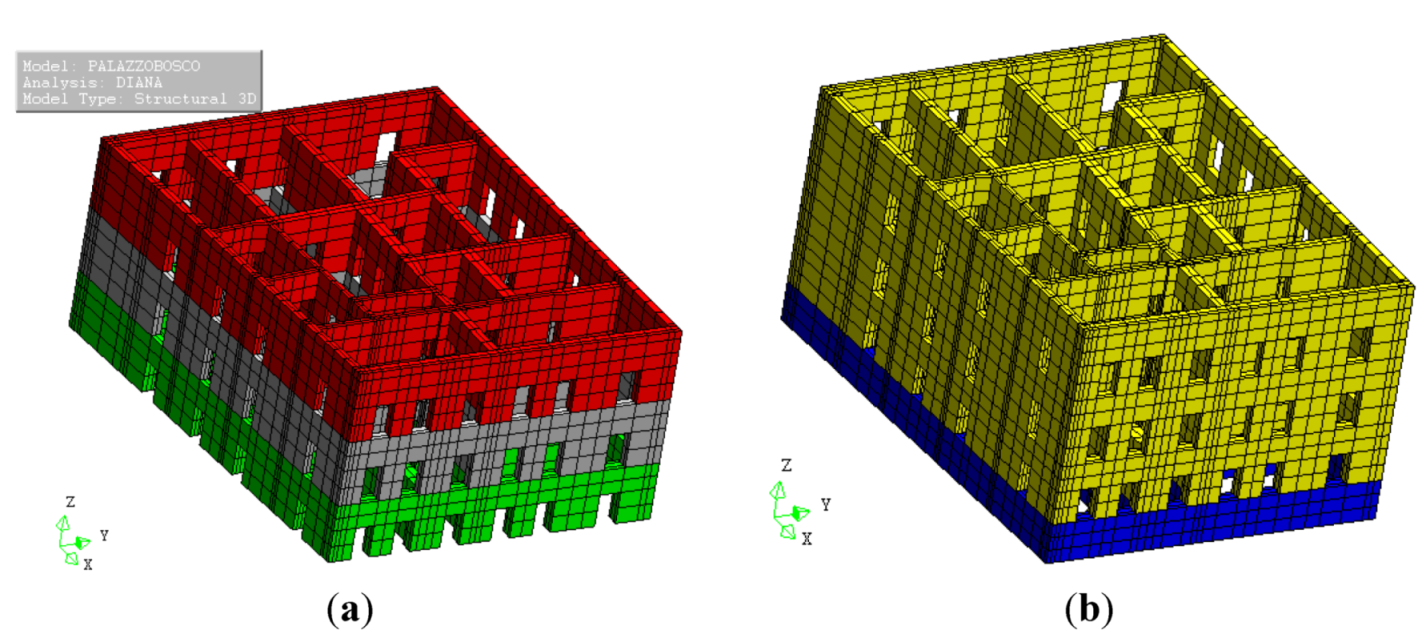
The 3D model is made of about 20’000 elements (Figure 6); the three floors were modeled by means of a stiff constraint in each plane and the vertical loads acting on the floors were applied directly on the corresponding masonry walls. The building was modeled both with (Model B, Figure 6b) and without (Model A, Figure 6a) the underground floor according to the type of analysis, as will be explained in the following.
As gravity loads the self-weight of masonry walls was computed using the unit weight reported in Table 1; the dead load of the floors was estimated as Gk = 5.40 kN/m2, while for the accidental loads, at the ground level, the first and the second floor, the values Qk = 3.00 kN/m2 for eventually crowded ambient [27] were considered and at the level under the roof the lower value of Qk = 0.50 kN/m2 [27] was assumed. The weight of the steel roof was estimated to be 1.75 kN/m2, while the weight of the masonry stairs was neglected. The loads of the balconies were applied directly on the external walls (Gk = 3.60 kN/m2, Qk = 4.00 kN/m2).
Assuming a reduction factor for the accidental loads of ψ2 = 0.6 under the quasi-permanent loading condition [27,36], the total weight is about 68700 kN for Model A and 88900 kN for Model B.
3.2. Linear Dynamic Analysis
Linear dynamic analyses were developed through the 3D FE Model considering all the vibration modes characterized by a participating mass ratio greater than 5%. The aims of such an analysis and its comparison with the dynamic in situ tests are multiple, even if they are correlated with each other: (1) to identify the dynamic behavior of the building in terms of main vibration shapes and frequencies; (2) to confirm and/or assess the reliability of the unit weight and the Young's modulus of masonry previously estimated; (3) to have indications about the interaction with the foundation soil. These topics are strictly correlated because the values of the main frequencies depend both on the mechanical properties of masonry (unit weight and Young’s modulus) and on the soil-structure interaction effects. Assuming that the geometrical survey of the building is very detailed and conforms to reality and that the estimation of the unit weight of masonry is reliable (this means the global mass of the building is well-defined), the dynamic analysis will be used to assess only the Young’s modulus and estimate the effect of the soil-structure interaction, if present. This latter point has been investigated thanks to some information available about the mechanical properties of the foundation soil (see Section 3.3). In order to achieve these results, (1) the mean values of the first two frequencies estimated by the dynamic measurements in situ (see Table 2) were used as target for the numerical values of frequencies given by the dynamic analyses; (2) the Young’s modulus of masonry were varied in reliable ranges.
Firstly, the effect of the Young’s modulus was investigated and, in order to take into account the cracking phenomena as suggested by the codes, the central values of the ranges reported in Table 1 (Young’s modulus for the ground floor EG = 2610 MPa, Young’s modulus for the 1st and 2nd floor and E1–2 = 2250 MPa) were reduced. For reinforced concrete structures it is in general suggested to reduce the inertia of the element by 50%, taking into account the cracking phenomena [27]; this hypothesis can be simply introduced into the modeling by reducing the Young’s modulus of concrete. For masonry structures it is expected that the reduction of the inertia due to cracking phenomena is lower because of the high compressive stresses usually acting on the masonry walls. Thus, three reductions, lower than 50%, of the Young’s modulus were assumed in order to: (1) verify the variation with E of the theoretical values of frequencies given by the FE model, and (2) compare them with the experimental ones:
Case 1: - 30% (EG = 1850 MPa and E1–2 = 1550 MPa);
Case 2: - 45% (EG = 1450 MPa and E1–2 = 1250 MPa);
Case 3: - 15% (EG = 2200 MPa and E1–2 = 1850 MPa).
For these analyses in both Models A and B, the basement was considered completely restrained. Moreover, for the model with the underground level (Model B, Figure 7b), the pressure of the lateral soil was considered as acting on the underground walls by means of an earth pressure coefficient ko at rest equal to 0.7 (no kinematism was hypothesized).

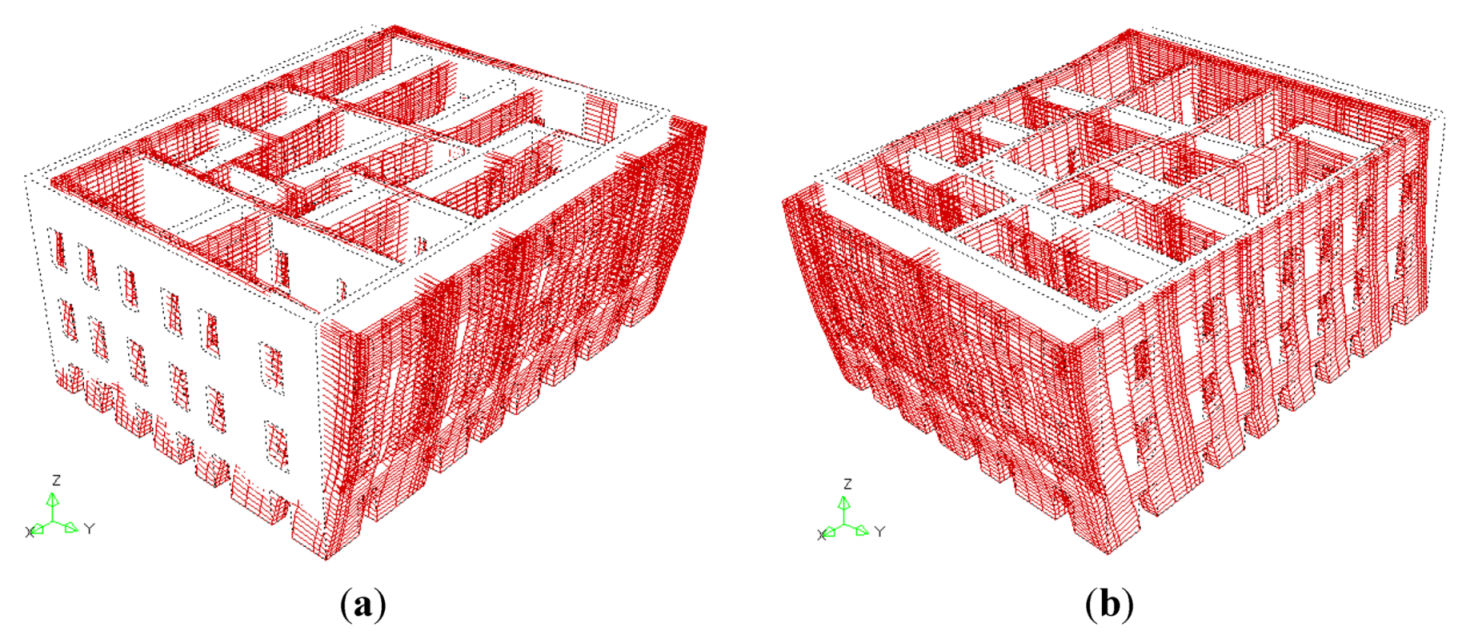
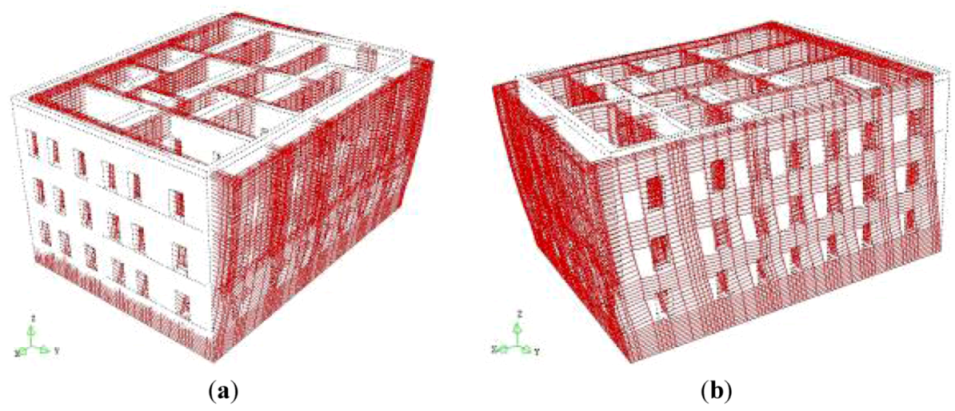
The numerical values of the first four frequencies are listed in Table 3 for the three cases examined, while the shapes of the first two vibration modes are reported in Figure 7 and Figure 8 for Models A and B of the only Case 1, since they are identical for Cases 2 and 3.
| fth,fix [Hz] | fexp | ||||||
| Case 1 | Case 2 | Case 3 | |||||
| EG = 1850 MPa | EG = 1450 MPa | EG = 2200 MPa | [Hz] | ||||
| E1-2 = 1550 MPa | E1-2 = 1250 MPa | E1-2 = 1850 MPa | |||||
| Mode | Model A | Model B | Model A | Model B | Model A | Model B | Exp. |
| 1 (Transl. Y) | 4.88 | 4.21 | 4.36 | 3.75 | 5.33 | 4.60 | 4.24 |
| 2 (Transl. X) | 5.45 | 4.71 | 4.87 | 4.19 | 5.96 | 5.14 | 4.69 |
| 3 (Local) | 11.61 | 10.81 | 10.38 | 9.64 | 12.71 | 11.81 | - |
| 4 (Local) | 13.08 | 11.58 | 11.67 | 10.32 | 14.29 | 12.64 | - |
In both models, the first and the second modal shapes are completely translational in direction Y (Figure 7a and Figure 8a) and X (Figure 7b and Figure 8b), respectively, with a participating mass ratio of about 75% for each direction. In agreement with the experimental results, the first frequency (direction Y) is always about 10% lower than the second one (direction X); this evidences a tendency of the building to be more deformable in direction Y that is parallel to the shorter side (East-West direction, see Figure 2b).
In the model with the underground level (Model B), the first two frequencies are reduced by about 16% with respect to Model A, clearly indicating a greater deformability of the building when the underground floor is modeled too.
The third modal shape, having a share of participant mass equal to 10 % only, is local and regards a wall of the Northwest façade (Figure 2d) on the second floor. This wall is particularly deformable due to the presence of many openings in comparison with the other façades (the two parallel façades along the X direction are not perfectly symmetrical, see plan of the building in Figure 2b). The fourth mode is local too and characterized by mass participant ratios lower than 5%.
When the effect of the Young’s modulus is reduced by about 20% (i.e., Case 2 vs. Case 1) both first and second frequencies reduce by 10%. Adopting Young’s moduli lower than those assumed in Case 2 is unrealistic, because very small numerical frequencies are obtained, and, thus, they are not reliable with the experimental evidence. Moreover, any interaction with the foundation soil has not been considered yet in these analyses, and it is known that the SSI can induce a further reduction of the main frequencies. Similarly, when the Young’s modulus increases by about 20% (i.e., Case 3 vs. Case 1), the theoretical frequencies increase by about 10%. In conclusion, as expected, a relevant sensitivity of the frequencies to the variation in Young’s modulus has been observed: It can be concluded that, for the examined building, a variation of 50% in E leads to a variation of about 25% in terms of frequencies.
In the last column of Table 3, the mean values of the first two frequencies experimentally indentified are listed too. As confirmed by the numerical FE analyses, higher frequencies have not been experimentally identified, probably due to the low rate of participating mass corresponding to these modes and the low intensity energy of the dynamic source. The experimental frequency of the first mode is the mean value of the values corresponding to the first peak of the FFT for each sensor measuring in the Y direction; the same applies analogously for the X direction.
Considering Model A (without the underground level), the results of Case 2 are closer to the experimental evidence (+2.8% and +3.8%). By contrast, considering Model B (with the underground level) that furnishes lower frequencies than Model A, the experimental results are best fitted by the Case 1 (–0.7% and +0.4%).
It is clear that a correct assessment of the Young’s modulus of masonry should not ignore the effect of the foundation soil deformability that, in these analyses, has been completely neglected in both Models A and B because the structure has been considered fixed at the basement.
3.3. Effect of Soil Stiffness
In Section 3.2 it has been observed that for Model B, where the underground floor is modeled and lateral pressures of the subsoil are applied on the perimetric underground walls, the first two frequencies decrease by about 16% with respect to Model A (see Table 3), independently of the Young's modulus of masonry.
A first simple approach to consider also the deformability of the foundation soil consists in substituting the fixed constraint at the basement level with vertical elastic springs identified by a coefficient of sub-grade reaction, k [37]. This approach, even if it is widely adopted by designers to take into account soil deformability in the global modeling of the structures, is strongly influenced by the values assigned to the parameter k. Note that an uncorrected estimation of k could lead to an excessive and unrealistic deformability of the structure.
For the case at hand, several values of k have been assigned to the vertical springs placed under the basement walls, and it was found that for k = 0.10 N/mm3 the same results of the completely fixed-base schemes are obtained. This led to consider k = 0.10 N/mm3 as an upper limit of the variability range of this parameter. Moreover, varying k in the range of 0–0.10 N/mm3, it was found that the main frequencies reduce as k decreases with a quite linear trend: i.e., for k = 0.05 N/mm3, that corresponds to 50% of the upper limit, the frequencies reduce by about 25% compared to the fixed-base schemes. Notwithstanding the simplicity of this approach, the parametric study enhances, thus, that the effect of k is similar to that given by the variation of the masonry Young’s modulus discussed in Section 3.2. This aspect highlights how soil deformability could be important in modeling the structure response. However, different and more refined approaches for taking into account Soil-Structure Interaction exist and their use for the case at hand has been illustrated in [38].
3.4. Analysis under Gravity Loads
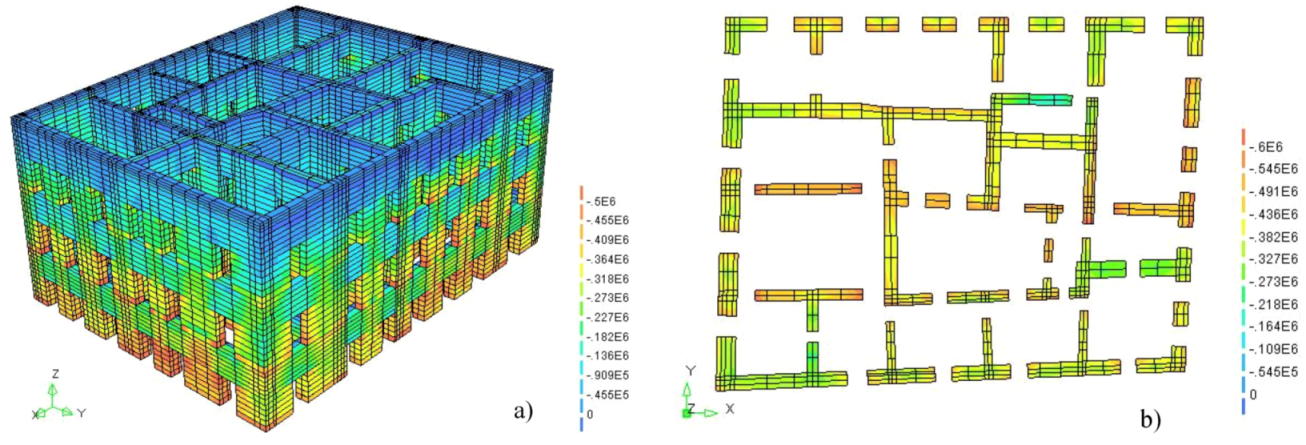
By means of the 3D FE model of the building, the stress distribution under gravity loads was estimated in order to check the eventual presence of anomalous stress concentrations. The gravity loads were defined in Section 3.1 and were amplified by the coefficients γg = 1.3 and γq = 1.5 for permanent and accidental loads, respectively, in order to carry out verifications at the ultimate limit state [27,39].
In Figure 9 the distributions of the vertical stresses (σzz) in the entire building (Figure 9a) and at the ground floor (Figure 9b) are reported for Model A. The highest values of the compressive stresses are 0.85 MPa for the ground floor, 0.70 MPa for the first, and 0.45 MPa for the second one. These values, referring to the strength reported in Table 1 (2.20 MPa for the ground floor and 2.70 MPa for the superior ones), correspond to safety factors of 2.6, 3.9 and 6.0, respectively. However, these values are singular peaks relieved at corners or openings, while the stresses are on average about 0.55 MPa at the ground, 0.45 MPa at the first and 0.35 MPa at the second floor.
When the underground level is modeled too (Model B) and the pressure of the foundation soil is taken into account on the lateral underground walls by means of the coefficient ko = 0.7, a contrasting action of the soil on the transversal dilatation of the underground walls is observed. The compressive stresses are a little higher than Model A and are on average equal to 0.90 MPa at the underground level, that is, however, significantly lower that the masonry strength.
3.5. Non Linear Static Analysis under Horizontal Actions
3.5.1. Choice of Parameters for Non-Linear Analysis
Several non-linear static analyses of the structure under horizontal forces (Push Over) were carried out through the 3D FE model. The first purpose of these analyses was the estimation of the sensitivity of the global structural behavior to changes of some parameters typical of masonry constitutive laws, especially in terms of stiffness in the elastic field and ductility in the post-elastic field. Then, the performances of the building under horizontal actions were evaluated.
The masonry was modeled as an equivalent continuous and homogenized material (Poisson coefficient 0.3) adopting the ‘total strain’ model [40] with ‘fixed cracking’ for the tension behavior. The ‘fixed crack’ concept considers that the coordinate system along which the constitutive law is kept in a fixed position, defined upon cracking. Thus, the reference system to evaluate the principal stresses is defined by the first crack plane and, after cracking, a reduction of the shear modulus of the material, G, can be considered by means of a shear retention factor, β [41]. The hypothesis of β = 1 corresponds to not consider any reduction of G after cracking and, in general, leads to overestimation of the global strength of the investigated element or structure. By contrast, when the shear retention factor reduces, the strength reduces too, and the influence of the other parameters of the constitutive laws can become less significant due to the higher decay of G. For the examined building, the effect of three values of β was investigated: 1, 0.5, and 0.01.
Regarding the constitutive laws of masonry, the same Young’s modulus were considered in the linear field both for compression and tension behaviors.
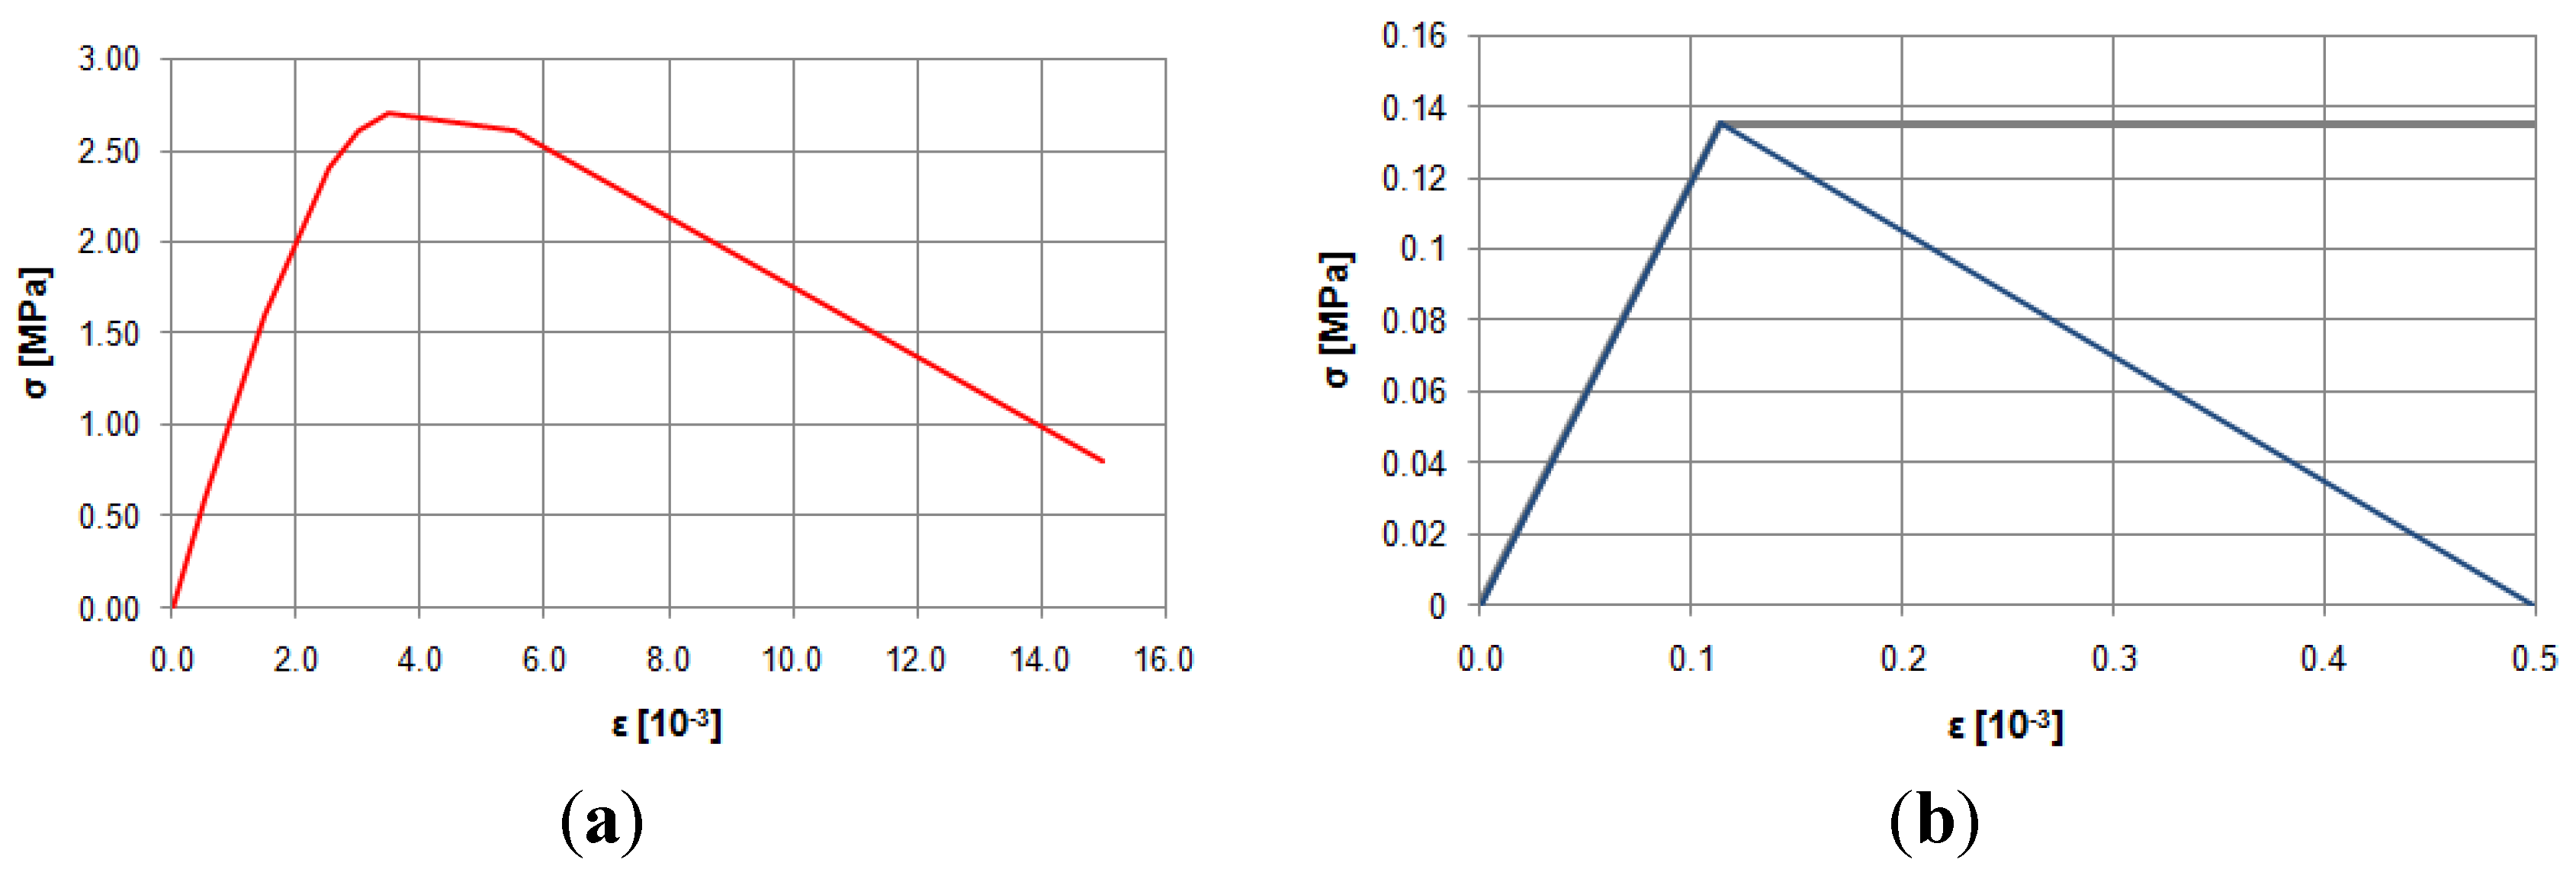
For compression, a linear behavior is assumed until reaching 50% of the strength, and then the stiffness reduces according to a parabolic law up to the strength. The values of the compressive strength, fm, are the ones estimated in Table 1 for the two types of masonry. After the peak, a linear softening is considered until a residual stress of 0.8 MPa (that is 30–35% of fm [33]) and a maximum strain of 15‰ (see Figure 10a).
For tension, a linear behavior was assumed until the values of strength, ftm, listed in Table 1 and corresponding to about the 5–6% of the compressive one, fm, [33] were reached. After the peak, two trends were considered in order to analyze the influence of the post-elastic behavior under tension on the global ductility of the building: A linear softening of the stress until a maximum strain of 0.05% or a plastic behavior characterized by an indefinite strain with constant stress (see Figure 10b). The hypothesis of plastic behavior after the peak can be considered as an equivalent and simplified way to take into account the modeling of the homogenized material with the large slips that usually develop in the post-elastic field between masonry blocks and mortar joints.
The shape of the constitutive law in compression was kept unchanged in all the analyses, because it was expected that for a masonry building under horizontal actions the criticism was represented by the shear performances that were related to the modeling of masonry behavior in tension. In particular, it was expected that the post-peak behavior of the compressive law would not be significantly attained, so that the parametric analyses had been carried out only varying β and the post-elastic behavior under tension.
Furthermore, in order to focus the attention on this topic and remove other causes of variability in the structural behavior, the building was modeled without the underground level and under the assumption of a fixed basement (Model A). Thus, no effect of SSI was directly taken into account. However, in order to consider, even if in a simplified way, the additional deformability of the structure due to the neglected effects (underground level and SSI), the lower values of Young’s modulus, EG = 1450 MPa and E1–2 = 1250 MPa corresponding to Case 2, were used in the push-over analyses. Indeed, using these couple of values for E, the numerical frequencies approximate to the experimental ones (see Table 3). This choice for the Young’s moduli was also determined by means of the consideration that their values influence the slope of the elastic part of the capacity curve of the structure and, thus, they must be assessed in order to replicate as well as possible the behavior of the structure in the linear field.
In Table 4 a synthesis of the main mechanical parameters assumed in the analyses for the two masonry typologies is reported.
| Parameters/Floors | Ground | 1st–2nd |
|---|---|---|
| Young’s Modulus | 1450 | 1250 |
| Compressive strength [MPa] | 2.2 | 2.7 |
| Tensile strength [MPa] | 0.120 | 0.135 |
| Ultimate strain in compression | 0.015 | 0.015 |
| Compressive stress at the ultimate strain [MPa] | 0.80 | 0.80 |
| Ultimate strain in tension—softening | 0.0005 | 0.0005 |
| Ultimate strain in tension—plastic | indefinite | Indefinite |
3.5.2. Assessment of the Capacity Curve
The non-linear behavior of the structure can be synthesized by the relationship (capacity curve) between the base shear, that is the resultant of the horizontal applied forces, and the displacement of a control point of the building. The non-linear static analysis was carried out for the examined building for several reasons: (a) to estimate the displacement capacity of the building under seismic actions, (b) to assess the behavior structure factor q [27,30,36] for verifications based on linear-elastic analysis, (c) to check the sensitivity of the building response to some parameters characteristic of the masonry modeling (shear retention factor, β, constitutive law in tension). Because the first two modal shapes of the buildings are the main ones (mass participating ratio of about 75%) and are completely translational in Y and X directions with no torsional effects (see Section 3.2), the horizontal forces were applied according to a distribution proportional to the two first vibration modes of the building, separately in directions ±X and ±Y (‘main distribution’ as defined in the current Italian code [27]). The displacement of the centroid of the last floor of the building (about 15 m from the ground level) was assumed as control point for the displacement [27,36]. Note that both the assumption on the force distribution and on the control point may not reproduce correctly the actual dynamic behavior of the building; for example, an adaptive pushover procedure should furnish more reliable results [42]. The only force distributions proportional to the first two vibration modes were considered and no secondary distribution of forces, i.e., an uniform pattern of loads as suggested in both national and European codes [27,30,36], since the attention was mainly focused on having a global view of the building’s behavior.
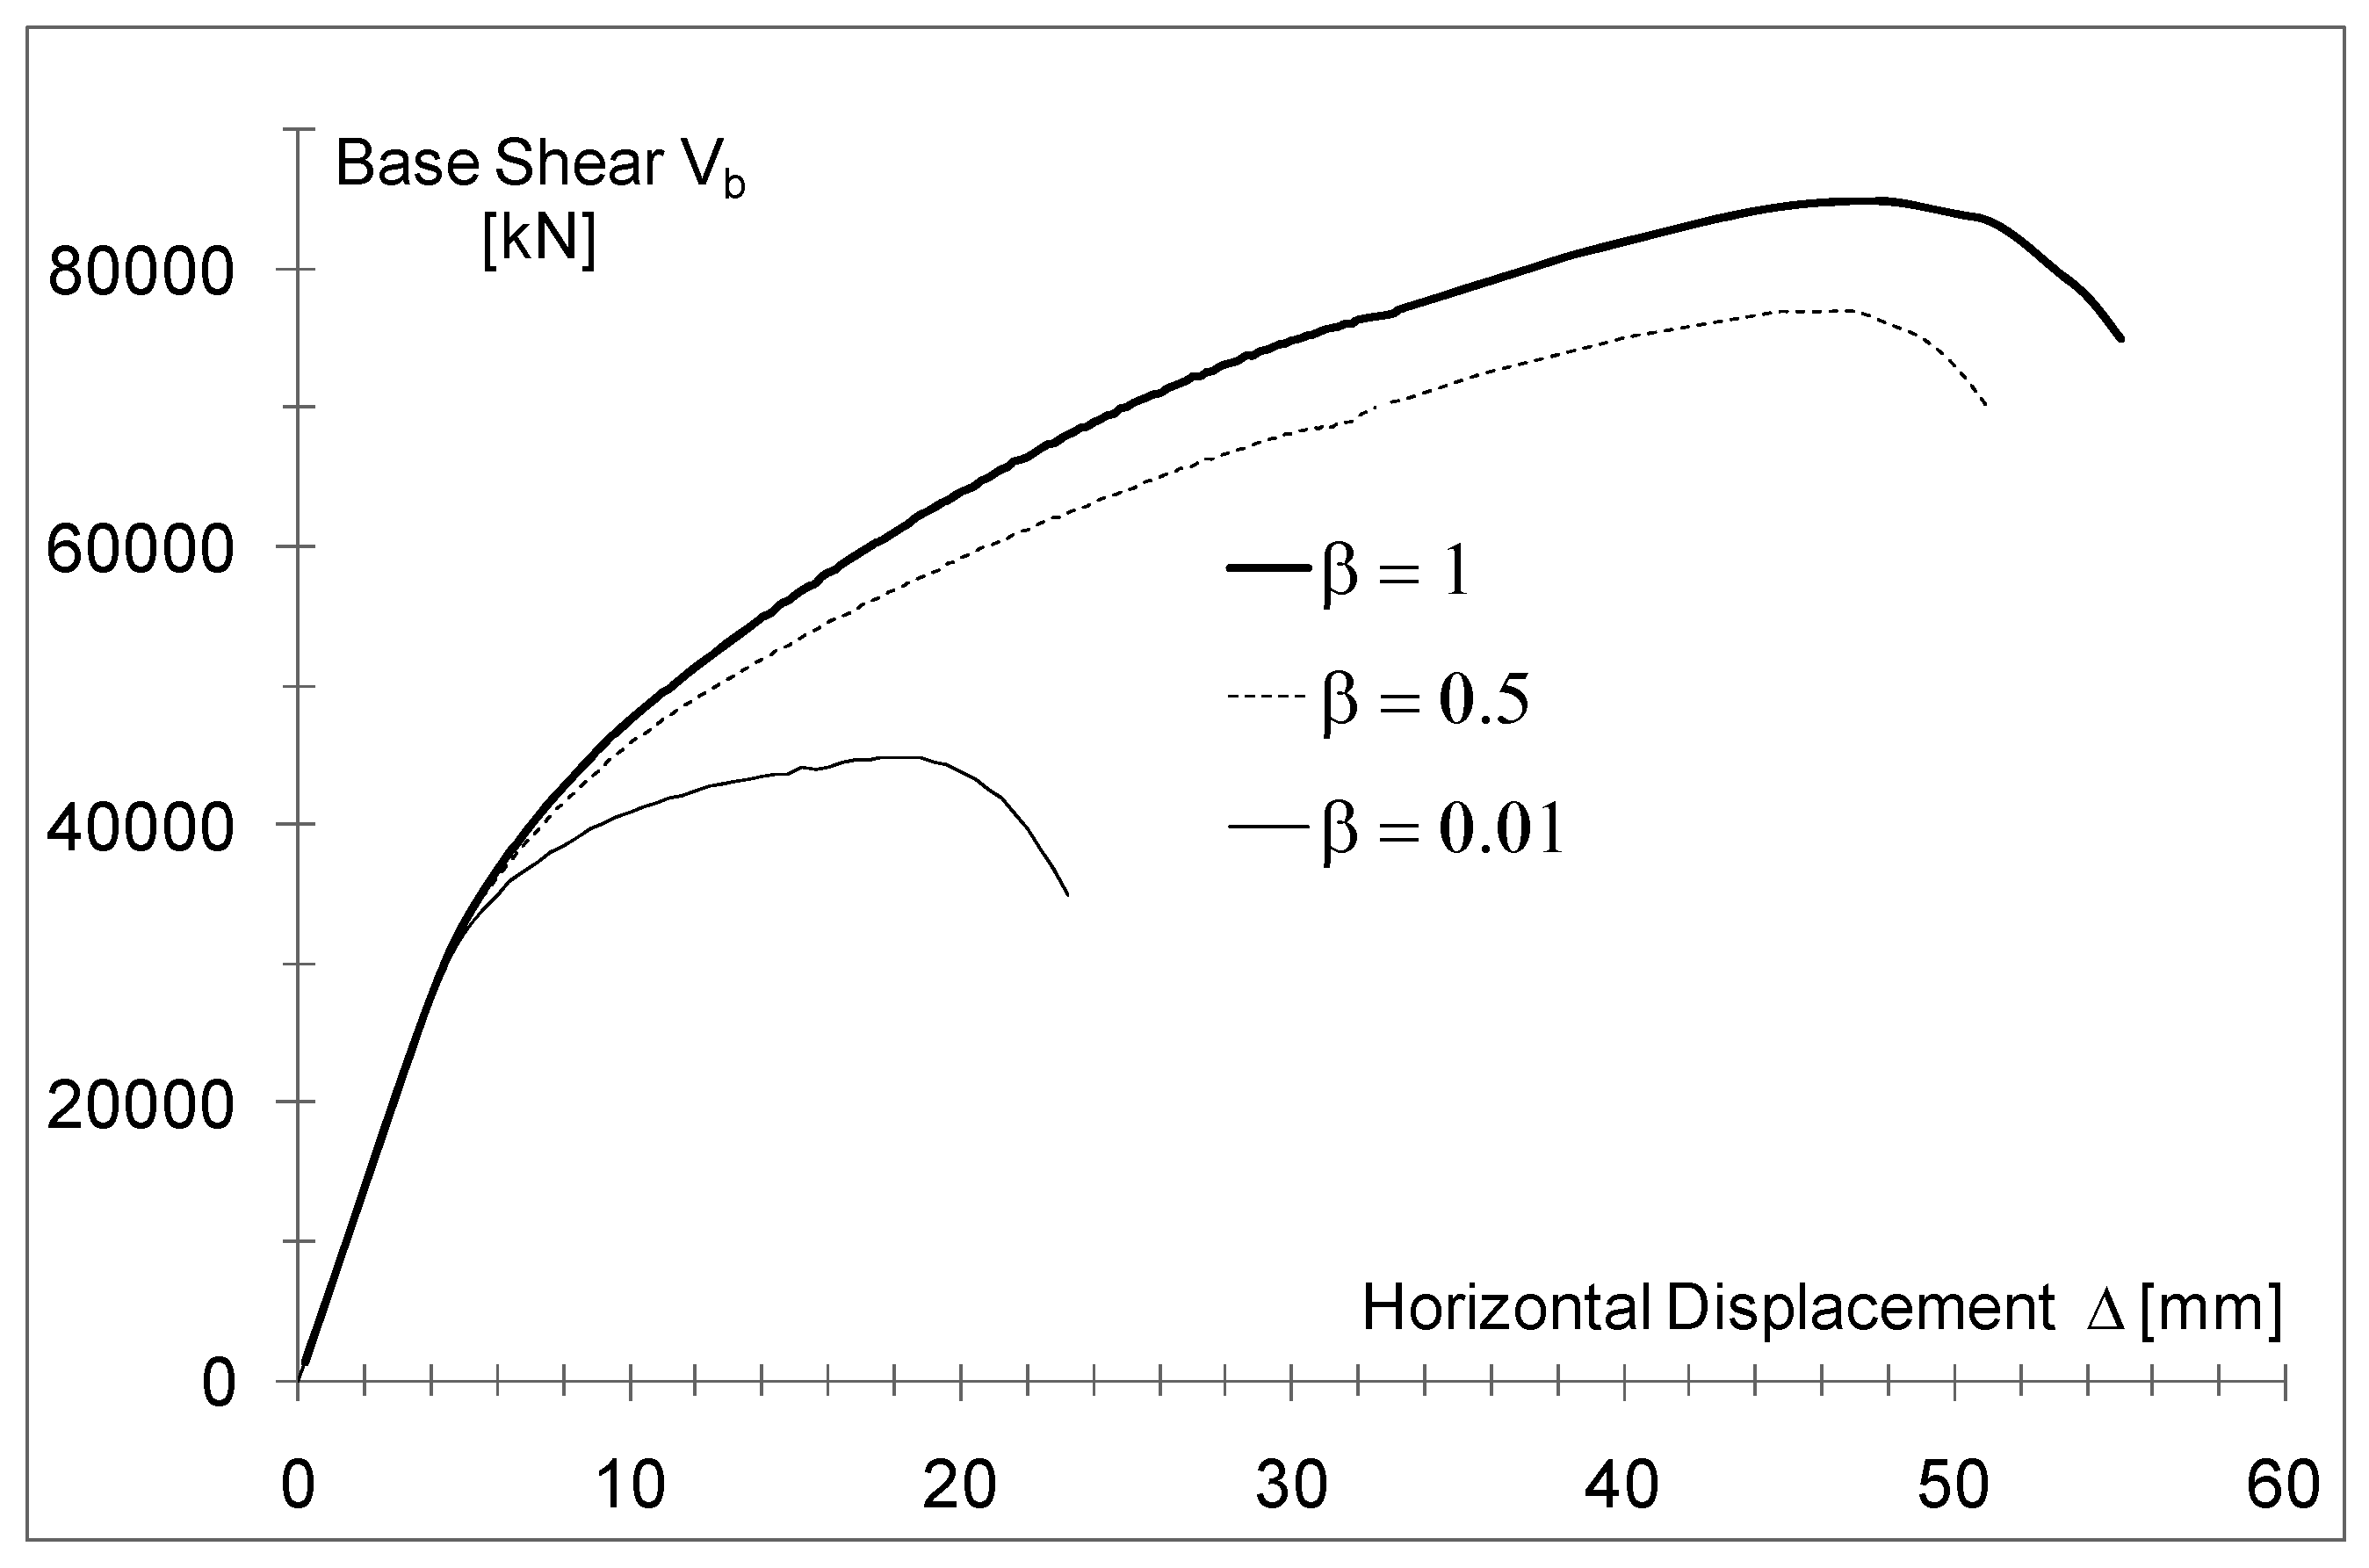
In Figure 11 the capacity curves for the direction +X under the assumption of plastic behavior under tension are graphed for three values of β: 1, 0.5, and 0.01. The analyses were stopped after the base shear had attained a reduction of about 20% of the maximum value [30]. As expected, the lower β is, the lower are both the maximum horizontal load and the maximum displacement. Considering the uncertainness of the effective behavior of masonry, the lowest values for β can be reasonably assumed in order to have the safest predictions of the overall behavior of the building.
In Figure 12 the capacity curves in direction +X and +Y are directly compared under the hypothesis of softening or plastic behavior under tension (see Figure 10b) and assuming β = 0.01. The softening behavior does not influence the stiffness of the building in the elastic phase, but the beginning and the extension of the plastic field. Clearly, under the hypothesis of plastic behavior, the ultimate displacements increase significantly with values that are 1.6–1.7 times larger for both directions. Moreover, the strength is higher too. Because of the asymmetry of the building, the behavior in direction X and Y is not the same, but a larger deformability in the elastic phases is evidenced for direction Y, which is the shorter side and is characterized by a lower number of resistant walls as well (see Figure 2b).
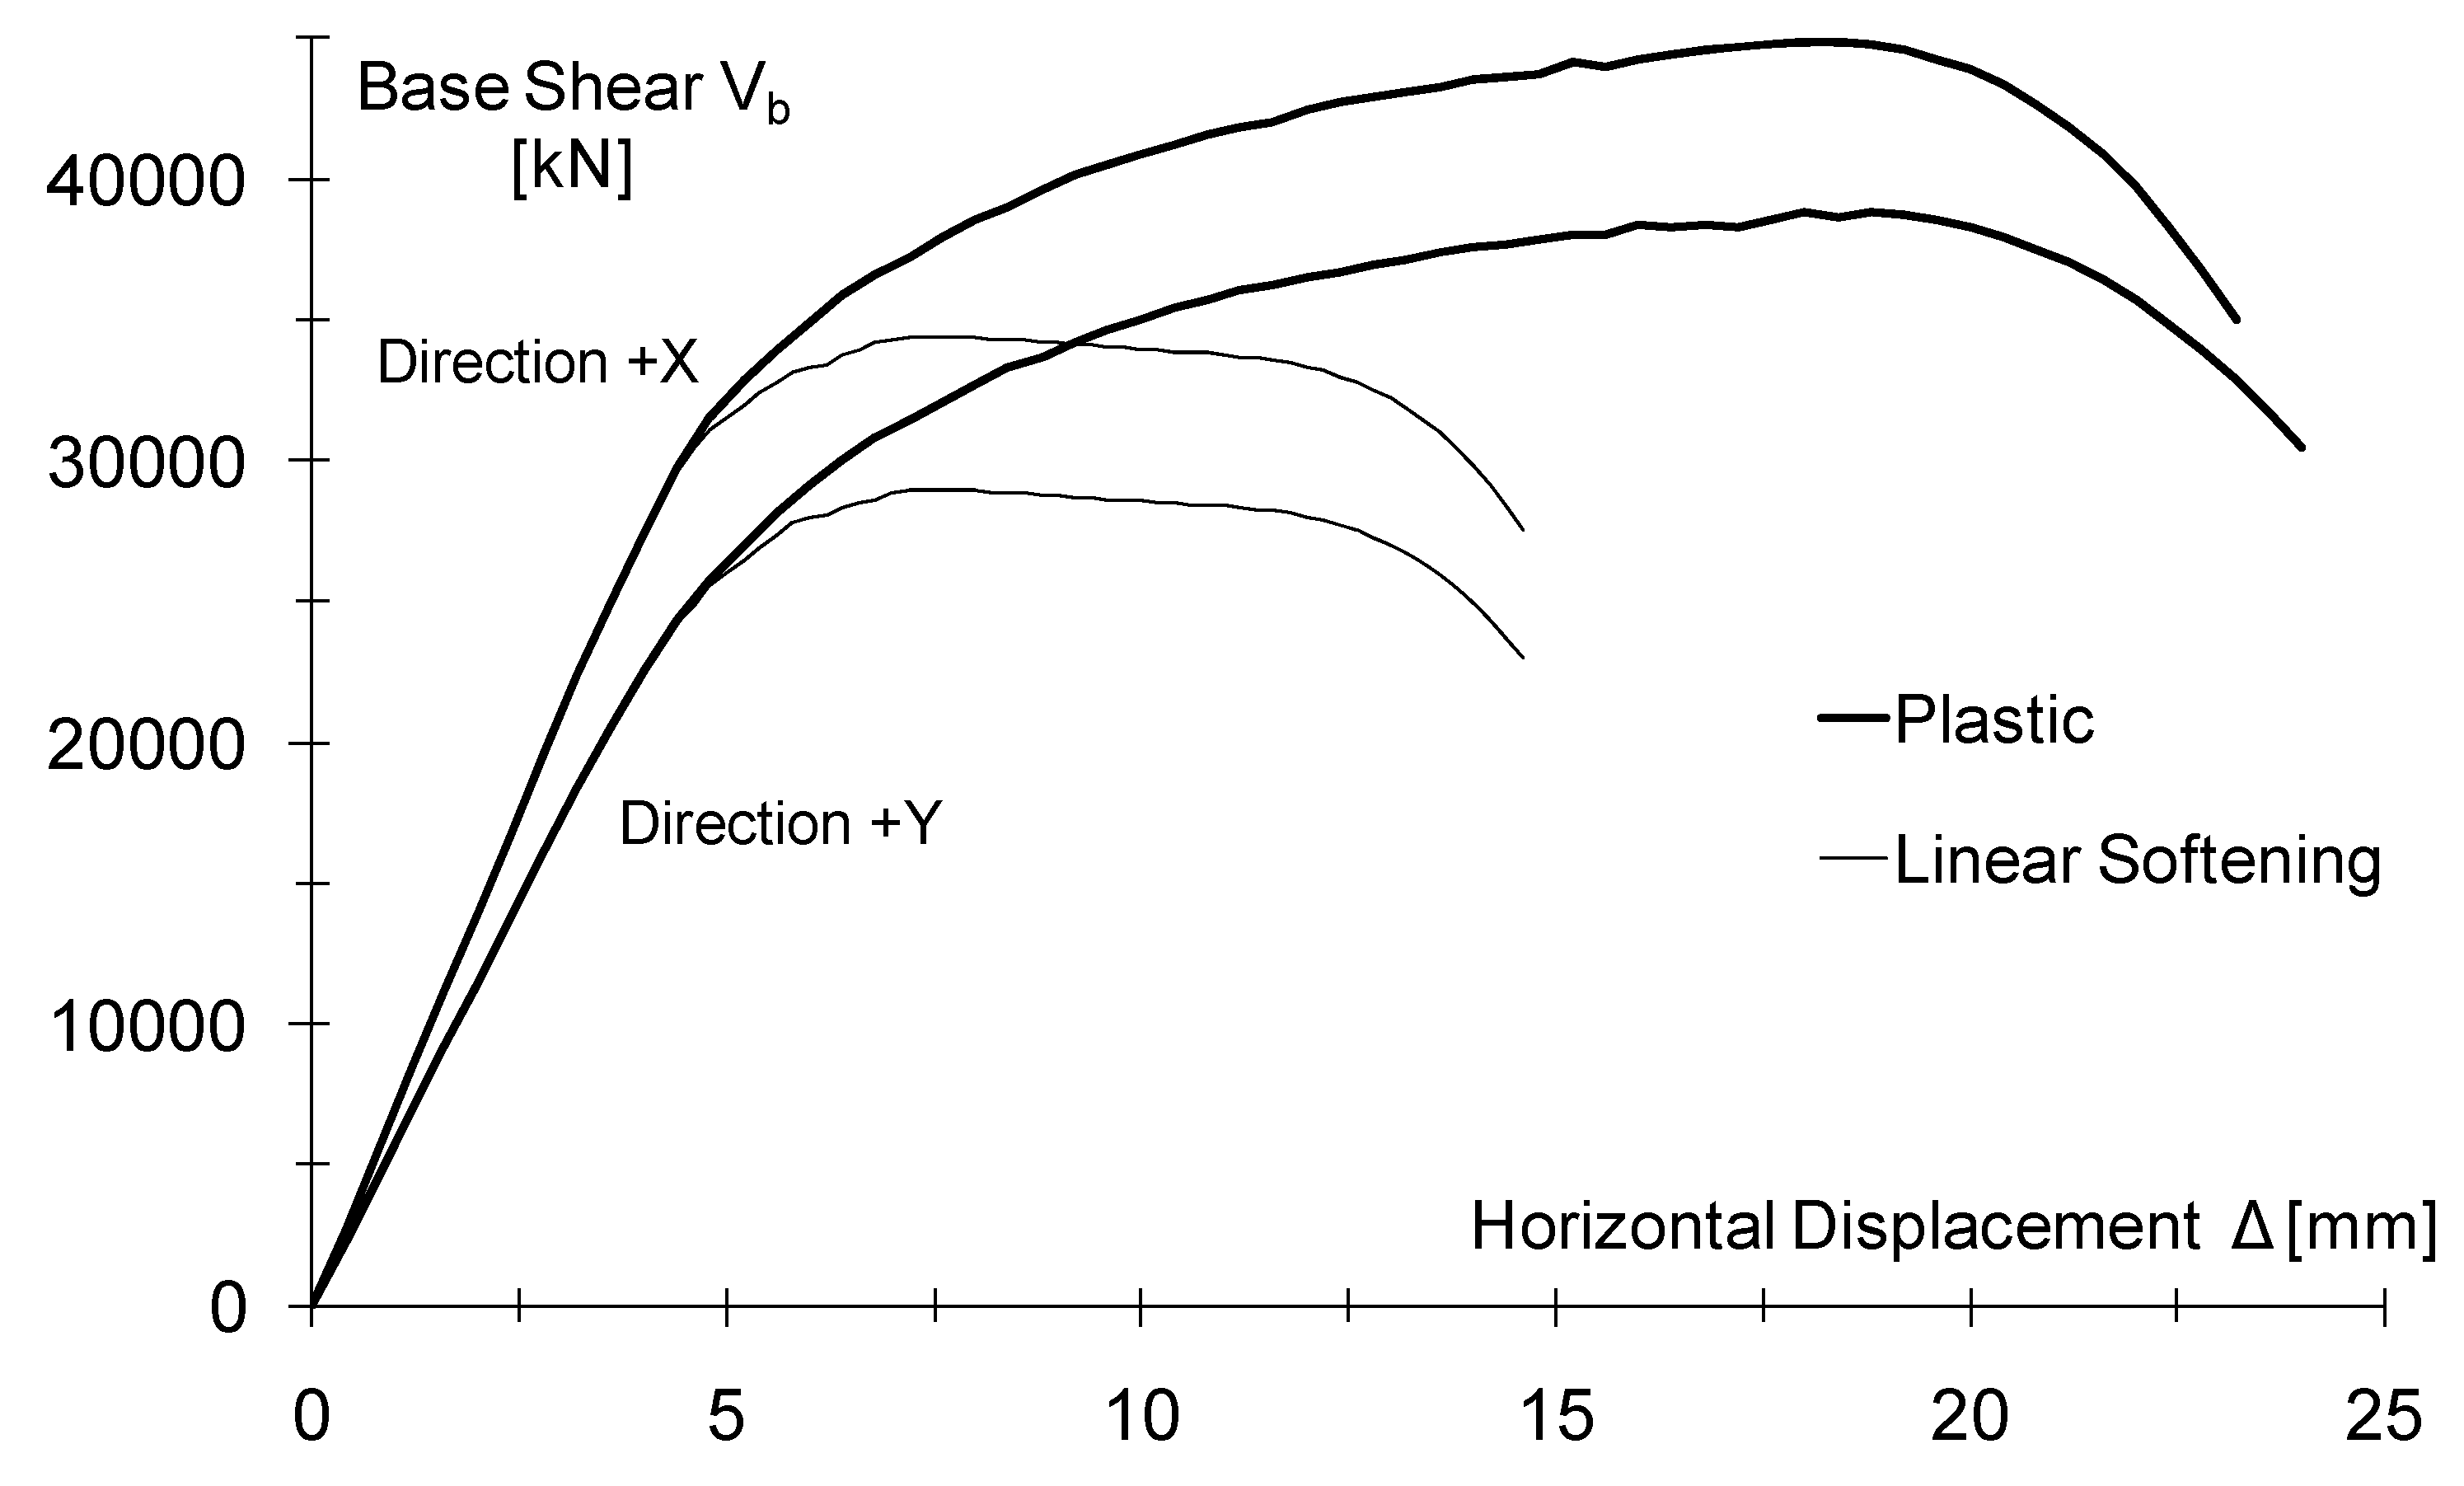
In conclusion, the analyses evidences that the behavior of the whole structure is strongly influenced by the shear stiffness reduction, β, and by the softening branch of the tensile behavior. It is clear that a correct choice of β and of the post-peak behavior under tension significantly influences the safety verifications, with the displacement capacity being very different.
The exam of the strain distribution shows that, under the assumption of linear softening after the tensile strength, most of the panels are able to reach the assigned ultimate tensile strain (0.05%). Moreover, most of the compressed panels are in the elastic field because the strains are lower than 0.4%, while only in few cases the strains are proximal to the ultimate one (1.5%). These results confirm that the crisis of the structure is due to the tension behavior. By contrast, for the case of plastic behavior under tension, in most panels the tensile strains overcome the value of 0.15% that is three times larger than the maximum value (0.05%) assumed in the case of softening. This allows the entire structure to have larger displacements and to reach a slightly higher strain also under compression; nevertheless, most of the compressed panels remain in the elastic field with the strains being lower than 0.4%.
3.5.3. Assessment of q-Factor
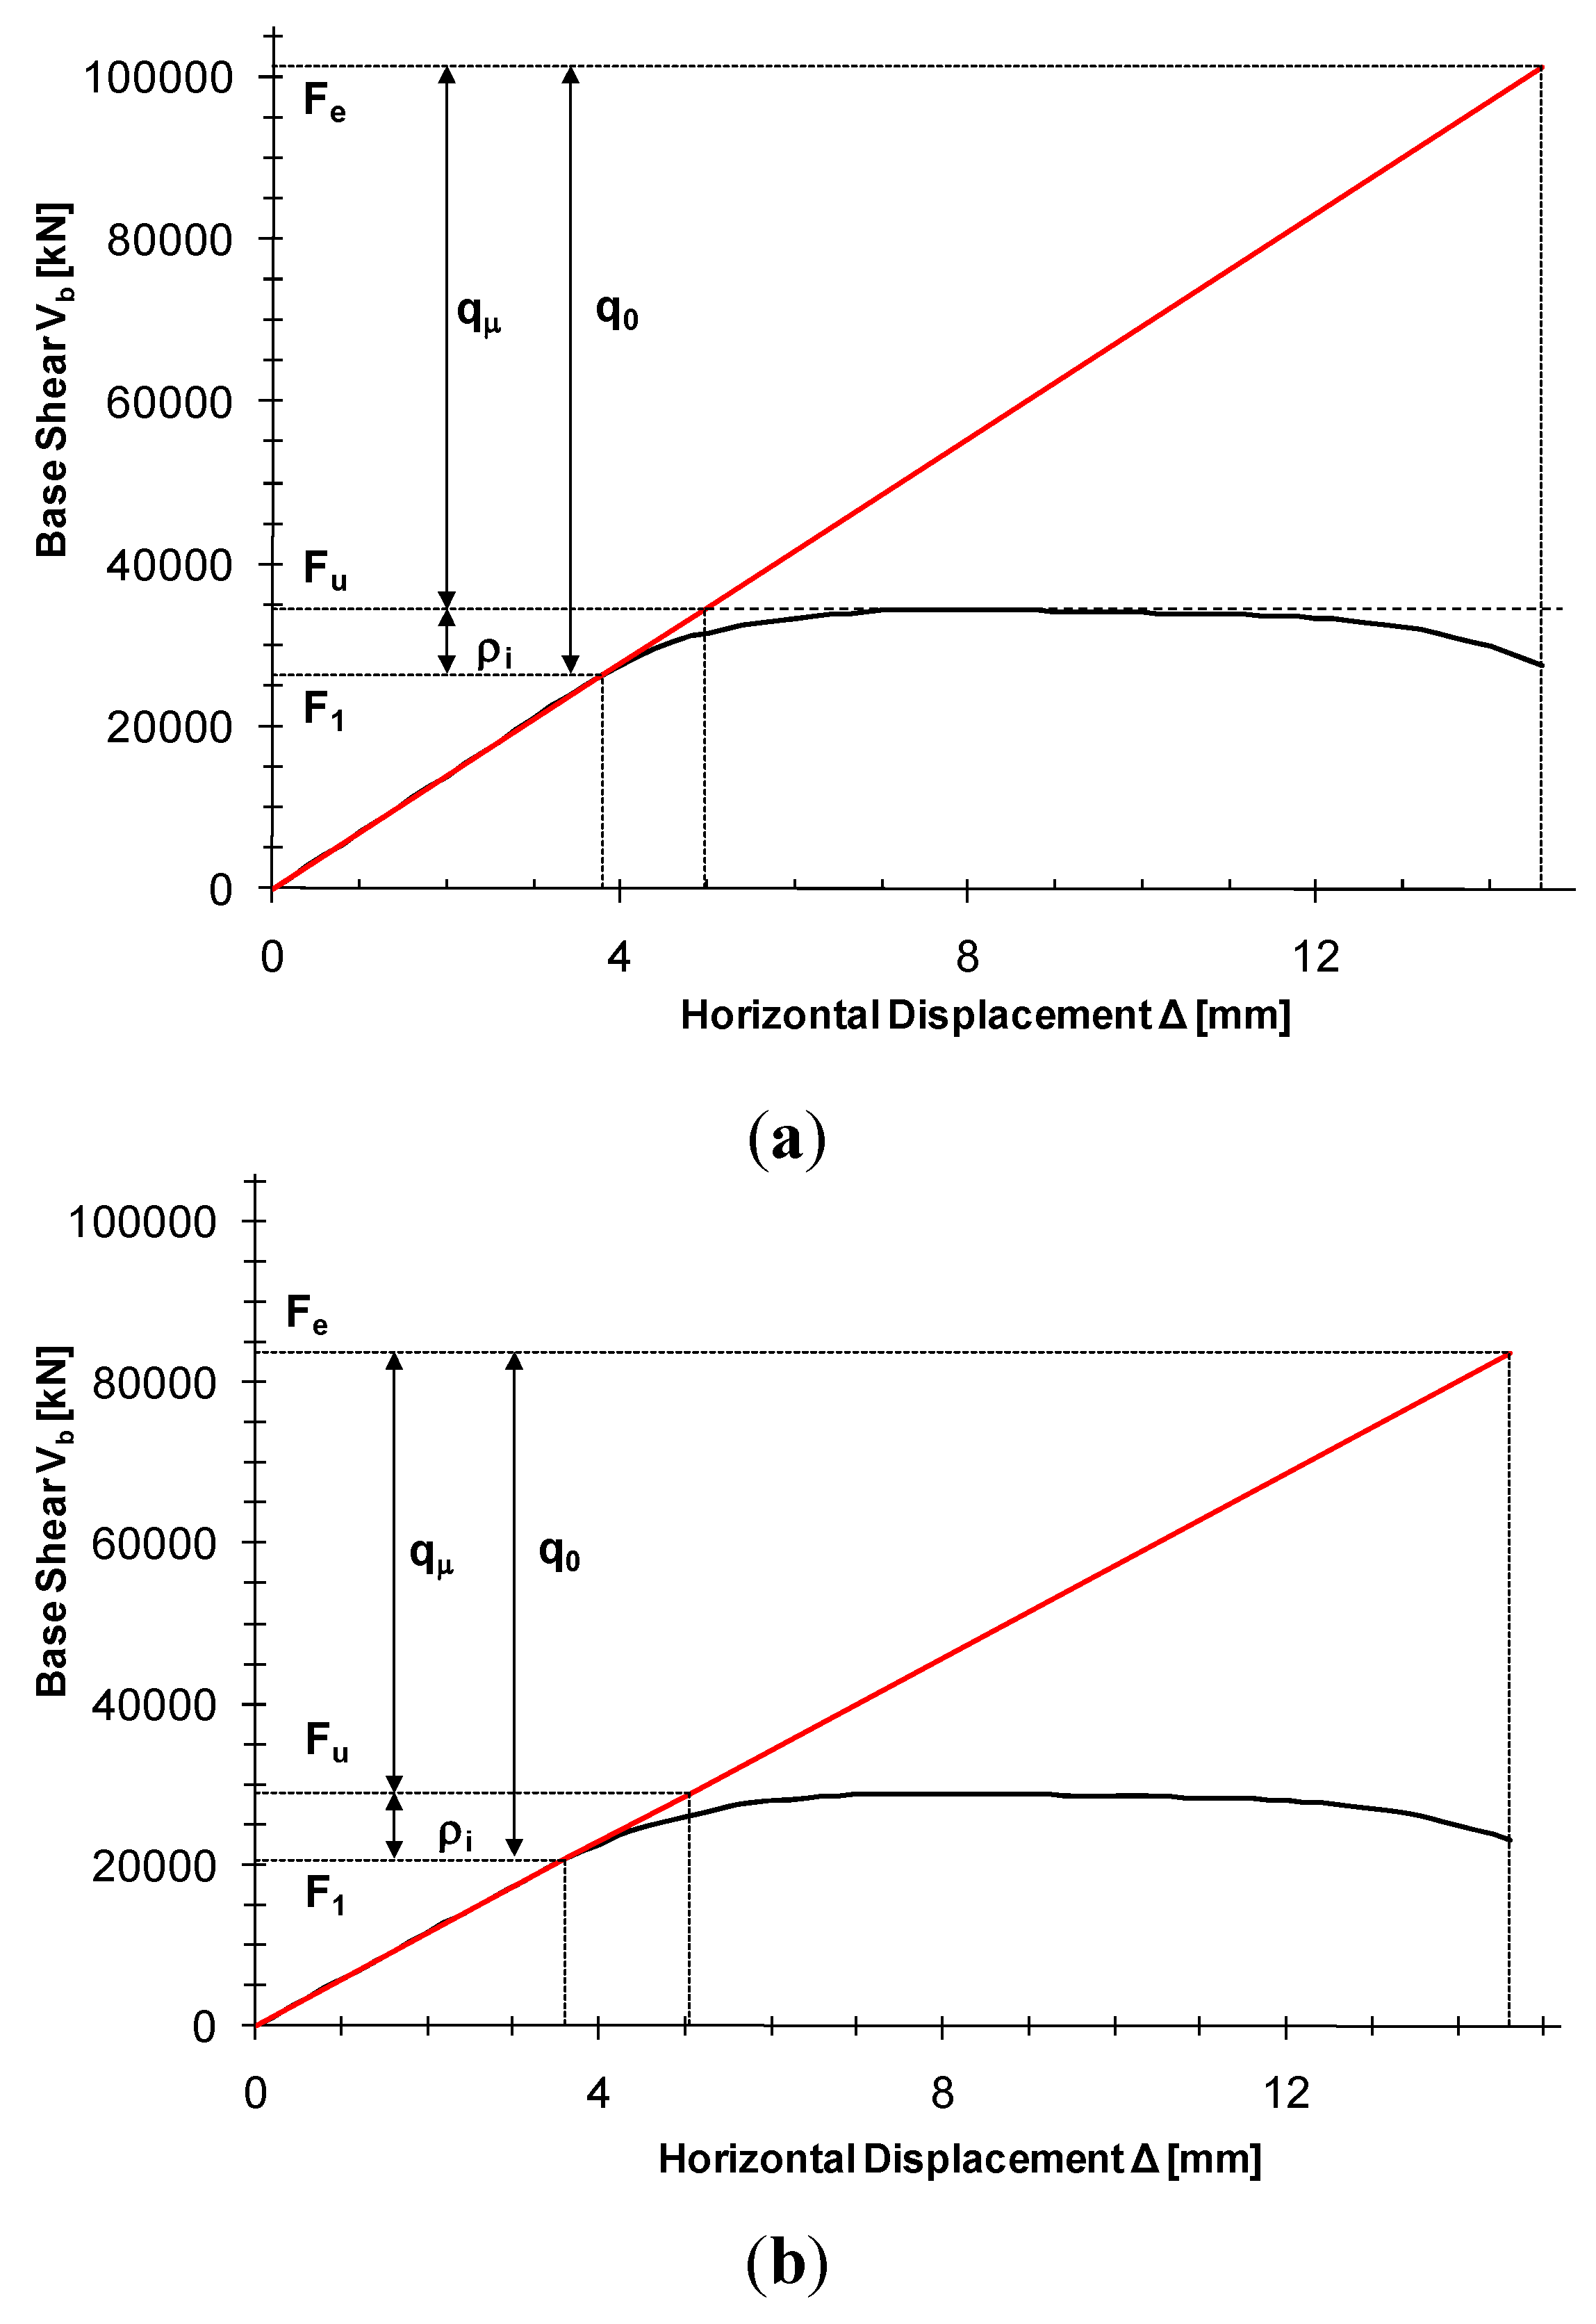
On the basis of the numerical capacity curves it was possible to estimate the behavior q-factor [27,36] of the building according to the graphic procedures illustrated in Figure 13a,b for the direction +X and + Y, under the hypothesis of linear softening under tension and β = 0.01. In particular the q-factor, q0 is defined as:

where ρi is the ratio of the maximum load given by the capacity curve, Fu, to the limit elastic one, F1, and qμ is the ratio of the theoretical elastic load corresponding to the failure condition, Fe, to Fu. The values of qμ, ρi, and q0 calculated according to the graphical procedure of Figure 13 are 2.94, 1.31 and 3.84, respectively, for the direction X and 2.89, 1.40 and 4.06 for the direction Y.
The European code [36] gives a value of q0 ranging between 1.5 and 2.5.
The Italian code [27] gives a value of q0 = 2.0 αu/α1 for ordinary masonry constructions. Assuming αu/α1 = 1.8 for masonry buildings with two or more stories, as the examined one, the q-factor is q0 = 3.6.
The values of q0 calculated from the numerical curves (q0x = 3.84 and q0y = 4.06) are, thus, meanly 10–15% greater than the ones given by the Italian code, while they are significantly larger than the ones furnished by the European code [36]. Lower values of q0 mean lower reduction of the seismic action in the case of linear analyses and, thus, are safer. Thus, in view of these results, the assumption of a linear softening under tension seems to be more consistent compared to the hypothesis of plastic behavior that leads to estimating a very large ductility of the structure and, thus, an even greater q-factor.
3.5.4. Safety Verification of the Building According to Code Indications
The capacity displacement curves reported in Figure 12 represent a characteristic of the structure and can be used to assimilate the behavior of a complex system characterized by Multi Degrees Of Freedom (MDOF system) to that of an equivalent non-linear Single Degree Of Freedom oscillator (SDOF system). Hence in the pushover procedure, after the first step leading to the definition of the capacity curve, the ultimate displacement available for the structure (MDOF system) has to be compared with a target design displacement, calculated according to national or European code indications [27,36].
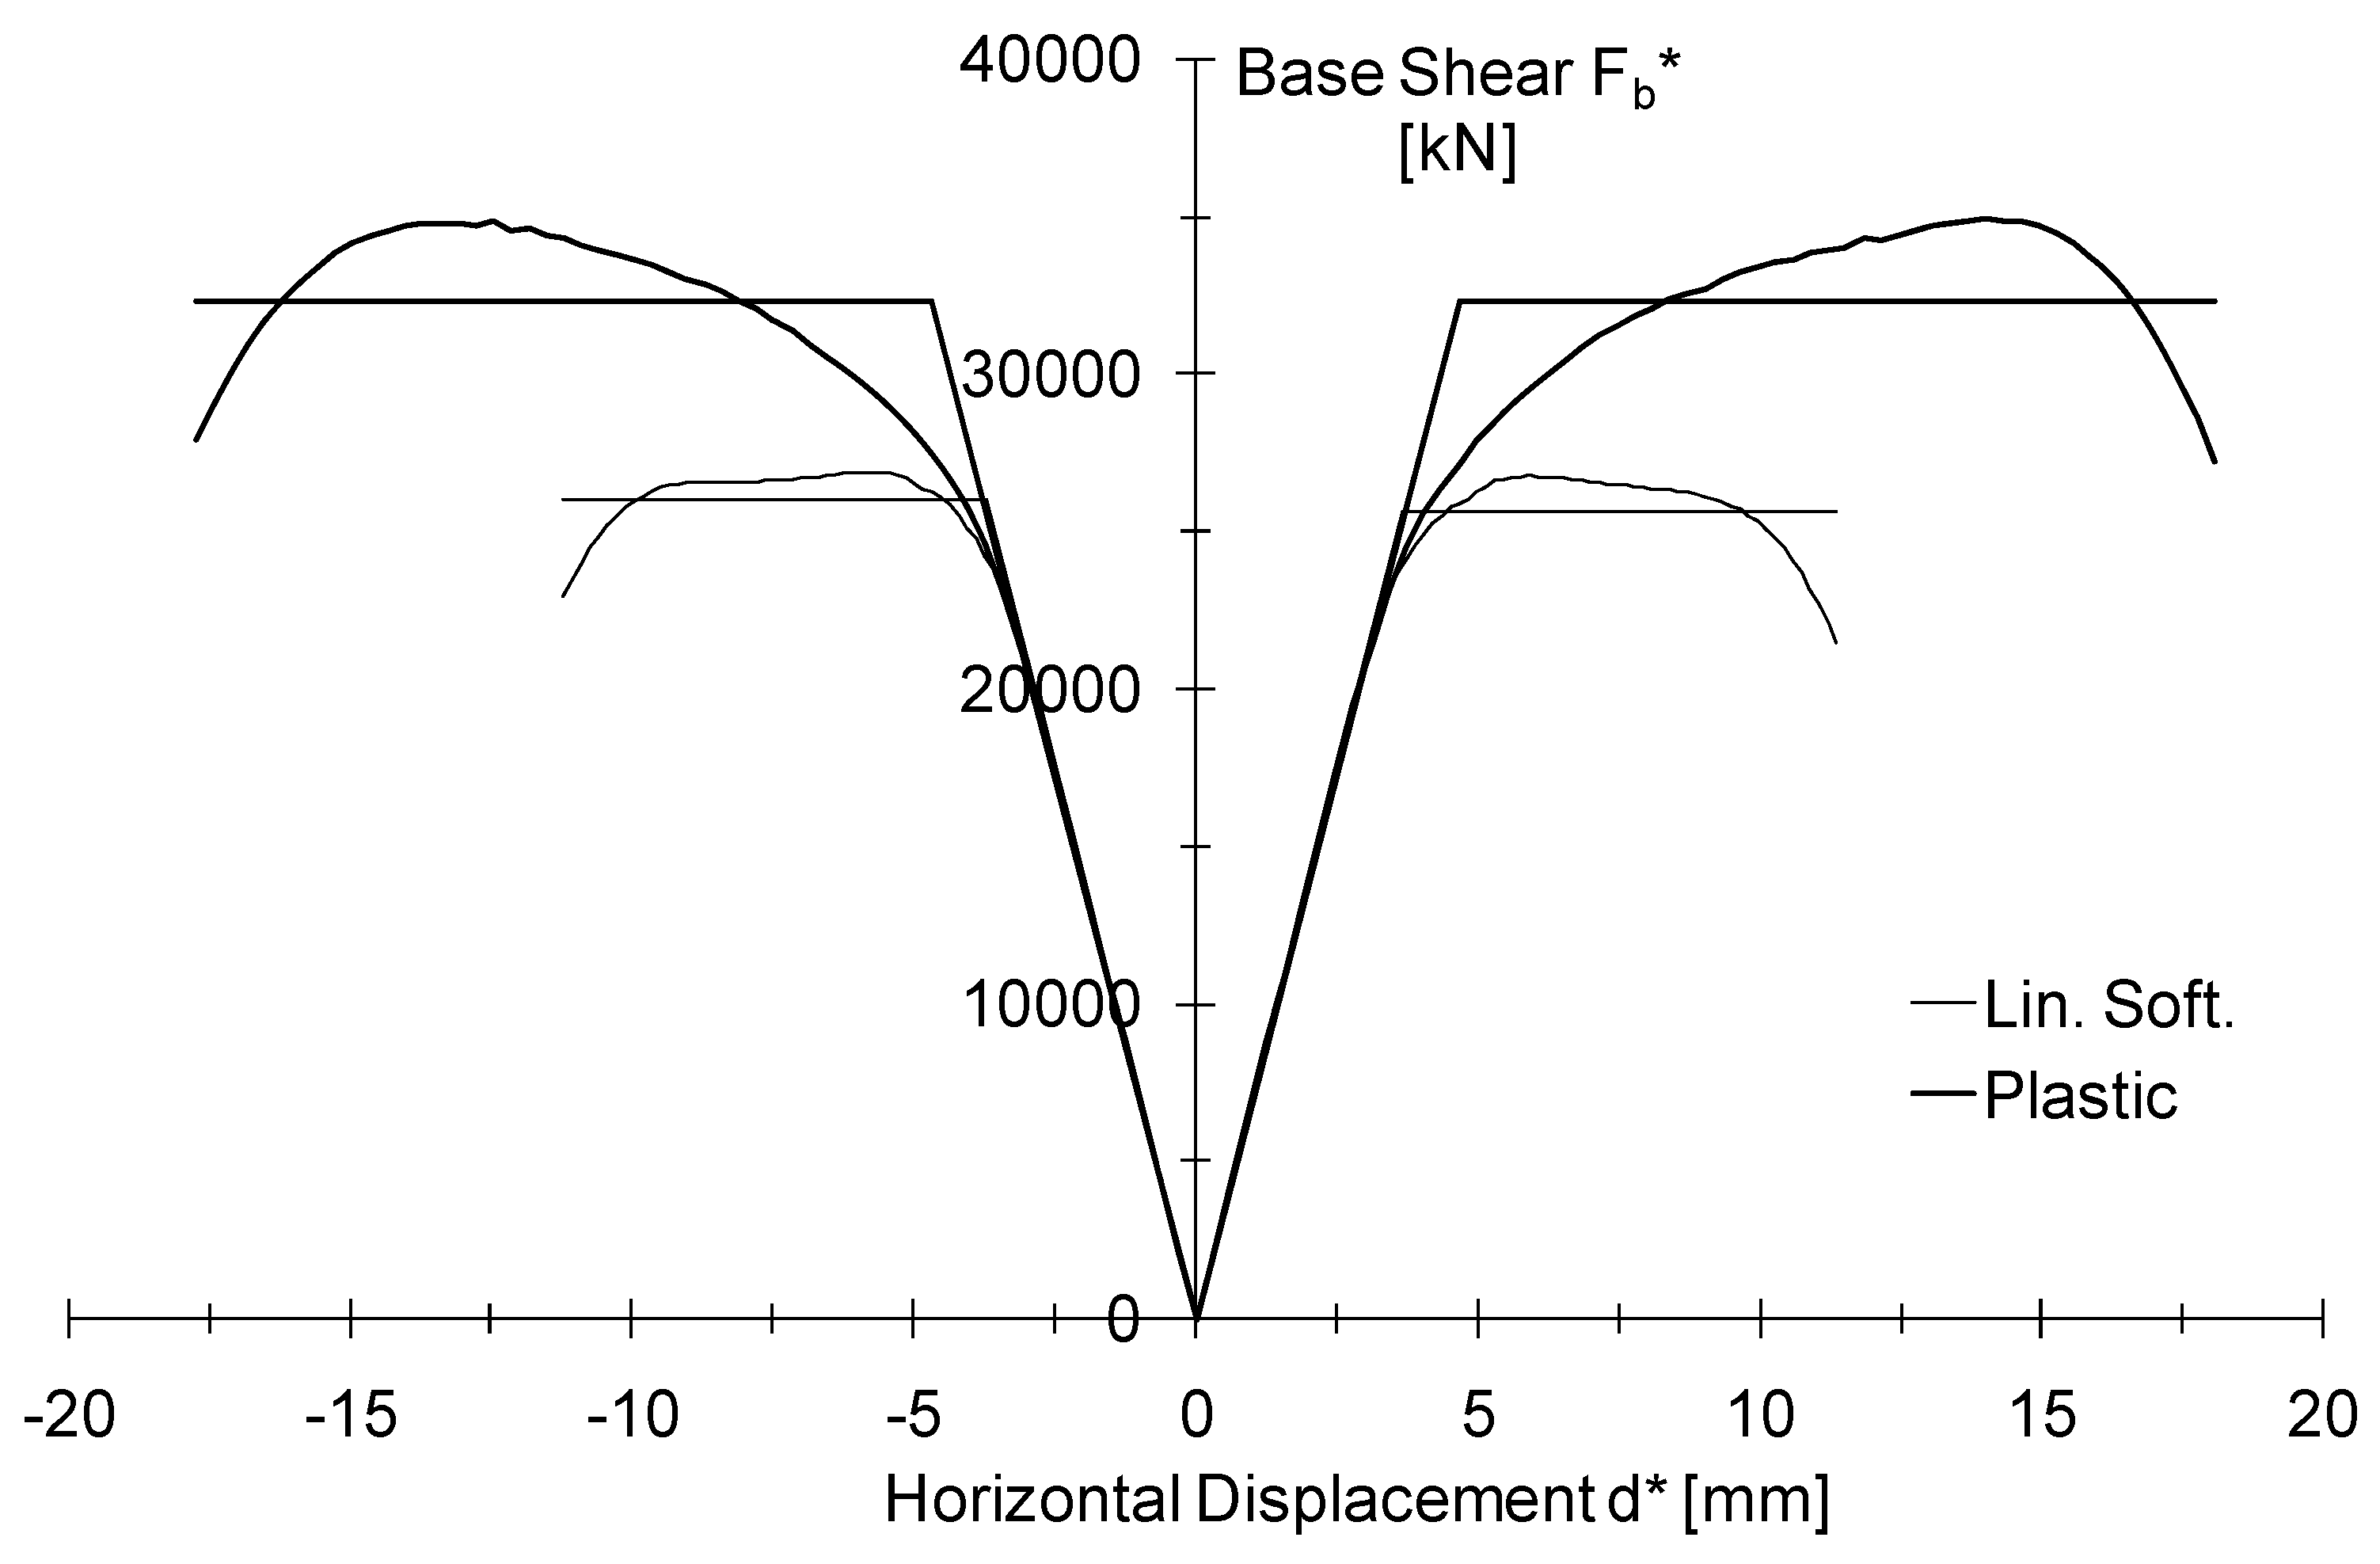
The second step consists in defining the capacity displacement curve of the equivalent SDOF system that is usually assumed to have a bilinear shape. The equivalence is established by the principle that the area above the bilinear curve of the SDOF system is equal to the area above the true capacity curve of the structure. To this aim, firstly, the capacity curve of the MDOF structure has to be normalized by defining the force F* and the displacement d* as follows:
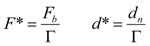
where Fb and dn are the base shear force and the control node displacement of the structure in its capacity curve and Г is a transformation factor associated to the first modal shape. For the examined building the factor Г is 1.29 and the 1st modal shape is the main one for both directions.
In Figure 14 for the direction ±X (note that the building shows a lower displacement capacity in direction ±X than in direction ±Y) the capacity displacement curves of the structure normalized to Г and the bilinear ones of the equivalent SDOF systems are reported for both cases of linear softening and plastic behavior after the tensile strength. The minimum values of the maximum displacement d* in direction ±X are equal to 11.20 mm and 17.74 mm under the assumption of linear softening or plastic behavior, respectively. This means that the maximum peak ground acceleration that the building can sustain is 0.74 g in the case of linear softening or 0.91 g in the case of plastic behavior under tension.
Considering that, according to the seismic risk map of Italy [43], the expected peak ground acceleration, ag, for the site is ag,475 = 0.262g assuming a return period of 475 years (probability of exceedance of 10% in 50 years) or ag,975 = 0.325g assuming a return period of 975 years (probability of exceedance of 5% in 50 years), the building has a minimum safety factor of 2.8 and 2.3 for these two values of acceleration, respectively.
These values of peak ground acceleration can be modified according to an importance factor γI that in this case can be assumed to be equal to 1.0 considering the building in Class II (the classes are significant to the destination importance of the building and are numbered from I to IV); indeed the building has no importance for public safety in view of the consequences associated with a collapse, and its integrity is not of vital importance for civil protection during earthquakes [27,36].
4. Conclusions
The structural analysis of historical masonry buildings is particularly complex since each construction is a stand-alone system usually designed and erected for being a singular case. In this paper the procedure for assessing the seismic risk of a historical masonry building is applied to a case study that is of a very common typology of masonry building in Italy and, moreover, is located in an area with high seismicity. The main aim of the procedure is to identify the key parameters in the implementation of a FE numerical model aimed at allowing to carry out allowable analyses in the linear dynamic and non-linear static field.
The greatest difficulties in facing the study of the building were the definition of the mechanical properties of masonry, especially the strength and the elastic modulus. Furthermore, if the effect of the soil-structure interaction is accounted for, the type of modeling and the mechanical characterization of the soil are necessary. An important contribution to calibrating the FE linear model was given by the results of the dynamic in situ tests used as target of the numerical analysis in terms of fundamental frequencies. By means of the FE model, indeed, the influence of the uncertainties of masonry Young’s modulus and soil deformability, which is simply taken into account by means of vertical linear elastic springs, on the dynamic behavior of the structure was studied; the following concluding remarks are highlighted:
- The influence of the deformability of the masonry and soil was found to be comparable, however, as it is well-known, the real uncertainty in evaluating soil deformability (i.e., the coefficient of sub-grade reaction, k) is much higher than the one of the masonry;
- Concerting the properties of masonry, the non-linear static analysis demonstrated the major importance of the modeling of the constitutive relationship under tension, since the ductility of the entire building was directly related to the ductility developed by the masonry under tension;
- Regarding the behavior factor suggested by Italian and European codes, the numerical analysis provided higher values especially when the constitutive relationship of masonry under tension was assumed to be elastic-plastic, thus the assumption of a linear softening under tension seemed to be more adequate to obtain a safer prediction.
In conclusion, the present work enhanced the key parameters regulating the structural behavior of a historical masonry building under seismic actions (i.e., the structural models) and the utility of the in situ dynamic tests.
Further studies are necessary to define the most suitable model to account for both the soil-structure interaction and the behavior of masonry under tension.
References and Notes
- ICOMOS Charter. Principles for the Analysis, Conservation and Structural Restoration of Architectural Heritage; International Council on Monument and Sites (ICOMOS). In Proceedings of the 14th ICOMOS General Assembly, Victoria Falls, Zimbabwe; 2003.
- Linee Guida per la valutazione e riduzione del rischio sismico del patrimonio culturale allineate alle nuove Norme Tecniche per le costruzioni (D.M. 14 gennaio 2008); G.U.R.I.; 2008; Volume 24, 1 29. (in Italian)
- Binda, L.; Saisi, A.; Tiraboschi, C. Investigation procedures for the diagnosis of historic masonries. Constr. Build. Mater. 2000, 14, 199–233. [Google Scholar] [CrossRef]
- McCann, D.M.; Forde, M.C. Review of NDT methods in the assessment of concrete and masonry structures. NDT E Int. 2001, 34, 71–84. [Google Scholar] [CrossRef]
- Clark, M.R.; McCann, D.M.; Forde, M.C. Application of infrared thermography to the non-destructive testing of concrete and masonry bridges. NDT E Int. 2003, 36, 265–275. [Google Scholar] [CrossRef]
- Carpinteri, A.; Invernizzi, S.; Lacidogna, G. In situ damage assessment and non linear modelling of historical masonry towers. Eng. Struct. 2005, 27, 387–395. [Google Scholar] [CrossRef]
- Binda, L.; Zanzi, L.; Lualdi, M.; Condoleo, P. The use of georadar to assess damage to a masonry Bell Tower in Cremona, Italy. NDT E Int. 2005, 38, 171–179. [Google Scholar] [CrossRef]
- Carpinteri, A.; Invernizzi, S.; Lacidogna, G. Historical brick-masonry subjected to double flat-jack test: Acoustic emissions and scale effects on cracking density. Constr. Build. Mater. 2009, 23, 2813–2820. [Google Scholar] [CrossRef]
- De Sortis, A.; Antonacci, E.; Vestroni, F. Dynamic identification of a masonry building using forced vibration test. Eng. Struct. 2005, 27, 155–165. [Google Scholar] [CrossRef]
- Bennati, S.; Nardini, L.; Salvatore, W. Dynamical behaviour of a masonry medieval tower subjected to bell’s action. Part I: Bell’s action measurement and modelling. J. Struct. Eng. ASCE 2005, 131, 1647–1655. [Google Scholar] [CrossRef]
- Gentile, C. Operational Modal Analysis and Assessment of Historical Structures. In Proceedings of the 1st International Operational Modal Analysis Conference, Copenhagen, Denmark, 26–27 April 2005.
- Gentile, C.; Saisi, A. Ambient vibration testing of historic masonry towers for structural identification and damage assessment. Constr. Build. Mater. 2007, 21, 1311–1321. [Google Scholar] [CrossRef]
- Ivorra, S.; Pallarés, F.J. A Masonry Bell-Tower Assessment by Modal Testing. In Proceedings of the 2nd International Operational Modal Analysis Conference (IOMAC), Copenhagen, Denmark, 30 April–2 May 2007.
- Ceroni, F.; Pecce, M.; Voto, S.; Manfredi, G. Historical, architectural and structural assessment of the Bell Tower of Santa Maria del Carmine. Int. J. Archit. Herit. 2009, 3, 169–194. [Google Scholar] [CrossRef]
- Rainieri, C.; Fabbrocino, G. Operational modal analysis for the characterization of heritage structures. Geofizika 2011, 28, 109–126. [Google Scholar]
- Tomazevic, M. The Computer Program POR; Report ZRMK, Ljubljana, Slovenian, 1978; (in Slovenian).
- Tomazevic, M. Dynamic modelling of masonry buildings: Storey mechanism model as a simple alternative. Earthq. Eng. Struct. Dyn. 1987, 15, 731–749. [Google Scholar] [CrossRef]
- Magenes, G.; Della Fontana, A. Simplified non-linear seismic analysis of masonry buildings. Proc. Br. Mason. Soc. 1998, 8, 190–195. [Google Scholar]
- Lourenço, P.B. Anisotropic softening model for masonry plates and shells. J. Struct. Eng. 2000, 126, 1008–1016. [Google Scholar] [CrossRef]
- Massart, T.J.; Peerlings, R.H.J.; Geers, M.G.D. Mesoscopicmodelling of failure and damage induced anisotropy in brick masonry. Eur. J. Mech. Solids 2004, 23, 719–735. [Google Scholar] [CrossRef]
- Calderini, C.; Lagomarsino, S. A continuum model for in-plane anisotropic inelastic behaviour of masonry. J. Struct. Eng. 2008, 134, 209–220. [Google Scholar] [CrossRef]
- Chen, S.-Y.; Moon, F.L.; Yi, T. A macroelement for the nonlinear analysis of in-plane unreinforced masonry piers. Eng. Struct. 2008, 30, 2242–2252. [Google Scholar] [CrossRef]
- Ceroni, F.; Pecce, M.; Manfredi, G. Modelling and seismic assessment of the bell Tower of Santa Maria del carmine: Problems and solutions. J. Earthq. Eng. 2010, 14, 30–56. [Google Scholar]
- De Luca, A.; Giordano, A.; Mele, E. A simplified procedure for assessing the seismic capacity of masonry arches. Eng. Struct. 2004, 26, 1915–1929. [Google Scholar] [CrossRef]
- Lagomarsino, S.; Galasco, A.; Penna, A. Non Linear Macro-element Dynamic Analysis of Masonry Buildings. In Proceedings of the ECCOMAS Thematic Conference on Computational Methods in Structural Dynamics and Earthquake Engineering, Rethymno, Crete, Greece, 13–16 June 2007.
- Aerial view of historical centre of Benevento, Italy form satellite. Available online: http://maps.google.it/maps (accessed on 15 January 2012).
- NTC 2008. Norme Tecniche per le Costruzioni, Decreto Ministeriale del 14/01/2008. In G.U.R.I.; 2008 2 4; Volume 29. (in Italian).
- OCPM 3431. Primi elementi in materia di criteri generali per la classificazione sismica del territorio nazionale e di normative tecniche per le costruzioni in zona sismica. Ordinanza del Presidente del Consiglio dei Ministri del 03/05/2005. In G.U.R.I.; 10 05 2005; 107. (in Italian).
- Circolare 617. Istruzioni per l’applicazione delle “Nuove norme tecniche per le costruzioni di cui al D.M. 14 gennaio 2008. Ministero dei Lavori Pubblici, Roma, 02/02/2009 (in Italian).
- Eurocode 8. Design of Structures for Earthquake Resistance—Part 3: Assessment and Retrofitting of Buildings; Committee for Standardization: Brussels, Belgium, 2005; EN 1998-1..
- Marcari, G.; Fabbrocino, G.; Lourenço, P. Mechanical Properties of Tuff and Calcarenite Stone Masonry Panels under Compression. In Proceedings of the 8th International Masonry Conference, Dresden, Germany, 4–7 July 2010.
- Binda, L.; Pina-Henriques, J.; Anzani, A.; Fontana, A.; Lourenço, P.B. A contribution for the understanding of load-transfer mechanisms in multi-leaf masonry walls: Testing and modelling. Eng. Struct. 2006, 28, 1132–1148. [Google Scholar] [CrossRef]
- Augenti, N.; Parisi, F. Constitutive models for tuff masonry under uniaxial compression. J. Mater. Civ. Eng. 2010, 22, 1102–1111. [Google Scholar] [CrossRef]
- Improta, L.; di Giulio, G.; Iannaccone, G. Variations of local seismic response inBenevento (Southern Italy) using earthquakes and ambient noise recordings. J. Seismol. 2005, 9, 191–210. [Google Scholar] [CrossRef]
- DIANA Finite Elements Analysis. In User’s Manual—Release 9.4—Element Library, Material Library; TNO Building and Construction Research, Department of Computational Mechanics: A.A. Delft, Netherlands, 2009.
- Eurocode 8. Design of Structures for Earthquake Resistance—Part 1: General Rules, Seismic Actions and Rules for Buildings; Committee for Standardization: Brussels, Belgium, 2005; EN 1998-1..
- Terzaghi, K.; Peck, R.B. Soil Mechanics in Engineering Practice; Wiley: New York, NY, USA, 1948. [Google Scholar]
- Ceroni, F.; Sica, S.; Pecce, M.; Garofano, A. Effect of Soil-Structure Interaction on the dynamic behavior of masonry and RC buildings. In Proceedings of the 15th World Conference on Earthquake Engineering (WCEE), Lisbon, Portugal, 24-28 September, 2012.
- Eurocode 2. Design of Concrete Structures—Part 1-1: General Rules and Rules for Buildings; SPRING Singapore: Singapore, 2004; ENV 1992-1-1: 2004: E..
- Selby, R.G.; Vecchio, F.J. Three-dimensional Constitutive Relations for Reinforced Concrete. In Technical Report 93-02; Department Civil Engineer, University of Toronto: Toronto, Canada, 1993. [Google Scholar]
- Crisfield, M.A. Non-Linear Finite Element Analysis of Solids and Structures; John Wiley & Sons: Hoboken, NJ, USA, 1991; Volume 1. [Google Scholar]
- Galasco, A.; Lagomarsino, S.; Penna, A. On the Use of Pushover Analysis for Existing Masonry Buildings. In Proceedings of the 1st European Conference on Earthquake Engineering and Seismology, Geneva, Switzerland, 3–8 September 2006.
- Stime di pericolosità sismica per diverse probabilità di superamento in 50 anni: Valori di ag. Available online: http://esse1.mi.ingv.it/d2.html (accessed on 15 January 2012, in Italian).
© 2012 by the authors; licensee MDPI, Basel, Switzerland. This article is an open-access article distributed under the terms and conditions of the Creative Commons Attribution license (http://creativecommons.org/licenses/by/3.0/).
Share and Cite
Ceroni, F.; Pecce, M.; Sica, S.; Garofano, A. Assessment of Seismic Vulnerability of a Historical Masonry Building. Buildings 2012, 2, 332-358. https://doi.org/10.3390/buildings2030332
Ceroni F, Pecce M, Sica S, Garofano A. Assessment of Seismic Vulnerability of a Historical Masonry Building. Buildings. 2012; 2(3):332-358. https://doi.org/10.3390/buildings2030332
Chicago/Turabian StyleCeroni, Francesca, Marisa Pecce, Stefania Sica, and Angelo Garofano. 2012. "Assessment of Seismic Vulnerability of a Historical Masonry Building" Buildings 2, no. 3: 332-358. https://doi.org/10.3390/buildings2030332