

How Can Conflicts with Supervisors or Coworkers Affect Construction Workers’ Safety Performance on Site? Two Cross-Sectional Studies in North America

Abstract
:1. Introduction
2. Literature Review
3. Materials and Methods
3.1. Survey Instrument
3.2. Data Collection and Participants
3.3. Measures
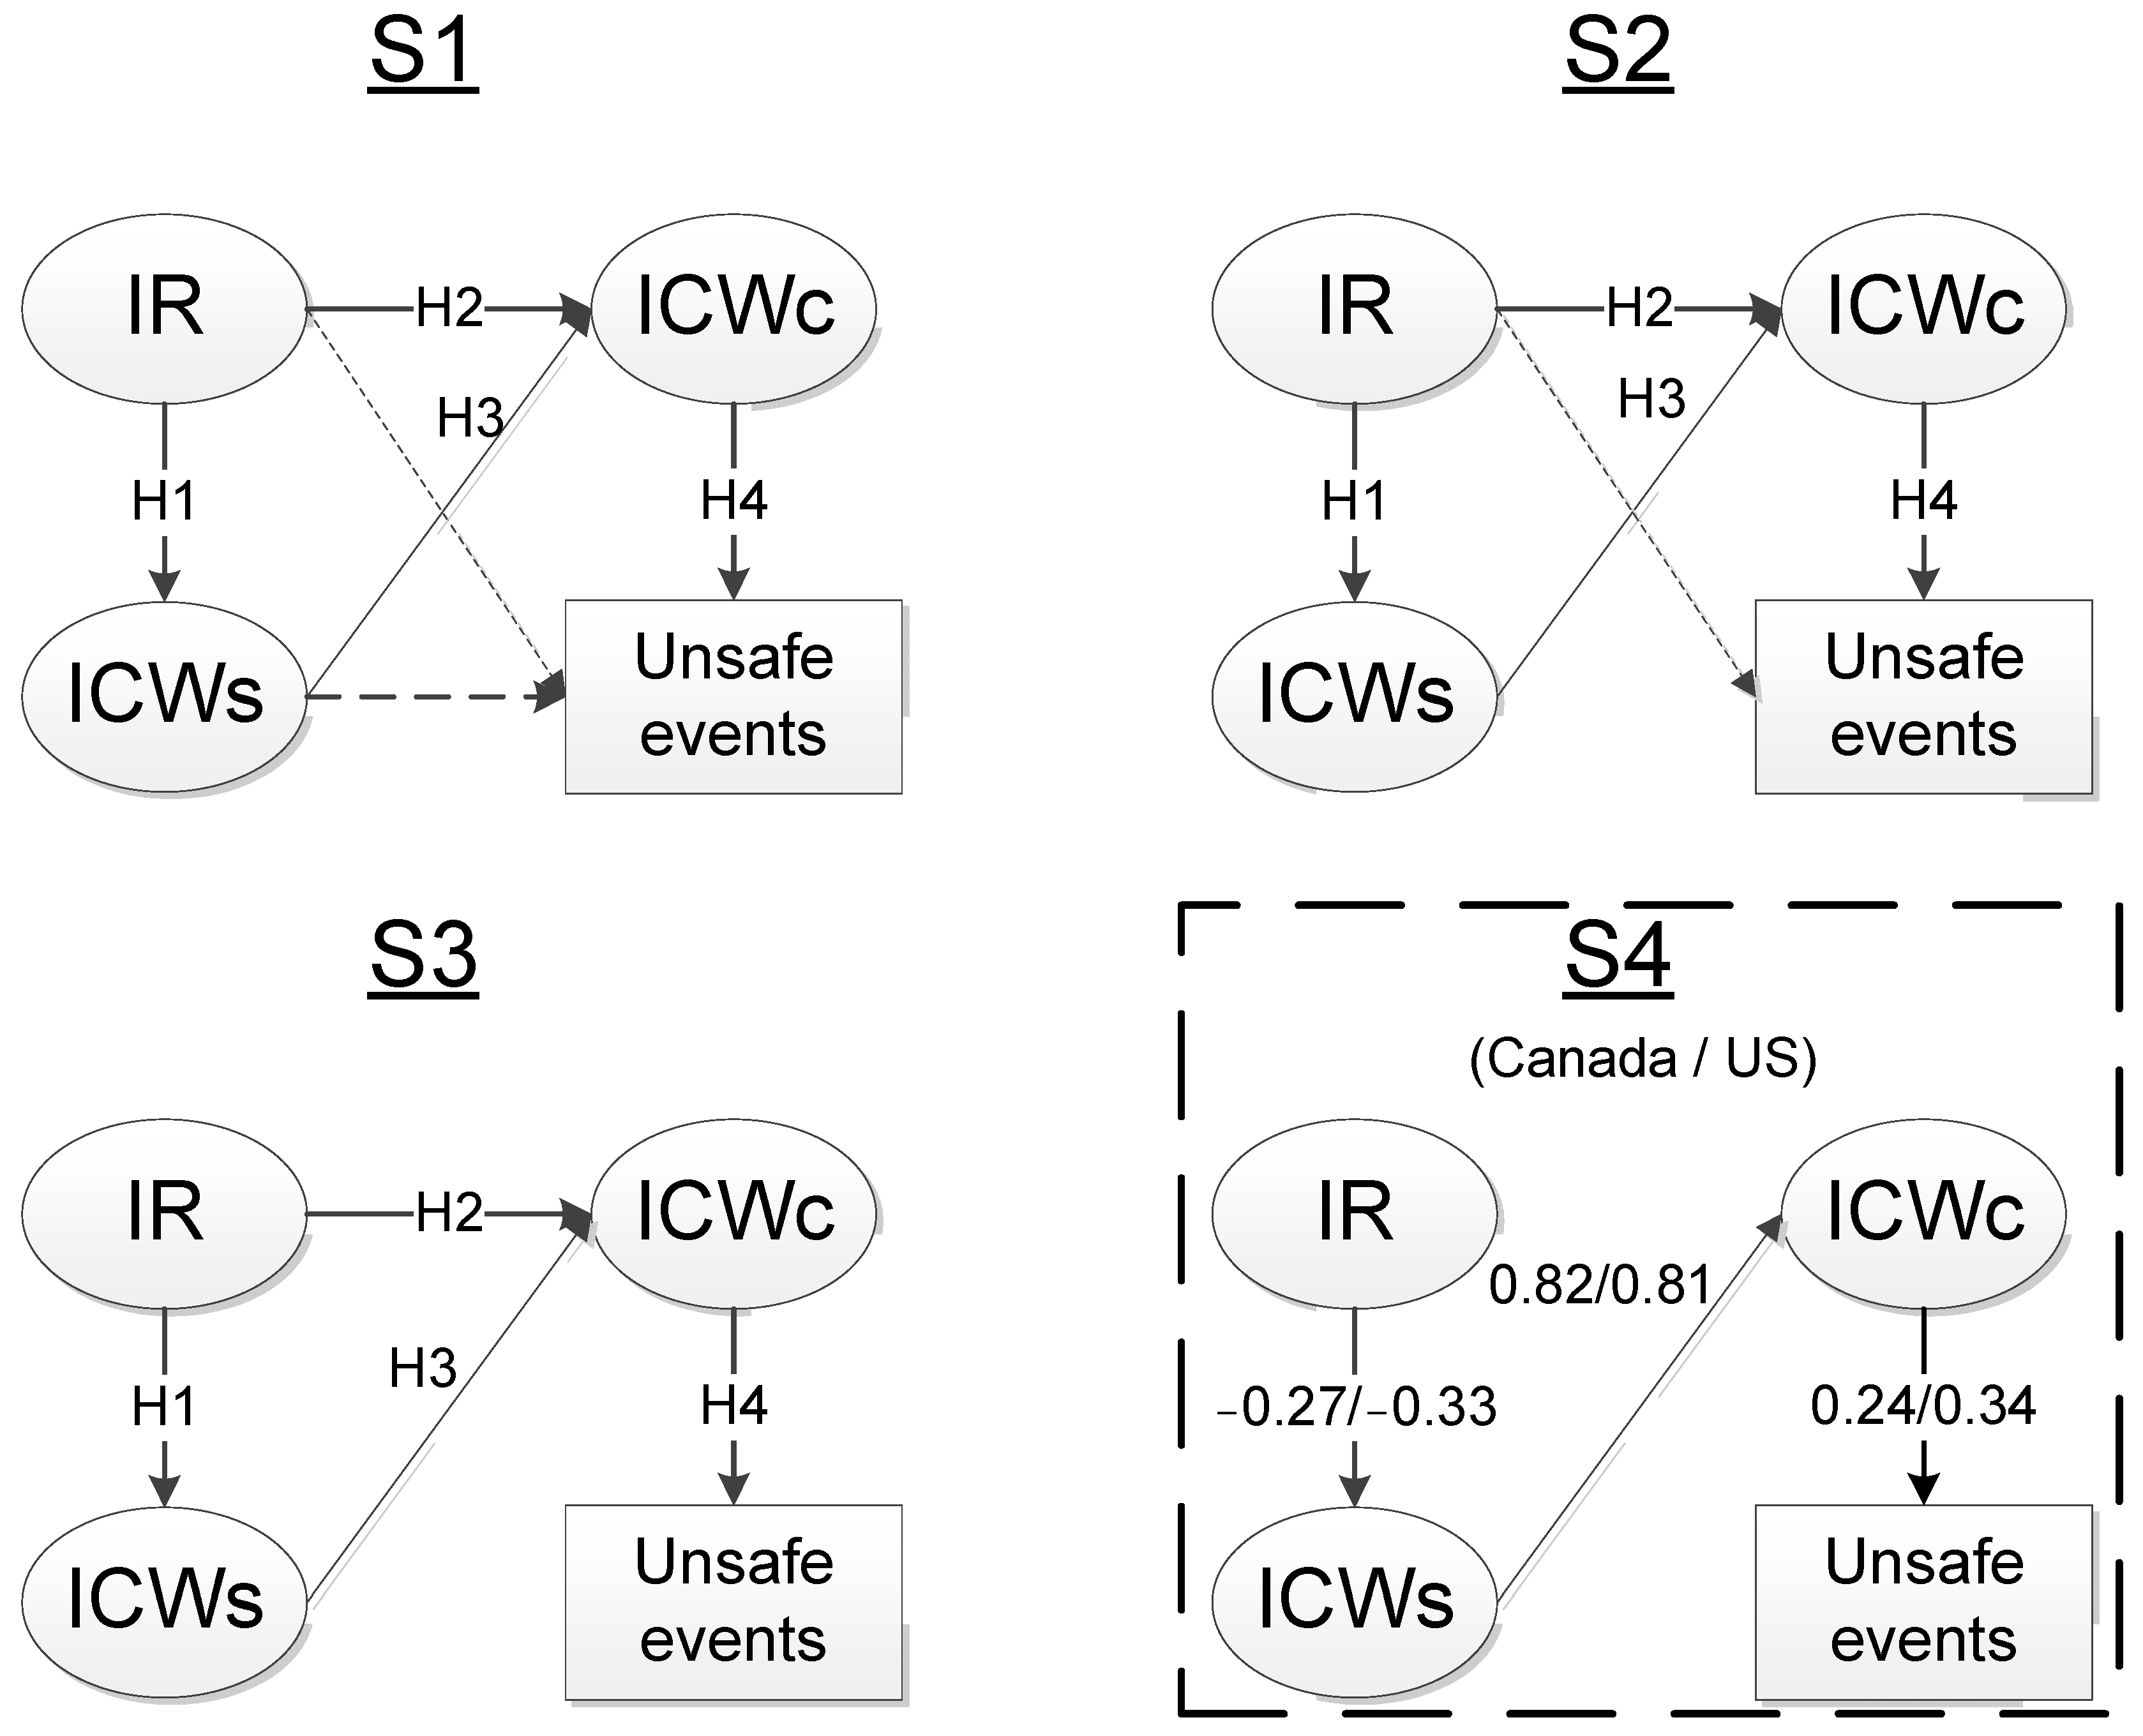
3.4. Hypotheses
3.5. Data Analysis
4. Results
4.1. Examination of Factor Structure
4.2. MI
4.3. ICW Frequency Comparison
4.4. Prediction Relationship Comparisons
5. Discussion
5.1. Overall Findings
5.2. Significance of the Study and Theretical Contributions
5.3. Practical Implications
5.4. How to Improve IR and Reduce ICW of Construction Workers?
5.5. Limitations and Future Work
6. Conclusions
Author Contributions
Funding
Data Availability Statement
Conflicts of Interest
References
- Bureau of Economic Analysis (BEA). Total Full-Time and Part-Time Employment by NAICS Industry. 2022. Available online: https://www.bea.gov/ (accessed on 6 March 2024).
- Bureau of Labor Statistics (BLS). The Economics Daily, a Look at Workplace Deaths, Injuries, and Illnesses on Workers’ Memorial Day. 2022. Available online: https://www.bls.gov/opub/ted/2022/a-look-at-workplace-deaths-injuries-and-illnesses-on-workers-memorial-day.htm (accessed on 6 March 2024).
- Snyder, L.A.; Krauss, A.D.; Chen, P.Y.; Finlinson, S.; Huang, Y.H. Occupational safety: Application of the job demand–control–support model. Accid. Anal. Prev. 2008, 40, 1713–1723. [Google Scholar] [CrossRef] [PubMed]
- Turner, N.; Stride, C.B.; Carter, A.J.; McCaughey, D.; Carroll, A.E. Job Demands–Control–Support model and employee safety performance. Accid. Anal. Prev. 2012, 45, 811–817. [Google Scholar] [CrossRef] [PubMed]
- Ariza-Montes, A.; Arjona-Fuentes, J.M.; Han, H.; Law, R. Work environment and well-being of different occupational groups in hospitality: Job Demand–Control–Support model. Int. J. Hosp. Manag. 2018, 73, 1–11. [Google Scholar] [CrossRef]
- Rivera-Torres, P.; Araque-Padilla, R.A.; Montero-Simó, M.J. Job Stress across Gender: The Importance of Emotional and Intellectual Demands and Social Support in Women. Int. J. Environ. Res. Public Health 2013, 10, 375–389. [Google Scholar] [CrossRef] [PubMed]
- Dawson, K.M.; O’Brien, K.E.; Beehr, T.A. The role of hindrance stressors in the job demand–control–support model of occupational stress: A proposed theory revision. J. Organ. Behav. 2016, 37, 397–415. [Google Scholar] [CrossRef]
- Cavanaugh, M.A.; Boswell, W.R.; Roehling, M.V.; Boudreau, J.W. An empirical examination of self-reported work stress among U.S. managers. J. Appl. Psychol. 2000, 85, 65–74. [Google Scholar] [CrossRef] [PubMed]
- Bowen, P.; Govender, R.; Edwards, P. Structural Equation Modeling of Occupational Stress in the Construction Industry. J. Constr. Eng. Manag. 2014, 140, 04014042. [Google Scholar] [CrossRef]
- Chan, A.P.C.; Nwaogu, J.M. Mental Ill-Health Risk Factors in the Construction Industry: Systematic Review. J. Constr. Eng. Manag. 2020, 146, 04020004. [Google Scholar] [CrossRef] [PubMed]
- Cheung, C.M.; Zhang, R.P.; Cui, Q.; Hsu, S.C. The antecedents of safety leadership: The job demands-resources model. Saf. Sci. 2021, 133, 104979. [Google Scholar] [CrossRef]
- Hampton, P.; Chinyio, E.A.; Riva, S. Framing stress and associated behaviors at work: An ethnography study in the United Kingdom. Eng. Constr. Archit. Manag. 2019, 26, 2566–2580. [Google Scholar] [CrossRef]
- Janssen, P.P.M.; Bakker, A.B.; de Jong, A. A Test and Refinement of the Demand–Control–Support Model in the Construction Industry. Int. J. Stress Manag. 2001, 8, 315–332. [Google Scholar] [CrossRef]
- Kamardeen, I.; Sunindijo, R.Y. Personal Characteristics Moderate Work Stress in Construction Professionals. J. Constr. Eng. Manag. 2017, 143, 04017072. [Google Scholar] [CrossRef]
- Mitropoulos, P.; Cupido, G.; Namboodiri, M. Cognitive approach to construction safety: Task demand-capability model. J. Constr. Eng. Manag. 2009, 135, 881–889. [Google Scholar] [CrossRef]
- Zheng, J.; Gou, X.; Li, H.; Xue, H.; Xie, H. Linking Challenge–Hindrance Stressors to Safety Outcomes and Performance: A Dual Mediation Model for Construction Workers. Int. J. Environ. Res. Public Health 2020, 17, 7867. [Google Scholar] [CrossRef] [PubMed]
- Nixon, A.E.; Mazzola, J.J.; Bauer, J.; Krueger, J.R.; Spector, P.E. Can work make you sick? A meta-analysis of the relationships between job stressors and physical symptoms. Work Stress 2011, 25, 1–22. [Google Scholar] [CrossRef]
- Van den Broeck, A.; De Cuyper, N.; De Witte, H.; Vansteenkiste, M. Not all job demands are equal: Differentiating job hindrances and job challenges in the Job Demands–Resources model. Eur. J. Work Organ. Psychol. 2010, 19, 735–759. [Google Scholar] [CrossRef]
- Oxenstierna, G.; Hanson, L.L.M.; Widmark, M.; Finnholm, K.; Stenfors, C.; Elofsson, S.; Theorell, T. Conflicts at work—The relationship with workplace factors, work characteristics and self-rated health. Ind. Health 2011, 49, 501–510. [Google Scholar] [CrossRef]
- Palancı, Y.; Mengenci, C.; Bayraktaroğlu, S.; Emhan, A. Analysis of workplace health and safety, job stress, interpersonal conflict, and turnover intention: A comparative study in the health sector. Health Psychol. Rep. 2020, 9, 76–86. [Google Scholar] [CrossRef] [PubMed]
- Lavelle, M.; Darzi, A.; Starodub, R.; Anderson, J.E. The role of transactive memory systems, psychological safety, and interpersonal conflict in hospital team performance. Ergonomics 2022, 65, 519–529. [Google Scholar] [CrossRef]
- Chen, Y.; McCabe, B.; Hyatt, D. Relationship between Individual Resilience, Interpersonal Conflicts at Work, and Safety Outcomes of Construction Workers. J. Constr. Eng. Manag. 2017, 143, 04017042. [Google Scholar] [CrossRef]
- Kahn, R.L.; Wolfe, D.M.; Quinn, R.P.; Snoek, J.D.; Rosenthal, R.A. Organizational Stress: Studies in Role Conflict and Ambiguity; John Wiley: Oxford, UK, 1964. [Google Scholar]
- Dodanwala, T.C.; Shrestha, P.; Santoso, D.S. Role conflict related job stress among construction professionals: The moderating role of age and organization tenure. Constr. Econ. Build. 2021, 21, 21–37. [Google Scholar] [CrossRef]
- Schmidt, S.; Roesler, U.; Kusserow, T.; Rau, R. Uncertainty in the workplace: Examining role ambiguity and role conflict, and their link to depression—A meta-analysis. Eur. J. Work Organ. Psychol. 2014, 23, 91–106. [Google Scholar] [CrossRef]
- Hazeen Fathima, M.; Umarani, C. A study on the impact of role stress on engineer intention to leave in Indian construction firms. Sci. Rep. 2022, 12, 17576. [Google Scholar] [CrossRef] [PubMed]
- Cropanzano, R.S.; Kacmar, K.M. Organizational Politics, Justice, and Support: Managing the Social Climate of the Workplace; Praeger: Westport, CT, USA, 1995; pp. 1–18. [Google Scholar]
- Ferris, G.R.; Harrell-Cook, G.; Dulebohn, J.H. Organizational politics: The nature of the relationship between politics perceptions and political behavior. Res. Sociol. Organ. 2000, 17, 89–130. [Google Scholar]
- Edmondson, A. Psychological safety and learning behavior in work teams. Adm. Sci. Q. 1999, 44, 350–383. [Google Scholar] [CrossRef]
- Li, J.; Wu, L.Z.; Liu, D.; Kwan, H.K.; Liu, J. Insiders maintain voice: A psychological safety model of organizational politics. Asia Pac. J. Manag. 2014, 31, 853–874. [Google Scholar] [CrossRef]
- Silva de Carvalho Chinelato, R.; Tavares, S.M.D.O.; Ferreira, M.C.; Valentini, F. Perception of organizational politics, psychological safety climate, and work engagement: A cross-level analysis using hierarchical linear modeling. An. Psicol. 2020, 36, 348–360. [Google Scholar] [CrossRef]
- Alkan, S.E.; Turgut, T. A research about the relationship of psychological safety and organizational politics perception with compulsory citizenship behavior and the pressures behind compulsory citizenship behavior. Res. J. Bus. Manag. 2015, 2, 185–203. [Google Scholar] [CrossRef]
- Dennis, W. Organ. Organizational Citizenship Behavior. In International Encyclopedia of the Social & Behavioral Sciences, 2nd ed.; Wright, J.D., Ed.; Elsevier: Amsterdam, The Netherlands, 2015; pp. 317–321. Available online: https://books.google.com/books/about/International_Encyclopedia_of_the_Social.html?id=TQaFBAAAQBAJ&source=kp_book_description (accessed on 30 November 2023).
- Karasek, R.; Theorell, T. Healthy Work: Stress, Productivity and the Reconstruction of Working Life; Basic Books: New York, NY, USA, 1990. [Google Scholar]
- Spector, P.E.; Jex, S.M. Development of four self-report measures of job stressors and strain: Interpersonal Conflict at Work Scale, Organizational Constraints Scale, Quantitative Workload Inventory, and Physical Symptoms Inventory. J. Occup. Health Psychol. 1998, 3, 356–367. [Google Scholar] [CrossRef]
- Gillen, M.; Baltz, D.; Gassel, M.; Kirsch, L.; Vaccaro, D. Perceived safety climate, job demands, and coworker support among union and nonunion injured construction workers. J. Safety Res. 2002, 33, 33–51. [Google Scholar] [CrossRef]
- Lee, W.; Migliaccio, G.C.; Lin, K.Y.; Seto, E.Y. Workforce development: Understanding task-level job demands-resources, burnout, and performance in unskilled construction workers. Saf. Sci. 2020, 123, 104577. [Google Scholar] [CrossRef]
- McCabe, B.; Loughlin, C.; Munteanu, R.; Tucker, S.; Lam, A. Individual safety and health outcomes in the construction industry. Can. J. Civil Eng. 2008, 35, 1455–1467. [Google Scholar] [CrossRef]
- Connor, K.M.; Davidson, J.R.T. Development of a new Resilience scale: The Connor-Davidson Resilience scale (CD-RISC). Depress. Anxiety 2003, 18, 76–82. [Google Scholar] [CrossRef] [PubMed]
- Schwarzer, R.; Jerusalem, M. Generalized Self-Efficacy Scale. In Measures in Health Psychology: A User’s Portfolio; Johnston, M., Wright, S.C., Weinman, J., Eds.; Nfer-Nelson: East Windsor, UK, 1995; pp. 35–37. [Google Scholar] [CrossRef]
- Youssef, C.M.; Luthans, F. Positive Organizational Behavior in the Workplace: The Impact of Hope, Optimism, and Resilience. J. Manag. 2007, 33, 774–800. [Google Scholar] [CrossRef]
- Cigularov, K.P.; Lancaster, P.G.; Chen, P.Y.; Gittleman, J.; Haile, E. Measurement equivalence of a safety climate measure among Hispanic and White Non-Hispanic construction workers. Saf. Sci. 2013, 54, 58–68. [Google Scholar] [CrossRef]
- Beaujean, A.A. Latent Variable Modeling Using R: A Step-by-Step Guide; Routledge: New York, NY, USA, 2014. [Google Scholar] [CrossRef]
- Vandenberg, R.J.; Lance, C.E. A Review and Synthesis of the Measurement Invariance Literature: Suggestions, Practices, and Recommendations for Organizational Research. Organ. Res. Methods 2000, 3, 4–70. [Google Scholar] [CrossRef]
- Chen, Y.; McCabe, B.; Wang, J.; Hyatt, D. Scale Equivalence in Canada and the United States for Interpersonal Conflicts at Work and Individual Resilience in the Construction Sector. In Construction Research Congress 2022: Health and Safety, Workforce, and Education, Proceedings of the ASCE Construction Research Congress 2022, Arlington, VA, USA, 9–12 March 2022; ASCE: Reston, VA, USA, 2022; (With permission from ASCE). [Google Scholar]
- Kline, R.B. Principles and Practice of Structural Equation Modeling; The Guilford Press: New York, NY, USA, 2005. [Google Scholar]
- Wheaton, B.; Muthén, B.; Alwin, D.F.; Summers, G.F. Assessing Reliability and Stability in Panel Models. Sociol. Methodol. 1977, 8, 84–136. [Google Scholar] [CrossRef]
- Tabachnick, B.G.; Fidell, L.S. Using Multivariate Statistics; Pearson: London, UK, 2007. [Google Scholar]
- Hooper, D.; Couglan, J.; Mullen, M.R. Structural equation modelling: Guidelines for determining model fit. Electron. J. Bus. Res. Methods 2008, 6, 53–60. [Google Scholar]
- Byrne, B.M. Structural Equation Modeling with AMOS: Basic Concepts, Applications, and Programming; Lawrence Erlbaum Associates: Mahwah, NJ, USA, 2001. [Google Scholar]
- Diamantopoulos, A.; Siguaw, J.A. Introducing LISREL; SAGE Publications: Thousand Oaks, CA, USA, 2000. [Google Scholar]
- Browne, M.W.; Cudeck, R. Alternative Ways of Assesing Model Fit. Sociol. Methods Res. 1992, 21, 230–258. [Google Scholar] [CrossRef]
- Xu, K. Multiple Group Measurement Invariance Analysis in Lavaan. Available online: http://users.ugent.be/~yrosseel/lavaan/multiplegroup6Dec2012.pdf (accessed on 24 June 2018).
- Birditt, K.S.; Fingerman, K.L.; Almeida, D.M. Age Differences in Exposure and Reactions to Interpersonal Tensions: A Daily Diary Study. Psychol. Aging 2005, 20, 330–340. [Google Scholar] [CrossRef]
- Canadian Centre for Occupational Health and Safety (CCOHS). Joint Health and Safety Committee-What Is a Joint Health and Safety Committee? 2018. Available online: https://www.ccohs.ca/oshanswers/hsprograms/hscommittees/whatisa.html (accessed on 1 July 2018).
- De Raeve, L.; Jansen, N.W.H.; van den Brandt, P.A.; Vasse, R.M.; Kant, I.J. Risk factors for interpersonal conflicts at work. Scand. J. Work Environ. Health 2008, 34, 96–106. [Google Scholar] [CrossRef] [PubMed]
- Iacuone, D. “Real men are tough guys”: Hegemonic masculinity and safety in the construction industry. J. Men’s Stud. 2005, 13, 247–266. [Google Scholar] [CrossRef]
- Tyler, S.; Gunn, K.; Esterman, A.; Clifford, B.; Procter, N. Suicidal ideation in the Australian construction industry: Prevalence and the associations of psychosocial job adversity and adherence to traditional masculine norms. Int. J. Environ. Res. Public Health 2022, 19, 15760. [Google Scholar] [CrossRef] [PubMed]
- Grant, A.M.; Curtayne, L.; Burton, G. Executive coaching enhances goal attainment, resilience and workplace well-being: A randomised controlled study. J. Posit. Psychol. 2009, 4, 396–407. [Google Scholar] [CrossRef]


| Demographics | Canada | US |
|---|---|---|
| Gender | 98% male | 96% male |
| Age | 37 | 39 |
| Years in the construction industry | 14 | 15 |
| Years with current employers | 6 | 6 |
| No. of employers in the previous 3 years | 2 | 2 |
| No. of projects in the previous 3 years | 10 | 17 |
| Average weekly work hours | 44 | 45 |
| Safety training percentage | 98% | 96% |
| Safety committee member percentage | 38% | 28% |
| Union member percentage | 60% | 57% |
| Job position | Supervisor 31% Journeyman 51% Apprentice 18% | Supervisor 20% Journeyman 61% Apprentice 19% |
| Sample | Model | χ2 | df | χ2 Difference | df Difference | χ2/df | CFI | RMSEA |
|---|---|---|---|---|---|---|---|---|
| Canada (n = 771) | 3-factor | 148.58 | 39 | - | - | 3.81 | 0.97 | 0.06 |
| 2-factor | 267.44 | 41 | 118.86 | 2 | 6.52 | 0.94 | 0.09 | |
| 1-factor | 1211.36 | 52 | 1062.78 | 13 | 23.3 | 0.71 | 0.18 | |
| US (n = 385) | 3-factor | 141.2 | 39 | - | - | 3.62 | 0.94 | 0.08 |
| 2-factor | 192.58 | 41 | 51.38 | 2 | 4.7 | 0.92 | 0.10 | |
| 1-factor | 641.51 | 52 | 500.31 | 13 | 12.34 | 0.69 | 0.17 |
| Models | χ2 | df | χ2/df | Compare | CFI diff | CFI | RMSEA |
|---|---|---|---|---|---|---|---|
| M1:configural invariance | 289.783 | 78 | 3.72 | - | 0.962 | 0.070 | |
| M2: weak invariance | 313.529 | 86 | 3.65 | M1 | −0.003 | 0.959 | 0.069 |
| M3: strong invariance | 340.688 | 94 | 3.62 | M2 | −0.003 | 0.956 | 0.069 |
| M4: strict invariance | 365.867 | 105 | 3.48 | M3 | −0.002 | 0.954 | 0.067 |
| Factors | Indicator No. | Statements | Canada | US | ||
|---|---|---|---|---|---|---|
| Factor Loading | Communality | Factor Loading | Communality | |||
| Individual resilience | IR1 | I remain calm when facing difficulties because I can rely on my coping abilities | 0.75 | 0.56 | 0.73 | 0.53 |
| IR2 | I am confident that I could deal efficiently with unexpected events | 0.73 | 0.53 | 0.69 | 0.48 | |
| IR3 | I can cope with stress | 0.68 | 0.46 | 0.55 | 0.30 | |
| IR4 | I can focus and think clearly when I am under pressure | 0.67 | 0.45 | 0.70 | 0.49 | |
| IR5 | When confronted with a problem, I can usually find several solutions | 0.63 | 0.40 | 0.76 | 0.58 | |
| Conflicts with supervisors | CS2 | How often are your supervisors (subordinates) rude to you at work? | 0.88 | 0.77 | 0.83 | 0.69 |
| CS3 | How often do your supervisors (subordinates) do nasty things to you at work? | 0.81 | 0.66 | 0.87 | 0.76 | |
| CS1 | How often do you get into arguments with your supervisors (subordinates)? | 0.74 | 0.55 | 0.69 | 0.48 | |
| Conflicts with coworkers | CC2 | How often are your coworkers rude to you at work? | 0.83 | 0.69 | 0.80 | 0.64 |
| CC3 | How often do your coworkers do nasty things to you at work? | 0.83 | 0.69 | 0.83 | 0.69 | |
| CC1 | How often do you get into arguments with your coworkers? | 0.68 | 0.46 | 0.60 | 0.36 | |
| Factors | Standardized Estimates |
|---|---|
| IR | 0.04 |
| ICWs | −0.17 * |
| ICWc | −0.06 |
| Country | Conflicts with Supervisors | Conflicts with Coworkers | ||||
|---|---|---|---|---|---|---|
| CS1 | CS2 | CS3 | CC1 | CC2 | CC3 | |
| Canada | 51% | 48% | 37% | 70% | 70% | 44% |
| US | 42% | 42% | 25% | 62% | 70% | 42% |
| Demographics | CS1 | CS2 | CS3 | |||
|---|---|---|---|---|---|---|
| Canada | US | Canada | US | Canada | US | |
| Age | - | - | - | −0.12 * | - | - |
| Years with current employers | 0.07 * | 0.16 ** | - | - | - | - |
| No. of projects in the previous 3 years | - | - | - | - | - | −0.12 * |
| Average weekly work hours | 0.12 ** | - | 0.07 * | - | - | - |
| Safety committee member percentage | - | 0.15 ** | - | - | - | - |
| Job position | −0.16 ** | −0.21 ** | - | - | - | - |
| Demographics | Canada | US | Differences |
|---|---|---|---|
| Age | 36.8 | 38.5 | 1.7 ** |
| Years with current employers | 6.2 | 5.5 | −0.7 |
| No. of projects in the previous 3 years | 10 | 17.2 | 7.2 *** |
| Average weekly work hours | 44.3 | 45.2 | 0.9 |
| Safety committee member percentage | 37.5% | 27.8% | −9.7% ** |
| Supervisor % | 29.2% | 16.1% | −13.1% ** |
| Sample | Model | χ2 | df | χ2 Difference | df Difference | χ2/df | CFI | RMSEA |
|---|---|---|---|---|---|---|---|---|
| Canada (n = 771) | S1 | 170.755 | 47 | - | - | 3.633 | 0.968 | 0.060 |
| S2 | 170.756 | 48 | 0.001 | 1 | 3.557 | 0.968 | 0.059 | |
| S3 | 170.759 | 49 | 0.003 | 1 | 3.485 | 0.968 | 0.059 | |
| S4 | 172.607 | 50 | 1.848 | 1 | 3.452 | 0.968 | 0.058 | |
| US (n = 385) | S1 | 160.671 | 47 | - | - | 3.419 | 0.940 | 0.080 |
| S2 | 161.353 | 48 | 0.682 | 1 | 3.362 | 0.940 | 0.079 | |
| S3 | 161.913 | 49 | 0.56 | 1 | 3.304 | 0.940 | 0.078 | |
| S4 | 165.502 | 50 | 3.589 | 1 | 3.310 | 0.939 | 0.078 |
Disclaimer/Publisher’s Note: The statements, opinions and data contained in all publications are solely those of the individual author(s) and contributor(s) and not of MDPI and/or the editor(s). MDPI and/or the editor(s) disclaim responsibility for any injury to people or property resulting from any ideas, methods, instructions or products referred to in the content. |
© 2024 by the authors. Licensee MDPI, Basel, Switzerland. This article is an open access article distributed under the terms and conditions of the Creative Commons Attribution (CC BY) license (https://creativecommons.org/licenses/by/4.0/).
Share and Cite
Chen, Y.; Hyatt, D.; Shahi, A.; Hanna, A.; Safa, M. How Can Conflicts with Supervisors or Coworkers Affect Construction Workers’ Safety Performance on Site? Two Cross-Sectional Studies in North America. Buildings 2024, 14, 1245. https://doi.org/10.3390/buildings14051245
Chen Y, Hyatt D, Shahi A, Hanna A, Safa M. How Can Conflicts with Supervisors or Coworkers Affect Construction Workers’ Safety Performance on Site? Two Cross-Sectional Studies in North America. Buildings. 2024; 14(5):1245. https://doi.org/10.3390/buildings14051245
Chicago/Turabian StyleChen, Yuting (Tina), Douglas Hyatt, Arash Shahi, Awad Hanna, and Mahdi Safa. 2024. "How Can Conflicts with Supervisors or Coworkers Affect Construction Workers’ Safety Performance on Site? Two Cross-Sectional Studies in North America" Buildings 14, no. 5: 1245. https://doi.org/10.3390/buildings14051245