


Research on Optimization Strategy of Commercial Street Spatial Vitality Based on Pedestrian Trajectories
1
School of Architecture and Design, Hebei University of Engineering, Handan 056038, China
2
School of Architecture, Tianjin University, Tianjin 300072, China
*
Author to whom correspondence should be addressed.
Buildings 2024, 14(5), 1240; https://doi.org/10.3390/buildings14051240
Submission received: 11 March 2024
/
Revised: 15 April 2024
/
Accepted: 24 April 2024
/
Published: 26 April 2024
(This article belongs to the Topic Biophilic Cities and Communities: Towards Natural Resources, Environmental and Social Sustainability)
Abstract
:Commercial pedestrian streets significantly enhance urban life. Previous research often depends on limited survey data or subjective evaluations, which fail to fully capture the impact of street elements on spatial vitality under diverse spatiotemporal conditions. This study, conducted in Beijing’s Sanlitun commercial district, analyzes pedestrian data from six branch roads collected via WiFi detection to determine how various spatial elements influence the vibrancy of commercial pedestrian streets. The results show a positive correlation between street width, ranging from 5.88 to 10.83 m, and vitality. Furthermore, the influence of different street elements on vitality varies notably. During the daytime, street width is the most effective element for enhancing vitality, with a maximum standardized coefficient of 1.717. However, at night, the associations between advertising area, store type, and vitality diminish. The street recording the highest nighttime vitality peaked at a pedestrian count of 91.7831. The contribution of street width to enhancing nighttime vitality is 2.49 times greater than at noon on non-working days, 2.01 times more than on working days, and 2.92 times higher than the impact of tables and chairs. Therefore, street design should prioritize street width, ground floor interface permeability, number of tables and chairs, store density, advertising area, and store type.
1. Introduction
In recent decades, the phenomenon of “ghost streets” has emerged in cities such as Berlin, London, Detroit, and Shanghai [1]. These streets have experienced significantly lower development and utilization rates than expected, leading to an evident waste of urban space and attracting considerable attention [2]. To revitalize these areas, substantial investments in reconstruction are often necessary [3]. However, these plans do not always yield the anticipated success, making the enhancement of vitality within limited urban spaces a pressing topic in urban studies [4].
Additionally, many major cities across France, China, and Japan face the challenge of urban shrinkage, which has drained the original vitality from their streets, posing new challenges to economic and social development [5]. There is an urgent need for a method that can accurately predict and evaluate urban vitality based on proposed plans. Such a method would minimize risks prior to construction and provide crucial guidance for urban development.
During the inventory renewal period, research on urban spatial vitality has primarily focused on the macro-urban level, with fewer studies addressing the micro-level vitality of street spaces [6]. Yet, micro street spaces are intimately linked to residents’ daily experiences [7]. As highly dynamic micro-urban environments, commercial pedestrian streets increasingly emphasize enhancing street vitality in their spatial renewal designs [8]. Recent empirical studies have demonstrated that the spatial form, functional attributes, and facilities of streets [9] can attract activities, and optimizing street vitality is now recognized as a crucial strategy for improving spatial quality.
In existing research, spatial vitality often receives less attention in small-scale urban spaces and primarily depends on subjective evaluations and qualitative descriptions, lacking a robust measurement of impact weights [10]. Traditional methods, such as behavioral records, participant observation, questionnaires, and interviews, typically cover only limited time segments and smaller scales [11]. The introduction of pedestrian trajectory capture technology has enabled the collection of new data sources that facilitate the observation of street vitality over extended periods and at a broader scale while also providing detailed insights. This research advances a more refined quantitative analysis, elucidating the influence of the built environment on street vitality and quantifying the impact weights of different elements [12]. Additionally, by considering the distribution of spatiotemporal characteristics, this study has analyzed these elements’ effects on the vitality of street space. Understanding the influence of spatial elements on the vitality of commercial pedestrian streets is crucial for designing commercial street spaces and enhancing the quality of street experiences.
This study begins with a literature review to identify elements that significantly impact pedestrian trajectories in commercial street spaces and to establish a method for calculating the spatial vitality of these trajectories. Secondly, six east–west branch streets in the Sanlitun Commercial District in Beijing, China, were selected to extract pedestrian trajectory data via WiFi detection. Thirdly, the spatial vitality values of these pedestrian trajectories were calculated, and regression analysis was conducted with the primary street element data to quantitatively assess the impact of street elements on spatial vitality. Finally, this study derived rules for the influence of spatial elements on the spatial vitality of commercial pedestrian streets and, based on these findings, proposed optimization strategies for commercial streets.
2. Literature Review
2.1. Vitality of Street Space
The spatial vitality of street spaces relates to their potential for survival and development, assessable through two primary observational methods: macroscopic and microscopic. Some scholars, using cities as examples, employ multi-source data to measure urban vitality [13]. At the macro scale, significant attention is given to the vitality of street space, from employing the store density (SD) method to evaluate vitality based on human perception [14,15] to large-scale quantitative analyses that build frameworks for understanding the impact of street vitality and exploring factors influencing it [16]. Additionally, field surveys and open-source network data are utilized to construct a street vitality evaluation index for commercial districts [17]. At the micro scale, methods to study street vitality include using the midpoint of the street as an observation point to mitigate the effects of road intersections and other variables on pedestrian flow distribution [18]. By using location data to document the main distribution characteristics of pedestrians, it has been observed that the spatial facilities and functional layouts of streets mutually enhance each other, thus increasing their attractiveness to people [19]. Using location information to record the main distribution characteristics of pedestrians, it is found that the spatial facilities and functional layout of the block strengthen each other, accelerating the attraction of pedestrian flow [20]. To evaluate the impact of spatial elements on vitality, it is crucial to consider the activity characteristics of individuals at a microscopic level, including detailed spatial attributes. In commercial pedestrian streets, particular emphasis is placed on how the functional attributes of the street, spatial form, and facilities affect micro-individual activities [9,21]. Drawing from the literature, this study identifies key factors that significantly affect spatial vitality in the micro-spaces of commercial streets, such as store density [22], store types [23], ground floor interface permeability [24], pedestrian width [25], the number of public tables and chairs [26], and billboard area [27]. Leveraging established research methods, scholars continue to investigate the influence of street elements on spatial vitality.
Overall, relatively mature research on the vitality of commercial districts has been conducted at the macro level, but research on the vitality of commercial streets at the micro level still needs to be strengthened. In particular, research on the vitality of commercial streets that integrates three dimensions of crowd activity, spatial change, and temporal change is even rarer, and this research is crucial for deepening understanding of the operating mechanism of commercial street vitality and formulating scientific optimization strategies.
2.2. Pedestrian Trajectories
Collecting pedestrian spatio-temporal information to represent vitality from a micro perspective remains a challenging task for effective vitality assessment. The primary challenge is to gather this information in an efficient manner that accurately reflects vitality. In existing research, methods such as actual measurements [28] and questionnaires [29] are predominantly used in micro-scale street environments. These methods involve processing pedestrian location information, which can be inaccurate, costly, and time-consuming. Conducting such studies on a large scale presents significant challenges. With the advent of big data, resources such as mobile phone signaling data [30], social media check-ins [31], and GPS data [32] have been utilized in spatial vitality research. While big data offer extensive coverage, long-term data collection, and low acquisition costs, its coarse granularity presents difficulties in conducting detailed spatial vitality research on micro-scale commercial pedestrian streets.
By reviewing existing research, this study aims to collect higher-precision pedestrian spatio-temporal information leveraging big data techniques. Hou utilized video datasets and computer vision techniques to record pedestrian trajectories and quantify the utilization of small public spaces [33], demonstrating that variations in the number of individuals at different times can serve as an indicator of street vitality. Williams et al. employed tracking algorithms to monitor the flow of people and generate social cohesion images [34], finding that crowd-gathering behavior varied across different functional types of street spaces. Yan et al. extracted pedestrian movement trajectories from videos [35] and analyzed the spatiotemporal distribution of stays, revealing that pedestrian stay times varied in street spaces with different interface forms. Li et al. used a multi-target tracking algorithm [26] to quantitatively assess vitality by analyzing pedestrian counts, confirming that the spatial form of streets directly impacts changes in spatial vitality. These approaches address the challenges of data collection inherent in traditional methods, overcome the limitations of non-visual big data, and enhance the level of detail and accuracy in capturing crowd dynamics.
Certain methodologies focus primarily on quantitatively analyzing location information across spatial and temporal dimensions while also incorporating qualitative discussions about human activities. A more advanced approach is that of Tong Niu, who captures pedestrian trajectory information from video data [36] and proposes a vitality quantification model through multiple linear regression analysis based on quantitative indicators. However, studies on the detailed spatial optimization design for commercial pedestrian streets, particularly based on pedestrian trajectories, have been relatively limited. Consequently, there is a lack of established general principles regarding the impact of spatial design parameters on the optimization of these streets. Specifically, studies that examine the combined impact of design parameters—such as store density, store type, ground floor interface permeability, street width, the number of public tables and chairs, and billboard area—on spatial optimization to accurately assess spatial vitality are scarce in the Chinese literature.
2.3. Behavior Mapping
In addition, this study used a method of using video datasets to record pedestrian trajectories, and through this behavior mapping method, researchers can gain a deeper understanding of pedestrian activity patterns. However, the effectiveness and scientificity of this method still need to be rigorously validated. Sommer R. mentioned that behavior mapping is a continuous process of collecting time and behavior data, which requires an observation schedule to systematically collect behavior data over a long period of time [37]. Robin C. Moore used visual methods to mark children’s sites on the floor plan of community open spaces and found that different natural spatial features may affect children’s physical activity levels [38]. Zordan M. collected data on crowd behavior mapping using visual snapshots and found that the underlying features of buildings can affect the density of human face-to-face interaction [39]. Villani C., on the other hand, places more emphasis on precise capture of spatiotemporal information. She has positioned different activity behaviors in the GIS environment and found that pedestrian streets, as public open spaces, are in intense conflict with the behavior of personal power due to their transportation and commercial nature [40]. In another article, it was proposed that migrant workers in Hong Kong, as a vulnerable social group, faced problems of human rights, space justice, and urban inclusiveness during COVID-19. This research method not only provides us with a deeper understanding of pedestrian behavior but also triggers thinking about urban planning and management [41]. Therefore, the use of video datasets to record pedestrian trajectories has brought new possibilities for urban research.
2.4. Concept Definition
Street vitality is characterized primarily by spatial attributes, manifesting as the distribution patterns of human activity intensity on streets. These spatial characteristics are observed through the presence and activities of individuals within a specific spatial context. Moreover, street vitality encompasses temporal characteristics [42]. Jacobs posits that street vitality arises from the fluctuating flow of people at different times. Two key phenomena associated with street vitality are the absolute number of people utilizing city streets and their temporal distribution throughout the day [43], with an emphasis on the significance of time distribution. The assessment of street vitality involves quantifying various activities within the street space, such as counting the number of people staying, walking slowly, and participating in other activities. It also includes evaluating the distribution of these activities at different times of the day. The intensity of crowd activity on the street can be quantified by its spatiotemporal characteristics, which define the essence of street vitality.
2.5. Objective
Against this backdrop, the objective of this study is to evaluate the spatial vitality of commercial pedestrian streets using the pedestrian trajectory method. The research aims to quantify the impact of design parameters on spatial vitality, specifically addressing three key issues:
- (I)
- How do the design parameters of commercial pedestrian streets influence spatial vitality in terms of spatial characteristics?
- (II)
- How do the design parameters affect spatial vitality in terms of temporal characteristics?
- (III)
- Considering the dynamic changes in spatial and temporal characteristics, which design parameters should be prioritized in the planning of a commercial pedestrian street?
3. Methods
3.1. Research Framework
This study investigates the influence of spatial elements on pedestrian trajectory behavior within commercial pedestrian streets. A street design optimization strategy, guided by the promotion of vitality, is proposed. The research content and steps are outlined in the following figure (Figure 1):
- (I)
- Six street space samples with representative environmental characteristics were selected within the Sanlitun commercial district in Beijing, China.
- (II)
- During the same time period, four specific time intervals were chosen to conduct WiFi trajectory data collection for these six samples. The collection process involved documenting various pedestrian trajectory behaviors and the spatial element configuration of each sample.
- (III)
- For data analysis, trajectory behavior data were extracted according to specific analytical requirements. It is proposed that the data concerning factors and vitality be modeled using ordered logistic regression equations in SPSS. This evaluation will help ascertain the impact of various factors on street vitality under different pedestrian densities and aid in constructing a spatial configuration model for commercial pedestrian streets aimed at enhancing vitality.
- (IV)
- In line with design requirements, priorities should be rationally allocated to propose street-type design methods tailored to different priority levels.
3.2. Sample Selection
Beijing’s Sanlitun Commercial Pedestrian Street has a large number of activities, obvious differences in vitality, and high application value [44]. This article uses six commercial pedestrian street spaces as sample spaces and conducts eight on-site surveys at Taikoo Li Sanlitun, four times on 20 August 2023 (Sunday) and four times on 21 August 2023 (Monday), each involving daytime hours, nights, working days, non-working days [45]. To analyze changes in the amount of positioning data and the number of external trust sources, each piece of data includes the device MAC address, collection timestamp, probe number, and distance between the device and the probe. Among them, device groups 1, 2, 3, 4, 5, and 6 in Sanlitun South District detect 6 east–west streets, as shown in Figure 2.
The data collected are the flow trajectory data of Sanlitun South District. The data collection times are 12:00–13:30, 14:00–15:30, 16:00–17:30, and 19:00–20:30. Each time period, a 5 min technical detection was carried out. At the same time, the No. 1 cross street in the South District was selected for video measurement and shooting, and the accuracy of the two-way cross-sectional human flow verification technology was recorded. After statistical processing of the human flow and human flow trajectories by street, model analysis is performed.
In order to ensure the accuracy and comprehensiveness of the data, we have decided to conduct additional data collection on the streets from 7 to 8 July 2024 to compensate for the shortcomings of the previously collected data [45]. After additional data collection, it was found that the data were highly consistent with those collected on 20–21 August 2023. This additional data collection initiative will help compensate for the lack of time span and provide a more comprehensive and accurate analysis foundation for the research. Through such measures, we can be more confident that our research results are comprehensive and accurate, making our conclusions more credible.
3.3. Model Specification
3.3.1. Pedestrian Street Spatial Elements
- (I)
- Store density (SD)
Store density [22] is defined as the number of stores per unit length of a commercial pedestrian street. In this study, store density is represented by the number of stores along the median of the street divided by the length of that median. Store density plays a crucial role in the spatial vitality of commercial pedestrian streets. A higher store density indicates a greater variety of shopping and service options available, which can attract more customers and tourists. This, in turn, increases pedestrian traffic and activity levels on the street, as presented in Table 1.
- (II)
- Store type (ST)
Store type [23] refers to the variety of functional store categories found on commercial pedestrian streets. This metric reflects the diversity of shopping, dining, entertainment, and service options available. In this study, store types are categorized based on the types of products or services offered. A higher number of store types indicates a richer experience for pedestrians, providing a broader range of activities and interactions.
- (III)
- Bottom interface permeability (BP)
Good ground floor interface permeability [24] enhances customer flow between the underground and ground levels. This facilitates increased pedestrian traffic, which in turn enhances store visibility and customer footfall, contributing to a vibrant and thriving business environment on the pedestrian street. A preliminary investigation indicates that the transmittance of the glass curtain wall on Sanlitun Commercial Street exceeds 80%. In this study, the ratio of the glass area to the facade area along the street is employed as the metric for calculating ground floor interface permeability.
- (IV)
- Street width (SW)
The building height along Sanlitun Commercial Street is uniformly set to three floors [25]. Variations in pedestrian width influence the cross-sectional shape of the street. The SW of a commercial pedestrian street is intricately linked to its capacity for pedestrian traffic. Wider streets can accommodate more pedestrians, facilitating free movement and reducing congestion and pedestrian conflicts. In this study, street width is calculated as the average width, determined by dividing the total street area by the length of the line connecting the midpoints of the street’s entrances and exits.
- (V)
- Number of public tables and chairs (NC)
A sufficient number of public tables and chairs [26] can enhance social interaction and activity on commercial pedestrian streets. Comfortable seating facilities offer pedestrians places to rest and dine, potentially increasing their duration of stay. The quantity of tables and chairs is determined through systematic observation and recording.
- (VI)
- Billboard area (BA)
Billboard area [27] enhances the spatial perception and visual appeal of commercial pedestrian streets. It provides navigation and information transmission functions that assist pedestrians in quickly locating their destinations or accessing necessary information. Clear and easily readable signage offers guidance that can facilitate pedestrian flow and encourage participation in commercial pedestrian areas. In this study, the advertising area was calculated by measuring the length and width of advertising signs along the street, including facade advertising, independent hanging signs, and other advertisements.
3.3.2. Street Vitality Measurement
This study adopts the spatial vitality quantification model based on quantitative indicators proposed by Tong Niu as the method for measuring street vitality [36]. This model provides a practical and scientifically robust approach to assessing street vitality. It objectively quantifies vitality by incorporating various quantitative indicators, thus offering a comprehensive evaluation. The model’s four quantitative indicators—number of people, residence time, trajectory diversity, and trajectory complexity—address key aspects such as human flow, activity duration, space utilization, and degree of interaction. These indicators facilitate a more detailed assessment of street vitality. Moreover, while the spatial vitality of commercial pedestrian streets predominantly reflects the attractiveness and busyness of different spaces, it does not necessarily capture directional business activities. Consequently, the quantification model proposed by Tong Niu is both scientific and comprehensive, making it well-suited for evaluating the spatial vitality of commercial pedestrian streets. By utilizing this method, the research can achieve objective and thorough evaluation results.
The calculation formula of the spatial vitality quantification model based on quantitative indicators is as follows (1):
In the street space, the vitality is determined by several factors. The number of pedestrians present in the area is represented by “num”, while the duration of their stay is denoted as “dur”. Additionally, the diversity of pedestrian trajectories is captured by “TD”, and the complexity of pedestrian trajectories is measured by “TC”.
- (I)
- Number of people (num)
The attractiveness of a commercial pedestrian space can be assessed by the number of people present. A higher number of individuals in the same space often signifies greater appeal. In this study, the population count is determined by analyzing the number of pedestrian trajectories. To ensure accuracy, it is essential to deduplicate trajectories using the unique identifier of the device, such as the MAC address, to prevent tracking errors. Due to potential detection range errors, this study utilizes filtered trajectories. Consequently, the count of people excludes pedestrians who only briefly enter the spatial boundary or who travel along the boundary. These findings are summarized in Table 2.
- (II)
- Residence time (dur)
This study calculates the dwell time by recording the number of track points marked by the trajectory timing. During data collection, track points are recorded at five-second intervals. Dwell time, defined as the average duration that pedestrians spend in a commercial street area, serves as an indicator of the space’s attractiveness. This metric offers insights into the appeal of the space to pedestrians and their willingness to linger. The calculation is performed by analyzing the duration of the connection between WiFi detection equipment and pedestrians’ devices. A higher number of stay track points typically indicates greater pedestrian attraction and interest in the commercial streets.
- (III)
- Trajectory diversity (TD)
Higher vitality correlates with a richer array of activities, which is manifested in the diversity of pedestrian trajectories. This trajectory diversity illustrates variations in the structural patterns of pedestrian movement and captures the differences in paths taken by individuals within the space. Specifically, by collecting vector information that includes the starting and ending points of individual trajectories, one can calculate the structural similarity of these paths. These local vectors represent the shape and structure of pedestrian trajectories. Similarities or differences in these structures can indicate behavioral patterns of pedestrian groups or clusters.
- (IV)
- Trajectory complexity (TC)
To account for behaviors that share the same trajectory but involve different activities, this study introduces the concept of trajectory complexity to calculate vitality values. For instance, when pedestrians traverse a space with identical starting and ending points, their movements tend to be purposeful, often lacking spontaneity. Such trajectories typically appear as simple straight lines, indicating a direct and efficient route to their destination. In contrast, trajectories associated with self-selected and social activities exhibit high randomness and significant variability, often appearing as wavy lines with frequent fluctuations. Variations in behaviors are primarily evidenced by the presence of inflection points in the trajectories and changes in the direction vectors at these points. Trajectories of passing pedestrians generally have few inflection points, and the variation in direction vectors between these points tends to be relatively uniform. On the other hand, trajectories of pedestrians engaged in leisure activities contain numerous inflection points, with notable variations in direction vectors observed between these points. The complexity of a trajectory is assessed by first identifying the inflection points and then calculating the vector differences by connecting adjacent inflection points.
4. Results
4.1. The Spatial Feature Dataset of Streets
The processed data on spatial elements include six major categories: SD, ST, BP, SW, NC, and BA. The classification and proportion of these elements are detailed in Table 3.
In the east–west streets of Sanlitun, significant differences are observed in the data across various types of spatial elements. For instance, as depicted in Figure 3, Street 4 exhibits the highest value of six for store density, while Street 5 has the lowest at one, indicating that Street 4’s value is six times that of Street 5. In terms of street width, Street 4 records the highest measurement at 12.03 m, compared to Street 2 at 5.88 m, marking an increase of 104.5%. Regarding ground floor interface permeability, Street 6 shows the highest value at 0.538, while Street 1 is the lowest at 0.495, an 8.6% increase. For the number of public tables and chairs, Street 4 leads with 52, significantly higher than Street 5, which has 10, an increase of 420%. In the billboard area, Street 1 features the largest area at 51 square meters, whereas Street 4 has the smallest at 15 square meters, showing an increase of 240%.
According to the data presented in the figure, among the six indicators—store density, store types, street width, number of public tables and chairs, and billboard area—Street 4 is representative in terms of store density, store types, street width, number of public tables and chairs, and billboard area. Street 1 is notably representative of store density, ground floor interface permeability, and billboard area. The spatial element data for Streets 4 and 1 exhibit significant differences. Additionally, Street 5 stands out in terms of shop types and the number of public tables and chairs, Street 2 is distinguished solely by its street width, and Street 6 is unique for its ground floor interface permeability. It is important to note that this study highlights the considerable variance in the spatial element data between Streets 4 and 1, providing a clearer understanding of the spatial diversity among different commercial streets. However, the presence of significant differences in spatial elements does not necessarily correlate with substantial differences in spatial vitality. Assessing spatial vitality requires detailed analysis through specific calculations.
4.2. Spatial Vitality Dataset of Streets
This study analyzes pedestrian trajectory data from commercial streets collected via WiFi detection. The underlying principle involves the WiFi detection system actively scanning and capturing the signal characteristics of user devices, such as MAC addresses and signal strengths, when their WiFi functions are enabled. These characteristics, along with the distribution pattern of the signal, are used to precisely locate users within the street area. The data are confined to the street area and exclude the interiors of stores on either side of the street. Furthermore, to ensure data accuracy, detailed video observations and analyses were conducted. These confirmed that the data obtained from WiFi detection technology closely correspond to the actual pedestrian movements. This alignment is further discussed and validated in the subsequent verification phase.
The data collected include the number of people and individual trajectory information, yielding 5626 and 4452 records over two days, respectively. The recorded information is illustrated in the accompanying figure. The data collection methodology was developed with reference to relevant studies [46] and adhered to ethical research practices through several measures: firstly, permission for sample collection was obtained through negotiations with local law enforcement authorities; secondly, an agreement was signed with the management agency of the community where the data were gathered, stipulating that all personal information in the collected data would be anonymized and that the data would be used solely for research purposes, with no disclosure to third parties; thirdly, data recording occurred in outdoor public spaces, where pedestrians were informed about the data collection, emphasizing that the records are used exclusively for studying crowd behavior, not for individual tracking, and that personal information would be obscured.
4.3. Data Verification
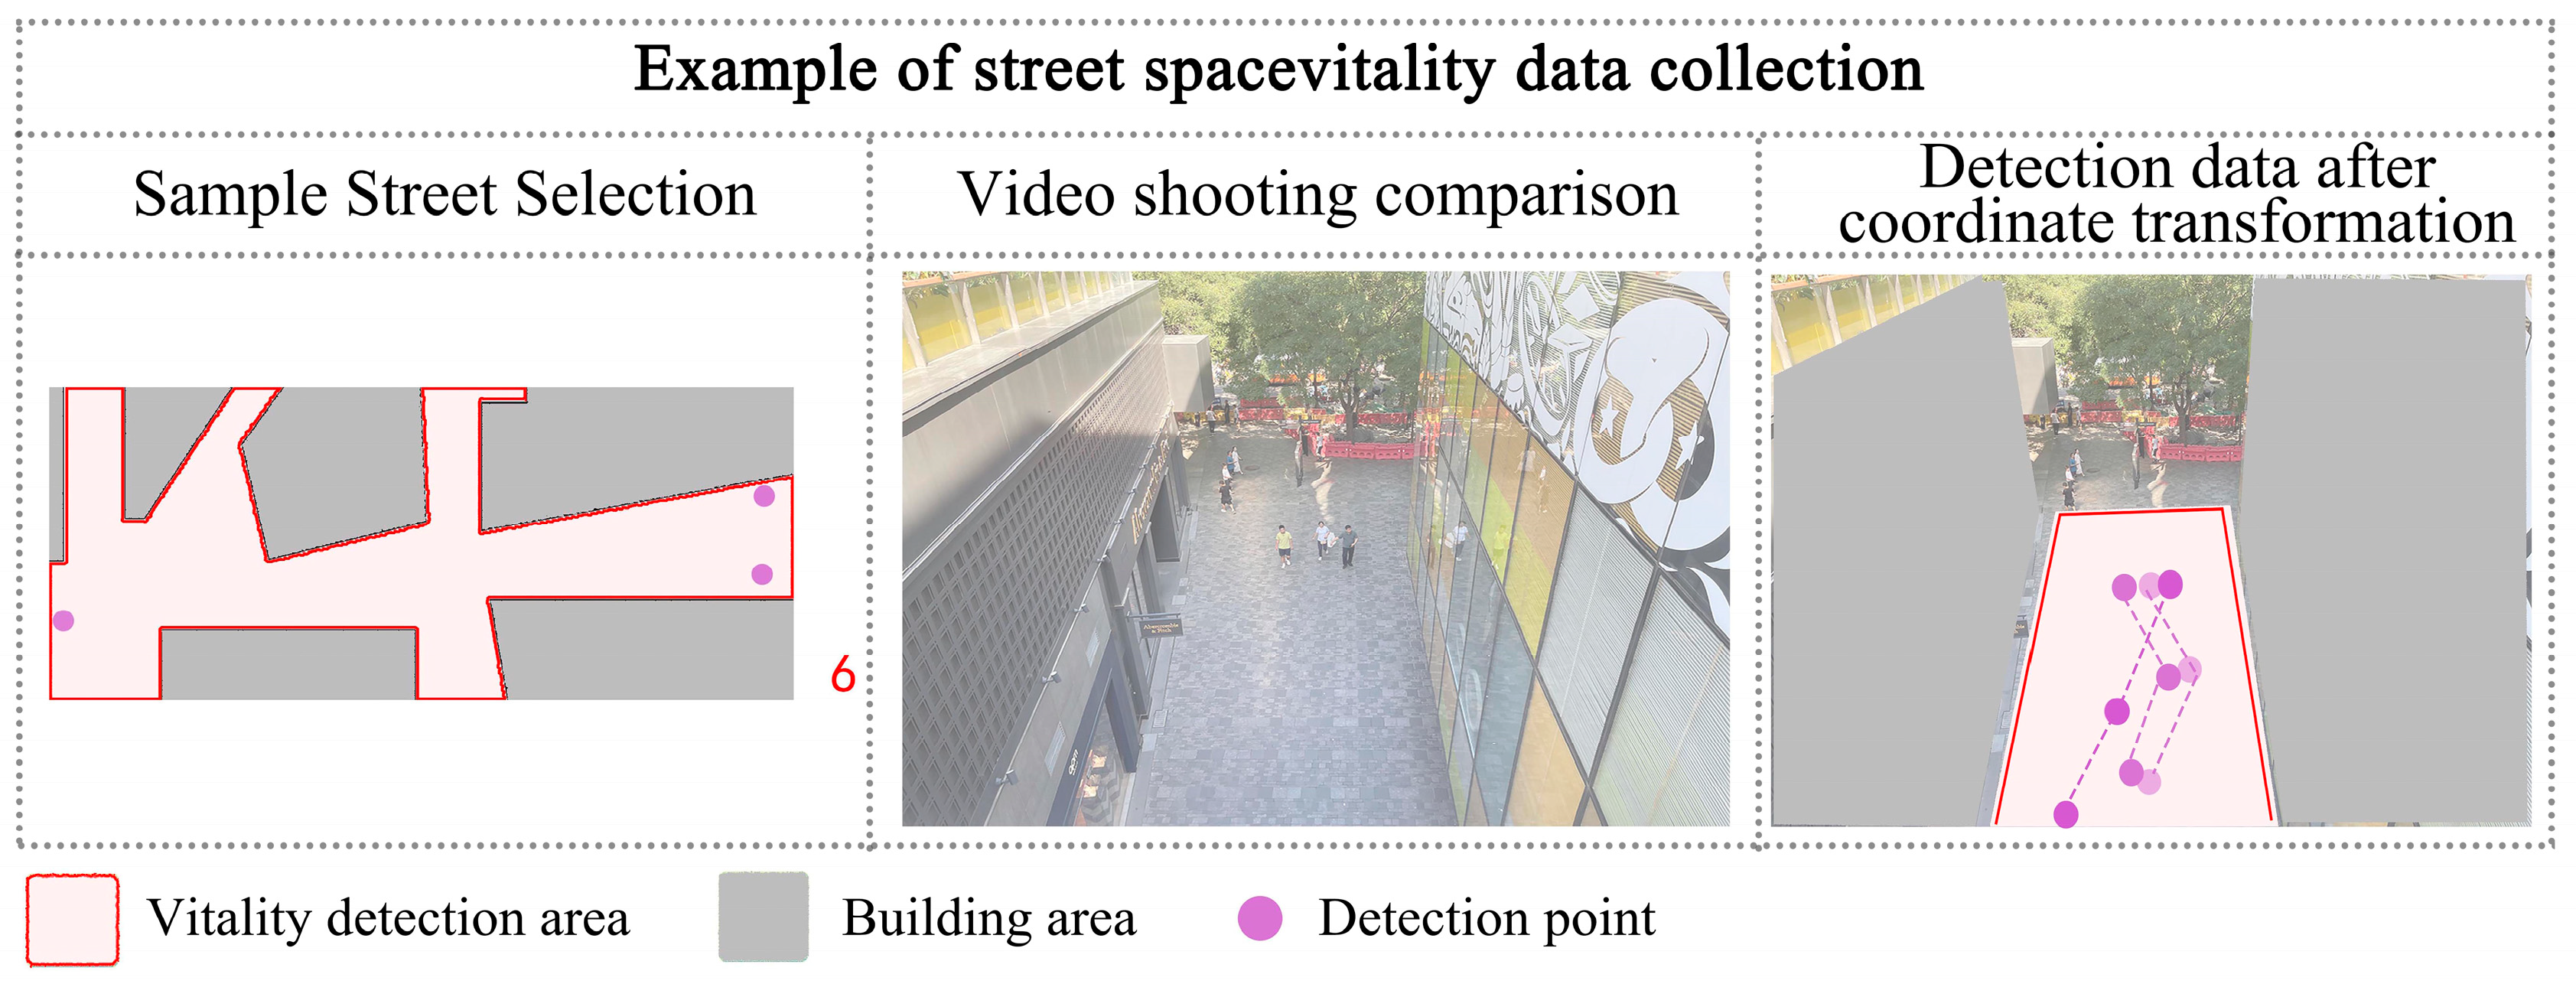
To ensure the accuracy of spatial vitality data, this study employs synchronous video recording for five minutes at each collection point during different time periods to capture bidirectional cross-sectional people flow activities at the measurement points. The data verification method consists of the following steps: (a) capturing video screenshots, (b) extracting pedestrian trajectories, and (c) transforming position coordinates [36]. Figure 4 details the specific processing procedure for each video: Initially, the research team selects clips from the video at the measurement point, ensuring each frame is smooth and stable. Subsequently, frame-by-frame analysis is conducted to pinpoint the pedestrian’s trajectory. Given that the shape of pedestrian trajectories detected via WiFi differs from the video recording angle, the trajectory punctuation points recorded in the video are converted into vertical top-view trajectory points using the reference objects. This study employs the perspective transformation method (X, Y) to perform the coordinate transformation [47]. The primary aim of processing the data is to ascertain the consistency of the number of pedestrians, pedestrian residence time, trajectory coordinate points, and detection data in the video. While this verification method may not yield a flawless trajectory, and coordinate conversion might introduce errors, as well as tracking issues for severely occluded or excessively blurred individuals in the video may also generate inaccuracies, these factors minimally impact the quantitative analysis of vitality from the perspective of verifying spatial vitality elements. Future studies will incorporate more refined verification methods to enhance the accuracy of assessing the vitality of spatial elements in streets.
4.4. Regression Analysis of Spatial Vitality and Elements
In this study, a correlation analysis of spatial vitality and elements is conducted using a method based on stepwise multiple linear regression. The fundamental principle of stepwise multiple linear regression is to automatically identify the most significant variables from a large pool of variables. This process helps establish a predictive or explanatory model for regression analysis [48]. Specifically, the model will first include the variables with the highest correlation with the dependent variable. Subsequently, the method adds the next most relevant variable to the model until no other variables demonstrate statistical significance. During this iterative process, it is possible to exclude a variable that was previously included in a step but is no longer statistically significant. This study used the SPSS platform for regression analysis calculations [49]. Through regression analysis, this study obtained the optimal energy quantification model at different times. Among them, the independent variables are store density, store type, ground floor interface permeability, street width, number of public tables and chairs, and billboard area, and the dependent variable is the spatial vitality value.
The research results show that in the multiple linear regression model established between 19:00 and 20:30 on non-working days, the significance of store type and advertising area are 0.143 and 0.529, respectively. There is no significant difference in store type and advertising area at the 0.05 level. In the multiple linear regression model developed for the remaining time periods, all variables included in the model exhibit statistical significance at the 0.05 significance level.
Based on the analysis, it can be inferred that during non-working days from 19:00 to 20:30, the vitality of the street space is influenced by factors such as the density of shops, the permeability of the ground floor interface, the width of walkways, and the presence of public tables and chairs. The rest of the time, the vitality of street space is affected by store density, store types, ground floor interface permeability, pedestrian width, number of public tables and chairs, and billboard area.
4.4.1. Analysis Results of Different Spatial Characteristics
In this study, there are two sets of correlations between spatial elements and spatial vitality. In the special vitality model, focusing on the time period from 19:00 to 20:30 on non-working days, street spatial vitality is correlated with store density, ground floor interface permeability, and pedestrian width.
- (I)
- Normal vitality model
This study utilizes the results obtained from stepwise multiple linear regression analysis models. It reveals that across all normal models investigated, certain findings can be derived. Store density and advertising area are negatively correlated with spatial vitality, while store type, ground floor interface permeability, street width, and the number of public tables and chairs are positively correlated with spatial vitality. The third model in the regression parameter graph shows a significant spatial weight difference in the analysis model between 16:00 and 17:30 on non working days.
The results show that tolerance values of store density (SD), store type (ST), ground floor interface permeability (BP), street width (PW), number of public tables and chairs (NC), and billboard area (BA) are 1.1, 0.7, 1.1, 0.3, 0.5, and 0.5, respectively. All the coefficients, which are all greater than 0.1, indicate that there is no significant covariance between the independent variables and other variables in this study. SPSS 26 statistical analysis software was used to conduct a linear regression analysis on store density, store type, ground floor interface permeability, street width, number of public tables and chairs, billboard area and spatial vitality, and a regression model of street space design parameters on spatial vitality was obtained, as shown in Equation (2).
Among them, Y is the street space vitality, SD is the store density, ST is the store type, BP is the permeability of the ground floor interface, PW is the street width, NC is the number of public tables and chairs, and BA is the billboard area.
The findings from the linear regression analysis are displayed in Figure 1. These coefficients enable the comparison of the influence of street space design parameters on overall vitality, even though they may have varying magnitudes and units. The standardized factor β is a quantitative index utilized to standardize different quantitative units, indicating the effectiveness of the independent variable on the dependent variable. The street width has a standardized coefficient of 1.717, whereas the billboard area has a standardized coefficient of −0.039. The influence of pedestrian width on street vitality is 44.02 times greater than that of the billboard area, and the multiple correlation coefficient is 0.645. The coefficient of determination is a statistical measure indicating the effectiveness of model fitting; the model’s fitting effect improves as it approaches one. Hence, the equation demonstrates a high level of fit, indicating a strong linear relationship between street space design parameters and spatial vitality.
- (II)
- Special vitality model
This study utilizes the results obtained from the stepwise multiple linear regression analysis model. The findings demonstrate that in the model of spatial vitality, certain relationships and patterns can be observed. Store density is negatively correlated with spatial vitality, while ground floor interface permeability, street width, and the number of public tables and chairs are positively correlated with spatial vitality. For non-working days, the 19:00–20:30 model is analyzed, which is the fourth model in the model regression parameter diagram.
The results show that the tolerance values of store density (SD), ground floor interface permeability (BP), pedestrian width (PW), and number of public tables and chairs (NC) are 1.1, 1.1, 0.3, and 0.5, respectively, all greater than 0.1, the analysis indicates that there is no covariance between the independent variable and other variables, as all coefficients demonstrate no significant association. SPSS 26 statistical analysis software was used to conduct linear regression analysis on store density, ground floor interface permeability, street width, number of public tables and chairs, and spatial vitality, and the obtained regression model illustrates the relationship between street space design parameters and spatial vitality, as shown in Equation (3).
Among them, Y is the vitality of street space, SD is the density of shops, BP is the permeability of the ground floor interface, PW is the street width, and NC is the number of public tables and chairs.
Figure 5 presents the results obtained from the linear regression analysis. These coefficients facilitate the comparison of the effects of street space design parameters on overall vitality despite their varying magnitudes and measurement units. The standardized factor β is a quantitative index employed to standardize diverse measurement units, signifying the effectiveness of the independent variable on the dependent variable. The street width has a standardized coefficient of 2.745, while the number of public tables and chairs has a standardized coefficient of 0.9376. The impact of street width on street vitality is 2.92 times that of the number of public tables and chairs, and the multiple correlation coefficient is 0.735. The coefficient of determination is a statistical measure indicating the effectiveness of model fitting; the model’s fitting effect improves as it approaches one. Thus, the equation demonstrates a high level of fit, suggesting a strong linear relationship between street space design parameters and spatial vitality.
4.4.2. Analysis Results of Different Time Characteristics
In this study, it was found that the standardized factor difference varied significantly between working days and non-working days, indicating that the efficiency of street parameters on street vitality changes over time. The results show that on non-working days, the standardized coefficient of street width at noon is 0.521, accounting for 16.52%, and the standardized coefficient at night is 2.745, accounting for 41.23%. The street width is more efficient at improving street vitality at night than at noon by 2.49 times, while the standardized coefficient of the number of tables and chairs at noon is 0.352, accounting for 11.16%, and the standardized coefficient at night is 0.937, accounting for 14.07%. The efficiency of the number of tables and chairs in improving street vitality at night is 1.269 times that at noon. The findings indicate that over time, the influence of street width and the number of tables and chairs on enhancing street vitality increases gradually. Notably, the impact of street width on effectiveness exhibits the highest rate of growth in improving street vitality, as shown in Figure 6.
On weekdays, the standardized coefficient of street width at noon is 0.338, accounting for 14.42%, and the standardized coefficient at night is 1.835, accounting for 28.91%. The efficiency of street width in improving street vitality at night is 2.01 times that at noon; The standardized coefficient of store types at noon is 1.192, accounting for 50.91%, and the standardized coefficient at night is 2.419, accounting for 38.12%. The efficiency of store types in improving street vitality at night is 0.748 times that at noon. It shows that with the increase in time, the impact of street width on the improvement in street vitality is gradually increasing, and the impact of store types on the improvement in street vitality is gradually declining, among which the efficiency of street width has the fastest growth.
It shows that as time goes from noon to night, the efficiency of street width in street space design parameters in improving street vitality is more significant, by 2.49 times on non-working days and by 2.01 times on working days. The efficiency of store types in improving street vitality is low. The working day is not affected; the working day is 0.748 times. As time changes, the vitality-improving efficiency of street space design parameters from large to small is pedestrian width, ground floor interface permeability, number of tables and chairs, store density, billboard area, and store types.
5. Discussion
5.1. Selection of Spatial Elements under Spatial Characteristics
Disregarding temporal characteristics and focusing solely on spatial attributes, significant variations are observed in the impact of different street elements on vitality. Specifically, within the street width range of 5.88 m to 10.83 m, there is a positive correlation between street width and street vitality, suggesting that an increase in street width generally enhances vitality. This discovery does not conflict with the idea that narrower streets are more accessible. Jan Gehl pointed out in “Cities For People” that the scale of streets close to people is below 15 m, and the two are not contradictory. The premise of this discovery is based on research results within the same commercial district. However, it is important to note that excessively narrow streets can lead to congestion and traffic issues, thereby adversely affecting street vitality. Therefore, this correlation underscores a nuanced relationship between street width and vitality; within the specified range, an expansion in street width is likely to boost vitality to some extent [50].
Moreover, within the shop density range of 12% to 22%, there is a negative correlation between shop density and street vitality. Increased shop density tends to diminish street vitality, potentially due to heightened competition among businesses and diminished appeal of individual shops, which collectively detract from the overall street vitality [51].
5.2. Daytime Street Element Selection under Time Characteristics
Focusing solely on time characteristics during daylight hours, there is a noticeable difference in how street elements impact vitality. Specifically, from 12:00 to 17:30, there is a positive correlation between time and street vitality. As the day progresses, the total number of people on the street gradually increases, enhancing vitality more rapidly in conjunction with wider street widths and higher penetration rates of the ground floor interface. Between 16:00 and 17:30, the six streets surveyed reached their peak daytime vitality, with the highest recorded value being 74.7406. Streets that feature higher ground floor interface permeability, diverse store types, and an abundance of tables and chairs tend to attract more people. In the spatial design of commercial pedestrian streets operational during daylight hours, the focus should be on maximizing street width, which shows the fastest growth in vitality, followed by the permeability of the ground floor interface, store variety, and the availability of tables and chairs.
5.3. Nighttime Street Element Selection under Time Characteristics
Considering only the temporal characteristics of nighttime, the impact of various street elements on vitality shows notable differences, with advertising area and store type demonstrating no significant correlation to street vitality. During the hours of 19:00 to 20:30 on non-working nights, street width, store density, ground floor interface permeability, and the presence of tables and chairs emerge as the critical factors influencing vitality. The peak nighttime vitality is observed at a street vitality index of 91.7831, coinciding with the maximum pedestrian count. The contribution of street width to enhancing nighttime vitality is 2.49 times greater than at noon on non-working days, 2.01 times more than on working days, and 2.92 times higher than the impact of tables and chairs. Thus, in designing commercial pedestrian streets with a focus on the nighttime economy, it is advisable to prioritize street width due to its significant influence on vitality. This should be followed by optimizing ground floor interface permeability and the strategic placement of tables and chairs while minimizing the diversity of store types.
6. Conclusions
In this research, a comprehensive dataset of pedestrian trajectories on commercial pedestrian streets was compiled, introducing a people-centric vitality evaluation system aimed at assessing overall street vitality and constructing a dataset with a specific focus on this aspect. This study explores the correlation between spatial vitality and several variables, SD, ST, BP, SW, NC, and BA, to derive a model that accurately quantifies vitality. Experimental findings confirm that the methodology proposed herein accurately evaluates the influence of street design parameters on overall vitality. The vitality quantification model presented shows a higher accuracy in fitting overall vitality than models relying solely on superficial attributes such as pedestrian count and dwell time. This research surpasses traditional observational and behavioral recording techniques, offering a precise assessment of street design elements. The results provide a crucial reference for further quantitative research on the interaction between the environment and human behavior. It should be noted that due to data collection constraints, this study focuses on a 5 min visual technology detection of each street space, limiting the analysis to spatial vitality within this brief timeframe. Future research will extend the analysis to longer periods and explore temporal variations in vitality accuracy.
This research article presents findings aimed at identifying design parameters that influence the vitality of street spaces, offering an innovative methodology for the meticulous design of commercial pedestrian streets. The employed vitality quantification method serves to assess and refine design schemes, aligning with the goal of augmenting architectural design specifications. The developed workflow facilitates real-time evaluation and comparative analysis of spatial vitality in design schemes for commercial pedestrian streets. Importantly, this workflow retains its applicability even when fluctuations occur in the pedestrian traffic on the commercial street.
Author Contributions
Conceptualization, J.Z., W.Z. and H.L.; methodology, W.Z.; software, W.Z.; validation, J.Z., W.Z. and H.L.; formal analysis, W.Z.; investigation, W.Z.; resources, J.Z.; data curation, W.Z.; writing—original draft preparation, J.Z., W.Z., H.L. and R.H.; writing—review and editing, J.Z., W.Z., H.L. and R.H.; visualization, R.H.; supervision, J.Z.; project administration, J.Z.; funding acquisition, W.Z. All authors have read and agreed to the published version of the manuscript.
Funding
This research was funded by Hebei Province social Science Foundation, grant number HB19YS039.
Data Availability Statement
No new data were created or analysed in this study. Data sharing is not applicable to this article.
Conflicts of Interest
The authors declare no conflict of interest.
References
- Gandy, M. Berlin bodies: Anatomizing the streets of the city, by Stephen Barber: London, Reaktion, 2017. J. Urban Aff. 2020, 42, 285–286. [Google Scholar] [CrossRef]
- Leichtle, T.; Taubenböck, H. Urbanization that Hides in the Dark-Spotting China’s “Ghost Neighborhoods” from Space. Landsc. Urban Plan. 2020, 200, 103822. [Google Scholar]
- Döringer, S.; Uchiyama, Y.; Penker, M.; Kohsaka, R. A meta-analysis of shrinking cities in Europe and Japan. Towards an integrative research agenda. Eur. Plan. Stud. 2020, 28, 1693–1712. [Google Scholar] [CrossRef]
- Nia, H.A.N. The role of urban aesthetics on enhancing vitality of urban spaces. Khulna Univ. Stud. 2021, 18, 59–77. [Google Scholar]
- Le Borgne, S. Coping with urban shrinkage: The role of informal social capital in French medium-sized shrinking cities. Eur. Plan. Stud. 2024, 32, 569–585. [Google Scholar] [CrossRef]
- Li, Q.; Cui, C.; Liu, F.; Wu, Q.; Run, Y.; Han, Z. Multidimensional urban vitality on streets: Spatial patterns and influence factor identification using multisource urban data. ISPRS Int. J. Geo-Inf. 2021, 11, 2. [Google Scholar] [CrossRef]
- Bertolini, L. From “streets for traffic” to “streets for people”: Can street experiments transform urban mobility? Transp. Rev. 2020, 40, 734–753. [Google Scholar] [CrossRef]
- Liang, Y.; D’uva, D.; Scandiffio, A.; Rolando, A. The more walkable, the more livable?—Can urban attractiveness improve urban vitality? Transp. Res. Procedia 2022, 60, 322–329. [Google Scholar] [CrossRef]
- Jiang, Y.; Han, Y.; Liu, M.; Ye, Y. Street vitality and built environment features: A data-informed approach from fourteen Chinese cities. Sustain. Cities Soc. 2022, 79, 103724. [Google Scholar] [CrossRef]
- Liu, B.; Qing, L.; Han, L.; Ying, L. Research on Public Space Vitality Representation Based on Space Trajectory Entropy. Landsc. Archit. 2022, 29, 95–101. [Google Scholar] [CrossRef]
- Zhao, K.; Guo, J.; Ma, Z.; Wu, W. Exploring the Spatiotemporal Heterogeneity and Stationarity in the Relationship between Street Vitality and Built Environment. SAGE Open 2023, 13, 21582440231152226. [Google Scholar] [CrossRef]
- Xiana, H. Simulation of pedestrian flow in traditional commercial streets based on space syntax. Procedia Eng. 2017, 205, 1344–1349. [Google Scholar] [CrossRef]
- Yue, W.; Chen, Y.; Zhang, Q.; Liu, Y. Spatial explicit assessment of urban vitality using multi-source data: A case of Shanghai, China. Sustainability 2019, 11, 638. [Google Scholar] [CrossRef]
- Ma, X.; Ma, C.; Wu, C.; Xi, Y.; Yang, R.; Peng, N.; Zhang, C.; Ren, F. Measuring human perceptions of streetscapes to better inform urban renewal: A perspective of scene semantic parsing. Cities 2021, 110, 103086. [Google Scholar] [CrossRef]
- Li, Z.; Sun, X.; Zhao, S.; Zuo, H. Integrating eye-movement analysis and the semantic differential method to analyze the visual effect of a traditional commercial block in Hefei, China. Front. Archit. Res. 2021, 10, 317–331. [Google Scholar] [CrossRef]
- Gan, X.; Huang, L.; Wang, H.; Mou, Y.; Wang, D.; Hu, A. Optimal block size for improving urban vitality: An exploratory analysis with multiple vitality indicators. J. Urban Plan. Dev. 2021, 147, 04021027. [Google Scholar] [CrossRef]
- Wu, W.; Niu, X. Influence of built environment on urban vitality: Case study of Shanghai using mobile phone location data. J. Urban Plan. Dev. 2019, 145, 04019007. [Google Scholar] [CrossRef]
- Sun, Z.; Bell, S.; Scott, I.; Qian, J. Everyday use of urban street spaces: The spatio-temporal relations between pedestrians and street vendors: A case study in Yuncheng, China. Landsc. Res. 2020, 45, 292–309. [Google Scholar] [CrossRef]
- Chen, J.; Tian, W.; Xu, K.; Pellegrini, P. Testing Small-Scale Vitality Measurement Based on 5D Model Assessment with Multi-Source Data: A Resettlement Community Case in Suzhou. ISPRS Int. J. Geo-Inf. 2022, 11, 626. [Google Scholar] [CrossRef]
- Yang, C.; Qian, Z. Street network or functional attractors? Capturing pedestrian movement patterns and urban form with the integration of space syntax and MCDA. Urban Des. Int. 2023, 28, 3–18. [Google Scholar] [CrossRef]
- Li, S.; Ma, S.; Tong, D.; Jia, Z.; Li, P.; Long, Y. Associations between the quality of street space and the attributes of the built environment using large volumes of street view pictures. Environ. Plan. B Urban Anal. City Sci. 2022, 49, 1197–1211. [Google Scholar] [CrossRef]
- Fang, K.; Wang, X.; Chen, L.; Zhang, Z.; Furuya, N. Research on the correlation between pedestrian density and street spatial characteristics of commercial blocks in downtown area: A case study on Shanghai Tianzifang. J. Asian Archit. Build. Eng. 2019, 18, 233–246. [Google Scholar] [CrossRef]
- Hu, X.; Ren, Y.; Tan, Y.; Shi, Y. Research on the Spatial and Temporal Dynamics of Crowd Activities in Commercial Streets and Their Relationship with Formats—A Case Study of Lao Men Dong Commercial Street in Nanjing. Sustainability 2023, 15, 16838. [Google Scholar] [CrossRef]
- Xu, G.; Zhong, L.; Wu, F.; Zhang, Y.; Zhang, Z. Impacts of Micro-Scale Built Environment Features on Tourists’ Walking Behaviors in Historic Streets: Insights from Wudaoying Hutong, China. Buildings 2022, 12, 2248. [Google Scholar] [CrossRef]
- Zhang, L.; Zhang, R.; Yin, B. The impact of the built-up environment of streets on pedestrian activities in the historical area. Alex. Eng. J. 2021, 60, 285–300. [Google Scholar] [CrossRef]
- Li, Y.; Yabuki, N.; Fukuda, T. Exploring the association between street built environment and street vitality using deep learning methods. Sustain. Cities Soc. 2022, 79, 103656. [Google Scholar] [CrossRef]
- Kangyan, D. Impact of Outdoor Store Signboards on Street Vitality: A Case Study of Ximazhuang Street in Nanchang City. J. Landsc. Res. 2020, 12, 105. [Google Scholar] [CrossRef]
- Mu, B.; Liu, C.; Mu, T.; Xu, X.; Tian, G.; Zhang, Y.; Kim, G. Spatiotemporal fluctuations in urban park spatial vitality determined by on-site observation and behavior mapping: A case study of three parks in Zhengzhou City, China. Urban For. Urban Green. 2021, 64, 127246. [Google Scholar] [CrossRef]
- Liu, S.; Lai, S.-Q.; Liu, C.; Jiang, L. What influenced the vitality of the waterfront open space? A case study of Huangpu River in Shanghai, China. Cities 2021, 114, 103197. [Google Scholar] [CrossRef]
- Kim, Y.L. Seoul’s Wi-Fi hotspots: Wi-Fi access points as an indicator of urban vitality. Comput. Environ. Urban Syst. 2018, 72, 13–24. [Google Scholar] [CrossRef]
- Liu, S.; Lai, S. Measurement of Urban Public Space Vitality Based on Big Data. Landsc. Archit. 2019, 26, 24–28. [Google Scholar]
- Zheng, J.; He, J.; Tang, H. The vitality of public space and the effects of environmental factors in Chinese suburban rural communities based on tourists and residents. Int. J. Environ. Res. Public Health 2022, 20, 263. [Google Scholar] [CrossRef]
- Hou, J.; Chen, L.; Zhang, E.; Jia, H.; Long, Y. Quantifying the usage of small public spaces using deep convolutional neural network. PLoS ONE 2020, 15, e0239390. [Google Scholar] [CrossRef]
- Williams, S.; Ahn, C.; Gunc, H.; Ozgirin, E.; Pearce, M.; Xiong, Z. Evaluating sensors for the measurement of public life: A future in image processing. Environ. Plann. B: Urban Anal. City Sci. 2019, 46, 1534–1548. [Google Scholar] [CrossRef]
- Yan, W.; Forsyth, D.A. Learning the behavior of users in a public space through video tracking. In Proceedings of the 2005 Seventh IEEE Workshops on Applications of Computer Vision (WACV/MOTION’05), Breckenridge, CO, USA, 5–7 January 2005; pp. 370–377. [Google Scholar] [CrossRef]
- Niu, T.; Qing, L.; Han, L.; Long, Y.; Hou, J.; Li, L.; Tang, W.; Teng, Q. Small public space vitality analysis and evaluation based on human trajectory modeling using video data. Build. Environ. 2022, 225, 109563. [Google Scholar] [CrossRef]
- Sommer, R. Social Design: Creating Buildings with People in Mind; Prentice Hall Inc.: Upper Saddle River, NJ, USA, 1983. [Google Scholar]
- Moore, R.C.; Cosco, N.G. Using behaviour mapping to investigate healthy outdoor environments for children and families: Conceptual framework, procedures and applications. Innov. Approaches Res. Landsc. Health Open Space People Space 2010, 2, 33–73. [Google Scholar]
- Zordan, M.; Talamini, G.; Villani, C. The Association between Ground Floor Features and Public Open Space Face-To-Face Interactions: Evidence from Nantou Village, Shenzhen. Int. J. Environ. Res. Public Health 2019, 16, 4934. [Google Scholar] [CrossRef]
- Villani, C.; Talamini, G. Pedestrianised streets in the global neoliberal city: A battleground between hegemonic strategies of commodification and informal tactics of commoning. Cities 2021, 108, 102983. [Google Scholar] [CrossRef]
- Villani, C.; Talamini, G. Making Vulnerability Invisible: The Impact of COVID-19 on the Use of Public Space in Hong Kong. J. Plan. Educ. Res. 2023, 1, 16. [Google Scholar] [CrossRef]
- Kang, C.; Fan, D.; Jiao, H. Validating activity, time, and space diversity as essential components of urban vitality. Environ. Plan. B Urban Anal. City Sci. 2021, 48, 1180–1197. [Google Scholar] [CrossRef]
- Xu, Y.; Chen, X. The spatial vitality and spatial environments of urban underground space (UUS) in metro area based on the spatiotemporal analysis. Tunn. Undergr. Space Technol. 2022, 123, 104401. [Google Scholar] [CrossRef]
- Jiang, C.; Cheng, G. The Way of the Ease Traffic Congestion in Commercial Center of Beijing—The Analysis and Research of Level Analyses and Fuzzy Evaluation in Sanlitun Street. In Proceedings of the 22nd International Conference on Industrial Engineering and Engineering Management 2015: Core Theory and Applications of Industrial Engineering (Volume 1); Atlantis Press: Paris, France, 2016; pp. 51–61. [Google Scholar]
- Cohen, J.; Cohen, P.; West, S.G.; Aiken, L.S. Applied Multiple Regression/Correlation Analysis for the Behavioral Sciences; Routledge: New York, NY, USA, 2013. [Google Scholar]
- Wu, W.; Ma, Z.; Guo, J.; Niu, X.; Zhao, K. Evaluating the effects of built environment on street vitality at the city level: An empirical research based on spatial panel Durbin model. Int. J. Environ. Res. Public Health 2022, 19, 1664. [Google Scholar] [CrossRef] [PubMed]
- Eiter, T.; Mannila, H. Computing Discrete Fréchet Distance. Technical Report. 1994. Available online: http://citeseerx.ist.psu.edu/viewdoc/download?doi=10.1.1.90.937&rep=rep1&type=pdf (accessed on 10 March 2024).
- Azemati, S.; Saleh Sedghpour, B. Feasibility study of improving the level of vitality in university open space from the perspective of space users by structural equation modeling method. J. Sustain. Archit. Urban Des. 2021, 9, 215–227. [Google Scholar] [CrossRef]
- Wang, H.; Yang, F.; Liu, L. Comparison and application of standardized regressive coefficient and partial correlation coefficient. J. Q. Tech. Econ. 2006, 9, 150–155. Available online: http://en.cnki.com.cn/Article_en/CJFDTOTAL-SLJY200609016.htm (accessed on 10 March 2024).
- Gehl, J. Cities for People; Island Press: Washington, DC, USA, 2013. [Google Scholar]
- Pons, F.; Giroux, M.; Mourali, M.; Zins, M. The relationship between density perceptions and satisfaction in the retail setting: Mediation and moderation effects. J. Bus. Res. 2016, 69, 1000–1007. [Google Scholar] [CrossRef]
Figure 1.
Workflow of holistic approach.

Figure 2.
Sample data collection plan of sanlitun commercial street in Beijing.

Figure 3.
Schematic diagram of spatial parameters and vitality records for streets.

Figure 4.
Schematic diagram of spatial parameters and vitality records for Street 6.

Figure 5.
Model regression parameter diagrams.


Figure 6.
The effectiveness impact of various street elements on enhancing street vitality at different time periods.
Figure 6.
The effectiveness impact of various street elements on enhancing street vitality at different time periods.


Table 1.
Calculation methods for spatial element indicators of pedestrian streets.
| Spatial Element Indicators | Calculation Method |
|---|---|
| Store density () | The store density value is the ratio of the number of shops () on both sides of the street to the length of the median () line of the street. |
| Store type () | Calculate the type of store by calculating the sales type of the store (). |
| Street width () | The calculation method for street width is the ratio of the total street area () to the median length of the street (), which is the average street width. |
| Bottom permeability () | The calculation method for the permeability of the bottom () interface of the street is the ratio of the glass area along the street () to the facade area (). |
| Number of chairs () | The number of public tables and chairs is recorded through observation and statistics. |
| Billboard area () | The advertising area is calculated by recording the length and width of advertising signs along the street, including street facade advertisements (), independent hanging advertisements (), and advertising signs (). |
Table 2.
Tong Niu’s trajectory-based vitality calculation method.
| Vitality Indicators | Calculation Method |
|---|---|
| Vitality () | The quantitative-indicator-based spatial vitality quantification model proposed by Tong Niu is a street vitality measurement method. The model consists of four quantifications, where num is the number of people in the street space, dur is the residence time of pedestrians, TD is the diversity of pedestrian trajectories, and TC is the complexity of pedestrian trajectories. The calculation method is as follows: |
| Number of people () | The result of the number of people is obtained by recording the number of different trajectories, excluding pedestrians who enter the spatial boundary in a short period of time or travel along the boundary. |
| Duration of the timing () | This article calculates the dwell time by recording the number of trajectory points marked during the trajectory timing. During the measurement process, the trajectory points () are recorded every 5 s, which means the dwell time is equal to the number of trajectory points in a single trajectory multiplied by 5. |
| Trajectory diversity () | Trajectory diversity reflects the structural differences in trajectories; that is, by collecting vector information composed of starting and ending points in a single trajectory, the similarity of its path structure is calculated. Among them, the difference in morphological structure between P (initial point) and Q (stopping point) is TD (P, Q), where trajectory and vectors, and trajectory Q is represented by and vectors. |
| Trajectory complexity () | To calculate the trajectory complexity, the inflection points of each trajectory are extracted, and then their vector differences are extracted by connecting adjacent inflection points. is the complexity of the j-th trajectory, and m is the number of trajectory segment vectors for the j-th trajectory. and are the angle and length differences in the i + 1 trajectory segment vectors of the i-th and j-th trajectory segment vectors, respectively. |
Table 3.
Sanlitun commercial street elements survey form.
| Street Name | Store Density (%) | Store Type | Street Width (m) | Bottom Surface Permeability (%) | Number of Tables and Chairs | Advertising Area |
|---|---|---|---|---|---|---|
| Street 1 | 22 | 2 | 9.26 | 49.5 | 18 | 51 |
| Street 2 | 16.9 | 4 | 5.88 | 53.4 | 33 | 25 |
| Street 3 | 18 | 3 | 10.23 | 53.7 | 14 | 34 |
| Street 4 | 12.4 | 6 | 12.03 | 51.5 | 52 | 15 |
| Street 5 | 16.5 | 1 | 7.86 | 48.2 | 10 | 29 |
| Street 6 | 15.1 | 3 | 7.69 | 53.8 | 24 | 40 |
Disclaimer/Publisher’s Note: The statements, opinions and data contained in all publications are solely those of the individual author(s) and contributor(s) and not of MDPI and/or the editor(s). MDPI and/or the editor(s) disclaim responsibility for any injury to people or property resulting from any ideas, methods, instructions or products referred to in the content. |
© 2024 by the authors. Licensee MDPI, Basel, Switzerland. This article is an open access article distributed under the terms and conditions of the Creative Commons Attribution (CC BY) license (https://creativecommons.org/licenses/by/4.0/).
Share and Cite
MDPI and ACS Style
Zhang, J.; Zhou, W.; Lian, H.; Hu, R. Research on Optimization Strategy of Commercial Street Spatial Vitality Based on Pedestrian Trajectories. Buildings 2024, 14, 1240. https://doi.org/10.3390/buildings14051240
AMA Style
Zhang J, Zhou W, Lian H, Hu R. Research on Optimization Strategy of Commercial Street Spatial Vitality Based on Pedestrian Trajectories. Buildings. 2024; 14(5):1240. https://doi.org/10.3390/buildings14051240
Chicago/Turabian StyleZhang, Jinjiang, Wenyu Zhou, Haitao Lian, and Ranran Hu. 2024. "Research on Optimization Strategy of Commercial Street Spatial Vitality Based on Pedestrian Trajectories" Buildings 14, no. 5: 1240. https://doi.org/10.3390/buildings14051240
Note that from the first issue of 2016, this journal uses article numbers instead of page numbers. See further details here.