
Full-Scale Field Tests on Concrete Slabs Subjected to Close-In Blast Loads
by
 , , , and
María Chiquito
1,*,
Lina M. López
1,
Ricardo Castedo
1,
Anastasio P. Santos
1 and
Alejandro Pérez-Caldentey
2,3 1
E.T.S.I. de Minas y Energía, Universidad Politécnica de Madrid, C/Ríos Rosas, 21, 28003 Madrid, Spain
2
E.T.S.I. de Caminos, Canales y Puertos, Universidad Politécnica de Madrid, C/del Prof. Aranguren, 3, 28040 Madrid, Spain
3
FHECOR Consulting Engineers, C/del Barquillo, 23, 28004 Madrid, Spain
*
Author to whom correspondence should be addressed.
Buildings 2023, 13(8), 2068; https://doi.org/10.3390/buildings13082068
Submission received: 26 July 2023
/
Revised: 11 August 2023
/
Accepted: 12 August 2023
/
Published: 14 August 2023
(This article belongs to the Special Issue Blast Loading and Blast Effect on Building Structures)
Abstract
:This research evaluates the performance of different protective solutions for reinforced concrete slabs subjected to blast loading. A series of full-scale blast tests were carried out on concrete slabs at scaled distances ranging from 0.20 to 0.83 m/kg1/3. For this purpose, 16 concrete slabs were tested; eight of them were unreinforced as ‘control specimens’, and the other eight were protected with five different protective solutions. After the tests, a damage assessment was conducted based on three different parameters. The results showed that there was no clear improvement in the concrete performance when the charge was located 0.5 m from the slab. Significant local damage that completely perforated the slab occurred. In the tests with the load placed 1 m from the slab, the reinforcements that were used significantly contributed to the retention of some fragments produced in these tests.
1. Introduction
Critical infrastructures, chemical plants, and warehouses, as well as the nuclear industry, involve activities that have to be carried out in environments and constructions that require a higher level of protection and security. Among the many threats that they face are explosions, whether of external origin, such as terrorist acts, or of internal origin, such as accidents related to the production process. Strategic lines of action include resilience and security assurance through redundant protection systems in order to prevent and protect critical infrastructures from all threats that may affect them [1,2]. Good protection of structures could mean the difference between a small accident and a major disaster. Improving the response of structures to unpredictable events can reduce much of the damage from such events.
Reinforced concrete (RC) is one of the most common materials used in the construction of all types of structures. It presents many advantages, such as low cost, versatility, durability, fire resistance, and low maintenance. However, when subjected to blast loading, RC structures can be severely damaged, and this may even lead to the collapse of the entire structure.
In the last several decades, there has been considerable research on structural damage and blast effects on buildings and especially on concrete structures [3,4]. To enhance the blast performance of RC structures, two main procedures have been widely used: internal and external strengthening. Internal reinforcement consists of adding fibers inside the concrete mixture. The most common fibers used are steel, polypropylene, and carbon fibers that vary in fiber content and fiber length. Mao et al. [5] concluded that, under far-field blast loading, steel fibers and reinforcement bars have similar effects by providing extra resistance to RC panels. Tabatabaei et al. [6] studied the effect of introducing carbon fibers to improve the blast resistance of concrete panels and observed a reduction in the degree of cracking. Pantelides et al. [7] tested small-scale concrete panels reinforced with polypropylene fibers. The result was that the fibers performed poorly, since they could not resist the blast effects. On the contrary, Foglar and Kovac [8] found a beneficial effect of adding polypropylene fibers on the blast performance of their specimens. Recent studies, such as the one carried out by Wang et al. [9], showed that the addition of various admixtures, such as fly ash, fiber, and MgO, and shrinkage reduction might improve the mechanical properties and, hence, the strength of concrete slabs. The main disadvantage of this procedure is that it can only be used on new structures. Regarding external reinforcement, different techniques have been proposed to improve the blast resistance of RC structures. One of these techniques is the use of external or sacrificial layers of aluminum foam. The studies conducted by Schenker et al. [10] and Wu et al. [11] showed that aluminum foam modified the response of concrete slabs and was effective in mitigating blast effects. Merrett et al. [12] found that aluminum foam was also acceptable by not increasing stress transfer to the protective structure. Another technique consists of strengthening with fiber-reinforced polymer (FRP) composites; the most commonly used fibers are glass [13] and carbon [14]. In recent years, the use of sprayed-on polyurea coatings has increased [15,16,17] due to the enhancement of ductility that polyurea provides to the structural response.
The blast performance of protective solutions should be evaluated through experimental tests. However, the number of facilities available to carry out such experiments is limited. Furthermore, testing with explosives is very complex and highly costly. To address some of these problems, many experimental tests are conducted on a small scale [18,19,20]. In these scenarios, the results cannot be extrapolated to real-sized structures, as the behavior of the specimens is greatly affected by the scale effect. In other cases, numerical methods, such as the finite element method (FEM), are used to predict the structural response in comparison with empirical equations [21,22] or with experimental data found in the literature [23,24]. Although numerical modeling is a very useful tool when it comes to the blast resistance of structures, it is necessary to validate the results with corresponding field tests.
Since experimental studies are very valuable in the field of structural protection research, this work focuses on the description and analysis of two field test campaigns. The performance of different potential protective solutions for use in reinforced concrete subjected to blast loading was investigated. The different reinforcement solutions that were used included both internal and external reinforcement. For this purpose, a series of full-scale blast tests were carried out. A total of 16 RC slabs were tested, of which eight were unreinforced (as control specimens), and the other eight were reinforced with five different protective solutions. The overall goal of the research was to establish and validate the improvement of the tested reinforcement solutions for enhancing the performance of critical concrete structures subjected to blast loading. After the tests, a damage assessment considering three different parameters was carried out: the surface damage, the relative area of damage, and the permanent deflections. In addition, the data obtained from these tests can subsequently be used to calibrate and validate numerical models that could then be used to explore other situations for which no tests have been performed.
2. Field Blast Tests
The experimental tests presented in this work were carried out in two different research projects (SEGTRANS and PICAEX), but both had the same objective, which was related to the protection of critical infrastructures. A total of 16 reinforced concrete slabs were tested by using different protective solutions—eight of them in the first project (identified as S1 to S8) and the other eight in the second project (identified as P1 to P8). The test specimens were designed with a representative size to avoid the scale effect; they had dimensions of 4.40 × 1.46 m and a thickness of 0.15 m. The slabs were built by using concrete of class C25/30, with an aggregate size of 20 mm and a water/cement ratio of 0.60. This type of concrete is expected to achieve a minimum compressive strength of 25 MPa. As for the reinforcing steel, B500C rebar with a yield strength of 500 MPa was used. Regarding the steel reinforcement, slabs S1 to S8 were reinforced with two meshes of bars that were 12 mm in diameter and spaced 150 mm in both directions with a concrete cover of about 30 mm on both faces. In the case of slabs P1 to P8, the upper face (which was the one receiving the explosion) was reinforced with a mesh of 10 mm bars spaced 300 mm in both directions, while the bottom face was reinforced with a mesh of 12 mm bars spaced 150 mm in both directions. In both projects, two charge masses of TNT equivalent were tested at two standoff distances, resulting in three different scaled distances, as shown in Table 1. The tests with the higher scaled distances (0.79–0.83 m/kg1/3) were intended as calibration tests for characterizing the explosion by measuring the pressure and acceleration. The tests with smaller scaled distances (0.20–0.42 m/kg1/3) were intended to compare the effects of the different protective solutions. To analyze the improvements of different retrofitting materials, a non-reinforced slab was tested as a ‘control slab’ at the different scaled distances.
Regarding the boundary conditions, the concrete slabs were supported on two steel-clad concrete blocks designed to withstand repeated explosions. The span between supports was 4.00 m. The anchoring system was intended to simulate a supported slab with fixed supports. Figure 1 shows a scheme of the concrete slab with its main dimensions and the details of the boundary conditions.
2.1. Protective Solutions
In the SEGTRANS project, three different reinforcement solutions were tested (Figure 2):
- Slab S6: A steel sheet (SS) made of S-275 JR steel was located at the center of the span on the side facing the blast charge, with dimensions of 1.50 × 1.46 m and a thickness of 10 mm. The steel sheet was fixed by using an epoxy adhesive.
- Slab S7: The concrete used in this slab was a steel-fiber-reinforced concrete (SFRC) with a fiber content of 120 kg/m3.
- Slab S8: The concrete used in this slab was a polypropylene-fiber-reinforced concrete (PPFRC) with a fiber content of 9 kg/m3.
In the PICAEX project, two other protective solutions (Figure 3) were tested:
- Slabs P3 and P5: These slabs were protected with a glass-fiber-reinforced polymer (GFRP) composed of a bi-directional primed glass-fiber-reinforcing sheet with a one-component ready-to-use water and polyurethane-based adhesive. In this case, the GFRP was placed on the side of the slab that was not facing the explosive charge, which was the face where the tensile stresses occurred.
- Slabs P4, P6, and P8: These slabs were protected by using a carbon-fiber-reinforced polymer (CFRP) composed of a high-strength carbon fiber mesh with a thixotropic epoxy adhesive. As in the GFRP, the protected solution was placed on the tensile face of the slabs.
The main mechanical properties of the protective solutions are listed in Table 2.
2.2. Test Setup and Monitoring
As mentioned above, the tests with the higher scaled distance were designed to evaluate and characterize the blast waves. For this purpose, the tests were monitored with pressure gauges and accelerometers. The number of pressure sensors used varied between two and five depending on the test. Pressure transducers were located at the same level as the top surface of the slab. The pressure gauges had a high frequency with ablative protection and a range of 5000 psi (34.5 MPa). As can be seen in Figure 4, the sensors were located within radii of 1 m and 2 m from the center of the slab and at distances of 1.4 m and 2.2 m from the charge, respectively. In addition, a fifth sensor was located on the ground at eight meters from the charge in the horizontal direction.
To measure accelerations in the slab, two or three accelerometers (depending on the test) were located on the rear face of the slab, with one of them in the center of the slab and the other two 1 m from the center (see Figure 4). In the tests with smaller scaled distances, accelerometers were not used due to the risk of damaging the sensors. To register the shockwave in these tests, pressure gauges were placed on the ground at standoff distances of between 8 and 12 m, as shown in Figure 5.
For slabs S1 to S8, the explosive used in the experimental trials was PG2, an RDX-based plastic explosive for military use with a TNT equivalence calculated on the basis of an experimental pressure of 1.16. For slabs P1 to P8, the explosive used was dynamite (gelatin type), with a TNT equivalence that was also calculated based on peak pressure of 0.87. The charge mass was placed on an expanded polystyrene cube when the standoff distance was 0.5 m and was hung from a rope or a wooden tripod when the standoff distance was 1 m (see Figure 6). Regarding the charge’s shape, it was a spherical shape for lighter loads and cubic with round corners for the others. The explosive was initiated in all cases with a detonator that was inserted into the center of the charge.
In addition to all the instrumentation, the tests were recorded with a high-speed camera. Since an explosive event is a phenomenon with a very short duration, the images obtained with the high-speed camera (Figure 7) provided valuable information about the event. For instance, it was verified in the high-speed camera images that the shockwaves of both charge shapes (spherical and cubic) were similar in terms of pressure distribution.
3. Test Results
To analyze the results of the different tests and the improvements of the different reinforcement solutions, it was necessary to first evaluate the blast effects on the non-reinforced specimens. Although the slabs were tested in two different projects, the geometry was the same in all cases so that they could be analyzed together.
3.1. Non-Reinforced Slabs
Of the 16 slabs tested, eight of them were non-reinforced, and of those eight, four were used in calibration tests that were carried out with a light load, i.e., 1.74–2 kg of TNT equivalent. The result in these cases was only minor cracks, which were mainly in the tensile face of the slabs. As an example, Figure 8 shows the images of slab P1 after a test. The results of these tests were used for the subsequent calibration of the numerical models [14,25,26], as pressure and acceleration data were available for these tests. However, numerical simulation is not within the scope of this work, so the models that were used will not be described here.
The recording of the pressures during the tests allowed the characterization of the shockwaves and the evaluation of the pressures to which the slabs were subjected. In the calibration tests, a pressure of 2500 kPa was recorded on the pressure gauge located 1 m from the load, and a pressure of 500 kPa was recorded on that located 2 m from it. The recorded pressures were then used to include the load in the subsequent test simulation. Figure 9 shows the pressure–time histories obtained in tests S1, S2, and S3 on pressure gauges G1 and G3 (1 and 2 m from the load, respectively).
Figure 10 shows the acceleration recordings obtained by sensors A1 and A2 during the P1 test. Peak accelerations ranging from −629 g to 997 g were observed. These acceleration values were also used for the comparison and subsequent calibration of the numerical simulation models.
After the calibration tests, the non-reinforced slabs were tested with a greater charge at standoff distances of 0.5 and 1 m. The different behaviors of the slabs between the two distances can be seen in Figure 11. When the charge was located 0.5 m from the slab, local damage was observed due to a punching failure. On the contrary, when the charge was located 1 m from the slab surface, a bending failure occurred at the central part of the slab. In this case, the resistance mechanism of the anchored slab corresponded to a membrane mechanism. In the most stressed section, the concrete fails, but the reinforcement, if properly anchored, allows the formation of a resistance mechanism, as shown in Figure 11b. The strength is limited only by the deformation capacity of the reinforcement, which, in turn, limits the value of the deflection.
3.2. Reinforced Slabs
Different protective solutions were tested with the aim of reducing the damage to the reinforced concrete slabs. In the SEGTRANS project, the three reinforced slabs were tested with a charge of 15 kg TNT eq. at 0.5 m.
3.2.1. Slab S6: Protected with a Steel Sheet
The use of a steel sheet facing the explosive charge as a protective solution resulted in much greater damage than that of the unreinforced slab. Figure 12 shows how the slab was completely bent and rested on the ground. Under the steel plate, the crater generated by the detonation was larger than that formed in the unreinforced slabs, covering the entire central part of the slab.
It was shown that this type of protection was not effective against close-in explosive charges, at least in the form used here. Instead of dissipating energy, the steel plate in this case acted as an amplifier of the shock wave, concentrating all of the damage in the central part of the slab. Perhaps if the steel plate had retrofitted the entire surface of the slab, the behavior would have been different.
3.2.2. Slabs S7 and S8: Protected with Fiber-Reinforced Concrete
Slabs S7 and S8 were constructed with fiber-reinforced concrete. In the case of S7, the fibers used were steel, and for S8, they were polypropylene. The results were very similar in both cases, as shown in Figure 13. The protective solutions did not prevent a punching failure in the slab. However, the inclusion of the fibers in the concrete resulted in a considerable increase in both the tensile and compressive strength, as shown in Table 2. While the compressive strength of the concrete was 25 MPa, in these cases, the values were higher than 40 MPa. The tensile strength achieved was 8.12 MPa for the SFRC and 5.62 MPa for the PPFRC, while the mean value for a plane concrete C25/30 would be around 2.6–2.9 MPa [27]. This increase in strength and, particularly, in tensile strength could mean that the reinforcement may be effective for blast loads that are not so close to the concrete slab.
Based on the SEGTRANS project, it could be determined that none of the reinforcements used were effective when the blast load was located 0.5 m from the concrete slab. Therefore, in the PICAEX project, the protective solutions used were tested with the explosive charge placed at 0.5 and 1 m from the concrete slab to evaluate the differences.
3.2.3. Slabs P3 and P5: Protected with GFRP
As in the previous cases, the GFRP failed to retain the fragments when the charge was located 0.5 m from the concrete slab (Figure 14a). It can be seen how the GFRP was broken and peeled off in the central part of the slab. However, when the charge was located at 1 m (Figure 14b), the behavior of the slab slightly improves with respect to the unreinforced specimen. In this case, the permanent deflection was smaller and there was no debris due to the fiber sheet.
3.2.4. Slabs P4, P6, and P8: Protected with CFRP
The last reinforcement that was tested was a carbon fiber mesh. There were two tests with the charge located 1 m from the slab (Figure 15). In these cases, the behavior was similar to that of the unreinforced slab, but with less deflection in the central part. In the case of test P6 (Figure 15a), the carbon fiber was torn and some debris was found on the ground. As for test P8 (Figure 15b), the fiber managed to retain the fragments.
Regarding the test with the charge located 0.5 m from the slab (P4), local failure was not avoided in this case either.
The tests of the PICAEX project showed that the reinforcement would only be effective as long as the rupture strain of the reinforcement was not reached, which limited the deflection capacity of the element. Once the reinforcement broke, the slab behaved as a reinforced concrete slab. As the reinforcement material was linearly elastic, it would also not have the capacity to absorb energy, and after breaking, it would simply transmit the previously stored strain energy to the slab; this additional load would have to be absorbed by the membrane mechanism through a sudden deflection.
4. Damage Analysis
Different parameters were analyzed to evaluate the damage to the concrete slabs. The objective was to establish a classification according to the levels of damage obtained, as well as to draw conclusions about the improvements introduced by the reinforcement materials used in the tests. The parameters considered were the surface damage (based on the rebound hammer), the relative area of damage, and, in some cases, the permanent deflections.
To analyze the surface damage, a methodology based on the rebound principle with a Schmidt hammer was used. A whole description of the methodology is included in the study by López et al. [28]. The objective was to find variations in the rebound number. The rebound number was measured at 19 different (previously determined) locations on the top surface of the concrete slab (Figure 16). In turn, each measurement point was defined with a template containing twelve points. Six of these points were used for evaluation before (obtaining the value of their median QB), and the other six were used to obtain the median after the explosion (QA). Then, it was checked whether there were statistically significant differences between the values from before and after by applying the one-tiled Wilcoxon rank-sum test. A p-value of less than 0.05 showed a decrease in the rebound number; therefore, there was a decrease in the quality of the material. A p-value of greater than 0.05 meant that there was no damage. Damage was defined as follows [28]:
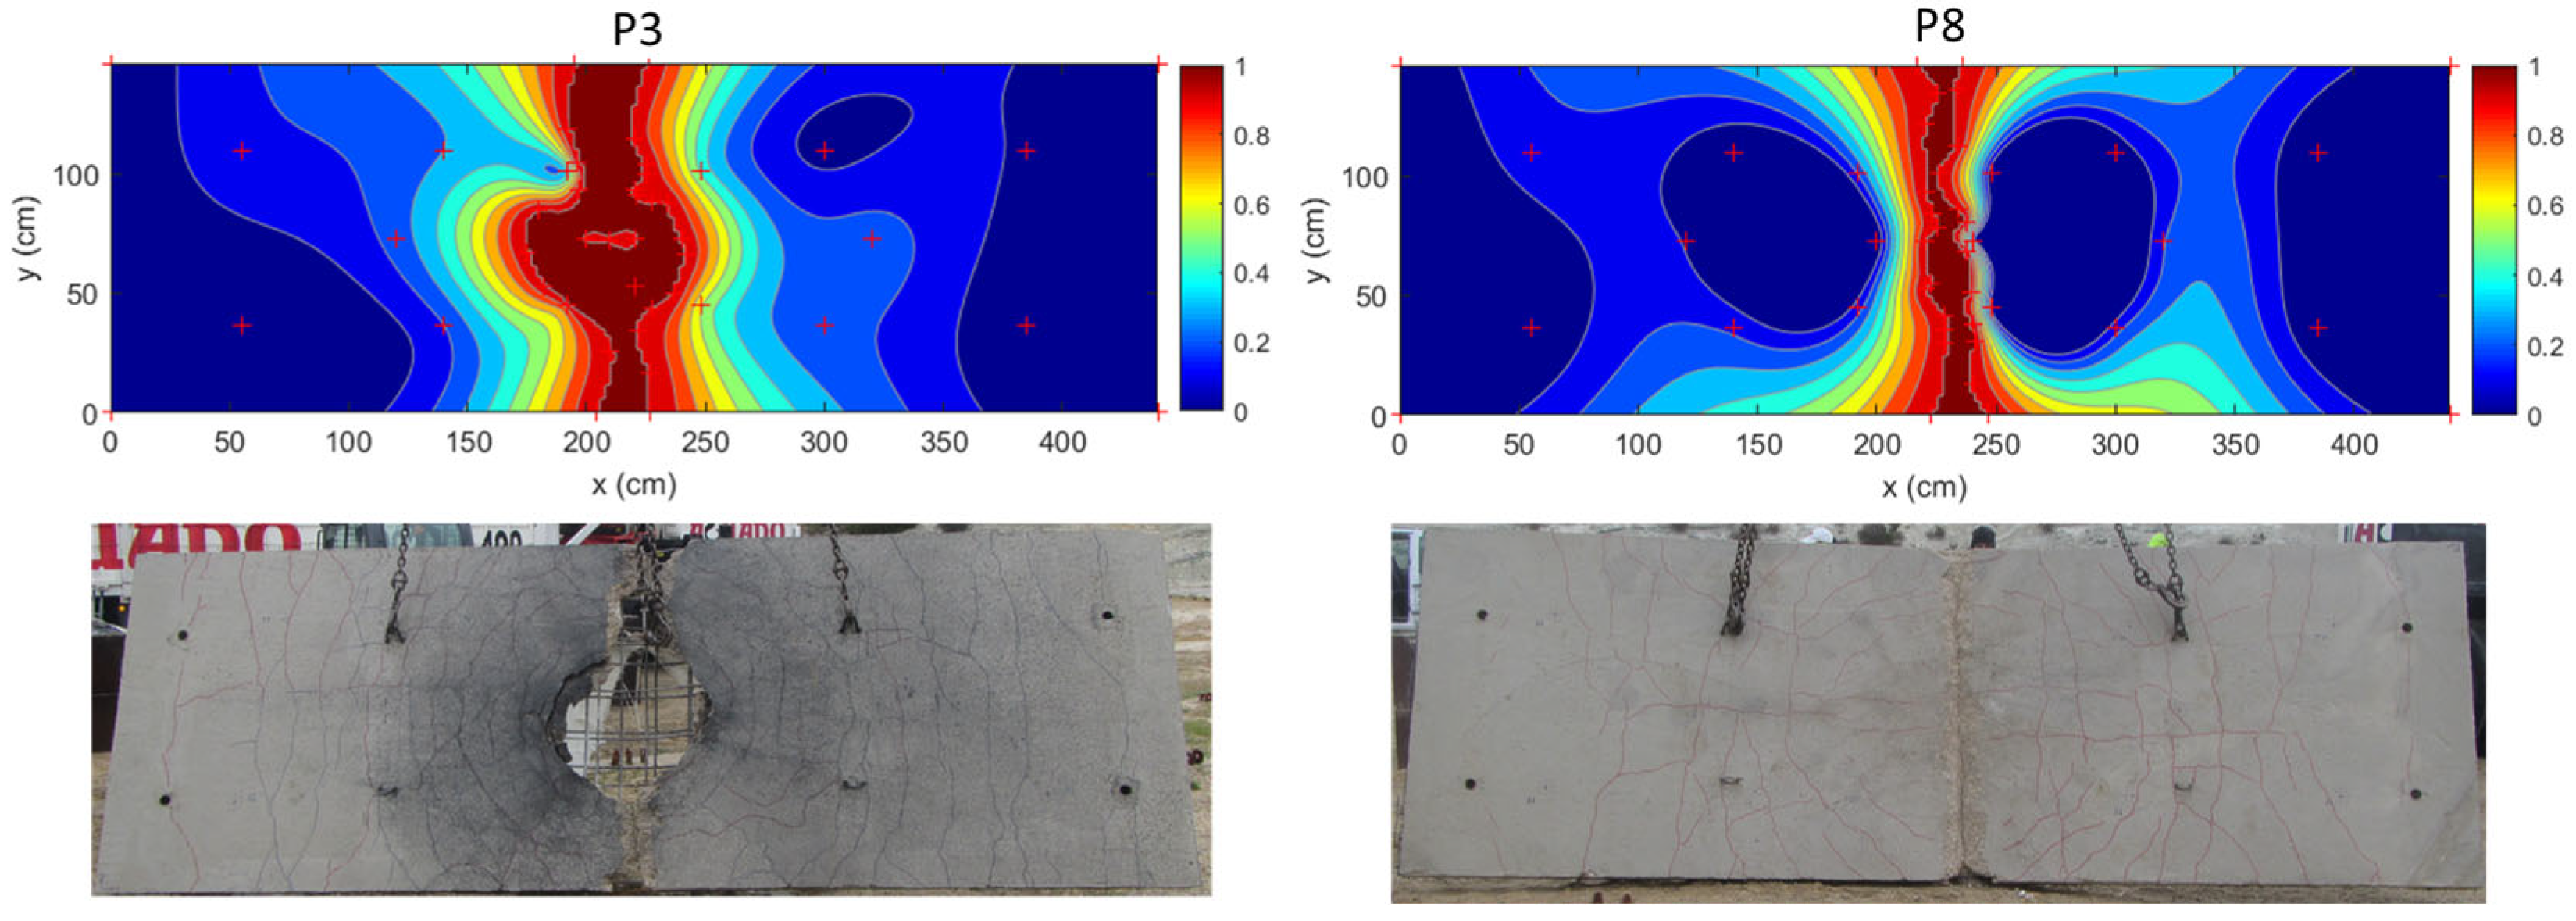
where Q1 and Q2 refer to the mean of the six values before and after the test, respectively. The damage values ranged from 0 for a ‘no damage’ point to 1 for a ‘total damage’ point. Finally, to obtain an index for comparing the surface damage on the slabs, a grid of 200 uniformly spaced points was created to interpolate the damage values obtained. The surface damage index (d200) can be defined as the mean of the interpolated values.
In addition to the surface damage index, damage maps were created. The damage maps provide an idea of the final state of the slabs and the surface damage caused by the explosion. Example of these maps are shown in Figure 17 for slabs P3 (unreinforced) and P8 (reinforced with CFRP).
The damage area (dA) was used to rank each specimen’s behavior in the blasting tests. In this research and for field data, it was defined as the ratio of the spalled area (surface with total damage) to the initial surface of the specimen based on visual inspection but not in damage maps (or Schmidt hammer data).
Regarding permanent deflections, they were measured only in the tests of the PICAEX project.
5. Results and Discussion
Since the loading conditions are not the same for all tests, the results were generally not comparable, but a comparison had to be made between the slabs under the same conditions. Although tests with light charges (1.74–2 kg of TNT eq.) are included in the results, there was no damage in these cases. For tests with greater charges (13.05–15 kg of TNT eq.), the results can be compared for the two different standoff distances used (0.5 and 1 m).
Table 3 shows the results of the surface damage index d200 for all slabs. Looking at these data, it can be concluded that the reinforcements that were used did not provide any improvements with respect to the unreinforced slabs. However, this is logical, as this parameter is intended for the assessment of damage below the surface and, in the PICAEX project, all of the reinforcements were located on the side opposite to that on which the parameter was evaluated. Regarding the SEGTRANS project, the inclusion of fibers in the concrete did not affect the surface damage. Looking at the tests where the blast loading was located at a height of 0.5 m, the d200 index was between 27 and 30%. In the case of the tests with the charge located at 1 m, the results were around 17–21%, which shows the consistency of the results obtained with this methodology.
The damage areas (dA) are also shown in Table 3. Looking at the results provided by this parameter, it can be seen that the differences were also minimal, and it was not possible to establish a percentage of improvement for any of the reinforcements tested. In all cases, this parameter was around 7–8% for the tests with the blast loading at a standoff distance of 0.5 m and around 3–5% for the tests with a standoff distance of 1 m. Only in the case of slab S6, which was protected with a steel sheet, was it clear that the reinforcement that was used led to a worse result, as the damaged area was significantly greater (22%) than those obtained with the other reinforcements, and it was even greater than that obtained with the unreinforced concrete slabs.
The third parameter analyzed was measured only in the slabs of the PICAEX project. Table 3 shows the deflection results obtained for these slabs in cm. As can be seen, the results of the deflections were almost halved when the distance of the explosive was increased from 0.5 m to 1 m. The differences in the results do not allow a clear improvement to be established in this case either, but differences due to the effects of the reinforcements could be observed. In the case of the tests with the blast loading at 0.5 m (P2 to P4), the shockwave penetrated the slab, detaching the concrete fragments between the reinforcement steel bars, which meant that the slab did not develop a membrane mechanism. Since the reinforcement did not prevent the formation of a crater and the detachment of fragments, no improvement over the reinforcement could be seen at such a small scaled distance. However, when the charge was placed at a distance of 1 m, a membrane effect could be observed. In this case, it could be seen that the unreinforced slab had a deflection of 34 cm in comparison with the 23.20 cm deflection measured in the case of the carbon fiber reinforcement. This 12 cm difference can be attributed to an improvement introduced by the CFRP reinforcement. This type of protective solution provided extra stiffness, which prevented the bending of the element or, as in the case of the slabs, significantly reduced this bending. In the case of GFRP, it could be seen that the deflection measured in test P5 (32.50 cm) was practically the same as that of the unreinforced slab (34 cm). The GFRP broke due to the tensile effect of the slab. When the fiber broke, it stopped performing its retaining function, thus making the results with this slab comparable to those of an unreinforced slab. It should also be noted that the bonding of the GFRP was not strong enough and that it suffered partial debonding during the test.
6. Conclusions
A series of blast tests were carried out on concrete slabs at full scale to investigate the performance of different protective solutions when subjected to blast loading. For this purpose, 16 concrete slabs were tested—eight of them were unreinforced as ‘control specimens’, and the other eight were protected with five different protective solutions. For the two tested standoff distances, different results were obtained:
- With the explosive charge at 0.5 m from the slab, significant local damage occurred, perforating the slab completely. In these cases, the reinforcements tested did not provide any additional protection, as the slabs were perforated, and they did not contribute to the retention of fragments.
- In the tests with the load at 1 m, the failure mode of the slab was different, with smaller deflections and no complete penetration. The reinforcements that were used significantly contributed to the retention of some fragments that were produced in these tests, and permanent deflections were reduced.
After analyzing the different parameters that were measured to evaluate the damage caused by the explosions, it was concluded that it could not be established if the different protective solutions improved any of the resistance capacities of the concrete slabs. However, some findings might be highlighted:
- The difference in deflection found in the slab with carbon fiber mesh reinforcement with respect to the slab without reinforcement was considered to be very positive, and it would be worth further study in future projects to consider this type of reinforcement.
- The addition of steel and polypropylene fibers to the concrete improves its mechanical properties—mainly its tensile strength. This fact, which does not improve in the event of close-in explosions, could be tested at other scaled distances in order to compare the results.
- On the contrary, the use of a steel plate as a protective solution produces a higher level of damage than that with an unreinforced slab.
Author Contributions
Conceptualization, L.M.L., M.C. and A.P.-C.; methodology, M.C., L.M.L. and R.C.; software, R.C. and A.P.S.; validation, R.C. and A.P.S.; formal analysis, M.C.; investigation, L.M.L.; writing—original draft preparation, M.C. and L.M.L.; writing—review and editing, R.C., A.P.S. and A.P.-C.; project administration, L.M.L.; funding acquisition, A.P.-C. All authors have read and agreed to the published version of the manuscript.
Funding
This research was funded by the Center for Industrial Technological Development (CDTI), an agency of the Spanish Government.
Data Availability Statement
Data will be made available on request.
Acknowledgments
This research was conducted under the SEGTRANS and PICAEX projects We would like to thank all of the people from FHECOR, MAPEI, TAPUSA, EUROESTUDIOS, KV Consultores, and SACYR who contributed to the design and execution of the tests. We also thank the staff in La Marañosa (ITM-INTA) for their help at the testing site.
Conflicts of Interest
The authors declare no conflict of interest.
References
- Kosal, M.E. Terrorism Targeting Industrial Chemical Facilities: Strategic Motivations and the Implications for U.S. Security 2017, 30, 41–73. [Google Scholar] [CrossRef]
- Zhu, R.; Li, X.; Hu, X.; Hu, D. Risk Analysis of Chemical Plant Explosion Accidents Based on Bayesian Network. Sustainability 2020, 12, 137. [Google Scholar] [CrossRef] [Green Version]
- Draganić, H.; Gazić, G.; Varevac, D. Experimental Investigation of Design and Retrofit Methods for Blast Load Mitigation—A State-of-the-Art Review. Eng. Struct. 2019, 190, 189–209. [Google Scholar] [CrossRef]
- Goswami, A.; Adhikary, S. Das Retrofitting Materials for Enhanced Blast Performance of Structures: Recent Advancement and Challenges Ahead. Constr. Build. Mater. 2019, 204, 224–243. [Google Scholar] [CrossRef]
- Mao, L.; Barnett, S.; Begg, D.; Schleyer, G.; Wight, G. Numerical Simulation of Ultra High Performance Fibre Reinforced Concrete Panel Subjected to Blast Loading. Int. J. Impact Eng. 2014, 64, 91–100. [Google Scholar] [CrossRef] [Green Version]
- Tabatabaei, Z.S.; Volz, J.S.; Baird, J.; Gliha, B.P.; Keener, D.I. Experimental and Numerical Analyses of Long Carbon Fiber Reinforced Concrete Panels Exposed to Blast Loading. Int. J. Impact Eng. 2013, 57, 70–80. [Google Scholar] [CrossRef]
- Pantelides, C.P.; Garfield, T.T.; Richins, W.D.; Larson, T.K.; Blakeley, J.E. Reinforced Concrete and Fiber Reinforced Concrete Panels Subjected to Blast Detonations and Post-Blast Static Tests. Eng. Struct. 2014, 76, 24–33. [Google Scholar] [CrossRef] [Green Version]
- Foglar, M.; Kovar, M. Conclusions from Experimental Testing of Blast Resistance of FRC and RC Bridge Decks. Int. J. Impact Eng. 2013, 59, 18–28. [Google Scholar] [CrossRef]
- Wang, L.; Guo, F.; Yang, H.; Wang, Y.A.N.; Tang, S. Comparison of Fly Ash, PVA Fiber, MGO and Shrinkage-Reducing Admixture on the Frost Resistance of Face Slab Concrete via Pore Structural and Fractal Analysis. Fractals 2021, 29, 2140002. [Google Scholar] [CrossRef]
- Schenker, A.; Anteby, I.; Gal, E.; Kivity, Y.; Nizri, E.; Sadot, O.; Michaelis, R.; Levintant, O.; Ben-Dor, G. Full-Scale Field Tests of Concrete Slabs Subjected to Blast Loads. Int. J. Impact Eng. 2008, 35, 184–198. [Google Scholar] [CrossRef]
- Wu, C.; Huang, L.; Oehlers, D.J. Blast Testing of Aluminum Foam–Protected Reinforced Concrete Slabs. J. Perform. Constr. Facil. 2011, 25, 464–474. [Google Scholar] [CrossRef]
- Merrett, R.P.; Langdon, G.S.; Theobald, M.D. The Blast and Impact Loading of Aluminium Foam. Mater. Des. 2013, 44, 311–319. [Google Scholar] [CrossRef]
- Ghani Razaqpur, A.; Tolba, A.; Contestabile, E. Blast Loading Response of Reinforced Concrete Panels Reinforced with Externally Bonded GFRP Laminates. Compos. B Eng. 2007, 38, 535–546. [Google Scholar] [CrossRef]
- Reifarth, C.; Castedo, R.; Santos, A.P.; Chiquito, M.; López, L.M.; Pérez-Caldentey, A.; Martínez-Almajano, S.; Alañon, A. Numerical and Experimental Study of Externally Reinforced RC Slabs Using FRPs Subjected to Close-in Blast Loads. Int. J. Impact Eng. 2021, 156, 103939. [Google Scholar] [CrossRef]
- Greene, C.E.; Myers, J.J. Flexural and Shear Behavior of Reinforced Concrete Members Strengthened with a Discrete Fiber-Reinforced Polyurea System. J. Compos. Constr. 2013, 17, 108–116. [Google Scholar] [CrossRef]
- Carey, N.L.; Myers, J.J.; Asprone, D.; Menna, C.; Prota, A. Polyurea Coated and Plane Reinforced Concrete Panel Behavior under Blast Loading: Numerical Simulation to Experimental Results. Trends Civ. Eng. Archit. 2018, 1, 87–98. [Google Scholar] [CrossRef]
- Santos, A.P.; Chiquito, M.; Castedo, R.; López, L.M.; Gomes, G.; Mota, C.; Fangueiro, R.; Mingote, J.L. Experimental and Numerical Study of Polyurea Coating Systems for Blast Mitigation of Concrete Masonry Walls. Eng. Struct. 2023, 284, 116006. [Google Scholar] [CrossRef]
- Wang, W.; Zhang, D.; Lu, F.; Wang, S.C.; Tang, F. Experimental Study and Numerical Simulation of the Damage Mode of a Square Reinforced Concrete Slab under Close-in Explosion. Eng. Fail. Anal. 2013, 27, 41–51. [Google Scholar] [CrossRef]
- Zhao, C.F.; Chen, J.Y. Damage Mechanism and Mode of Square Reinforced Concrete Slab Subjected to Blast Loading. Theor. Appl. Fract. Mech. 2013, 63–64, 54–62. [Google Scholar] [CrossRef]
- Thiagarajan, G.; Kadambi, A.V.; Robert, S.; Johnson, C.F. Experimental and Finite Element Analysis of Doubly Reinforced Concrete Slabs Subjected to Blast Loads. Int. J. Impact Eng. 2015, 75, 162–173. [Google Scholar] [CrossRef]
- Tai, Y.S.; Chu, T.L.; Hu, H.T.; Wu, J.Y. Dynamic Response of a Reinforced Concrete Slab Subjected to Air Blast Load. Theor. Appl. Fract. Mech. 2011, 56, 140–147. [Google Scholar] [CrossRef]
- Zhao, C.F.; Chen, J.Y.; Wang, Y.; Lu, S.J. Damage Mechanism and Response of Reinforced Concrete Containment Structure under Internal Blast Loading. Theor. Appl. Fract. Mech. 2012, 61, 12–20. [Google Scholar] [CrossRef]
- Lin, X.; Zhang, Y.X.; Hazell, P.J. Modelling the Response of Reinforced Concrete Panels under Blast Loading. J. Mater. Des. 2014, 56, 620–628. [Google Scholar] [CrossRef]
- Jayasooriya, R.; Thambiratnam, D.P.; Perera, N.J.; Kosse, V. Blast and Residual Capacity Analysis of Reinforced Concrete Framed Buildings. Eng. Struct. 2011, 33, 3483–3495. [Google Scholar] [CrossRef]
- Castedo, R.; Segarra, P.; Alañon, A.; Lopez, L.M.; Santos, A.P.; Sanchidrian, J.A. Air Blast Resistance of Full-Scale Slabs with Different Compositions: Numerical Modeling and Field Validation. Int. J. Impact Eng. 2015, 86, 145–156. [Google Scholar] [CrossRef]
- Castedo, R.; Santos, A.P.; Alañón, A.; Reifarth, C.; Chiquito, M.; López, L.M.; Martínez-Almajano, S.; Pérez-Caldentey, A. Numerical Study and Experimental Tests on Full-Scale RC Slabs under Close-in Explosions. Eng. Struct. 2021, 231, 111774. [Google Scholar] [CrossRef]
- EN 1992-1-1; Eurocode 2: Design of Concrete Structures—Part 1-1: General Rules and Rules for Buildings. CEN: Brussels, Belgium, 2004.
- López, L.M.; Castedo, R.; Chiquito, M.; Segarra, P.; Sanchidrián, J.A.; Santos, A.P.; Navarro, J. Post-Blast Non-Destructive Damage Assessment on Full-Scale Structural Elements. J. Nondestr. Eval. 2019, 38, 30. [Google Scholar] [CrossRef]
Figure 1.
Main dimensions of the concrete slab and details of the boundary conditions: (a) concrete slab layout; (b) anchorage detail; (c) photo of the experimental setup before the test.
Figure 1.
Main dimensions of the concrete slab and details of the boundary conditions: (a) concrete slab layout; (b) anchorage detail; (c) photo of the experimental setup before the test.

Figure 2.
(a) Steel sheet; (b) steel fibers; (c) polypropylene fibers.

Figure 3.
(a) Slab protected with CFRP; (b) slab protected with GFRP.
Figure 4.
Test setup for the calibration test.
Figure 5.
Test setup for test with 15 kg of TNT.
Figure 6.
Charge details for the different tests.

Figure 7.
Image sequence of the high-speed camera during test S4 (15 kg eq. TNT at 1 m).
Figure 8.
Images of the result of the P1 test.
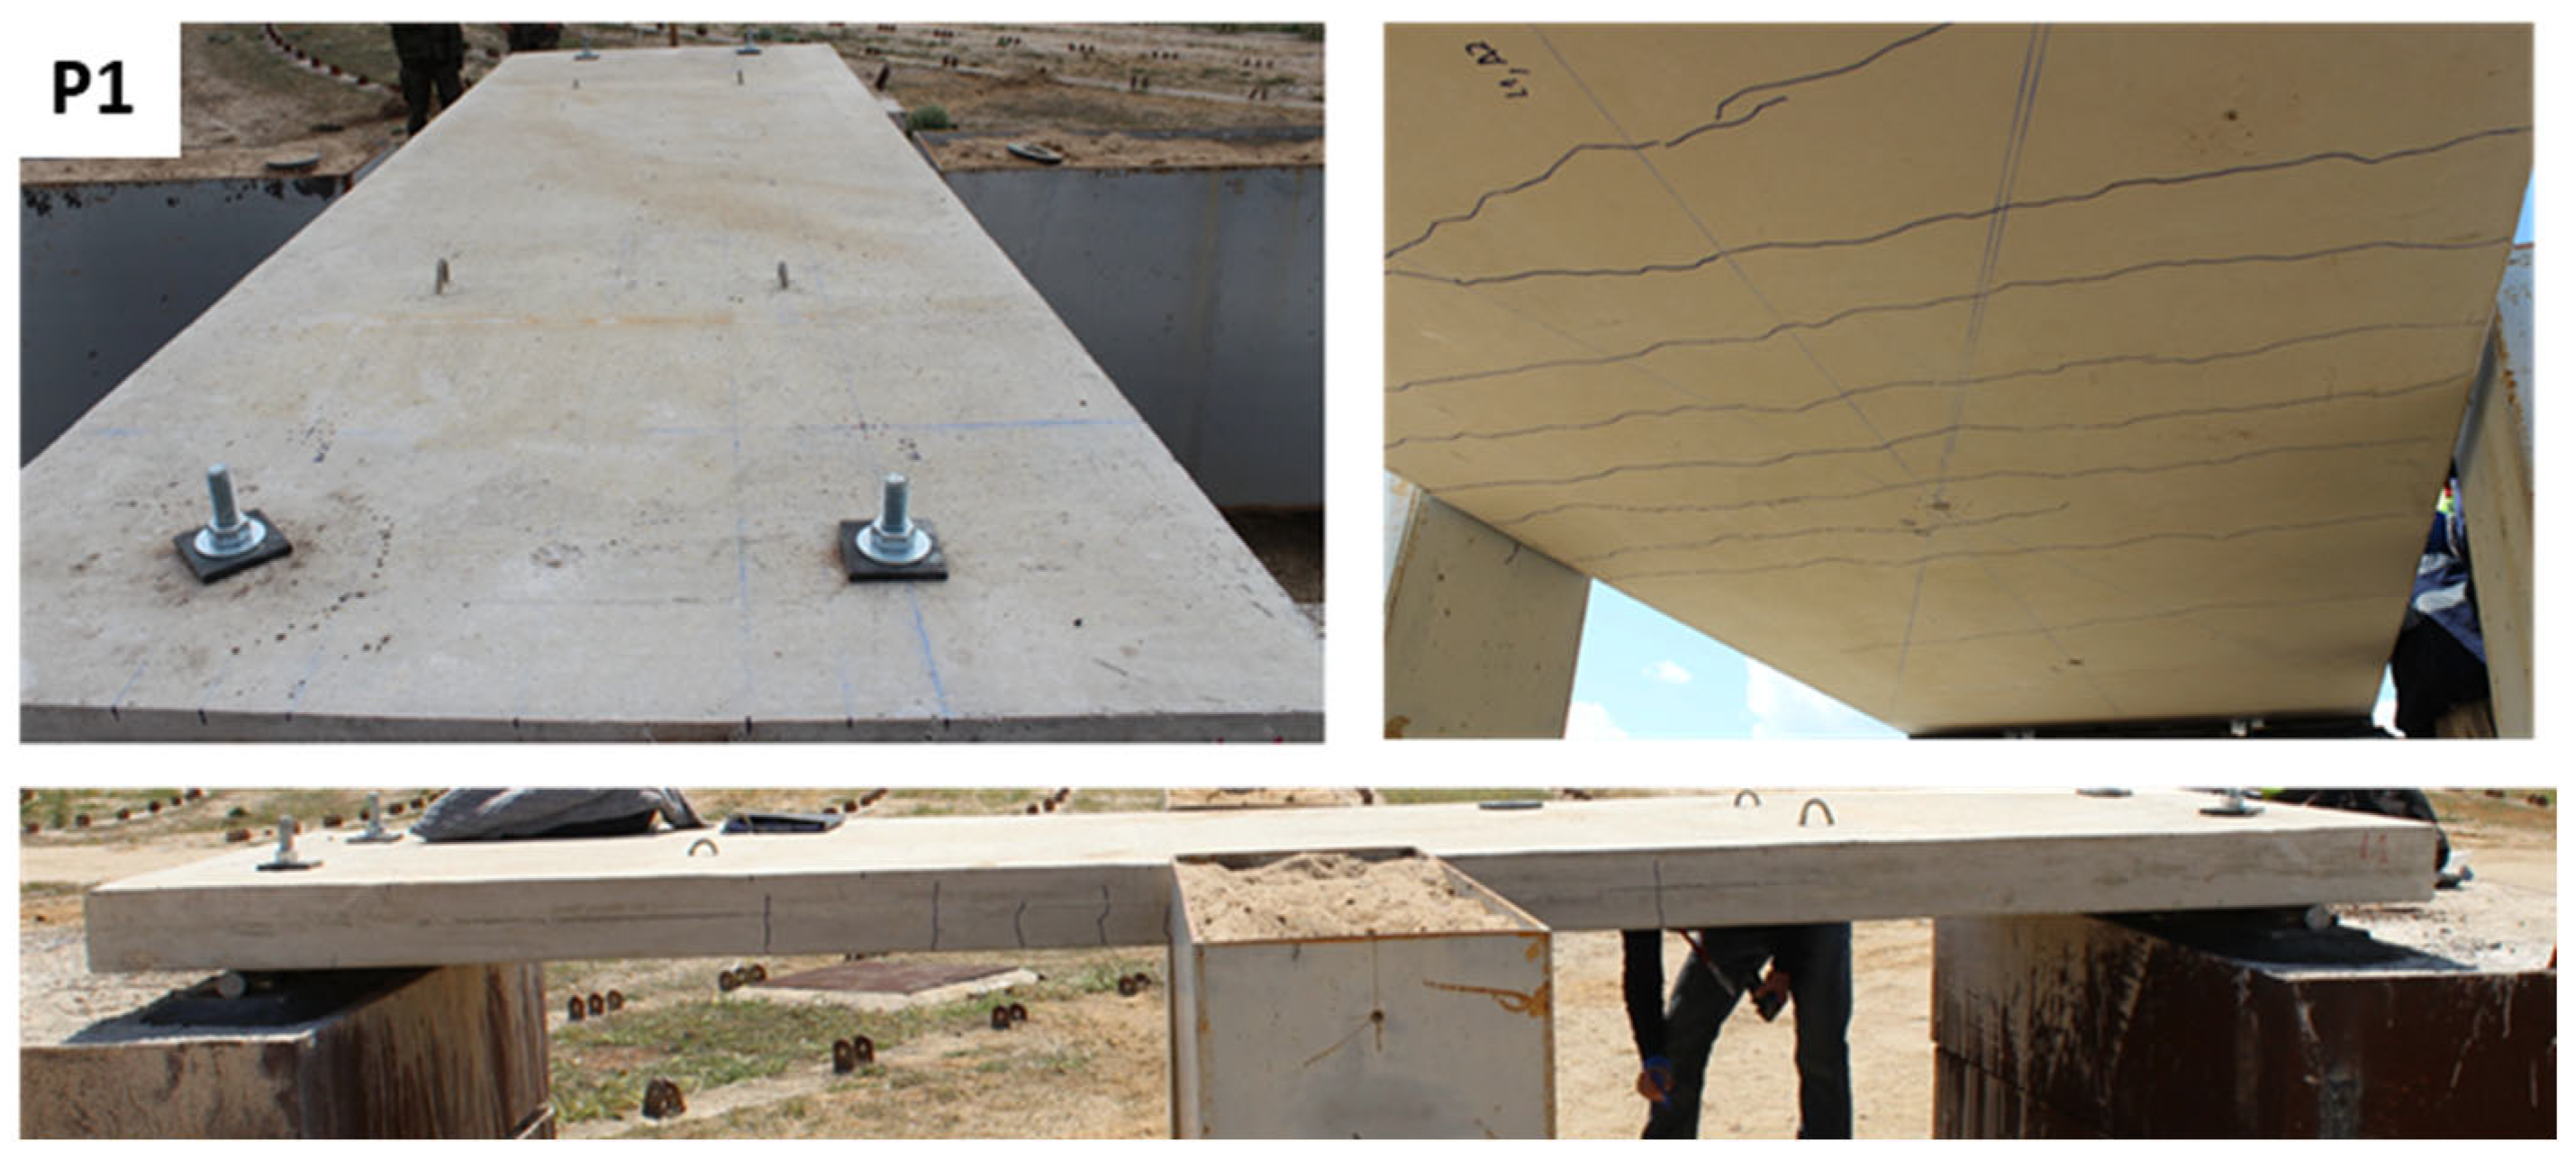
Figure 9.
Pressure signal results of the tests on S1, S2, and S3 from pressure gauges G1 and G3.

Figure 10.
Acceleration signals from test P1 with sensors A1 and A2.

Figure 11.
Post-blast images of non-reinforced slabs with an explosive charge of 15 kg TNT eq. (a) at 0.5 m and (b) at 1 m.
Figure 11.
Post-blast images of non-reinforced slabs with an explosive charge of 15 kg TNT eq. (a) at 0.5 m and (b) at 1 m.
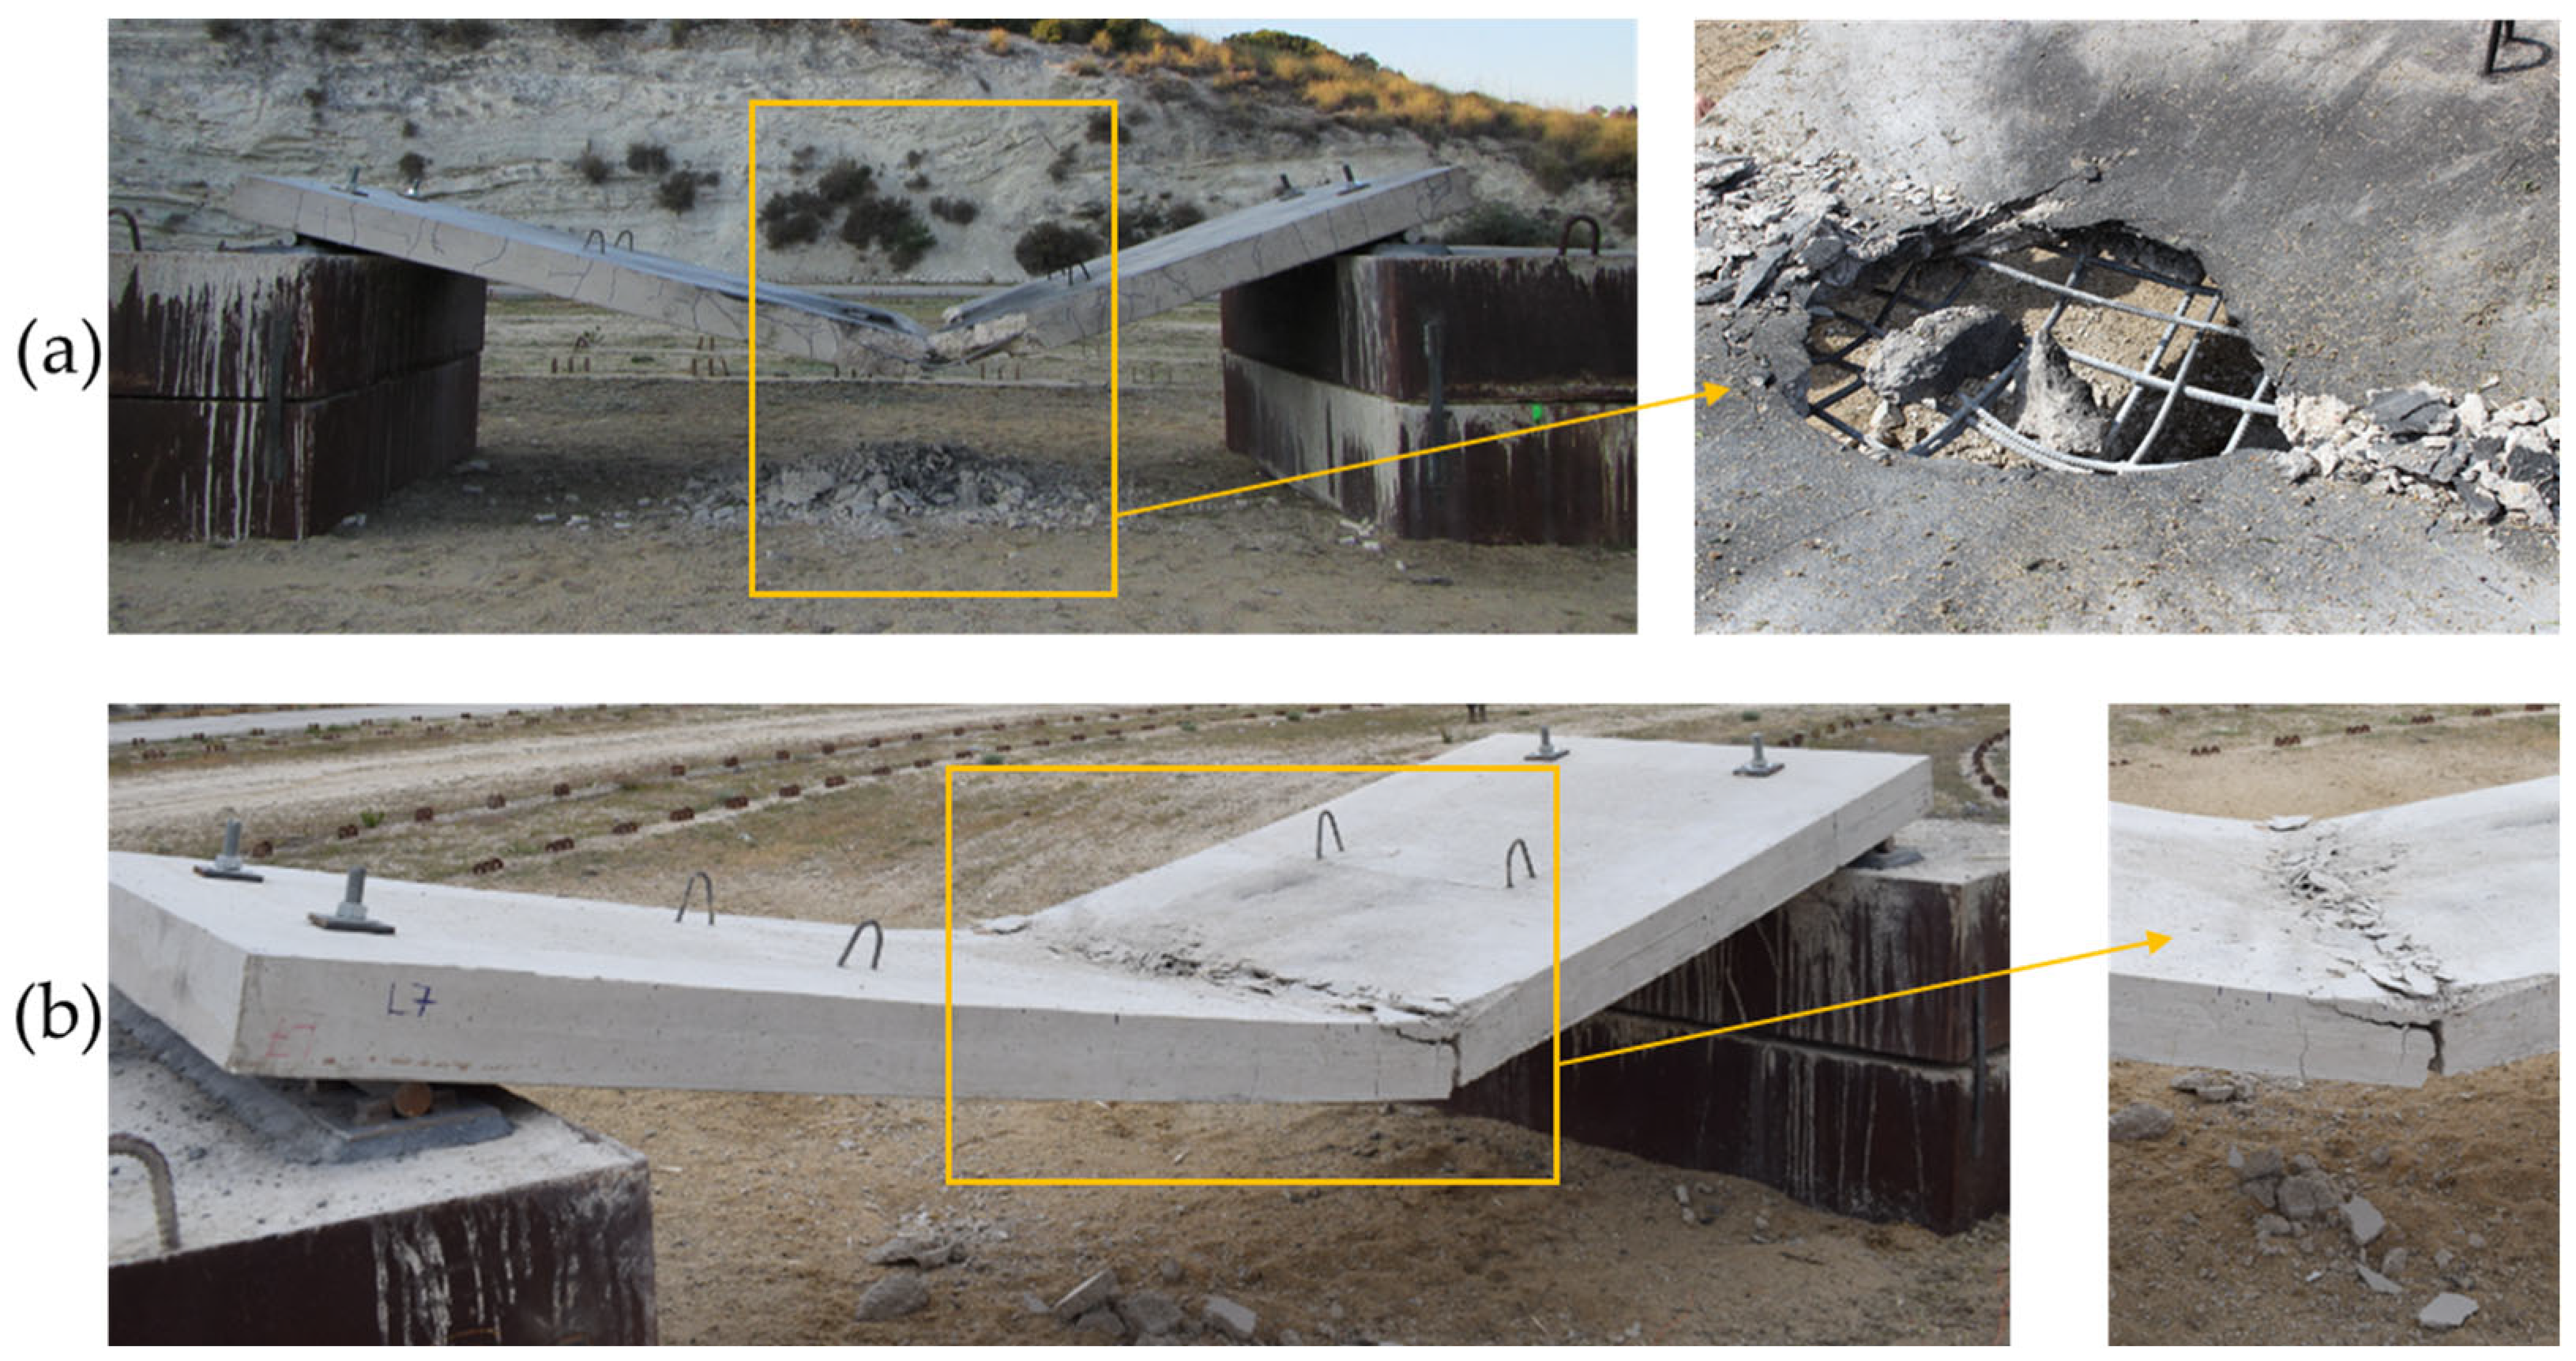
Figure 12.
Post-blast images of slab S6, which was protected with a steel sheet: (a) lateral view; (b) top view without the steel sheet; (c) bottom view of the slab.
Figure 12.
Post-blast images of slab S6, which was protected with a steel sheet: (a) lateral view; (b) top view without the steel sheet; (c) bottom view of the slab.
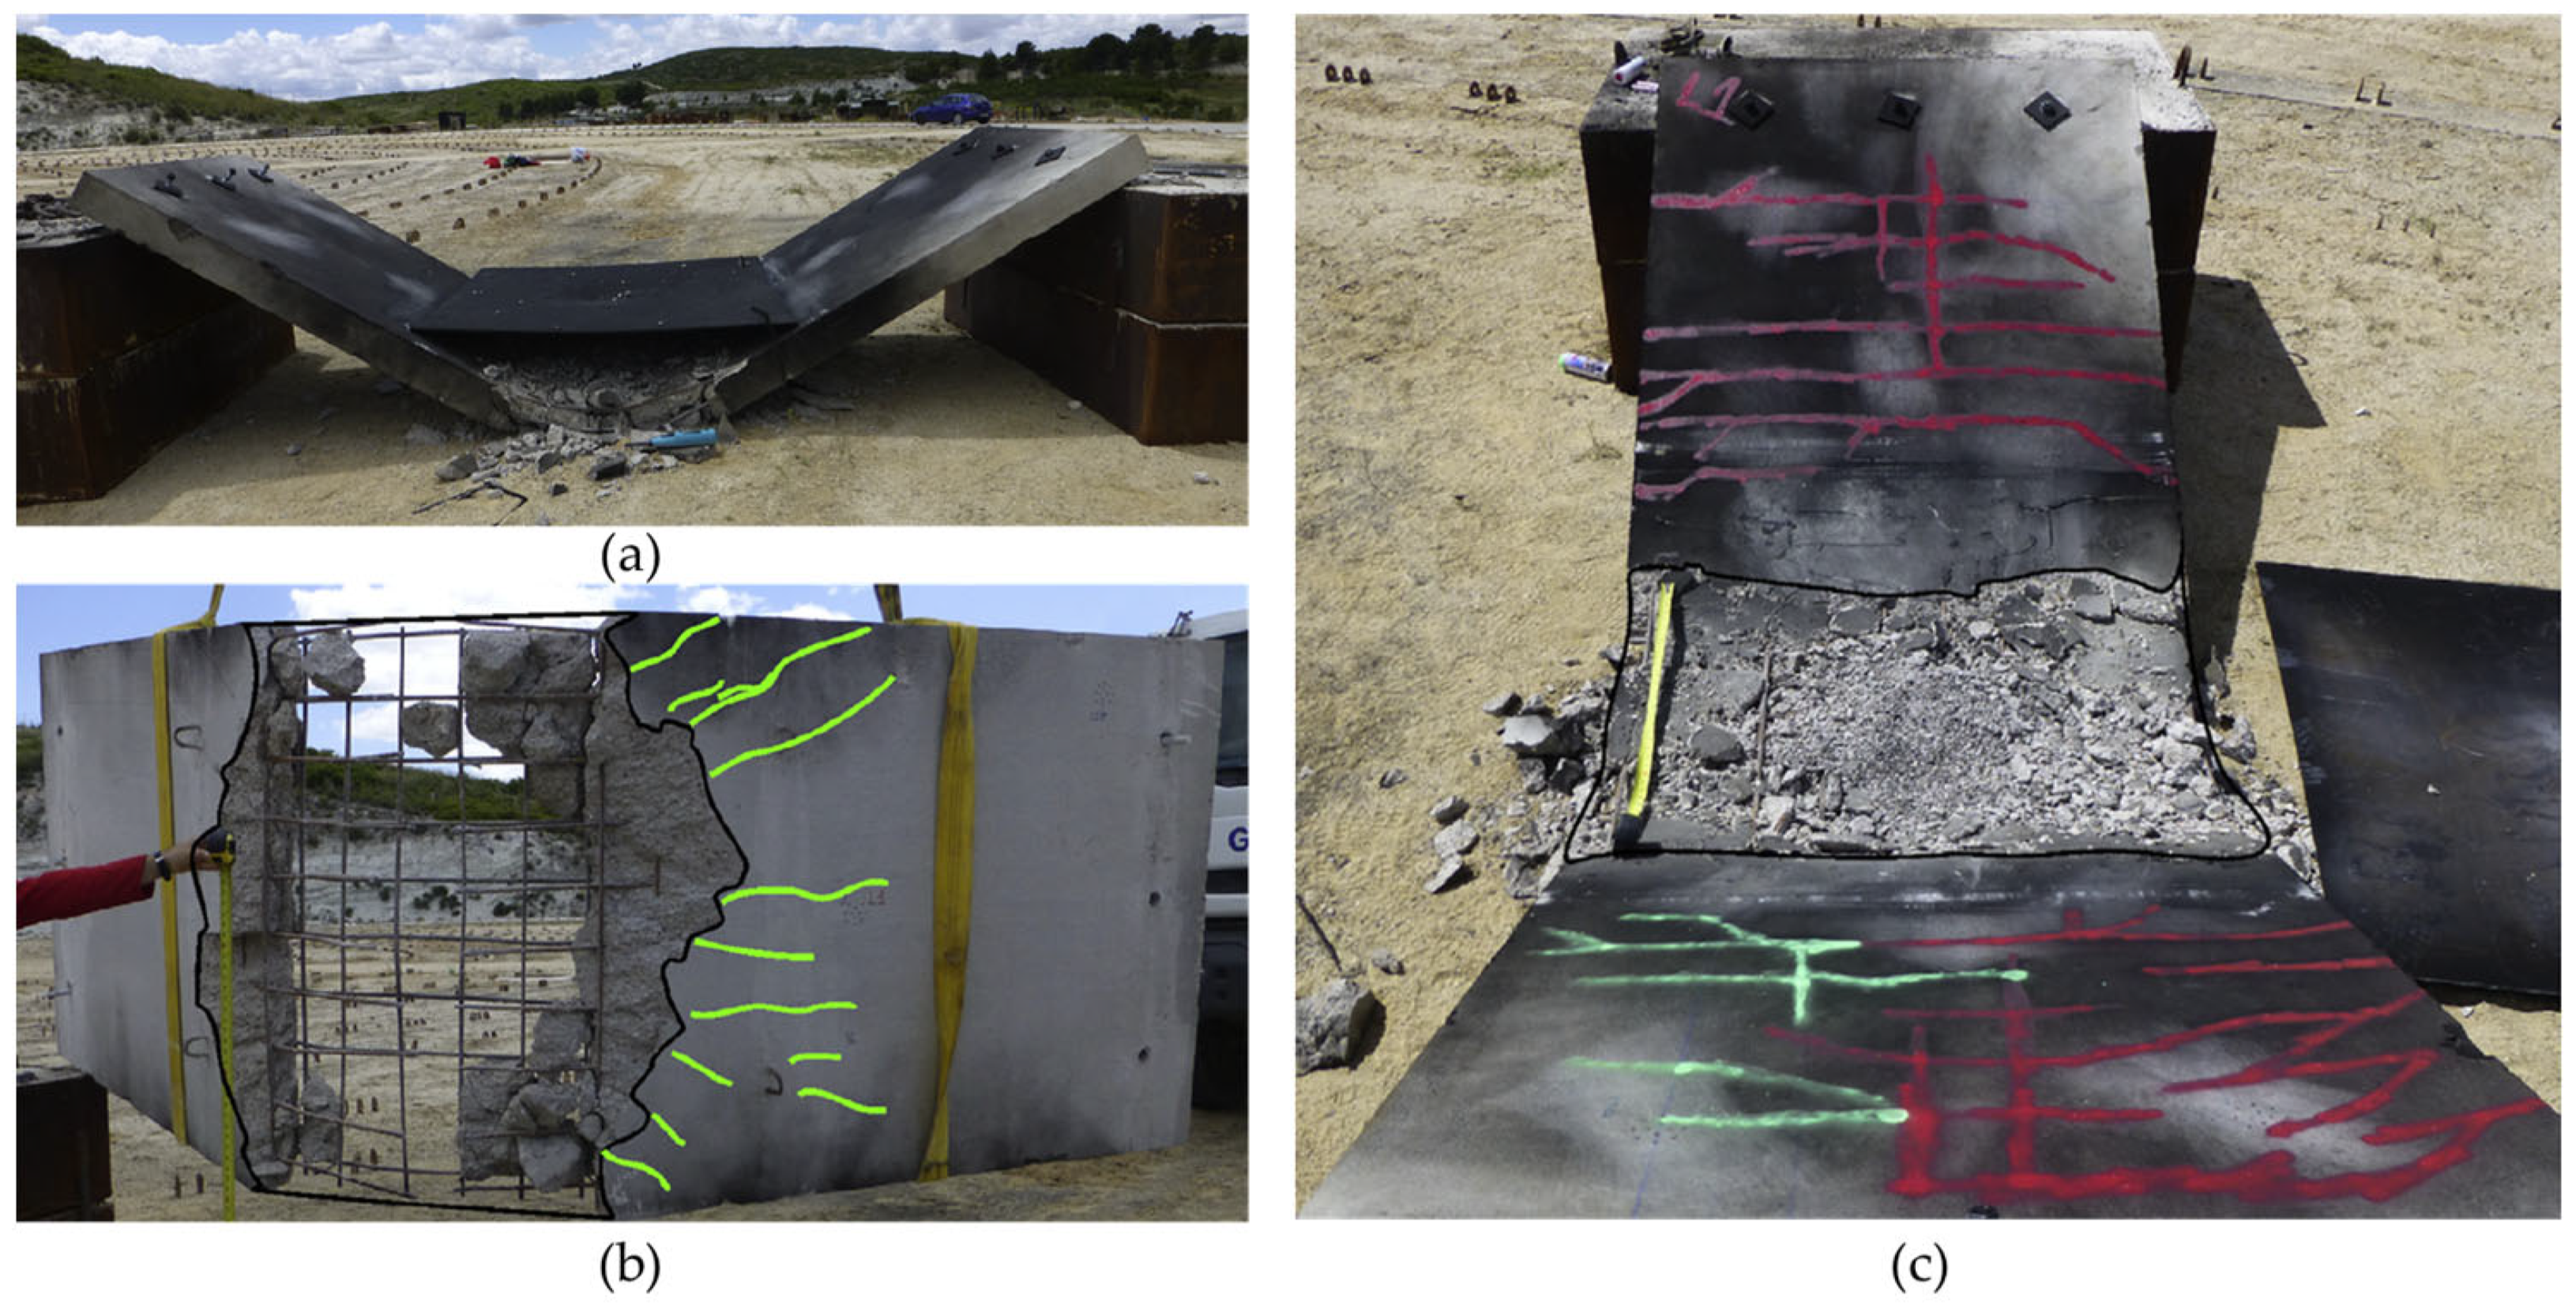
Figure 13.
Post-blast images of slabs protected with fiber-reinforced concrete: (a) S7 with steel fibers; (b) S8 with polypropylene fibers.
Figure 13.
Post-blast images of slabs protected with fiber-reinforced concrete: (a) S7 with steel fibers; (b) S8 with polypropylene fibers.

Figure 14.
Post-blast images of slabs protected with GFRP: (a) result with the charge at a standoff distance of 0.5 m; (b) result with the charge at a standoff distance of 1 m.
Figure 14.
Post-blast images of slabs protected with GFRP: (a) result with the charge at a standoff distance of 0.5 m; (b) result with the charge at a standoff distance of 1 m.
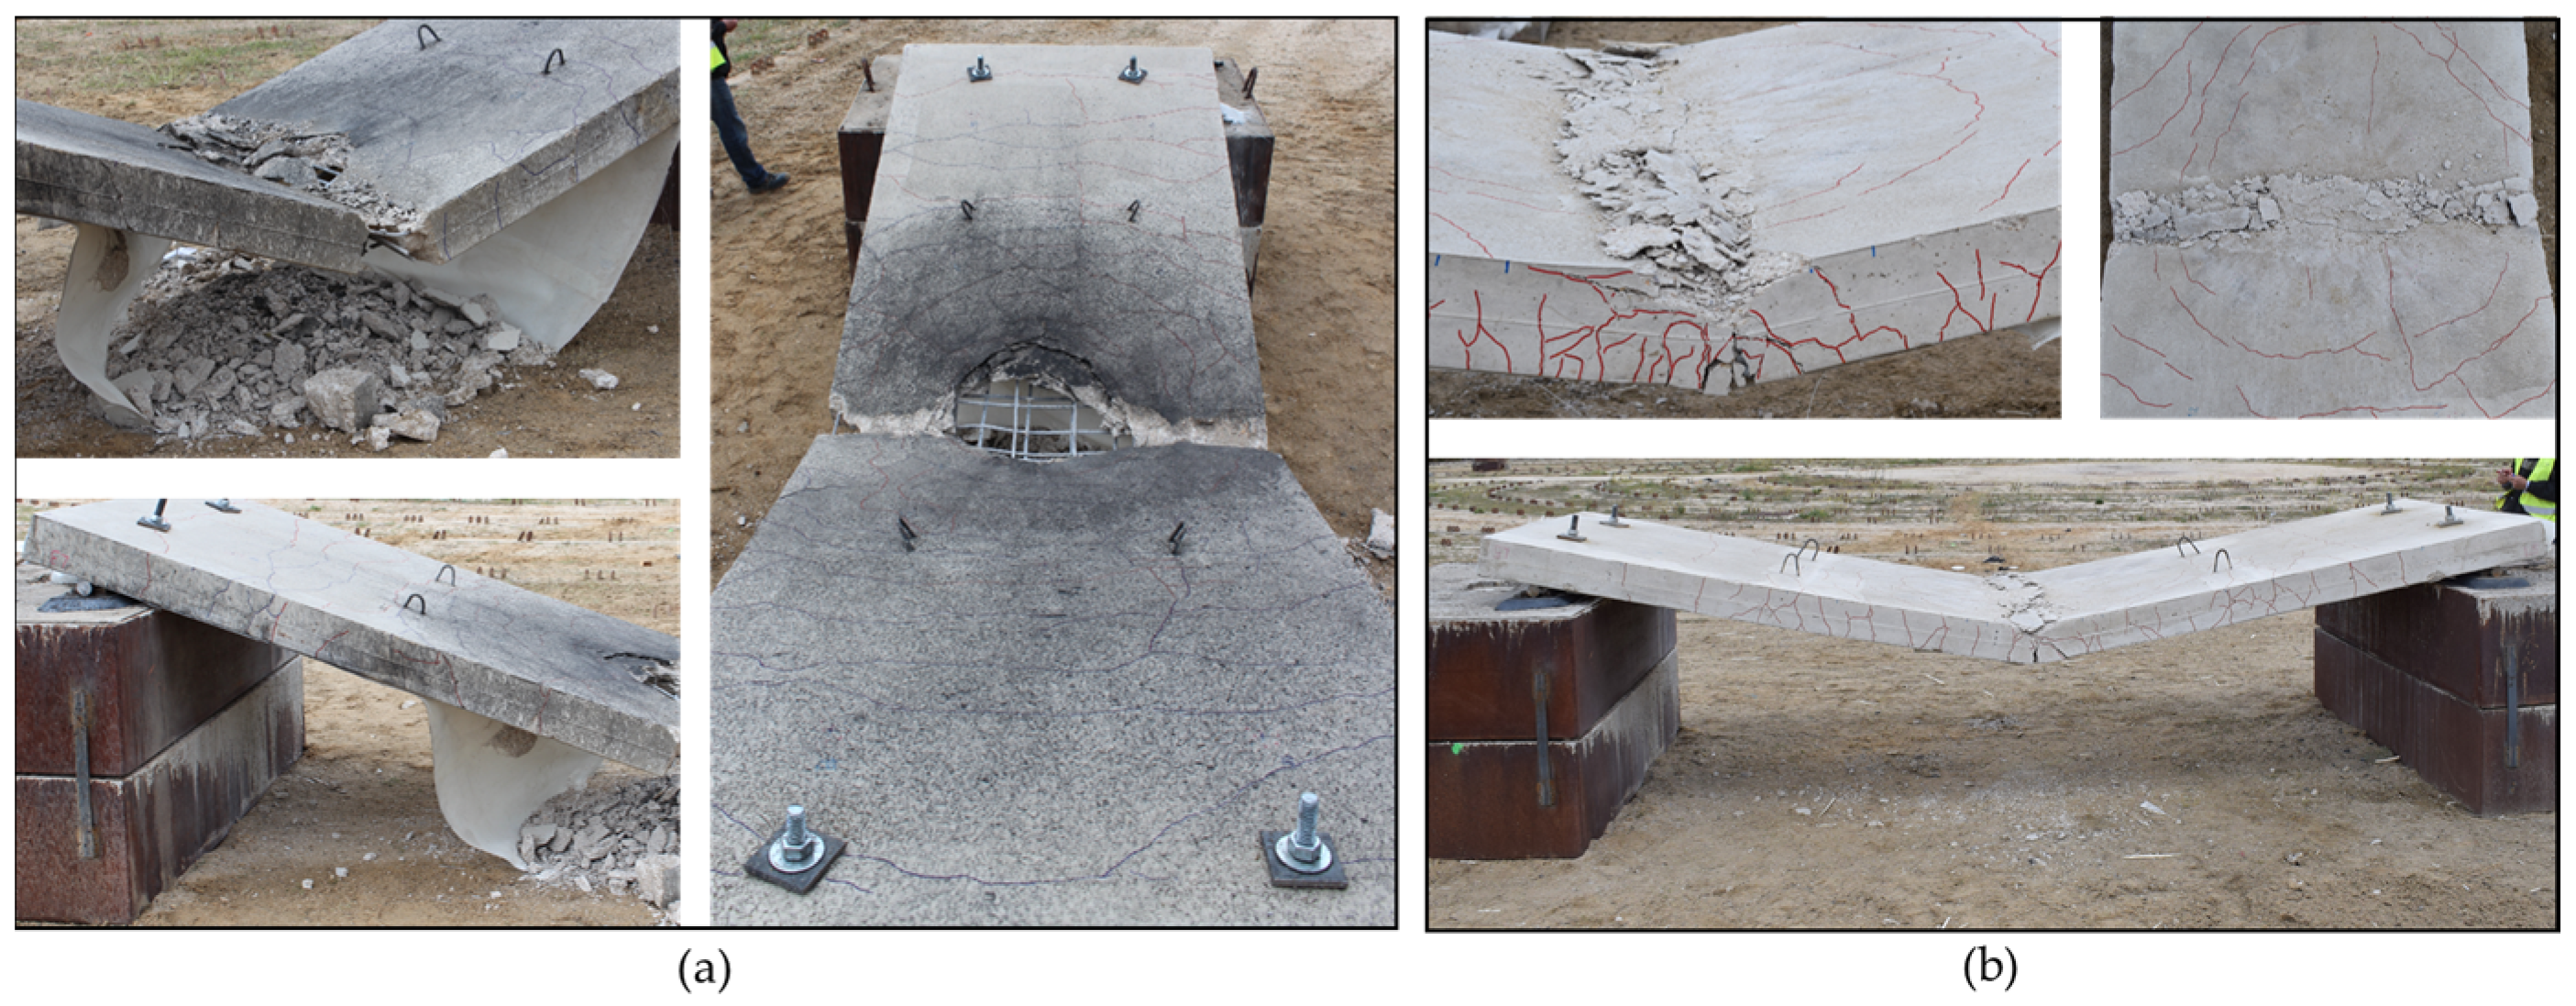
Figure 15.
Post-blast images of slabs protected with CFRP with the charge at a standoff distance of 1 m: (a) test P6; (b) test P8.
Figure 15.
Post-blast images of slabs protected with CFRP with the charge at a standoff distance of 1 m: (a) test P6; (b) test P8.
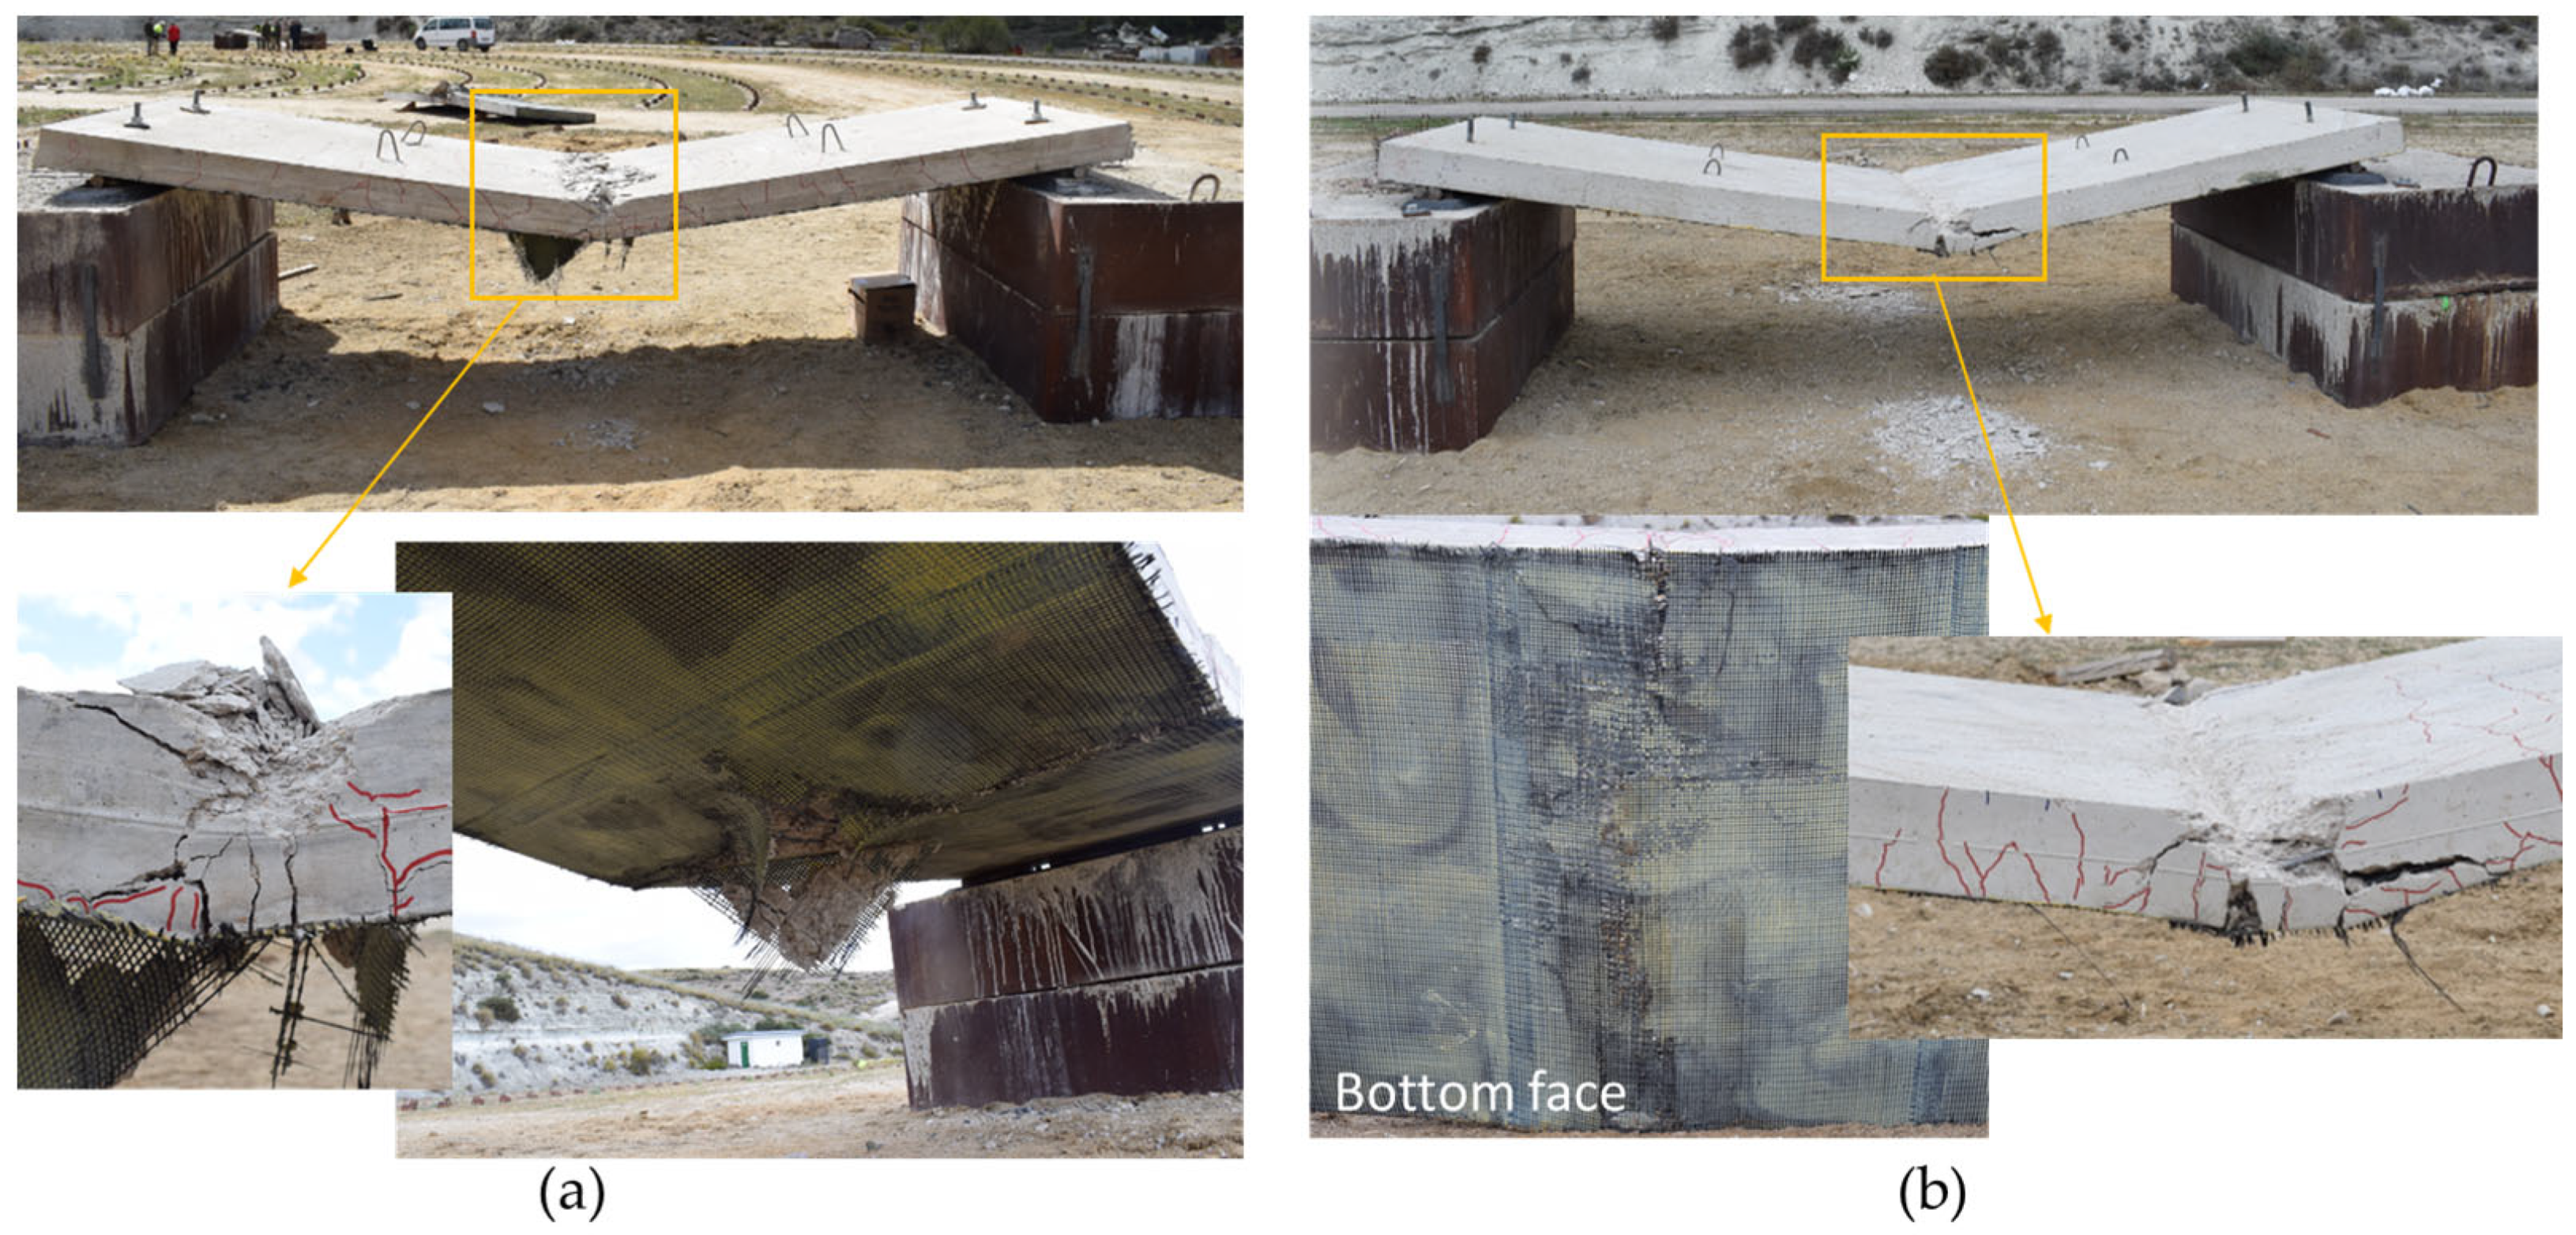
Figure 16.
(a) Measurement locations on the slab; (b) measurement with the Schmidt hammer.
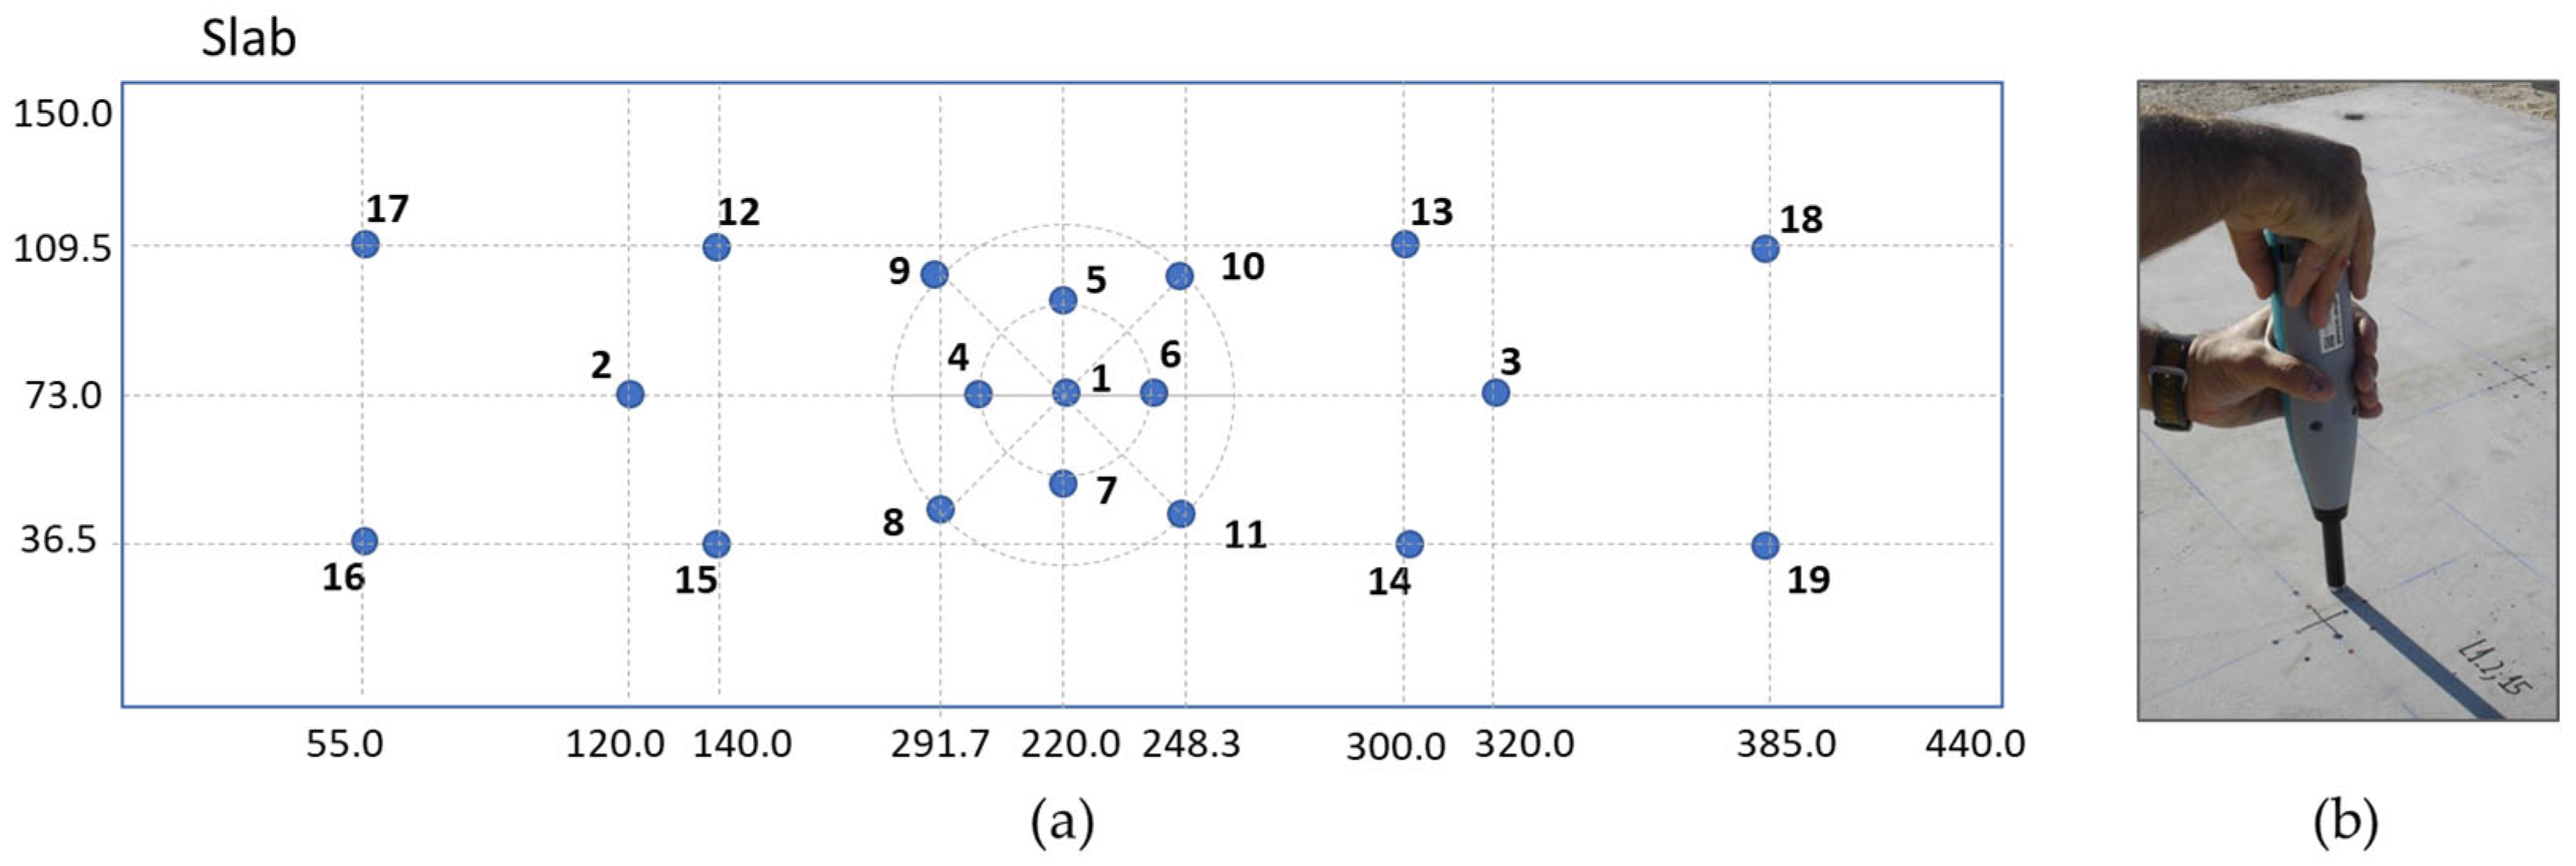
Figure 17.
Damage maps for tests P3 and P8 and a comparison with the experimental results.

Table 1.
Main test characteristics.
| Test | Reinforcement | Eq. TNT Mass (kg) | Standoff Distance (m) | Scaled Distance (m/kg1/3) |
|---|---|---|---|---|
| S1/S2/S3 | Non-reinforced | 2.00 | 1.0 | 0.79 |
| S4 | Non-reinforced | 15.00 | 1.0 | 0.41 |
| S5 | Non-reinforced | 15.00 | 0.5 | 0.20 |
| S6 | Steel sheet | 15.00 | 0.5 | 0.20 |
| S7 | SFRC | 15.00 | 0.5 | 0.20 |
| S8 | PPFRC | 15.00 | 0.5 | 0.20 |
| P1 | Non-reinforced | 1.74 | 1.0 | 0.83 |
| P2 | Non-reinforced | 13.05 | 0.5 | 0.21 |
| P3 | GFRP | 13.05 | 0.5 | 0.21 |
| P4 | CFRP | 13.05 | 0.5 | 0.21 |
| P5 | GFRP | 13.05 | 1.0 | 0.42 |
| P6 | CFRP | 13.05 | 1.0 | 0.42 |
| P7 | Non-reinforced | 13.05 | 1.0 | 0.42 |
| P8 | CFRP | 13.05 | 1.0 | 0.42 |
Table 2.
Mechanical properties of the protective solutions.
| CFRP | GFRP | ||||||
|---|---|---|---|---|---|---|---|
| SS | SFRC | PPFRC | Carbon Fiber | Resin | Glass Fiber | Adhesive | |
| Density (kg/m3) | 7850 | 7810 | 910 | 1830 | 1300 | - | 1100 |
| Length (mm) | - | 50 | 48 | - | - | - | - |
| Diameter (mm) | - | 1 | 0.85 | - | - | - | - |
| Weight (g/m2) | - | - | ≥170 | - | 286 | - | |
| Tensile strength (MPa) | 550 | 1100 | 400 | 5000 | 20 | >1620 | 5.25 |
| Young’s Modulus (GPa) | 200 | - | 6.2 | 252 | 2 | 42 | 0.55 |
| Elongation at failure (%) | - | - | 2 | 1 | 4 | 1.2 | |
| Compressive strength of concrete, fc (MPa) | - | 44.16 | 43.33 | - | - | - | - |
| Tensile strength of concrete (MPa) | - | 8.12 | 5.62 | - | - | - | - |
| Yield strength (MPa) | 275 | - | - | - | - | - | - |
| Tangent modulus (MPa) | 1850 | - | - | - | - | - | - |
Table 3.
Results of the damage parameters.
| Test | Reinforcement | Eq. TNT Mass (kg) | Standoff Distance (m) | d200 (%) | dA (%) | Deflection (cm) |
|---|---|---|---|---|---|---|
| S1/S1/S3 | Non-reinforced | 2.00 | 1.0 | 0.00 | 0.00 | - |
| S4 | Non-reinforced | 15.00 | 1.0 | 10.00 | 3.00 | - |
| S5 | Non-reinforced | 15.00 | 0.5 | 27.00 | 7.00 | - |
| S6 | Steel sheet | 15.00 | 0.5 | 30.00 | 22.00 | - |
| S7 | SFRC | 15.00 | 0.5 | 27.00 | 5.00 | - |
| S8 | PPFRC | 15.00 | 0.5 | 28.00 | 6.00 | - |
| P1 | Non-reinforced | 1.74 | 1.0 | 0.00 | 0.00 | 0.00 |
| P2 | Non-reinforced | 13.05 | 0.5 | 27.69 | 8.19 | 51.00 |
| P3 | GFRP | 13.05 | 0.5 | 28.93 | 7.63 | 63.00 |
| P4 | CFRP | 13.05 | 0.5 | 28.22 | 7.86 | 57.00 |
| P5 | GFRP | 13.05 | 1.0 | 17.85 | 3.89 | 32.50 |
| P6 | CFRP | 13.05 | 1.0 | 19.33 | 4.55 | 23.20 |
| P7 | Non-reinforced | 13.05 | 1.0 | 18.77 | 5.59 | 34.00 |
| P8 | CFRP | 13.05 | 1.0 | 21.26 | 3.41 | 27.94 |
Disclaimer/Publisher’s Note: The statements, opinions and data contained in all publications are solely those of the individual author(s) and contributor(s) and not of MDPI and/or the editor(s). MDPI and/or the editor(s) disclaim responsibility for any injury to people or property resulting from any ideas, methods, instructions or products referred to in the content. |
© 2023 by the authors. Licensee MDPI, Basel, Switzerland. This article is an open access article distributed under the terms and conditions of the Creative Commons Attribution (CC BY) license (https://creativecommons.org/licenses/by/4.0/).
Share and Cite
MDPI and ACS Style
Chiquito, M.; López, L.M.; Castedo, R.; Santos, A.P.; Pérez-Caldentey, A. Full-Scale Field Tests on Concrete Slabs Subjected to Close-In Blast Loads. Buildings 2023, 13, 2068. https://doi.org/10.3390/buildings13082068
AMA Style
Chiquito M, López LM, Castedo R, Santos AP, Pérez-Caldentey A. Full-Scale Field Tests on Concrete Slabs Subjected to Close-In Blast Loads. Buildings. 2023; 13(8):2068. https://doi.org/10.3390/buildings13082068
Chicago/Turabian StyleChiquito, María, Lina M. López, Ricardo Castedo, Anastasio P. Santos, and Alejandro Pérez-Caldentey. 2023. "Full-Scale Field Tests on Concrete Slabs Subjected to Close-In Blast Loads" Buildings 13, no. 8: 2068. https://doi.org/10.3390/buildings13082068
Note that from the first issue of 2016, this journal uses article numbers instead of page numbers. See further details here.