Article

Experimental Study on the Flexural Behaviors of Prestressed Segmental Ultra–High–Performance Concrete Channels and Reinforced Conventional Concrete Deck Composite Girders

1
College of Civil Engineering, Fuzhou University, Fuzhou 350108, China
2
Department of Architecture, Roma Tre University, 00153 Rome, Italy
*
Author to whom correspondence should be addressed.
Buildings 2023, 13(7), 1841; https://doi.org/10.3390/buildings13071841
Submission received: 26 June 2023 / Revised: 13 July 2023 / Accepted: 17 July 2023 / Published: 20 July 2023

Abstract

:
Flexural testing on two prestressed segmental ultra–high–performance concrete channels and reinforced conventional concrete deck composite girders (PSUC–RCCD) was carried out. One was made up of four segments with dry joints, and the other was formed of one channel beam without a dry joint. Both of them poured a conventional concrete deck slab on site. The mechanical behaviors of the girders, including the whole loading process, the crack pattern, and the failure mode were investigated and compared. The effect of the number of segments and the steel fiber volume fraction of UHPC on the bending behavior of the PSUC–RCCD girder was explored using the finite element method. This study showed that the loading process of semi-segmental and integral girders is similar; the whole loading process of the girders can be divided into the elastic phase, crack development, and the failure phase. The only notable difference between the two girders was the stage of crack development; specifically, after cracking, the stiffness of the semi-segmental girder reduced rapidly, while the “bridging effect” of the steel fibers in the integrated girder caused a slow reduction in rigidity. The flexural cracks in the semi-segmental girder were significantly less than those in the integral girder in terms of the number of cracks, and were present only at the joints. The finite element analysis showed that the number of segments had little influence on the flexural capacity of the girders, but the girders with even numbers of segments cracked earlier than those with odd segments. Increasing the steel fiber volume fraction in UHPC (ultra–high–performance concrete) had a small effect on the cracking load of the semi-segmental girders but enhanced its ultimate flexural capacity. Based on this experiment, a calculated method for estimating the flexural capacity of semi-sectional girders was proposed. The calculated values were in good agreement with the experimental and finite element values. In the preliminary design, the flexural capacity of the semi-segmental section could be estimated by multiplying the flexural capacity of the integral section by a resistance factor of 0.95.

1. Introduction

Ultra–high–performance concrete (UHPC), as a new generation of high–performance concrete, shows ultra-high strength, ductility, and durable properties [1,2]. As a major advancement in the development of cementitious materials today, it has the potential to move bridge structures toward lightweight construction and large spans, achieve a long life in service environments, and reduce post-maintenance costs. Although some progress has been made in its application [3,4,5] and research [6,7,8,9] into UHPC, UHPC is still a new material [10]; it is favorable for use in precast concrete segmental bridges [11,12], and numerous examples of this type of bridge have been constructed, such as the Sakata–Mirai Bridge [13] (Japan 2002), the PS34 overpass bridge [14] (France 2005), and the Batu 6 bridge [15] (Malaysia 2013).
There has been some research progress on UHPC segmental girders. Jeong et al. [16] designed four segmental UHPC box girders with low reinforcement ratios and tested them for flexural performance. Their research found that as the reinforcement ratio increased, the girders transformed from ductile failure to over-reinforced brittle failure, indicating the reinforcement indexes that needed to be modified in the code. Ye et al. [17] investigated the structure of precast ultra–high–performance concrete (UHPC) segmental bridges (PUSBs), and the results showed flexural failure with crushing of the UHPC at the joints. Although the ultimate capacity, stiffness, and cracking load of the segmental beams were slightly lower than those of the monolithic beams, the segmental beams tended to exhibit better ductility and deformation capacity; in addition, they proposed formulas based on French codes. Zeng et al. [18] introduced a novel connection based on FRP bars and steel grouting sleeves. The connection mode and the fiber type had little influence on the first cracking load and the initial bending stiffness of the FRP bar-reinforced UHPC plates, while the horse-tooth connection led to better ductility of the composite plates than the staggered connection mode, while the study of flat dry joints on girders is still relatively limited. Obviously, a significant feature in this area of construction was the weakness of the joints between segments. Most of the studies still used wet or epoxy joints for joints when studying segmental UHPC beams. All of these methods are certainly good, but this structure should be improved upon. In addition, some scholars have found that the compressive stress of the UHPC material in the comparison zone of girders did not reach its compressive strength when the structure failed [19], which would certainly cause a waste of material. Therefore, it is necessary to design a new type of bridge member to reduce or avoid the waste of UHPC materials and also make up for the problems caused by joints.
This study proposed a novel structure consisting of a prestressed segmental UHPC channel and a reinforced conventional concrete deck (PSUC–RCCD) to provide references for the design of the precast segmentally assembled bridge structure.
The structural features of the UHPC segments can be precast and steam-cured in a factory, thus completing most of the shrinkage of the UHPC. The lightweight UHPC segments can be transported to the construction site by conventional lorries and hoisting equipment, and can be formed directly into UHPC channels using post-tensioning. Since an UHPC channel does not use glue joints or wet joints, the assembly can be completed quickly. The cast in situ conventional concrete (CC) used in the deck slab can be efficiently used to bear loads, and it can improve the integrity of the segmental girder. It was first constructed in Japan in 2008 in the GSE (ground support equipment) bridge and has been widely used in Malaysia, achieving good economic benefits [20,21]. However, few studies have been carried out on this new type of structure. In order to facilitate the promotion of this bridge, we urgently need to investigate its flexural properties. However, few studies have been carried out [22,23]. Makhbal et al. [22] studied the PSUC–RCCD girder experimentally and proposed that its flexural load capacity was higher than the design requirements for the service limit state and limit state. However, due to technical reasons, the test was stopped before failure, and neither failure mode nor ultimate load were found. Lee et al. [23] compared the effects of different volume fractions of steel fibers and deck slab on segmental U-beams. It was shown that the flexural capacity of beams with a higher steel fiber volume fraction increased. The composite U-beam had higher ductility, which reduced the brittle failure of the U-beam. The link between the UHPC U-beam and the high-strength concrete slab was effective and did not show any sliding and cracking before the failure load.
The study conducted an experimental study on the flexural behavior of PSUC–RCCD composite girders with dry joints, compared with integral PSUC–RCCD composite girders. The details of the test specimens, the instrumentation setup, and the test procedure are described first, followed by the structural responses, including the deflections, strains, and failure modes. A finite element model (FEM) was developed. Based on the FEM of the tested girder, parametric analyses were conducted. The calculation methods for the flexural capacity of the segmental and integral sections in PSUC–RCCD girders were proposed and verified by the test results. The results provide a better understanding of the flexural behavior of the segmental PSUC–RCCD composite girder.

2. Experimental Program

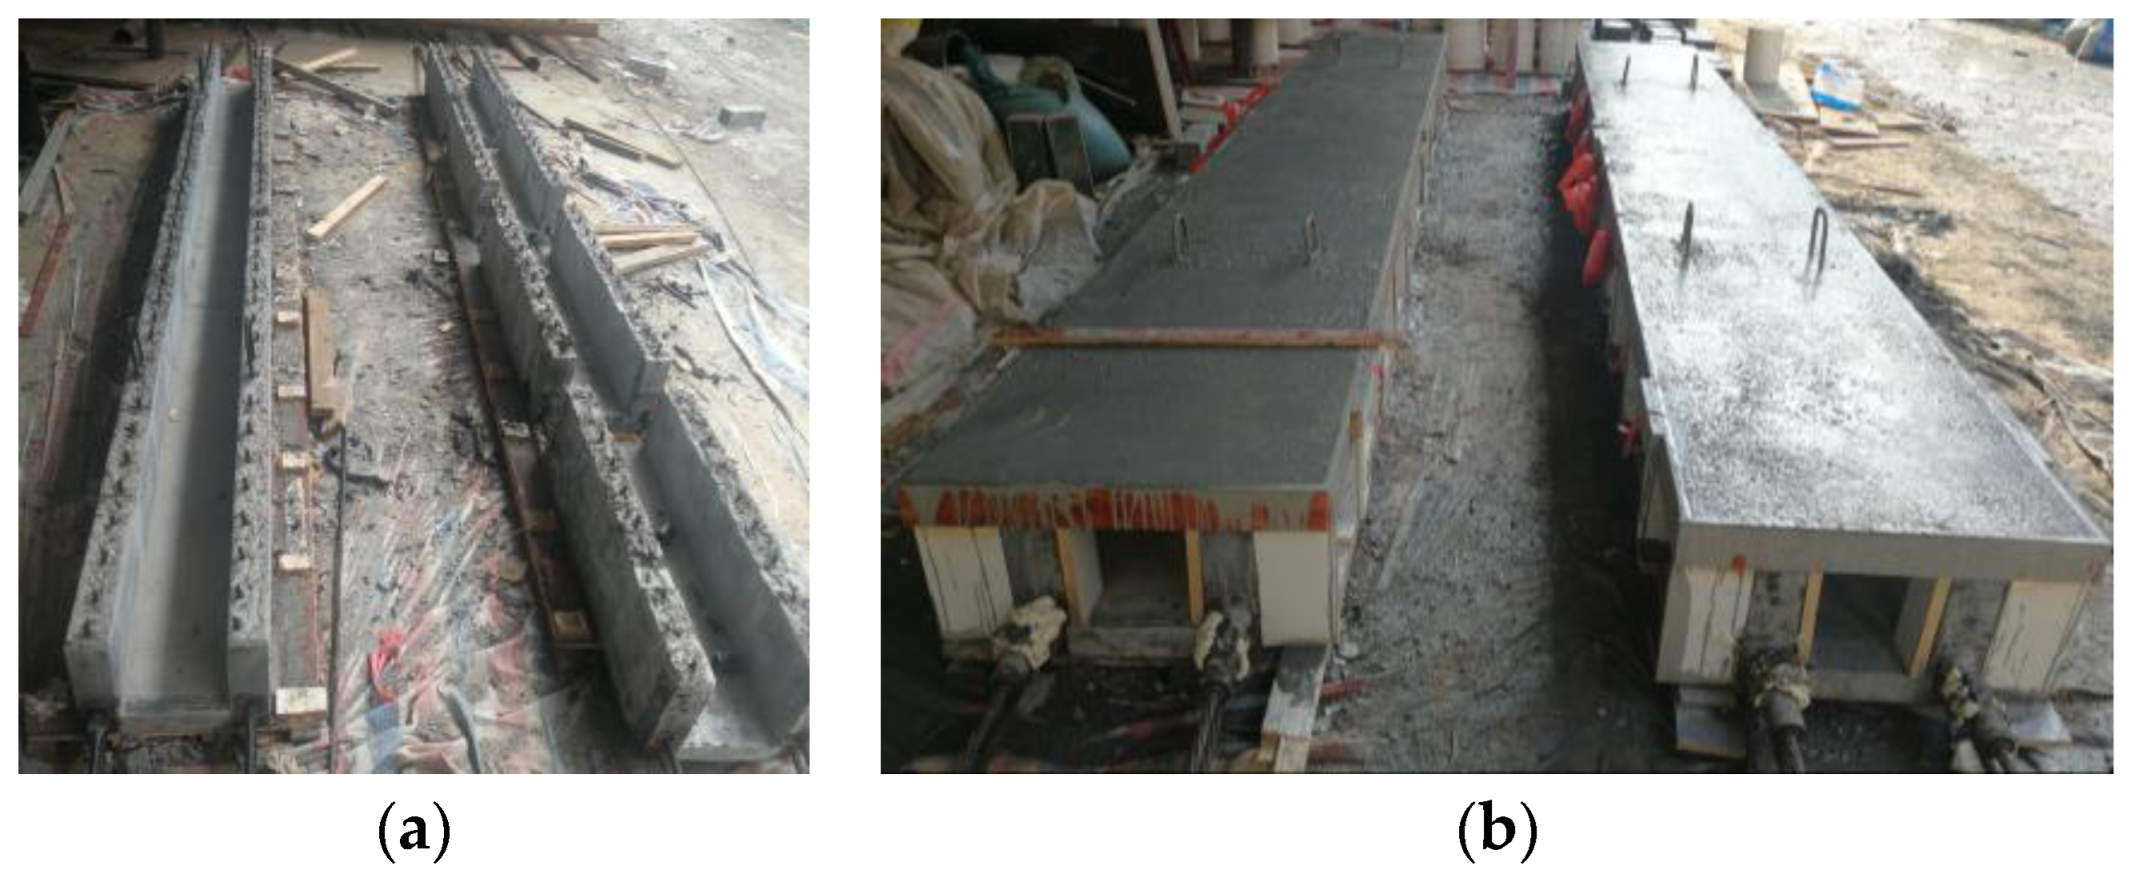
2.1. Specimens Details

The test specimen was based on a design-in-progress of a UHPC-RC composite box girder pedestrian bridge in China, and a scaled-down design, fabrication, and stress study of the original bridge design after considering a new bridge structure in Malaysia.
The specimens were composed of prestressed UHPC channel beams and RCCD slabs. PSUC–RCCD-4 consisted of 4 segments and was connected by dry joints without shear keys. PSUC–RCCD-1 had an integral UHPC channel and therefore 1 segment. The length of the specimens was 4 m and the calculated span was 3.8 m, as shown in Figure 1. The girder’s section was a box girder with a 0.3 m depth, a 0.6 m width, and a 0.075 m thickness in each web, and a 0.050 m thick RCCD slab.
Note that the semi-segmental girders in this study were not totally composed of segments, and the deck slabs were cast-in-place as a monolithic slab; therefore, it was a semi-segmental or semi-integral girder. Such girders have better integrity and a higher flexural capacity than common semi-segmental girders, which is also an important advantage of such a girder. In addition, CC was adopted instead of UHPC to solve the problem of wasted material due to the fact that the compressive strength of the UHPC slab on top could not be fully utilized.
The precast UHPC segments (Figure 2a) were post-tensioned by prestressing strands 15.2 mm in diameter (an average effective tensile force of 146kN for each) to form UHPC channel beams, and were connected to the RCCD slabs by shear bars with a diameter of 10 mm. After tensioning of the prestressing strands, the RCCD slab (Figure 2b) was poured. The reinforcement arrangement of the cross-section of specimens is shown in Figure 3.
The shear keys in the solid bridge were located in the webs of the segmental girders [20], three in each web, at a depth of about 0.44% of the segmental length. The shear keys were small, so it was considered that the shear keys could be disregarded after the section was scaled down. Therefore, in this experiment, the UHPC segments were connected with flat dry joints, no bond, and no wet joints, as well as no shear keys. The interface between the segments was transmitted by the compressive stresses generated by the prestressing strands and the section’s friction. The main observation was the effect of flat dry joints on the flexural performance of the combined PSUC–RCCD girders.

2.2. Material Properties

The mixture proportions of the concrete are shown in Table 1 and Table 2. Straight steel fibers with a diameter of 0.16 mm and a length of 13 mm were used in the UHPC with a fiber volume fraction of 3%.
Prisms of 100 × 100 × 300 mm [24] and 150 × 150 × 450 mm [25] were tested at a compressive strength of UHPC and CC, respectively. Dog-bone specimens of 50 mm × 100 mm × 150 mm were tested for the axial tensile strength of UHPC [26]. All material specimens were poured with the girders, and three specimens of each type were tested. The test results are listed in Table 3. The values in parentheses are the standard deviations.
The material properties of the steel were determined through coupon tests in accordance with the Chinese Standard Metallic materials—Tensile testing—Part 1: Method of testing at room temperature (GB/T 228.1-2010) [27]. The test results of the prestressing strand and the HRB400 are listed in Table 4.
The material properties of the steel were measured using a universal testing machine. Since the prestressing strands had no obvious yield step, the stress corresponding to a residual strain of 0.002 was used as its nominal yield point, with a yield strength of 1490 MPa and a yield strain of 0.010.

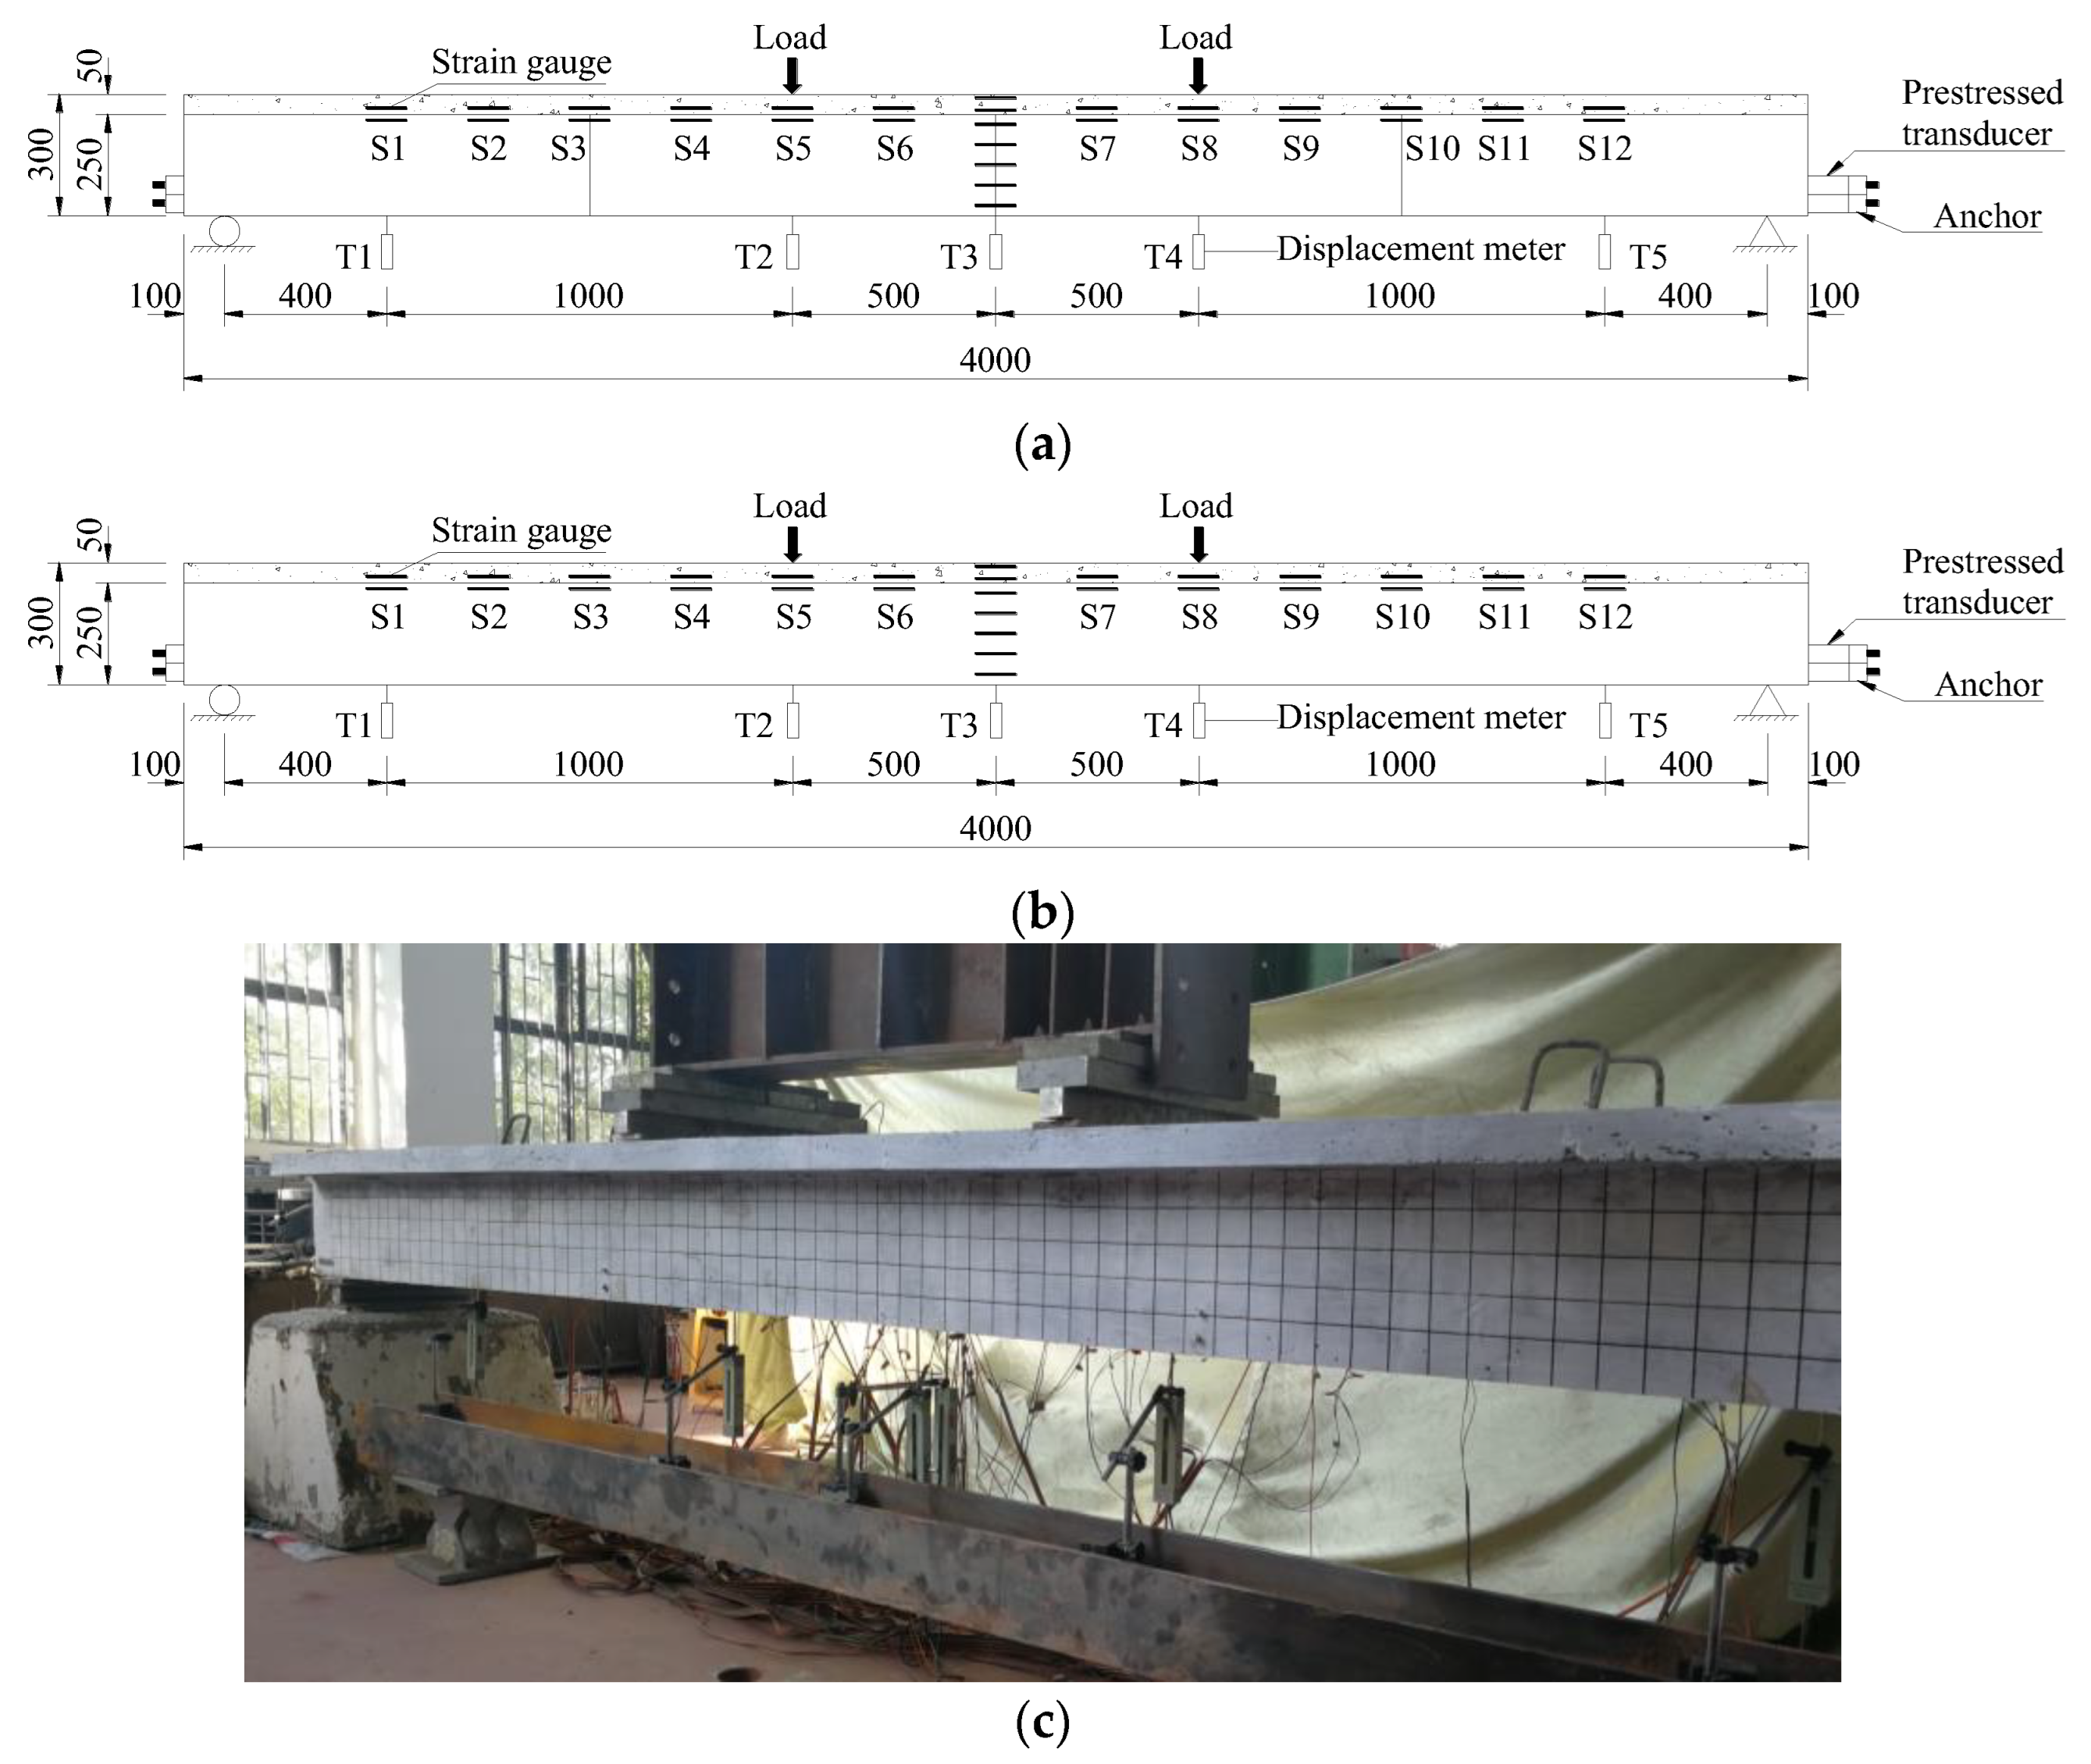
2.3. Test Setup and Arrangement of Measurement Points

As shown in Figure 4, according to GB/T 50152-2012 (Standard for test methods of concrete structures) [28], the specimens were placed in a simple supported condition, where the roller was supported at one end and the hinge was supported at the other end. The load was arranged for a four-point bending condition and was located symmetrically at two points with a pure bending zone of 1 m.
For the arrangement of the measurement points, the concrete strain gauges S1 through to S12 were arranged on the joint interface of the UHPC beam and RCCD slab to observe the coordinated deformation. On the mid-span web, the concrete strain gauges were arranged and used to measure the concrete strain of the test girder at different depths. The prestressed transducer was arranged on the prestressed strand to record the strain value. Displacement transducers (LVDTs) were placed under the girder to record the deflection of five locations along the girder’s span (T1–T5).
The DH3816 static strain test system was used to record the displacement transducer’s data, the strain gauges’ data, and prestressed transducer’s data. A ZBL-F101-type crack width meter was used to measure the crack widths of the girder.
The static loading was carried out with a jack. We preloaded 30 kN first, and unloaded it after confirming the good working condition of the instrument. Formal loading was carried out at 10 kN per stage until the crack was made, and we then switched to 5 kN per stage, and the load was maintained for 10 min per stage.

3. Experimental Results

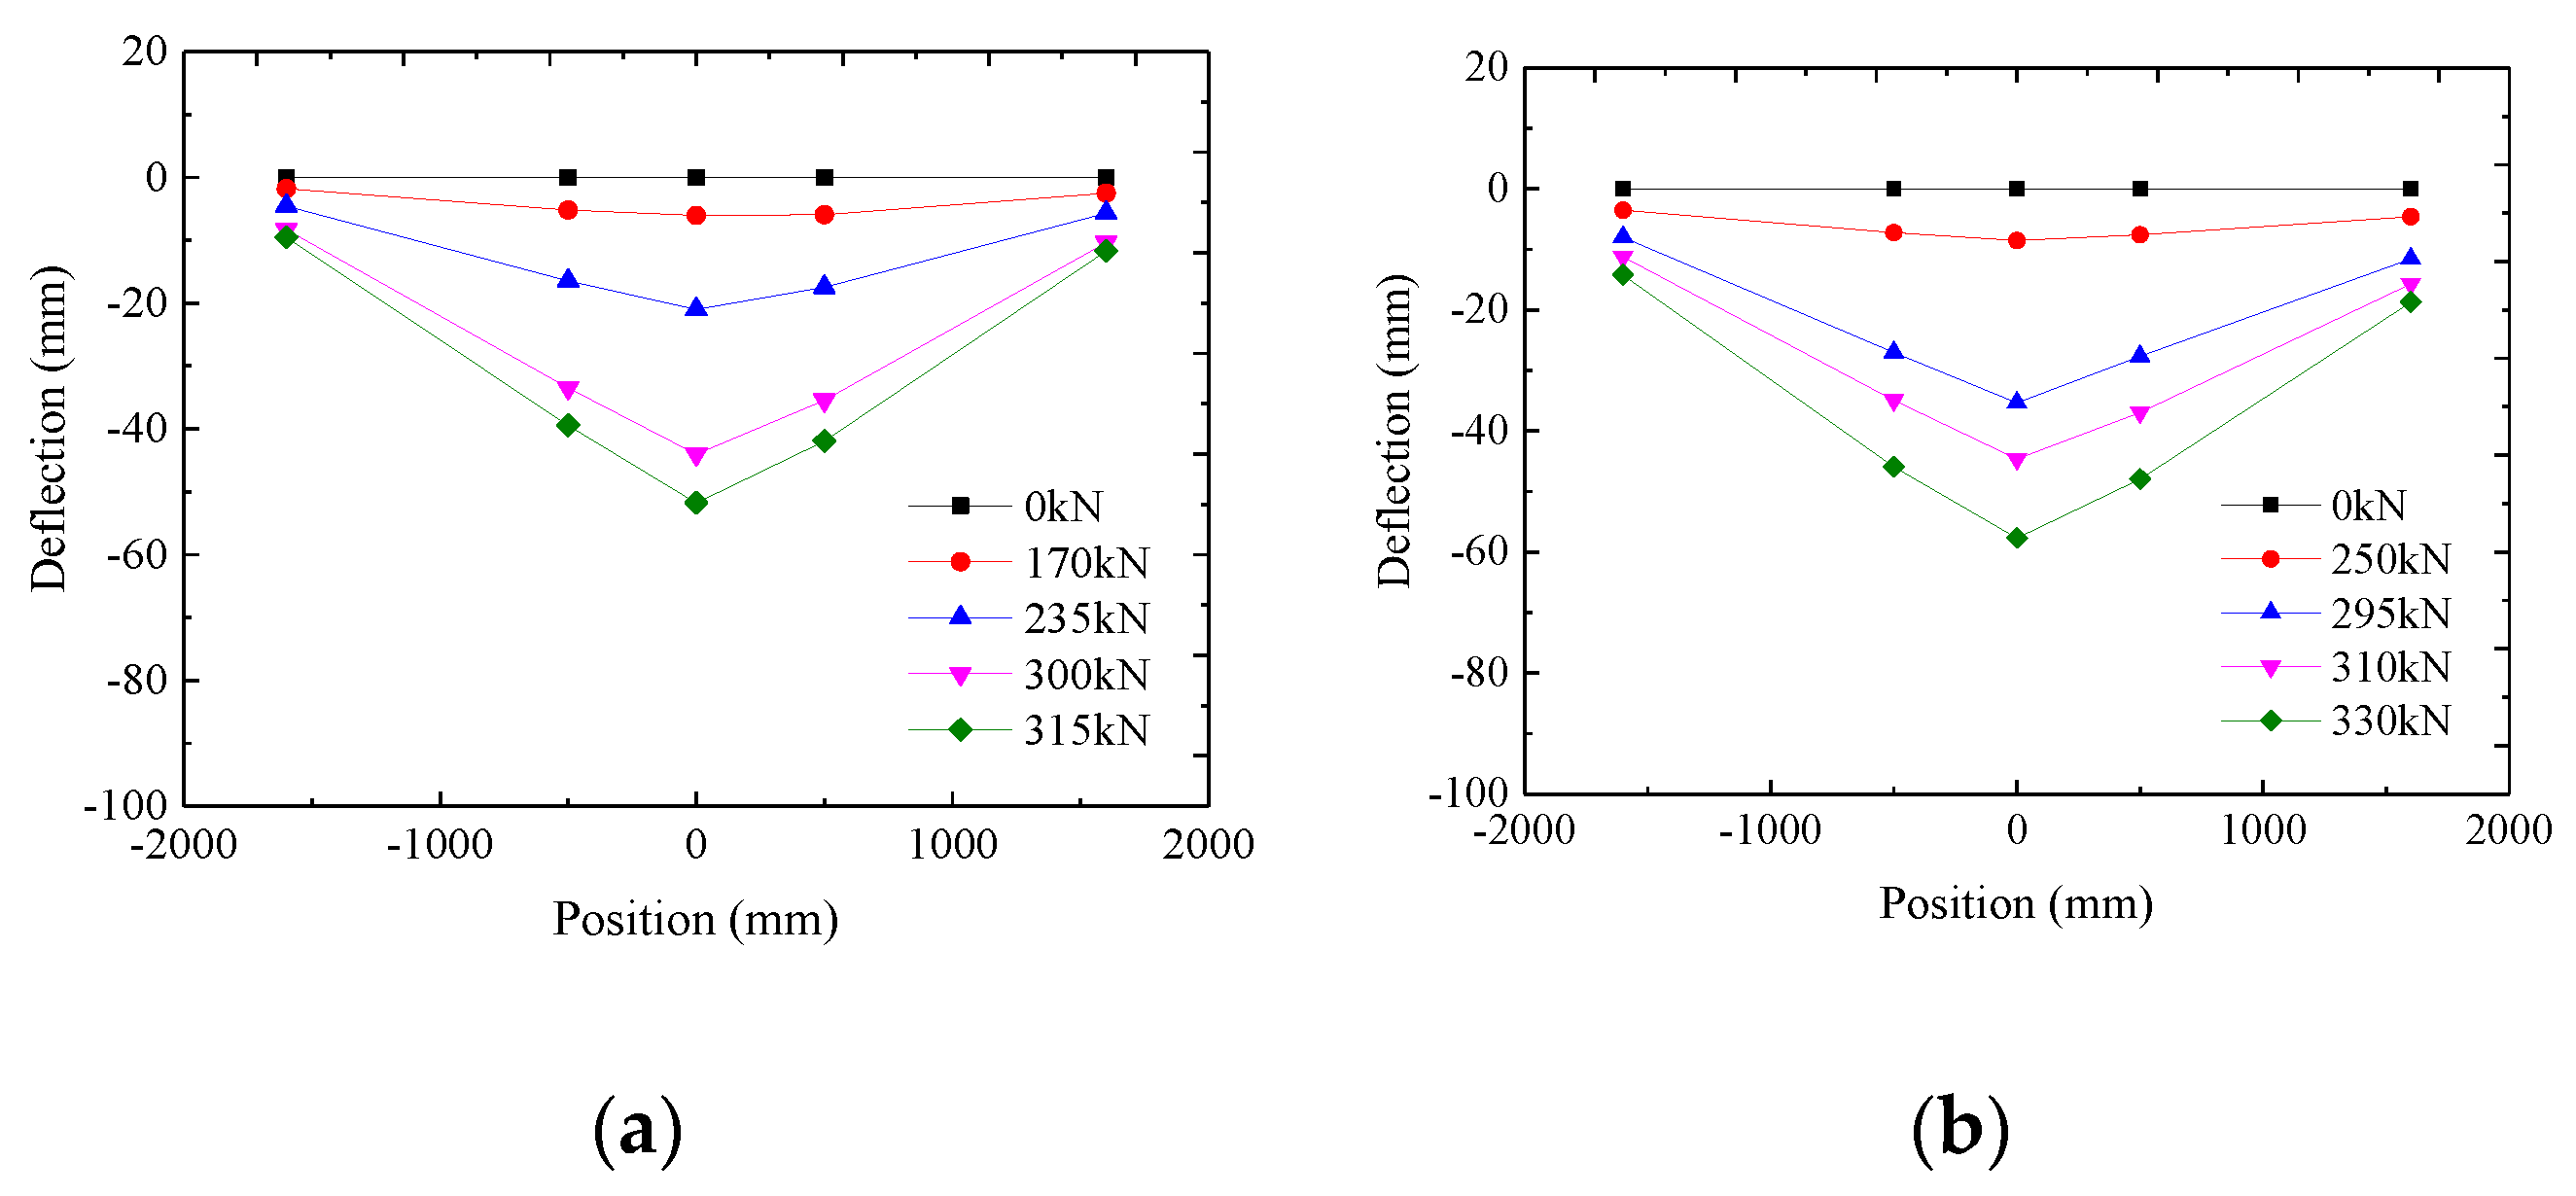
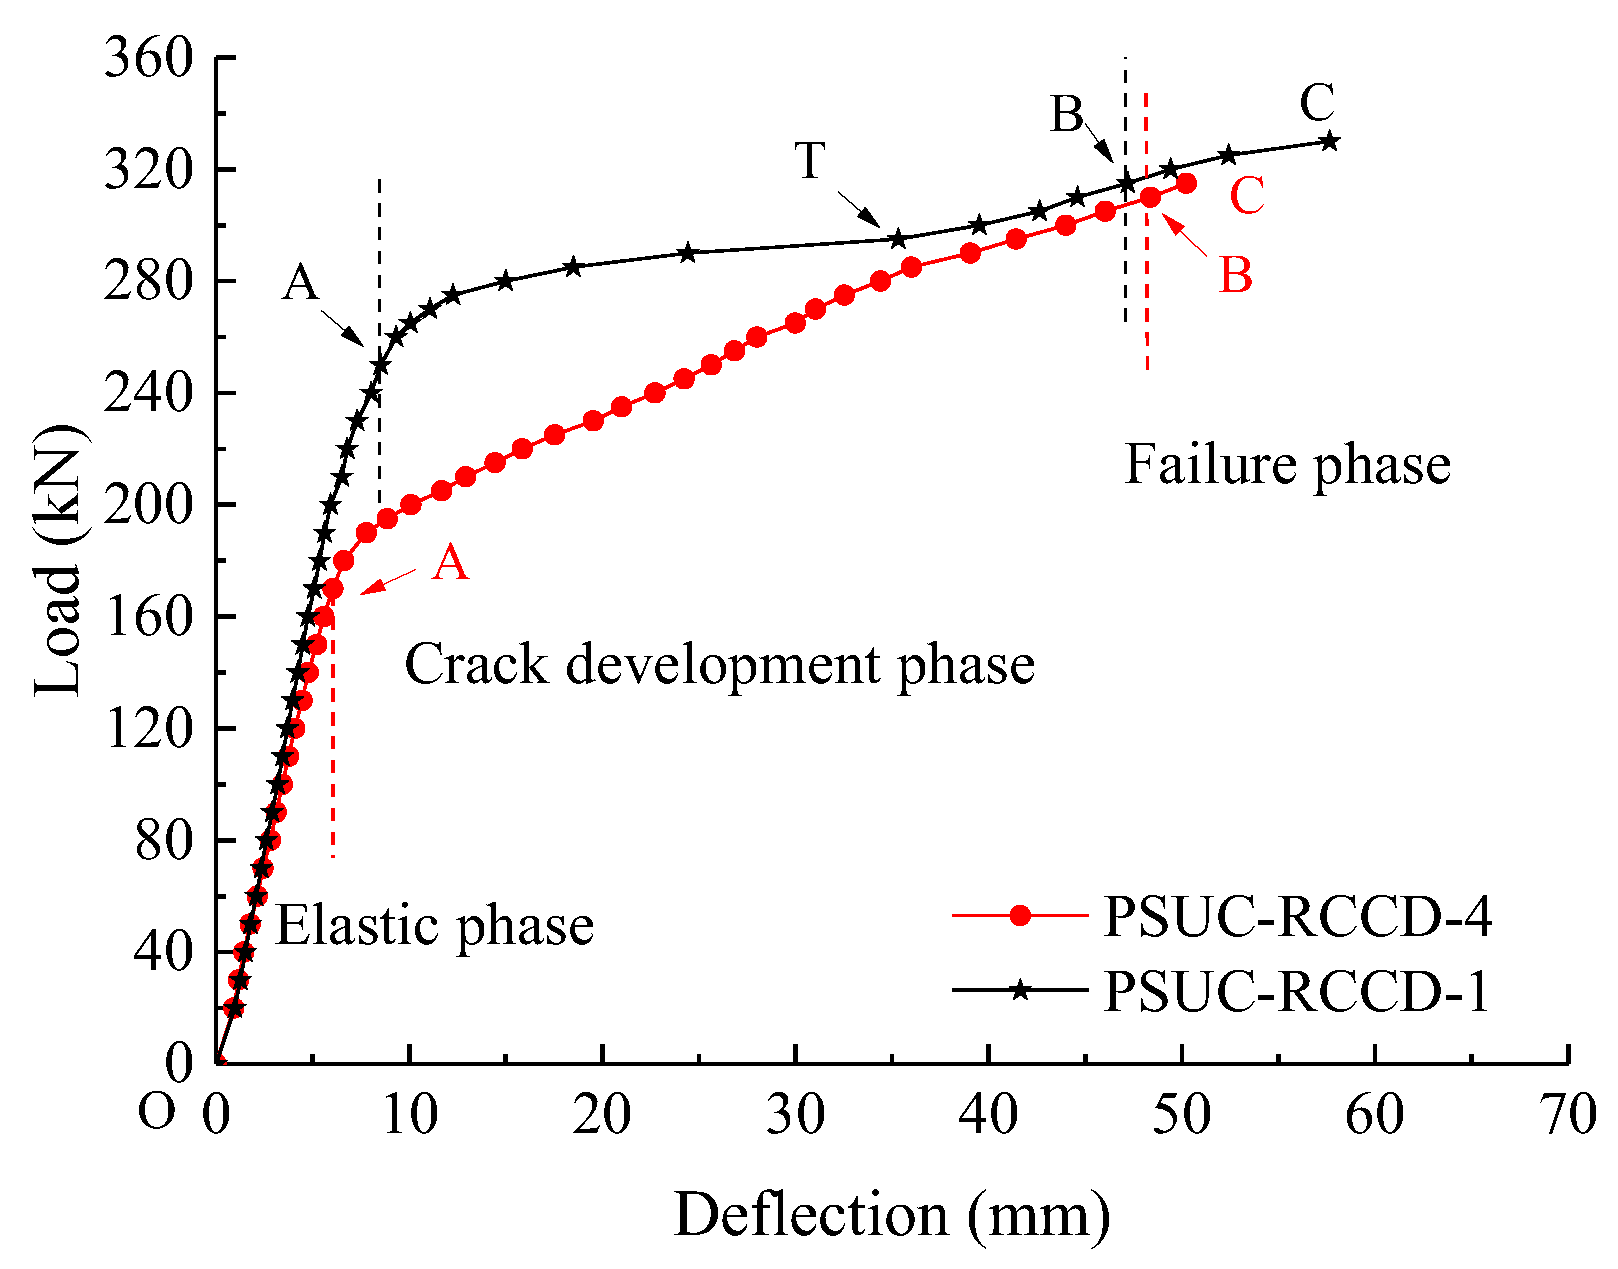
3.1. Load–Deflection Curves
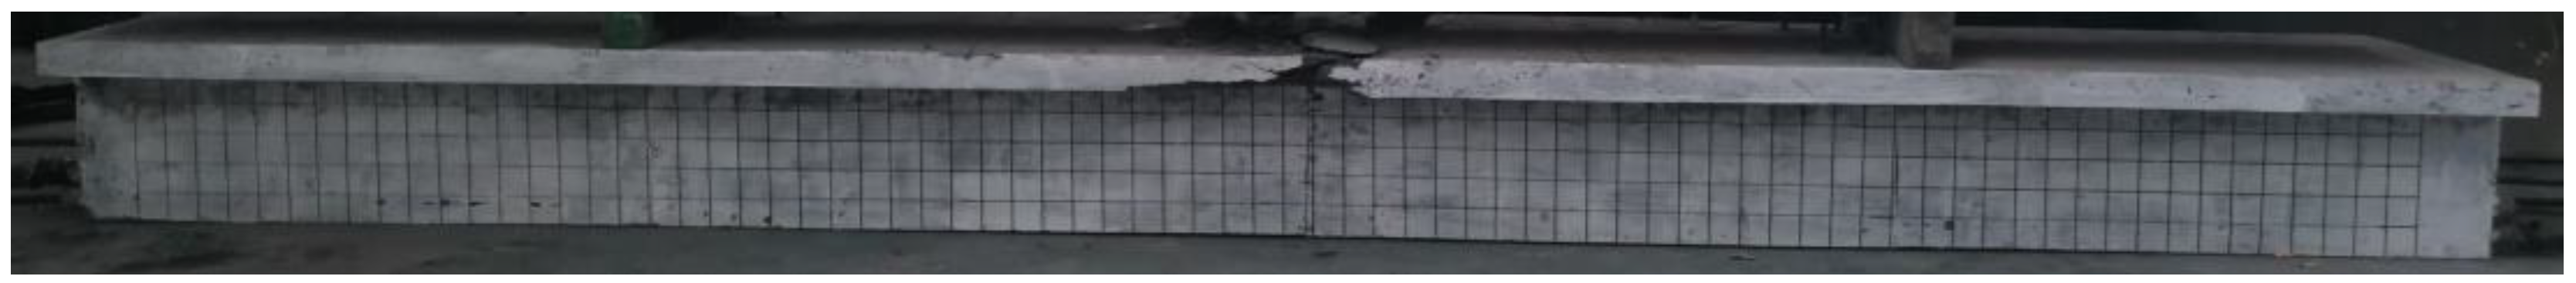
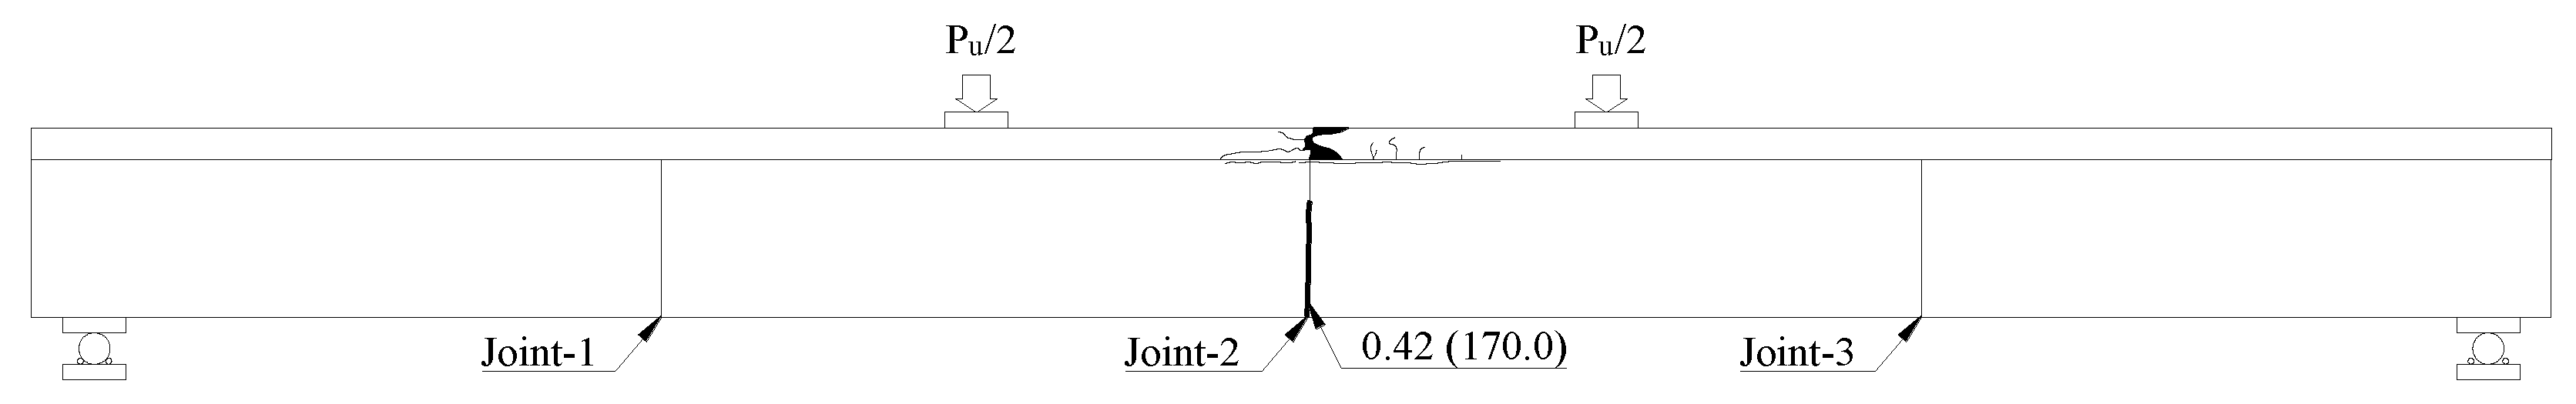
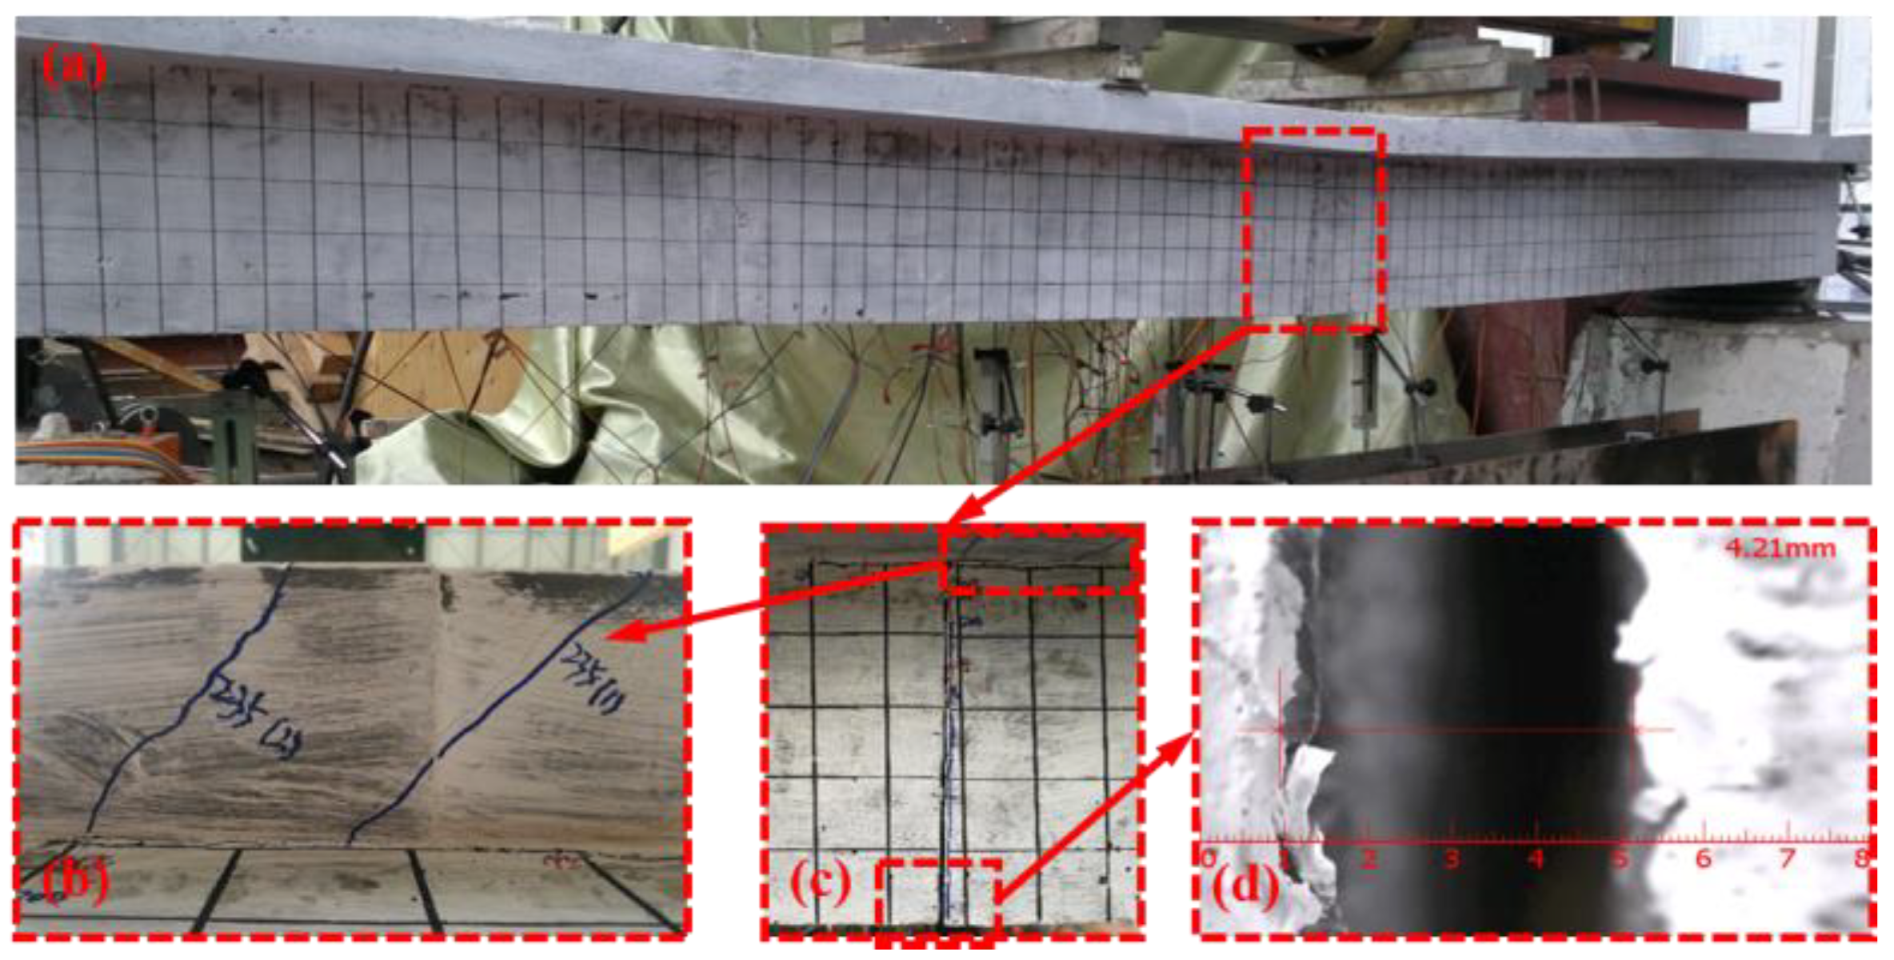
From the vertical deflection deformation in Figure 5, it is known that the deflection deformation of each section was symmetric about the span. The variation in the deflection of the semi-segmental girder and integral girder were similar. It can be seen that since the stresses were concentrated in the bending zone, the dry joints in the shear-span zone were not tensioned and had little influence on the vertical deflection; therefore, it can be equated to an integral girder.
Figure 6 shows the relationship between the applied load and the mid-span deflection of the specimens obtained from the test. The whole loading process of the PSUC–RCCD composite girders could be classified into three phases, i.e., the elastic phase, the crack development phase, and the failure phase.
Before cracking, the two specimens had almost the same initial stiffness, PSUC–RCCD-4 and PSUC–RCCD-1 were both in the elastic phase (curve OA) of the load history, and the mid-span deflection of the specimens was observed to increase linearly with the load, with the flexural stiffness of the specimens being constant. PSUC–RCCD-4 ended the elastic phase (Point A, 54% ultimate load Pu1, 170 kN) earlier than PSUC–RCCD-1 (74% Pu2, 250 kN). The maximum deflections at the end of this phase were 6.05 mm (12% ultimate deflection Wu1) and 6.90 mm (19% Wu2), respectively.
After cracking (after Point A), the girder entered into the crack development phase (the curve of AB). The flexural stiffness of the girders was observed to decrease with an increase in the load, and the rate of the increase in mid-span deflection increased. Since the tensile zone of PSUC–RCCD-4 was only supported by the prestressing strands, the flexural crack appeared at the dry joints quickly under the decompression moment, and then the stiffness of PSUC–RCCD-4 decreased rapidly. As a result of fiber bridging, the stiffness of PSUC–RCCD-1 decreased slowly. As the load increased, the steel fibers in PSUC–RCCD-1 were continuously pulled out, and at 90% Pu2 (295 kN, Point T), the two curves almost coincided.
The specimens entered the failure phase (curve BC) since the prestressing strands reached a nominal yield strength (Point B); the ultimate load of PSUC–RCCD-4 and PSUC–RCCD-1 was 315 kN (Pu1) and 330 kN (Pu2), respectively. It was observed that the ultimate load of the two was almost the same; the maximum deflection of PSUC–RCCD-4 and PSUC–RCCD-1 was 50.2 mm (Wu1) and 57.7 mm (Wu2), respectively.

3.2. Crack Patterns

The crack patterns of PSUC–RCCD-4 and PSUC–RCCD-1 after failure are illustrated in Figure 7 and Figure 8, respectively. The values in brackets are the load (kN) and the values outside brackets are the crack width (mm).
For PSUC–RCCD-4, the cracking load of the specimen was 54% Pu1 (170 kN), and a flexural crack appeared in Joint 2 with a width of 0.4 mm. As the load increased, the flexural crack in Joint 2 developed widely and deeply; meanwhile, no new flexural cracks appeared in the girder. As the load increased, this first crack developed in both width and length. When the load reached 75% Pu1 (235 kN), the flexural crack developed to the RCCD slab, as shown in Figure 9. At this time, the maximum crack width was 4.2 mm.
At 95% Pu1 (300 kN), the prestressing strand reached its nominal yield strength, and the maximum crack width was 11 mm. At the failure phase, as the flexural load reached the maximum value of Pu1 (315 kN), the concrete of the upper slab was crushed(Figure 10). The maximum width of the mid-span crack was 14.8 mm.
For PSUC–RCCD-1, when the load reached 76% Pu2 (250 kN), the flexural crack with a maximum width of 0.1 mm appeared at the mid-span. When the load reached 295 kN (89% Pu2), the flexural crack developed to the RC flange (Figure 11), and then a horizontal crack appeared along the girder’s length. At this time, the maximum width of the mid-span crack was 5.5 mm.
After the load reached 310 kN (94% Pu2), the prestressing strand reached its nominal yield strength and the flexural crack’s width was 10.6 mm. When the load increased to 330 kN (Pu2), the top slab was crushed. (Figure 12) The flexural crack’s width was 16.1 mm.
As can be seen from Figure 7 and Figure 8, the failure modes of the integral girder and the semi-segmental girder were similar; after the specimen cracked, a vertical crack appeared in the span, and with an increase in the load, the crack reached the top slab and developed on the flange, followed by the prestressing strands reaching the nominal yield strength, the t-slab being crushed, the load being rapidly reduced, and the specimen being declared a failure.
If we compare the distribution of cracks in the two specimens, under the bending moment, only one flexural crack appeared at the dry joint in the mid-span of PSUC–RCCD-4. However, multiple cracks appeared in the pure flexure area of PSUC–RCCD-1. Therefore, for the segmental girder, it was more convenient to estimate the location of cracking and its development.

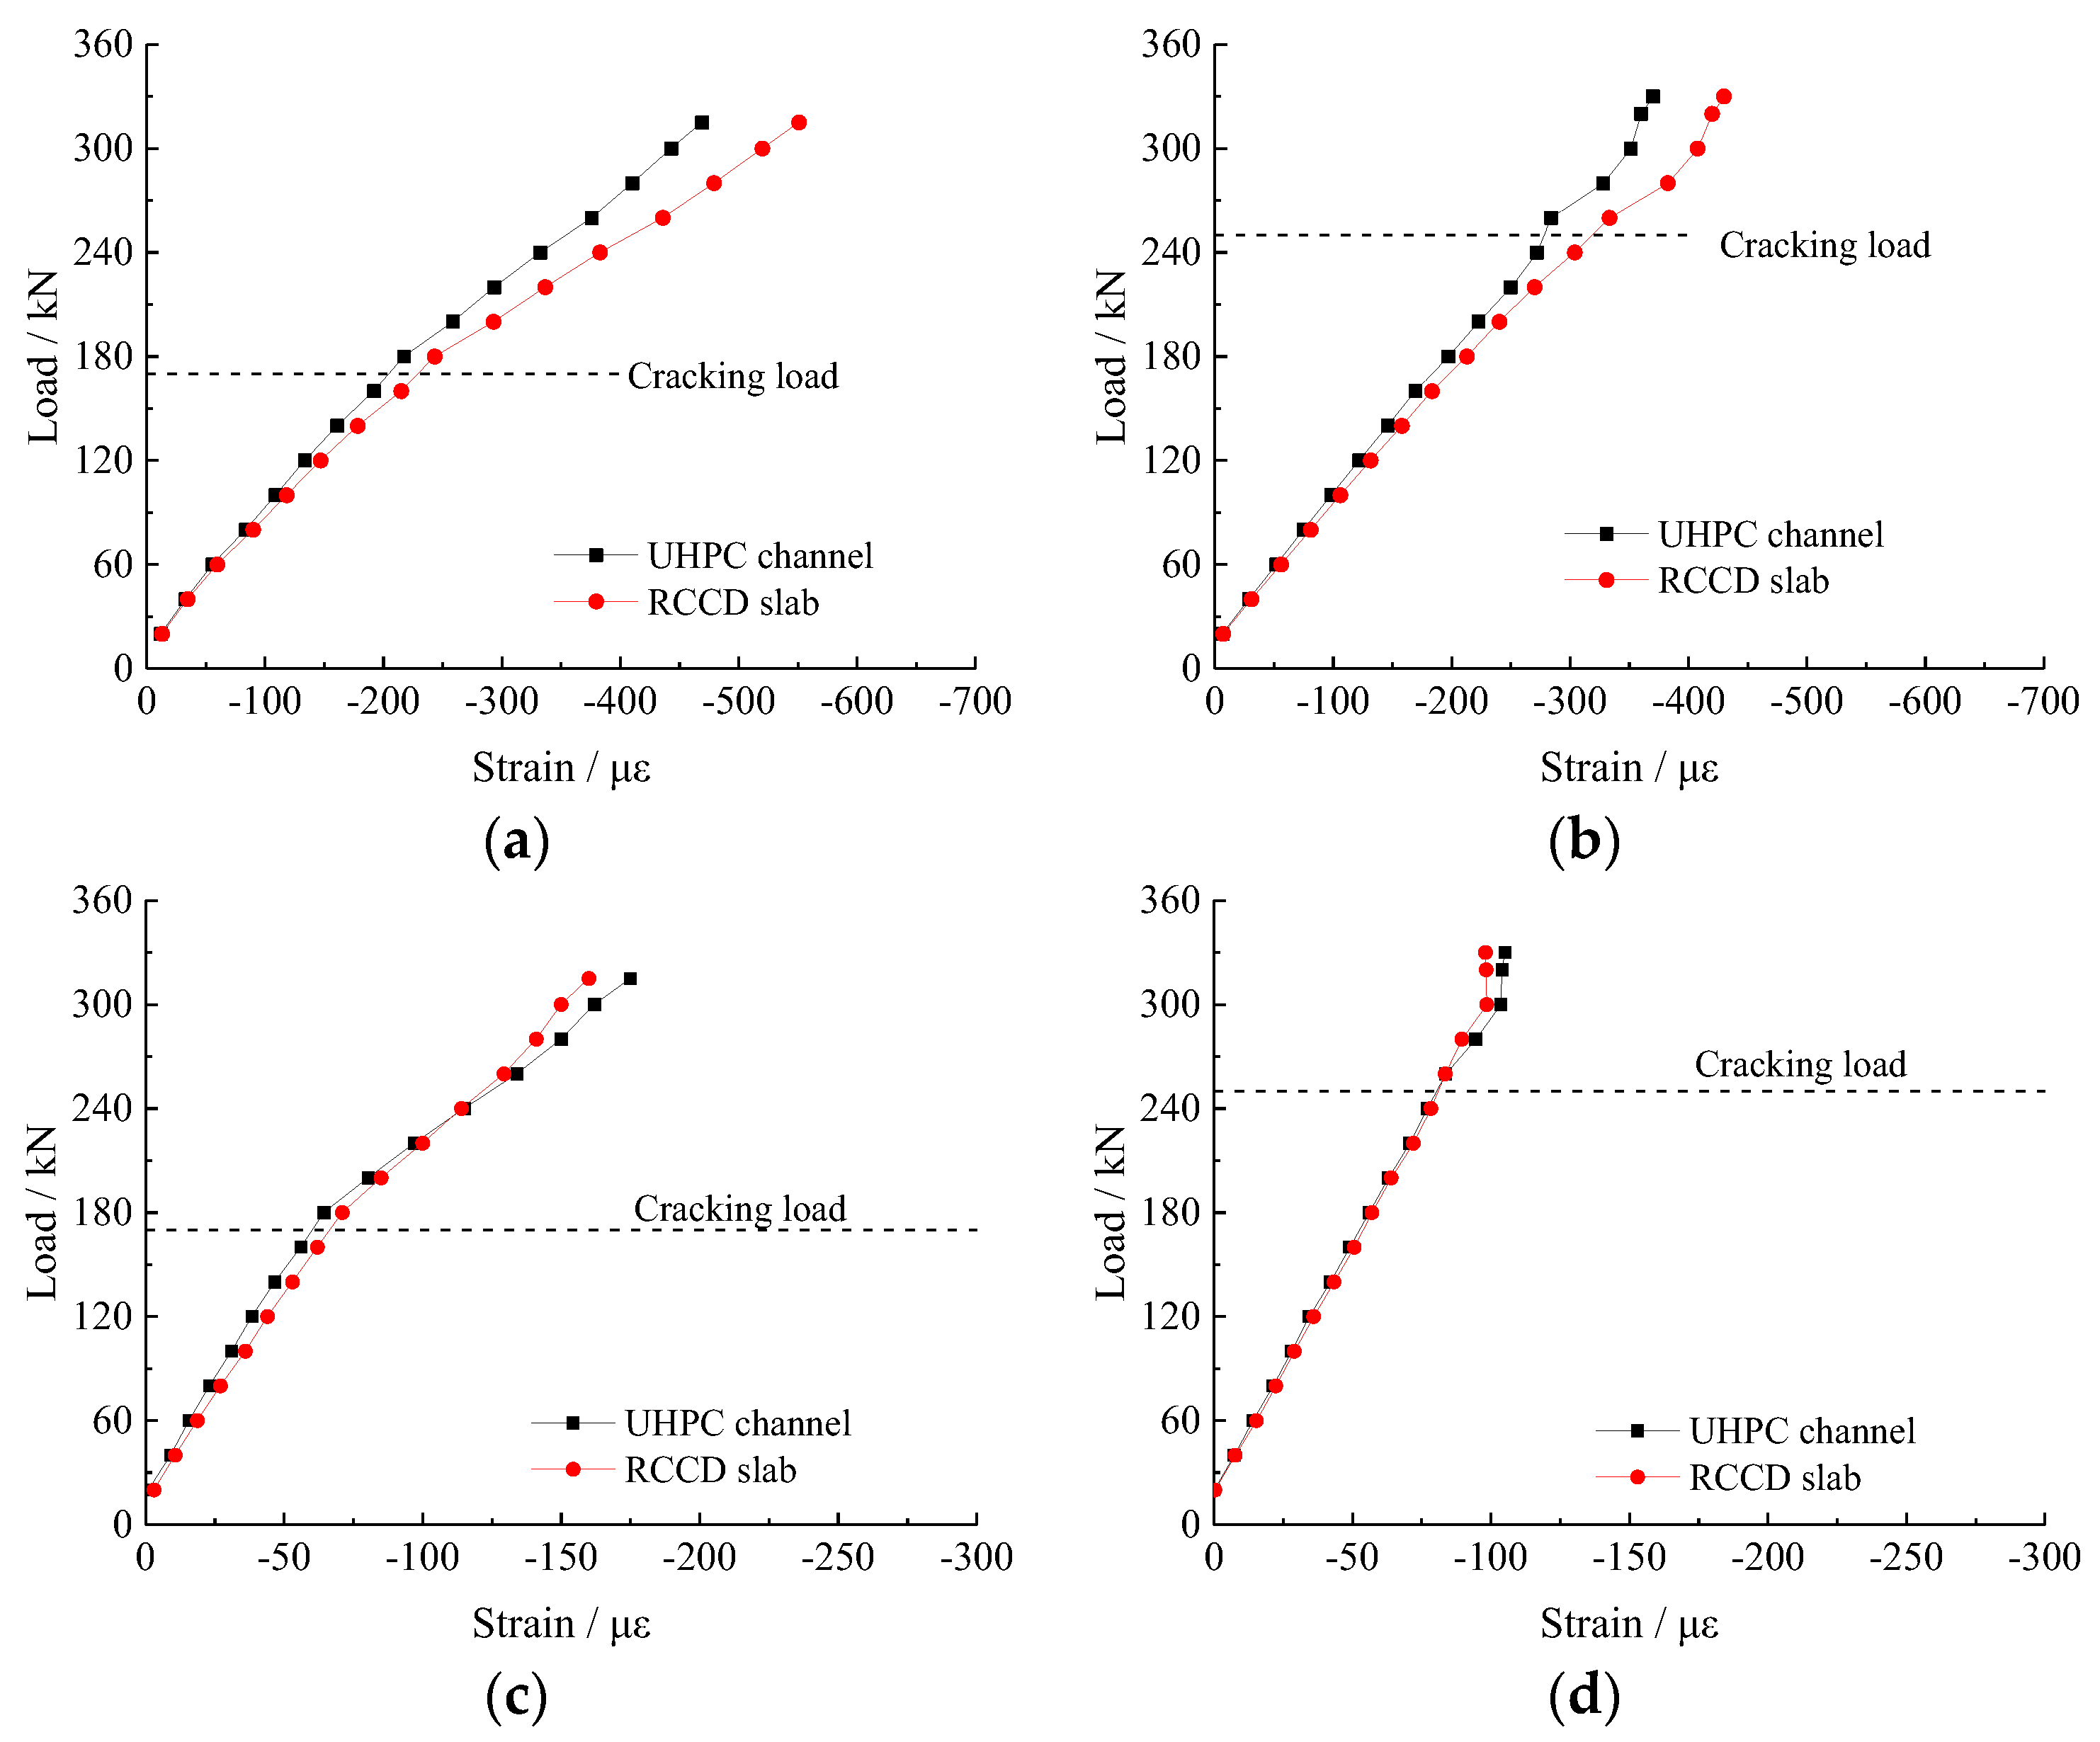
3.3. Load–Concrete Strain Curve

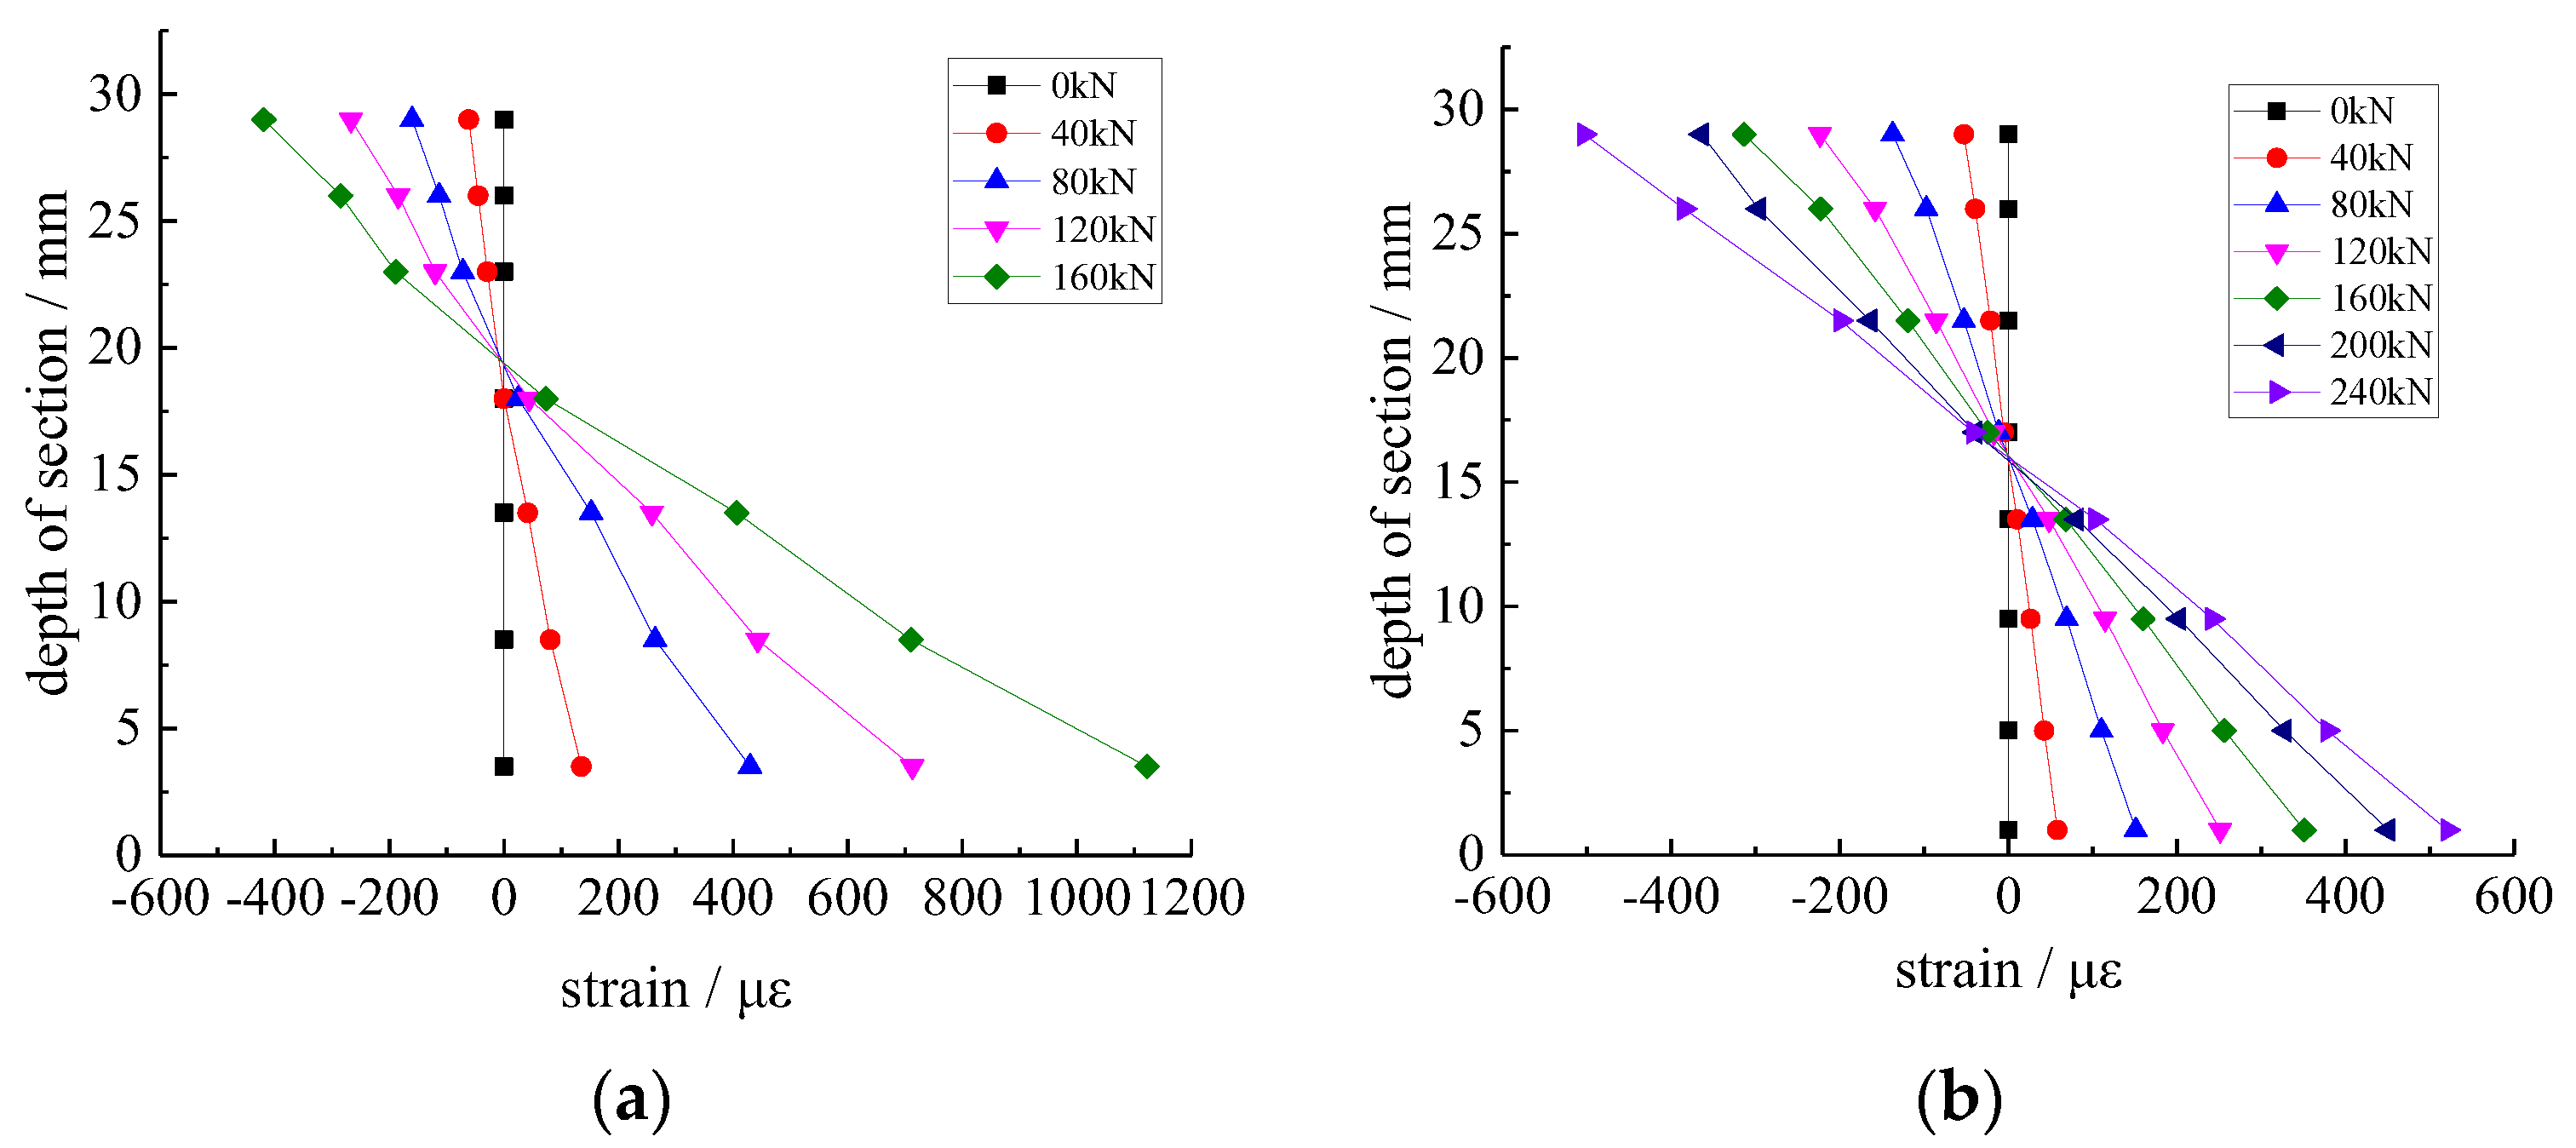
3.3.1. Distribution at Mid-Span

It can be seen from Figure 13 that the distribution of concrete strain at the mid-span of PSUC–RCCD-4 and PSUC–RCCD-1 before cracking was linearly distributed along the girder’s section, satisfying the plane section assumption. The strain gauges in the tensile zone of PSUC–RCCD-4 were damaged by tension after 170 kN, and those of PSUC–RCCD-1 were damaged after 240 kN.

3.3.2. The Interface between the UHPC Channel and the RCCD Slab

Figure 14 shows the load–strain curves at the interface between the UHPC channel and the RCCD slab (at Points S6 and S1, Figure 4). The deformation of the UHPC channel and RCCD slab was consistent. It is important to note that Point S6 in the middle of the span is the point where the RCCD slab and the UHPC beam differed the most, but they tended to be the same overall. The strain curves at the remaining points of the slab and girder nearly overlapped, as at Point S1, and are not repeated for space reasons.
Therefore, the RCCD slab and the UHPC channel had good co-deformation, and the segmental girder can be considered as an integral UHPC girder before cracking.

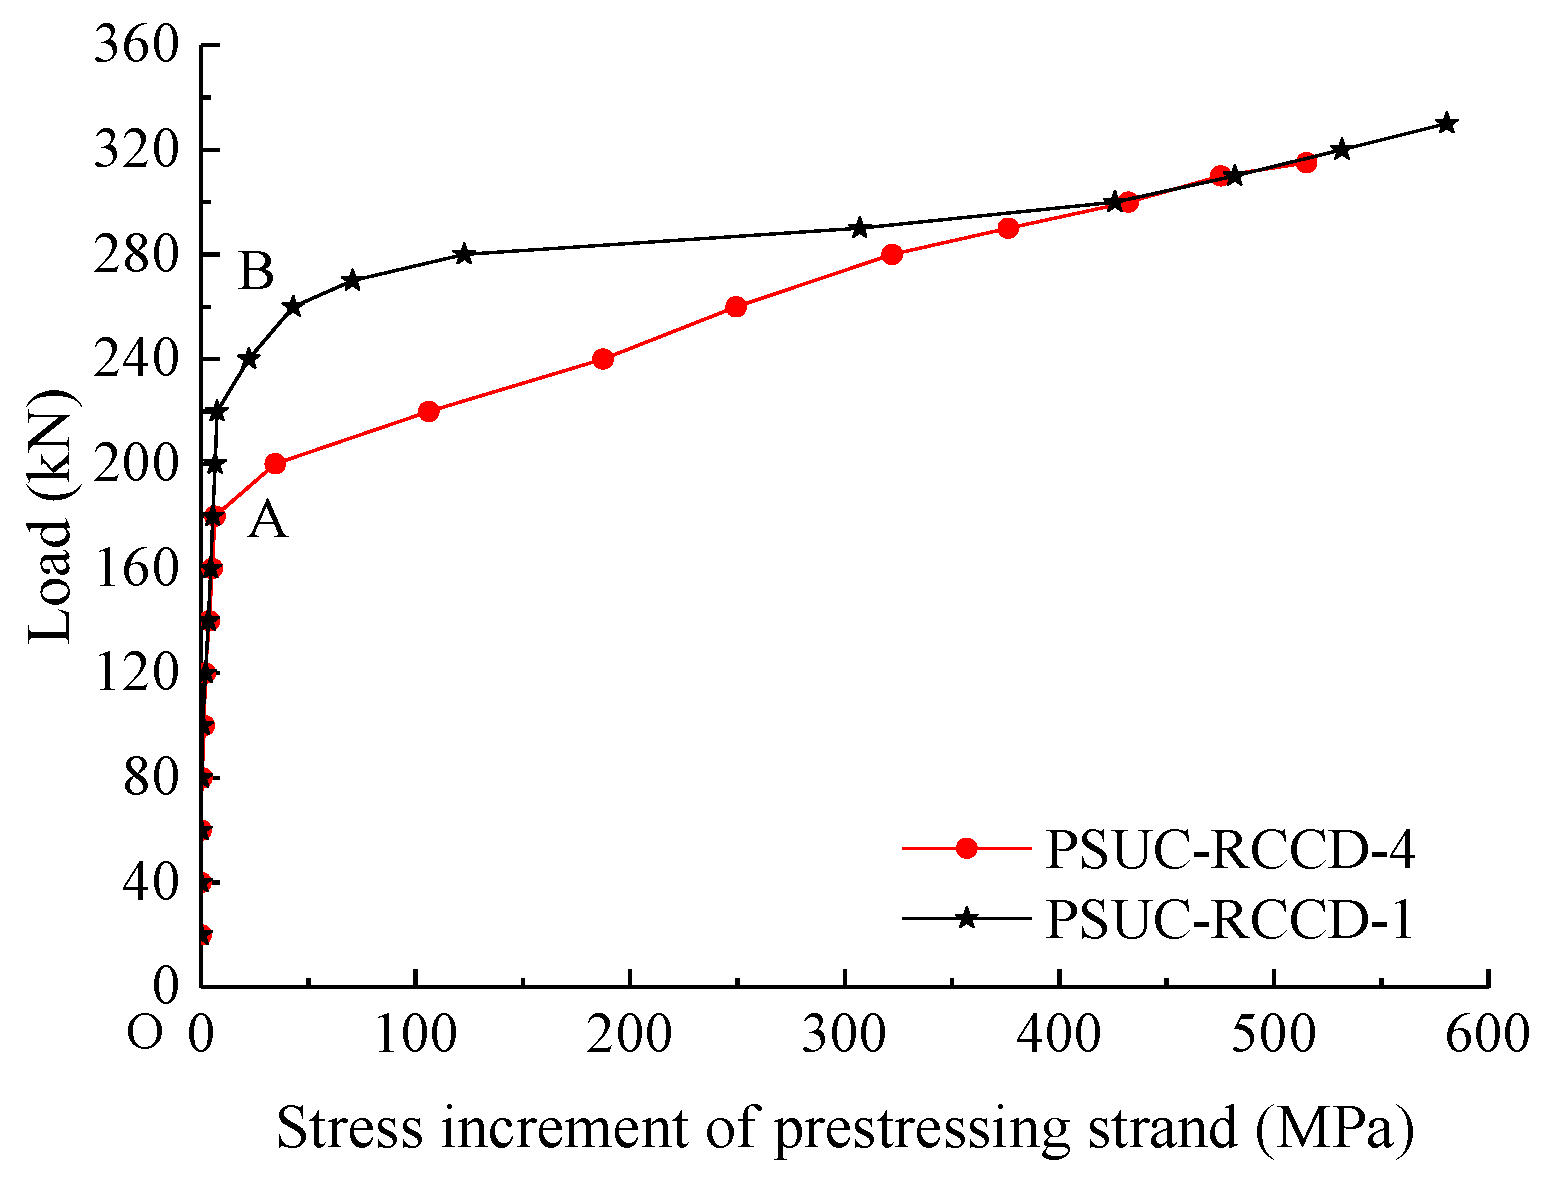
3.4. Curve of Load vs. Stress Increment of the Prestressing Strands

The curve of load vs. the stress increment of the prestressing strand of the specimens is shown in Figure 15. The prestressing strands of PSUC–RCCD-4 and PSUC–RCCD-1 were tensioned by an effective jacking force of 147 kN and 145 kN during post-tensioning, respectively. Before cracking, the increase in the prestressing strand of the two specimens was basically similar. After cracking (Points A and B), the increase in the prestressing strand of the two specimens increased obviously, and a curve appeared at the inflection point. After 295 kN, the curves of the two types of girders almost overlapped again because the steel fibers between the cracks in the integral girder were constantly pulled out, resulting in the exhaustion of the UHPC’s tensile strength and the crack behaving as a dry joint. When the load reached 300 and 310 kN, the stress increment of the prestressing strands in the specimens was 432.2 MPa and 481.7 MPa, respectively, for PSUC–RCCD-4 and PSUC–RCCD-1, and the stresses in the prestressing strands both exceeded their nominal yield strength of 1490 MPa. When the specimens failed, the value of the increase in the prestressing strands of PSUC–RCCD-4 and PSUC–RCCD-1 reached 1573 MPa and 1623 MPa, respectively.
The curve of deflection vs. the stress increment of the prestressing strands of the specimens is shown in Figure 16. It can be seen that the deflection of the specimens and the increase in the stress of the prestressing strand in the specimens were linearly related.

4. Finite Element Method Analysis

Based on the experimental study in Section 3, a finite element model (FEM) of the PSUC–RCCD composite girder was established using ABAQUS 6.14-4 software.

4.1. Finite Element Model

4.1.1. Model of Material Properties

The damage plasticity model considering the tensile and compressive properties of the material was used for the constitutive model of concrete in ABAQUS.
The models for predicting the nonlinear material properties of the UHPC under compression and tension [19], as shown in Equations (1) and (2), respectively, were considered in the FE analyses.
y = { 1.2 x 0.2 x 6 ( 0 x 1 ) x 10 ( x 1 ) 2 + x ( x 1 )
where x = εccp, y = σccp, εc, and σc are the compressive strain and compressive stress of the UHPC, and εcp and σcp are the peak values of the compressive strain and compressive stress of the UHPC.
y = { x 0.92 x 1.09 + 0.08 ( 0 x < 1 ) x 0.1 ( x 1 ) 2.4 + x ( 1 x )
where x = εttp, y = σttp, ε, and σ are the tensile strain and tensile stress of the UHPC, and εtp and σtp are the peak values of tensile strain and tensile stress of the UHPC.
The εcp, σcp, εtp, and σtp of the UHPC were obtained from the experimental tests.
The constitutive relations of CC were based on the uniaxial tension and compression strain curves proposed in [29]. The constitutive model of reinforcement adopted the bilinear model, and the prestressed strand adopted the trilinear model.

4.1.2. Unit Types and Interrelationships

An eight-node hexahedral element (C3D8R) was adapted to simulate the concrete material (UHPC and CC), and a two-node truss element (T3D2) was used to simulate the steel material (reinforcement and prestressing strands). The embedding method was used to establish the coupling between the reinforcement and the UHPC or CC material to simulate the bond between them.
For the UHPC channel beam, a rigid spring was set between the UHPC and the prestressing strand. The prestressing strands and UHPC of the UHPC channel allowed relative sliding and the “decreasing temperature method” was used to apply a prestressing force to the prestressing strands.
Hard contact and a friction coefficient were used to simulate the transmission of force and the contact mode at the dry joint of the girder.

4.1.3. Boundary Conditions, Meshing, and Loading Methods
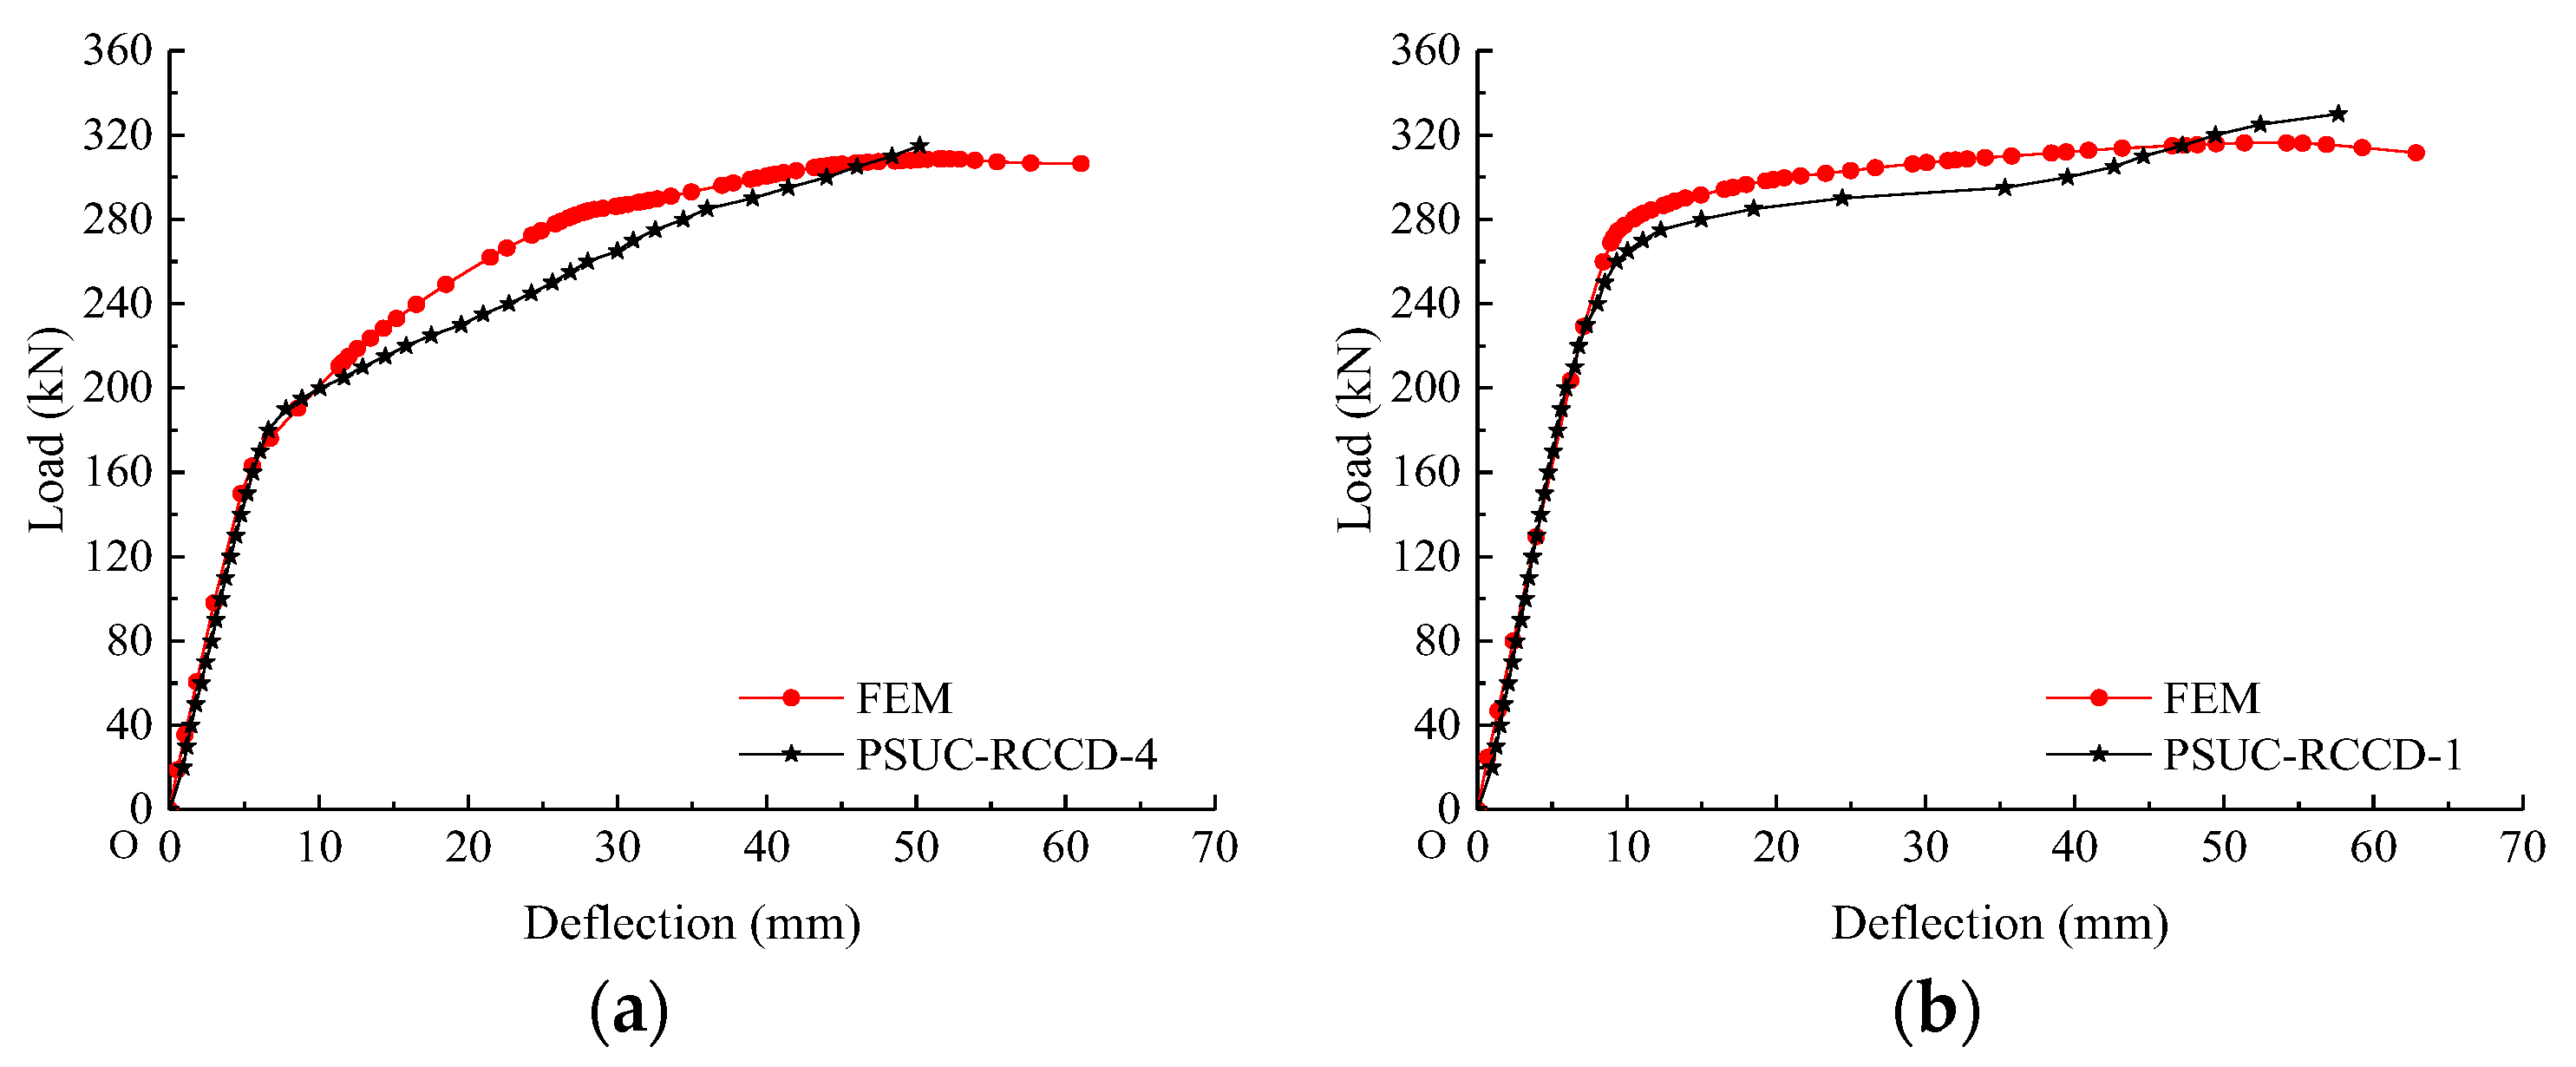
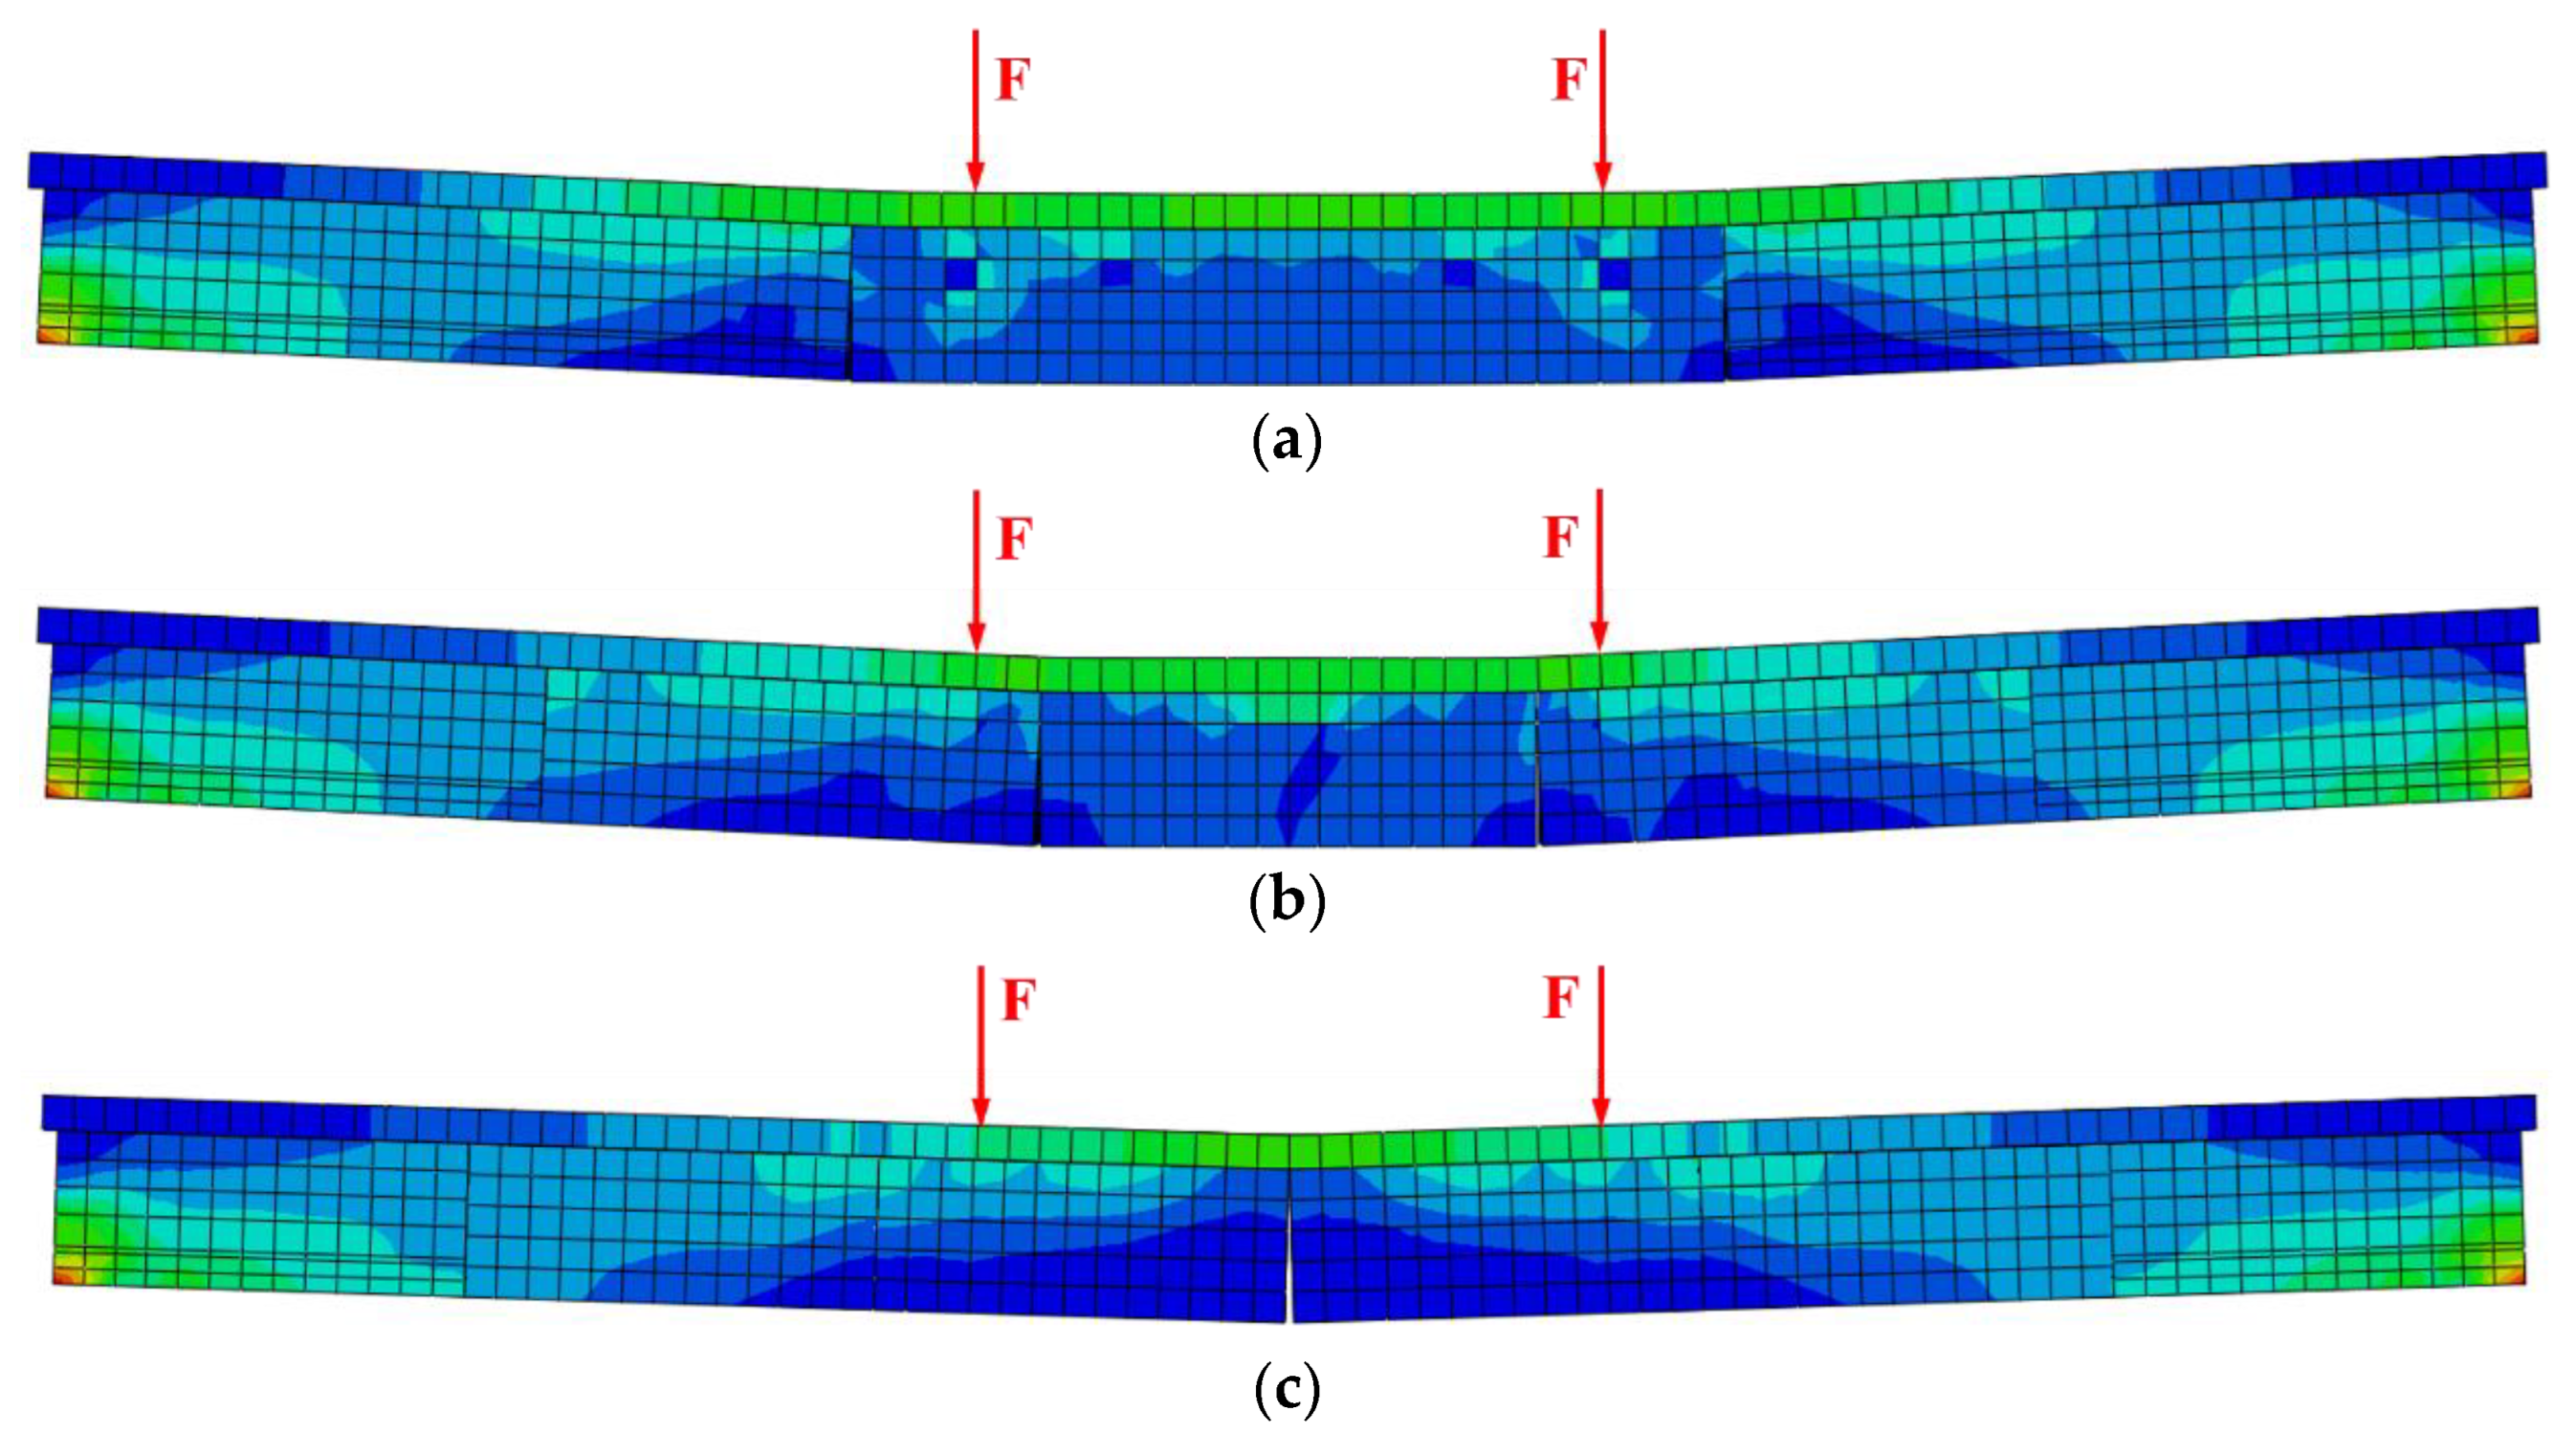
To model the boundary conditions associated with the bottom surface, one end of the girder was a pinned support, whereas the other end was sitting on a pin and a roller support to ensure free rotation and horizontal translation as required. The model was divided by structured meshing, and the mesh size was 20 mm × 20 mm × 20 mm.
Figure 17 shows the two parts of a typical FEM, namely, the steel cage (including the longitudinal and transverse reinforcements in the top slab, the prestressing strands in channel beam, and the shear bar at the interface of the top slab and channel beams) and the concrete.
The two concentrated loads shown in Figure 4 were applied to the top loading blocks as two concentrated loads. Rigid blocks were modeled at the loading points and at the support points of the girder to avoid premature failure due to the concentration of stress.

4.1.4. FEM Results

Figure 18 shows a comparison of the stress nephogram obtained from the finite element calculation and the failure diagram of the specimen, and Figure 19 shows the relationship between the load and the mid-span deflection of the girder obtained from the test and the FEM. The results of FEM analysis were basically consistent with the test results, and the established FEM of the test girder could accurately simulate the flexural behavior of the PSUC–RCCD composite girder.
It was shown that the ultimate load obtained from the FE analysis of the PSUC–RCCD-4 and PSUC–RCCD-1 girders was 308 and 316 kN, respectively, which was in good agreement with the maximum applied load reached experimentally (315 kN and 330 kN).

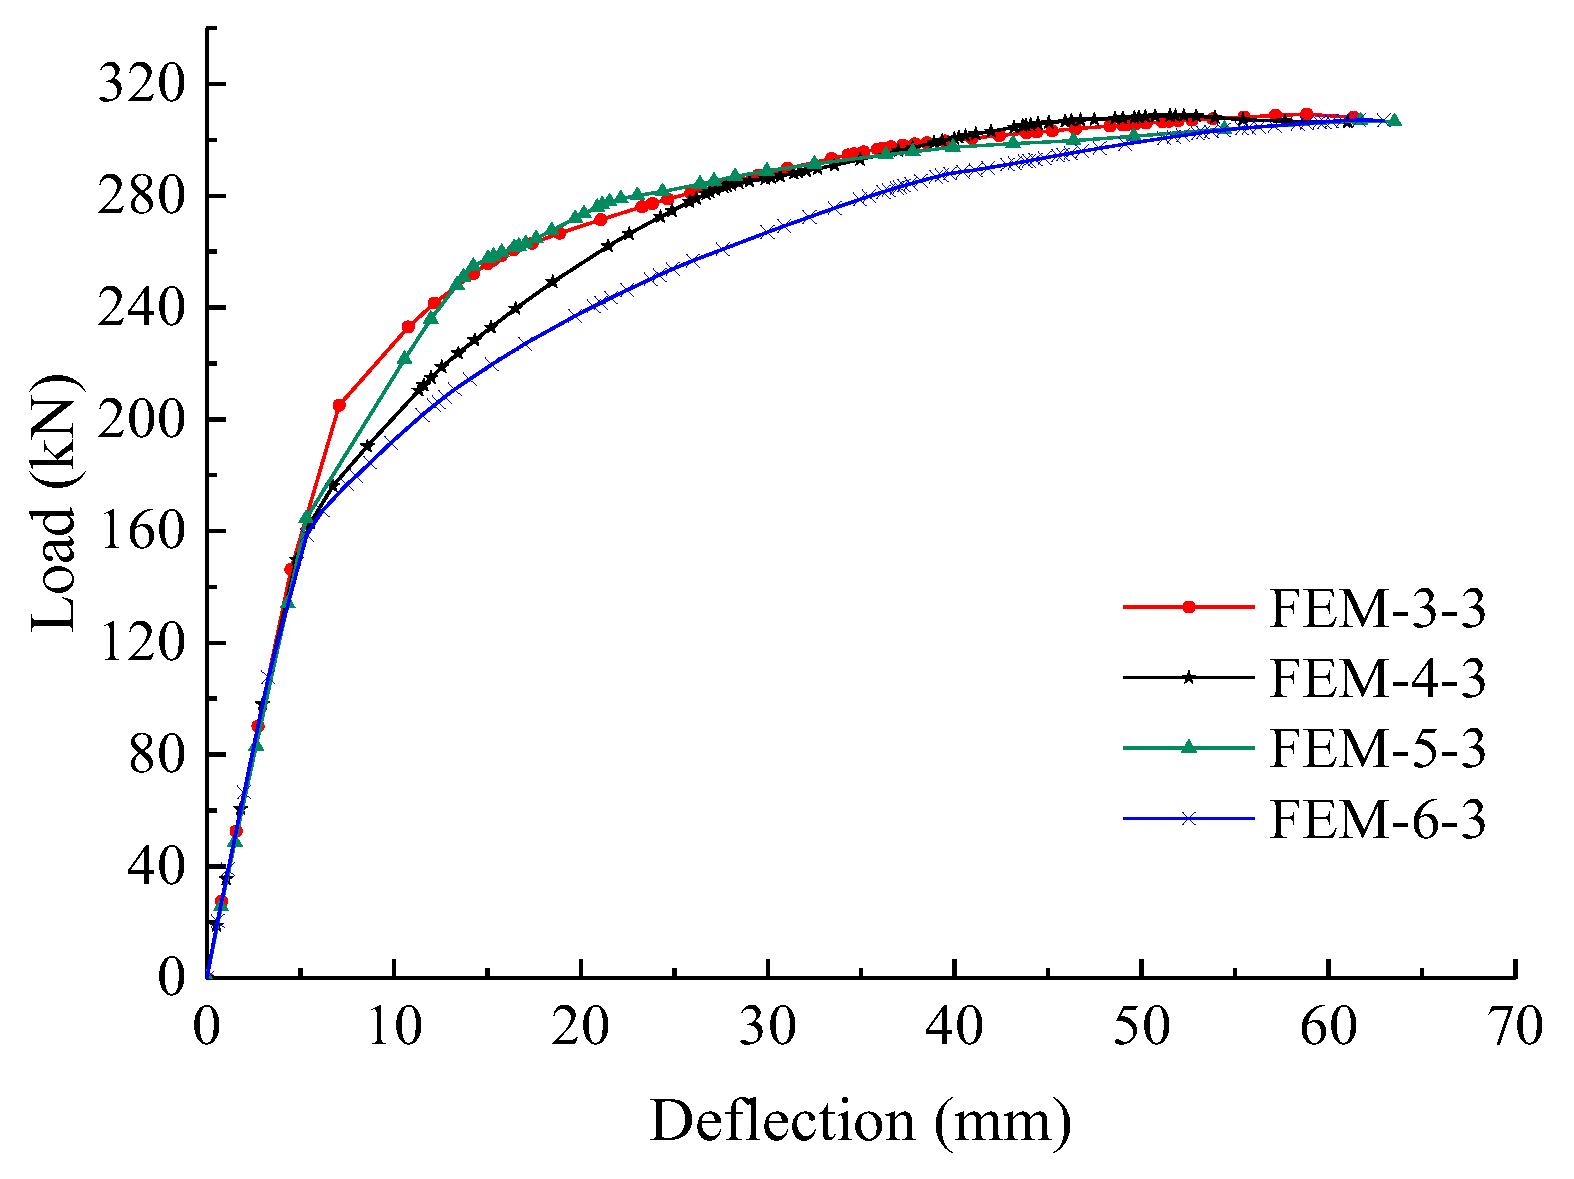
4.2. Parameter Analysis

Based on the verified FEM of the tested girder, parametric analyses were conducted to address the influences of the number of segments and the steel fiber volume fraction of UHPC on the flexural strength of the girder, as listed in Table 5.
Here, the girder notation FEM-x-y means that the number of segments is x and the steel fiber volume fraction of UHPC is y%. Mn,EFM indicates the flexural capacity of the segmental girders from the FEM.

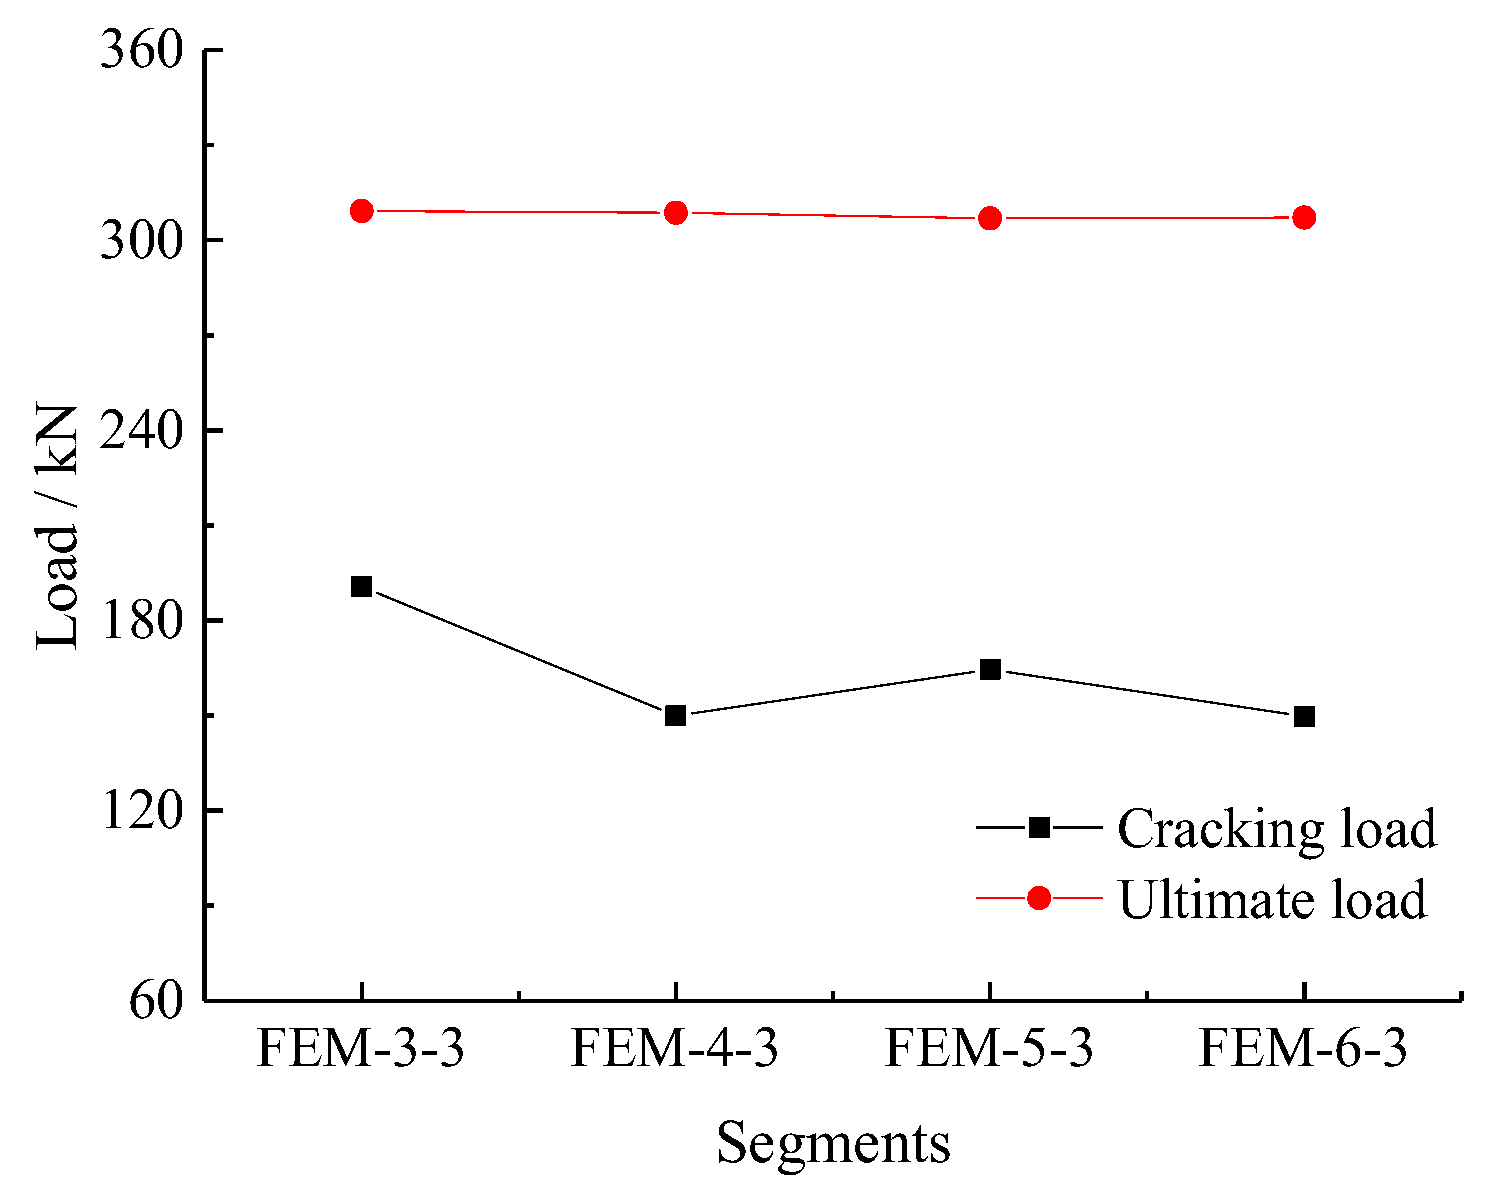
4.2.1. Number of Segments

Figure 20 shows the load–deflection curves of the PSUC–RCCD girders with different numbers of segments (the number of segments was from 3 to 6). Figure 21 shows the load–segment curve of PSUC–RCCD girders with different numbers of segments.
It can be seen that the trends of the curves of the four FEM girders were similar. By comparing the FEM girders with different numbers of segments, it can be found that the FEM girders with an odd number of segments (three and five segments) entered the crack development phase earlier than that those with an even number of segments (four and six segment). After cracking, for FEM girders with an even number of segments, the section’s stiffness weakened faster than in those with an odd number of segments, and the deflection deformation was larger than in those with an odd number of segments under the same load.
As can be seen in Figure 22, and the experimental results for PSUC–RCCD-4 (Figure 7), the flexural cracks in the FEM girders with an even number of segments were concentrated in the mid-span of the girders. The flexural cracks of the FEM girders with an odd number of sections were symmetrically distributed at the location of the load. The widths of the cracks in the girders with an odd number off segments were smaller than those in girders with an even number of segments. As a result, the forces in the mid-span section of the girders with an even number of segments were more concentrated, cracking earlier, and the stiffness decreased more.

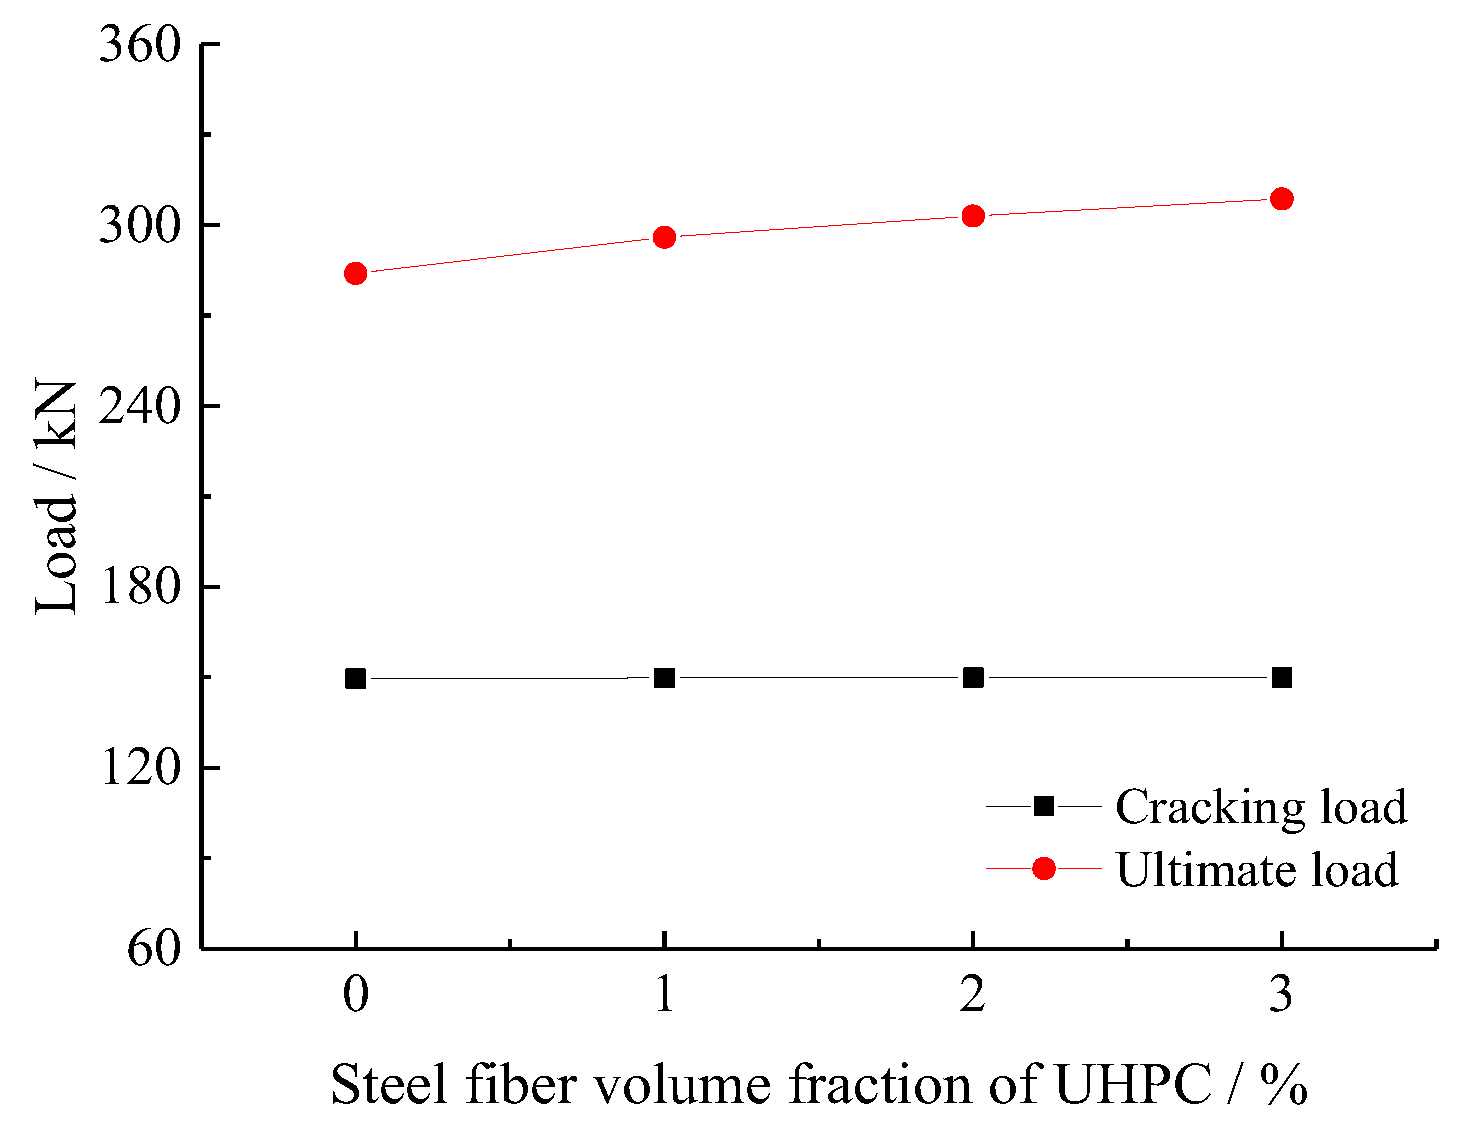
4.2.2. Steel Fiber Volume Fraction of UHPC

Figure 23 shows the load–deflection curves of PSUC–RCCD girders with different steel fiber volume fractions of UHPC (0–3%). Figure 24 shows the load–steel fiber volume fraction of UHPC curve of PSUC–RCCD girders with different steel fiber volume fraction of UHPC.
For the PSUC–RCCD composite girder (four segments), a crack developed at the dry joint of the girder, so UHPC was not able to utilize its tensile properties. Therefore, the steel fiber volume fraction of UHPC had little influence on the cracking load.
After cracking, when the upper part of the UHPC web was under pressure (i.e., the central axis was located inside the UHPC web), the UHPC could exert its compressive effect. Therefore, the steel fiber volume fraction of UHPC increased from 0% to 3%, and the ultimate load of the girder was increased (9.8%) due to the increased compressive strength of the UHPC. The stiffness of the girders increased with the steel fiber volume fraction of UHPC.

5. Methods of Calculating Flexural Capacity

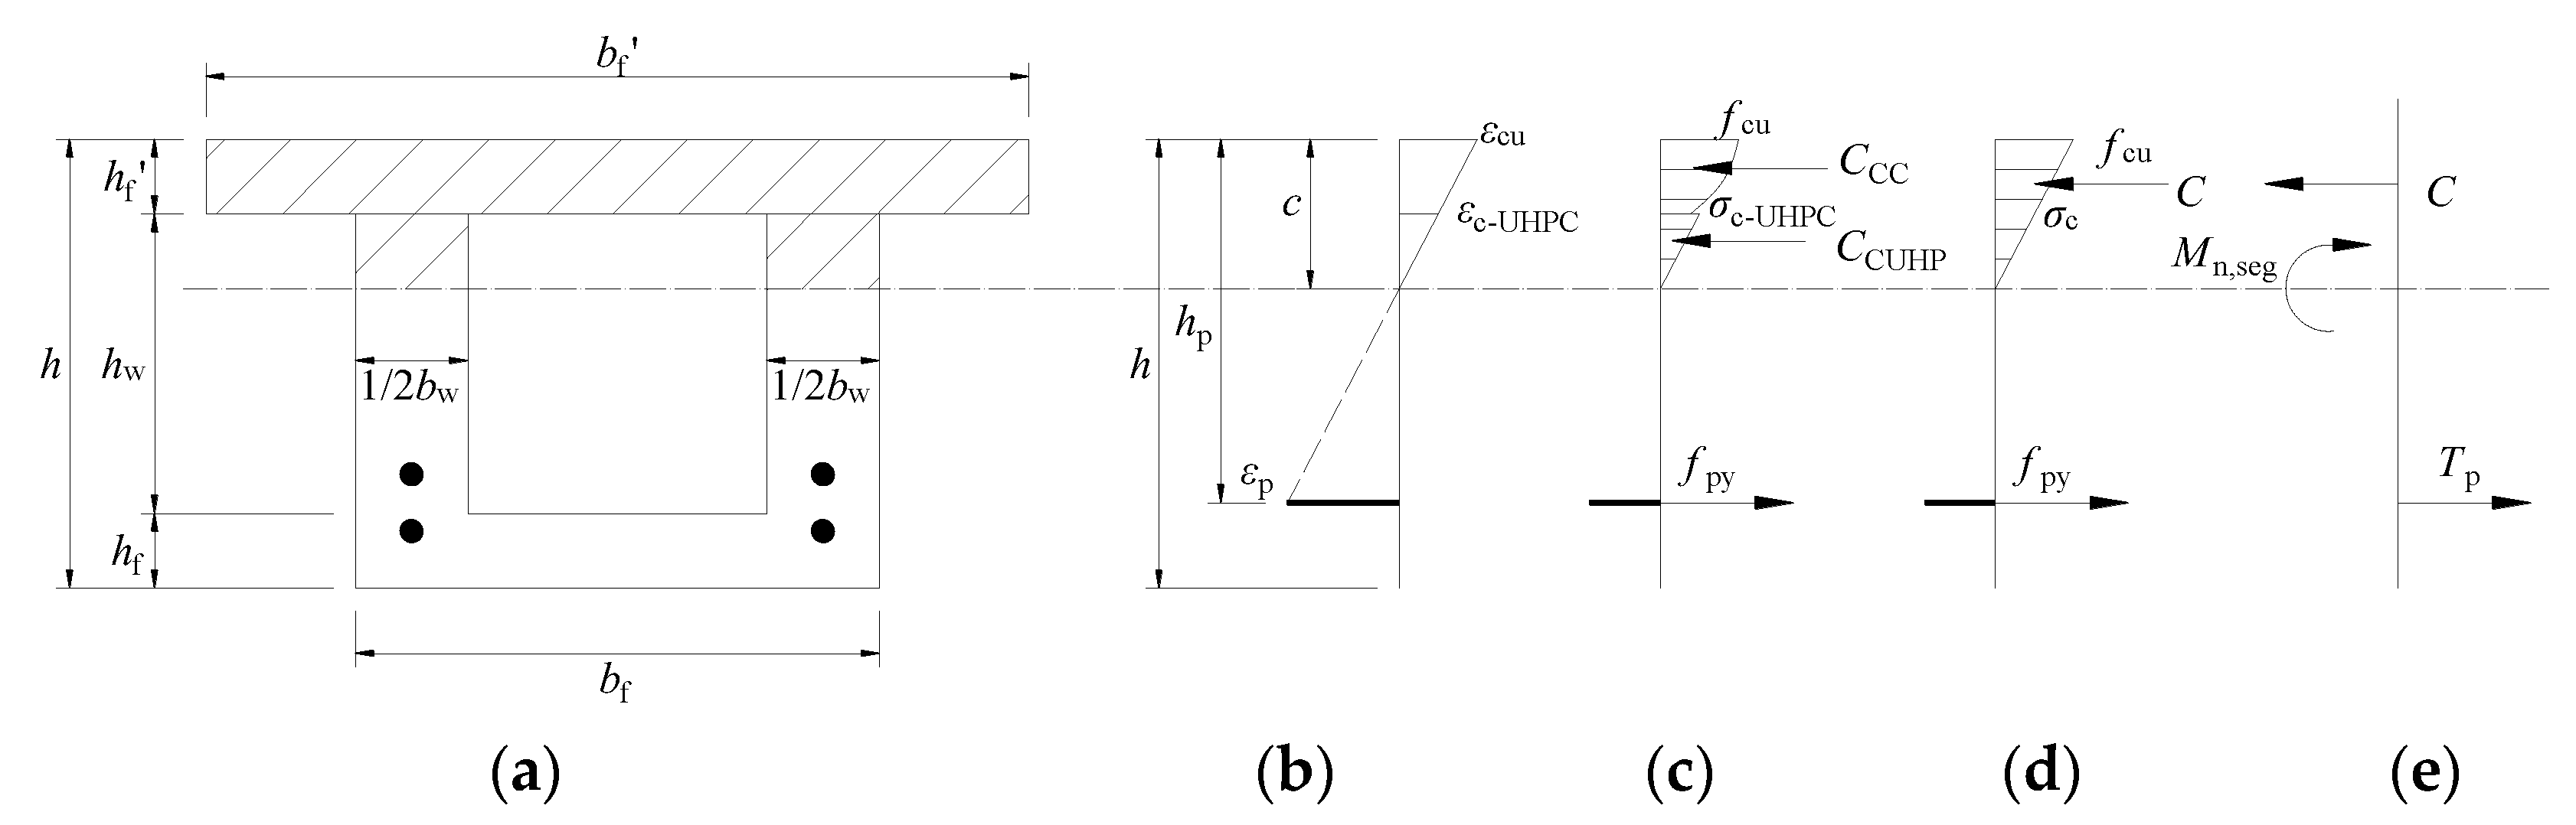
5.1. Semi-Segmental Sections

For a dry joint section, according to the calculation method in the FHWA-HIF-13-032 Design Guide for Precast UHPC Waffle Deck Panel System, Including Connections [30], the cross-section bending model was developed by considering the absence of tensile stresses in the UHPC at the dry joint’s cross-section.
The distribution of strain and stress when the depth of the neutral axis (c) was located in the web when the girder failed are shown in Figure 25b,c.
Though the compressed zone was composed of CC and UHPC, the distribution of concrete stress in the section could still be simplified as a linear distribution, as shown in Figure 25d. This is because the values of the modulus of elasticity of the two materials were close to each other, e.g., the Ec of CC was 35.8 GPa and the UHPC was 46.2 GPa in this study when the section reached flexural capacity. For an ideal reinforced beam, the stress of the RCCD slab in the compressed zone is crushed when the girder fails, as can be seen in the tests in this study (see Section 3.2). Therefore, the maximum value of the concrete stress in Figure 25d was set as the compressive strength of the concrete, fcu.
The flexural capacity of a dry joint section, Mn,seg, can be obtained from the force equilibrium in the section as shown in Figure 25e, where the compression strains in the compression zone are represented by a concentrated force, while only the prestressing forces are considered as the tensile forces.
To calculate the flexural capacity, the location of the depth of the neutral axis (c) should be obtained first.
Assuming that c is within the flange section, an equation can be written as shown in Equation (3), from which c can be obtained. If the obtained value of c is less than the flange depth, i.e., chf′, this means that the assumption is correct.
1 2 f cu b f c = f py A p
Then the flexural capacity Mn,seg can be obtained using Equation (4).
M n , seg = 1 3 f cu b f c 2 + f py A p ( h p c )
If the c obtained from Equation (3) is larger than the flange depth, i.e., c > hf′, the neutral axis is located in the web but not the flange, as indicated in Figure 25. The va lue of c should be solved again by Equations (5) and (6)
σ c b f h f + 1 2 ( f cu σ c ) b f h f + 1 2 σ c b w ( c h f ) = f py A p
Thus, the flexural capacity Mn,seg is obtained using Equation (4)
M n , seg = 1 3 f cu b f c 2 + f py A p ( h p c )

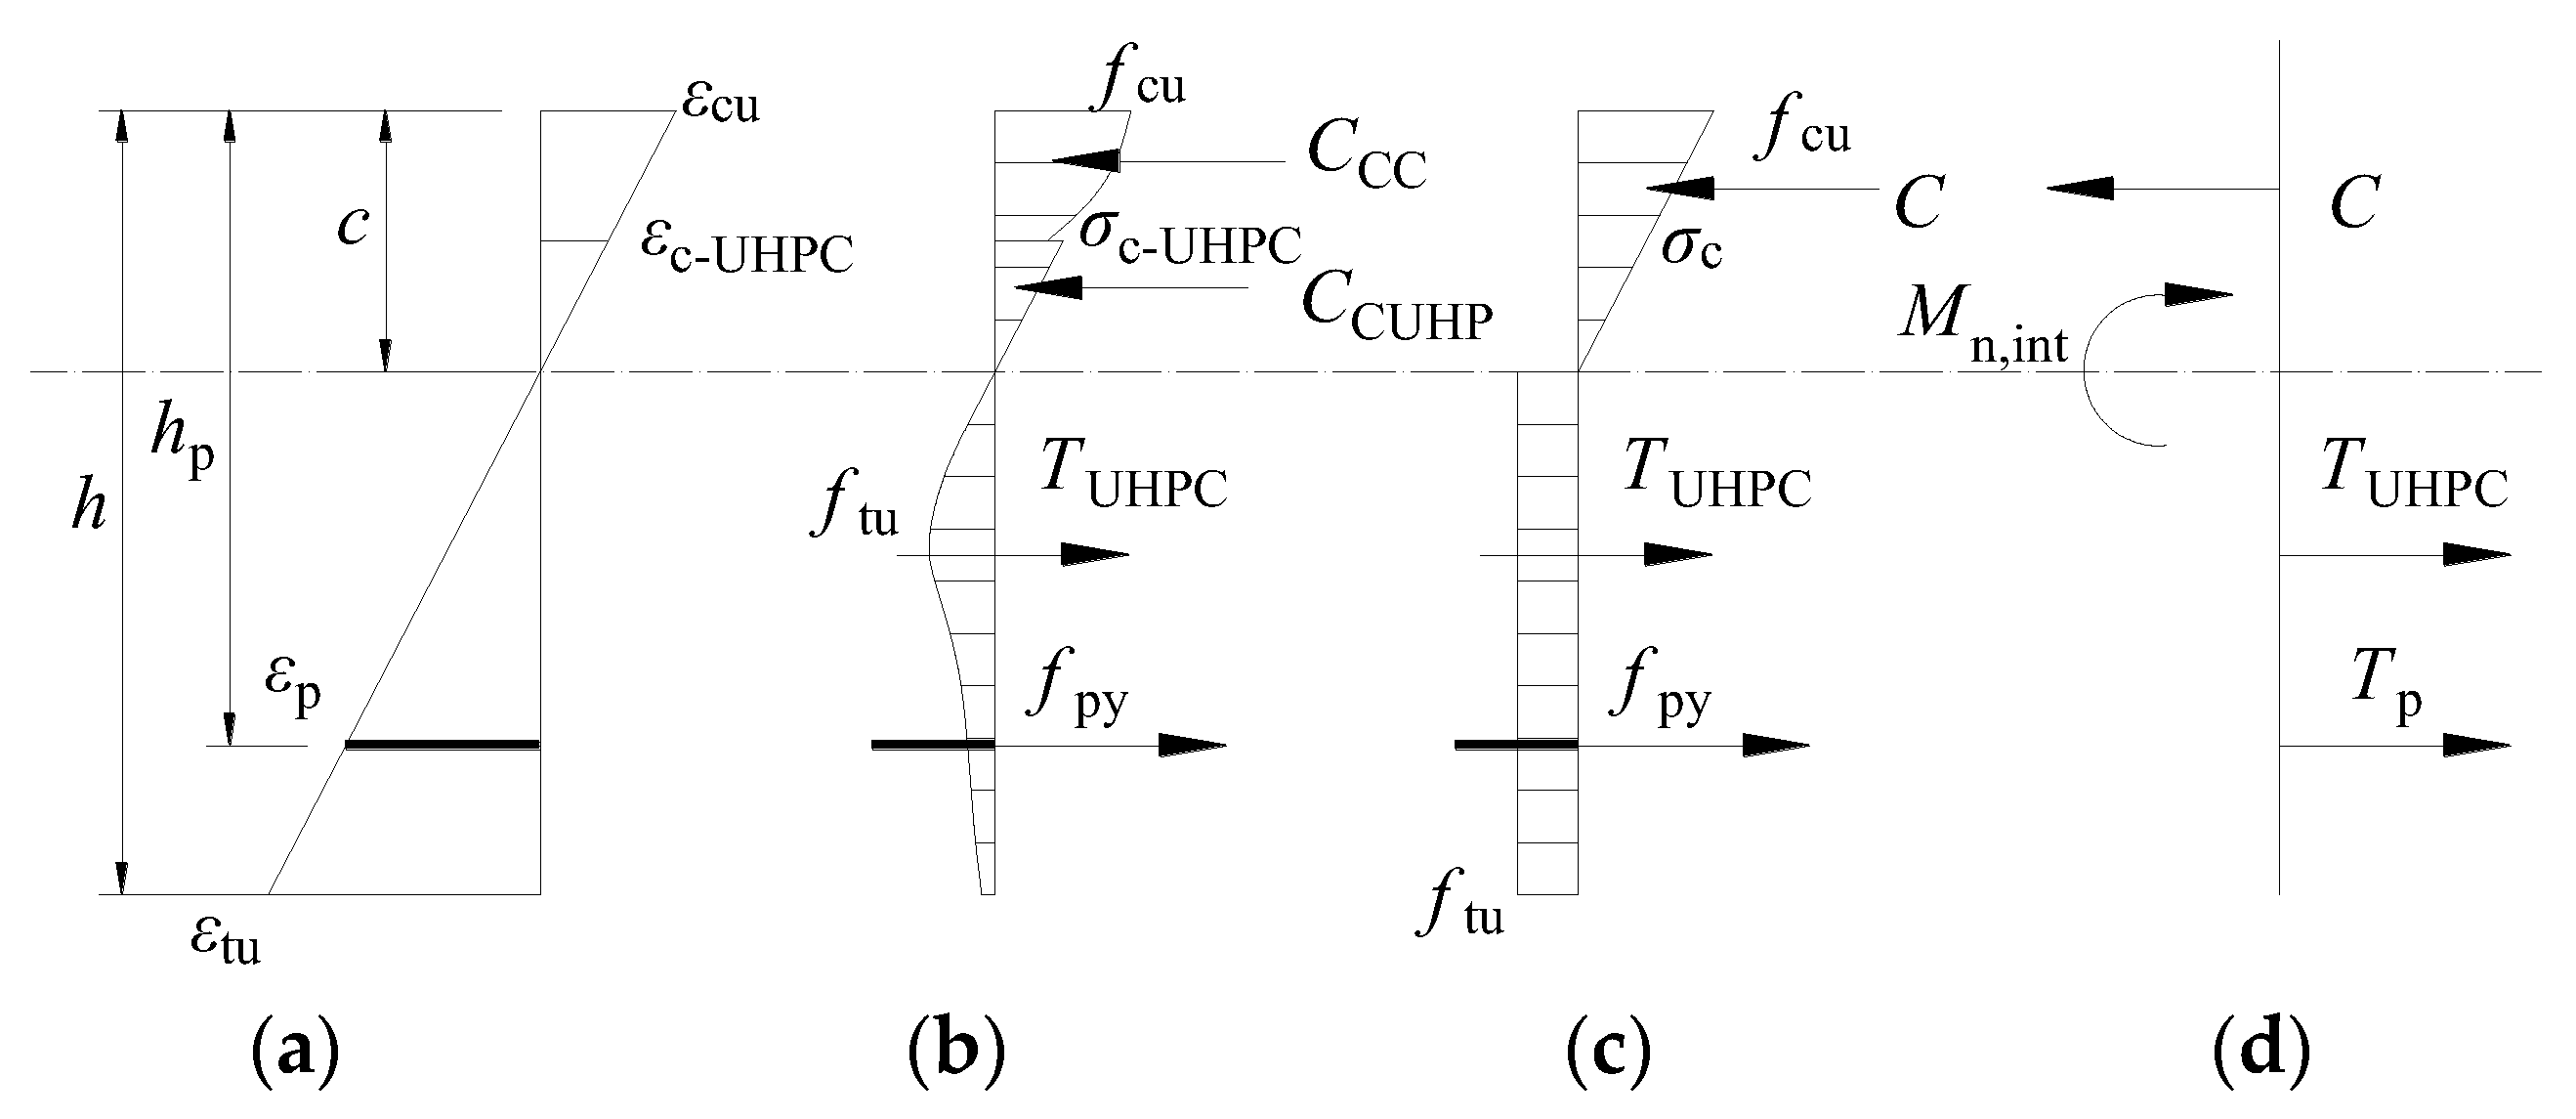
5.2. Integral Section

It is well known that UHPC reinforced by steel fibers with a certain volume fraction has a relatively large tensile strength and good strain-hardening behavior [31]. Therefore, the contribution of the UHPC’s tensile strength can be taken into account in predicting the flexural capacity of an integral section in a PSUC–RCCD composite girder. As in Section 3.3.1, the integral section conforms to the assumption of a plane section, and the distribution of strain of the section can be drawn as shown in Figure 26a.
The stresses in the section can be obtained from the distribution of strain in Figure 26a and the stress–strain relationship of CC and UHPC, as shown in Figure 26b. The distributions of concrete stress in the section are simplified as triangles in the compression zone and blocks in the tensile zone, as shown in Figure 26c.
The flexural capacity of an integral section, Mn,int, can be obtained from the force equilibrium in the section, as shown in Figure 26d. Similar to computing the flexural capacity of a dry joint section, the flexural capacity of an integral section can be obtained from two cases of the location of the neutral axis.
If chf′, Mn,int can be obtained using Equations (7) and (8).
M n , int = 1 3 f cu b f c 2 + f py A p ( h p c ) + b w f tu 1 2 ( h c ) 2 + f tu ( b f b w ) h f ( h c 1 2 h f )
1 2 f cu b f c = f py A p + ( h c ) b w f tu + f tu ( b f b w ) h f
If c > hf′, Mn,int can be obtained using Equations (9) and (10).
M n , int = 1 3 f cu b f c 2 + f py A p ( h p c ) + f tu b w 1 2 ( h c ) 2 + f t ( b f b w ) h f ( h x c 1 2 h f )
σ c b f h f + 1 2 ( f cu σ c ) b f h f + 1 2 σ c b w ( c h f ) = f py A p + f tu b w ( h c ) + f tu ( b f b w ) h f

5.3. Validation and Discussion of the Methods of Calculating Flexural Capacity

5.3.1. Validation

For the semi-segmental specimens in this study, the failed section always appeared in the dry joint sections close to the central span; thus, the flexural capacity of the dry joint section can be subtracted from the flexural capacity of the integral section of girder.
By using Equations (1)–(4), we found that the flexural capacity of the integral section of the girder was 247.5 kN·m, while the flexural capacity of the semi-segmental section of the girder was 183.7 kN·m. For the semi-segmental girders, the lower load capacity of the semi-segmental section was selected.
A comparison of the calculated results of flexural capacity for the semi-segmental section with the test results is shown in Table 6.
The differences between the calculated Mn.cal (including Mn,seg and Mn,int) and the experimental values (Mn.exp) for all specimens were within the 15% error line. The mean value of the ratio of the calculated to the experimental values for all specimens was 0.90, and the standard deviation was less than 0.05. Therefore, the method of calculating the flexural capacity of specimens derived in this section has good accuracy and can be used for the design calculations of PSUC–RCCD and P-UHPC girders.

5.3.2. Discussion

In AASHTO LRFD-6 Bridge Design Specification [32] and Technical Specification for Reactive Powder Concrete Structures (DBJ 43T325-2017) [33], the flexural capacity of a semi-segmental girder can be obtained by multiplying a resistance factor φ to the flexural capacity of the corresponding integral girder, as shown in Equation (11). For semi-segmental girders with unbonded prestressing strands, the resistance factor φ is 0.85.
M n , φ = φ M n , int
According to the results of the simulation, PSUC–RCCD-1 (referred to as FEM-1-3) with a steel fiber volume fraction of UHPC of 0–3% was simulated to become Group 3, and its flexural capacity is shown in Table 7.
By dividing the flexural capacity of the semi-segmental girders by those of the corresponding integral girders, the test resistance factor φ could be obtained, as listed in Table 8. It ranged from 0.95 to 0.98, giving a mean value of 0.97, close to 1.0 and far away from 0.85, indicating that the flexural capacity of the semi-segmental girder in this study was different from that of a common segmental girder, but closer to that of an integral girder. This is mainly because the semi-segmental girders in this study were not totally composed of segments, and the deck slabs were cast in place as a monolithic slab. This led to such girders having better integrity and higher flexural capacity than common segmental girders. Therefore, the flexural capacity of semi-segmental girders is between that of an integral girder and a segmental girder, and is closer to the flexural capacity of an integral girder. If φ = 0.85 is used directly to estimate the flexural capacity of the semi-segmental girder, as recommended in the standards of AASHTO LRFD-6 and DBJ 43T325-2017 for UHPC segments, this will lead to a waste of material in the semi-segmental girder.
It can be seen from Table 8 that 0.95 is the minimum value of the ratio of the flexural capacity of a semi-sectional girder to that of an integral girder. Considering the safety of the member, therefore, this study suggests that in the preliminary design, the flexural capacity of the dry joint section can be estimated conversely by multiplying a φ of 0.95 by the flexural capacity of the integral section.

6. Conclusions

This study presented the flexural behavior of PSUC–RCCD composite girders through experimental and numerical simulations. The study’s results are as follows.
(1) The loading process of semi-segmental and integral girders is basically similar; the whole loading process of all kinds of girder can be divided into the elastic phase, the crack development phase, and the failure phase. The only notable difference between the two girders was the stage of crack development. After cracking, the stiffness of the semi-segmental girder reduced rapidly. Conversely, the “bridging effect” of the steel fibers in the integrated girder caused a slow reduction in rigidity.
(2) Both girders also had a similar crack distribution and failure mode. When the load was around 75% and 89% of the ultimate load, the flexural cracks developed in the top slab of the semi-segmental girder and integral girder, respectively. At this time, the prestressing strands reached their nominal yield strength, and the concrete in the top slab was crushed. The number of flexural cracks was substantially less prevalent in the semi-segmental girders than in the integral ones, and the cracks of the former were only present at the joints.
(3) Parameter expansion was performed using ABAQUS software to compare the effects of the number of segments and the steel fiber volume fraction of UHPC on the segmental beams. The FEM calculations showed that for all numbers of segments, the ultimate flexural capacity of all girders was similar, but the girders with an even number of segments entered the crack development phase earlier than those with an odd number. The steel fiber volume fraction in UHPC had little influence on the cracking load of the semi-segmental girders. However, the effect of the steel fiber volume fraction of UHPC on the flexural capacity of the semi-segmental girders was also relatively limited, and the flexural capacity of the semi-segmental girders increased by only about 9.8% of the flexural capacity when the steel fiber volume fraction increased from 0% to 3%. However, the flexural capacity of the girders increased with the steel fiber volume fraction of UHPC.
(4) Based on the experimental results in this study, methods of calculating the flexural capacity of semi-segmental and integral sections in PSUC–RCCD girders have been presented. The computed results agreed well with the experimental and FEM results. The discussion revealed that the flexural capacity of such semi-segmental girders with a dry joint section, as proposed in this study, can simply be estimated by multiplying the flexural capacity of the integral section by a flexural resistance factor of 0.95 in the preliminary design.

Author Contributions

Methodology, investigation, data curation, and software, Y.C. and F.G.; validation, Y.C. and J.Z.; writing—original draft preparation, Y.C.; writing—review and editing, and supervision, J.Z. and C.N.; conceptualization, supervision, and funding acquisition, B.C. All authors have read and agreed to the published version of the manuscript.

Funding

This research was funded by the National Key R&D Program of China (2018YFC0705400).

Data Availability Statement

Data sharing is not applicable to this article.

Conflicts of Interest

The authors declare no conflict of interest.

References

  1. Shi, C.J.; Wu, Z.M.; Xiao, J.F.; Wang, D.; Huang, Z.; Fang, Z. A review on ultra high performance concrete: Part I. Raw materials and mixture design. Constr. Build. Mater. 2015, 101, 741–751. [Google Scholar] [CrossRef]
  2. Wang, D.H.; Shi, C.J.; Wu, Z.M.; Xiao, J.F.; Huang, Z.; Fang, Z. A review on ultra high performance concrete: Part II. Hydration, microstructure and properties. Constr. Build. Mater. 2015, 96, 368–377. [Google Scholar] [CrossRef]
  3. Zhou, M.; Lu, W.; Song, J.W.; Lee, G.C. Application of ultra-high performance concrete in bridge engineering. Constr. Build. Mater. 2018, 186, 1256–1267. [Google Scholar] [CrossRef]
  4. Xue, J.Q.; Briseghella, B.; Huang, F.Y.; Nuti, C.; Tabatabai, H.; Chen, B.C. Review of ultra-high performance concrete and its application in bridge engineering. Constr. Build. Mater. 2020, 260, 119844. [Google Scholar] [CrossRef]
  5. Graybeal, B.A.; Brühwiler, E.; Kim, B.S.; Toutlemonde, F. International Perspective on UHPC in Bridge Engineering. J. Bridge Eng. 2020, 25, 04020094. [Google Scholar] [CrossRef]
  6. Mishra, O.; Singh, S.P. An overview of microstructural and material properties of ultra-high-performance concrete. J. Sustain. Cem. 2019, 8, 97–143. [Google Scholar] [CrossRef]
  7. Ingrid, L.L.; Rein, T.T. The influence of steel fibres on compressive and tensile strength of ultra high performance concrete: A review. Constr. Build. Mater. 2020, 256, 119459. [Google Scholar] [CrossRef]
  8. Raju, S.; Jeong, G.J.; Prem, P.B. A comprehensive review on effects of mineral admixtures and fibers on engineering properties of ultra-high-performance concrete. J. Build. Eng. 2022, 45, 103314. [Google Scholar] [CrossRef]
  9. Yang, J.; Chen, B.C.; Su, J.Z.; Xu, G.; Zhang, D.; Zhou, J.L. Effects of fibers on the mechanical properties of UHPC: A review. J. Traffic Transp. Eng. 2022, 9, 363–387. [Google Scholar] [CrossRef]
  10. Perry, V.H. Ultra-High-Performance-Concrete Advancements and Industrialization—The Need for Standard Testing. Adv. Civ. Eng. Mater. 2015, 4, 20140028. [Google Scholar] [CrossRef]
  11. Jiang, H.B.; Cao, Q.; Liu, A.R.; Wang, T.L.; Qiu, Y. Flexural behavior of precast concrete segmental beams with hybrid tendons and dry joints. Constr. Build. Mater. 2016, 110, 1–7. [Google Scholar] [CrossRef]
  12. Liu, T.X.; Wang, Z.; Guo, J.; Wang, J.Q. Shear Strength of Dry Joints in Precast UHPC Segmental Bridges: Experimental and Theoretical Research. J. Bridge Eng. 2018, 24, 04018100.1–04018100.18. [Google Scholar] [CrossRef]
  13. Tanaka, Y.; Ohtake, A.; Musha, H.; Watanabe, N. Recent innovative application of UFC bridges in Japan. In Proceedings of the FraMCoS-7, 7th International Conference on Fracture Mechanics of Concrete and Concrete Structures, Jeju, Republic of Korea, 23–28 May 2010; pp. 24–27. [Google Scholar]
  14. Resplendino, J. Ultra-high performance concretes-recent realizations and research programs on UHPFRC bridges in France. In Proceedings of the Second International Symposium on Ultra High Performance Concrete, Kassel, Germany, 5–7 March 2008; pp. 31–43. [Google Scholar]
  15. Voo, Y.L.; Stephen, J.F. Design and construction of the 100 metre span uhpc batu 6 segmental box girder bridge. In Proceedings of the HiPerMat 2016 4th International Symposium on Ultra-High Performance Concrete and High Performance Materials, Kassel, Germany, 9–11 March 2016; pp. 173–174. [Google Scholar]
  16. Jeong, M.S.; Park, S.Y.; Han, S.M. Ductile Behavior of Ultra High Performance Fiber Reinforced Concrete Segmental Box Girder. J. Korean Recycl. Constr. Resour. Inst. 2017, 5, 282–289. [Google Scholar]
  17. Ye, M.; Li, L.F.; Yoo, D.Y.; Li, H.H.; Shao, X.D.; Zhou, C. Mechanistic understanding of precast UHPC segmental beams with external tendons and epoxy joints subject to combined bending and shear. Eng. Struct. 2023, 280, 115698. [Google Scholar] [CrossRef]
  18. Zeng, J.J.; Chen, S.P.; Feng, P.; Zhuge, Y.; Peng, K.D.; Dai, J.G.; Fan, T.H. FRP bar-reinforced ultra-high-performance concrete plates with a grouting sleeve connection: Development and flexural behavior. Eng. Struct. 2023, 287, 116164. [Google Scholar] [CrossRef]
  19. Su, J.Z.; Ma, X.L.; Chen, B.C.; Sennah, K. Full-scale Bending Test and Parametric Study on a 30 m Span Prestressed UHPC Box Girder. Adv. Struct. Eng. 2019, 23, 1276–1289. [Google Scholar] [CrossRef]
  20. Voo, Y.L.; Foster, S.J.; Chen, C.V. Ultrahigh-performance concrete segmental bridge technology: Toward sustainable bridge construction. J. Bridge Eng. 2015, 20, B5014001. [Google Scholar] [CrossRef]
  21. Voo, Y.L.; Hafezolghorani, M.; Foster, S.J. Application of Ultra- High Performance Fiber Reinforced Concrete Technology for Present and Future. In Proceedings of the 2nd International Conference on UHPC Materials and Structures, Fuzhou, China, 7–10 November 2018; pp. 6–20. [Google Scholar]
  22. Makhbal, T.O.; Han, S.M.; Kim, D.O. Flexural behavior of ultra high performance fiber reinforced concrete 50m composite box girder. In Proceedings of the 2nd International Conference on UHPC Materials and Structures, Fuzhou, China, 7–10 November 2018; pp. 777–790. [Google Scholar]
  23. Lee, S.J.; Makhbal, T.O.; Kim, S.T.; Han, S.M. Flexural Behavior of Segmental U-Girder and Composite U-Girder Using Ultra High Performance Concrete. J. Korean Recycl. Constr. Resour. Inst. 2017, 5, 290–297. [Google Scholar] [CrossRef]
  24. GB/T 31387-2015; Reactive Powder Concrete. Standards Press of China: Beijing, China, 2015. (In Chinese)
  25. GB/T 50081-2002; Standard for Method of Mechanical Properties on Ordinary Concrete. Standards Press of China: Beijing, China, 2002. (In Chinese)
  26. Yang, J.; Chen, B.C.; Shen, X.J.; Lin, Y.J. The Optimized Design of Dog-Bones for Tensile Test of Ultra-High Performance Concrete. Eng. Mech. 2018, 35, 37–46+55. [Google Scholar] [CrossRef]
  27. GB/T 228.1-2010; Metallic Materials—Tensile Testing—Part 1: Method of Test at Room Temperature. Standards Press of China: Beijing, China, 2010. (In Chinese)
  28. GB/T 50152-2012; Standard for Test Method of Concrete Structures. Standards Press of China: Beijing, China, 2012. (In Chinese)
  29. Guo, Z.H. Strength and Deformation of Concrete—Test Basis and Principal Structure Relationship; Tsinghua University Press: Beijing, China, 1997; pp. 30–52. (In Chinese) [Google Scholar]
  30. FHWA-HIF-13-032; Design Guide for Precast UHPC Waffle Deck Panel System, Including Connections. U.S.Department of transportation and Federal Highway Administration: Washington, DC, USA, 2013.
  31. Yang, J.; Chen, B.C.; Nuti, C. Influence of steel fiber on compressive properties of ultra-high performance fiber reinforced concrete. Constr. Build. Mater. 2021, 302, 124104. [Google Scholar] [CrossRef]
  32. LRFDUS-6; AASHTO LRFD Bridge Design Specifications. American Association of State Highway and Transportation Officials: Washington, DC, USA, 2012.
  33. DBJ 43/T 325-2017; Technical Specification for Reactive Powder Concrete Structures. China Architecture & Building Press: Beijing, China, 2017. (In Chinese)
Figure 1. Elevation of the test specimens (unit: mm). (a) PSUC–RCCD-4; (b) PSUC–RCCD-1.
Buildings 13 01841 g001
Figure 2. Fabrication of the specimen. (a) UHPC channel beam; (b) RCCD slab.
Buildings 13 01841 g002
Figure 3. Reinforcement arrangement (unit: mm).
Buildings 13 01841 g003
Figure 4. Test setup and arrangement of measuring points (unit: mm). (a) PSUC–RCCD-4; (b) PSUC–RCCD-1; (c) photo of the loading setup.
Buildings 13 01841 g004
Figure 5. Vertical deflections. (a) PSUC–RCCD-4; (b) PSUC–RCCD-1.
Buildings 13 01841 g005
Figure 6. Comparison of the load–deflection curves at mid-span.
Buildings 13 01841 g006
Figure 7. Crack pattern of PSUC–RCCD-4.
Buildings 13 01841 g007aBuildings 13 01841 g007b
Figure 8. Crack pattern of PSUC–RCCD-1.
Buildings 13 01841 g008
Figure 9. Crack pattern of PSUC–RCCD-4 at 235 kN. (a) Overall photo; (b) RC slab bottom; (c) Flexural crack; (d) Width of flexural crack.
Buildings 13 01841 g009
Figure 10. Crack pattern of PSUC–RCCD-4 at 315 kN. (a) Overall photo; (b) RC slab; (c) Crushed RC slab.
Buildings 13 01841 g010
Figure 11. Crack pattern of PSUC–RCCD-4 at 295 kN.
Buildings 13 01841 g011
Figure 12. Crack pattern of PSUC–RCCD-4 at 330 kN. (a) Overall photo; (b) RC slab; (c) Crushed RC slab.
Buildings 13 01841 g012
Figure 13. Distribution of concrete strain at the mid-span of the girder. (a) PSUC–RCCD-4; (b) PSUC–RCCD-1.
Buildings 13 01841 g013
Figure 14. Load–strain curves at the interface between the UHPC channel and the RCCD slab: (a) S6 of PSUC–RCCD-4, (b) S6 of PSUC–RCCD-1, (c) S1 of PSUC–RCCD-4, and (d) S1 of PSUC–RCCD-1.
Buildings 13 01841 g014
Figure 15. Curve of load vs. the stress increment of the prestressing strands.
Buildings 13 01841 g015
Figure 16. Curve of deflection vs. the stress increment of the prestressing strands.
Buildings 13 01841 g016
Figure 17. FEM of the tested girder. (a) PSUC–RCCD brick elements. (b) Layout of the steel.
Buildings 13 01841 g017
Figure 18. Comparison of the load–deflection curves from the simulation and the test. (a) PSUC–RCCD-4; (b) PSUC–RCCD-1.
Buildings 13 01841 g018
Figure 19. Comparison of the load–deflection curves from the simulation and the test. (a) PSUC–RCCD brick elements; (b) layout of the steel.
Buildings 13 01841 g019
Figure 20. Load–deflection curve of Group 1.
Buildings 13 01841 g020
Figure 21. Load–segments curve of Group 1.
Buildings 13 01841 g021
Figure 22. Crack pattern of FEM girders with different numbers of segments. (a) FEM-3-3; (b) FEM-5-3; (c) FEM-6-3.
Buildings 13 01841 g022
Figure 23. Load–deflection curve of Group 2.
Buildings 13 01841 g023
Figure 24. Load–steel fiber volume fraction of UHPC curve of Group 2.
Buildings 13 01841 g024
Figure 25. Distribution of strain and stress along the cross-section of a semi-segmental girder at the ultimate limit states: (a) cross-section, (b) strains, (c) stresses, (d) simplified stress, and (e) internal forces.
Buildings 13 01841 g025
Figure 26. Distribution of strain and stress along the cross-section of an integral girder at the ultimate limit state: (a) strains, (b) stresses, (c) simplified stress, and (d) internal forces.
Buildings 13 01841 g026
Table 1. Mix proportion of the UHPC matrix.
CementSilica FumeQuartz SandQuartz PowderSuperplasticizerWater
CoarseMediumFine
40–7020–4010–20
1.0000.3000.1400.4100.5260.0940.0250.204
Table 2. Mix proportion of the CC matrix.
CementFly AshSandCoarse AggregateSuperplasticizerWater
1.0000.1511.4262.2340.0190.319
Table 3. Material properties of the concrete.
MaterialCubic Compressive Strength
fcu/MPa
Compressive Strength
fc/MPa
Tensile Strength
ft/MPa
Elastic Modulus
Ec/GPa
UHPC183.7 (3.49)164.2 (2.70)10.2 (0.64)46.2 (2.45)
CC53.3 (3.90)45.8 (3.23)-35.8 (1.88)
Table 4. Material properties of the steel.
MaterialDiameter
d/mm
Yield Strength
fy/MPa
Ultimate Strength
fu/MPa
Elastic Modulus
Es/GPa
Prestressing strand15.214901875198
HRB4006407525203
8445600203
10462635203
Table 5. Groups of specimens.
GroupParametersGirder
Notation
Segments (n)Steel Fiber Volume Fraction of UHPCMn,EFM
Group 1Number of segmentsFEM-3-333216.01
FEM-4-34216.43
FEM-5-35216.08
FEM-6-36214.84
Group 2Steel fiber volume fraction of UHPCFEM-4-040197.19
FEM-4-11204.2
FEM-4-22210.94
FEM-4-33216.43
Table 6. Comparison of the flexural capacity of specimens between calculated and experimental or FEM values.
Girder
Notation
(Mn.exp or Mn.FEM)/kN·mMn.cal/(Mn.exp or Mn.FEM)
PSUC–RCCD-12311.07
PSUC–RCCD-4220.50.83
FEM-3-3216.010.85
FEM-4-3216.430.85
FEM-5-3216.080.85
FEM-6-3214.840.86
FEM-4-0197.190.93
FEM-4-1204.200.90
FEM-4-2210.940.87
FEM-4-3216.430.85
Mean value0.87
Standard deviation0.029
Table 7. Groups 3 details.
GroupParametersGirder
Notation
Segments (n)Steel Fiber Volume Fraction of UHPCMn,EFM
Group 3Steel fiber volume fraction of UHPCFEM-1-010197.57
FEM-1-11207.94
FEM-1-22214.79
FEM-1-33221.39
Table 8. Comparison of the flexural capacity of specimens between semi-segmental and integral girders.
Girder
Notation
φ(Mexp.seg/Mexp.int)
PSUC–RCCD-4/
PSUC–RCCD-1
0.95
FEM-3-3/FEM-1-30.97
FEM-4-3/FEM-1-30.97
FEM-5-3 FEM-1-30.97
FEM-6-3/ FEM-1-30.96
FEM-4-0/FEM-1-01.00
FEM-4-1/FEM-1-10.98
FEM-4-2/FEM-1-20.98
FEM-4-3/FEM-1-30.98
Mean value0.97
Disclaimer/Publisher’s Note: The statements, opinions and data contained in all publications are solely those of the individual author(s) and contributor(s) and not of MDPI and/or the editor(s). MDPI and/or the editor(s) disclaim responsibility for any injury to people or property resulting from any ideas, methods, instructions or products referred to in the content.

