
Seismic Performance of Composite Shear Walls Filled with Demolished Concrete Lumps and Self-Compacting Concrete after Fire

1
State Key Laboratory of Subtropical Building Science, South China University of Technology, Guangzhou 510640, China
2
Engineering Research & Test Center, Guangzhou University, Guangzhou 510405, China
3
Guangdong Chuangcheng Construction Supervision and Consulting Limited Liability Company, Guangzhou 510075, China
*
Author to whom correspondence should be addressed.
Buildings 2022, 12(9), 1308; https://doi.org/10.3390/buildings12091308
Submission received: 19 July 2022
/
Revised: 11 August 2022
/
Accepted: 22 August 2022
/
Published: 26 August 2022
(This article belongs to the Special Issue Resilience-Based Structural Seismic Design and Evaluation)
Abstract
:In order to provide a good solution for the treatment and utilization of construction waste, especially waste concrete and to promote the development of green construction to some extent, in this paper, a new composite shear wall filled with demolished concrete lumps (DCLs) and self-compacting concrete (SCC) was proposed, and its seismic performance after fire was investigated. Based on quasi-static tests of four composite shear walls filled with DCLs and SCC, three after a standard fire and one contrastive specimen without fire, the effects of fire exposure time, fire-retardant coating on the edge constraint steel pipe column, and the width-thickness ratio on seismic performance of composite shear walls after fire were studied. The failure patterns, bearing capacity, hysteretic loops, ductility, skeleton curves, rigidity degradation curves, and energy dissipation of shear walls were analyzed and compared. Test results indicate that the bearing capacity of the shear wall after 60 min of standard fire is slightly lower than the contrastive specimen without fire, but specimens still have good seismic performance. The interlayer displacement angle of the shear wall after a fire still meets the requirement of regulations. The fire-retardant coating on the edge of concealed steel pipe column has a limited effect on the seismic performance of specimens after a fire. The horizontal bearing capacity and energy dissipation capacity of shear walls after a fire can obviously be improved by properly increasing the width-thickness ratio.
1. Introduction
With the advancement of modern civilization, construction waste has gradually become a serious international problem. Construction waste accounts for approximately half of the solid waste generated globally each year, and the amount of construction waste will increase significantly in the coming years [1]. According to the National Bureau of Statistics of China 2020 [2], the weight of construction waste generated in China alone reached approximately 1585.65 million tons of which waste concrete accounts for approximately 48.35%. This construction waste, if it is directly piled up or landfilled, will waste a large amount of land resources and also pollute the environment. Utilizing construction waste in the production of new concrete can have a significant environmental and economic impact [3]. In addition, using construction waste to manufacture recycled aggregates has the potential to reduce CO2 emissions and the need for natural aggregates [4]. Based on this background, recycled concrete came into being.
Self-compacting concrete, also referred to as self-consolidating concrete, is the concrete that is able to flow under its own weight and completely fill the formwork, while maintaining homogeneity even in the presence of congested reinforcement, and then consolidating without the need of vibration [5]. SCC is characterized by very good flowability and workability. Moreover, it is well known that the introduction of self-compacting concrete (SCC) has improved both concrete technology and working safety and health conditions due to the removal of mechanical compaction in construction sites [6,7,8]. However, SCC prepared with recycled concrete aggregate needs to be deeply investigated.
In the modern construction industry, various precast concrete structure systems have emerged due to the speed of construction, quality of products and industrialization of construction, and research on the performance of precast structures is also common [9,10,11,12]. Among them, the composite shear wall structure is a relatively new form of precast concrete structure. The composite shear wall is divided into three layers from the direction of thickness. The inner and outer sides are prefabricated, connected by truss steel bars, with a cavity in the middle, and self-compacting concrete is poured on site [13,14]. The composite shear wall does not require socket joint or slurry anchor connection, with good integrality, smoothness on both sides of the panels characteristics. The composite shear wall combines the advantages of fast construction progress of precast structure and good integrality of cast-in-place structure. The prefabricated component not only replaces the formwork of the cast-in-place component on a large scale but also provides a certain structural strength for the shear wall structure and an operation platform for the structure construction, reducing the pressure of the support system, which conforms to the development trend of modernization of the construction industry [15,16,17,18].
In recent years, many scholars at home and abroad have conducted a large number of experimental studies on the seismic performance of composite walls. Soheil Shafaei et al. [19] conducted a study of a concrete-stiffened steel plate shear wall (CSPSW) with a reinforced concrete panel on one side and a gap between the concrete panel and the steel frame. The results showed that the reinforced concrete panel thickness had a remarkable and direct influence upon the shear capacity and the ultimate strength of the CSPSW; furthermore, it was dependent upon the thickness of the infill steel plate. Increasing the concrete panel thickness up to a specific value enhanced the shear capacity and the ultimate strength; however, with a further increase beyond that, the shear capacity and the ultimate shear strength of CSPSW remained constant.
In another study by Soheil Shafaei et al. [20], the authors aimed to understand wall–frame and steel–concrete interactions. The results showed that, in CSPSWs, the percentage of absorbed shear forces by the infill composite wall was always greater than the infill plate of its corresponding SPSW. By increasing the drift, the shear yielding of the steel plate led to a reduction of the shear force absorption. The reduction continued until the bulk of shear stiffness of CSPSW was provided by the frame. At the beginning of lateral loading, steel–concrete interactions increased until the shear yield of the steel plate. Following this stage, a sudden decrease took place in the shear force absorption of the reinforced concrete (RC) panel.
M. Hasim Kisa et al. [21] analyzed the behavior of composite shear walls with L-shaped vertical steel sheets compared to conventional shear walls. The authors observed that composite shear walls with L-shaped cold-formed steel sheets had lateral load capacities ranging from 11% to 14% more than the conventional RC shear wall. Placing cold-formed steel sheets on the outer side of boundary regions could effectively improve the flexural capacity of a shear wall. However, according to the results of the study, this would depend not only on the configurations of cold-formed steel sheets but also on their cross-section slenderness ratio.
The in-plane shear behavior of composite steel-concrete shear walls was investigated by M. Farzam et al. [22]. Results revealed that increasing the thickness of the steel plate increased the yield and ultimate shear strengths; increasing the spacing between shear studs reduced the shear resistance to some extent; steel-plate composite (SC) walls with iron angles had a higher yield and ultimate shear resistance than walls with studs; and the wall with minimum reinforcement behaved better than the wall with no reinforcement in terms of ductility and shear strength.
Five concrete filled double-skin steel-plate composite (CFDSC) wall specimens were tested under constant axial compressive force and lateral reversed cyclic loading by Shao-Teng Huang et al. [23] to investigate the seismic behavior of the wall considering the effect of axial force ratio and shear span ratio. The favorable seismic performance and great energy dissipation capacity of the CFDSC walls were demonstrated in the test.
However, studies on the seismic performance of composite shear walls after a fire are still relatively few. In the modernization process, high-rise and super high-rise buildings are becoming more and more common, and seismic as well as fire resistance are becoming more and more important in structural design [24,25,26,27]. Shear walls have good seismic performance as load-bearing elements, but after both a fire and a high temperature, their seismic performance is affected [28,29,30,31]. Whether the seismic performance of composite shear walls can meet the design requirements after a high temperature or whether the buildings can still be put into use after proper repair and reinforcement treatment remains to be further studied [32,33]. Therefore, it is necessary to conduct an experimental study on the seismic performance of composite shear walls filled with DCLs and SCC after a fire from the perspective of disaster prevention and mitigation.
In this paper, the seismic performance of this new composite shear wall filled with DCLs and SCC after a fire was investigated. Four composite shear wall specimens with edge constraint square steel pipe columns were made and tested, three of which were subjected to a standard fire, and one of which was a contrastive specimen without fire. The effects of fire exposure time, fire-retardant coating, and the width-thickness ratio on seismic performance of composite shear walls after a fire were studied. This study can provide a technical basis and an experimental reference for the safety evaluation and seismic reinforcement of shear walls after a fire.
2. Experimental Program
2.1. Specimen Design and Material Properties
In this test, a total of four infilling DCLs and SCC composite shear walls with edge constraint square steel pipe columns were designed. The design and the production of the specimens were basically the same as those in reference [34], and these specimens were numbered SW1 to SW4. The dimensions and structure of specimens are shown in Figure 1. The upper and lower ends of each specimen were designed with reinforced concrete rigid beams whose stiffness were much higher than the wall panels. The upper reinforced concrete rigid beam was the loading beam, and the lower was the foundation beam. The specimens were cast in the following order: in the first step, precast wallboard was cast with ordinary concrete, including formwork and thermocouple arrangement; in the second step, the precast wallboard with square steel pipe was assembled when the precast wallboard was cured to a certain strength; in the third step, the foundation beam was cast; in the fourth step, concrete was poured into the cavity of the precast wallboard and the square steel pipe for an approximate thickness of 20 mm and then the finished DCLs and SCC were placed alternately into the cavity of the precast wallboard and the square steel pipe, with auxiliary vibration; and, finally, the loading beam was poured with cast-in-place SCC.
The concrete casting of specimens is shown in Figure 2.
The yield strength and ultimate strength of steel slabs and steel bars are shown in Table 2. The cubic compressive strength of precast wall slab concrete on the day of the seismic test was 26.7 MPa. Self-compacting concrete was commercial concrete, with a cubic compressive strength of 63 MPa on the day of the seismic test.
The core samples of 75 × 75 mm (diameter × height) were obtained from the waste foundation beams by the core drilling method before the waste concrete was broken, and the compressive strength of the core samples was measured on the test day. According to the Technical specification for testing concrete strength with drilled core, the cubic compressive strength was converted to 39.7 MPa. The waste concrete used in this experiment was artificially broken into DCLs with characteristic dimensions of 60~80 mm (Figure 3). Then, the finished DCLs and SCC were placed alternately into the cavity of the precast wall panels and the square steel pipes, with auxiliary vibration. The detailed casting process of specimens can be found in reference [34].
2.2. Test Setup and Loading Process
This test was carried out in two stages. The first stage was the open fire test. To ensure that the loading beams and foundation beams avoided damage during the open fire test, two layers of fire-retardant coating were wrapped on the concrete surface of loading beams and foundation beams from SW2 to SW4. The ends of the wall restrained columns were coated with two layers of fire-retardant coating to ensure that both sides of shear wall specimens were exposed to the fire (Figure 4).
The second stage was the quasi-static test of shear walls after a standard fire. Specimens SW2 to SW4 were placed indoors for 30 days after the open fire test. Then, the quasi-static test was carried out on all specimens (SW1 to SW4). The vertical load was applied by a hydraulic jack with a range of 3200 kN, and the pressure sensor was placed under the jack. The repeated horizontal push–pull load was applied by MTS electro-hydraulic servo actuator with a range of 1600 kN, fixed to the reaction wall. The test setup is shown in Figure 5.
2.3. Monitoring Point Arrangement
To obtain the axial deformation of specimens during the open fire test, vertical displacement gauges were set around the top of loading beams, as shown in Figure 6.
The embedded thermocouples were at half the height of specimens and were used to measure the internal temperature field. There were seven thermocouples embedded in each specimen (SW2 to SW4) among which T1 was located inside the prefabricated wall panel at a distance of approximately 5 mm from the fire surface; T2 was approximately 50 mm from the fire surface; T3 was approximately 100 mm from the fire surface; T4 was attached to the outer wall of the square steel tube; T5 was located at the midpoint of the connection between the concrete center and the outer wall of the square steel tube; T6 was located at the concrete center of the edge-constrained steel tube core; and T7 was close to the vertical steel bars, measuring the temperature field of vertical steel bars during the open fire test. The arrangement of each thermocouple is shown in Figure 7.
The content of a quasi-static test after a fire mainly included the failure process and failure modes of specimens under various levels of horizontal loads and horizontal displacements. The layout of each displacement meter is shown in Figure 5, where LVDT1 was set on the loading beam; LVDT2 and LVDT3 were set at three points of shear wall height; LVDT4 was set at the center of the loading beam perpendicular to the specimen direction; LVDT5 and LVDT7 were arranged in the horizontal direction at the junction of the steel tube and prefabricated wall panel; and LVDT6 was arranged vertically at the junction of the steel tube and the precast wall panel.
At the beginning of the test, a predetermined vertical load was first applied to the shear wall specimen and then a repeated push–pull horizontal load was applied under the condition that the vertical load was basically stable. In this test, we adopted displacement control [35], and the specific loading system is shown in Figure 8. The displacement angle values of each stage are shown in Table 3.
3. Test Results
3.1. Open Fire Test Results Analysis
3.1.1. Phenomenon
The patterns of specimens after the open fire test are shown in Figure 9. It can be observed from the figure that the concrete of the three specimens was light yellow after 60 min of fire, and a few horizontal cracks appeared on the concrete surface of precast wall panels on both sides of the shear walls, and the steel bars in walls were not exposed. The outer surface of steel tubes on the concealed columns of SW2 and SW4 were mostly dark black, and steel tubes had a slight buckling phenomenon; SW3 was equipped with fire-retardant coating on the steel tubes of concealed columns, so the steel tubes did not appear bulging and were relatively flat.
3.1.2. Temperature Field Analysis
Furnace Temperature
Figure 10 shows the comparison of the measured average air temperature–exposure time curves in the furnace and ISO-834 standard fire curve, the actual fire heating curves have diversity, in order to unify and compare, many countries and organizations have formulated the standard fire heating curve for the component fire resistance test to assess the component fire resistance limit [36], during the open fire test of SW2 to SW4 in this test. It can be seen that the measured heating curves of SW3 and SW4 were generally consistent with the standard fire curve, while there were certain deviations in the furnace heating curve of specimen SW2. This was because the experimental furnace had not been used for four months before this test, and the workability of this experimental furnace was affected by moisture. After the open fire test of SW2, the workability of this furnace returned to normal.
Measured Temperature-Time Curve
Figure 11 shows the curves of temperature variation with time at the seven monitoring points during the open fire test. It can be seen that the temperature of three specimens all increased with fire time. In the same cross section, measured concrete temperature gradually decreased with increasing depth of the monitoring points. The temperature of steel pipes outer surface of concealed column and wall concrete surface of SW2 and SW4 were higher, the rest of the internal concrete were lower than 35 °C, and the temperature of core concrete was approximately 150 °C. Because of the fire-retardant coating on the steel pipe column, the temperature of the steel pipe column cross section of SW3 was lower than that of specimen SW2 and specimen SW4, but the temperature change of the wall cross section was almost the same as that of SW2 and SW4. In addition, the maximum temperature of the three specimens vertical reinforcement was approximately 500 °C. Fire for 60 min caused some degree of damage to the outer edges of specimens, while the properties of core concrete were basically the same as those at a normal temperature.
3.1.3. Axial Deformation Analysis
The axial deformation–fire time curves of specimens are shown in Figure 12, and the axial deformation was positive with expansion deformation. It can be seen from the figure that the axial deformation of SW2, SW3, and SW4 were 2.12 mm, 1.6 mm, and 2.29 mm, respectively. The axial deformation variation of the three specimens were basically the same, and they were all in the expansion stage.
3.2. Analysis of Seismic Test Results after Fire
3.2.1. Phenomenon
When specimens were in the elastic stage, there were no visible cracks on the surface of the shear wall concrete and no buckling phenomenon on the steel tubes of concealed columns. After specimens entered the yield stage, buckling occurred, then horizontal cracks were formed, and diagonal cracks gradually appeared. When specimens entered the failure stage, fire specimens and non-fire specimen showed different failure patterns. The diagonal cracks of concrete on the surface of specimen SW1, which was not subjected to fire, extended and widened, forming the principal diagonal cracks in the shape of an “X”. The concrete at the junction of steel tubes and precast wall panels displayed a spalling phenomenon and the bending steel bars were exposed. However, diagonal cracks of concrete on the surface of SW2 to SW4 did not form principal diagonal cracks. The wall panels were divided into some diamond-shaped pieces by several crossed diagonal cracks, and the concrete was peeled off in a large area at the corner of the wall panels (This may be due to the fact that under the combined effect of high temperature and axial load, the fire specimens were internally damaged to some extent. With the further action of low reversed cyclic loads, micro-cracks originally generated during fire time continued to expand, resulting in eventual failure without forming the principal diagonal cracks. [37,38,39]). The failure patterns of specimens are shown in Figure 13. The cracks depicted in blue were those generated during the open fire test, and the cracks depicted in red were those generated in this seismic test.
In the test process, the failure characteristics of SW1 were similar to those in reference [34], and the failure characteristics of SW2 to SW4 were roughly the same. Taking specimen SW2 as an example, the failure process, phenomenon, and characteristics were analyzed and introduced. Figure 14 shows the failure process and phenomenon of SW2.
(1) When the displacement angle was 1/1000, specimen was in the elastic stage, there was no visible crack on the concrete surface of the wall panel and no bulge on the steel tubes of concealed columns;
(2) When the displacement angle was 1/800, the first horizontal crack occurred at the junction of the prefabricated wall panel and steel tubes, which was 280 mm above the foundation beam;
(3) When the displacement angle was 1/500, the concrete cracks on the surface of the precast wall panel began to increase, and the steel tubes did not bulge;
(4) When the displacement angles were 1/300 and 1/200, steel tubes on both sides of specimen showed slight bulges under compression, but the bulges disappeared under an opposite side loading condition. At the same time, diagonal cracks began to appear on the surface of the precast wall panel;
(5) When the displacement angle was 1/50, the horizontal displacement reached 34 mm, diagonal cracks of concrete on the surface of the precast wall panel did not form the principal diagonal cracks. The wall was divided into some diamond-shaped pieces by several crossed diagonal cracks, and the concrete began to peel off;
(6) When the displacement angle was 1/30 till failure, lateral deformation of the specimen was severe. The concrete peeled off over a large area and steel bars were exposed under bending. In addition, there were two bulges on the left side of specimen and one on the right side, but no penetrating crack was formed.
3.2.2. Hysteretic Loop
The horizontal load-displacement hysteretic loops of composite shear walls are shown in Figure 15 from which the following conclusions can be drawn:
(1) At the initial stage of loading, the hysteretic loops were long and narrow, and the surrounding area was small. The specimens were in the elastic stage without residual deformation; when the specimens entered the yield stage, cracks appeared on the surface of precast wall panels and steel tubes of concealed columns bulged. The hysteretic loops had a platform section near the peak load and a “pinching” phenomenon appeared. The area of hysteretic loops increased rapidly, showing good energy dissipation capacity; with the further increase of the displacement angle, the horizontal bearing capacity decreased obviously, and the hysteretic loops presented an inverse S shape when the ultimate bearing capacity was reached;
(2) The hysteretic loops of SW2 were similar to those of SW1 in general, and the maximum horizontal load was almost the same. It can indicate that infilling DCLs and SCC composite shear walls with edge constraint square steel tubes still retained good seismic performance after a fire for 60 min.
3.2.3. Horizontal Bearing Capacity
(1) The horizontal bearing capacity of SW2 was equivalent to SW3. The horizontal bearing capacity of infilling DCLs and SCC composite shear walls were mainly related to the strength of longitudinal reinforcement in walls, the strength of concrete in steel tubes, and the strength of wall concrete. In addition, according to the calculation in reference [40], the reduction factors of the concrete strength in steel tubes were almost the same as those of the concrete strength in the walls of specimens SW2 and SW3. The results showed that the horizontal seismic bearing capacity of composite shear walls, filled with DCLs and SCC, and subjected to a standard fire on both sides for 1 h is not affected by spraying 20 mm fire-retardant coating on concealed column steel tubes;
(2) Compared with SW2, the bearing capacity and energy dissipation capacity of SW4 were significantly improved. Therefore, appropriately increasing the width-thickness ratio has a significant impact on the seismic performance of specimens after a standard fire.
3.2.4. Skeleton Curve
Figure 16 shows the effect of different parameters on the skeleton curves of shear walls. The important data for the skeleton curves of specimens are given in Table 4, where Py, Pue, and Pul represent the yield load, peak load, and ultimate load of specimens, respectively, and ∆y, ∆p, and ∆u represent yield displacement, peak displacement, and ultimate displacement, respectively. The yield load and the yield displacement were determined on the skeleton curves according to the Park method [41]. Ultimate load refers to the load size when the horizontal load dropped to 85% of the peak load. It can be seen from Figure 16 and Table 4 that:
(1) At the initial stage of test loading, the skeleton curves varied linearly when the specimens were in the elastic stage. With the increase of displacement, the skeleton curves sloped toward the horizontal axis and the slopes decreased. After the specimens entered the yield stage, a plateau section appeared in the curves. The skeleton curves dropped gently when reaching the peak load, and the specimens were in good ductility;
(2) The ultimate displacement angles of four shear walls were all over 1/50, which met the requirement of the 1/120 limit of the elastic-plastic displacement angle of shear wall structures under strong earthquakes in the code for the seismic design of buildings (GB 50011-2010) [42];
(3) Comparing SW2 with SW1, it can be seen that 60 min of fire had little effect on the horizontal bearing capacity of infilling DCLs and SCC composite shear walls. According to Figure 16a, the skeleton curves and stiffness of the two specimens were roughly the same (The skeleton curve is the trajectory of the maximum peak of horizontal force reached by each cycle of loading, reflecting the different stages and characteristics of force and deformation of components.), indicating that the seismic performance of composite shear walls filled with DCLs and SCC are basically equivalent to non-fire specimen when subjected to standard fire for 60 min;
(4) Comparing SW2 with SW3, the skeleton curves of the two specimens almost overlapped, and the variation trends of the horizontal bearing capacity as well as stiffness of the two specimens were roughly the same. Therefore, fire-retardant coating has little effect on the seismic performance of specimens after a standard fire;
(5) The comparison of peak loads and ultimate displacements of specimens SW2 and SW4 showed that appropriately increasing the width-thickness ratio has a significant effect on the seismic performance of infilling DCLs and SCC composite shear walls after a standard fire.
3.2.5. Ductility Analysis
According to Table 4, the following conclusions can be drawn:
(1) The displacement ductility factors of specimens met the requirement of seismic design ductility factor not less than 3.0, indicating that composite shear walls filled with DCLs and SCC have good deformation capacity after a standard fire;
(2) When subjected to fire for 60 min, the ductility factor of composite shear walls was 28.46% lower than at a normal temperature, which indicates that fire exposure time has a significant effect on the deformation capacity of shear walls;
(3) Fire-retardant coating on the edge constraint steel pipe columns improves the seismic deformation capacity of shear walls after a standard fire to some extent, while increasing the width-thickness ratio reduces the ductility capacity of shear walls filled with DCLs and SCC.
3.2.6. Energy Dissipation Capacity
Figure 17 shows the unicyclic energy dissipation curves of specimens. It can be seen that:
(1) All specimens showed the same variation trend of energy dissipation capacity. With the increase of displacement angles, the energy dissipation capacity of each specimen also increased;
(2) The influence of fire on the energy dissipation capacity of infilling DCLs and SCC composite shear walls is slight;
(3) Fire-retardant coating on the edge constraint steel pipe columns has little effect on the energy dissipation capacity of specimens after a fire;
(4) Appropriately increasing the width-thickness ratio can improve the energy dissipation capacity of specimens after a standard fire.
3.2.7. Stiffness Analysis
The stiffness degradation of each specimen is shown in Figure 18. It can be seen from the figure that:
(1) All specimens showed the same variation trend of stiffness, that is, with the increase of displacement angles, the secant stiffness of infilling DCLs and SCC composite shear wall specimens gradually decreased;
(2) Compared with SW1, the initial stiffness of SW2, subjected to fire for 60 min, decreased by 44%. At the later loading stage, specimens entered the plastic stage, and the secant stiffness of both specimens tended to be consistent;
(3) The stiffness degradation curves of SW2 and SW3 were almost overlapping, indicating that spraying fire-retardant coating on the surface of concealed column steel pipes has little effect on the stiffness degradation of composite shear walls filled with DCLs and SCC after a standard fire;
(4) Appropriately increasing the width-thickness ratio can improve the stiffness of infilling DCLs and SCC composite shear walls and slow down their stiffness degradation to some extent.
4. Conclusions
(1) After 60 min of fire, the failure displacement angles of all shear wall specimens were all over 1/50, which met the requirement of the 1/120 limit of the elastic-plastic displacement angle of shear wall structures under strong earthquakes in the Seismic Design Code for buildings;
(2) After 60 min of fire, the displacement ductility factors of shear wall specimens varied from 3.792 to 4.434, which met the requirement of no less than 3.0 of the Seismic Design Code, indicating that infilling DCLs and SCC composite shear walls still have good deformation capacity after 60 min of fire;
(3) The horizontal bearing capacity, initial stiffness, deformation capacity, and energy dissipation capacity of specimens after 60 min of fire were lower than those without fire, but the overall decline was slight, indicating that the composite shear walls filled with DCLs and SCC still have good seismic performance after 60 min of fire;
(4) The effect of fire-retardant coating on the edge of a concealed steel pipe column on horizontal bearing capacity, deformation capacity, initial stiffness, stiffness degradation and energy dissipation capacity of specimens after fire is limited. When the load was relatively small, the excess bearing capacity of the end restraint column and the wall was large, and the loading beam played the role of load redistribution. Without fire-retardant coating, the bearing capacity and seismic performance of the end restraint column after fire damage had no significant effect on the whole wall. Therefore, fire-retardant coating has no significant effect on the seismic performance of the composite shear wall;
(5) Appropriately increasing the width-thickness ratio can obviously improve the horizontal bearing capacity of shear walls after a standard fire. In addition, the initial stiffness, stiffness degradation, and energy dissipation capacity were improved to different degrees, but deformation capacity was reduced. The results showed that increasing the width-thickness ratio has a significant effect on the seismic performance of composite shear walls filled with DCLs and SCC after a standard fire;
(6) There are many possible factors affecting the seismic performance of composite shear walls after fire, this paper investigated and analyzed just three aspects, namely, fire exposure time, fire-retardant coating on the edge constraint steel pipe column, and the width-thickness ratio. Future research work may be carried out in the following aspects: cooling methods of shear walls after fire, curing age of shear walls, test axial compression ratio, and other possible factors.
Author Contributions
All authors contributed to the study design and implementation. Y.X.: conceptualization, funding acquisition, methodology, supervision, and writing—review and editing. A.C.: data curation, formal analysis, and writing original manuscript. D.W.: supervision, conceptualization, project administration, and methodology. G.Z.: investigation, software, and data curation. All authors have read and agreed to the published version of the manuscript.
Funding
China National Key R&D Program during the 13th Five-year Plan Period (2017YFC0703303); the National Natural Science Foundation of China (51878298, 52178281); the Science and Technology Planning Project of Guangdong Province (2018B02028003, 2021A1515012606); the Science and Technology Program of Guangzhou, China (201831826); and the Guangdong Provincial Key Laboratory of Modern Civil Engineering Technology (2021B1212040003).
Institutional Review Board Statement
Not applicable.
Informed Consent Statement
Not applicable.
Data Availability Statement
Data is contained within the article material.
Conflicts of Interest
The authors declare no conflict of interest.
References
- Redling, A. Construction Debris Volume to Surge in Coming Years. Construction & Demolition Recycling. Construction & Demolition Recycling Magazine, Ohio, United States. 2018. Available online: https://www.cdrecycler.com/Article/Global-Volumeconstruction-Demolition-Waste/ (accessed on 30 April 2020).
- National Bureau of Statistics of China. China Statistical Yearbook; China Statistic Publishing House: Beijing, China, 2020. (In Chinese)
- Velay-Lizancos, M.; Martinez-Lage, I.; Azenha, M.; Granja, J.; Vazquez-Burgo, P. Concrete with Fine and Coarse Recycled Aggregates: E-Modulus Evolution, Compressive Strength and Non-Destructive Testing at Early Ages. Constr. Build. Mater. 2018, 193, 323–331. [Google Scholar] [CrossRef]
- Thomas, C.; Setién, J.; Polanco, J.A. Structural Recycled Aggregate Concrete Made with Precast Wastes. Constr. Build. Mater. 2016, 114, 536–546. [Google Scholar] [CrossRef]
- Ahmad, S.; Umar, A.; Masood, A. Properties of Normal Concrete, Self-Compacting Concrete and Glass Fibre-Reinforced Self-Compacting Concrete: An Experimental Study. Procedia Eng. 2017, 173, 807–813. [Google Scholar] [CrossRef]
- Kumar, R.D. Self-Compacted Concrete Mix Design and Its Comparison with Conventional Concrete (M-40). J. Civ. Environ. Eng. 2015, 5, 1. [Google Scholar] [CrossRef]
- Khayat, K.H.; De Schutter, G. Mechanical Properties of Self-Compacting Concrete; Springer: Berlin/Heidelberg, Germany, 2014. [Google Scholar]
- Alhussainy, F.; Hasan, H.A.; Rogic, S.; Sheikh, M.N.; Hadi, M.N. Direct Tensile Testing of Self-Compacting Concrete. Constr. Build. Mater. 2016, 112, 903–906. [Google Scholar] [CrossRef]
- Negro, P.; Tornaghi, M.L. Seismic Response of Precast Structures with Vertical Cladding Panels: The safecladding Experimental Campaign. Eng. Struct. 2017, 132, 205–228. [Google Scholar] [CrossRef]
- Belleri, A.; Torquati, M.; Marini, A.; Riva, P. Horizontal Cladding Panels: In-Plane Seismic Performance in Precast Concrete Buildings. Bull. Earthq. Eng. 2016, 14, 1103–1129. [Google Scholar] [CrossRef]
- Brunesi, E.; Nascimbene, R.; Peloso, S. Evaluation of the Seismic Response of Precast Wall Connections: Experimental Observations and Numerical Modeling. J. Earthq. Eng. 2020, 24, 1057–1082. [Google Scholar] [CrossRef]
- Titi, A.; Biondini, F.; Toniolo, G. Seismic Assessment of Existing Precast Structures with Dry-Friction Beam-to-Column Joints. Bull. Earthq. Eng. 2018, 16, 2067–2086. [Google Scholar] [CrossRef]
- Wright, H.; Evans, R.; Gallocher, S. Composite walling. In Composite Construction in Steel and Concrete II; ASCE: Reston, VA, USA, 1992; pp. 783–797. [Google Scholar]
- Sener, K.C.; Varma, A.H.; Ayhan, D. Steel-Plate Composite (SC) Walls: Out-of-Plane Flexural Behavior, Database, and Design. J. Constr. Steel Res. 2015, 108, 46–59. [Google Scholar] [CrossRef]
- Pons, O. Assessing the sustainability of prefabricated buildings. In Eco-Efficient Construction and Building Materials; Woodhead Publishing: Sawston, UK, 2014; pp. 434–456. [Google Scholar]
- Vostrikova, E.V.; Gayevskaya, Z.A. Modernization of residential buildings of the 1960s. In Advanced Materials Research; Trans Tech Publications Ltd.: Bäch, Switzerland, 2014; Volume 941, pp. 858–863. [Google Scholar]
- Boafo, F.E.; Kim, J.H.; Kim, J.T. Performance of Modular Prefabricated Architecture: Case Study-Based Review and Future Pathways. Sustainability 2016, 8, 558. [Google Scholar] [CrossRef]
- Moradibistouni, M.; Vale, B.; Isaacs, N. Evaluating Sustainability of Prefabrication Methods in Comparison with Traditional Methods. In Proceedings of the International Conference on Sustainability in Energy and Buildings, Gold Coast, QLD, Australia, 20–22 June 2018; Springer: Cham, Switzerland, 2018; pp. 228–237. [Google Scholar]
- Shafaei, S.; Ayazi, A.; Farahbod, F. The Effect of Concrete Panel Thickness upon Composite Steel Plate Shear Walls. J. Constr. Steel Res. 2016, 117, 81–90. [Google Scholar] [CrossRef]
- Kisa, M.H.; Yuksel, S.B.; Caglar, N. Experimental Study on Hysteric Behavior of Composite Shear Walls with Steel Sheets. J. Build. Eng. 2021, 33, 101570. [Google Scholar] [CrossRef]
- Shafaei, S.; Farahbod, F.; Ayazi, A. The Wall–Frame and the Steel–Concrete Interactions in Composite Shear Walls. Struct. Des. Tall Spec. Build. 2018, 27, e1476. [Google Scholar] [CrossRef]
- Farzam, M.; Hoseinzade, F. Effect of Type and Distribution of Shear Studs on the Behavior of Composite Steel-Concrete Shear Walls. J. Rehabil. Civ. Eng. 2019, 7, 154–167. [Google Scholar]
- Huang, S.T.; Huang, Y.S.; He, A.; Tang, X.L.; Chen, Q.J.; Liu, X.; Cai, J. Experimental Study on Seismic Behavior of an Innovative Composite Shear Wall. J. Constr. Steel Res. 2018, 148, 165–179. (In Chinese) [Google Scholar] [CrossRef]
- Szolomicki, J.; Golasz-Szolomicka, H. Technological Advances and Trends in Modern High-Rise Buildings. Buildings 2019, 9, 193. [Google Scholar] [CrossRef]
- Sarcheshmehpour, M.; Estekanchi, H.E.; Moosavian, H. Optimum Seismic Design of Steel Framed-Tube and Tube-in-Tube Tall Buildings. Struct. Des. Tall Spec. Build. 2020, 29, e1782. [Google Scholar] [CrossRef]
- Molina Hutt, C.; Hulsey, A.M.; Kakoty, P.; Deierlein, G.G.; Eksir Monfared, A.; Wen-Yi, Y.; Hooper, J.D. Toward Functional Recovery Performance in the Seismic Design of Modern Tall Buildings. Earthq. Spectra 2022, 38, 283–309. [Google Scholar] [CrossRef]
- Gentili, F.; Giuliani, L.; Bontempi, F. Structural Response of Steel High Rise Buildings to Fire: System Characteristics and Failure Mechanisms. J. Struct. Fire Eng. 2013, 4, 9–26. [Google Scholar] [CrossRef]
- Andres, B.; Hoehler, M.S.; Bundy, M.F. Fire Resistance of Cold-Formed Steel Framed Shear Walls under Various Fire Scenarios. Fire Mater. 2020, 44, 352–364. [Google Scholar] [CrossRef] [PubMed]
- Hoehler, M.S.; Smith, C.M.; Hutchinson, T.C.; Wang, X.; Meacham, B.J.; Kamath, P. Behavior of Steel-Sheathed Shear Walls Subjected to Seismic and Fire Loads. Fire Saf. J. 2017, 91, 524–531. [Google Scholar] [CrossRef] [PubMed]
- Hoehler, M.S.; Andres, B.; Bundy, M.F. Lateral Resistance Reduction to Cold-Formed Steel-Framed Shear Walls under Various Fire Scenarios. J. Struct. Eng. 2020, 146. [Google Scholar] [CrossRef]
- Mistri, A.; Davis, R.; Sarkar, P. Condition Assessment of Fire Affected Reinforced Concrete Shear Wall Building—A Case Study. Adv. Concr. Constr. 2016, 4, 89. [Google Scholar] [CrossRef]
- Ambroziak, A.; Piotrkowski, P.; Heizig, T. Assessment of Technical Condition and Repair of Steel Structure Elements on the Example of Fire Damage in a Warehouse Building. In Proceedings of the MATEC Web of Conferences, Miedzyzdroje, Poland, 20–24 May 2019; EDP Sciences: Les Ulys, France, 2019; Volume 284, p. 02001. [Google Scholar]
- Cardoso, R. Haussmannian Building Repair, Rehabilitation and Strengthening: Case Study from France. Proc. Inst. Civ. Eng.-Eng. Hist. Herit. 2021, 175, 7–20. [Google Scholar] [CrossRef]
- Yan, X.I.O.N.G.; Guowei, Z.H.A.O.; Di, W.U.; Zhuoliang, X.I.A.O.; Yaxin, C.H.E.N. Experimental Study on Seismic Behavior of Composite Shear Walls Filled with Demolished Concrete Lumps and Self-Compacting Concrete. J. Build. Struct. 2022, 43, 114. (In Chinese) [Google Scholar]
- Dey, S.; Bhowmick, A.K. Seismic performance of composite plate shear walls. In Structures; Elsevier: Amsterdam, The Netherlands, 2016; Volume 6, pp. 59–72. [Google Scholar]
- GB/T 9978.3-2008; Fire-Resistance Tests—Elements of Building Construction—Part 3: Commentary on Test Method and Test Data Application. ISO: Geneva, Switzerland, 2008.
- Demir, U.; Goksu, C.; Binbir, E.; Ilki, A. Impact of time after fire on post-fire seismic behavior of RC columns. In Structures; Elsevier: Amsterdam, The Netherlands, 2020; Volume 26, pp. 537–548. [Google Scholar]
- Nguyen, K.T.; Ngo, T.; Mendis, P.; Heath, D. Performance of High-Strength Concrete Walls Exposed to Fire. Adv. Struct. Eng. 2018, 21, 1173–1182. [Google Scholar] [CrossRef]
- Ni, S.; Birely, A.C. Post-Fire Seismic Behavior of Reinforced Concrete Structural Walls. Eng. Struct. 2018, 168, 163–178. [Google Scholar] [CrossRef]
- Li, W.; Guo, Z. Experimental Investigation on Strength and Deformation of Concrete at Elevated Temperature. J. Build. Struct. 1993, 14, 8–16. (In Chinese) [Google Scholar]
- Park, R. Ductility evaluation from laboratory and analytical testing. In Proceedings of the 9th World Conference on Earthquake Engineering, Tokyo-Kyoto, Japan, 1 August 1988; Volume 8, pp. 605–616. [Google Scholar]
- GB 50011-2010; Code for Seismic Design of Buildings. China Architecture & Building Press: Beijing, China, 2010. (In Chinese)
Figure 1.
Dimensions and details of Specimen (unit: mm). (a) SW1~SW3 specimen design drawings; (b) SW4 specimen design drawings.
Figure 1.
Dimensions and details of Specimen (unit: mm). (a) SW1~SW3 specimen design drawings; (b) SW4 specimen design drawings.

Figure 2.
Concrete casting of specimens. (a) Formwork; (b) Thermocouple arrangement; (c) Precast wallboard pouring; (d) Precast wallboard pouring completed; (e) Precast wallboard and steel pipe assembling; (f) Casting of foundation beam; (g) Wet DCLs; (h) Cavity pouring. The variables studied experimentally included fire exposure time, fire-retardant coating on the edge constraint steel pipe column, and the width-thickness ratio. The basic parameters of each specimen are detailed in Table 1.

Figure 3.
Demolished concrete lumps (DCLs).
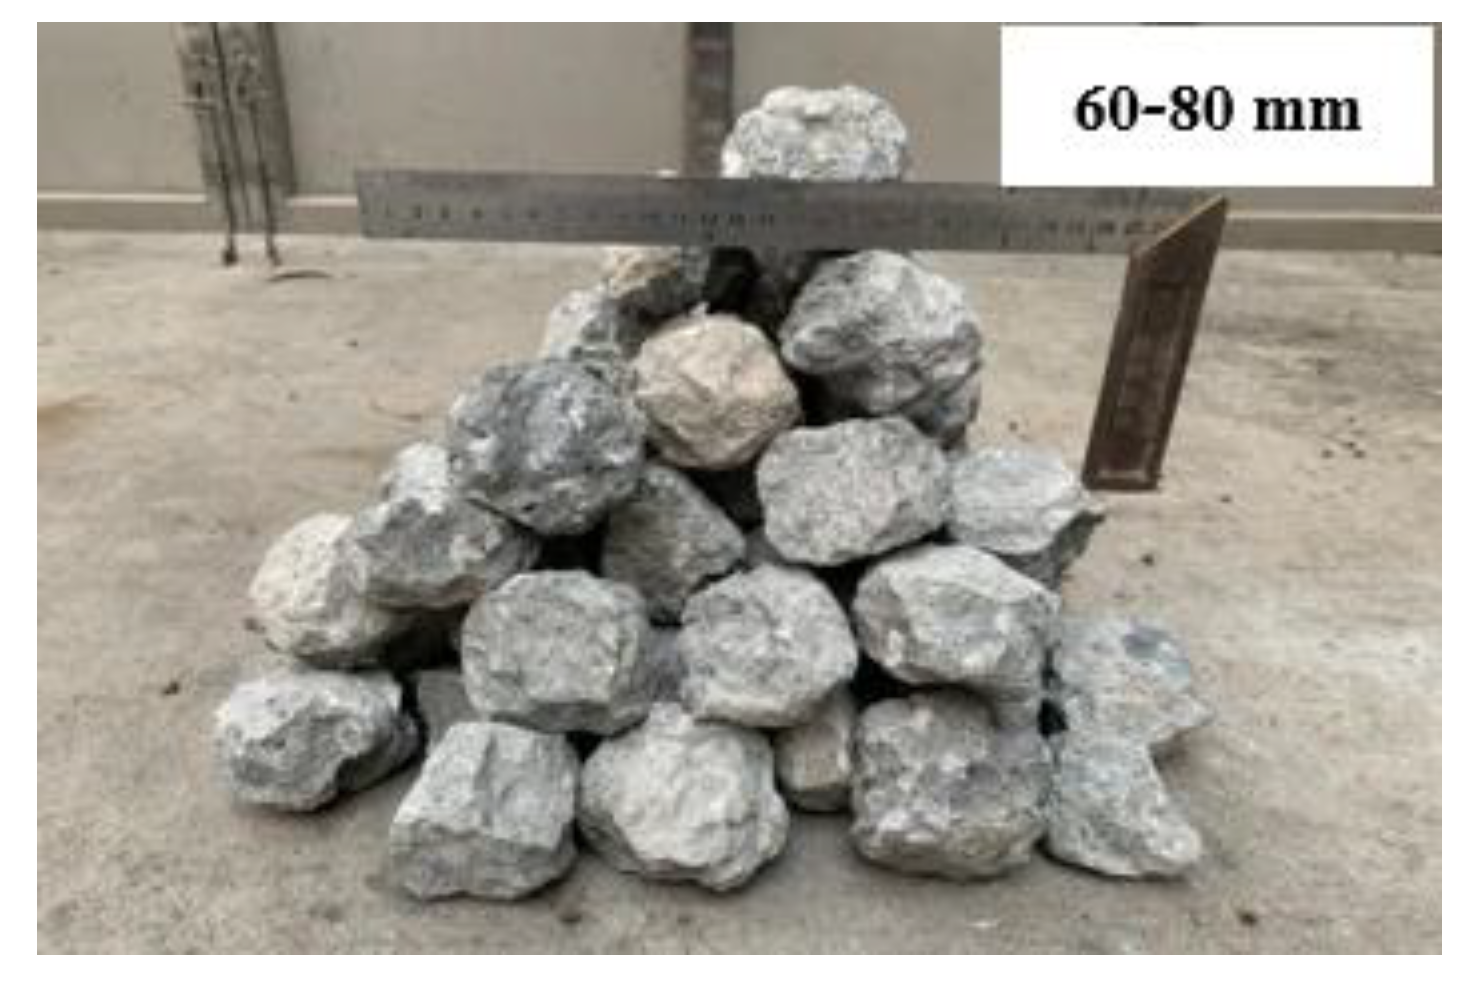
Figure 4.
Fire protection treatment of specimen.
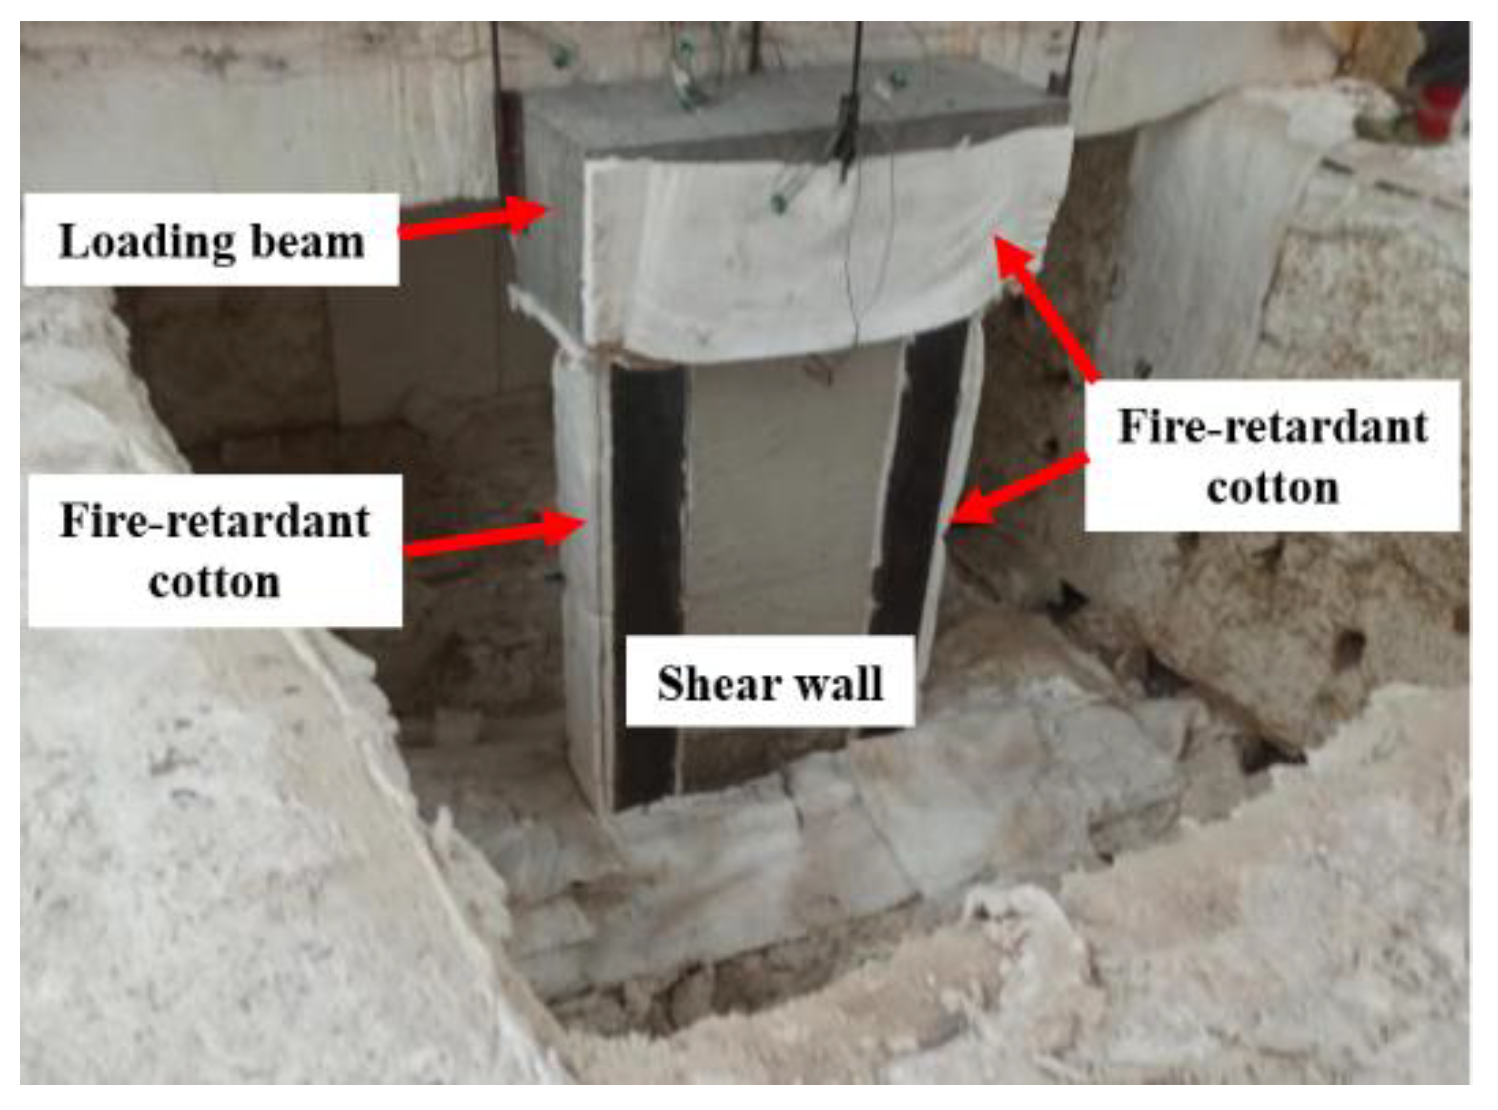
Figure 5.
Test setup. (a) Schematic diagram of test setup; (b) Specimen installation site.
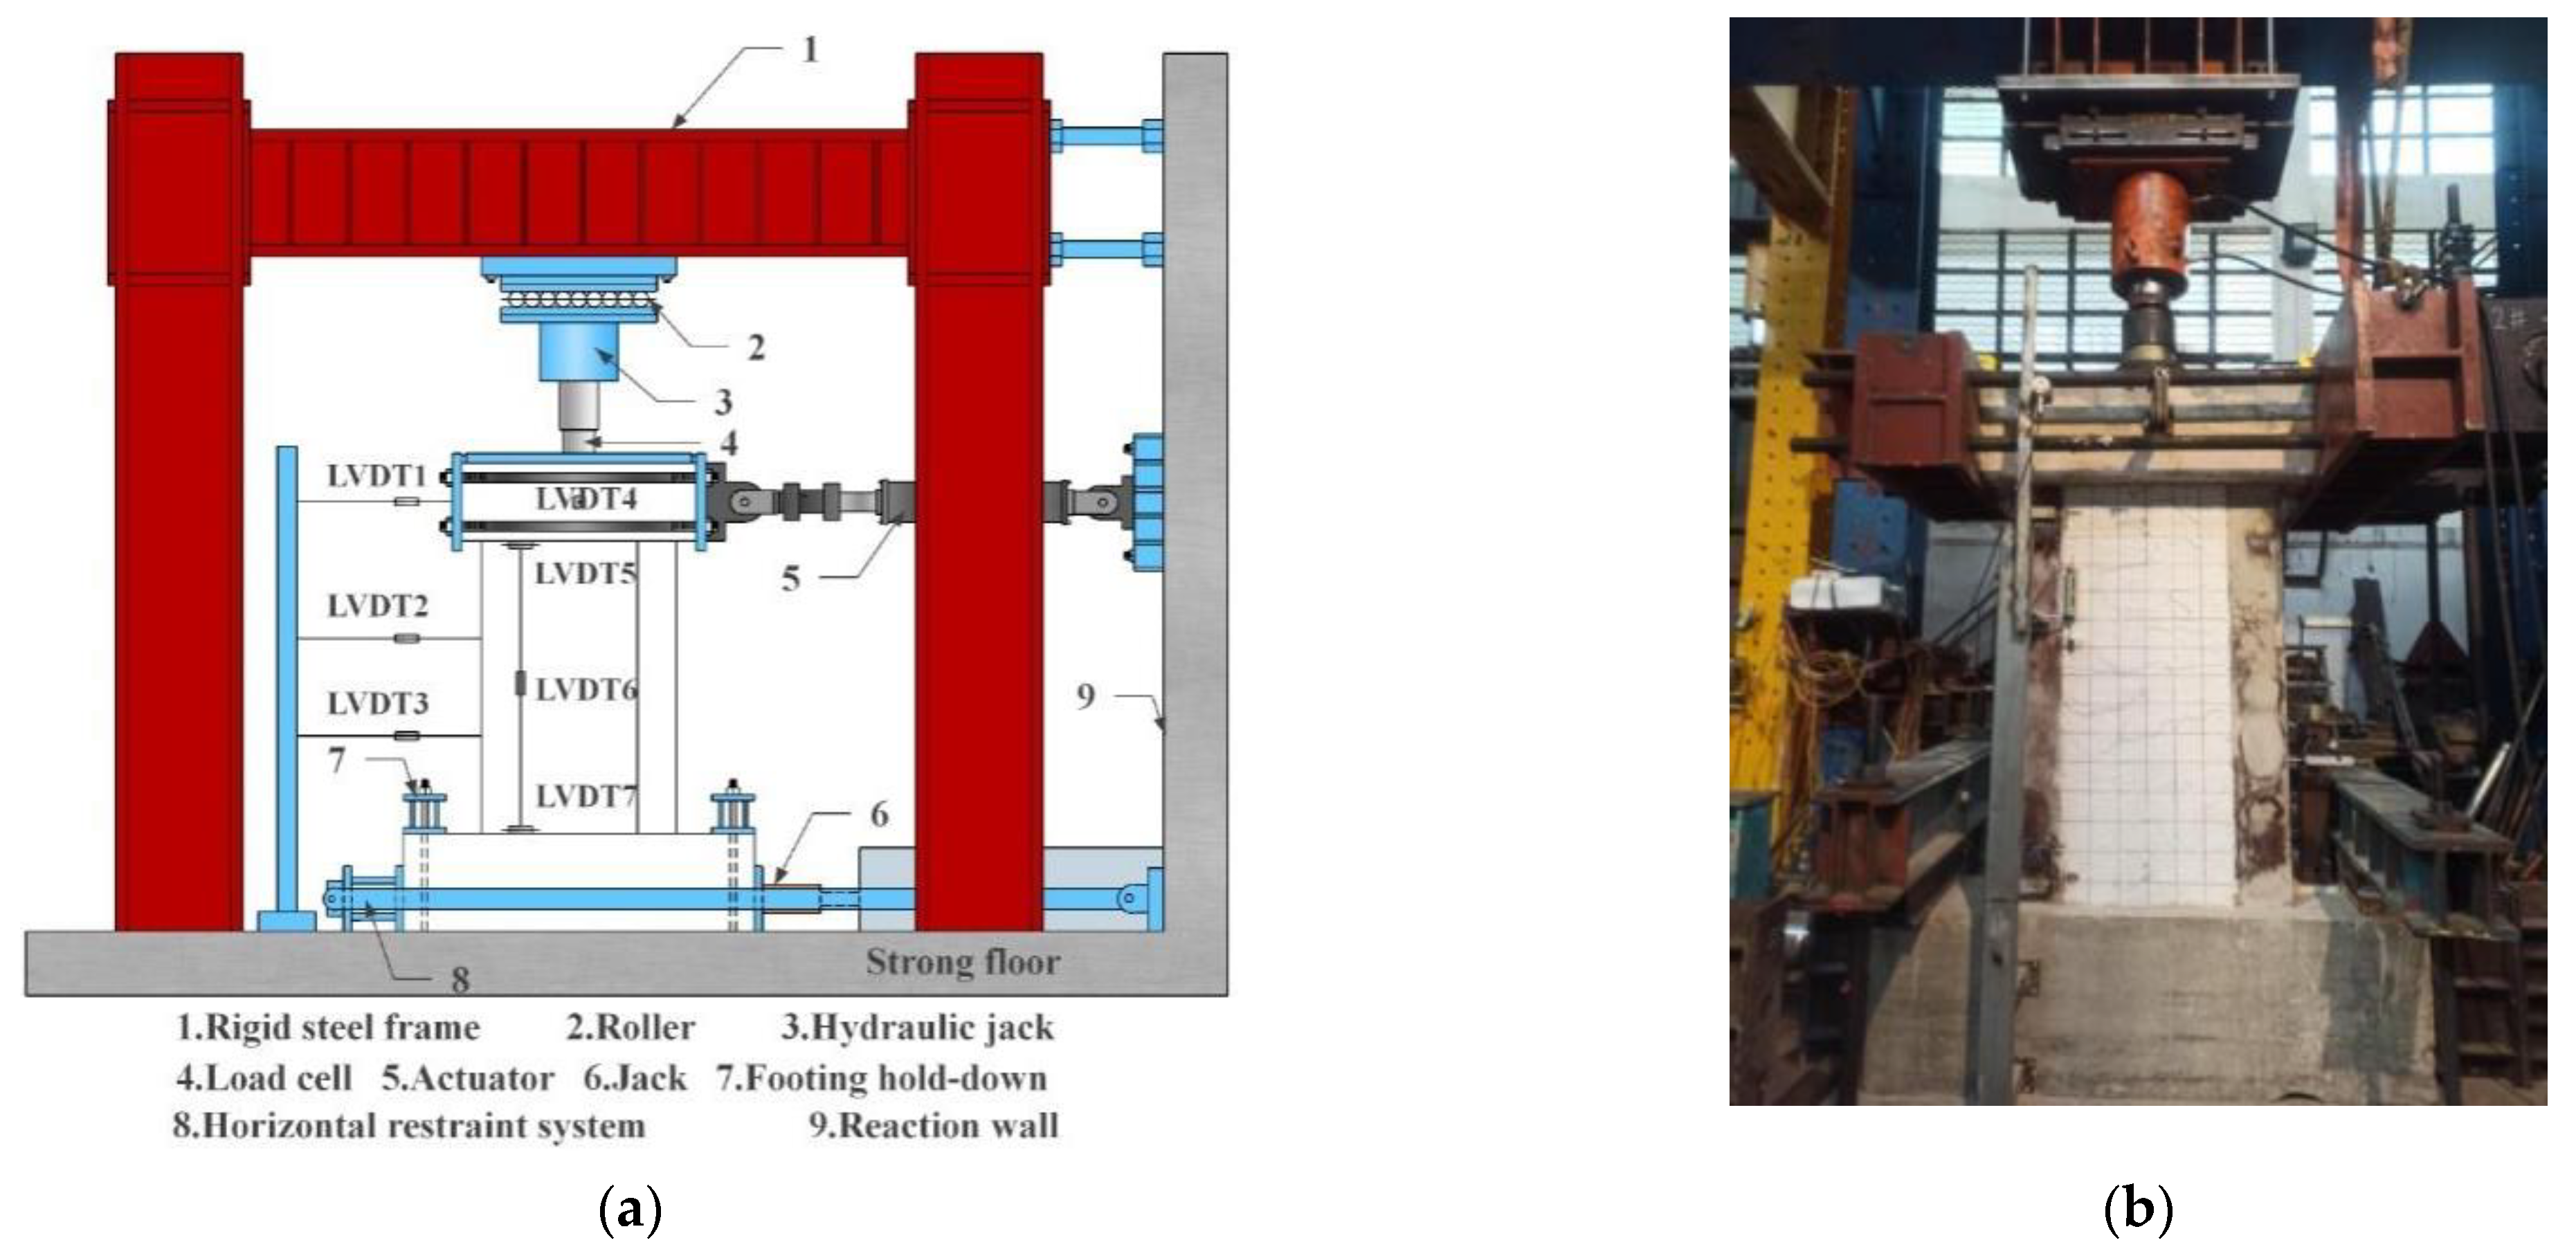
Figure 6.
Arrangement of LVDTs on specimens (unit: mm). (a) Arrangement of LVDTs on SW2 and SW3; (b) Arrangement of LVDTs on SW4.
Figure 6.
Arrangement of LVDTs on specimens (unit: mm). (a) Arrangement of LVDTs on SW2 and SW3; (b) Arrangement of LVDTs on SW4.
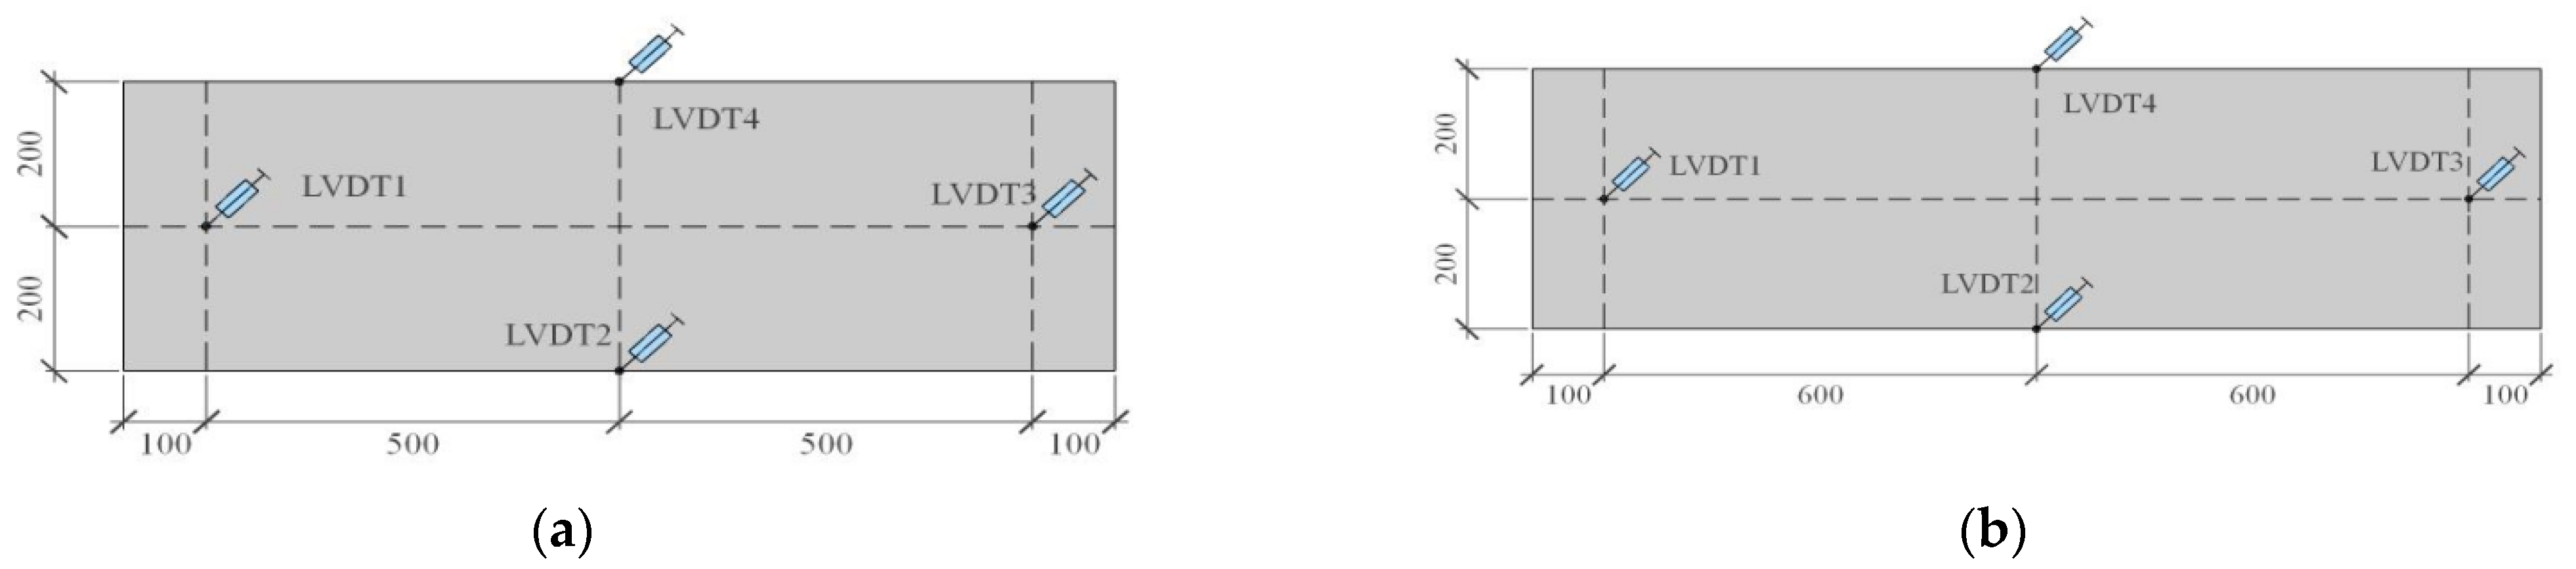
Figure 7.
Arrangement of thermocouples in specimens (unit: mm). (a) Arrangement of thermocouples in SW2 and SW3; (b) Arrangement of thermocouples in SW4; (c) Thermocouples side profile.
Figure 7.
Arrangement of thermocouples in specimens (unit: mm). (a) Arrangement of thermocouples in SW2 and SW3; (b) Arrangement of thermocouples in SW4; (c) Thermocouples side profile.
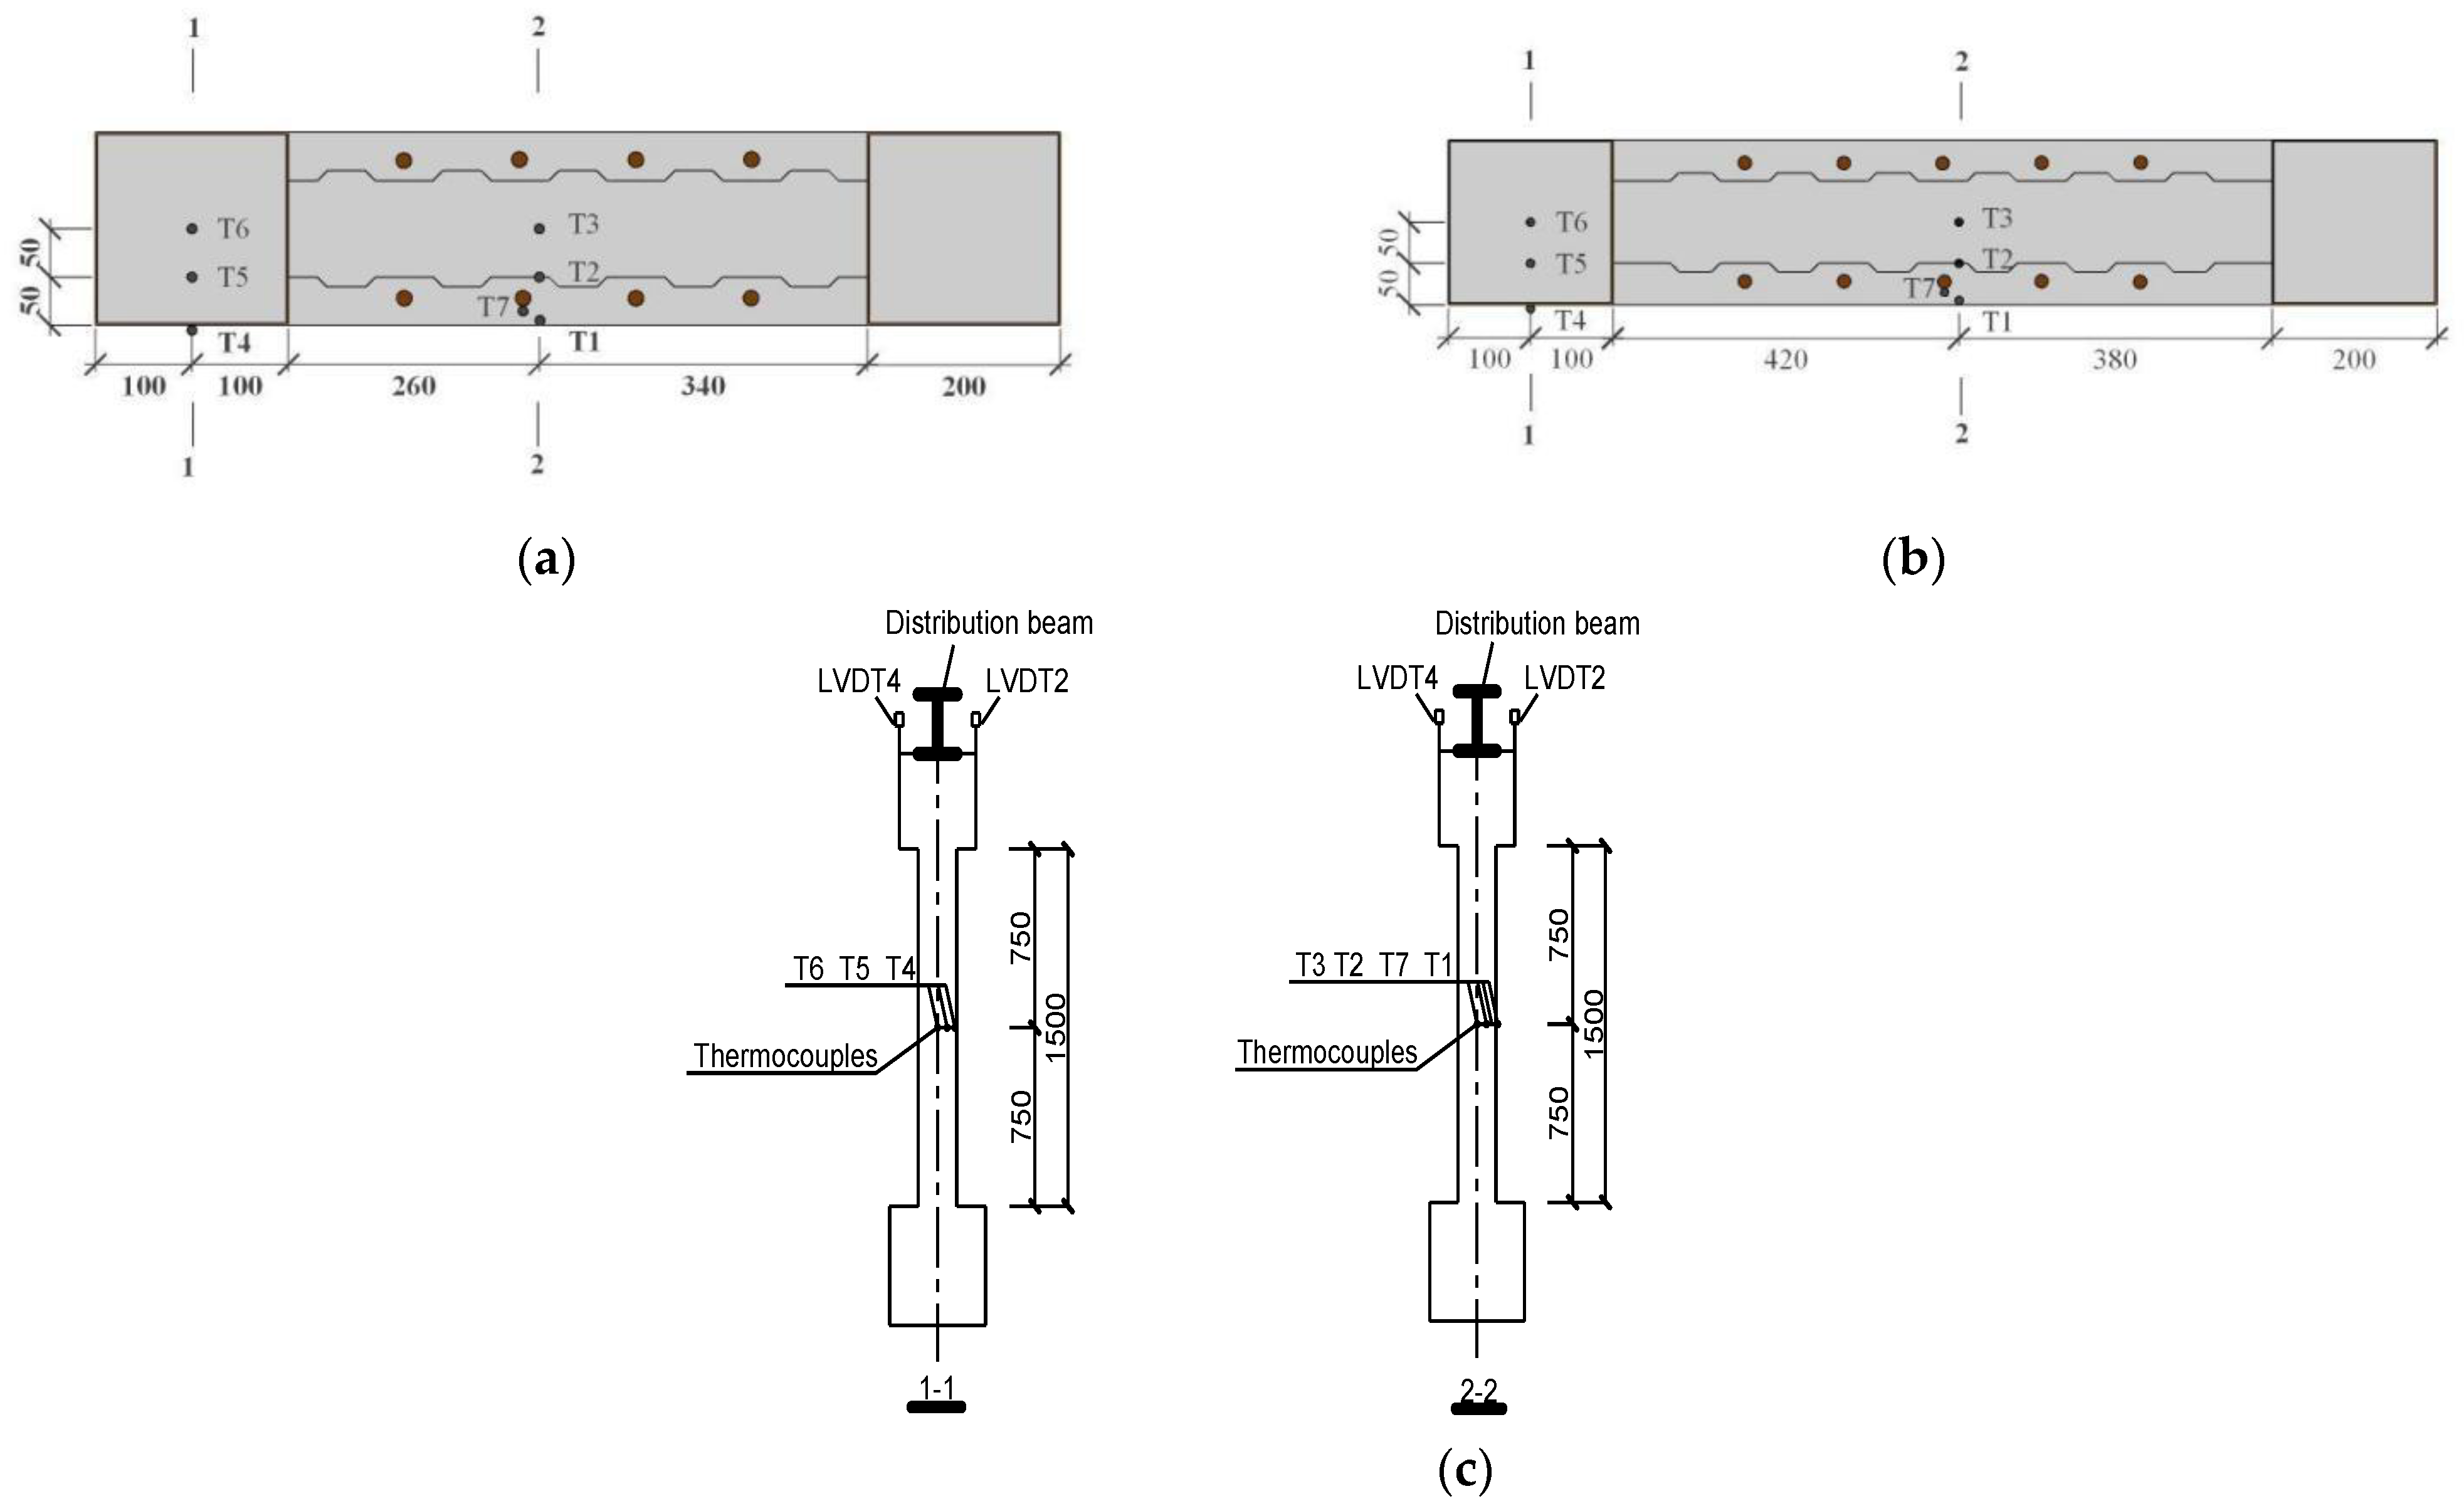
Figure 8.
Horizontal loading system.
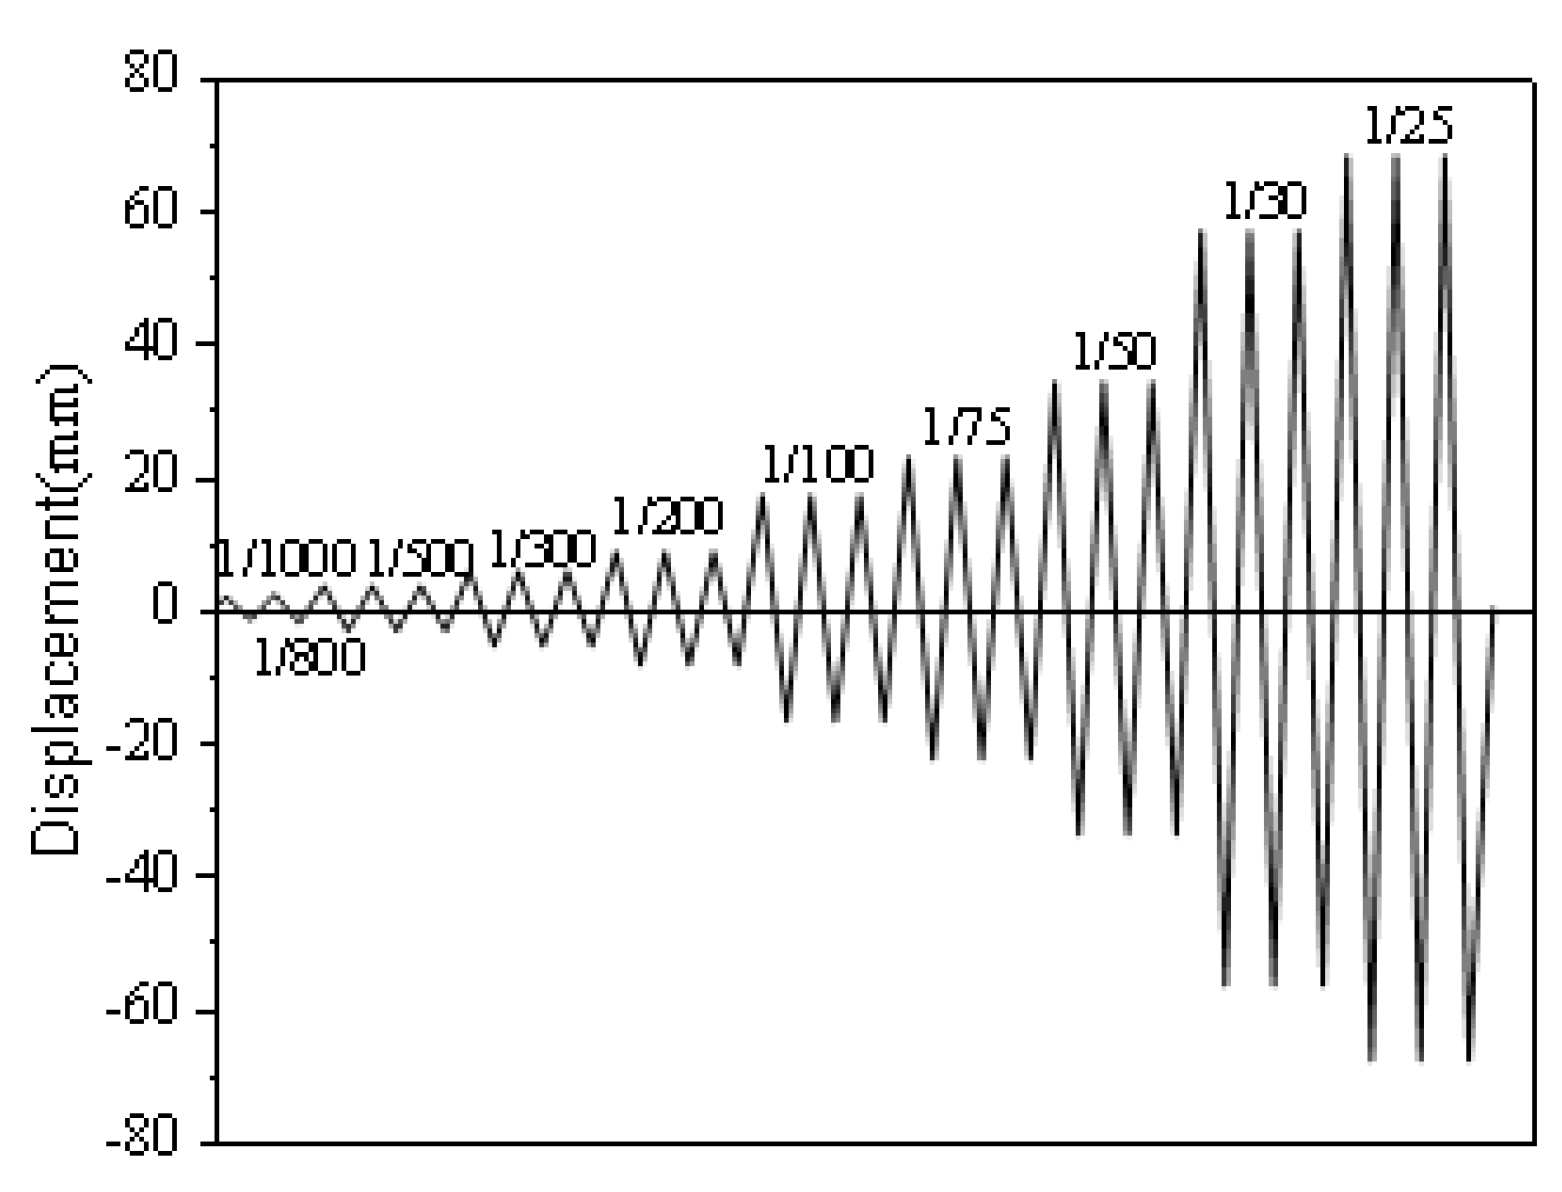
Figure 9.
Patterns of specimen after fire. (a) SW2; (b) SW3; (c) SW4.
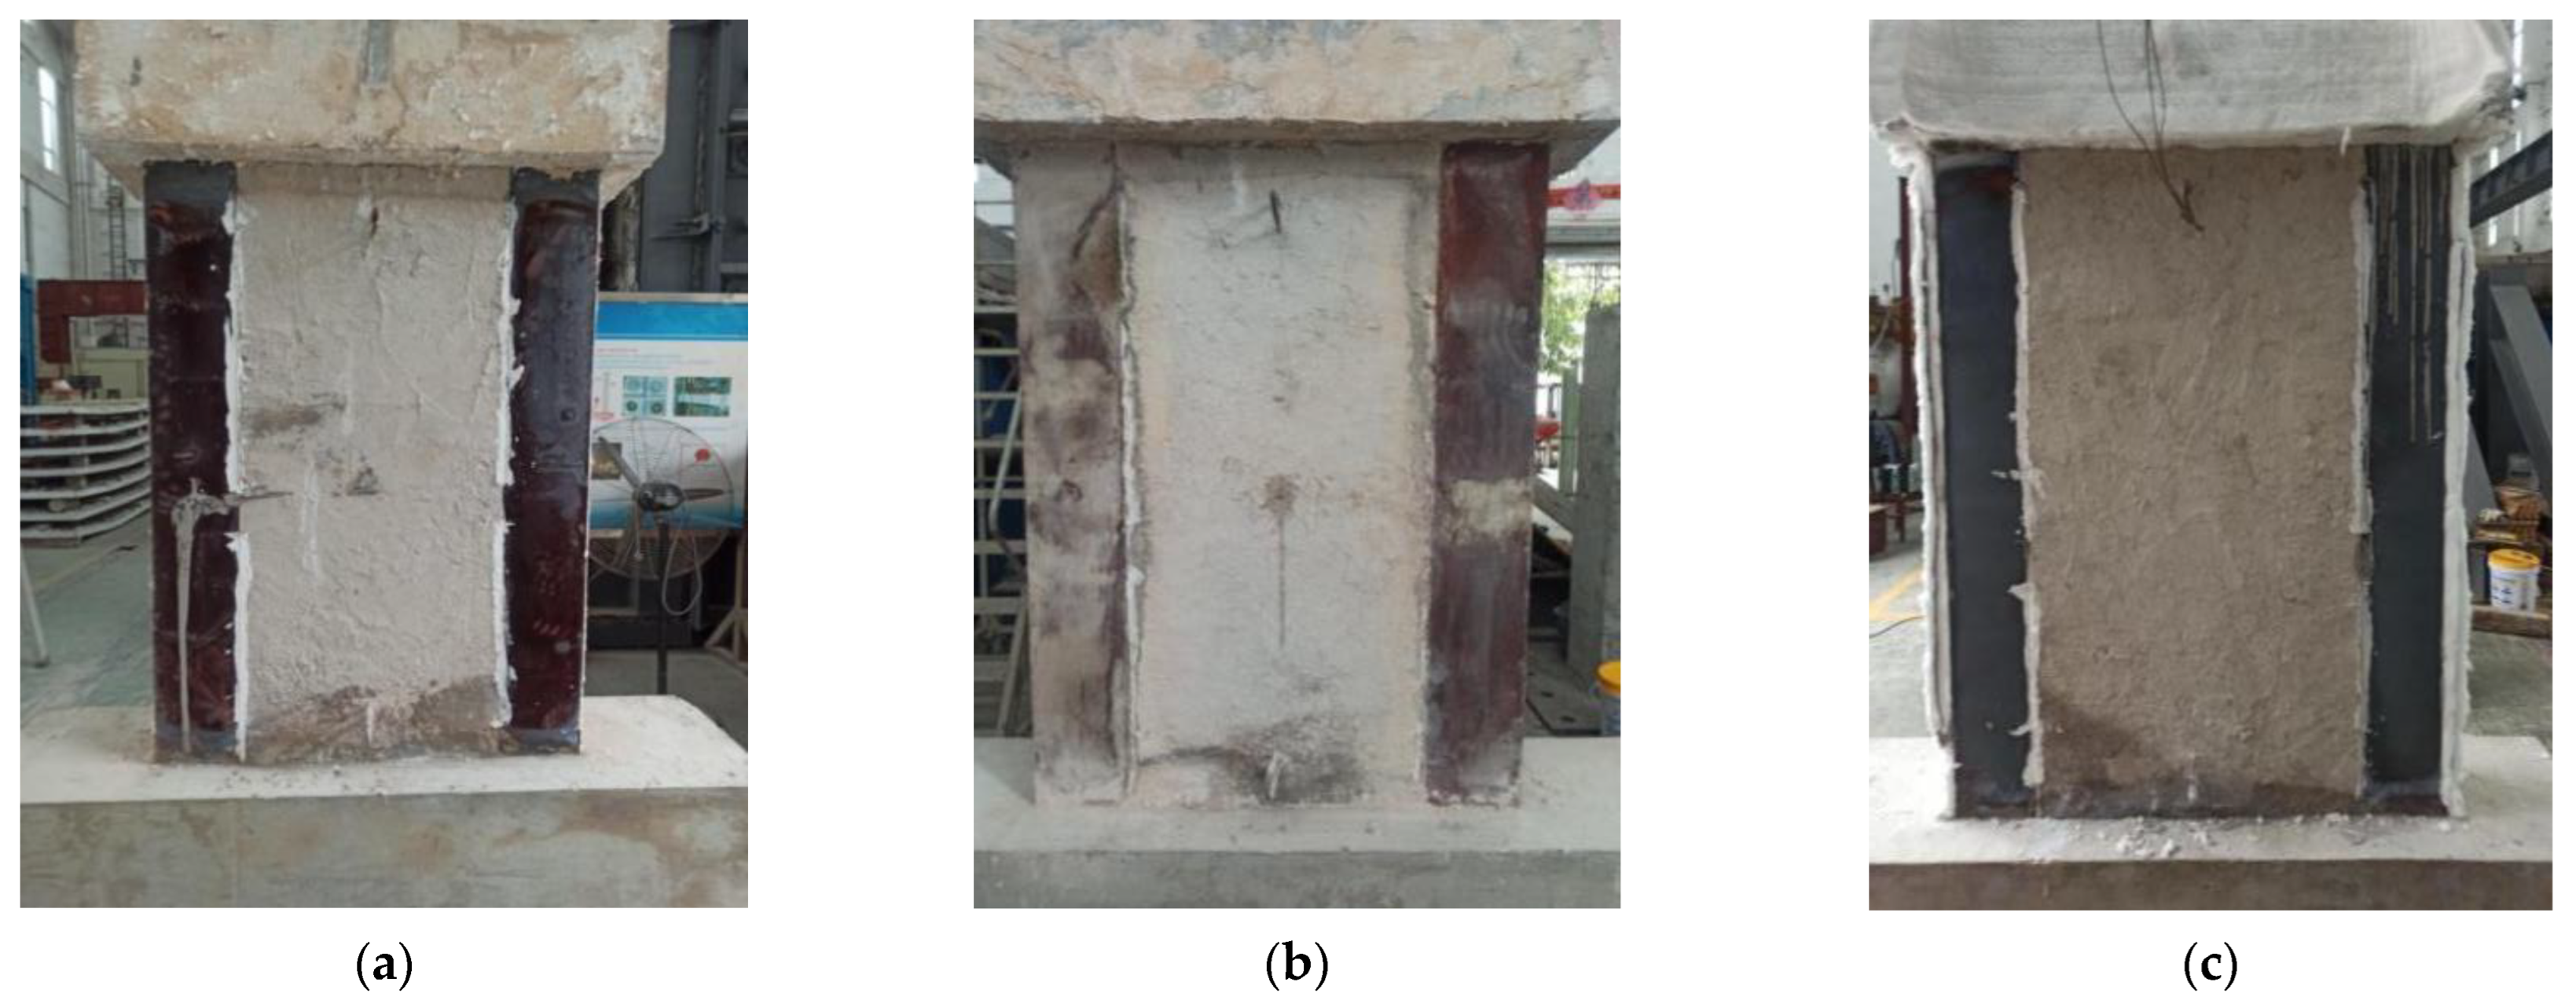
Figure 10.
Comparison of measured temperature–time curves in furnace and ISO 834 standard curve.
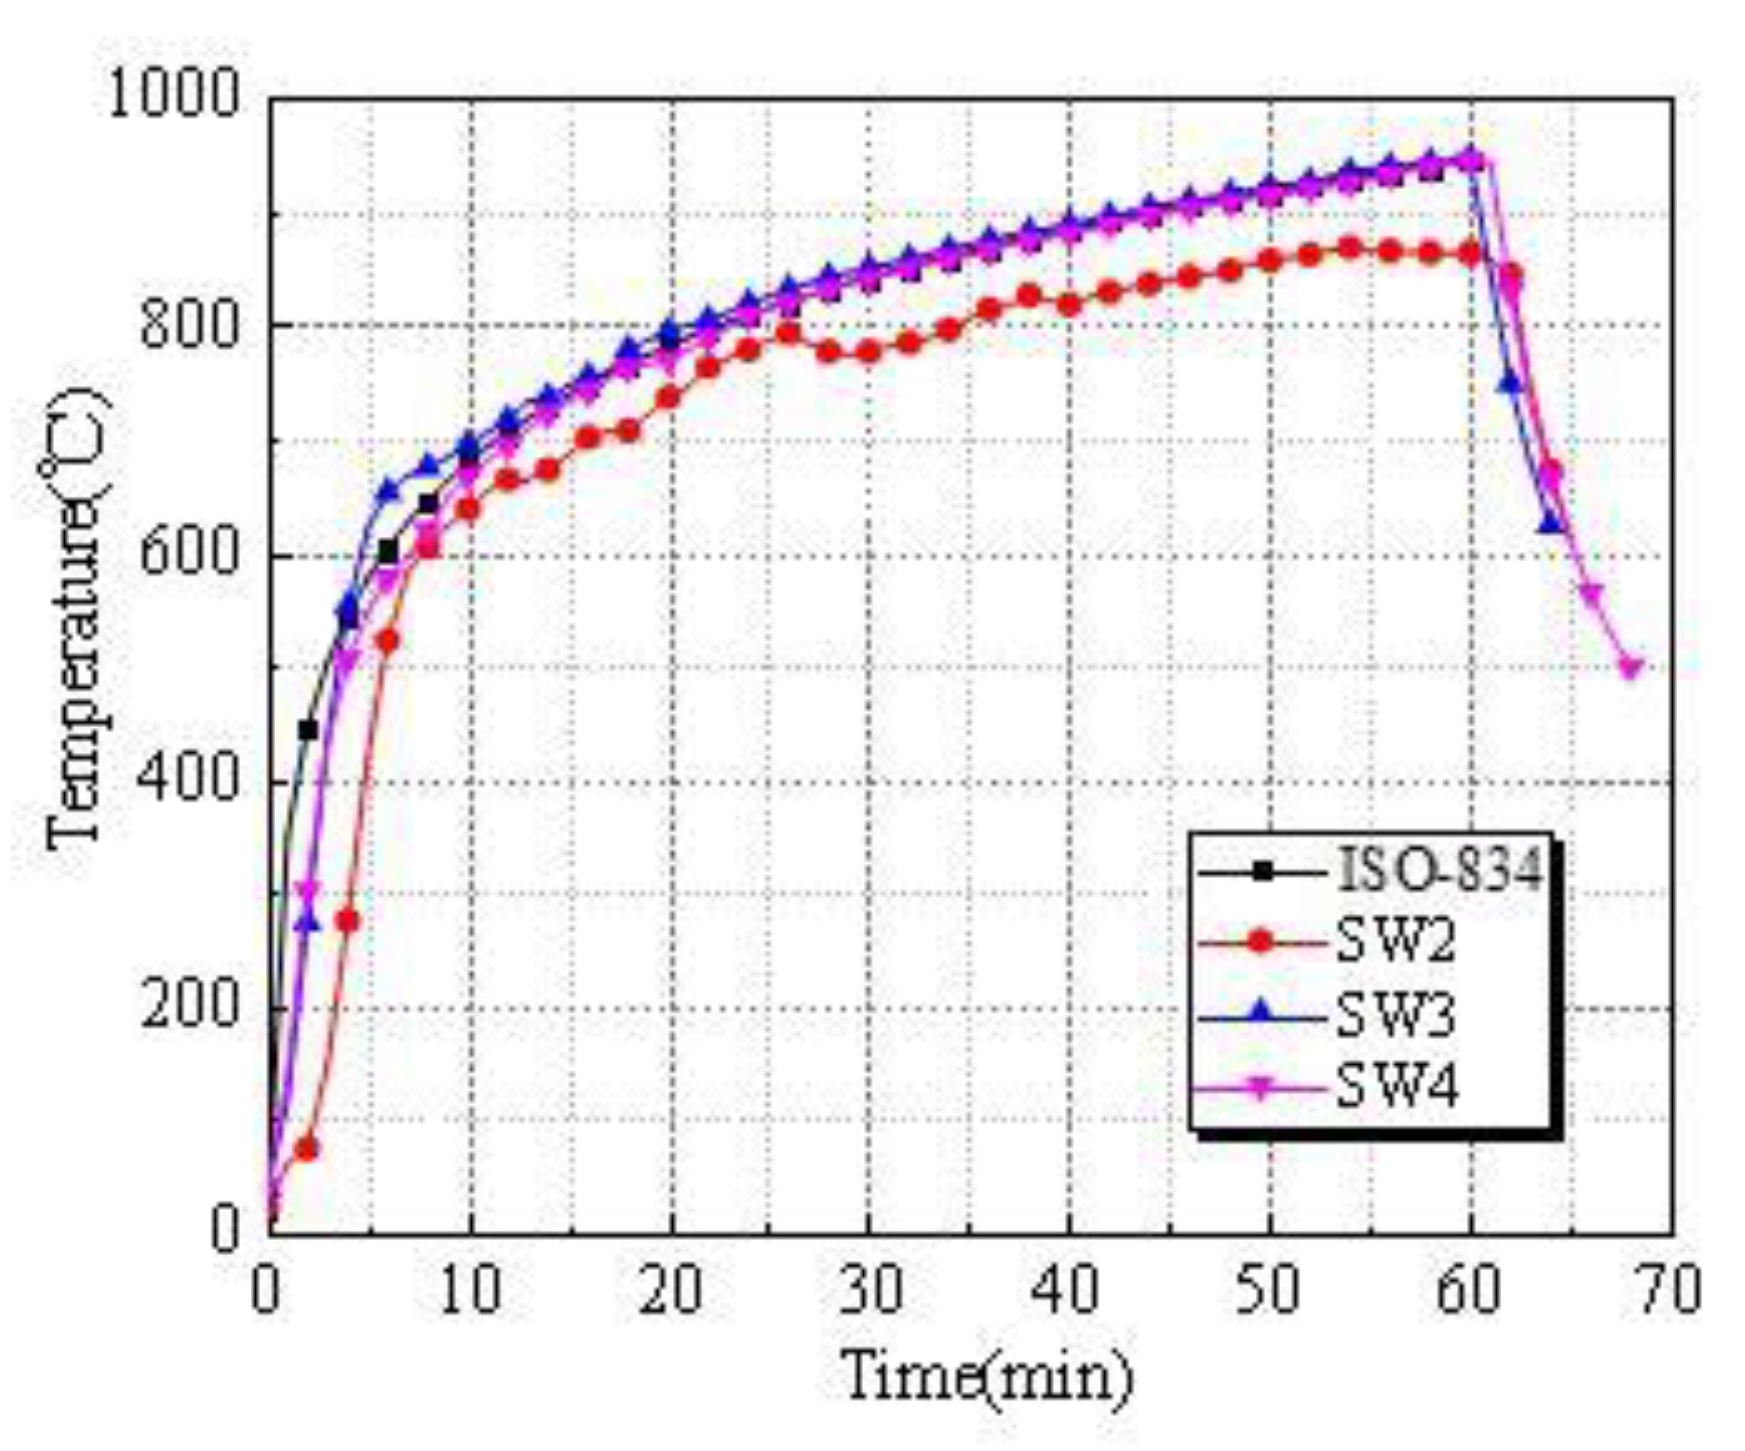
Figure 11.
Temperature–time curves. (a) SW2; (b) SW3; (c) SW4.
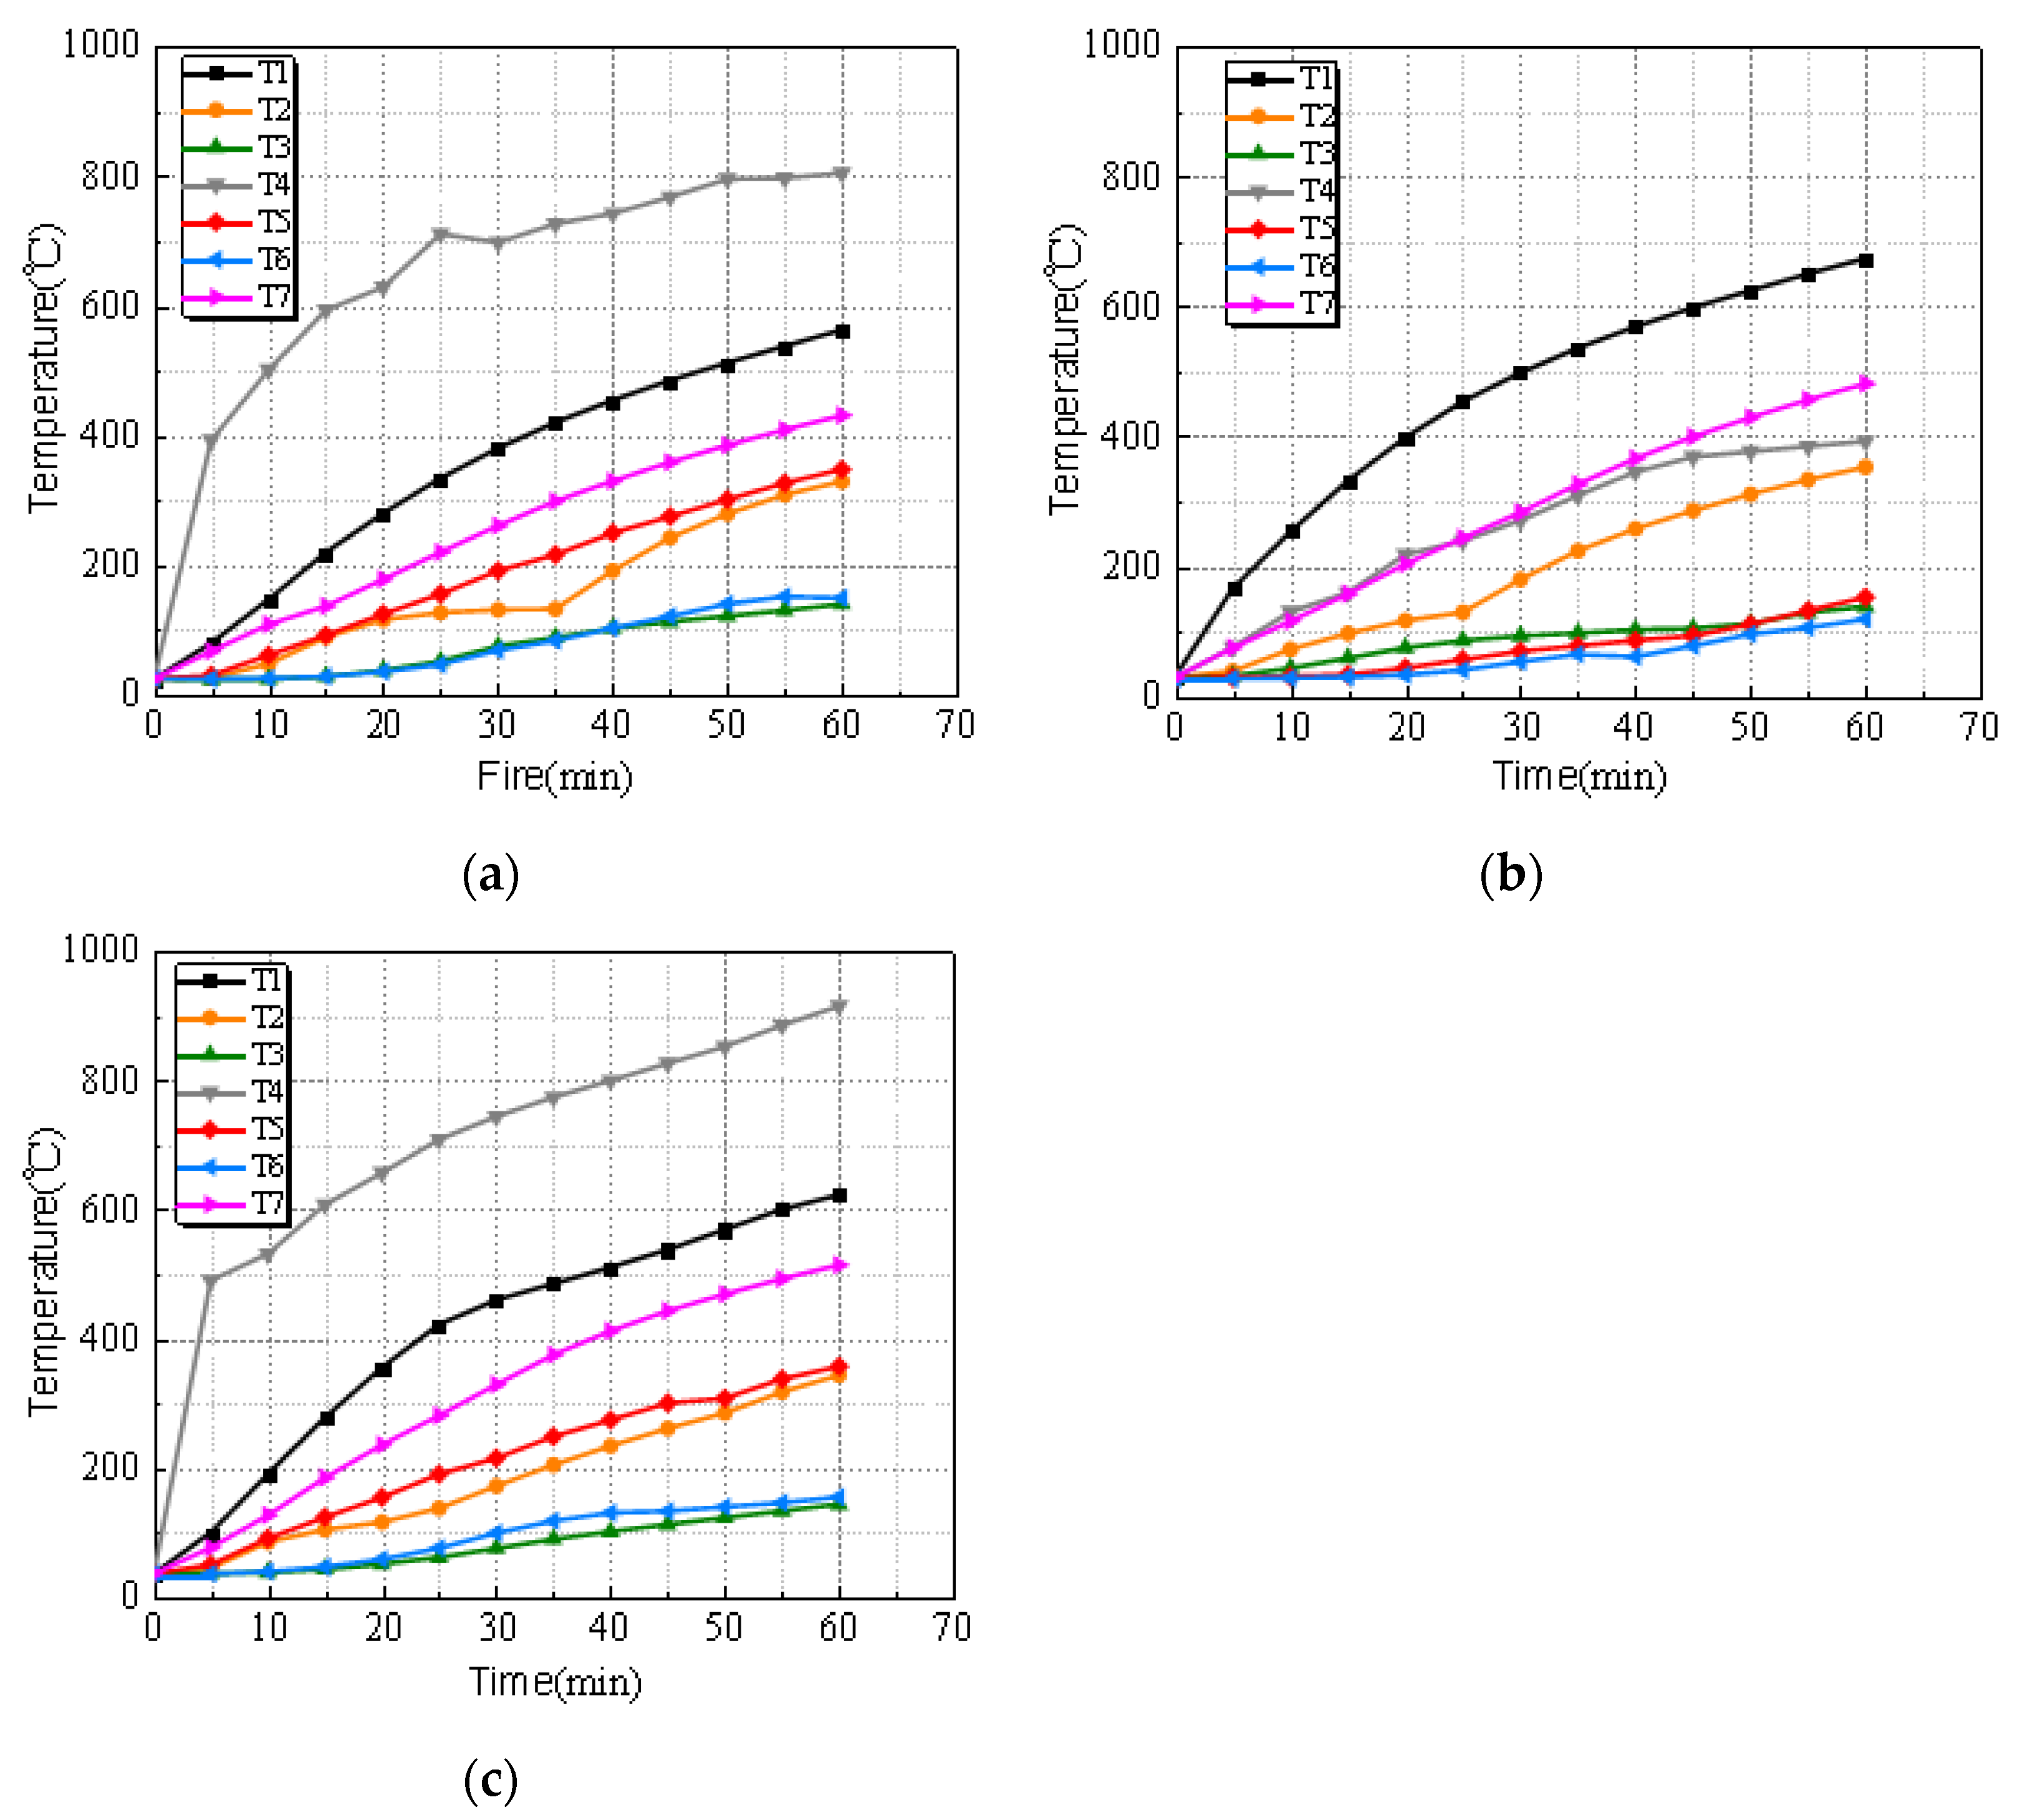
Figure 12.
Vertical deformation–time curves of specimens. (a) SW2; (b) SW3; (c) SW4.

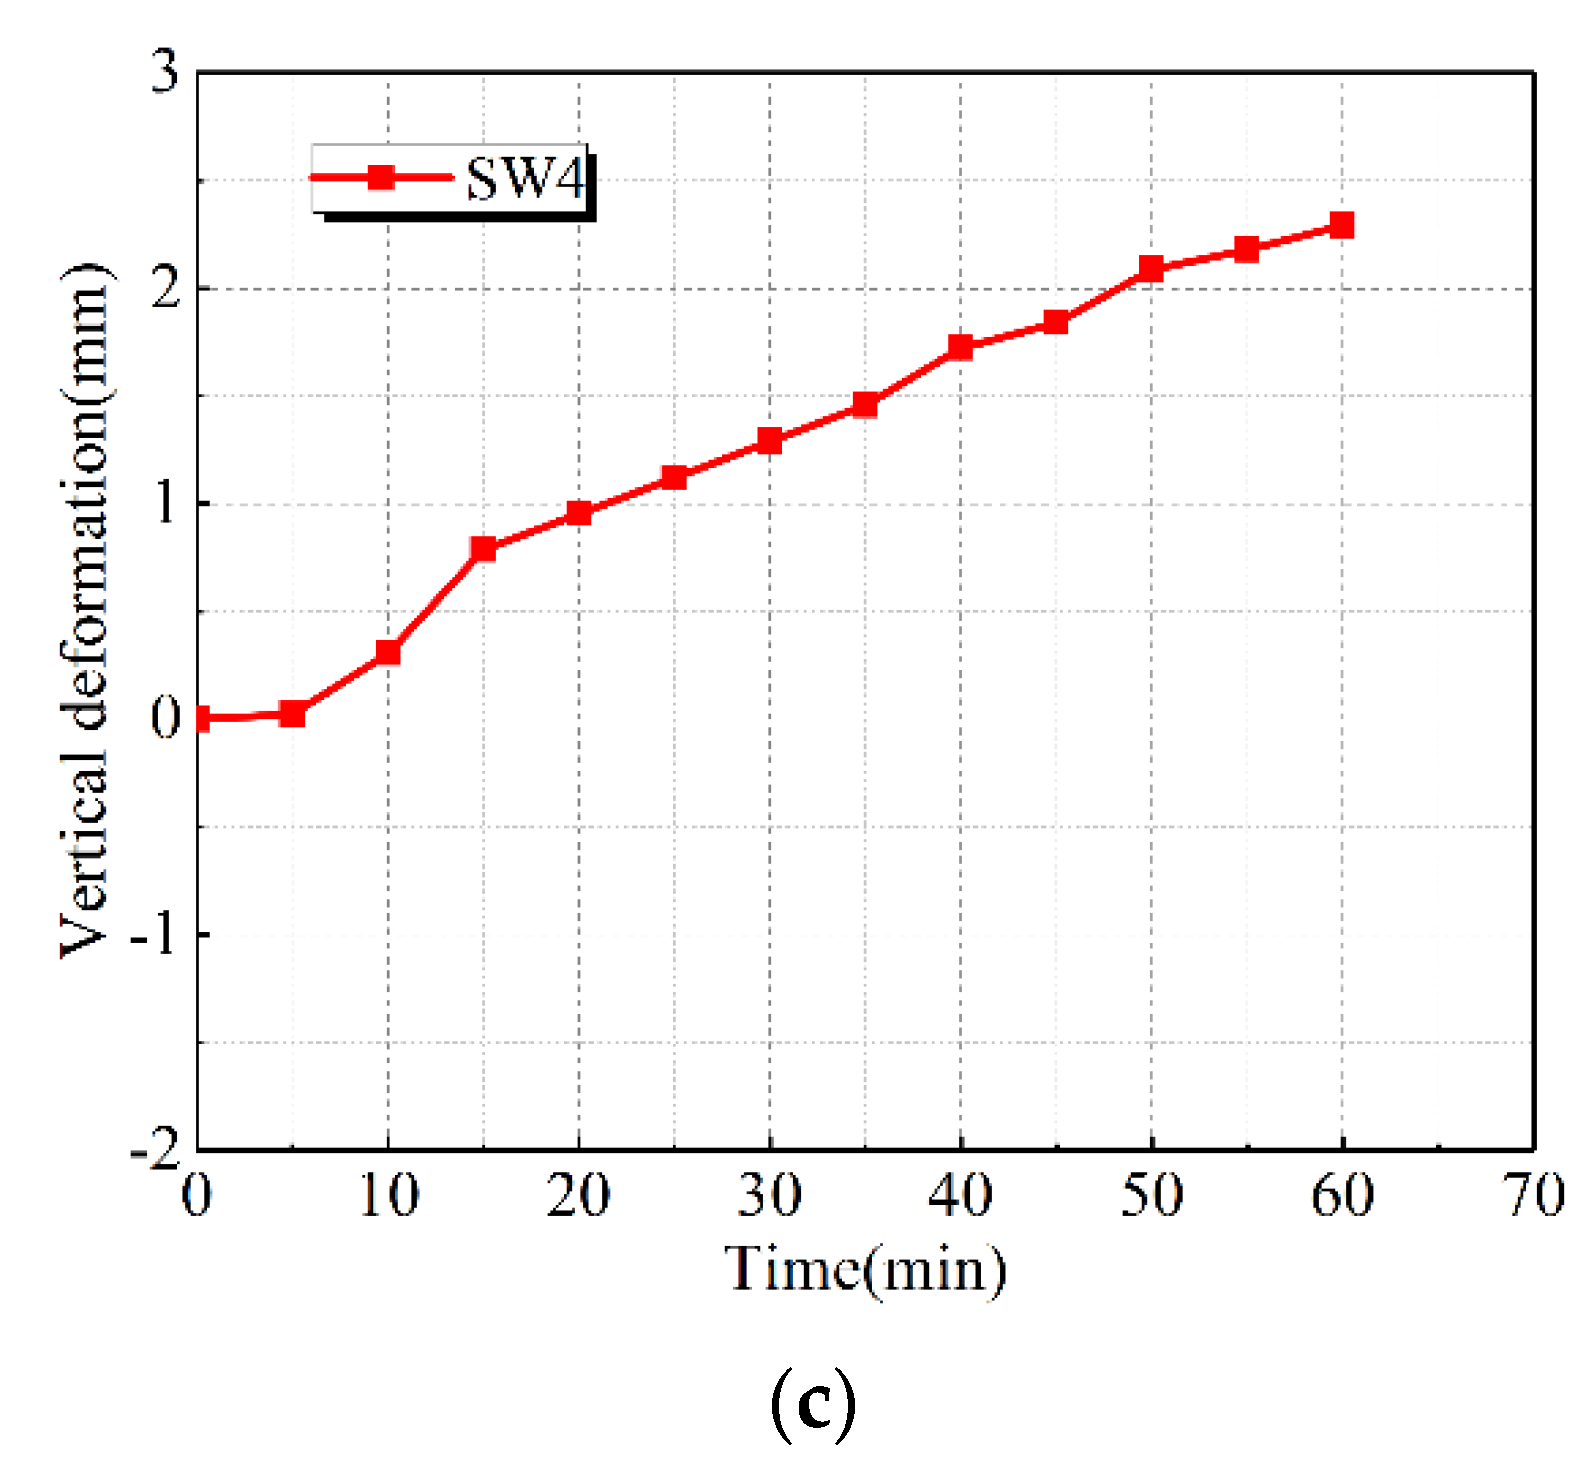
Figure 13.
Failure patterns of specimens. (a) SW1; (b) SW2; (c) SW3; (d) SW4.

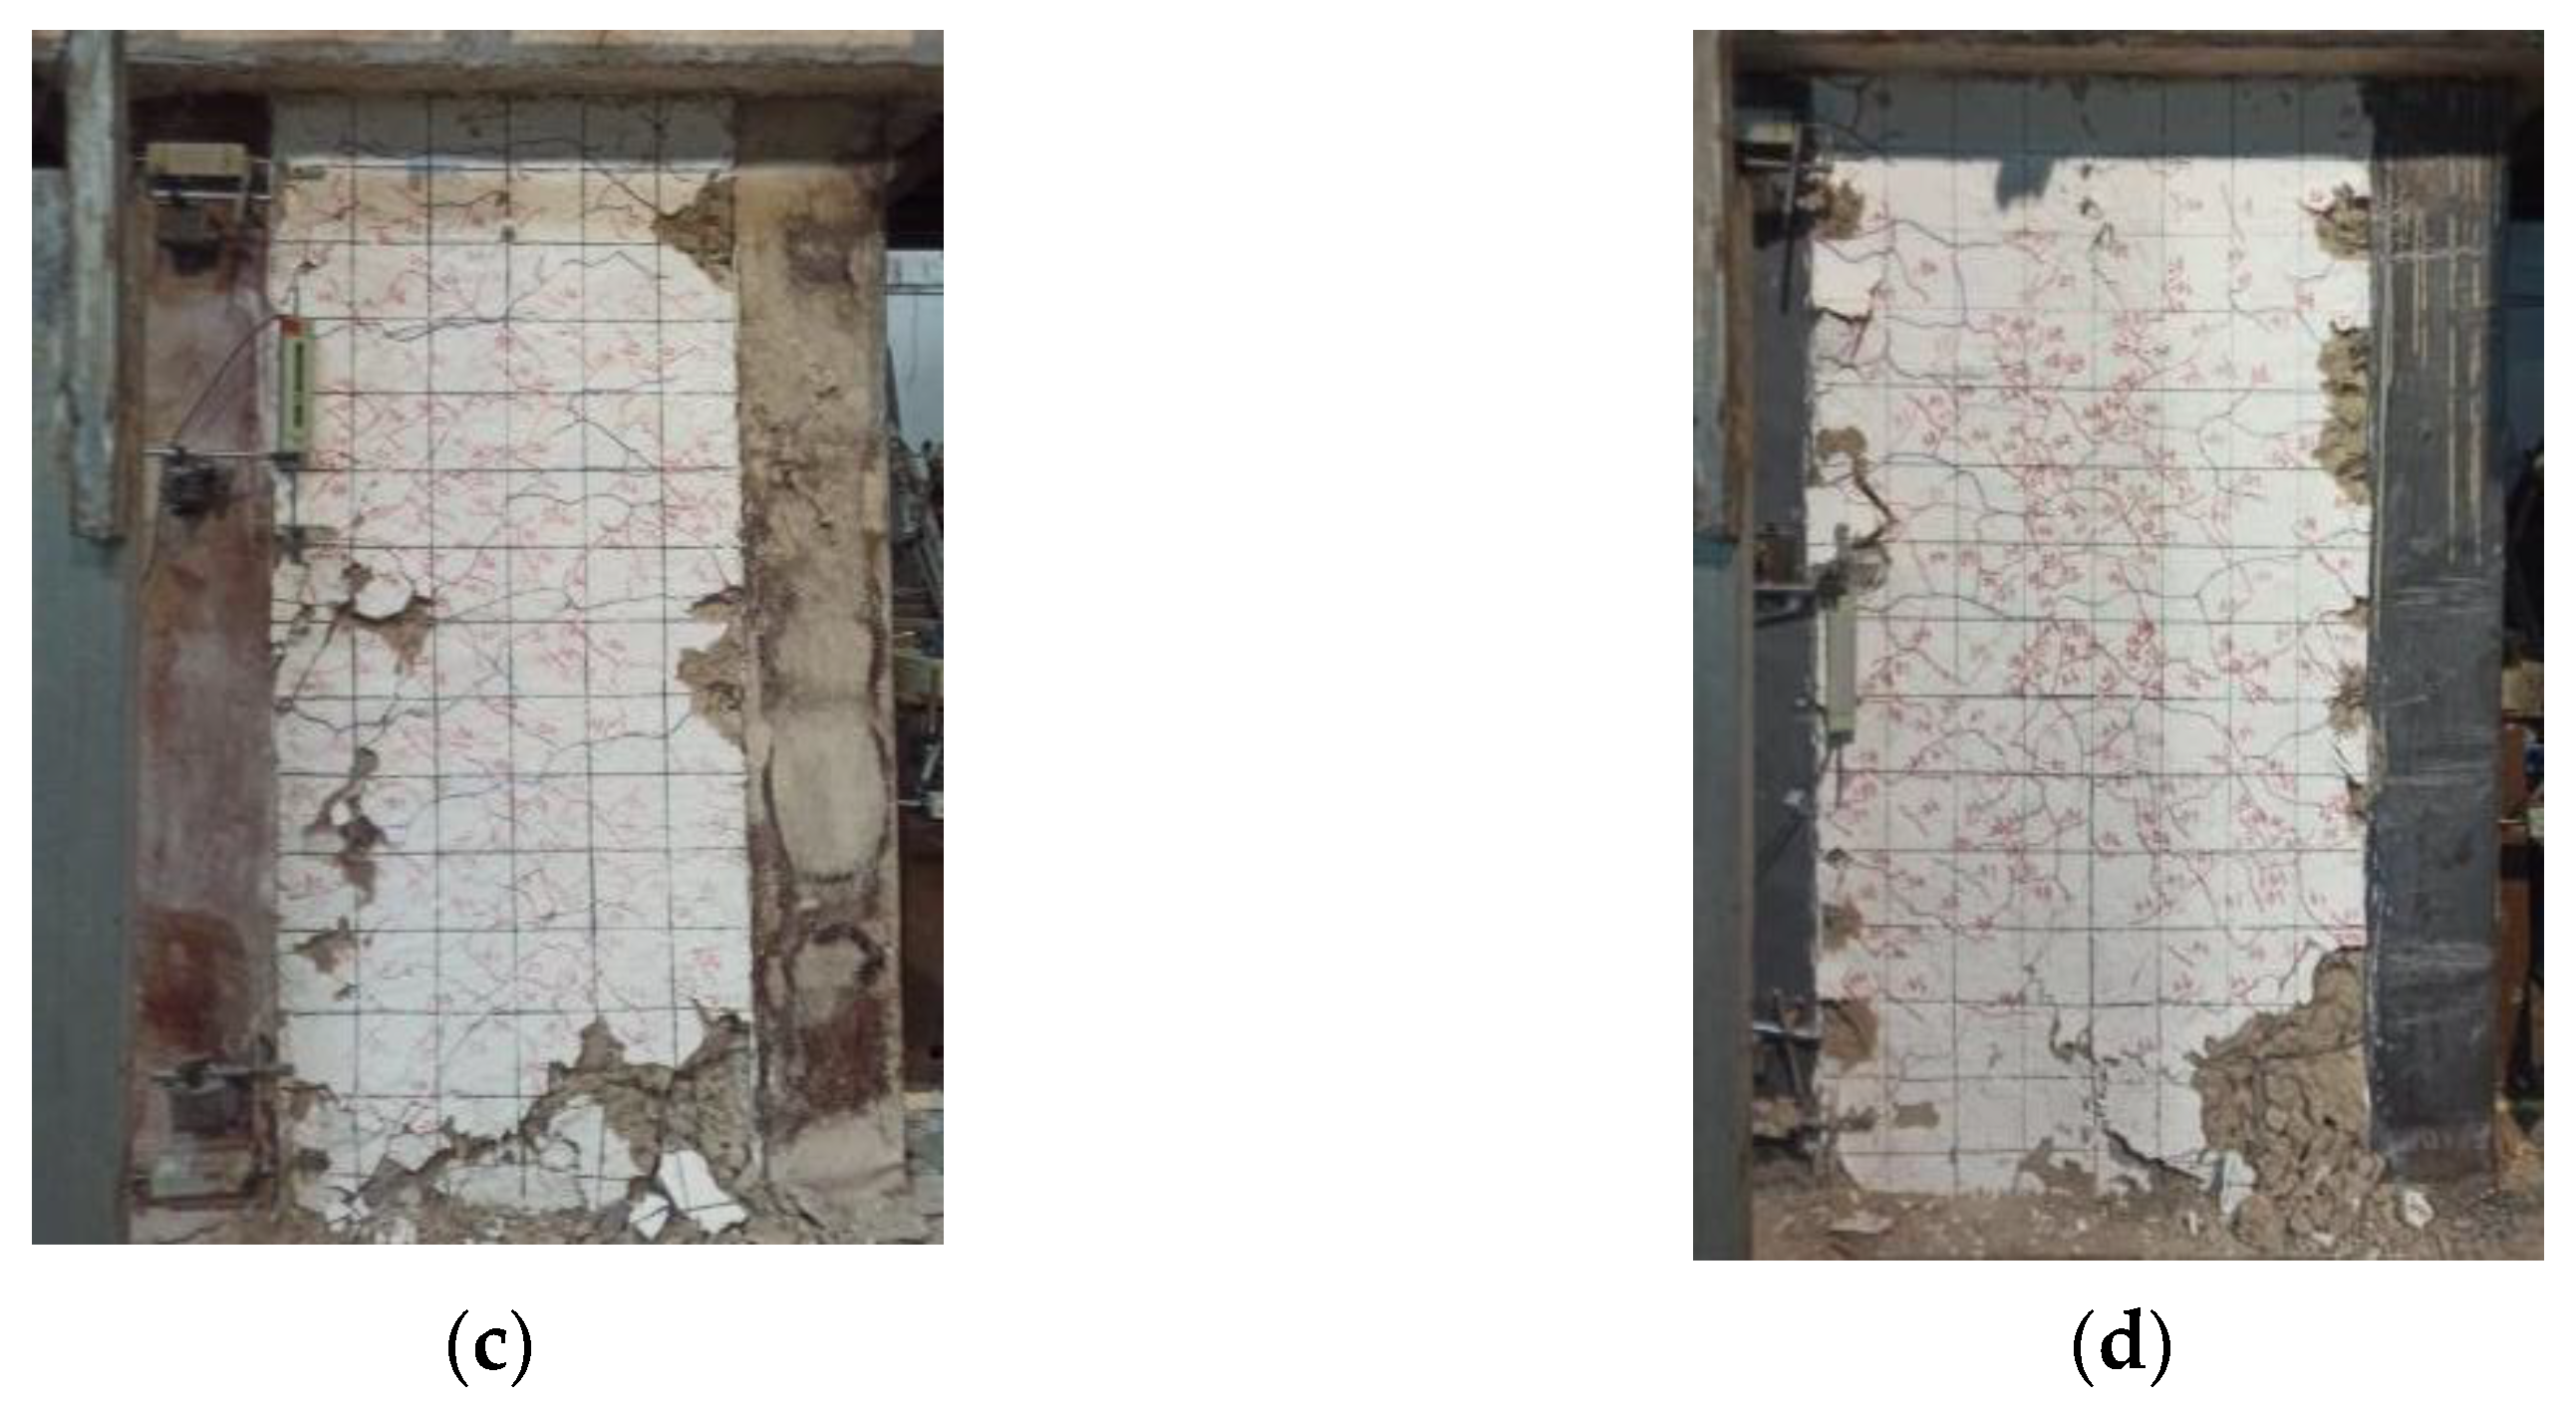
Figure 14.
Failure processes and modes of specimen SW2. (a) Displacement angle 1/800; (b) Displacement angle 1/500; (c) Displacement angle 1/300; (d) Displacement angle 1/200; (e) Displacement angle 1/50; (f) Displacement angle 1/30.
Figure 14.
Failure processes and modes of specimen SW2. (a) Displacement angle 1/800; (b) Displacement angle 1/500; (c) Displacement angle 1/300; (d) Displacement angle 1/200; (e) Displacement angle 1/50; (f) Displacement angle 1/30.
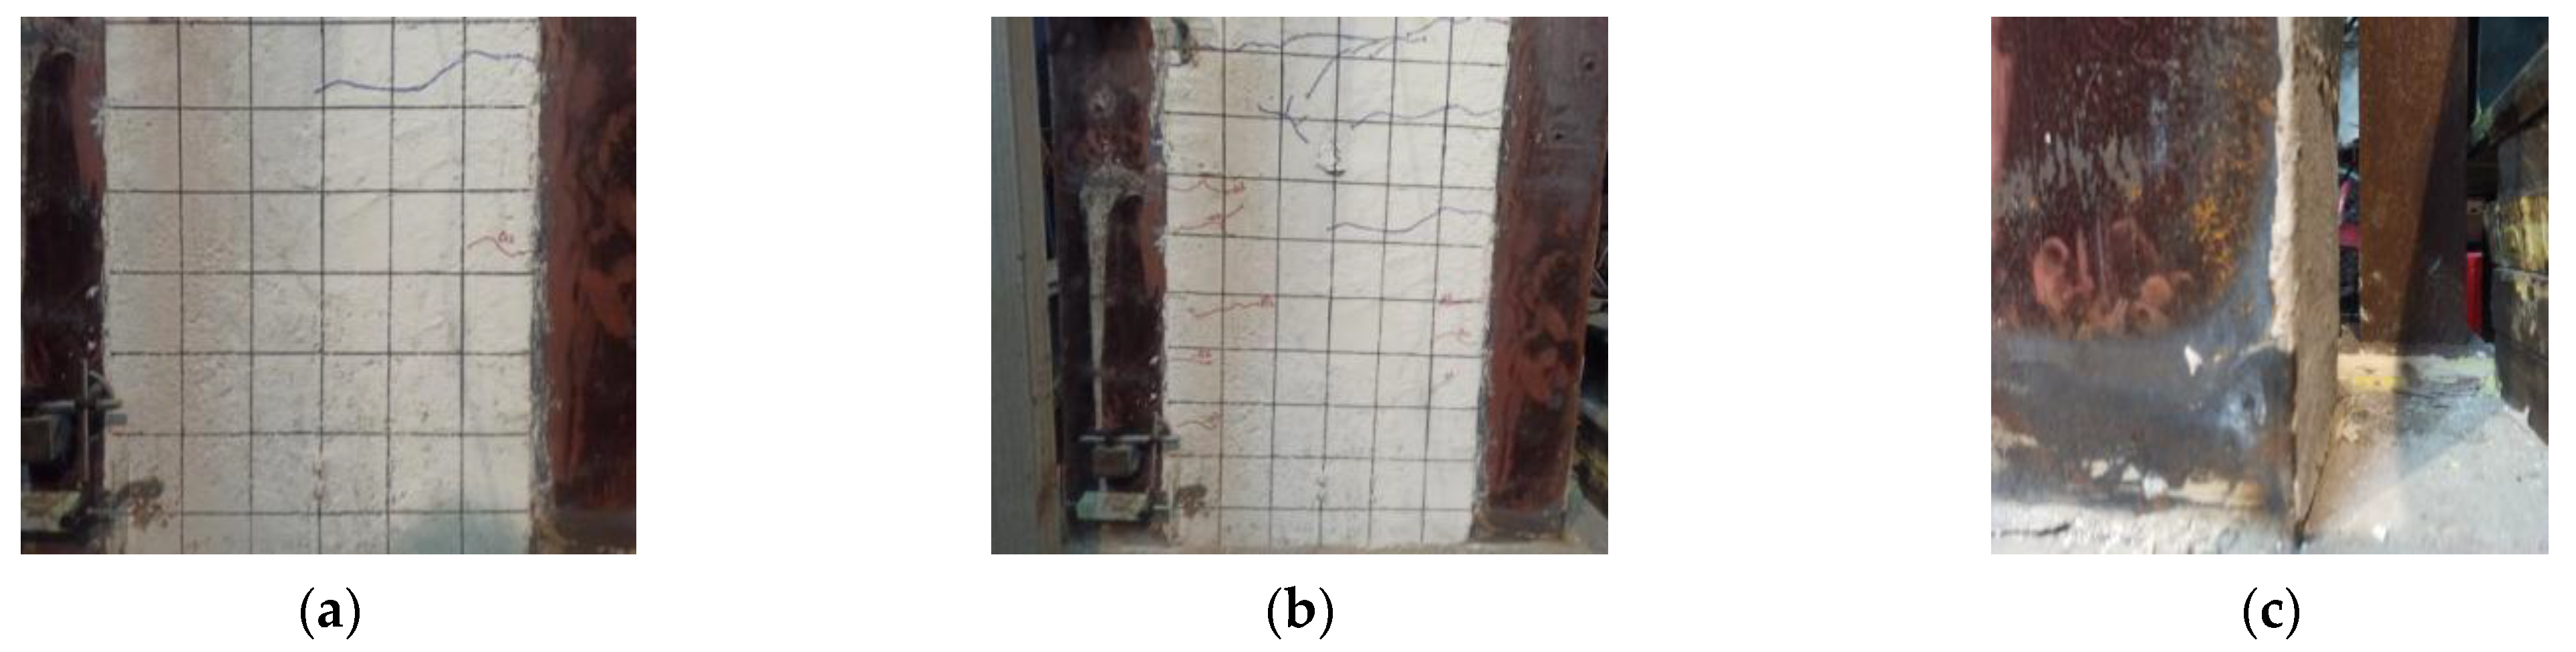
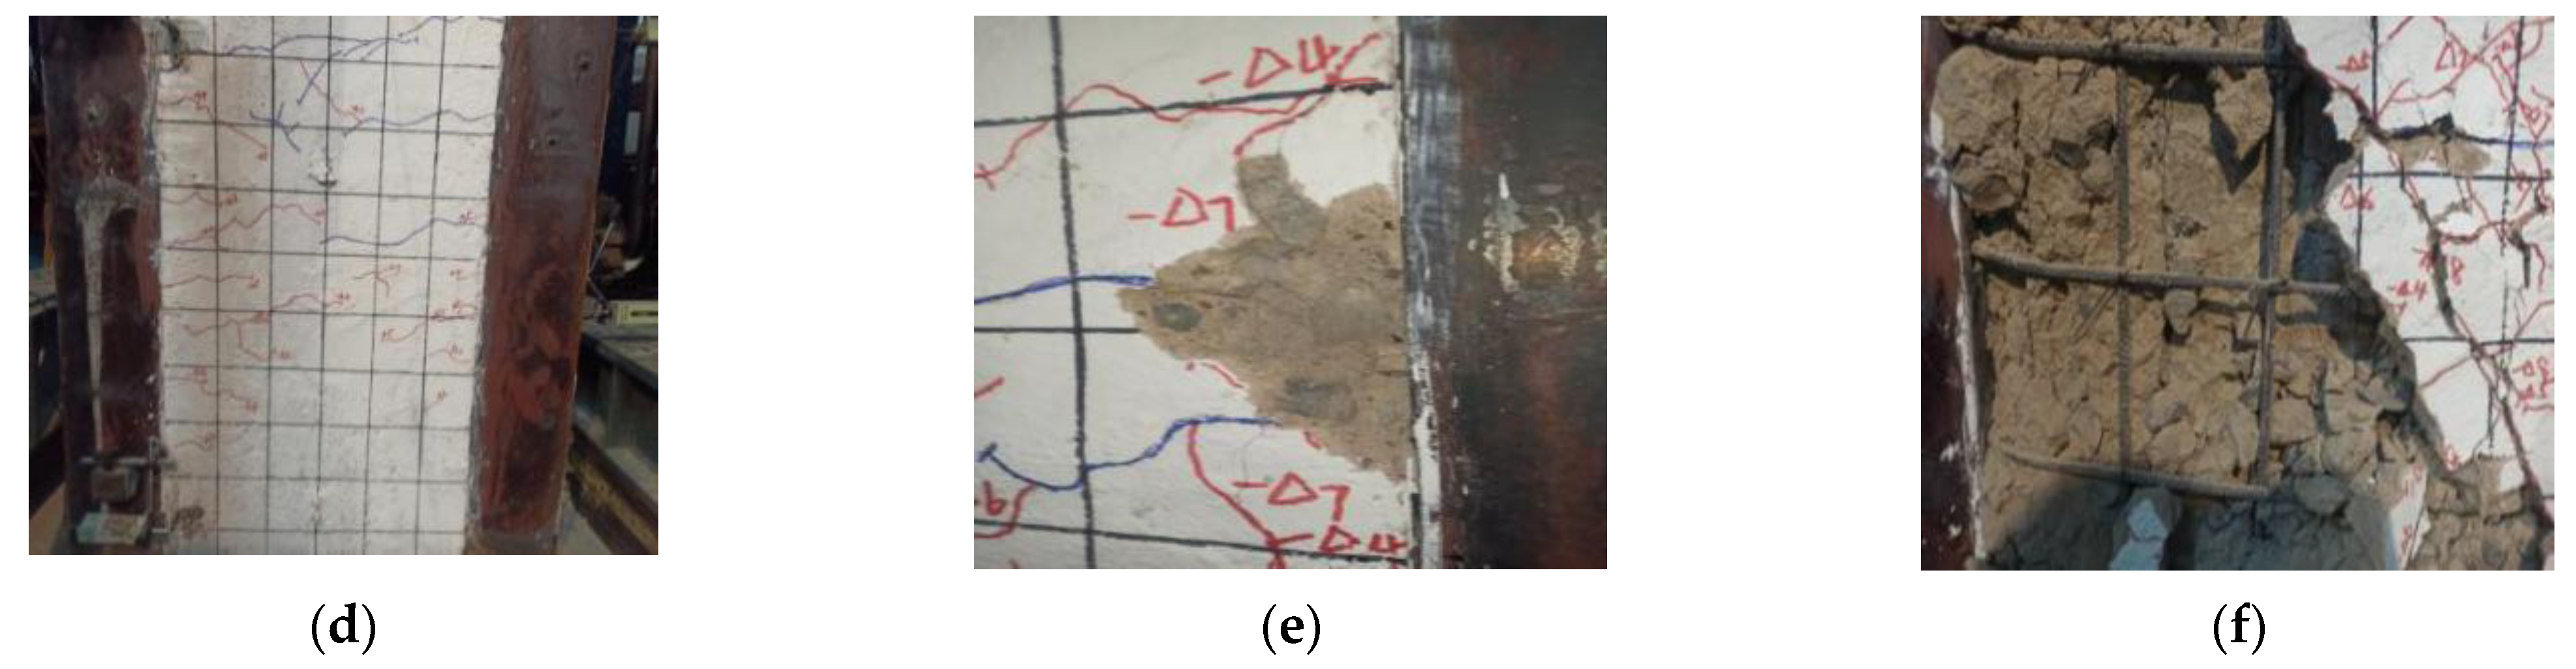
Figure 15.
Hysteretic curves of specimen. (a) SW1; (b) SW2; (c) SW3; (d) SW4.

Figure 16.
Envelope curves of specimen. (a) Fire exposure time; (b) Fire-retardant coating; (c) The width-thickness ratio.
Figure 16.
Envelope curves of specimen. (a) Fire exposure time; (b) Fire-retardant coating; (c) The width-thickness ratio.
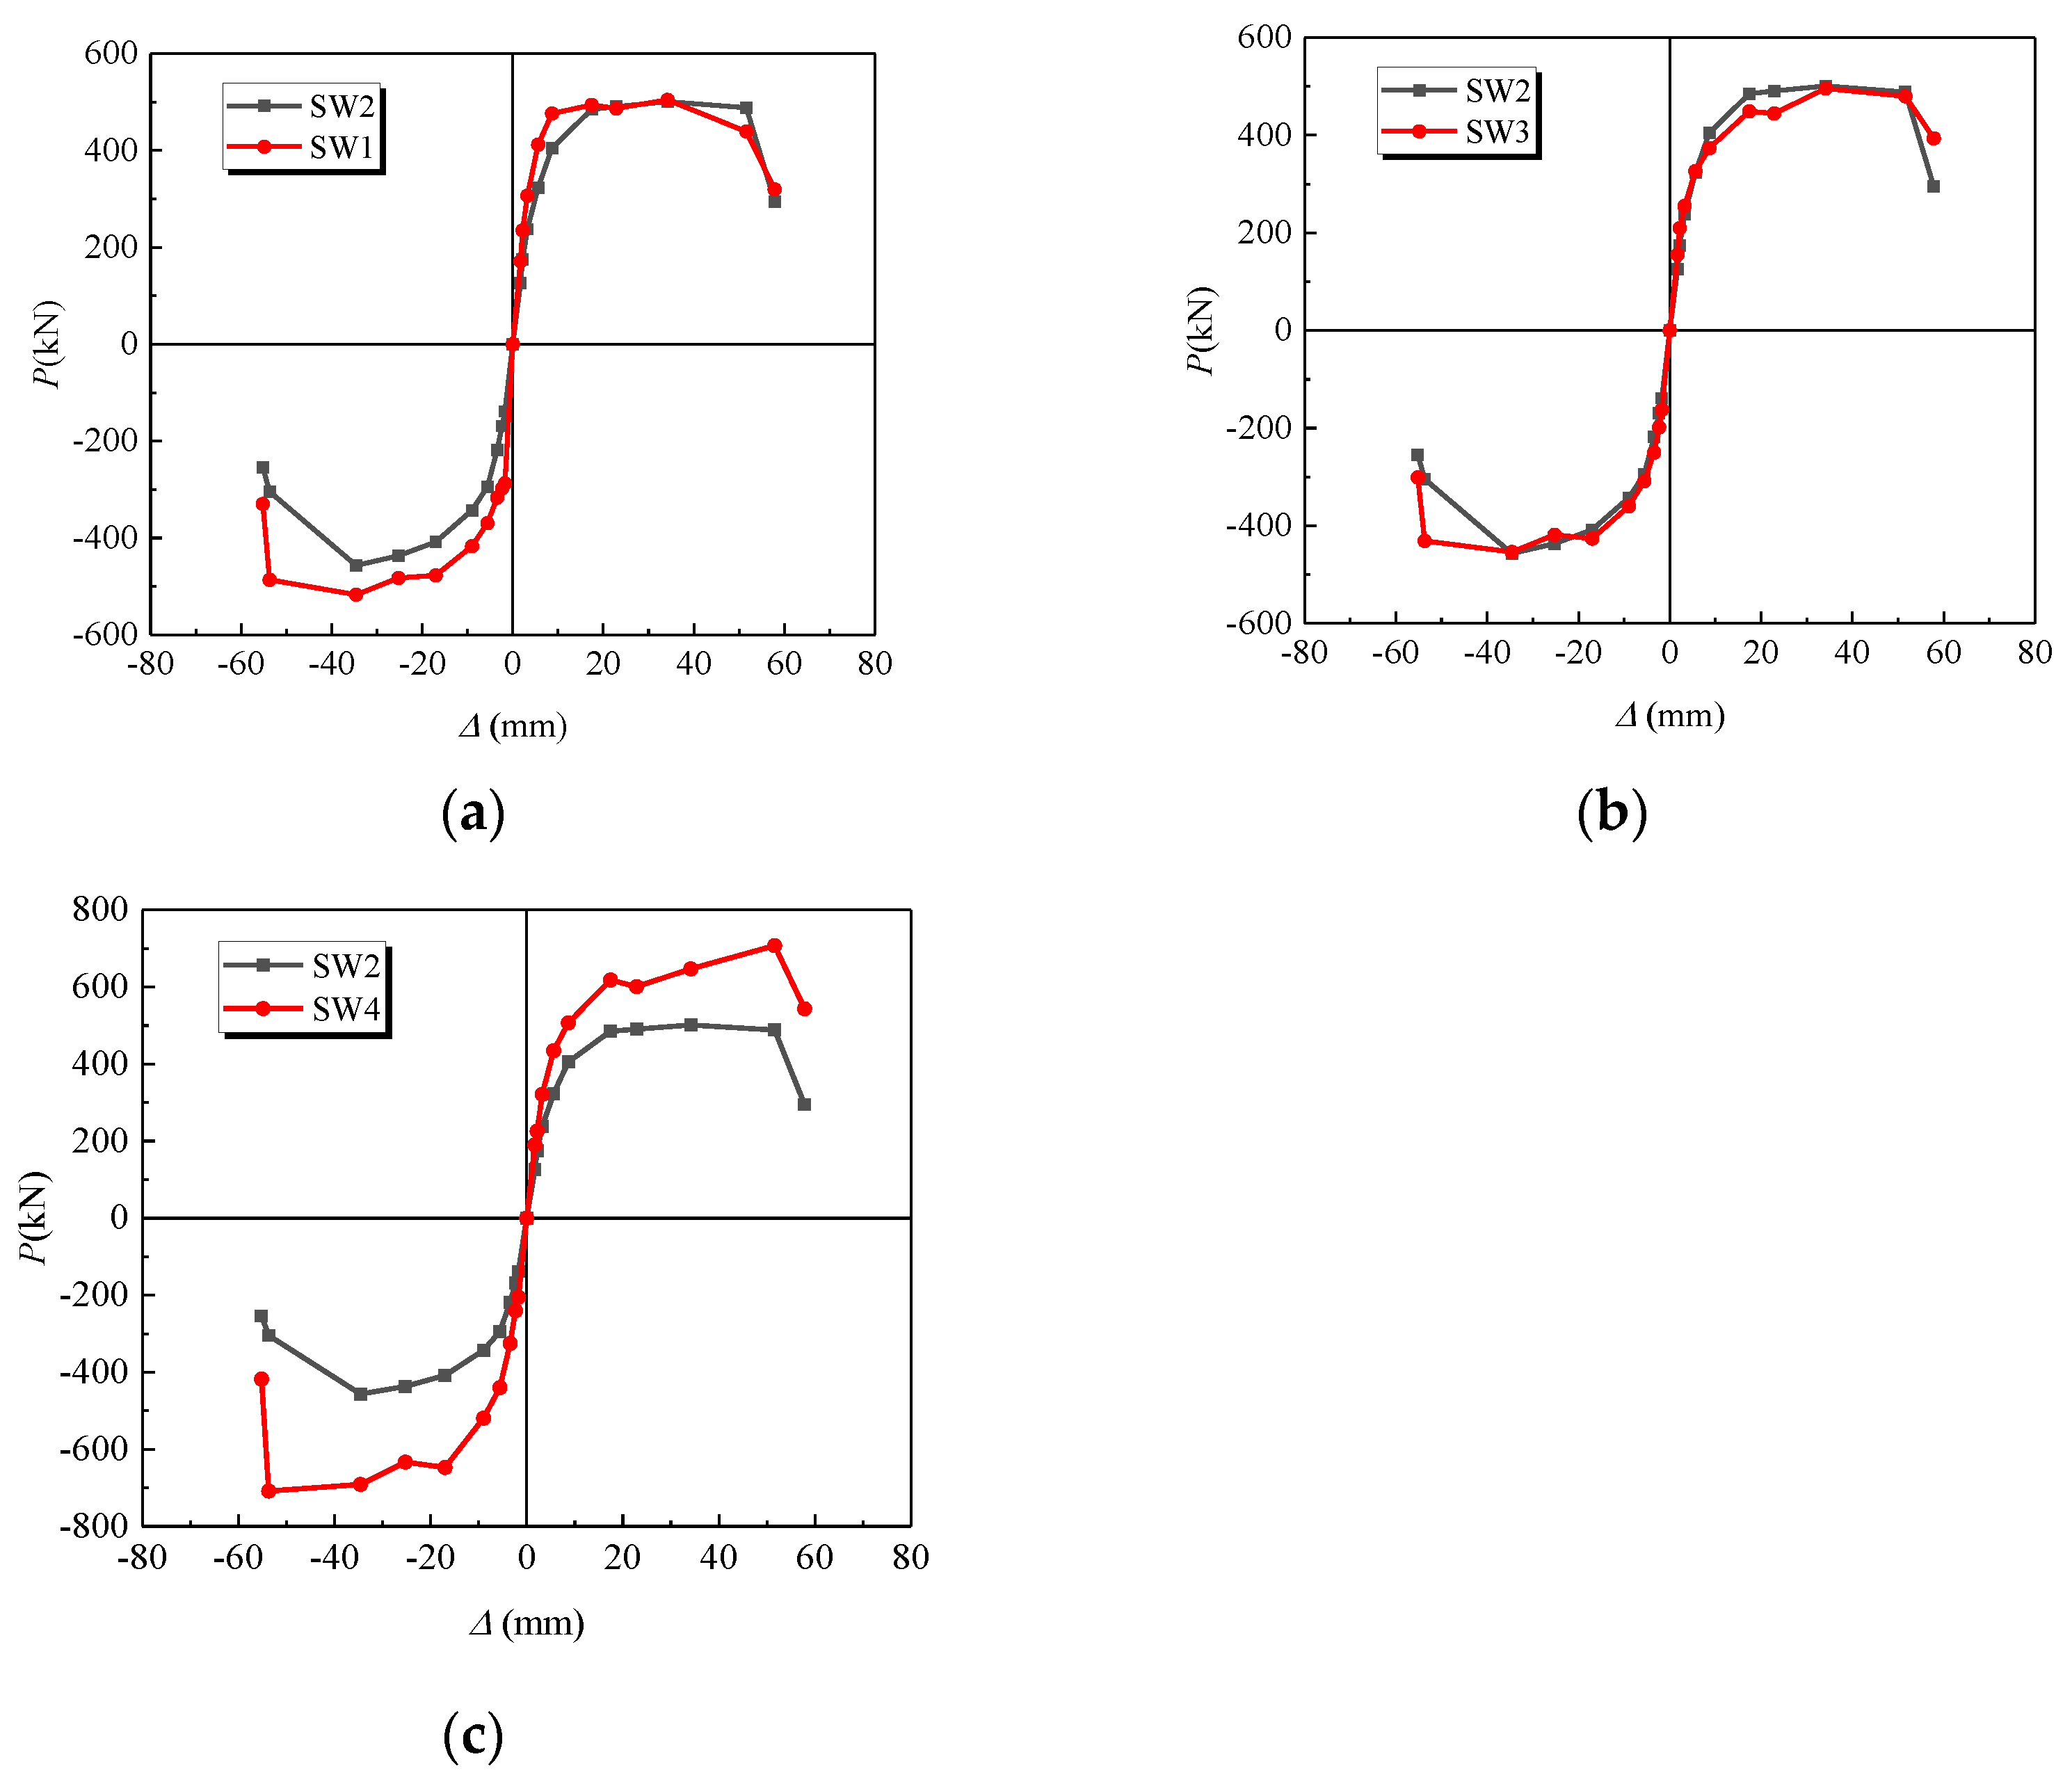
Figure 17.
Change of energy dissipation capacity with displacement amplitude. (a) Fire exposure time; (b) Fire-retardant coating; (c) The width-thickness ratio.
Figure 17.
Change of energy dissipation capacity with displacement amplitude. (a) Fire exposure time; (b) Fire-retardant coating; (c) The width-thickness ratio.
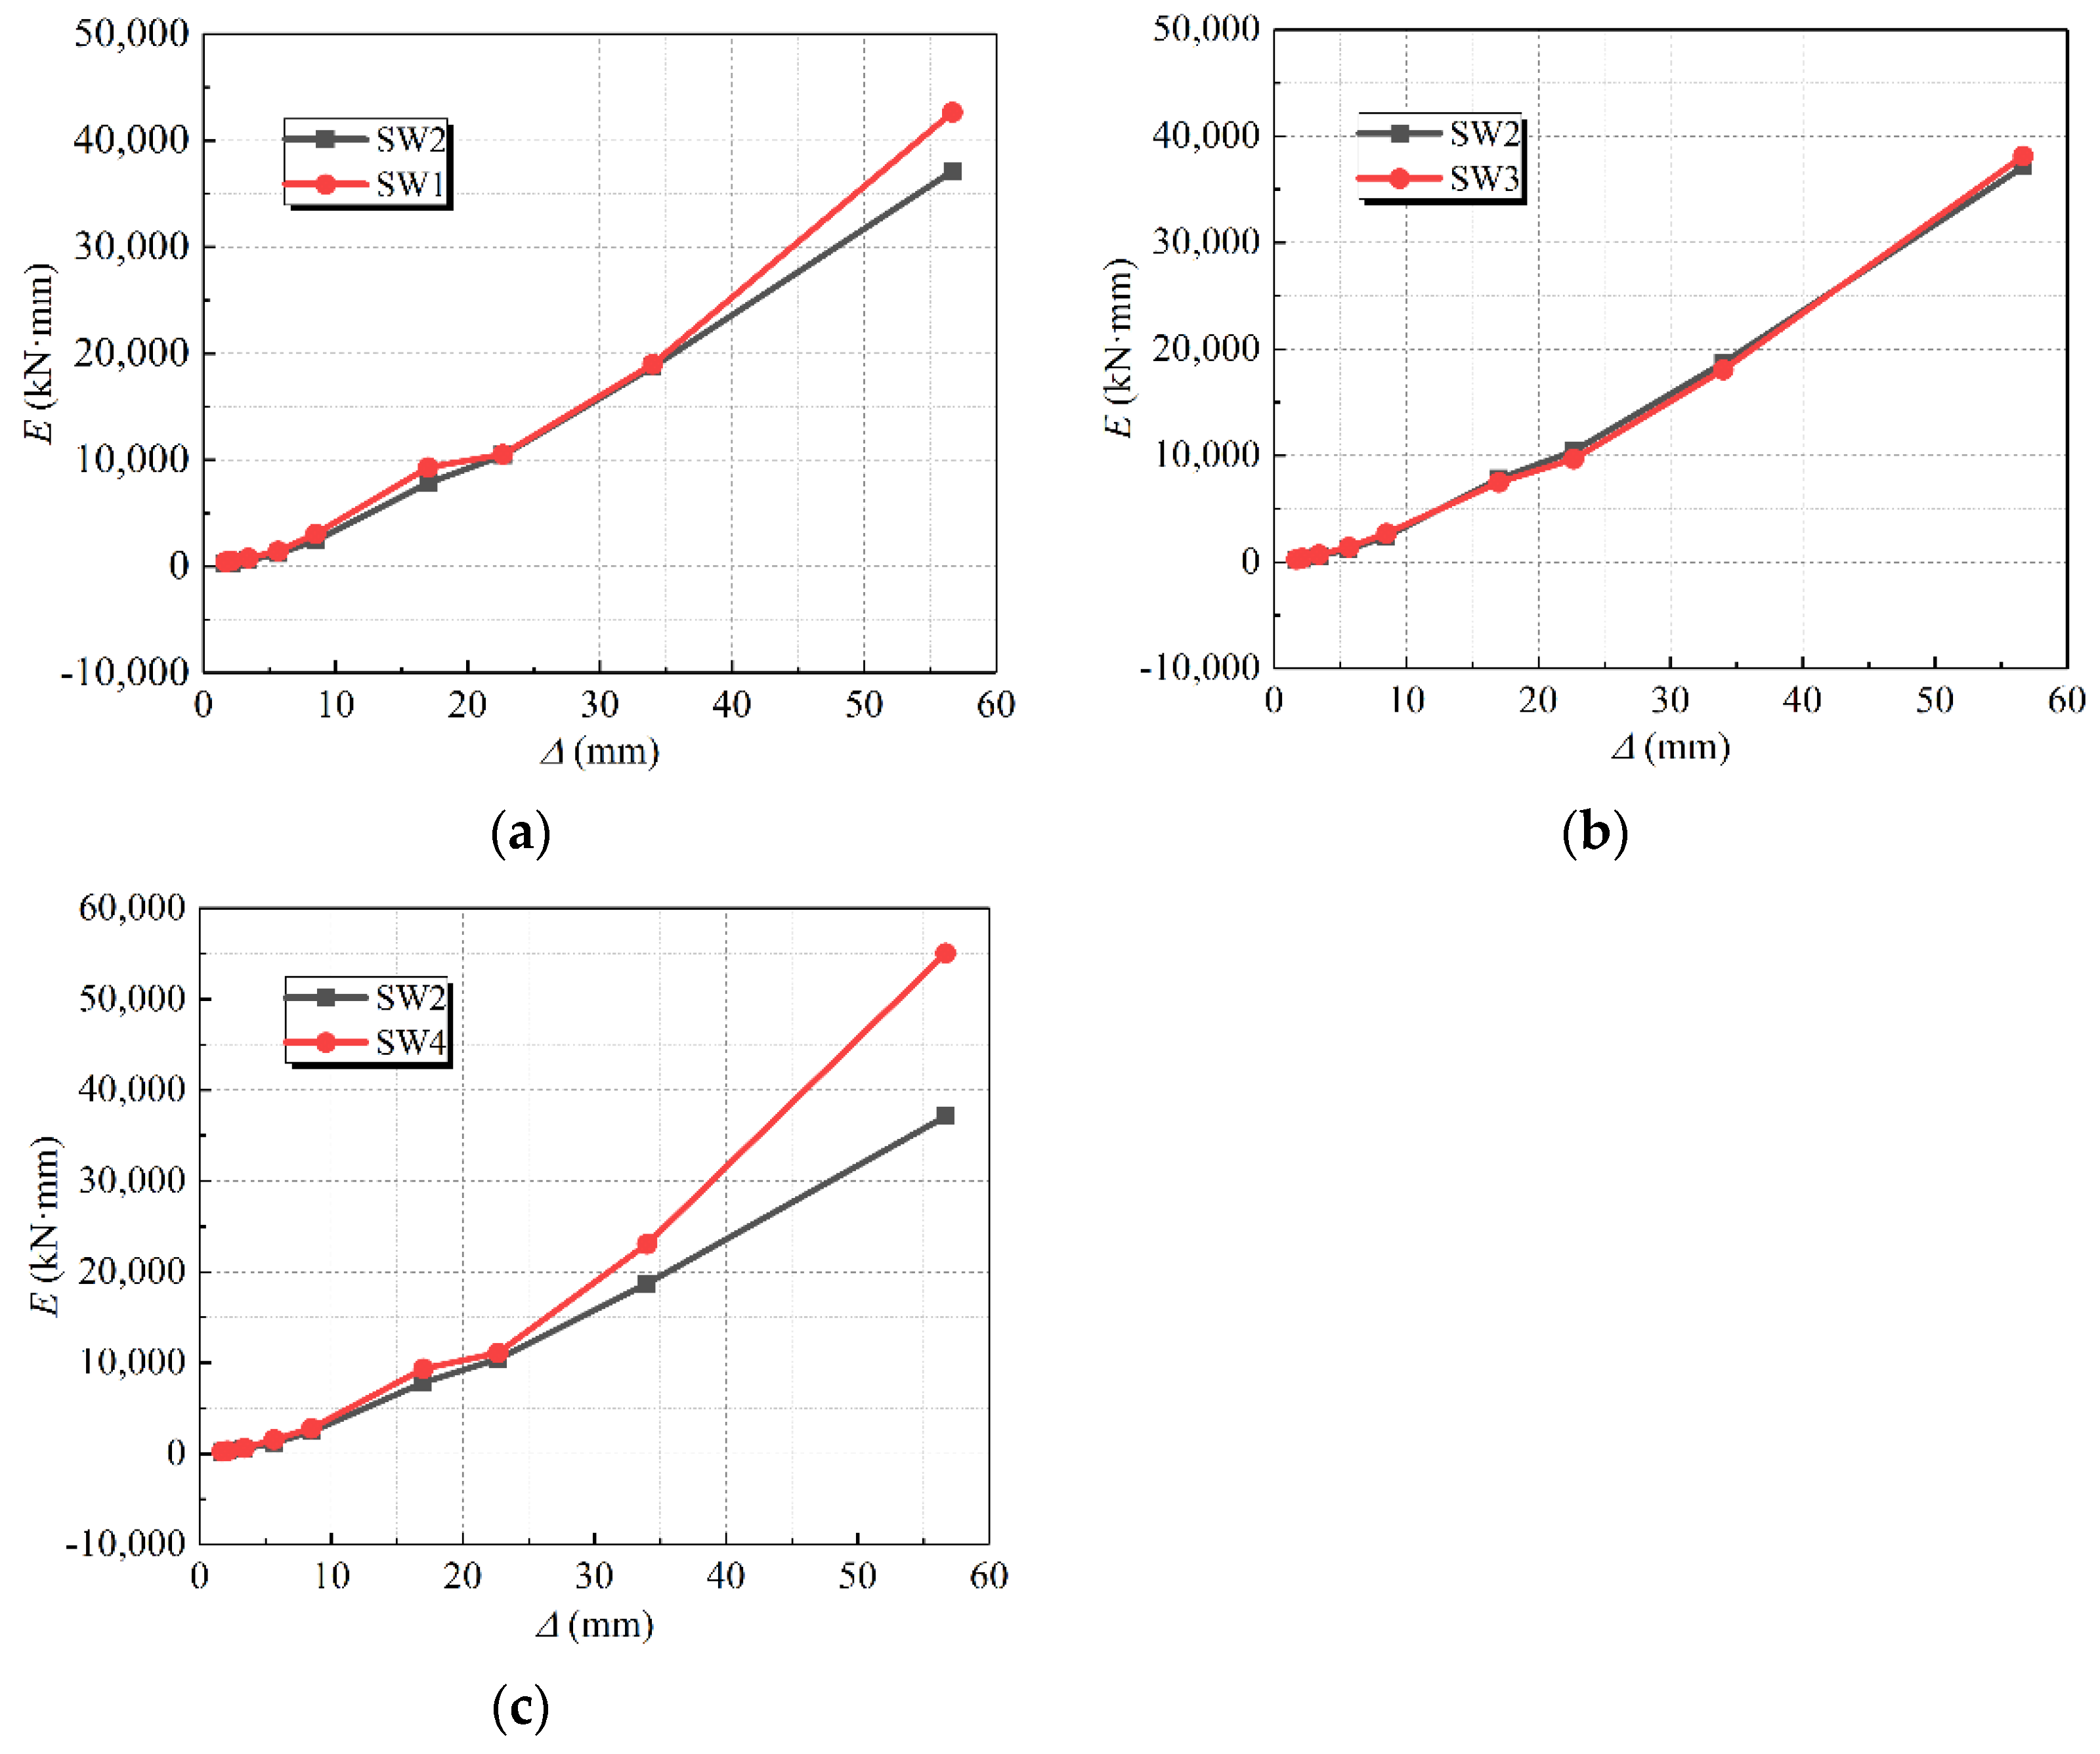
Figure 18.
Stiffness degradation curves. (a) Fire exposure time; (b) Fire-retardant coating; (c) The width-thickness ratio.
Figure 18.
Stiffness degradation curves. (a) Fire exposure time; (b) Fire-retardant coating; (c) The width-thickness ratio.


Table 1.
Detailed parameters of specimens.
| Specimen Number | Replacement Rate of Abandoned Concrete (%) | Wall Limb Width (mm) | Wall Limb Thickness (mm) | Thickness of Fire-Retardant Coating for Steel Pipe (mm) | Fire Exposure Time (min) | Axial Compression Ration |
|---|---|---|---|---|---|---|
| SW1 | 20 | 1000 | 200 | 0 | 0 | 0.18 |
| SW2 | 20 | 1000 | 200 | 0 | 60 | 0.18 |
| SW3 | 20 | 1000 | 200 | 20 | 60 | 0.18 |
| SW4 | 20 | 1200 | 200 | 0 | 60 | 0.18 |
Table 2.
Strengths of steel plate and steel bars.
| Steel Type | Nominal Thickness (mm) | Measured Thickness (mm) | Yield Strength (MPa) | Ultimate Strength (MPa) |
|---|---|---|---|---|
| Q235B | 2 | 1.77 | 340.7 | 467.6 |
| HRB400 | 8 | 8 | 430.1 | 594.2 |
| HRB400 | 20 | 20 | 443.6 | 620.2 |
Table 3.
Loading value.
| Series | Displacement Angle | Displacement Values (mm) | Cycles | Series | Displacement Angle | Displacement Values (mm) | Cycles |
|---|---|---|---|---|---|---|---|
| Δ1 | 1/1000 | 1.70 | 1 time | Δ6 | 1/100 | 17.00 | 3 times |
| Δ2 | 1/800 | 2.12 | 1 time | Δ7 | 1/75 | 22.67 | 3 times |
| Δ3 | 1/500 | 3.40 | 3 times | Δ8 | 1/50 | 34.00 | 3 times |
| Δ4 | 1/300 | 5.67 | 3 times | Δ9 | 1/30 | 56.67 | 3 times |
| Δ5 | 1/200 | 8.50 | 3 times | Δ10 | 1/25 | 68 | 3 times |
Table 4.
Summary of test results.
| Specimen Number | ∆y (mm) | Py (kN) | ∆p (mm) | Pue (KN) | ∆u (mm) | Pul (kN) | μ | ξeq |
|---|---|---|---|---|---|---|---|---|
| SW1 | 8.09 | 422.68 | 33.62 | 510.93 | 50.14 | 434.29 | 6.198 | 0.184 |
| SW2 | 10.94 | 386.36 | 34.39 | 478.99 | 48.51 | 407.14 | 4.434 | 0.182 |
| SW3 | 10.98 | 379.14 | 33.99 | 474.87 | 55.31 | 403.64 | 5.037 | 0.181 |
| SW4 | 14.26 | 588.08 | 50.675 | 707.76 | 54.08 | 601.60 | 3.792 | 0.245 |
Publisher’s Note: MDPI stays neutral with regard to jurisdictional claims in published maps and institutional affiliations. |
© 2022 by the authors. Licensee MDPI, Basel, Switzerland. This article is an open access article distributed under the terms and conditions of the Creative Commons Attribution (CC BY) license (https://creativecommons.org/licenses/by/4.0/).
Share and Cite
MDPI and ACS Style
Xiong, Y.; Chen, A.; Wu, D.; Zhao, G. Seismic Performance of Composite Shear Walls Filled with Demolished Concrete Lumps and Self-Compacting Concrete after Fire. Buildings 2022, 12, 1308. https://doi.org/10.3390/buildings12091308
AMA Style
Xiong Y, Chen A, Wu D, Zhao G. Seismic Performance of Composite Shear Walls Filled with Demolished Concrete Lumps and Self-Compacting Concrete after Fire. Buildings. 2022; 12(9):1308. https://doi.org/10.3390/buildings12091308
Chicago/Turabian StyleXiong, Yan, Aodong Chen, Di Wu, and Guowei Zhao. 2022. "Seismic Performance of Composite Shear Walls Filled with Demolished Concrete Lumps and Self-Compacting Concrete after Fire" Buildings 12, no. 9: 1308. https://doi.org/10.3390/buildings12091308
Note that from the first issue of 2016, this journal uses article numbers instead of page numbers. See further details here.