
External Sulphate Attack on Alkali-Activated Slag and Slag/Fly Ash Concrete


School of Natural and Built Environment, Queen’s University Belfast, Belfast BT9 5AG, UK
*
Author to whom correspondence should be addressed.
Buildings 2022, 12(2), 94; https://doi.org/10.3390/buildings12020094
Submission received: 14 December 2021
/
Revised: 14 January 2022
/
Accepted: 17 January 2022
/
Published: 20 January 2022
(This article belongs to the Special Issue Properties and Performance of Alkali Activated Concretes)
Abstract
:Two types of alkali-activated material (AAM) concretes were exposed to various sulphate bearing-solutions for over two years. Physical changes to the concrete specimen and chemical changes in the exposure liquid were studied in an attempt to understand how sulphate attack occurs in such binders and the role the mix variables play in offering resistance against such attack. The mix variables of alkali-activated slag concrete (AASC) included water-to-binder ratio, percentage of alkali, and the SiO2/Na2O ratio (silica modulus, Ms); for alkali-activated slag/fly ash (AA-S/F) concrete, the mix variables included slag/fly ash ratio and the SiO2/Na2O ratio. The exposure solutions included water, magnesium sulphate (5%), sodium sulphate (5%), calcium sulphate (0.2%), and two concentrations of sulphuric acid solutions, pH 3 and pH 1. The physical changes studied were length and mass change, visual appearance, and change in compressive strength. The exposure liquids were analysed for change in pH and ionic composition. Findings show that the AA-S/F blend performs better than AASC in sulphate environments, based on strength and change in length. Exposure to water resulted in the most expansion/shrinkage in all mixes studied. An empirical model was proposed for predicting the change in compressive strength for AAS&AA-S/F concretes based on mass gain. Further, a simple performance criterion was put forward for mixes in sulphate environments based on mass gain.
1. Introduction
Carbon dioxide (CO2) emissions and energy consumption due to Portland cement (PC) production accounts, respectively, for at least 5–8% of the world’s total CO2 emissions [1] and 10% of the world’s energy [2]. The second most consumed material on earth after water is concrete; currently, in excess of 10 billion tons per year are produced [2]. These factors have led, in recent years, to renewed research into alternative binder systems. Alkali-activated materials (AAM) concrete is produced by combining a precursor with a high alumina silicate content, such as ground granulated blast-furnace slag (GGBS) and pulverised fuel ash (PFA), with water and an activator. The drive has been to develop binder systems for exposure environments where Portland cement-based systems are not the best for achieving long term performance viz., acidic and sulphate-rich environments, biogenic environments, and fire protection systems.
Sulphate attack is a complex mechanism that is yet to be fully understood due to the many overlapping reactions taking place [3]. It is known that PC-based concretes do not perform well in high-sulphate environments. Thus, there is potential for finding a better alternative. Shi et al. state that in GGBS-based AAMs, an alternative to PC-based concrete, the reduction in alkali content increases the resistance to MgSO4 solutions [4]. They also state that an increase in the water-to-slag ratio decreased the ability of AAM to resist sulphate attack. Komljenovic’ et al. reported that AASC showed significantly higher resistance to sulphate attack than the benchmark Portland composite cement (CEM II) and this resistance can be explained by the absence of portlandite and the unavailability of aluminium, present in calcium silicate hydrate (C–S–H(I)) and hydrotalcite gels, for reaction with sulphates [5]. Huseien et al. reported that AAMs containing 50% palm oil fuel ash (POFA) immersed in 10% sulphate solutions showed better performance than those without POFA [6]. Kwasny et al. studied the resistance of AAM mortars based on low-purity kaolin against chemical attacks, i.e., sodium and magnesium sulphate solutions and sulphuric and hydrochloric acid solutions, and reported that they show superior performance against sulphate attack compared to Portland cement mortars (PCMs) [7]. Džunuzović et al. explored the correlation between alkali-activated binder microstructural and changes in strength for alkali-activated slag/fly ash exposed to 5% Na2SO4 [8]. Aiken et al. investigated the effect of slag content and activator dosage on the sulphuric acid resistance of fly ash-based alkali-activated binders [9]. Gu et al. evaluated the test methodologies on the degradation rate and microstructural performance of alkali-activated concretes subjected to sulphuric acid attack [10]. Aliques Granero et al. recently reported that dimension and mass changes were not suitable to assess the degree of sulphate attack for AAMs since there were minor differences for different AAMs. They state that the compressive strength loss and confirming the stability of the binder through the microstructural characterisation of samples after sulphate exposure was more reliable [11].
While AAM has shown superior durability over PC concretes based on laboratory testing [1,4,11], there are still gaps in the understanding of how different AAMs perform when exposed to higher concentrations of sulphate salts. Provis and van Deventer and Arbi et al. all agree that further research is required into the durability of AAMs before they become commercially viable and can be adopted for use in the construction industry on a wider scale [1,2]. This article will study how different AAM mixes behave when exposed to various sulphate solutions and investigate the ability of PFA and GGBS-based alkali-activated materials to resist sulphate attack as part of a wider study into the durability of AAMs. Further, the article will revisit the compressive strength vs. mass change relationship to develop an empirical equation for predicting strength change due to sulphate exposure.
2. Materials and Methods
2.1. Materials
The granulated blast furnace slag (GGBS) and low-CaO PFA used in this study as a part of a wider study were provided by ECOCEM—Ireland and Power Minerals Ltd., Sutton Coldfield, UK, respectively, and were the same powder materials as used in the previous study. The chemical and physical properties are presented in Table 1 [12]. The particle size distribution, density, and water absorption of GGBS and PFA were determined by using laser diffraction, a Le Chatelier flask, and the centrifugal consolidation method, respectively. The aggregates used in this study were crushed basalt from local sources in Northern Ireland and comprised 16.5 mm and 10 mm crushed coarsely. Fine aggregate was 4 mm sand. These were combined in a ratio of 48:12:40 according to the procedure outlined in Bondar et al. [13]. The bulk specific gravity and water absorption of the aggregates were measured based on BS EN 1097-1 [14] and were 2.66 and 1.92%, respectively. Drinking quality water was used to make the concrete mixtures. The sodium hydroxide solution was prepared by dissolving sodium hydroxide (NaOH) powder (99% purity) in water. The sodium silicate solution contained 30.5% SiO2, 15.5% Na2O, and 54% water. Four mixes comprised Group 1: two based on GGBS and two based on a blend of GGBS and PFA. These concretes were exposed to the relevant exposure solutions after 28 days of seal curing. The GGBS/PFA ratio, the percentage of Na2O (%), the silicate modulus (molar ratio SiO2/Na2O), water, and aggregate content for these mixes and their initial properties are shown in Table 2. Eight further AAS concretes were studied in Group 2, with different w/b ratios, binder-to-aggregate ratios, alkali concentrations, and Ms values. The details of these mixes and their initial properties are also presented in Table 2. These mixes were exposed to different solutions one year after the casting date to be sure that there was no drying shrinkage in the samples.
2.2. Mixing, Casting, Curing, and Sample Preparation
All ingredients for each mix were mixed in a laboratory pan-mixer. From each concrete mix of Group 1, sixteen 100 mm concrete cubes and five 75 × 75 × 285 mm concrete prisms and from each concrete mix of Group 2, two 150 mm concrete cubes and four 100 × 200 mm cylinders were cast. Cubes were used for the determination of changes in compressive strength and mass. Prisms and cylinders were used for expansion measurement. After casting, all the specimens still in the mould were covered with plastic sheets and left in the casting room for 24 h After the specimens were demoulded, group 1 samples were kept in a sealed plastic zip bag for 28 days after casting and group 2 samples were kept for one year. The 150 mm concrete cubes of Group 2 mixes were cut into eight 70 mm concrete cubes. Epoxy resin was applied onto the saw-cut faces of the specimens in three layers to prevent initial sorption or capillary forces on these faces during the exposure to water and chemical solutions. The samples from both groups were placed in a humidity- and temperature-controlled chamber (20 °C and 100% RH) for 24 h for conditioning. This was to achieve sufficient moisture to prevent the dominant capillary forces from controlling the initial uptake of moisture during exposure. Samples were placed in an airtight plastic storage container filled with Na2SO4 (5%), MgSO4 (5%), CaSO4 (0.2%), or two concentrations of sulphuric acid solutions, pH 3 and pH 1. The proportion of the volume of sulphate solution to the sample volume in each storage container was maintained at approximately 4.0. Throughout the immersion period, the pH of the exposure solutions was measured. After the first 88 days of exposure and after ensuring that the pH remained constant, the chemical solutions were changed. The pH of the sulphate solutions was monitored and roughly 10 days after the solutions were changed, the pH values were comparable but lower than the pre-change levels. With this in mind, no further replacement of solutions was carried out.
All specimens from Group 1 were kept together in a box, and all specimens from Group 2 were contained in another box. Ionic characterisations of the exposure solutions were carried out at four intervals. Liquid samples from each box were taken and the ionic make-up was determined using inductively coupled plasma-atomic emission spectroscopy (ICP-AES). As the difference in concentration was negligible, the average of the two values is reported here. In this way, the results are representative of all the mixes. The ionic characterisation was conducted to gain an understanding of the various ions that leach out of the samples onto the exposure solution (outflow) and vice versa (inflow).
3. Results and Discussions
3.1. Analysis of Solutions
3.1.1. pH of Solutions
For each time point, the pH of two samples from Group 1 and Group 2 specimens containing AASC and AAS/F blends was measured and the average was taken. For each solution, 12 tests (in total, 72 tests for 6 solutions including water, salt sulphates, and sulphuric acid with different pHs), were performed over 400 days and the results are presented in Figure 1.
- ▪
- Water and salt solutions:
The initial pH of the water, Na2SO4, MgSO4, and CaSO4 solutions used in this study was 7, 7.92, 7.82, and 8.72, respectively (Figure 1). During the investigation, due to the leaching of ions from (and to) the exposed concrete specimens, the pH value of the solution increased and approximately reached a constant value for each exposure solution. The pH values were 12.4 after 24 days for water, 12.04 after 43 days for Na2SO4, 9.13 after 4 days for MgSO4, and 12.19 after 30 days for CaSO4. An increase in pH value of the solutions was reported by Džunuzović et al. [8] for Na2SO4 solution and was said to occur primarily as a consequence of the diffusion of OH− ions from the pore solution of the investigated material onto Na2SO4 solution. It is apparent that the same phenomenon is happening for water and other sulphate solutions; however, because of the different pH values, the amount of diffusion of OH− ions may be different. The results show that the peak value of pH for MgSO4 solution was the lowest (9.13). However, this value is reached rapidly, possibly due to the highest intensity of Na leaching caused by this solution (Figure 1). Therefore, it seems that the concentration of various ions in the exposure solution can influence the rate and intensity of leaching.
- ▪
- Sulphuric acid solutions:
For a solution with a starting pH of 3, the pH value increased to 9.87 after just 3 days. For a pH of 1, one month was required for the pH value to change from 1 to 3. The difference in pH between the acid solution and concrete samples, which are alkaline, causes the transfer of mobile ions, such as Na+, K+ and Ca2+ and OH−, from the sample to the solution. Similarly, there will be an exchange of H+, H3O+, and SO42− ions from the solution to the sample.
As can be observed from this section, among the ionic environments, sulphuric acid pH 1 and MgSO4 solutions, respectively, recorded the lowest values of pH in the exposure solution, consistently. In the comparison of the Mg, Na, and Ca sulphate exposure solutions, Mg salts resulted in consistently low pH values. The pH values increased after the solutions were changed at 88 days. It took longer to peak and the peak values were lower than that in the first cycle. It is to be expected because the change in pH is caused by the leaching of ions from the concrete specimen and there is only a limited quantity of mobile ions in each specimen. This will be further explored in the next section, which considers the ionic characterisation of the solutions before and during exposure.
3.1.2. Ionic Characterisation of the Exposure Solutions
The main ions in the initial solutions before exposure are Na+ and S4+ in Na2SO4 solution, Mg2+ and S4+ in MgSO4 solution, Ca2+ and S4+ in CaSO4 solution, and S2+ in the sulphuric acid solution. The results of the inductively coupled plasma (ICP) analysis of the solutions are presented in Figure 2. The leaching rate of ions decreased over time due to the depletion of ion sources present in the concrete. The replacement of the exposure solution kick-started the leaching process, but the peak values were lower than the pre-replacement levels.
- ▪
- Water:
As shown in Figure 2a, the concentration of Na, S, and Si increased as exposure progressed. The source for sodium and silicon is highly likely to be the unreacted sodium hydroxide and sodium silicate activator used in the mix. Sulphur is from the sources that exist in the slag. The concentrations of aluminium, calcium, potassium, and magnesium were nominal, at 14, 31, 40, and 4 ppm (@ 92 days), respectively. The concentration of all the ions decreased with the time of leaching, except for sulphur.
- ▪
- Na2SO4 solution:
Figure 2b shows that other than the obvious Na and S ions (from the sodium sulphate), the concentrations of Ca and K were higher than the reference water exposure (Figure 2a). The increase in concentrations for these ions indicates the diffusion (leaching) of these elements from the material into solutions. Once the concrete leaching into the solution, there is a possibility of ion being involved. This is the main factor that should be concerned and confirmed to study the effect of chemical attacks on concrete properties. Si concentration is comparable to that of water exposure and it reached 152.5 ppm (at 88 days). This was probably the result of the leaching of unreacted sodium silicate present in the pore solution. Silicon leaching from silicon-rich components of binder gel structure might also be involved, but this cannot be confirmed. Na concentration increased by 558.5 ppm in the first 88 days and after replacement, the concentration rose substantially by 1531 ppm (from 5510 to 7041 ppm). This would suggest a three-fold increase in the transfer of Na from the concrete specimen onto the solution due to the replacement of the exposure solution. As exposure progressed to 400 days, the total concentration reduced to 4419 ppm, suggesting that there was a reverse transfer. A similar trend of reduction in concentration vs time was observed for S and Ca, although for Ca the change was marginal in comparison.
- ▪
- MgSO4 solution:
Figure 2c shows that other than Mg and S, the major contributors to the ionic movement were Na and Ca, with a respective concentrations of 973 ppm and 528 ppm after 88 days. Unlike the previous exposure solutions, Si concentration was negligible throughout (<11 ppm). The S concentration increased from 7628 ppm to 9306 ppm in the first 88 days. However, after the replacement of the solution, the concentration decreased by a similar amount. As there are two sources of S, sulphur from GGBS and sulphate in the exposure solution, it was not possible to explain this trend. The Mg concentration decreased from a value of 7073 ppm to 6346 ppm in the first 88 days. Once the solution was replenished, the concentration changed from 7006 to 7884 ppm initially and then reduced to 6083 ppm over 400 days. It seems there is subsequent or concurrent inflow outflow of Mg that occurs to and from the sample. The increase in the concentration of Na in the exposure solution suggests that Na from the gel structure could be dissipating. Similarly, there is a potential that Ca is appearing from the decalcification of the Ca-rich gel phases. Both of these, if confirmed, indicate a weakening of the microstructure and are supported by SEM images of the decalcification phenomena of AAM concrete in the investigation of Chindaprasirta et al. [16].
- ▪
- CaSO4 solution:
First, it should be noted in Figure 2d is that the Y-axis is on a different scale; it stops at 1000 ppm. This is due to the concentration of the calcium sulphate used in this study, 0.2%. There was a substantial increase in the concentration of Na during the whole period of exposure, with a maximum of 602 ppm. The Si concentration in the first 88 days reached a maximum of 140 ppm. No reduction in sulphate at the end of the exposure period was observed, showing there was no transfer of SO42− from the solution to the samples to form extra sulphate salts (Figure 2d). Therefore, external calcium sulphate solution can mostly deteriorate AAM concretes by the leachate of alkali and its consequent shrinkage.
In all sulphate salt solutions, ion exchange takes place, resulting in the transfer of Na+ and K+ from the samples to the solutions. The extent of this exchange is unique for each exposure solution. The replacement of the exposure solution had a significant effect on the quantity and direction of ion exchange. Except in the case of CaSO4 solution, S ions ingress from the solutions onto the concrete specimen. This can cause the formation of new sulphate salts, which can induce microcracks in the pore structure. In contrast, in calcium sulphate solution, there is a visible transfer of Ca ions from the exposure liquid to the sample, which could form new compounds, such as CASH gels, and further strengthen the matrix. Although the existence of CASH gels is more clearly shown by FTIR/XRD analysis, the increase in the strength of the exposed specimens may also provide evidence. This will be discussed further in Section 3.3 when changes to the compressive strength are presented.
- ▪
- Sulphuric acid (H2SO4):
Sulphuric acid is reported to lead to strong decalcification of the hardened cement paste in PC-based concrete, and then the removal of Al3+ and Fe3+ at lower pH [17,18]. In this process, new compounds are precipitated and, depending on their solubility in water, may be released or remain in the pore structure [18]. In this investigation of the diffusion of Na+, Mg2+, Ca2+ and Al3+ were observed in sulphuric acid solution with a pH of 1 during the whole period of immersion. The leaching of Si was observed for the first 180 days and then slowed after that (Figure 2e), which agreed with the results reported for PC-based concrete and geopolymer binders [9,17,18]. As sodium hydroxide and sodium silicate solutions were used as alkaline activators, these mixes have a large initial sodium content that can leach into sulphuric acid exposure. The large quantities of magnesium and calcium released into the sulphuric acid solution are due to the sources that exist in slag. The leaching of aluminium is greater in sulphuric acid exposure compared with exposure to water and other sulphate salt solutions. Sulphuric acid exposure causes preferential leaching of the elements Ca, Mg, and Na over the first 56 days. After 156 days, Al was the most washed-out element and in the whole period of exposure all these elements leached more than silicon (Figure 2e). This phenomenon helps to protect tetrahedral silicate and aluminium-free silica gel [19]. This may be the reason why AAM performs better against sulphuric acid attacks.
3.2. Fresh Properties and Compressive Strength
The slump value and compressive strength were measured according to Part 2 of BS EN 12350 (2009) and BS EN 12390-3 (2009), with two replicate samples tested per age [20,21]. The results are reported in Table 2. All mixes had a slump value of greater than 135 mm. After 28 days, Blend mix 1 was the strongest with, a compressive strength of 74.9 MPa; the other mixes had strengths ranging from 26.4–64.4 MPa. Except mixes 1 to 3 of Group 2, all other mixes achieved a strength of more than 40 MPa. The high water-to-binder ratio and low activator content resulted in the former having low strength [15,22]. The results also indicate that the microstructure forms rather quickly in AAC, thereby helping them to reach their maximum strengths faster than low-strength PC-based concretes made of CEMIIB, CEMIII, and CEMIV. However, this may not necessarily mean that these mixes had a very refined pore structure in the early days.
3.3. Strength Changes
Compressive strength results for mixes from Groups 1 and 2 are presented in Figure 3. The test age was 485 days for group 1 and 820 days for Group 2. The results include the reference specimens kept in a sealed condition (dry) and those specimens exposed to the salt (or water) exposure. It is worth noting that the Group 1 mixes were exposed to salt (and water) solution at an age of 28 days. Therefore, the continued polymerisation will affect the results. Group 2 mixes, on the other hand, were exposed only after a year, so the hydration effects, if any, will be negligible. As expected, the results showed that all four Group 1 mixes gained strength in water in comparison to the dry reference. The specimens kept in sodium and calcium sulphate solutions also gained strength in a similar manner and scale to those kept in water. As explained before, this is highly likely to be due to the continued polymerisation of the mixes. Salt water is known to have much less cohesion than plain water and this can enhance the infiltration of water into unreacted binder material, resulting in greater polymerisation [23].
Specimen exposed to magnesium sulphate show a mixed trend. For GGBS 1 and GGBS 2, exposure to the magnesium sulphate solution reduces the strength. For Blends 1 and 2, the strength is greater than that of the dry reference. As observed from the ICP analysis (Figure 2), the leaching of Ca in the magnesium sulphate solution points to the erosion of gel structure, therefore affecting the strength results. This will be more prevalent in GGBS mixes as they are mostly Ca-based. Blends have a higher proportion of PFA (which is low in calcium); therefore, the structure will be made of both NASH and CASH gels. From the leaching results in Figure 2c, the predominant ions leaching out in magnesium sulphate solution are Na and Ca, whilst only nominal quantities of Si ions are released. The source of these ions may be calcium hydroxides and Na from the excess activator (sodium silicate + sodium hydroxide), instead of the CASH/NASH gels. This may explain why the blends perform relatively better in the magnesium sulphate solution. Nevertheless, the increase in strength is only nominal and prolonged exposure would likely lead to leaching of the ions from the gels and therefore reduce the strength.
From considering the samples of Group 1 immersed in sulphate solutions, it is shown that all samples performed best in the 0.2% CaSO4 solution, which showed the largest increase in strength.
In the case of sulphuric acid exposure, GGBS 1 and Blend 1 performs poorly, whereas the other two show a marginal increase in strength regarding the air-cured specimen. The leaching results in Figure 2e show that Na, Al, Mg, and Ca are the major ions involved, followed by Si, but at a much lower concentration. The RILEM report highlights that preferential leaching of other ions before Si protect the tetrahedral silicate and aluminium-free silica gel [1]. Blend 2 had a larger reserve of Na due to low Si modulus and high NaO%. Therefore, the preferential leaching of all other ions before Si, evident in Figure 2e, explains why Blend 2 performs better in acid exposure. GGBS 2 has a higher Si modulus compared to GGBS 1; this may explain why the former performed better in comparison.
Blend 1 samples appeared to perform better than others based on the strength gain in salt sulphate solutions and Blend 2 in sulphuric acid solution (Figure 3). This may be because there was more silicon oxide in Blend 1 samples, which absorbs cations, especially Na+ from salt solutions, to create a stronger gel, while the alkalinity is greater in Blend 2, which delays the loss of alkalinity and strength as a consequence in sulphuric acid solution.
There was no obvious hydration effect visible in the results from the Group 2 mixes, as shown in Figure 3. Air-cured specimens had the maximum strength in most cases, except Mix 1, 6, and 8. For Mixes 1 and 6, specimens exposed to water have better strength, but within the margin of error (≤5 MPa), and therefore these variations are not significant. For Mix 8, specimens exposed to the water offered lower strength, but specimens exposed to some of the salt solutions offered equal or slightly higher strength than those that were air-cured. The reduction in strength for the specimen in sodium sulphate solution was roughly 10% lower than that reported by Bakharev et al. for AASC [17], whereas the strength loss for specimens in magnesium sulphate solution was only 7% lower than that reported by Allahvedi and Hashemi for AASC [18]. It can be postulated that the presence of water in the boundary of the specimen leads to the outwards leaching of ions. This leaching behaviour is exaggerated when the boundary is an ionic solution. As discussed before, leaching results in strength reduction, especially if the ions are emigrating from the gel structure. The resulting strength reduction indicates that the leaching increased in the following order: sodium sulphate, magnesium sulphate, sulphuric acid pH 1 and pH 3. Sulphuric acid leads to severe strength reduction because the action involves both acid-induced leaching and sulphate attack [19]. The progression of the acid attack front causes a loss of alkalinity coupled with an increase in porosity and permeability in PC-based concrete, thus leading to strength loss [24]. This was observed for AAM concretes made of 100% GGBS in this investigation as well. This can be confirmed by the high amount of cation depletion from the specimen, which can be inferred from Figure 2e.
3.4. Visual Appearance
The visual appearance of specimens after exposure to sodium sulphate, magnesium sulphate, and sulphuric acid solutions for 431 days is shown in Figure 4. The selected testing time is shown in Figure 1 to ensure that there was no more ion exchange between samples and solutions since the pH values were constant after 400 days, and even did not show more than 10% change in the past 100 days. Regardless of the type of solution, specimens of Blend 1 and 2 showed less surface deterioration than the GGBS counterparts. Decalcification of the Ca-rich gel phases from the GGBS specimen could have resulted in the change in appearance. The specimens exposed to sulphate salt solutions mostly had white precipitation on the surface, which was likely to be magnesium sulphate hydrate [25]. The specimens in magnesium sulphate solution seemed to have deteriorated to a greater extent than those in sodium sulphate solution. White spots were observed and believed to be caused by the precipitation of the magnesium dissolved in the solution (related to the Mg2+ leaching). The corners and edges were vague and showed visible signs of deterioration for specimens in magnesium sulphate solution. The specimens exposed to sulphuric acid solutions turned light brown and this discolouration was likely related to the precipitation of loosely bound ferric hydrates [26].
3.5. Expansion/Shrinkage Results
Prism specimens (75 × 75 × 285 mm) from four mixes from Group 1 were exposed to a few exposure environments (dry, water, and three sulphate solutions) for 400+ days. Group 2 specimens were in the form of cylinders (100 × 200 mm) and they were exposed to three environments (water, sodium sulphate solution, and magnesium sulphate solution) for 434 days. Changes in the length of the specimens were observed and the results are presented in Figure 5 (for Group 1) and Figure 6 (Group 2). It should be noted that the selected testing time is shown in Figure 1, confirming that there was no more ion exchange between samples and solutions since the pH results were constant.
- 1.
- Dry environment:
It is known that drying shrinkage in AAS can exceed that of comparable strength PC [27,28,29]. This is understood to be due to increased capillary stresses developed during the emptying of the pores [10,27,28,30]. Nevertheless, conflicting information can be found in the literature [31]. A higher slag content and silicate-based activators are both known to increase shrinkage [32]. Irregular drying shrinkage behaviour has been reported by Orosoz et al. in 2019, in which a faster drying rate does not necessarily lead to more rapid shrinkage development and indicates that drying shrinkage mechanisms in AAS are significantly more complex than OPC [33]. All four mixes studied shrunk at a rapid rate of up to 200 days and stabilised thereafter. GGBS 1, GGBS 2, and Blend 2 all had a maximum shrinkage of 0.1% in 200 days. Blend 1 shrunk to 0.3% in the same test duration, as this mix had a high silica modulus and Na2O. In addition, a comparatively low w/b indicates that the tensile forces in the capillaries would have been significantly higher, leading to the higher shrinkage observed.
The maximum shrinkage occurring in the three mixes (except for Blend 1) was 0.1% and this was within the acceptable level for structural elements as per ASTM C1012/C1012M-18a standard [34].
- 2.
- Immersion in Water:
In Group 1 mixes, expansion occurred in GGBS 1 and Blend 1 and shrinkage occurred in GGBS 2 and Blend 2 samples. The shrinkage in mixes immersed in water is likely due to the leaching of Na and Si from the unreacted activator. The pH data and leaching of the ions indicated that exposure to water led to a steady outflow of Na, S, and Si ions. Compared to GGBS 1, GGBS 2 has more silicate ions. The leaching data in Figure 2a show that specimens exposed to water lost more Si (226 ppm) than any other exposure solutions, including 1% acid (189 ppm). This logic does not apply to blends. For example, Blend 1 has more silicates and Na than Blend 2, yet the former was observed to swing between shrinkage and expansion, all within ±0.1%. Blend 2, with 56% fly ash, low modulus, and 8% alkali may have created a weaker microstructure due to lower strength and higher permeability 5.24 × 10⁻¹² m2/s (Table 1 [12,15]) that led to the leaching of ions. However, there is insufficient information to validate this inference.
Mix 5 of Group 2 was comparable to GGBS 1 and Mix 7 to GGBS 2. Mix 5 exhibited expansion similar to GGBS 1 and Mix 7 exhibited shrinkage similar to GGBS 2, proving that the results were repeatable. The magnitude of expansion/shrinkage, however, is low for Group 2 mixes in comparison. This is very likely due to the prolonged curing of Group 2 specimens (1 year in sealed conditions). Mixes 1 and 3 resulted in high levels of shrinkage due to the high w/b of these mixes. All other mixes have expansion/shrinkage within 0.1% bandwidth, indicating that they are acceptable for structural applications, as per ASTM C1012/C1012M-18a standard, if sufficient curing can be afforded. Mixes 4 and 6 resulted in the least expansion/shrinkage, which was due to their superior microstructure, indicated by the lowest diffusivity values (1.87 × 10⁻¹² m2/s and 2.34 × 10⁻¹² m2/s, respectively) [15].
- 3.
- Sodium sulphate solution:
According to Shi et al., Na2SO4 is a good activator for slag and other cementitious products and water also promotes the reaction; thus, it is not surprising that Blend 1 (Figure 5c) performs well in this solution (expansion/shrinkage ≤ 0.1%). Except for GGBS 2, all other mixes (in Group 1) show expansion towards the later phase of the exposure. Expansion is due to ion exchange and the transfer of more SO42− from the solution into the samples [4]. This causes the formation of sulphate salts such as ettringite (3CaO·Al2O3·3CaSO4·32H2O), resulting in an overall expansion.
All the mixes in Group 2 presented in Figure 6b showed expansion, except Mixes 2, 4, and 6. As presented before, Mix 4 had the lowest diffusivity, meaning that this specimen would have resisted the ingress/egress of all ions, leading to minimal changes in length. Mix 2, whilst offering a high diffusivity (5.09 × 10⁻¹² m2/s) [15], has the lowest amount of activator. There is a high chance the shrinkage in this mix is due to continued refinement of the microstructure from Na2SO4 acting as an activator. The maximum shrinkage was noted for Mix 6 specimens. Mix 6 had a high silicate modulus and low alkali dosage. This mix also was reported to have a low diffusivity (2.34 × 10⁻¹² m2/s) [15]. This information did not correlate well to provide a convincing explanation for the high shrinkage observed for this mix.
- 4.
- Magnesium sulphate solutions:
These solutions caused shrinkage of all Group 1 mixes, except for GGBS 1, which expanded. The spread of data was very low for Group 1 mixes, with all values lying between 0.1% and −0.2%. The change in the length of GGBS 2 was nominal and often close to 0%. The GGBS chosen for this study contained 6.5% MgO and sulphate egress from the sample was noted in the leaching test (Figure 2a). The concentration of Mg and sulphate ions in the exposure solution, therefore, will not have created a larger potential difference to promote diffusion/leaching in 100% GGBS mixes. Blend 1 is the only mix to have caused 0.2% shrinkage. The high silicate modulus, alkali dosage, and lower w/b in these combinations might have resulted in the higher shrinkage observed.
Figure 6c shows the change in length for all mixes of Group 2, except for Mixes 5 and 7, which was less than 0.1%, in a moderate range, and acceptable for structural performance as per ASTM C1012/C1012M-18a standard. Mix 7 showed high shrinkage in MgSO4. This can be autogenous shrinkage that occurs because of the chemical reactions without the loss of any water to the environment. Expansion in the case of Mix 5, which had a low silicate modulus (0.45), could be due to new sulphate-based products forming on an already hardened pore structure. With a low Ca/Si ratio and a significant degree of aluminium substitution, referred to as C–A–S–H, more secondary product, such as ettringite, can be expected. This will cause pore refinement in this mix. Although Mix 7 already has a high silicate modulus, shrinkage can occur due to selective removal of silicate ions, as this is the ion with the highest potential difference.
- 5.
- Calcium sulphate solutions:
Immersion in 0.2% CaSO4 solution appeared to cause almost no expansion/shrinkage for up to 100 days. During the first 100 days, the increase of Na and Si ion concentrations in 0.2% CaSO4 solution indicated that diffusion (leaching) of these elements from the material into solutions deteriorate the reacted precursor and more shrinkage occurred for Blend 1 and GGBS 2 due to the formation of anhydrite (CaSO4). For Blend 1, the structure became more porous to let the sulphate ions pass through and form new salt formations, such as ettringite, which caused greater expansion after 100 days.
The results present a very sophisticated outlook with shrinkage/expansion being influenced by anything from precursor type, silicate modulus, alkali dosage, w/b, and exposure solution. This suggests the complex behaviour of this binder system and its causative variables [34].
3.6. Change in Mass
Cube specimens for Group 1 and 2 mixes were exposed to different exposure solutions and the change in mass of these were recorded. Results from Group 1 mixes are presented in Figure 7 and Group 2 in Figure 8.
In all cases, the mass increased with the test duration. Given that the samples were cured in a sealed environment, this is to be expected. Figure 7 shows, universally, that there was a sudden increase in mass in all specimens when the exposure began. This indicates the sorption behaviour of the surface layer, during which capillary forces act to balance the moisture content to reach equilibrium. This phase is followed by a steady phase during which mass change, if present, is nominal. There are exceptions. GGBS 2 and Blend 2 show a steady rate of increase in mass when exposed to magnesium sulphate solution (Figure 7c). This is very likely due to the higher permeability of these two mixes, at 4.81 and 5.24 × 10⁻¹² m2/s, respectively (Table 1, [12,15]). All Group 1 samples exposed to sulphuric acid-pH 1 show an increase in mass. As discussed earlier (Section 3.1.2 Ionic characterisation), the samples exposed to sulphuric acid will be subjected to significant leaching of all ions (except Si). Leaching will weaken the microstructure and these gaps are filled with a chemical solution, leading to an increase in mass. Blend 2 shows a much better performance in this environment over the other three mixes. There is a higher amount of Si, Al, and Fe in this blend due to the larger proportion of PFA. It was discussed earlier that acid exposure causes preferential leaching of other ions before affecting Si ions [9]. Moreover, the precipitation of Fe hydrates, which causes the light brown colouration in acid-exposed samples, might act to block the pores and therefore allow less water ingress [26]. It seems that when there is more GGBS in the mix, there is more calcium in contact with sulphuric acid to convert to gypsum. This will cause expansion, cracking, and therefore greater ingress of water.
Figure 8a–e shows the change in mass of cubes from each mix of Group 2, 332 days after casting, for over 489 days of immersion. The mass change of samples immersed in water, Na2SO4, MgSO4, H2SO4 with pH 3 and H2SO4 with pH 1 solution used in this study was in the range of (1–3.6%), (1–2.8%), (1–2.8%), (1.1–3.8%), and (3.0–5.9%), respectively. Mixes 1 and 3 are consistently the worst performers, most likely due to their higher w/b. The rest of the results are comparable to the two mixes in Group 1.
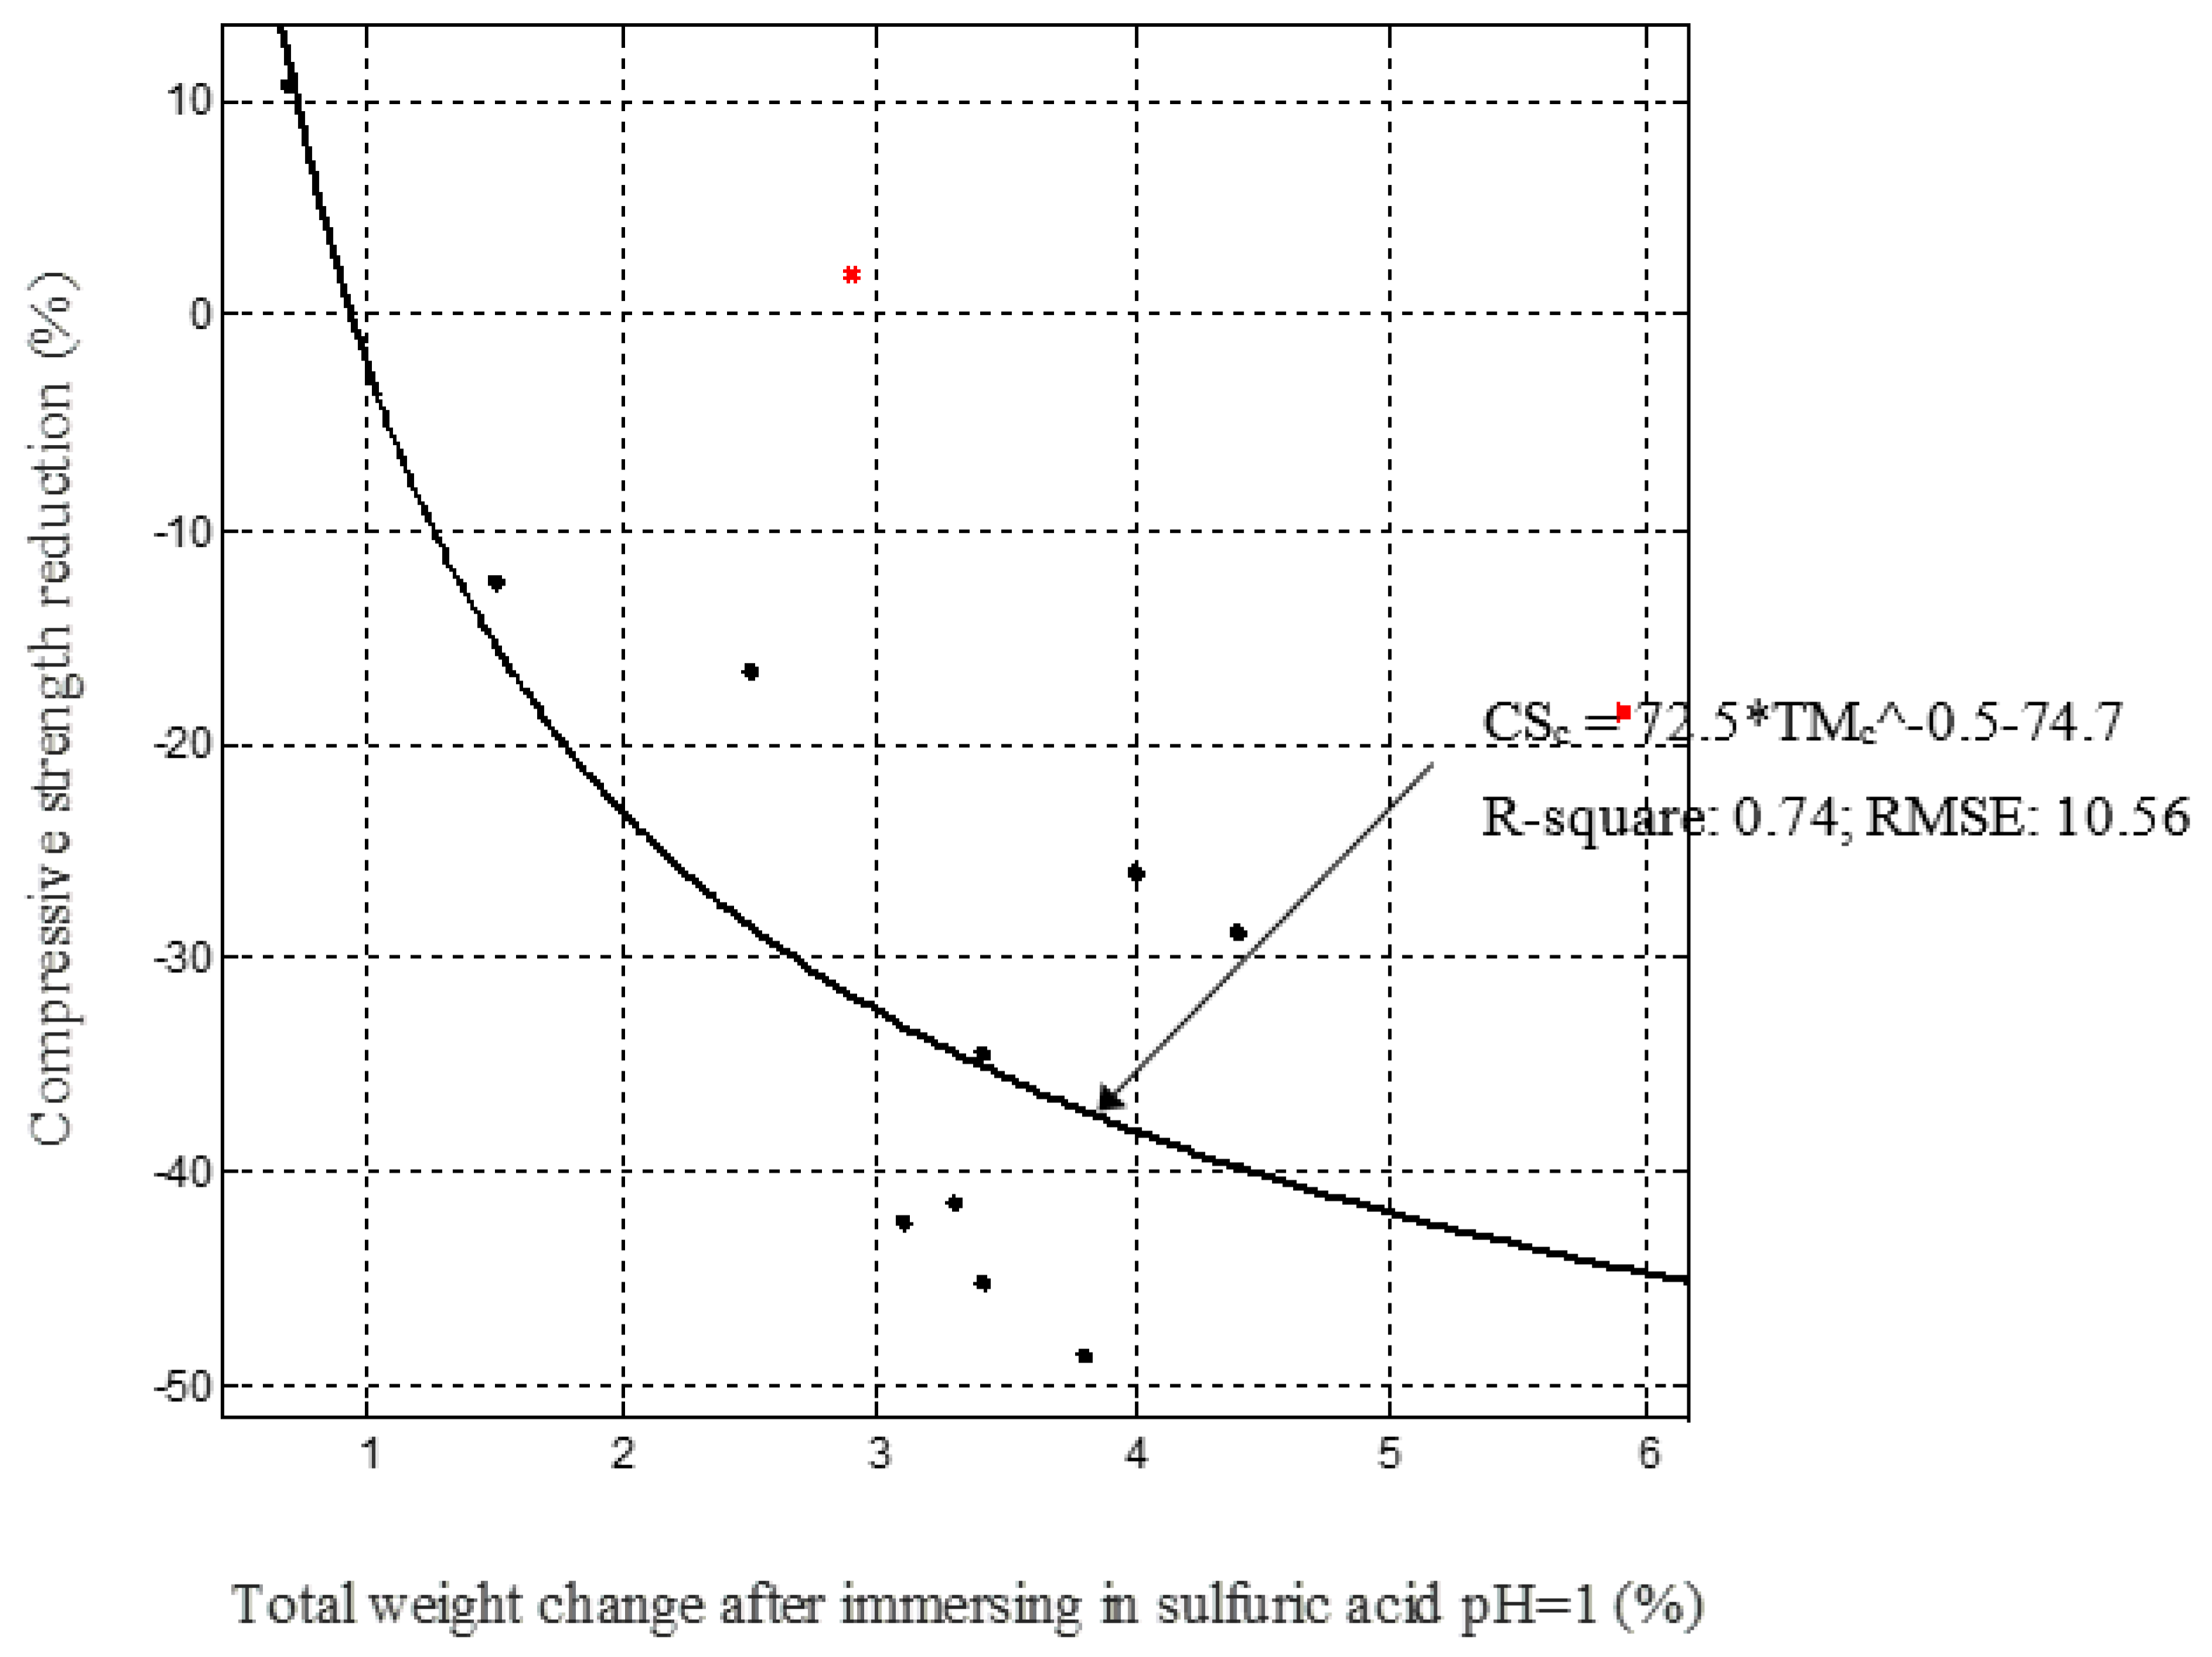
3.7. Strength Loss Modelling Due to Sulphate Ingress
In this study, an empirical model is suggested to predict the strength reduction due to external sulphate attack and the efficiency of the prediction was studied with the actual experimental data. This model evaluates the effect of mass change due to saturation and the chemical reaction due to the diffusion of sulphate ions by the total weight change after immersion in the solutions. Figure 9 shows the total weight change due to exposure to the solutions and the weight change due to saturation related linearly (0.73 < correlation coefficient (R2) < 0.96), while Figure 10 and Figure 11 present how the compressive strength changes against total weight change due to different solutions environment (0.74 < correlation coefficient (R2) < 0.94). Therefore, by measuring the mass change due to saturation, the mass change and the compressive strength change in samples exposed to sulphate solutions can be predicted. In the beginning, the strength of mixes increased in water and sodium sulphate solutions, but was constant in a magnesium sulphate solution. Then, a drop occurred in the strength of mixes exposed to the three solutions and an increase brought them to a stable state due to restructuring their matrix, especially for mixes exposed to MgSO4. A performance criterion that could be produced is that the mass change due to water saturation should be less than 1.0% for a favourable change in strength. If it exceeds 1.0% and is less than 1.3%, the strength change can be considered negligible. Further increase in mass will have a negative effect on strength, depending on the type of exposure solution.
4. Conclusions
Based on the results presented, the following conclusions can be drawn:
- (1)
- Exposure to water led to the egress of Na, Si, and S ions from the specimens. The source of the first two ions was the unreacted sodium hydroxide and silicate activator, whereas the S ions were from sources that existed in GGBS. During exposure, the pH increased from 7 to 12.4 within 24 days. Group 1 mixes were exposed after just 28 days of curing, and these specimens showed an increase in mass and compressive strength. Group 2 mixes, which were cured for a year before exposure, showed mass gain, but no strength gain was noticed. Specimens showed expansion or shrinkage depending on the quantity of Si modulus, Na2O%, and permeability. Whilst it is not possible to discern the exact influence of these variables, longer curing seems to limit the length change to a nominal 0.1% bandwidth allowed for structural applications.
- (2)
- Exposure to Na2SO4 led to leaching of Ca and K in addition to Na, Si, and S ions from the specimens initially. Further, there was a transfer of ions from the solution to the specimen, as expected, in the ionic exposure test. During exposure, the pH increased from 7.92 to 12.04 within 43 days. Group 1 concrete mixes that were exposed to Na2SO4 solution after just 28 days of curing gained strength due to the continued polymerisation of the mixes. The AA-S/F mix with a slag/fly ash ratio of 4 (Blend 1) appeared to perform better as it resisted the ingress/egress of ions and had minimal changes in mass and length. AAS mixes in Group 2 mostly showed strength reduction and expansion. However, those mixes with a high silicate modulus and low alkali dosage showed higher shrinkage.
- (3)
- Exposure to MgSO4 led to the movement of Na from the gel structure and Ca from the decalcification of the Ca-rich gel phases into the exposure solution, which contributed to the weakening of the microstructure. During exposure, the pH increased from 7.82 to 9.13 within 4 days and did not increase any further. All AAS concretes in Groups 1 and 2 exposed to magnesium sulphate solution showed a reduction in strength. The Blend 2 mix with a slag/fly ash ratio of 0.67 had a length change of ≤0.1%, which is within the allowable limit based on ASTM C1012/C1012M-18a.
- (4)
- Exposure to CaSO4 showed no transfer of SO42− from the solution to the samples to form extra sulphate salts while there was a visible transfer of Ca ions into the concrete, which could form new compounds, such as CASH gels, and further strengthen the matrix. During exposure, the pH increased from 8.72 to 12.19 within 30 days. All AAS-AA-S/F concretes exposed to calcium sulphate solutions gained strength and none of the mixes showed any expansion/shrinkage up to 100 days.
- (5)
- Exposure to H2SO4 led to preferential leaching of other elements (Na+, Mg2+, Ca2+ and Al3+) before silicon, which helps to protect tetrahedral silicate and AAM concrete perform better against sulphuric acid attack. During exposure, for a solution with a pH of 3, the pH value increased to 9.87 after just 3 days and for a pH of 1, it took one month for the pH value to change from 1 to 3. The sulphuric acid led to severe strength reduction in both groups of concrete mixes, except for the AA-S/F mix with a slag/fly ash ratio of 0.67 (Blend 2), which appeared to perform best based on the gain in strength and the minimum change in mass. The average mass change of the AASC and (AA-S/F) concrete specimens exposed to sulphuric acid with a pH of 1 was 3.4% and 1.1%, respectively.
- (6)
- Empirical model in Section 3.7 of the article is proposed for predicting changes in compressive strength as a function of mass change due to saturation. A simple performance criterion is proposed, indicating that the mass gain in specimens exposed to salt solutions should be less than 1.3% for a negligible change in compressive strength. It should be noted that the strength reduction (or gain) will not be uniform across the cross-section; the proposed model covers the average strength change and is valid for the outer zone of the concrete.
Author Contributions
Conceptualization, D.B.; methodology, D.B.; formal analysis, D.B.; investigation, D.B.; writing—original draft preparation, D.B.; writing—review and editing, S.N.; supervision, S.N. All authors have read and agreed to the published version of the manuscript.
Funding
This research was funded by the Engineering and Physical Sciences Research Council, grant number EP/M003272/1.
Acknowledgments
The authors acknowledge the School of Natural and Built Environment for providing the research facilities, laboratory equipment and internal funding for the analysis of samples.
Conflicts of Interest
The authors declare no conflict of interest.
References
- Provis, J.; van Deventer, J. (Eds.) Alkali Activated Materials, State-of-the-Art Report, RILEM TC-224-AAM, 1st ed.; Springer: London, UK, 2014. [Google Scholar]
- Arbi, K.; Nedeljković, M.; Zuo, Y.; Ye, G. A Review on the Durability of Alkali-Activated Fly Ash/Slag Systems: Advances, Issues, and Perspectives. Ind. Eng. Chem. Res. 2016, 55, 5439–5453. [Google Scholar] [CrossRef] [Green Version]
- Skalny, J.; Marchand, J.; Odler, I. Sulphate Attack on Concrete, 1st ed.; Spon Press: London, UK, 2002. [Google Scholar]
- Shi, C.; Krivenko, P.; Roy, D. Alkali-Activated Cements and Concretes, 1st ed.; Taylor & Francis: Chippenham, UK, 2006. [Google Scholar]
- Komljenović, M.; Baščarević, Z.; Marjanović, N.; Nikolic, V. External sulphate attack on alkali-activated slag. Constr. Build. Mater. 2013, 49, 31–39. [Google Scholar] [CrossRef]
- Huseien, G.F.; Tahir, M.M.; Mirza, J.; Ismail, M.; Wei Shah, K.; Asad, M.A. Effects of POFA replaced with FA on durability properties of GBFS included alkali-activated mortars. Constr. Build. Mater. 2018, 175, 174–186. [Google Scholar] [CrossRef]
- Kwasny, J.; Aiken, T.A.; Soutsos, M.N.; McIntosh, J.A.; Cleland, D.J. Sulphate and acid resistance of lithomarge-based geopolymer mortars. Constr. Build. Mater. 2018, 166, 537–553. [Google Scholar] [CrossRef] [Green Version]
- Džunuzović, N.; Komljenović, M.; Nikolić, V.; Ivanovic, T. External sulphate attack on alkali-activated fly ash-blast furnace slag composite. Constr. Build. Mater. 2017, 157, 737–747. [Google Scholar] [CrossRef]
- Aiken, T.A.; Kwasny, J.; Sha, W.; Soutsos, M.N. Effect of slag content and activator dosage on the resistance of fly ash geopolymer binders to sulphuric acid attack. Cem. Concr. Res. 2018, 111, 23–40. [Google Scholar] [CrossRef] [Green Version]
- Gu, Y.; Fang, Y.; You, D.; Gong, Y.; Zhu, C. Properties and microstructure of alkali-activated slag cement cured at below-and about-normal temperature. Constr. Build. Mater. 2015, 79, 1–8. [Google Scholar] [CrossRef]
- Aliques-Granero, J.; Tognonvi, M.T.; Tagnit-Hamoua, A. Durability study of AAMs: Sulphate attack resistance. Constr. Build. Mater. 2019, 229, 117100. [Google Scholar] [CrossRef]
- Bondar, D.; Basheer, M.; Nanukuttan, S. Suitability of alkali-activated slag/fly ash (AA-GGBS/FA) concretes for chloride environments: Characterisation based on mix design and compliance testing. Constr. Build. Mater. 2019, 216, 612–621. [Google Scholar] [CrossRef]
- Bondar, D.; Nanukuttan, S.; Provis, J.; Soutsos, M. Efficient mix design of alkali-activated slag concrete based on packing density of ingredients and paste thickness. J. Clean. Prod. 2019, 218, 438–449. [Google Scholar] [CrossRef]
- BS EN 1097-1. Tests for Mechanical and Physical Properties of Aggregates. Determination of the Resistance to Wear (Micro-Deval); BSI: London, UK, 1911. [Google Scholar]
- Bondar, D.; Ma, Q.; Soutsos, M.; Basheer, M.; Provis, J.; Nanukuttan, S. Alkali activated slag concretes designed for a desired slump, strength and chloride diffusivity. Constr. Build. Mater. 2018, 190, 191–199. [Google Scholar] [CrossRef] [Green Version]
- Chindaprasirta, P.; Sriopas, B.; Phosrib, P.; Yoddumrong, P.; Anantakarn, K.; Kroehong, W. Hybrid high calcium fly ash alkali-activated repair material for concrete exposed to sulfate environment. J. Build. Eng. 2022, 45, 103590. [Google Scholar] [CrossRef]
- Bakharev, T.; Sanjayan, J.G.; Cheng, Y.B. Sulphate attack on alkali-activated slag concrete. Cem. Concr. Res. 2002, 32, 211–216. [Google Scholar] [CrossRef]
- Allahvedi, A.; Hashemi, H. Investigating the resistance of alkali-activated slag mortar exposed to magnesium sulphate attack. Int. J. Civ. Eng. 2015, 13, 379–387. [Google Scholar]
- Alexander, M.; Bertron, A.; De Belie, N. (Eds.) Performance of Cement-Based Materials in Aqueous Environments, State-of-the-Art Report, RILEM TC 211—PAE; Springer: Dordrecht, The Netherlands, 2013; Volume 10, p. 462. [Google Scholar]
- BS EN 12350-2. Testing Fresh Concrete Part 2: Slump-Test and Part 5: Flow Table Test; BSI: London, UK, 2009. [Google Scholar]
- BS EN 12390-3. Testing Hardened Concrete Part 3: Compressive Strength of Test Specimens; BSI: London, UK, 2009. [Google Scholar]
- Allahverdi, A.; Shaverdi, B.; Najafi Kani, E. Influence of sodium oxide on properties of fresh and hardened paste of alkali-activated blast-furnace slag. Int. J. Civ. Eng. 2010, 8, 304–314. [Google Scholar]
- Giasuddin, H.M.; Sanjayan, J.G.; Ranjith, P.G. Strength of geopolymer cured in saline water in ambient conditions. Fuel 2013, 107, 34–39. [Google Scholar] [CrossRef]
- Beddoe, R.E.; Dorner, H.W. Modelling acid attack on concrete: Part I. The essential mechanisms. Cem. Concr. Res. 2005, 35, 2333–2339. [Google Scholar] [CrossRef]
- Kwasny, J.; Aiken, T.A.; Soutsos, M.N.; Cleland, D.J.; McIntosh, J.A. Comparison of lithomarge and cement-based mortars performance in aggressive aqueous environments. In Proceedings of the Sixth International Conference on Durability of Concrete Structures, Leeds, UK, 18–20 July 2018; pp. 160–169. [Google Scholar]
- Gutberlet, T.; Hilbig, H.; Beddoe, R.E. Acid attack on hydrated cement—Effect of mineral acids on the degradation process. Cem. Concr. Res. 2015, 74, 35–43. [Google Scholar] [CrossRef]
- Collins, S.J.G. Effect of pore size distribution on drying shrinking of alkali-activated slag concrete. Cem. Concr. Res. 2000, 30, 1401–1406. [Google Scholar] [CrossRef]
- Neto, A.A.M.; Cincotto, M.A.; Repette, W. Drying and autogenous shrinkage of pastes and mortars with activated lag cement. Cem. Concr. Res. 2008, 38, 565–574. [Google Scholar] [CrossRef]
- Cartwright, C.; Rajabipour, F.; Radlińska, A. Shrinkage characteristics of alkali-activated slag cement. J. Mater. Civ. Eng. 2015, 27, B4014007. [Google Scholar] [CrossRef]
- Omas, R.J.; Lezama, D.; Peethamparan, S. On drying shrinkage in alkali-activated concrete: Improving dimension and stability by ageing or heat-curing. Cem. Concr. Res. 2017, 91, 13–23. [Google Scholar]
- Ye, C.; Cartwright, F.; Rajabipour, R.A. Effect of drying rate on shrinkage of alkali-activated slag cement. In Proceedings of the 4th International Conference on the Advances in Civil Engineering Durability of Concrete Structures, Lafayette, IN, USA, 21 July 2014. [Google Scholar]
- Lee, N.K.; Jang, J.G.; Lee, H.K. Shrinkage characteristics of alkali-activated fly ash/slag paste and mortar at early ages. Cem. Concr. Compos. 2014, 53, 239–248. [Google Scholar] [CrossRef]
- Orosz, K.; Humad, A.; Hedlund, H.; Cwirzen, A. Autogenous Deformation of Alkali-Activated Blast Furnace Slag Concrete Subjected to Variable Curing Temperatures. Adv. Civ. Eng. 2019, 2019, 6903725. [Google Scholar] [CrossRef]
- ASTM International. ASTM C1012/C1012M-18a Standard Test Method for Length Change of Hydraulic-Cement Mortars Exposed to a Sulfate Solution; ASTM International: West Conshohocken, PA, USA, 2018. [Google Scholar]
Figure 1.
The fluctuation of the pH value of water, MgSO4, Na2SO4, CaSO4, and sulphuric acid solutions over 400 days of exposure to concrete specimens. Results represent an average of both Group 1 and Group 2 specimens containing AASC and AAS/F blends.
Figure 1.
The fluctuation of the pH value of water, MgSO4, Na2SO4, CaSO4, and sulphuric acid solutions over 400 days of exposure to concrete specimens. Results represent an average of both Group 1 and Group 2 specimens containing AASC and AAS/F blends.
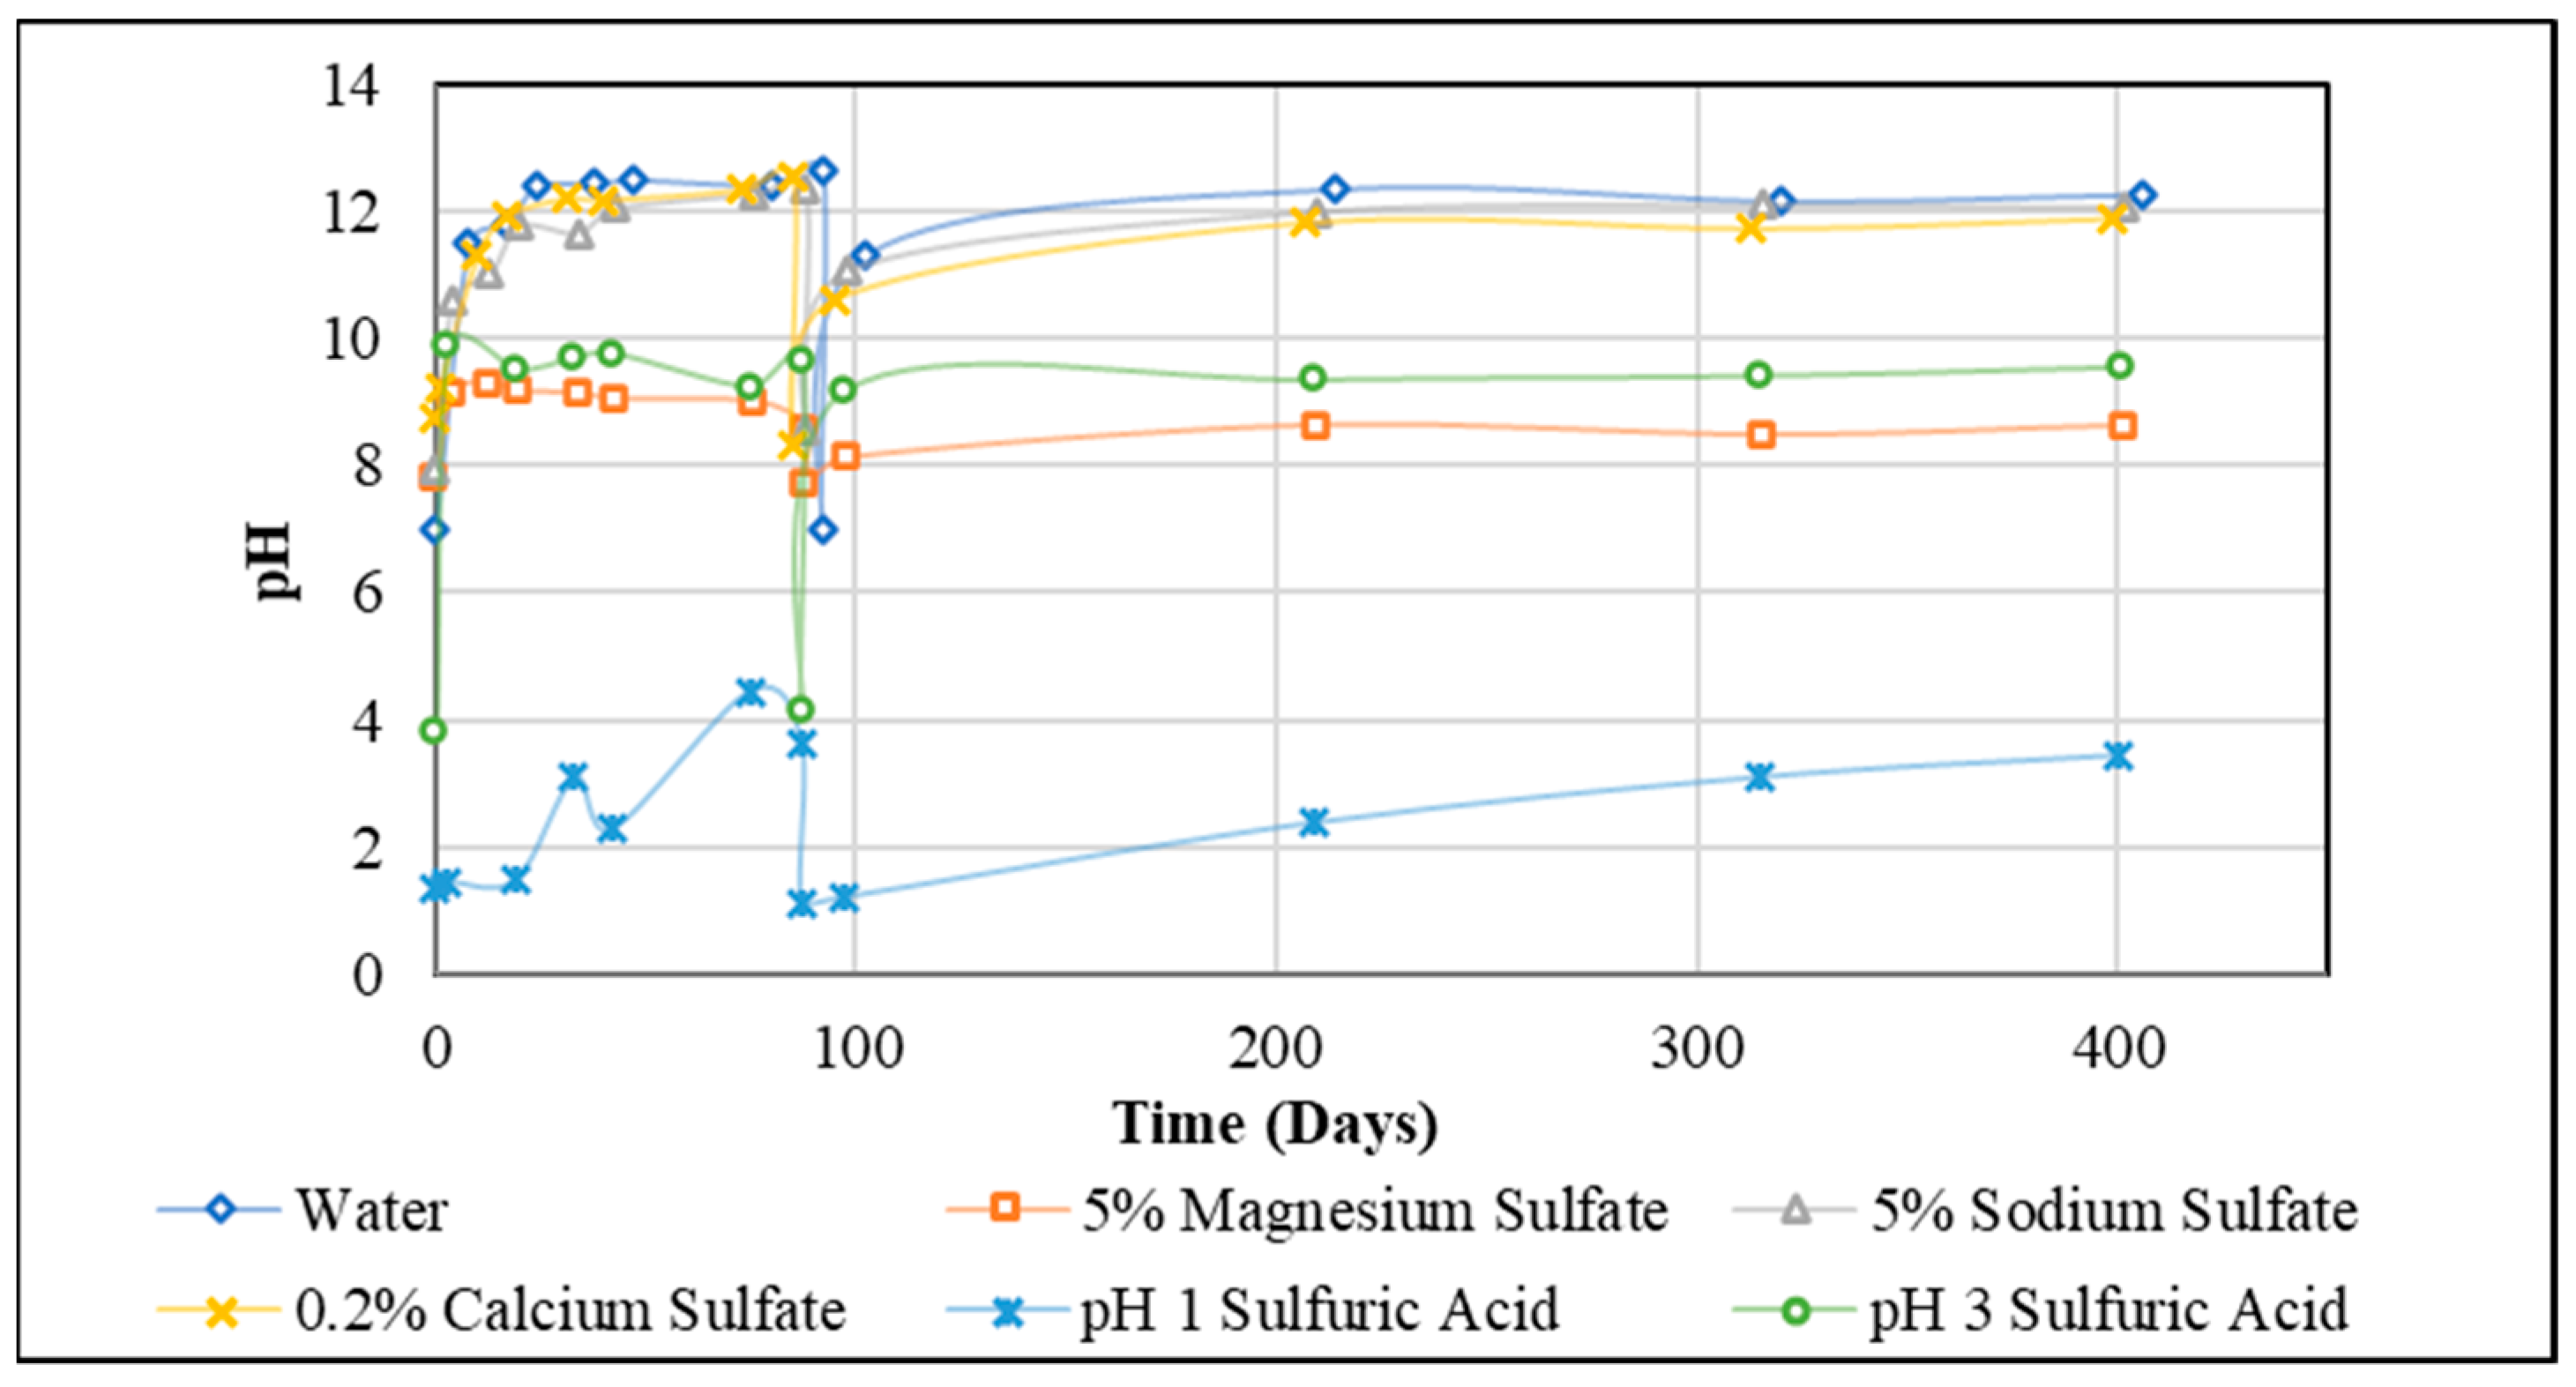
Figure 2.
The results of inductively coupled plasma analysis of the exposure solutions before [i.e., (a) water; (b) Na2SO4; (c) MgSO4; (d) CaSO4; (e) H2SO4-pH1] and after exposure to AASC and AAS/F concretes. Results represent an average of both Group 1 and Group 2 specimens.
Figure 2.
The results of inductively coupled plasma analysis of the exposure solutions before [i.e., (a) water; (b) Na2SO4; (c) MgSO4; (d) CaSO4; (e) H2SO4-pH1] and after exposure to AASC and AAS/F concretes. Results represent an average of both Group 1 and Group 2 specimens.
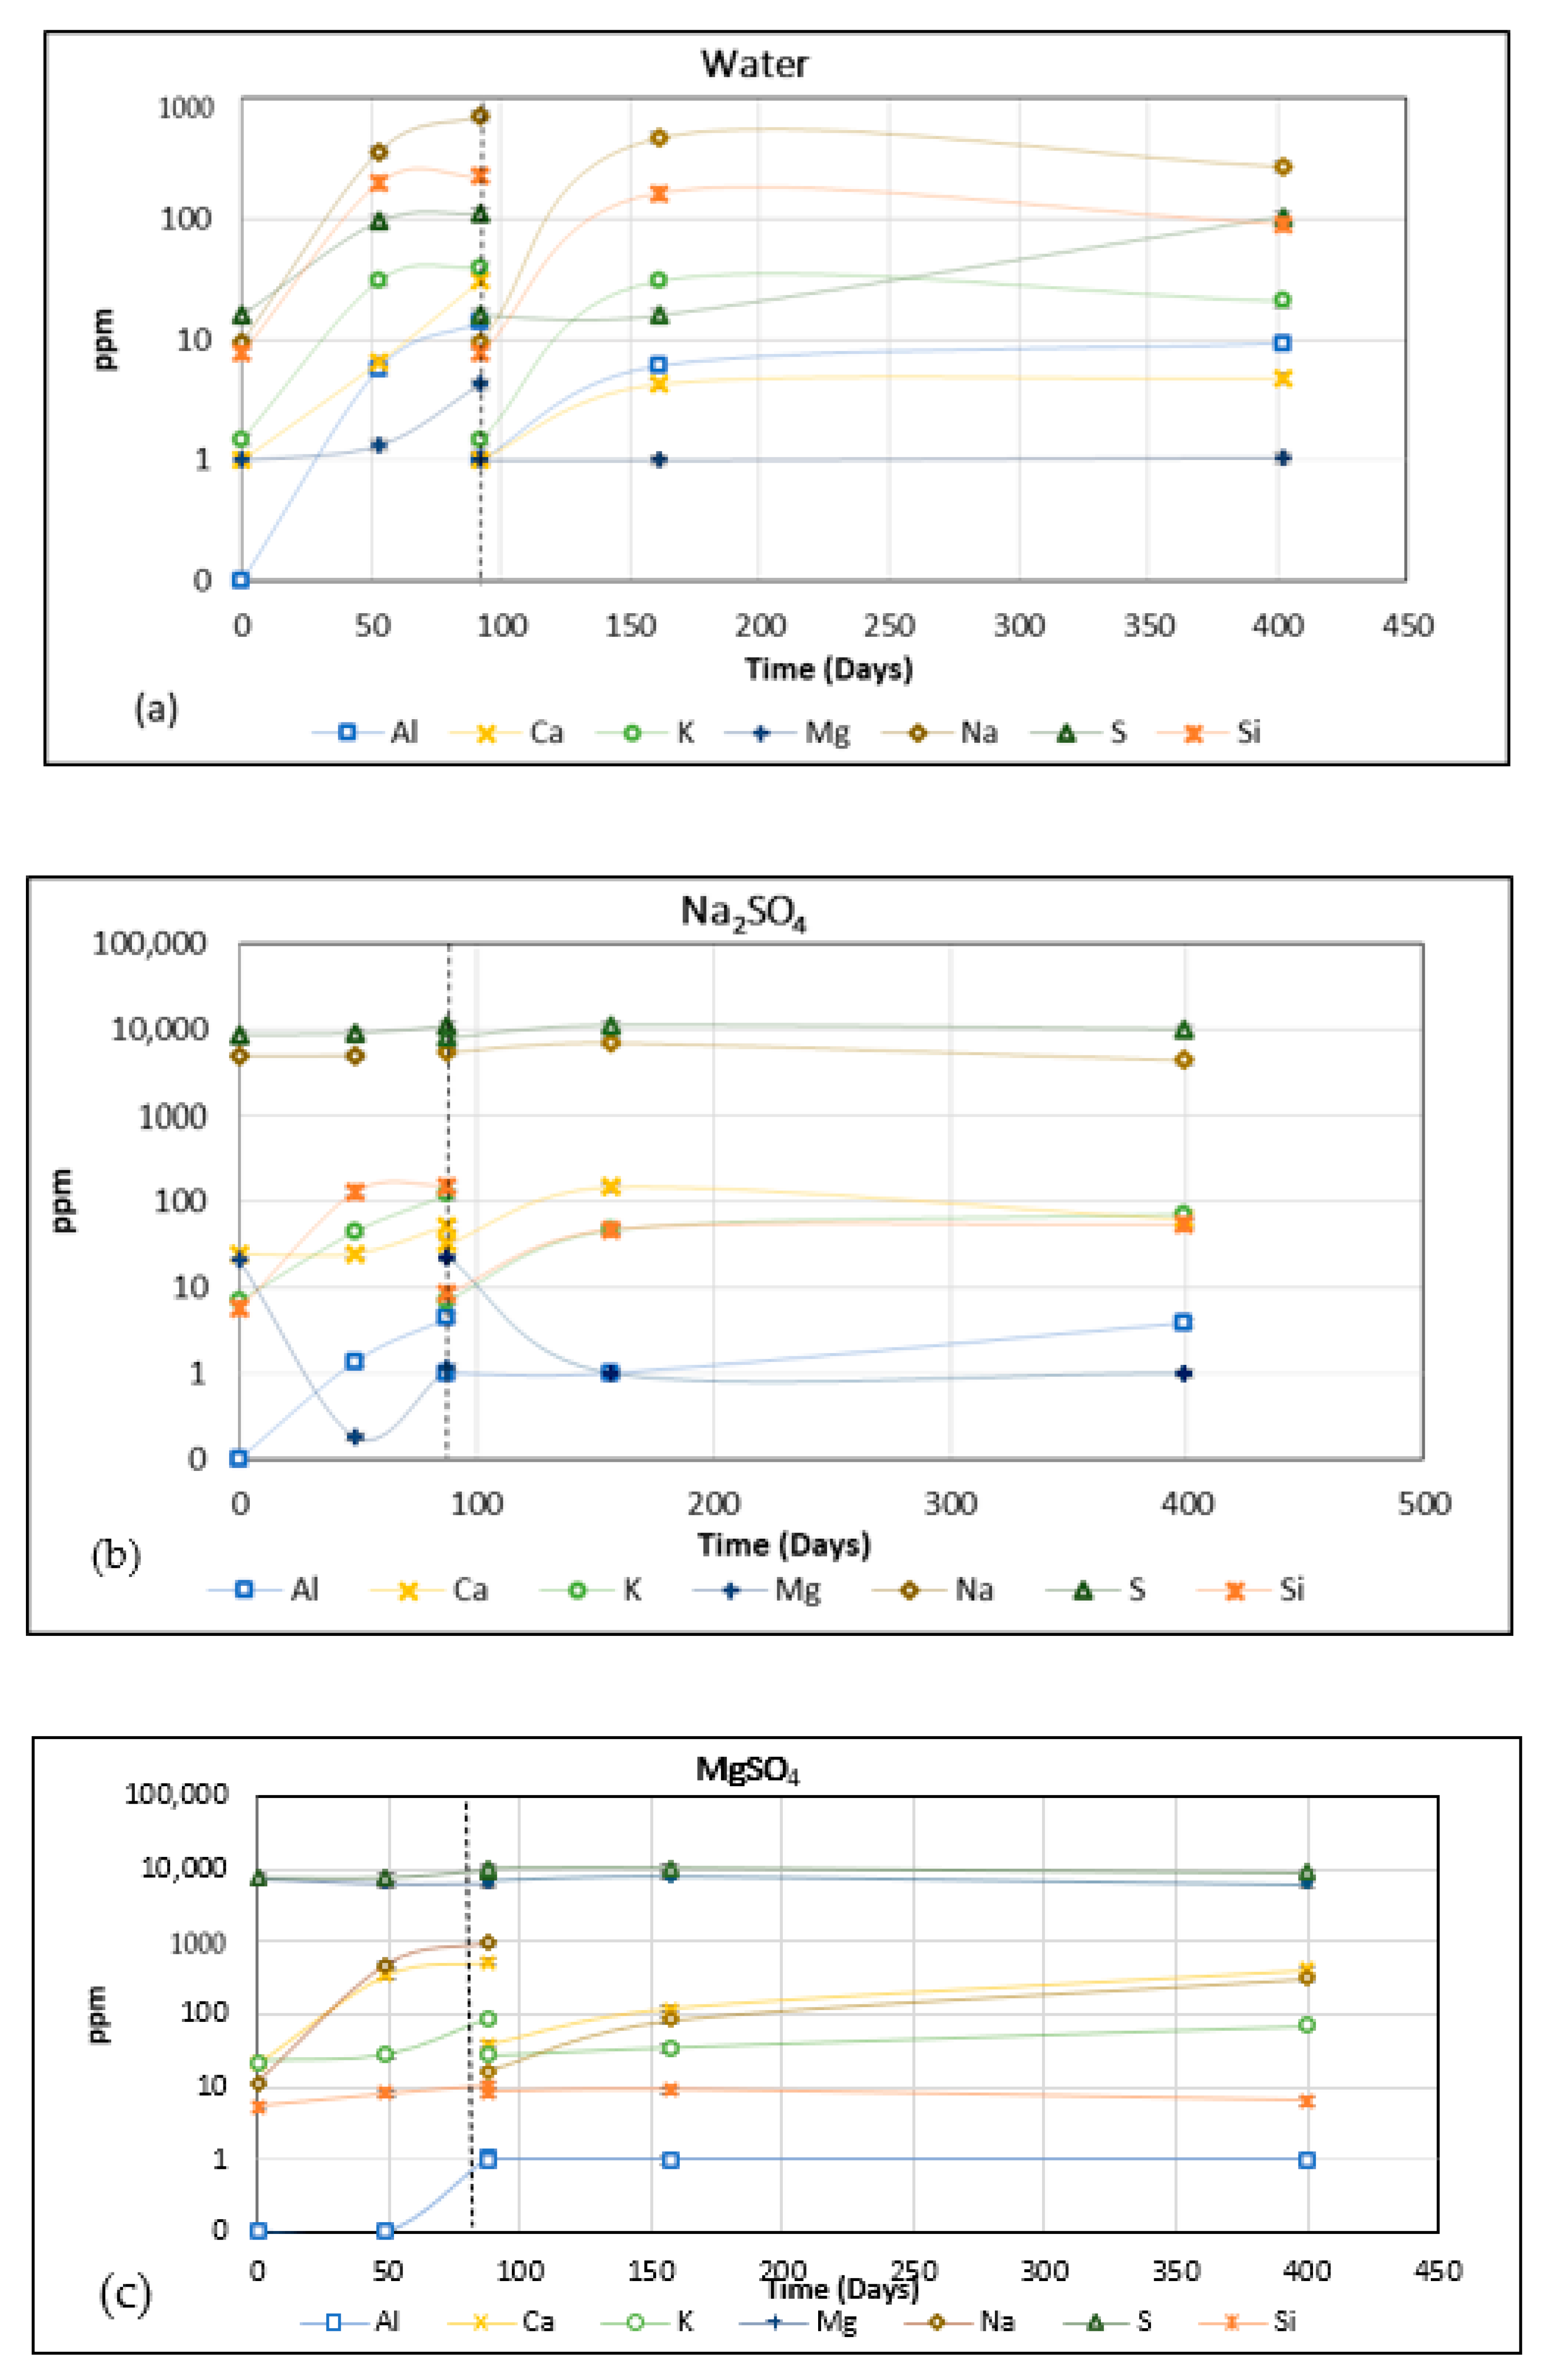
Figure 3.
The compressive strength of AASC and AAS/F concrete samples kept in sealed conditions and exposed to various solutions (Water, Na2SO4, MgSO4, CaSO4, H2SO4-pH 1, and H2SO4-pH 3) at 485 days for the first group and at 820 days for the second group of mixes.
Figure 3.
The compressive strength of AASC and AAS/F concrete samples kept in sealed conditions and exposed to various solutions (Water, Na2SO4, MgSO4, CaSO4, H2SO4-pH 1, and H2SO4-pH 3) at 485 days for the first group and at 820 days for the second group of mixes.
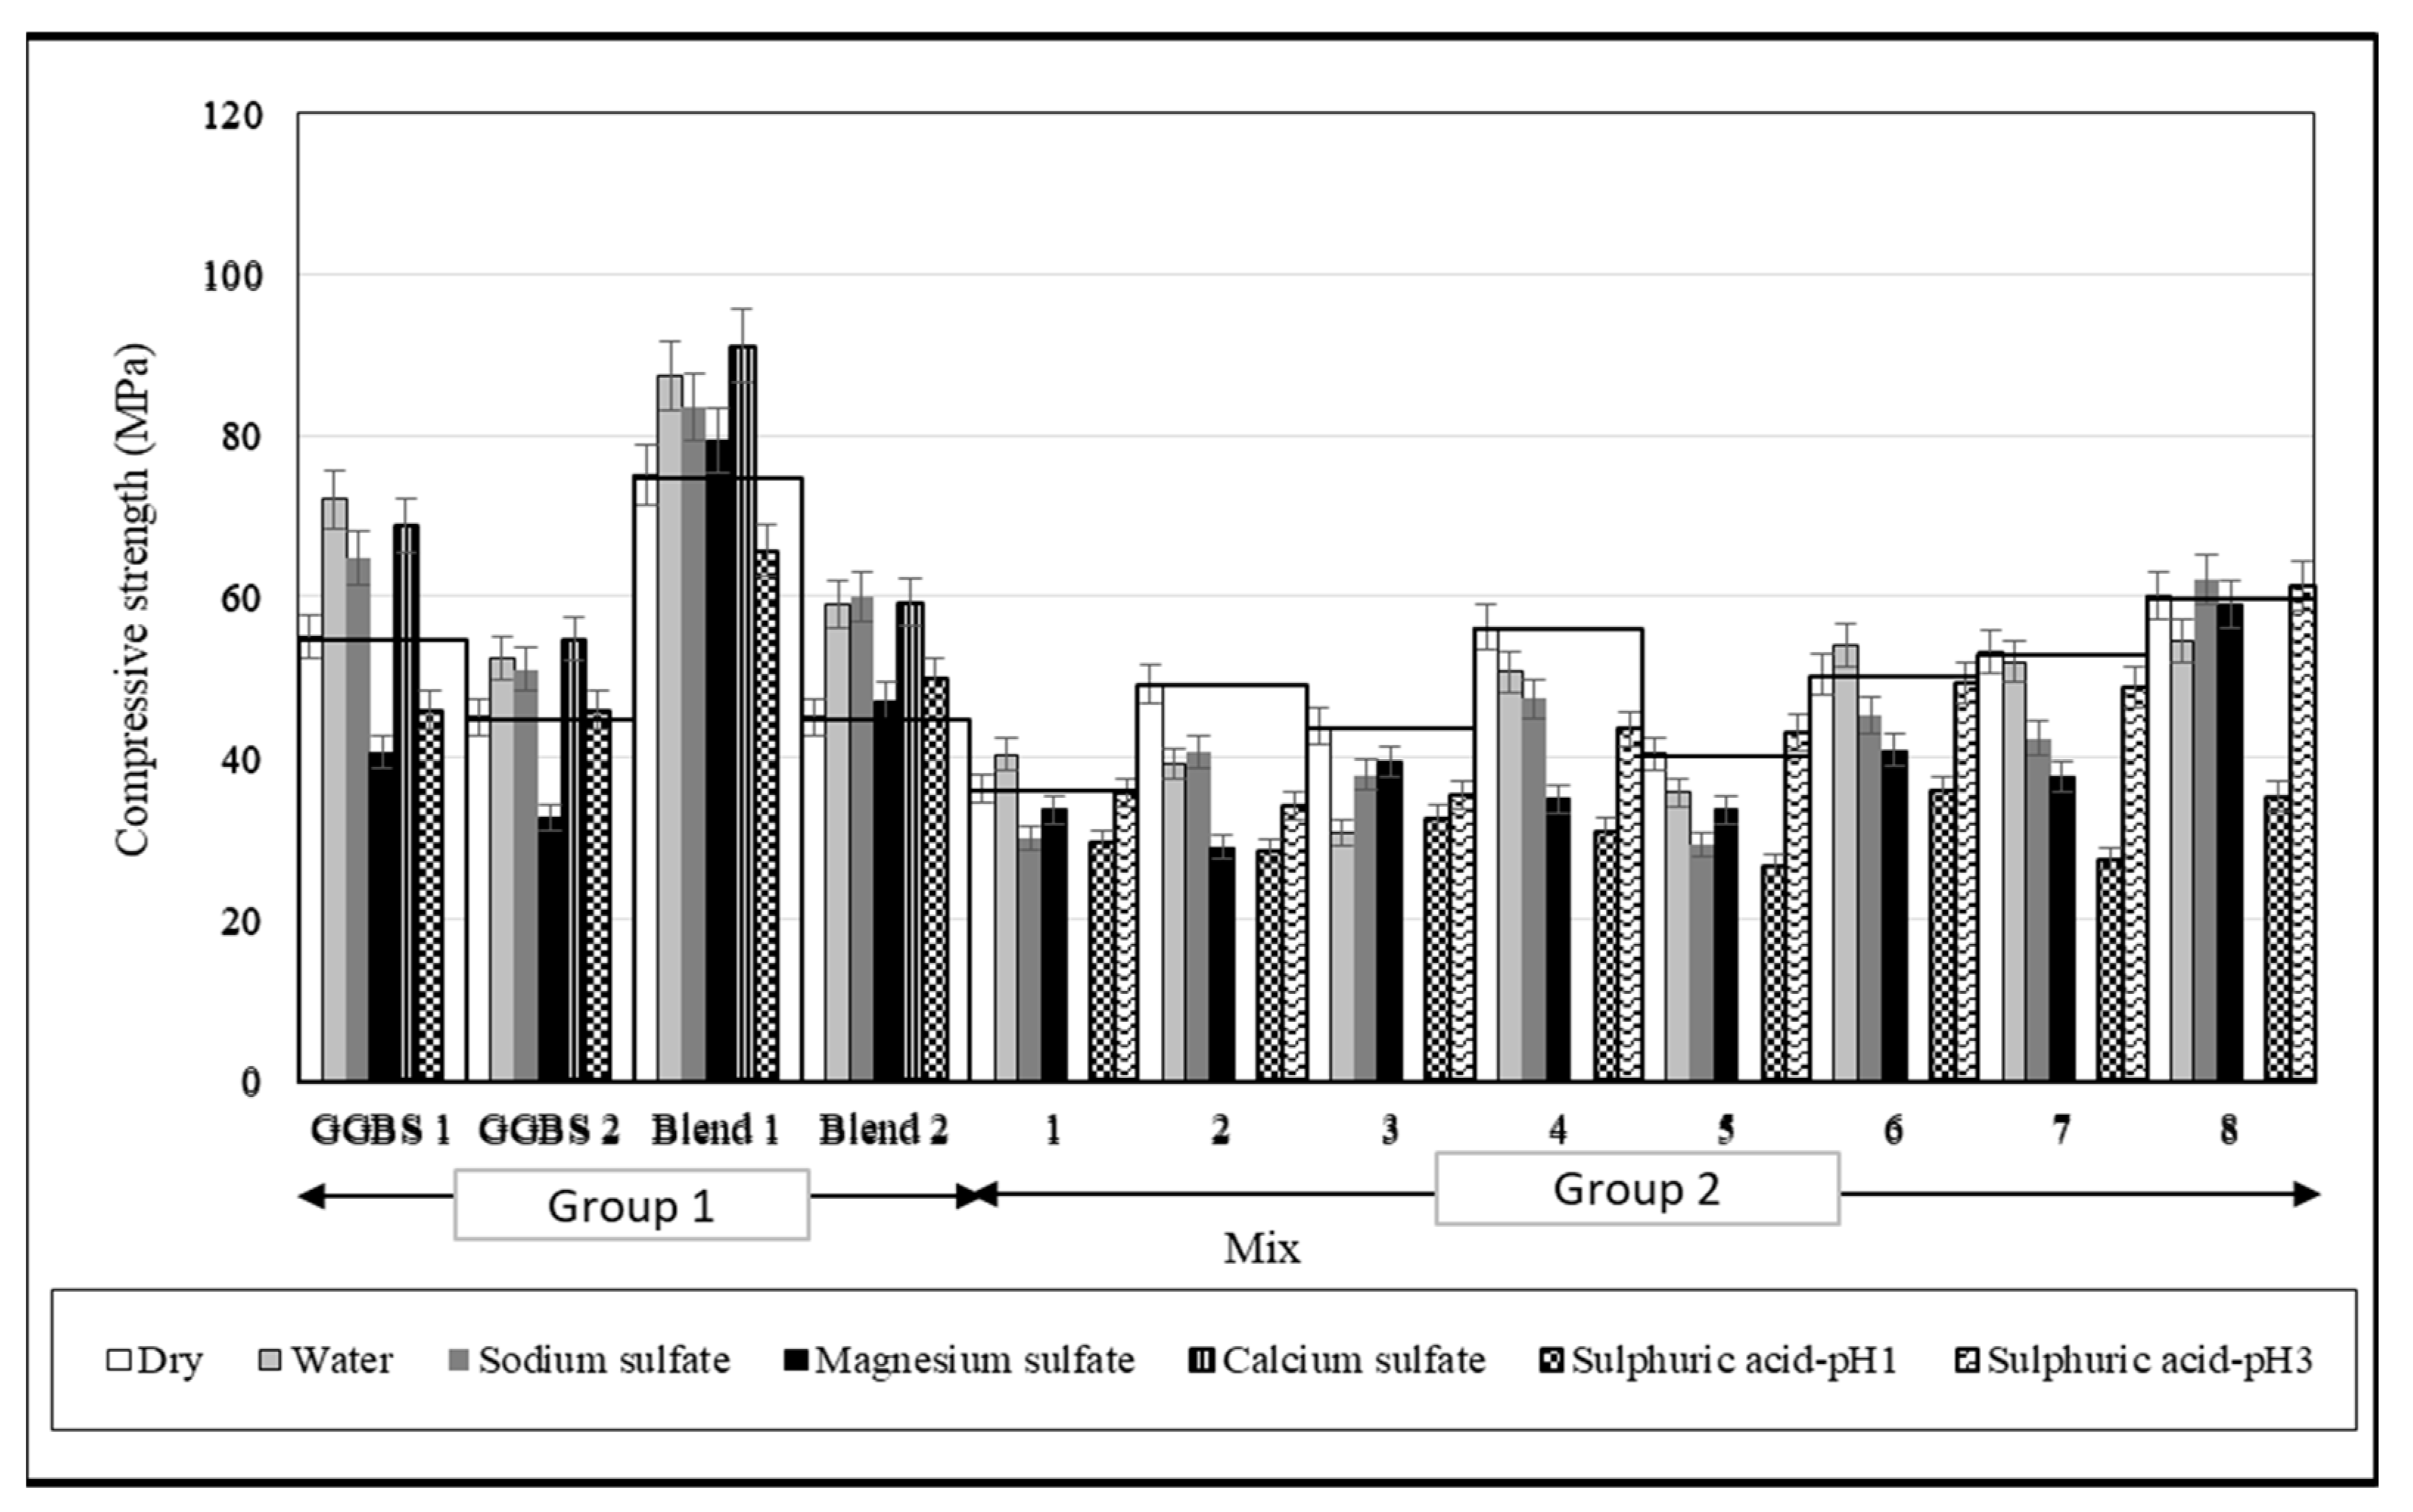
Figure 4.
The visual appearance of the concrete specimens after 14 months of exposure to various solutions. Group 1 specimens are shown on the left-hand side and Group 2 on the right. The corners and edges were damaged for specimens exposed to MgSO4 and sulphuric acid. Note the brown/orange colouration of specimens exposed to sulphuric acid.

Figure 5.
Expansion/shrinkage of Group 1 AASC and AAS/F concrete mixes (cured 28 days before exposure) during (a) dry condition and immersion in different solutions [(b) Water, (c) Na2SO4, (d) MgSO4, (e) CaSO4]; ±0.1% tolerance accepted by ASTM C1012 is shown on the figures as full horizontal black lines.

Figure 6.
Expansion/shrinkage of Group 2 AASC mixes (cured for a year before exposure) during immersion in different solutions [(a) Water, (b) Na2SO4, (c) MgSO4]; ±0.1% tolerance accepted by ASTM C1012 is shown on the figures as full horizontal black lines.
Figure 6.
Expansion/shrinkage of Group 2 AASC mixes (cured for a year before exposure) during immersion in different solutions [(a) Water, (b) Na2SO4, (c) MgSO4]; ±0.1% tolerance accepted by ASTM C1012 is shown on the figures as full horizontal black lines.
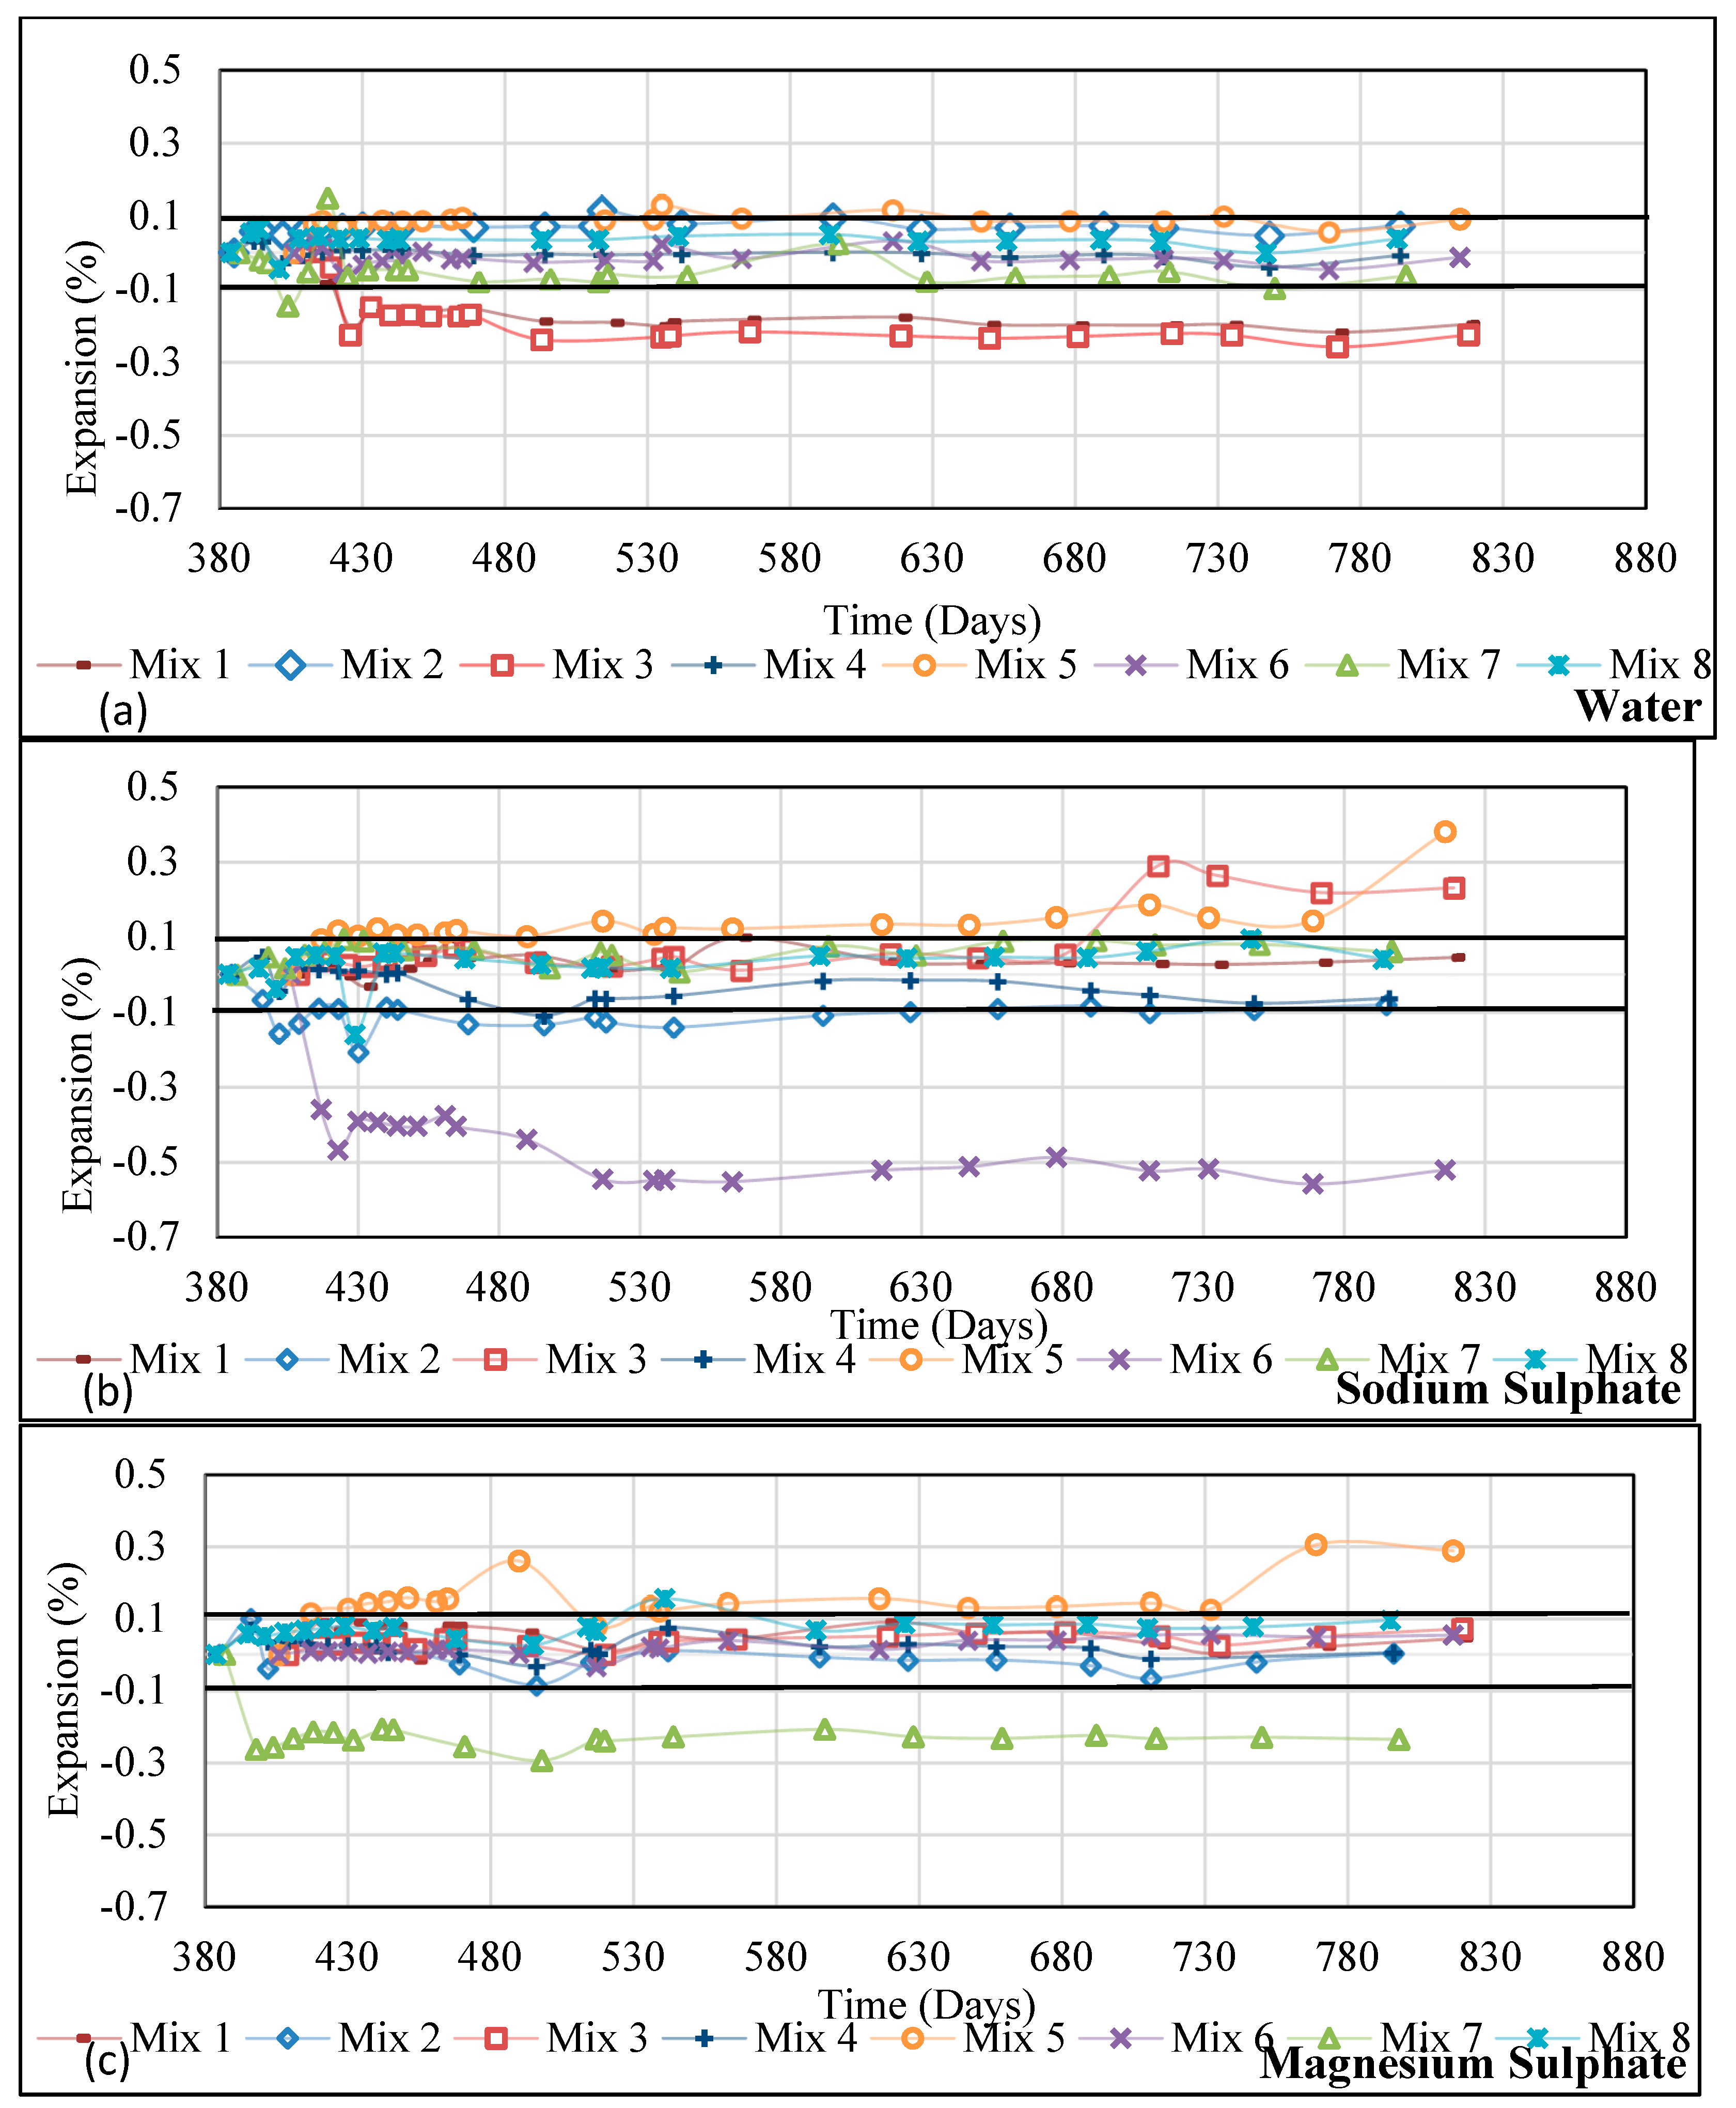
Figure 7.
Change in weight of Group 1 AASC and AAS/F concrete mixes (cured for 28 days before exposure) during immersion in different solutions [(a) Water, (b) Na2SO4, (c) MgSO4, (d) CaSO4, (e) H2SO4-pH 1].
Figure 7.
Change in weight of Group 1 AASC and AAS/F concrete mixes (cured for 28 days before exposure) during immersion in different solutions [(a) Water, (b) Na2SO4, (c) MgSO4, (d) CaSO4, (e) H2SO4-pH 1].
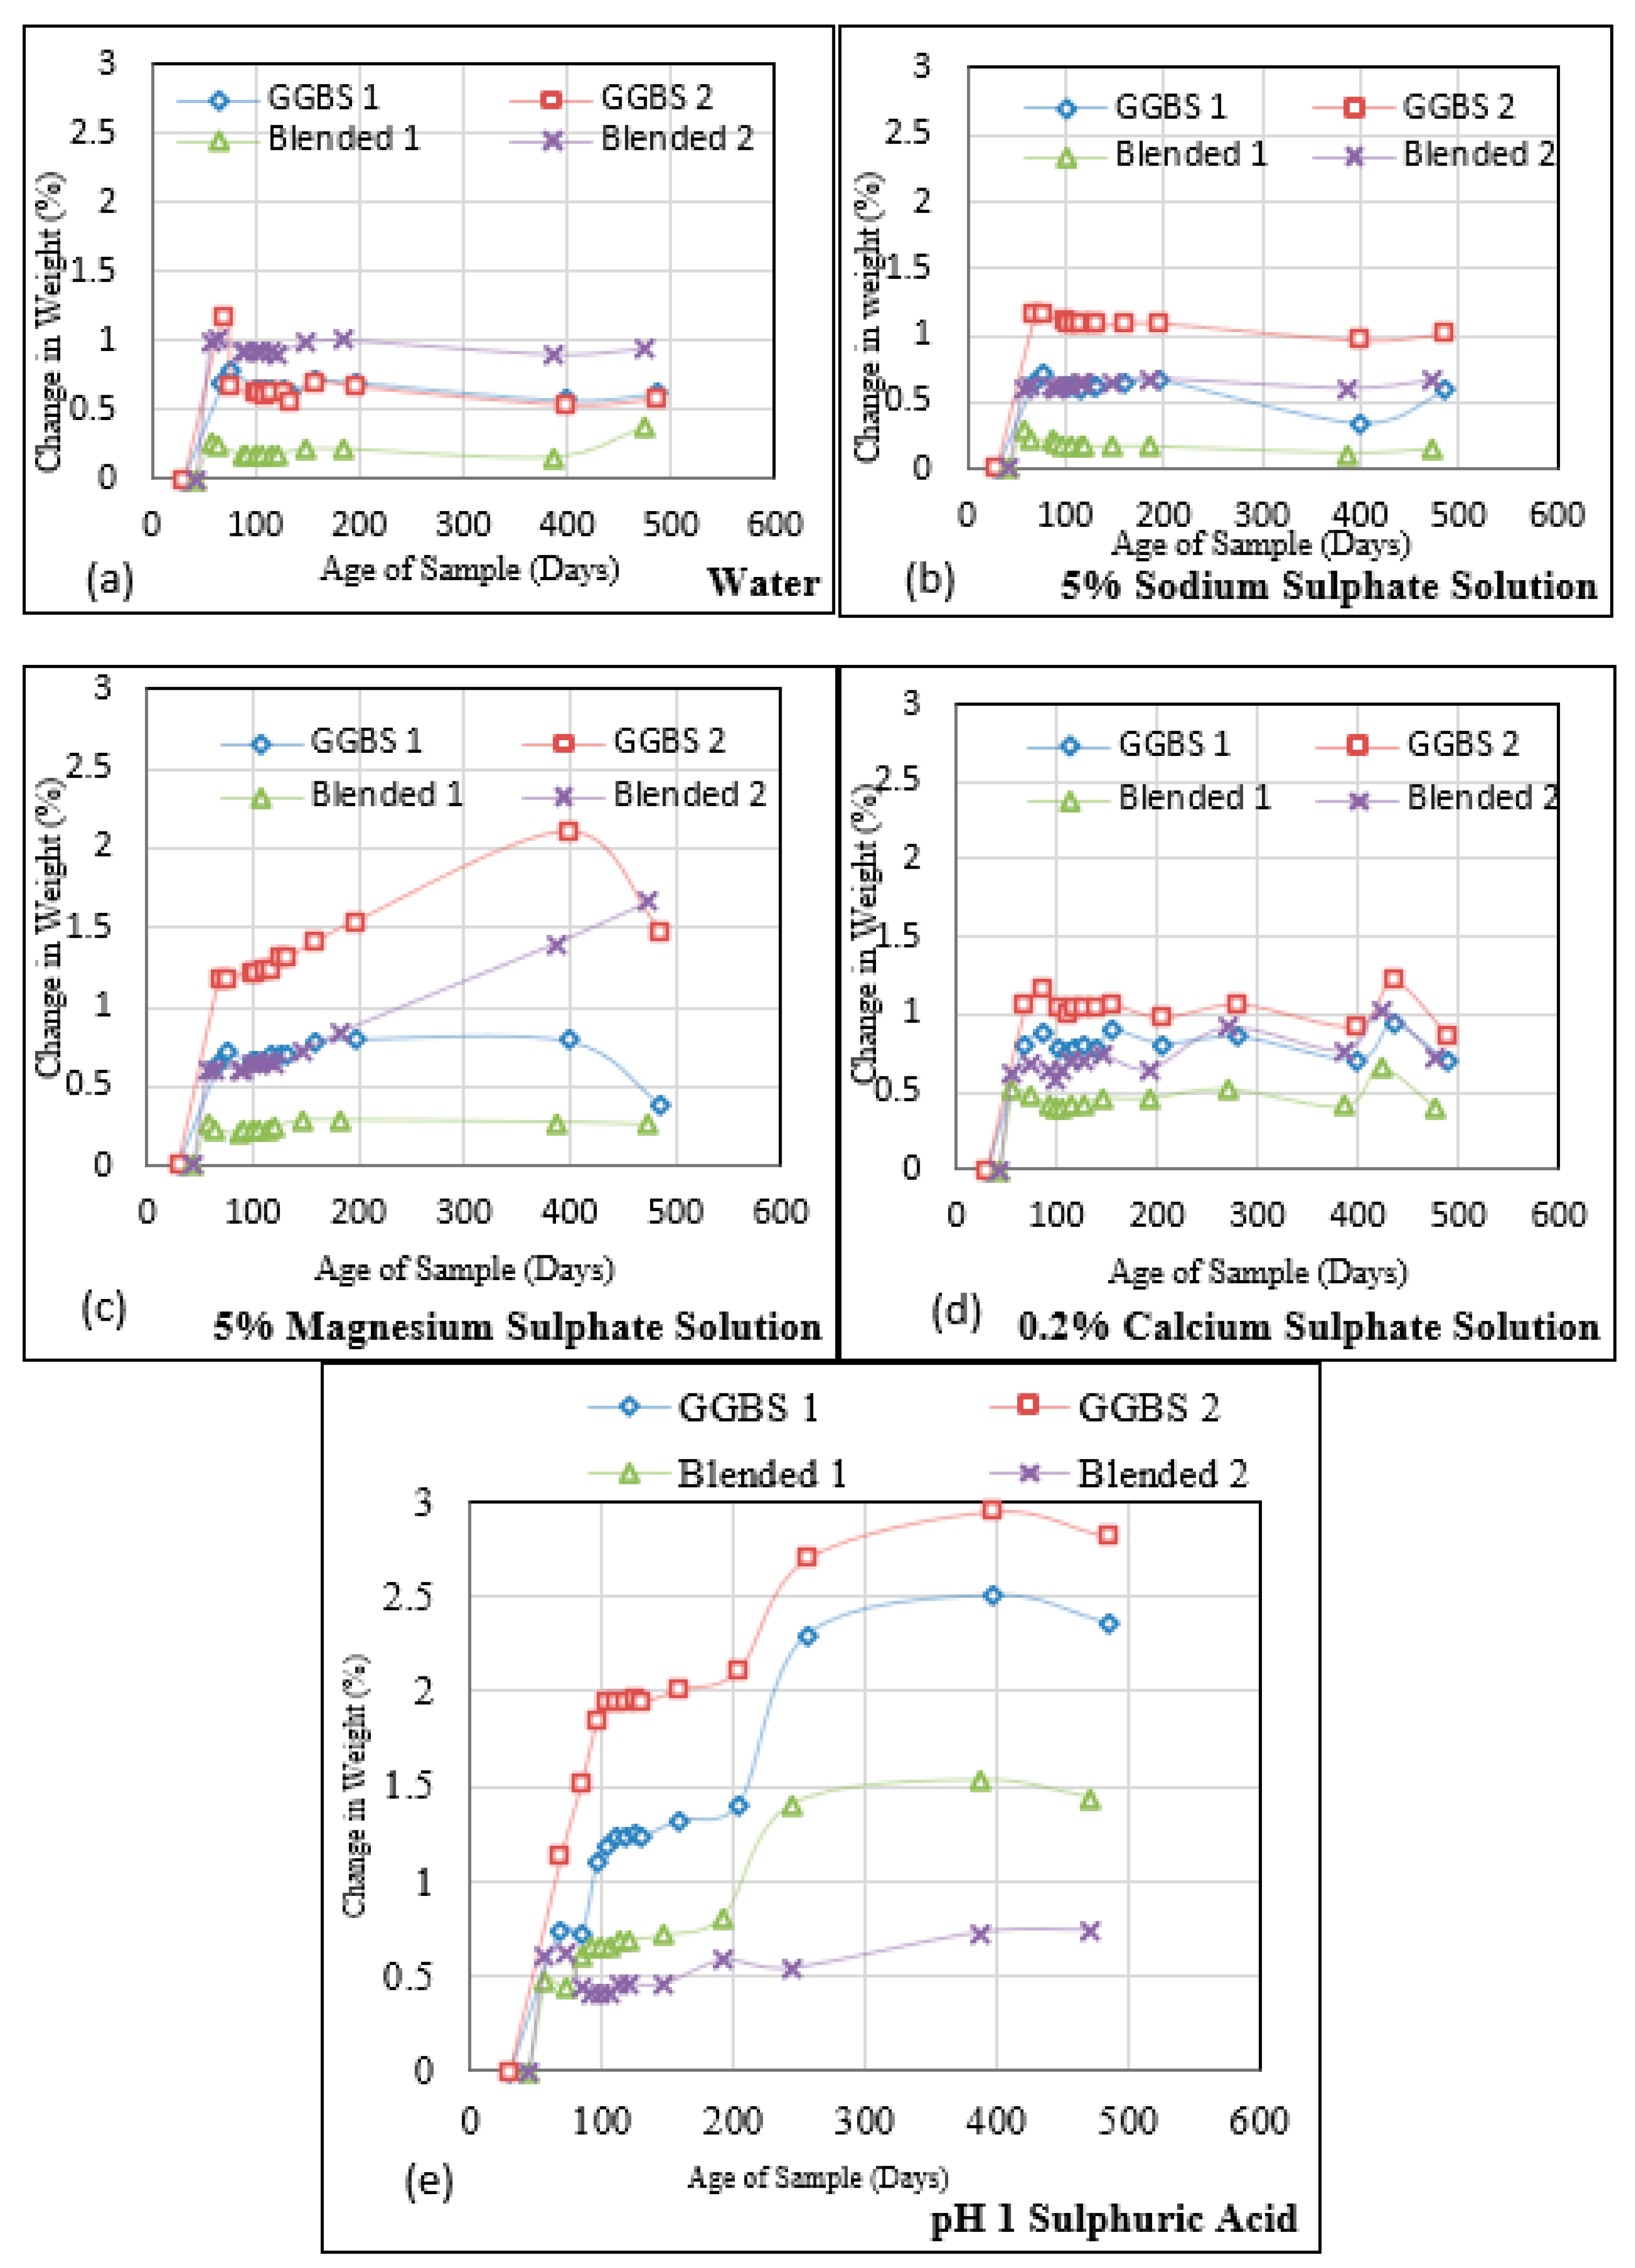
Figure 8.
Change in weight of Group 2 AASC mixes (cured for a year before exposure) during immersion in different solutions [(a) Water, (b) Na2SO4, (c) MgSO4, (d) H2SO4-pH 3, (e) H2SO4-pH 1].
Figure 8.
Change in weight of Group 2 AASC mixes (cured for a year before exposure) during immersion in different solutions [(a) Water, (b) Na2SO4, (c) MgSO4, (d) H2SO4-pH 3, (e) H2SO4-pH 1].

Figure 9.
Total mass change of mixes (%) after immersion in solutions against saturation mass change (%) (x = mass change (%) due to saturation).
Figure 9.
Total mass change of mixes (%) after immersion in solutions against saturation mass change (%) (x = mass change (%) due to saturation).
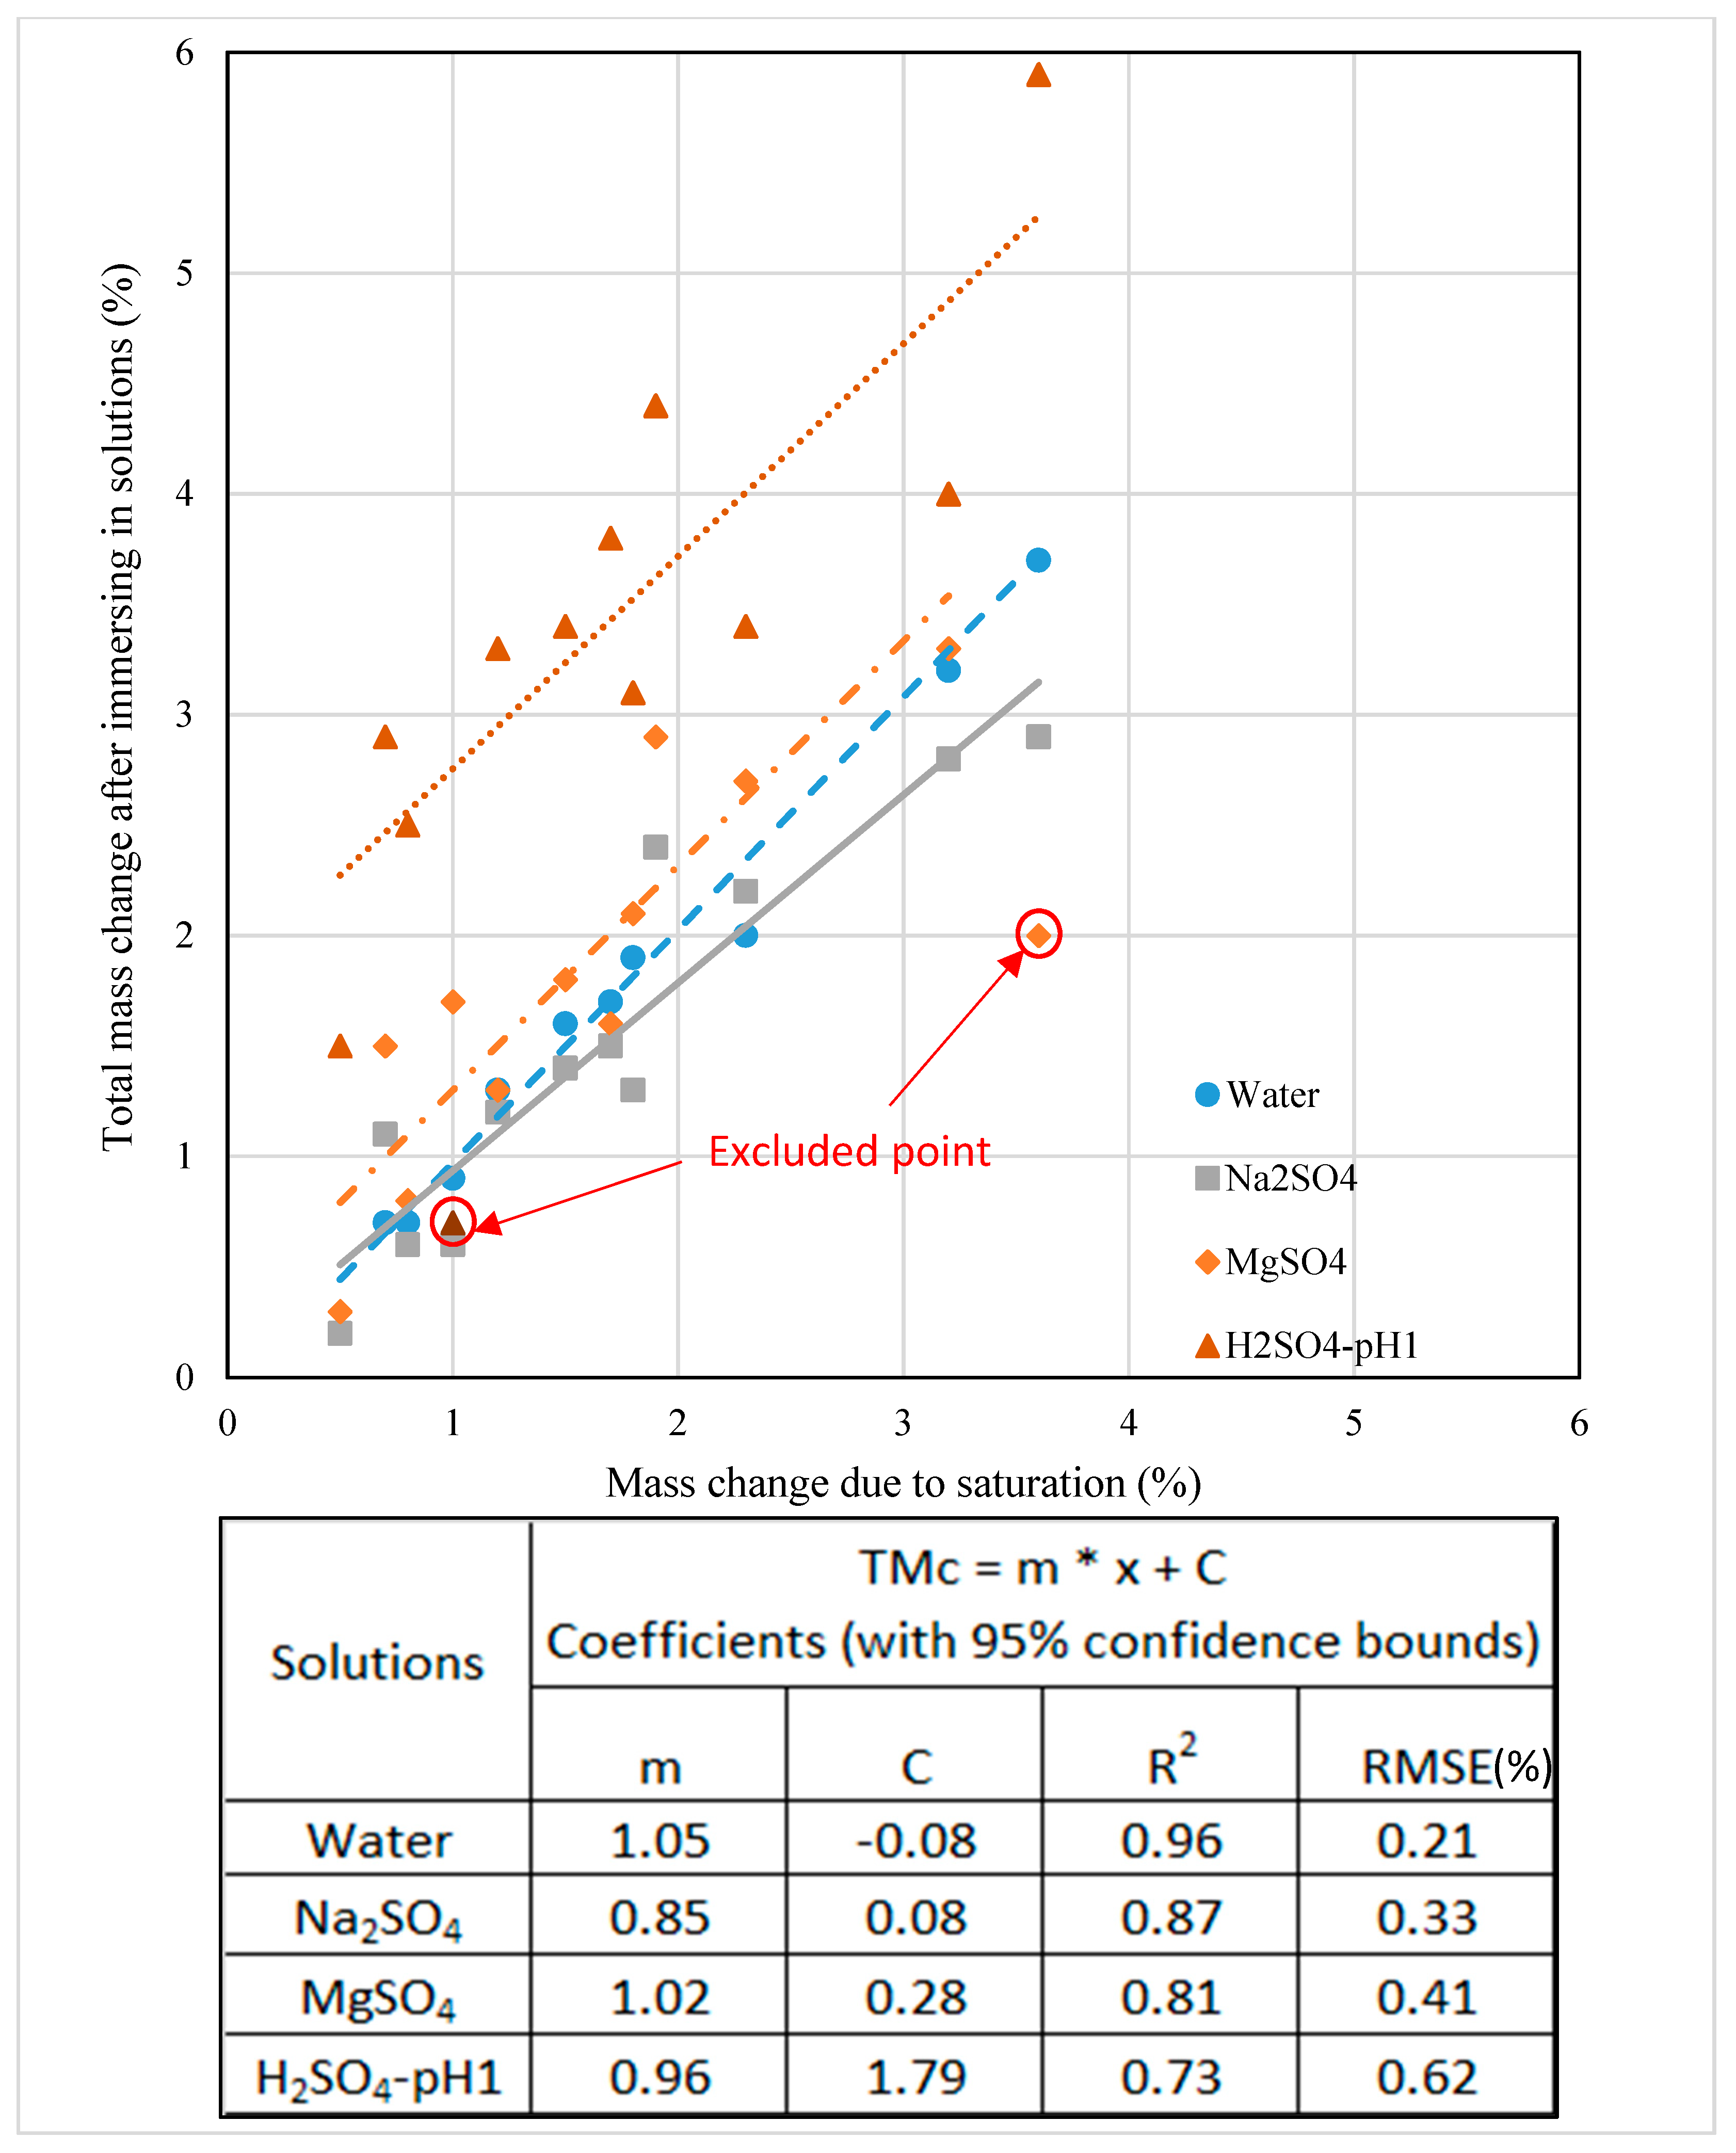
Figure 10.
Compressive strength change (%) against total mass change (%) after immersion in solutions.
Figure 10.
Compressive strength change (%) against total mass change (%) after immersion in solutions.

Figure 11.
Compressive strength change against total mass change after immersion in sulphuric acid.

Table 1.
Oxide composition and physical properties of GGBS and fly ash (Adapted from Ref. [12]).
Table 1.
Oxide composition and physical properties of GGBS and fly ash (Adapted from Ref. [12]).
| Precursor | Component (Mass% as Oxide) | Physical Properties | ||||||||
|---|---|---|---|---|---|---|---|---|---|---|
| SiO2 | Al2O3 | CaO | Fe2O3 | MgO | Others | LOI | Fineness ≥ 45 μm | Particle Density | Water Absorption | |
| GGBS | 35.7 | 11.2 | 43.9 | 0.3 | 6.5 | 2.09 | 0.31 | 7.74% | 2.86 | 35.14% |
| Fly ash | 46.8 | 22.5 | 2.2 | 9.1 | 1.3 | 14.5 | 3.6 | 18.39% | 2.21 | 27% |
Table 2.
The details of two types of AAM concrete mixes and their properties.
| AAM Type | Mix | GGBS/PFA (kg/m3) | Ms (= SiO2/Na2O) | Na2O (%) | W/B | Sand (kg/m3) | Aggregate (kg/m3) | Slump (mm) | 2 Days Comp.St (MPa) | 28 Days Comp.St (MPa) | Dnssd (×10−12 m2/s) [12,15] |
|---|---|---|---|---|---|---|---|---|---|---|---|
| Group 1: AASC & (AA-S/F) concretes | GGBS 1 | 400/0 | 0.45 | 8 | 0.55 | 841 | 911 | 220 | 29.7 | 51.8 | 2.92 |
| GGBS 2 | 400/0 | 1.0 | 6 | 0.55 | 841 | 911 | 205 | 29.1 | 44.8 | 4.81 | |
| Blend 1 | 340/85 | 1.0 | 8 | 0.47 | 841 | 911 | 220 | 50.7 | 74.9 | 2.37 | |
| Blend 2 | 170/255 | 0.45 | 8 | 0.44 | 841 | 911 | 230 | 14.3 | 45.5 | 5.24 | |
| Group 2: AASC | 1 | 400/0 | 0.45 | 4 | 0.60 | 669 | 1004 | 215 | 15.3 | 26.4 | 4.11 |
| 2 | 400/0 | 0.45 | 4 | 0.55 | 701 | 1051 | 168 | 17.8 | 30 | 5.09 | |
| 3 | 400/0 | 0.45 | 6 | 0.60 | 669 | 1004 | 215 | 21.2 | 35.8 | 4.74 | |
| 4 | 400/0 | 0.45 | 6 | 0.55 | 701 | 1051 | 135 | 24.7 | 44 | 1.87 | |
| 5 | 400/0 | 0.45 | 8 | 0.55 | 701 | 1051 | 225 | 38.4 | 53.6 | 2.92 | |
| 6 | 400/0 | 1.0 | 4 | 0.55 | 701 | 1051 | 160 | 25.8 | 47.8 | 2. 34 | |
| 7 | 400/0 | 1.0 | 6 | 0.55 | 701 | 1051 | 203 | 33.9 | 62.7 | 3.81 | |
| 8 | 400/0 | 1.0 | 8 | 0.55 | 701 | 1051 | 240 | 33.7 | 64.4 | 4.37 |
Publisher’s Note: MDPI stays neutral with regard to jurisdictional claims in published maps and institutional affiliations. |
© 2022 by the authors. Licensee MDPI, Basel, Switzerland. This article is an open access article distributed under the terms and conditions of the Creative Commons Attribution (CC BY) license (https://creativecommons.org/licenses/by/4.0/).
Share and Cite
MDPI and ACS Style
Bondar, D.; Nanukuttan, S. External Sulphate Attack on Alkali-Activated Slag and Slag/Fly Ash Concrete. Buildings 2022, 12, 94. https://doi.org/10.3390/buildings12020094
AMA Style
Bondar D, Nanukuttan S. External Sulphate Attack on Alkali-Activated Slag and Slag/Fly Ash Concrete. Buildings. 2022; 12(2):94. https://doi.org/10.3390/buildings12020094
Chicago/Turabian StyleBondar, Dali, and Sreejith Nanukuttan. 2022. "External Sulphate Attack on Alkali-Activated Slag and Slag/Fly Ash Concrete" Buildings 12, no. 2: 94. https://doi.org/10.3390/buildings12020094
Note that from the first issue of 2016, this journal uses article numbers instead of page numbers. See further details here.