An In-Situ LSCM Study on Bainite Formation in a Fe-0.2C-1.5Mn-2.0Cr Alloy


1
Faculty of Aerospace Engineering, Delft University of Technology, 2629 HS Delft, The Netherlands
2
Department of Materials Science and Engineering, Delft University of Technology, 2628 CD Delft, The Netherlands
3
Institute of Mechanics, Montanuniversität Leoben, Franz-Josef-Str. 18, 8700 Leoben, Austria
4
School of Materials Science and Engineering, Tsinghua University, Beijing 100084, China
*
Author to whom correspondence should be addressed.
Metals 2018, 8(7), 498; https://doi.org/10.3390/met8070498
Submission received: 28 May 2018
/
Revised: 12 June 2018
/
Accepted: 26 June 2018
/
Published: 28 June 2018
Abstract
:Direct microscopic observation of the isothermal bainite evolution in terms of nucleation events, the location of the nuclei, as well as their growth is very valuable for the refinement of models predicting the kinetics of bainite transformation. To this aim, the microstructural evolution in a Fe-0.2C-1.5Mn-2.0Cr alloy during isothermal bainite formation at temperatures between 723 K and 923 K is monitored in situ using high temperature laser scanning confocal microscopy (LSCM). Both the nucleation and the growth kinetics of the bainitic plates are analyzed quantitatively. Bainitic plates are observed to nucleate on three different types of locations in the grain: at austenitic grain boundaries, on newly-formed bainite plates and at unspecific sites within the austenite grains. Grain boundary nucleation is observed to be the dominant nucleation mode at all transformation temperatures. The rate of nucleation is found to vary markedly between different austenite grains. The temperature dependence of the average bainite nucleation rate is in qualitative agreement with the classical nucleation theory. Analysis of plate growth reveals that also the lengthening rates of bainite plates differ strongly between different grains. However, the lengthening rates do not seem to be related to the type of nucleation site. Analysis of the temperature dependence of the growth rate shows that the lengthening rates at high temperatures are in line with a diffusional model when a growth barrier of 400 J mol−1 is considered.
1. Introduction
The wish for better performing automobiles with improved fuel efficiency, low CO2 emission, crashworthiness and rigidity has directed the automotive industry’s efforts towards the adoption of advanced high strength steels (AHSS) as the primary structural material. AHSS offer the opportunity to create cost-effective and light-weight car body structures with improved crash worthiness [1,2,3]. The AHSS steels are compositionally relatively simple C-Mn-based steels having rather different microstructures as a result of different complex multistep thermomechanical treatments. The first generation of AHSS (1st Gen AHSS) includes dual phase (DP), transformation-induced plasticity (TRIP), complex-phase (CP) and martensitic (MART) steels with a high allotriomorphic ferrite fraction. The second generation of AHSS (2nd Gen AHSS) includes twinning-induced plasticity (TWIP), Al-rich lightweight steels (L-IP®) and shear band-strengthened steels (SIP) containing a mass fraction of Mn of about 20%. These 2nd Gen AHSS display significantly higher strength values compared to the 1st Gen AHSS. The third generation AHSS (3rd Gen AHSS) show even better strength-ductility combinations at lower costs [4,5,6,7]. Their attractive mechanical properties are due to the presence of a high volume fraction of retained austenite, which is stabilized by increasing the Mn content [8,9,10,11]. The occurrence of high volume fractions of retained austenite in the microstructure is realized by specific thermal processing routes and fine tuning of the Mn concentration. A key feature of these multi-phase steels is their primarily bainitic microstructure containing retained austenite volume fractions between 10 and 30% [12] at overall Mn concentrations between 1.5 and 8 mass% [13,14,15,16,17,18,19]. The 3rd Gen AHSS family includes the so-called medium Mn steels, to which the steel to be researched in this publication belongs. Intercritical annealing treatments at isothermal bainite transformation temperatures form the basis for the desired multi-phase bainite-austenite microstructures. In view of its technological importance, significant research efforts have been made to tailor the amount, morphology and stability of retained austenite after cooling [20,21,22,23,24] in relation to the preceding bainite formation. Predicting the kinetics of the bainite transformation by means of numerical models is a goal not only of academic, but also of significant industrial interest, since the austenite-bainite microstructure formed during intercritical annealing determines the mechanical properties of the steel.
The kinetics of bainite formation has been studied extensively for decades since the first observation of the microstructure by Davenport and Bain in the 1930s [25,26]. Due to the wide temperature range in which such bainitic microstructures form, its transformation kinetics is a complex phenomenon consisting of coupled dissipative processes. It is thus a challenging task to describe and predict the transformation kinetics. Currently, two schools of thought exist that provide different explanations for the physical mechanism through which bainite evolves, and the topic has been under debate for many decades [27,28,29,30,31,32,33,34,35,36,37,38,39,40,41,42,43,44]. While it is not the purpose of this paper to enter into this controversy, the concepts of both models are considered to be relevant for the interpretation of our observations. The diffusional approach, first formulated by Aaronson [45], explains the formation of bainite as a ferrite ledge growth mechanism, which involves reconstructive ferrite and cementite formation. The kinetics is governed by the movement of the austenite-ferrite interface, which depends on the interactions of constituent alloying elements in the iron lattice. The displacive school of thought, on the other hand, considers a diffusionless nucleation and growth of so-called bainitic sub-units to be the crucial formation mode. Growth is assumed to occur by successive nucleation of new sub-units. The overall kinetics is thus controlled by nucleation events since the growth of sub-units is a very fast process [46]. Both schools succeeded in modelling the overall transformation kinetics based on their own perception of the dominant bainite formation mechanism [46,47,48,49,50,51,52,53,54,55,56,57,58,59], without paying much attention to the actual microstructure evolution and its relation to the initial austenitic microstructure.
Given the importance of correctly modelling the austenite to bainitic ferrite transformation kinetics for designing suitable multiphase microstructures, in situ methods are applied to observe the evolution of microstructural features in real time. Conventional metallography is the classical method to investigate bainite formation; however, this technique can only be used to observe post mortem microstructures. While in situ optical observations of metallurgical transformation reactions using conventional microscopy were already made in 1952 [60], in recent years, in situ high temperature laser scanning confocal microscopy (HT-LSCM) has been used preferentially [61,62,63,64,65,66,67] because of its high sensitivity to the out-of-plane distortions at moving interfaces.
Xu et al. [65] quantitatively analyzed the austenite transformation rates by combining LSCM and dilatometry. Kolmskog et al. [62] also applied LSCM to directly observe isothermal bainite formation below the martensite start temperature. Dynamic LSCM imaging studies of the bainite evolution revealed a continuous lengthening of bainitic ferrite plates. Wan et al. [66] showed that the lengthening rate of the plates was constant with time irrespective of the nucleation location. Hu et al. [67] investigated the plate growth rates at low transformation temperatures in a super bainitic steel Fe-0.4C-2.81Mn-2.0Si (all in mass%) and also observed a constant lengthening rate. However, in contrast to the results presented in [64], they reported a dependency of the growth rates on the location of the nucleation site. Their study supported the diffusional growth hypothesis by semi-quantitatively validating their observations with the Zener-Hillert [68,69] and the Trivedi [70] model. Tian et al. [71] studied the same steel, but under different isothermal temperatures and reported a decrease in lengthening rate with decreasing temperature.
However, the past studies have focused only on quantifying the growth rate of bainitic plates, but did not pay attention to the variation of the growth rate. Some studies reported a variance in growth rate nucleating at different locations in the microstructure [67,71]. However, the nucleation aspect in the evolution of bainitic ferrite has rarely been measured and analyzed quantitatively. In this paper, in situ LSCM at a framing rate of 15 Hz is applied to directly observe the bainite phase transformation process in a typical Fe-0.2C-1.5Mn-2.0Cr (all in mass%) alloy. The dynamics of the bainite formation process, within the spatial and temporal resolution limits of LSCM, is quantified using a combination of manual and computer-aided image analysis techniques. This study reports on the bainitic nucleation and growth observed at different isothermal temperatures of 723 K, 773 K, 823 K and 923 K (450 °C, 500 °C, 550 °C and 650 °C). Nucleation and growth of bainitic plates has been analyzed quantitatively by distinguishing different nucleation sites and by comparing the bainite formation behavior in different grains. This latter aspect has not been addressed in previous bainite formation studies reported in the literature.
2. Experimental Procedure and Microstructure Measurement
The investigated material is a Fe-C-Mn-Cr alloy with the chemical composition listed in Table 1. Cold rolled cylindrical samples with a radius of 4 mm and a height of 5 mm were used, in which the highly-polished surface was perpendicular to the rolling direction.
In situ optical observation and recording of growing bainitic ferrite plates were done using a Yonekura VL 2000 DX HT-LSCM (Yonekura manufacturing Co., Ltd., Osaka, Japan) coupled with an SVF 17 SP mirror furnace. Details of the experimental setup can be found in Chen et al. [72]. Images of a region in the center of the sample (i.e., the thermally most homogeneous part of the sample) were video-recorded with a scanning frequency of 15 Hz. The temperature was recorded by a thermocouple. The applied combinations of austenitizing temperature and isothermal holding temperatures are listed in Table 1. The samples were typically austenitized for about 250 s and subsequently cooled from the austenitizing temperature to the bainitic holding temperature with a recorded cooling rate of 10–20 K/s.
The time-temperature-dependent microstructural changes observed by HT-LSCM measurements were analyzed after selecting representative large austenite grains showing the formation of multiple bainite plates. The austenite grains could be distinguished because of light thermal grooving at their grain boundaries. MATLAB’s image processing toolbox [73] (imtool) was used to isolate and quantify the bainite microstructure evolution from the recorded images, such as that shown in Figure 1. Each pixel size corresponds to ~0.23 μm, which sets the resolution of the analysis. Although the real nucleus size must be much smaller than the minimal detectable feature dimension, the detection of the earliest features of a particular bainite plate at ~0.6 μm recorded at this resolution is taken as the nucleation event. To analyze plate growth, temporal measurements of individual plates were performed to obtain plate growth rates using MATLAB’s imtool. The lengthening rate of individual bainitic plates was determined by linear regression yielding typical high correlation coefficients (R2 > 0.95) indicative of a constant growth rate within experimental accuracy. The plate growth rate (v) is then the slope of the fitted line. In some cases, where overall linear fitting would not yield a good fit, linear fitting was done in sub-growth stages to get a good fit. For plates with distinct stages of growth, the overall plate growth rate was calculated by averaging in the following way:
where vi and are the velocity and time period of stage i, respectively.
Complementary to HT-LSCM experiments, bainite formation in this steel was also studied using a Bähr DIL 805A/D dilatometer. Although results of these two experimental approaches were qualitatively comparable, due to significant differences in the temperatures at which comparable macroscopic bainite formation rates were obtained, only the results of HT LSCM are presented. As discussed in ref. [74], these differences can be caused by an uncertainty in the exact sample temperature in the LSCM and/or possible surface decarburization of the sample in the LSCM setup.
3. Results
3.1. Nucleation
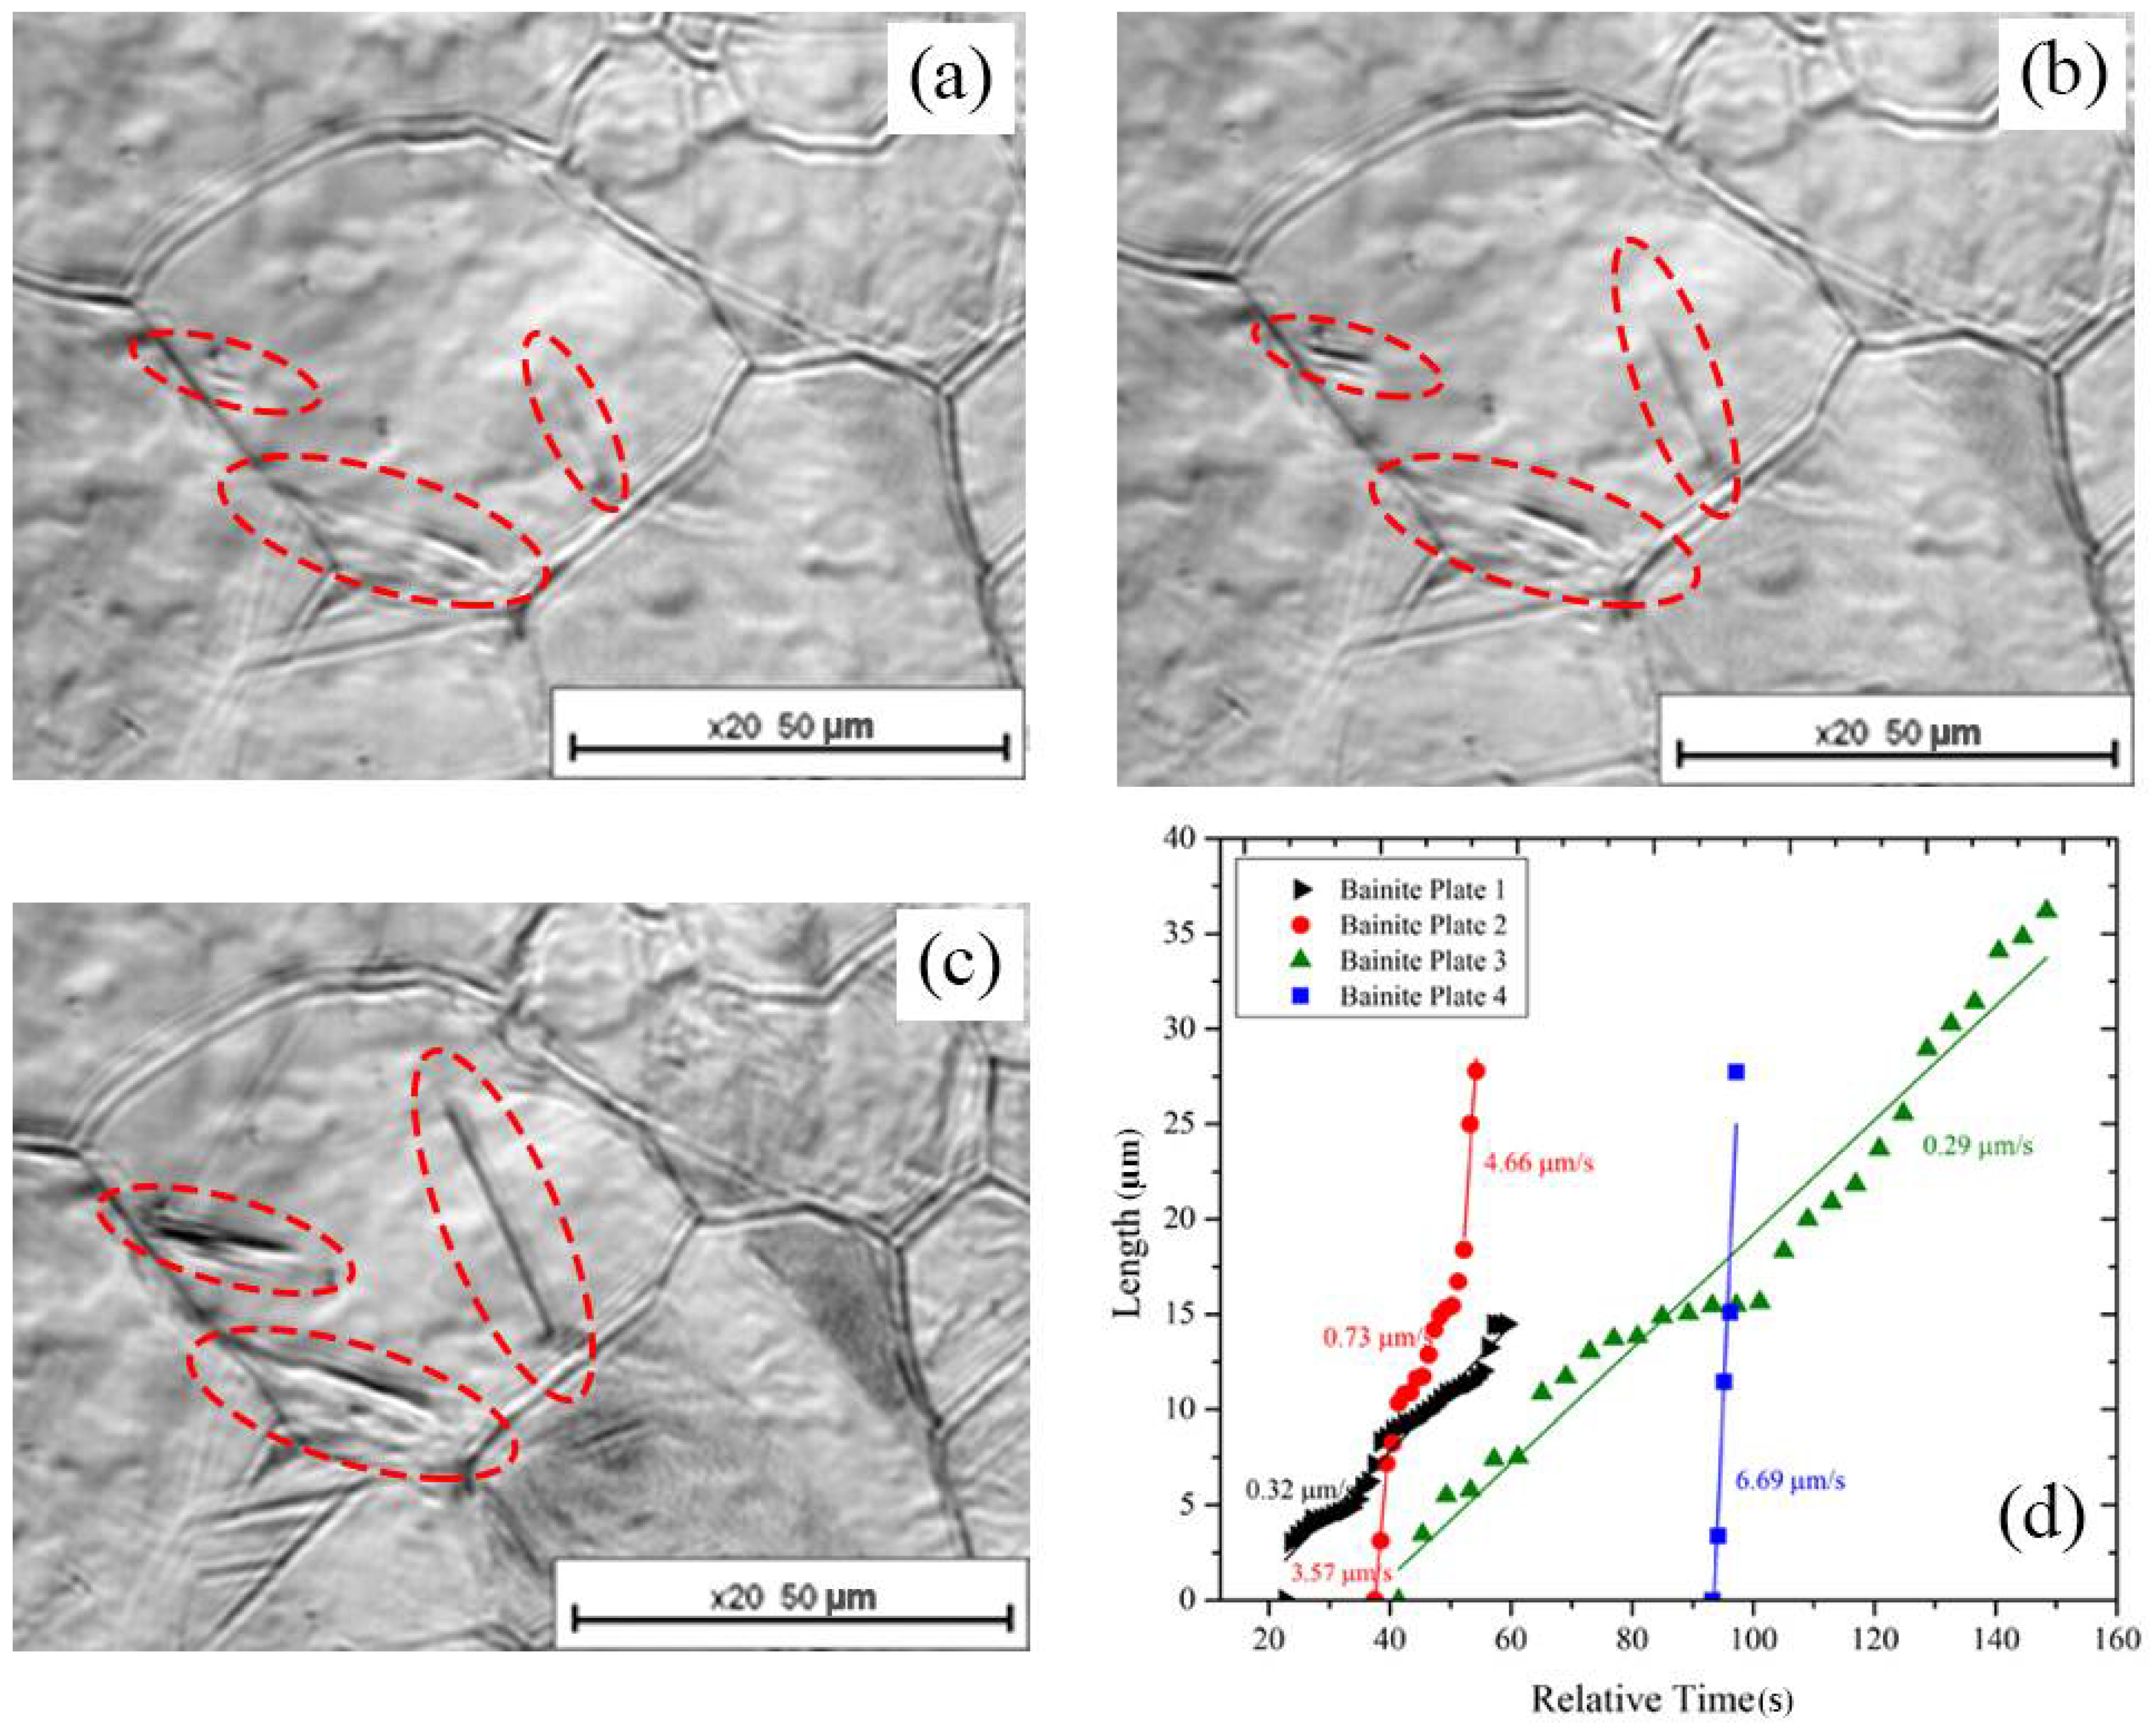
In this section, quantitative results of the in situ nucleation events of bainitic plates during austenite to bainite transformation as observed with HT-LSCM are presented. The bainite plates were observed to nucleate and grow during cooling, as well as during the subsequent isothermal holding stage. Nucleation was found to take place (a) at the grain boundary; (b) in the grain interior at the side of a recently-formed bainite plate and (c) in the grain interior at a location not showing any specific feature. Characteristic examples are shown in Figure 2. The occurrence of bainite formation at these specific locations has also been reported previously [67].
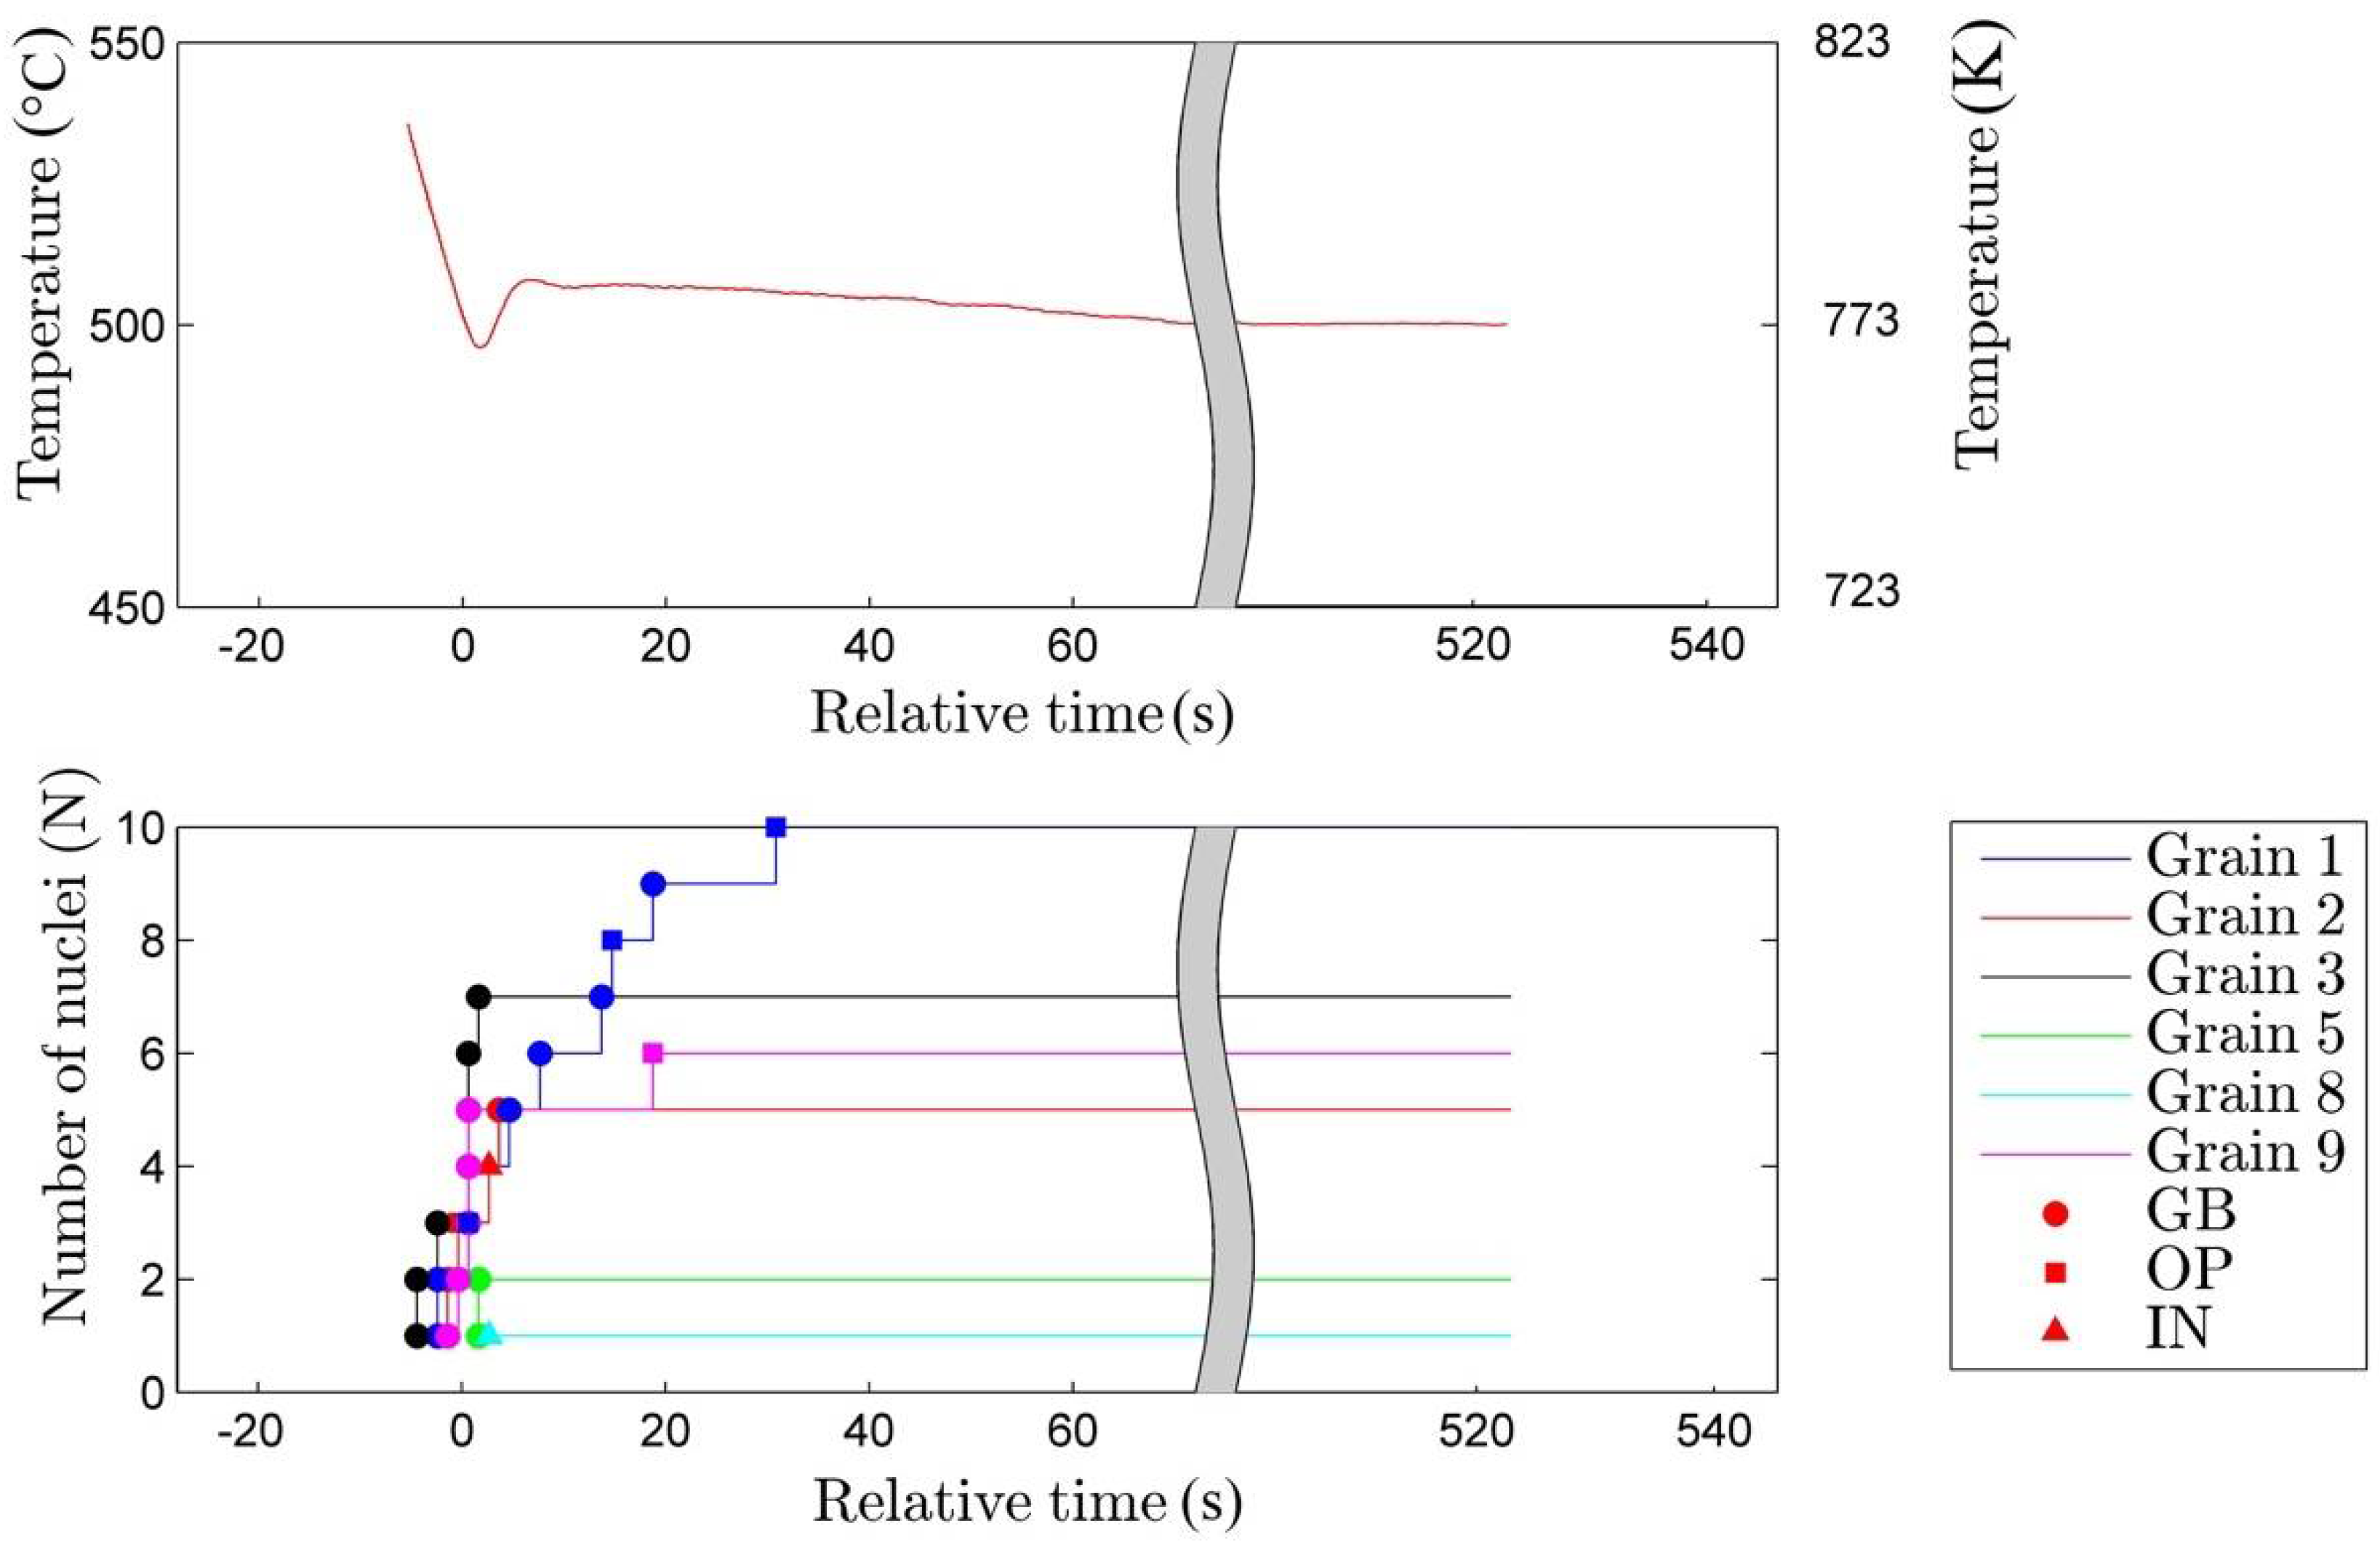
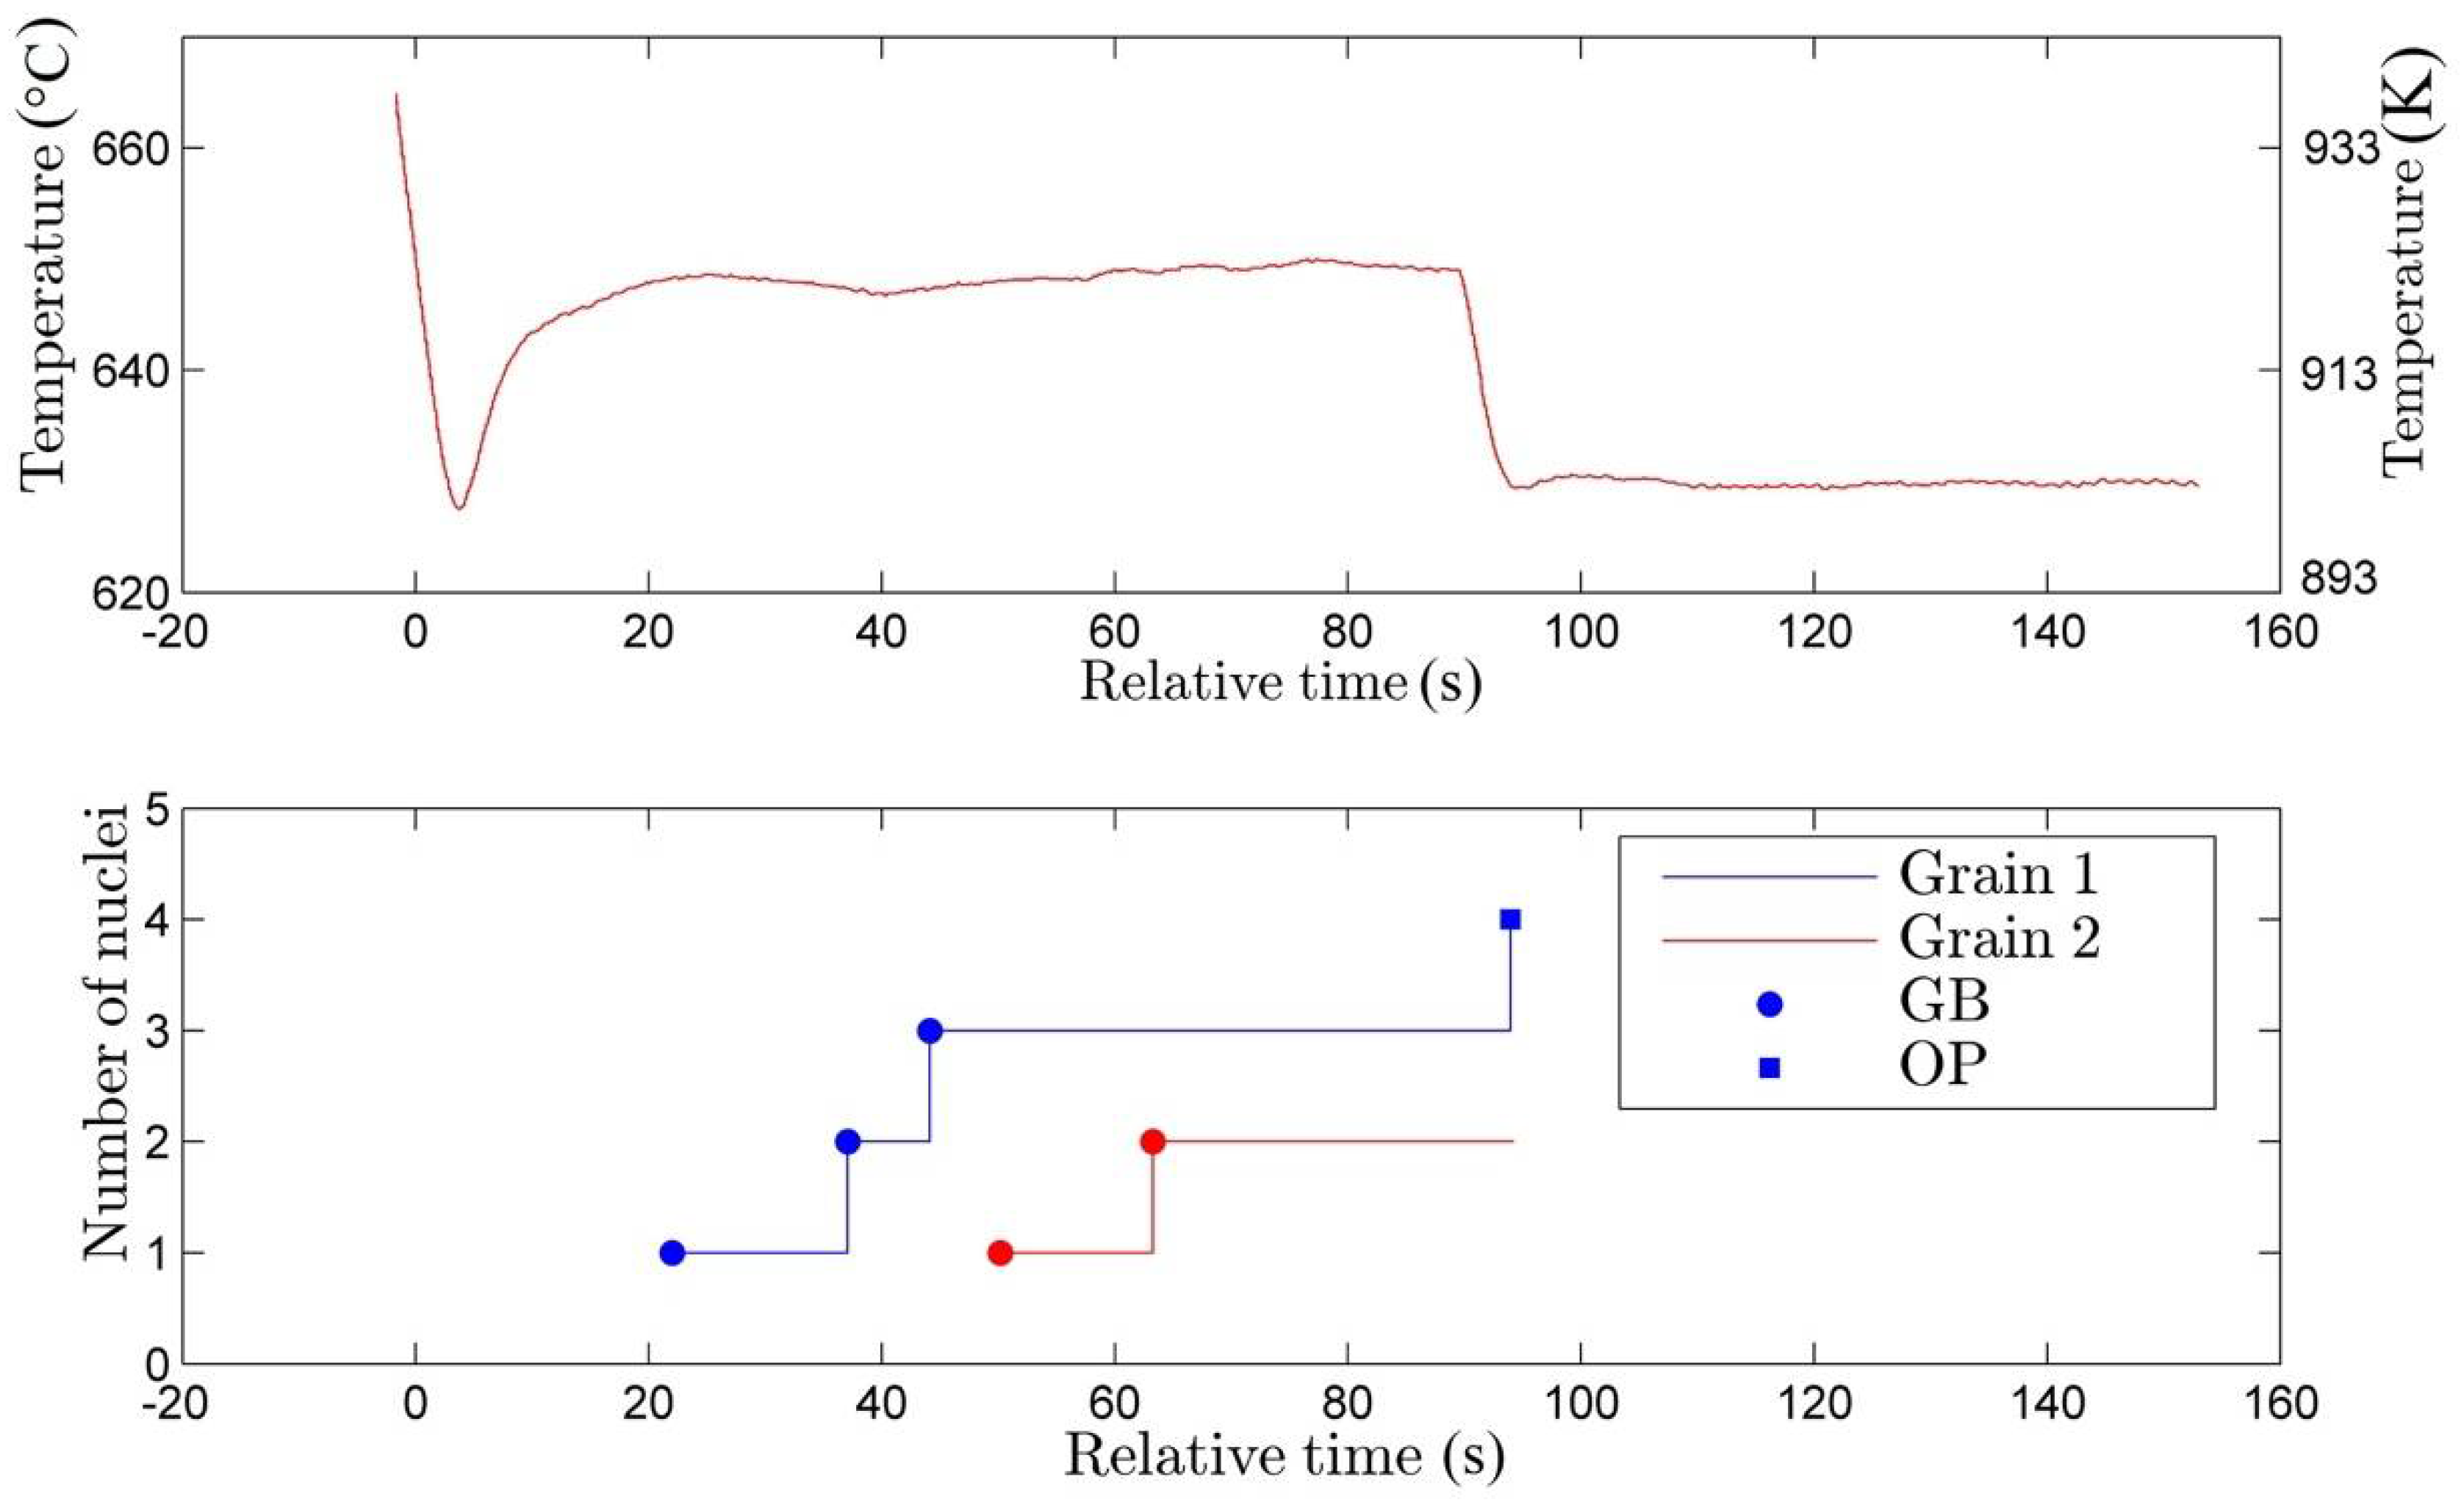
In our data analysis, each nucleation event is characterized by its type of nucleation site, the moment of first observation (the apparent nucleation time), the actual temperature and, finally, by the (numbered) grain in which nucleation occurs. The quantitative data concerning the nucleation events as observed in four separate samples of the same steel transformed at different isothermal holding treatments at 723 K, 773 K, 823 K and 923 K (450 °C, 500 °C, 550 °C and 650 °C) are presented in Figure 3, Figure 4, Figure 5 and Figure 6, respectively. The austenitizing temperatures used for each transformation temperature are listed in Table 1. The austenization time was kept constant at 250 s. The bainite formation-relevant part of the time-temperature profile is presented in Figure 3, Figure 4, Figure 5 and Figure 6. The time marked ‘zero’ in each graph refers to the time at which the isothermal temperature was reached first. Different symbols have been used to indicate the three distinct types of nucleation sites:
- (i)
- nucleation on the grain boundary (●)
- (ii)
- nucleation on the surface of an existing bainite plate (■)
- (iii)
- nucleation occurring inside the austenitic grain (▲).
No bainite nucleation was observed prior to the shortest indicated time, and no further bainite formation was observed after the longest time indicated in each figure.
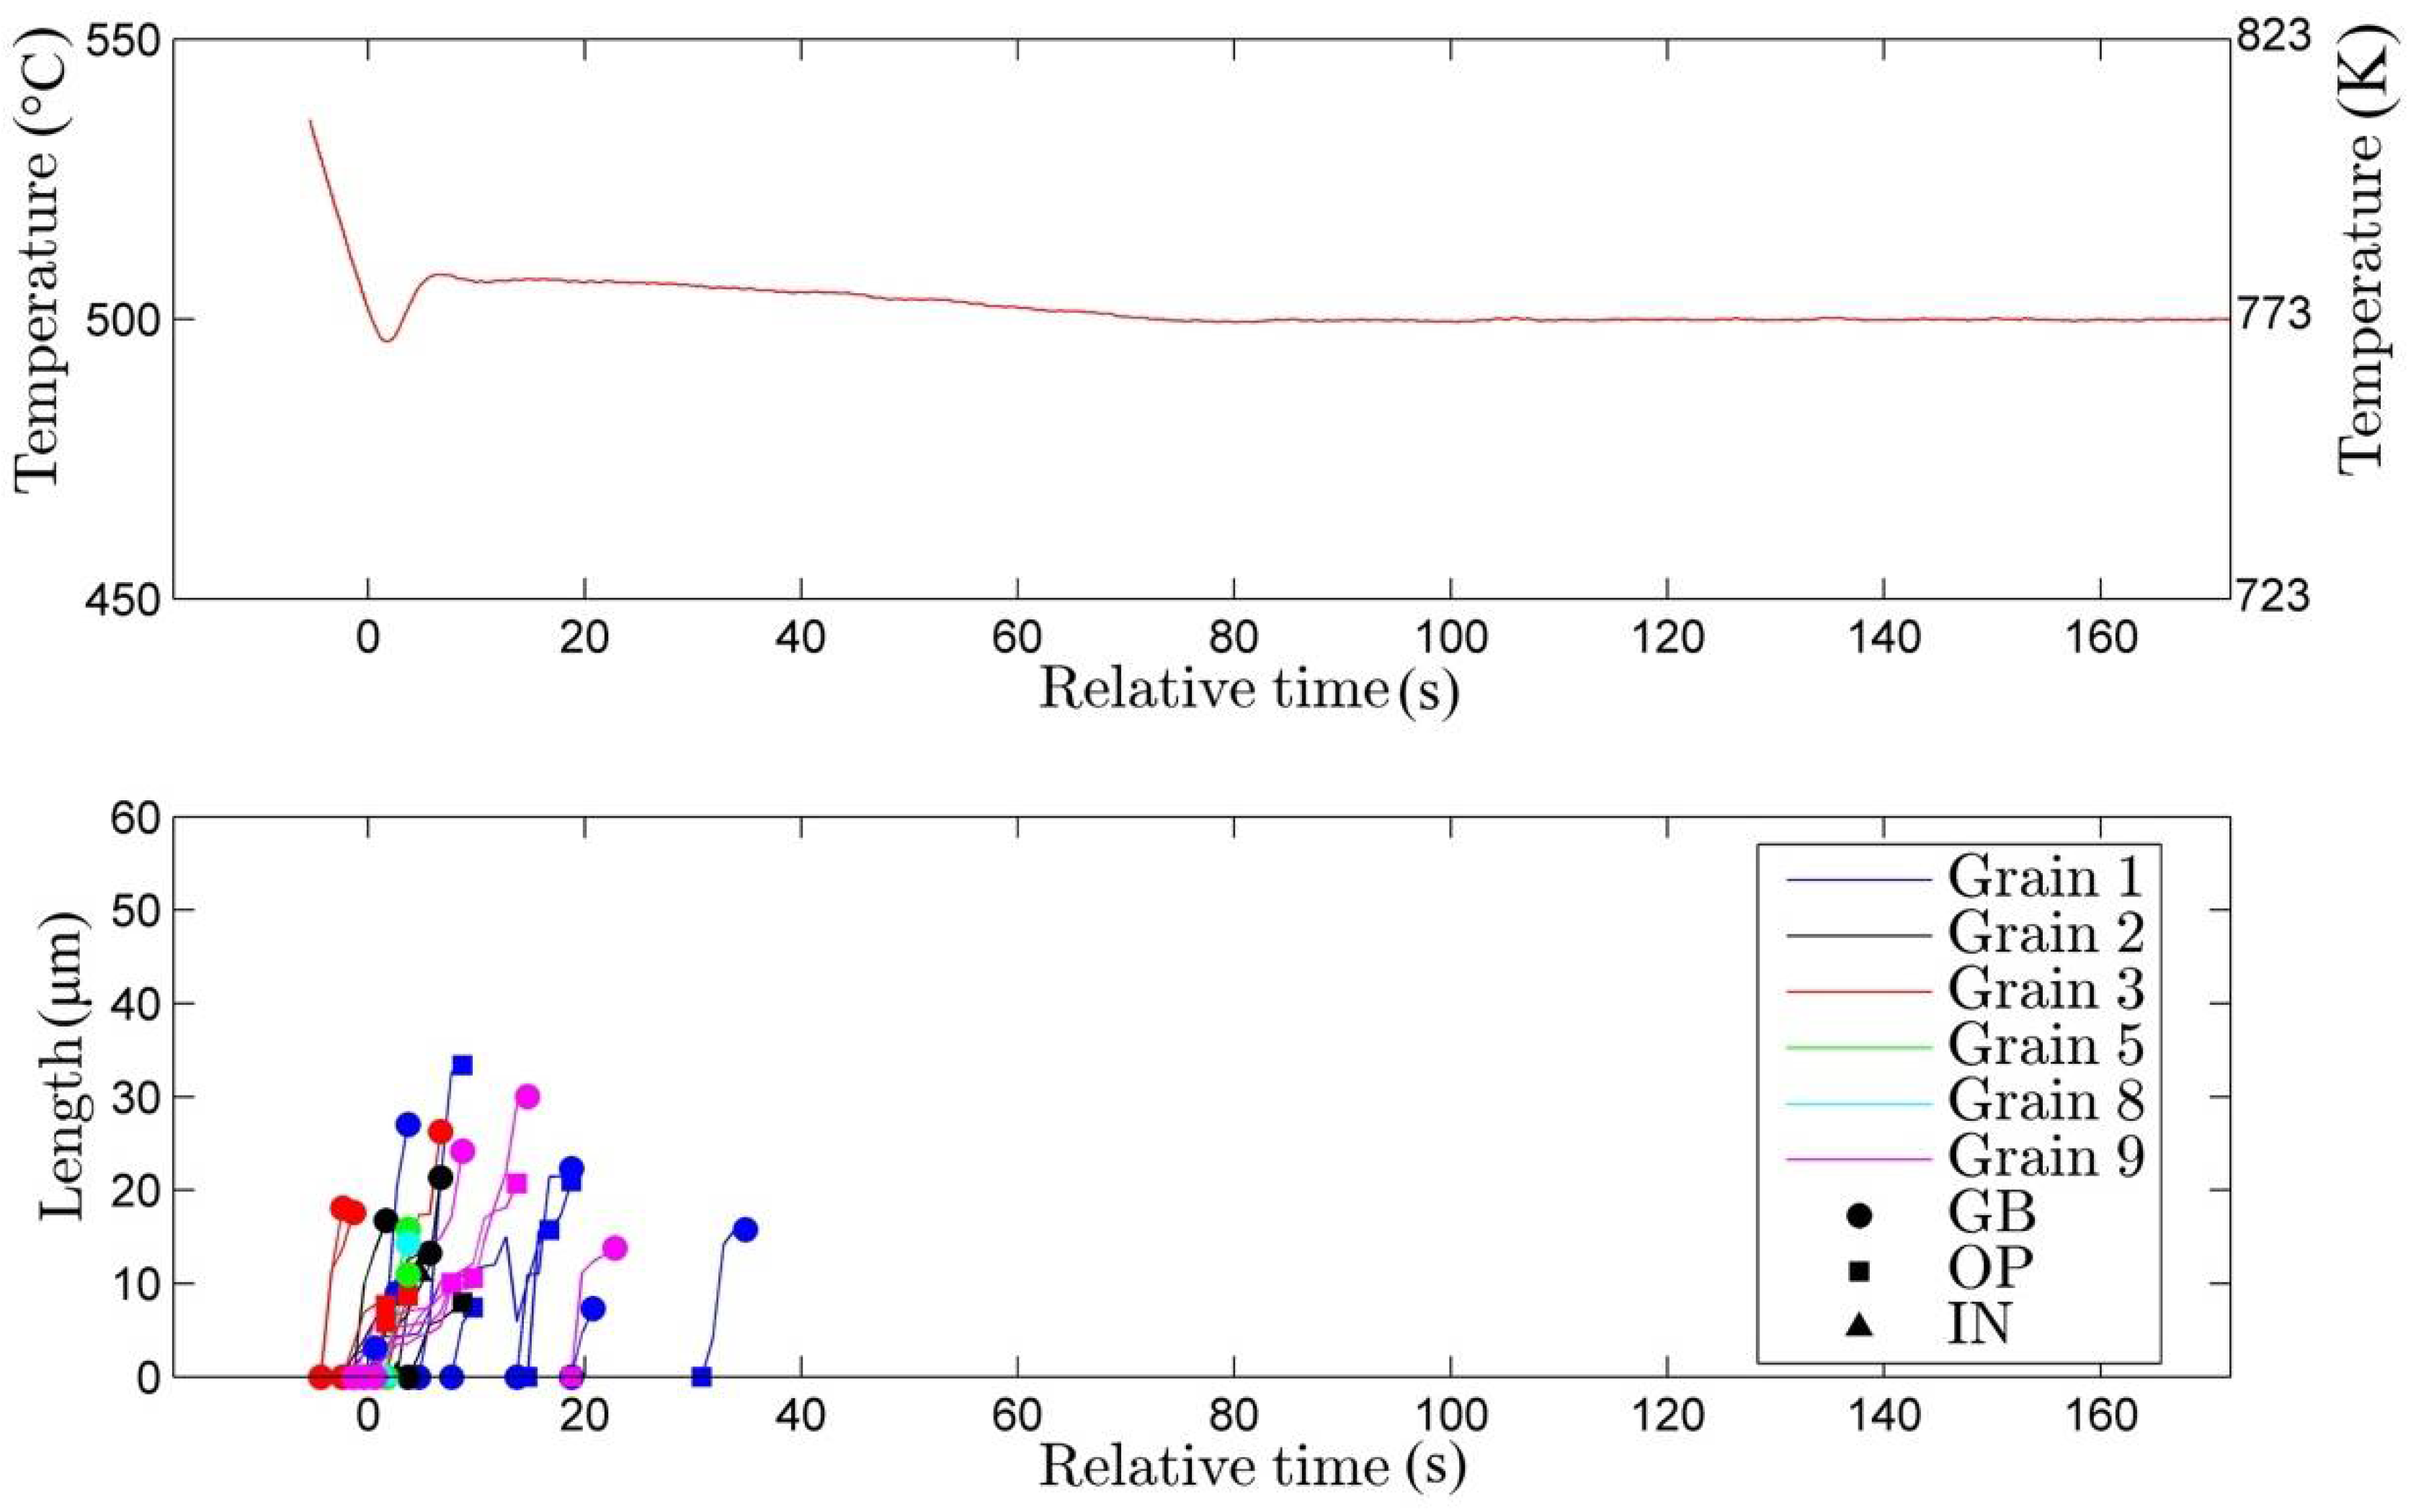
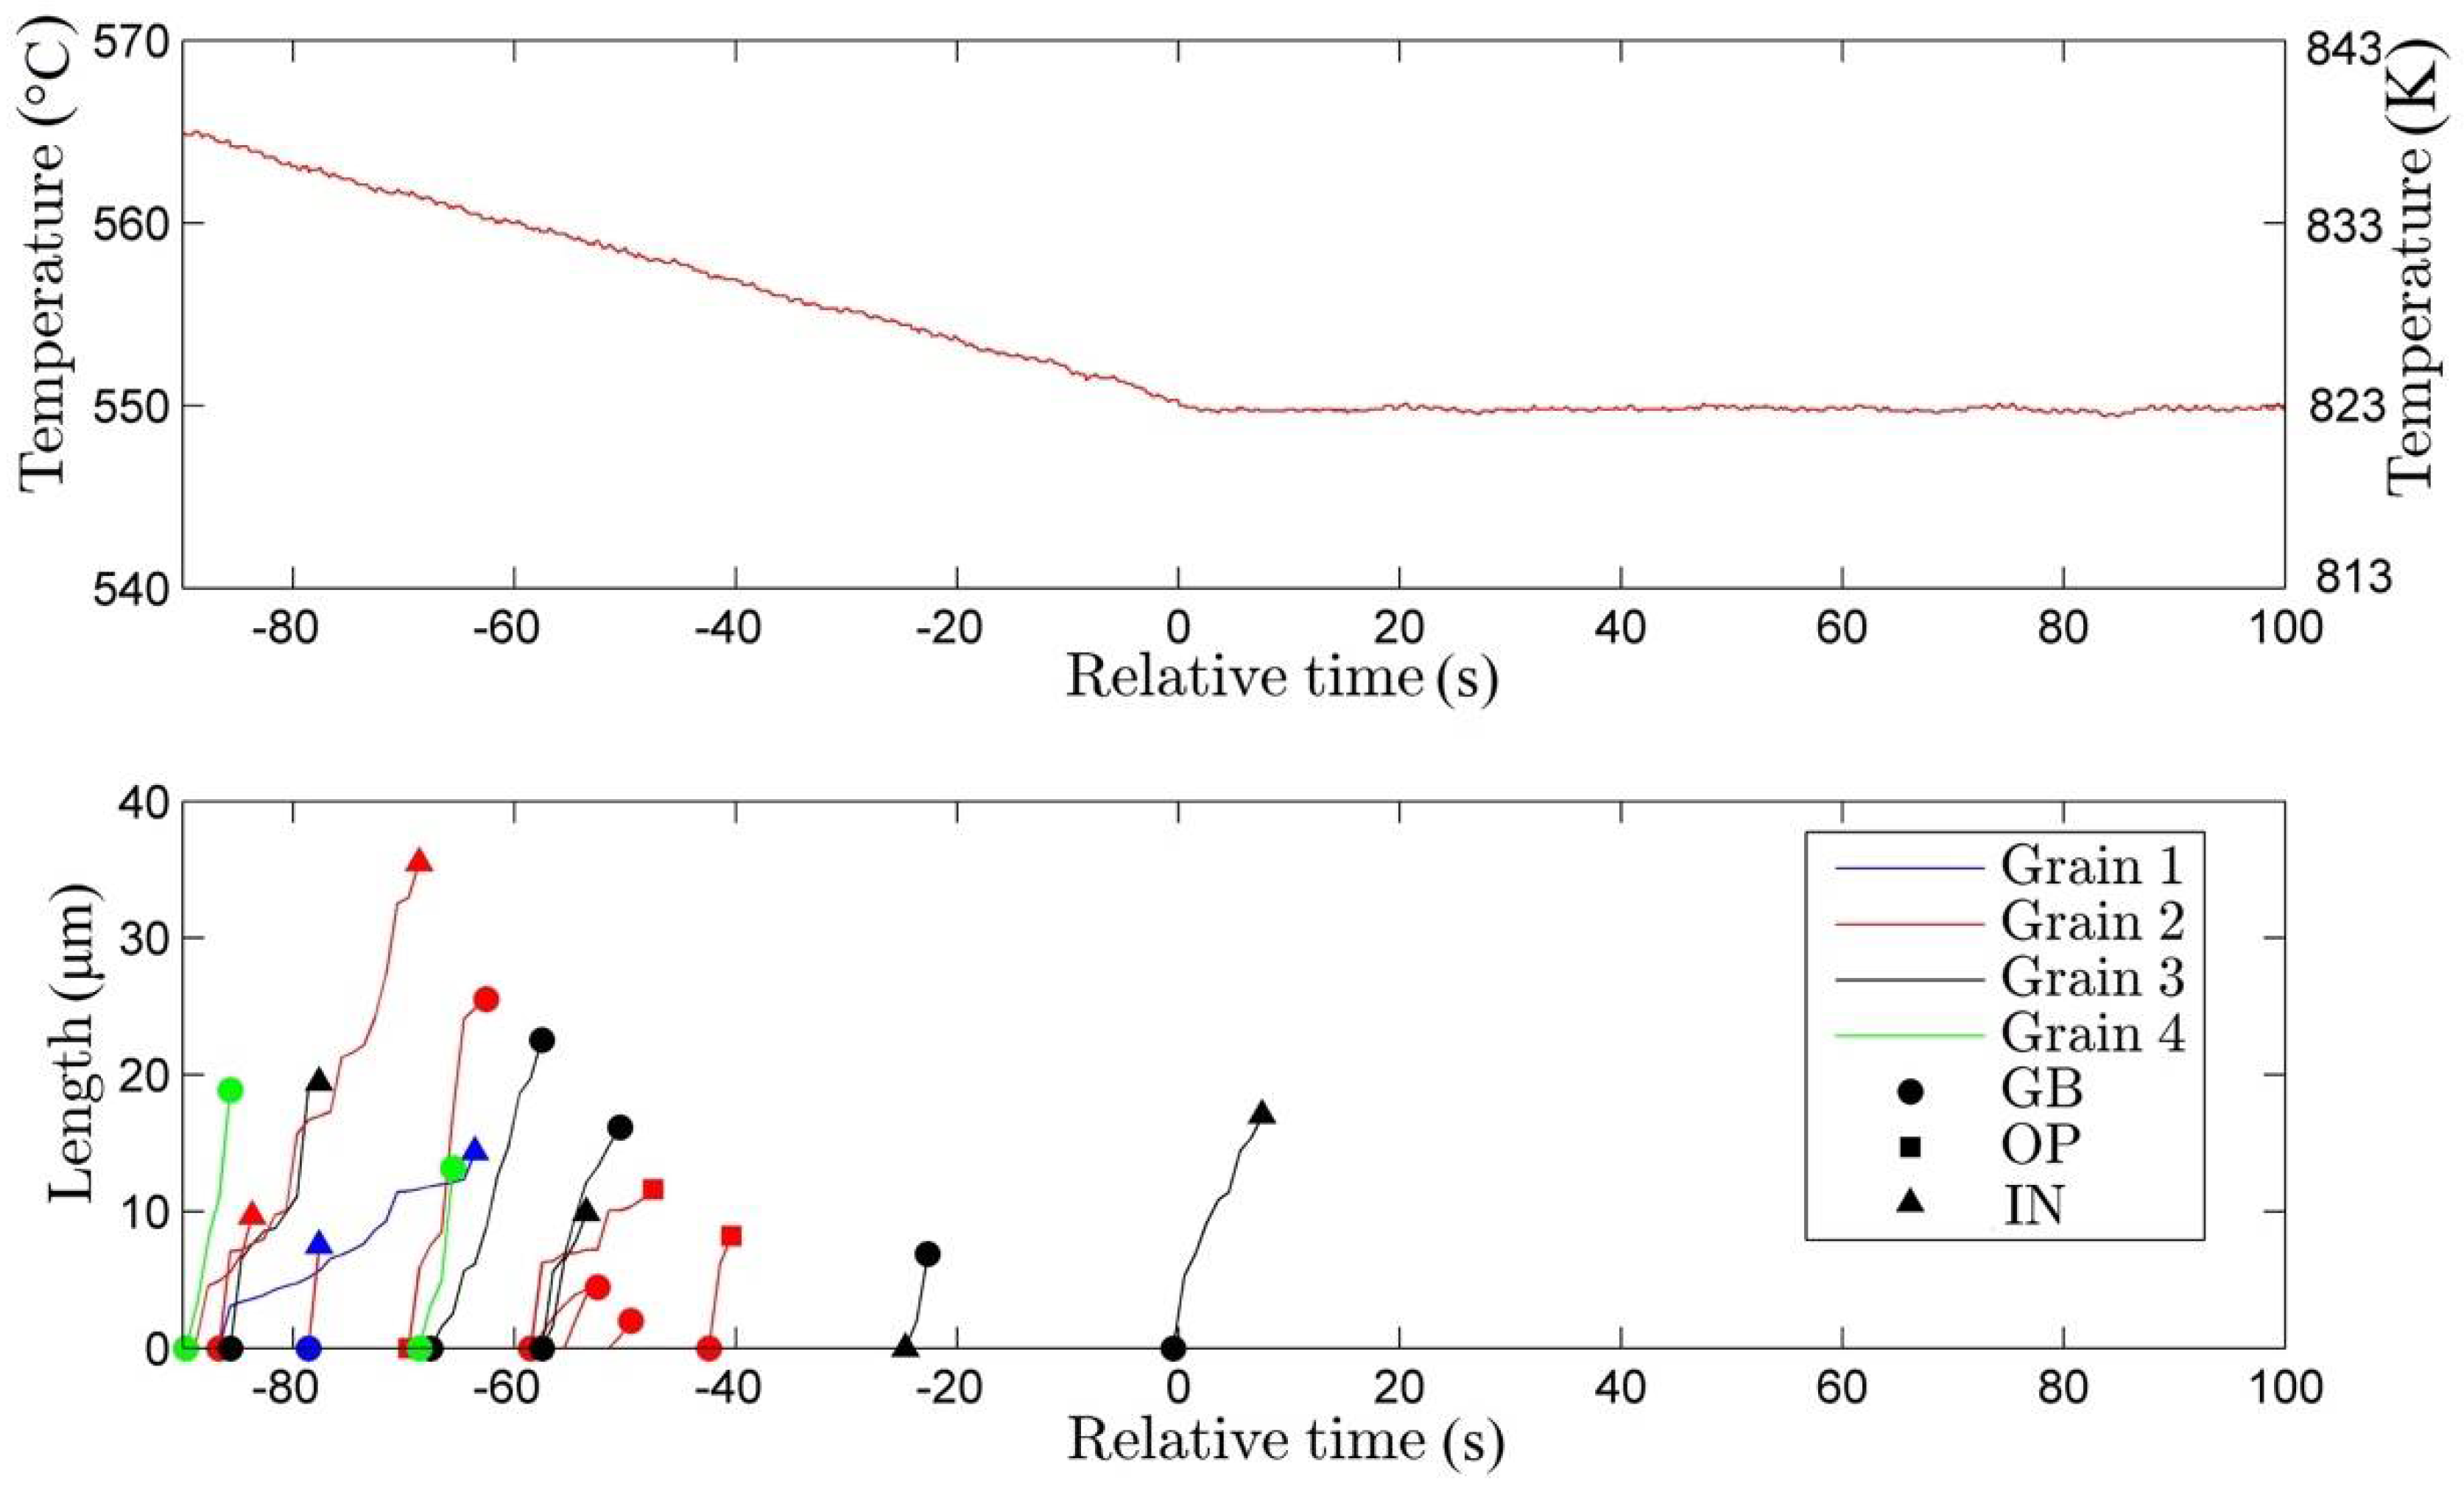
Bainitic ferrite plates were observed to nucleate predominantly on grain boundaries during the onset of the transformation. As the transformation proceeds, new plates are also observed to nucleate on previously-formed ones. It was observed that some new plates emerged from within the matrix, i.e., without any microstructural ‘reason’ in a few cases. They have been indexed as ‘internal’. All of these so-called ‘internal nucleation events’ took place near an existing plate or near a grain boundary. It is thus very likely that such a plate may have nucleated at grain boundaries or plate surfaces in the bulk of the material and what we observe is the plate emerging from the interior on the surface.
The majority of nucleation events were observed to take place during cooling to the holding temperature or at early stages of the isothermal holding at T = 723 K (450 °C) (Figure 3), T = 773 K (500 °C) (Figure 4) and T = 823 K (550 °C) (Figure 5), respectively. No new nucleation was observed during the later stages of the isothermal holding stage. In contrast, nucleation occurred only during the whole isothermal holding stage for holding at T = 973 K (650 °C) (Figure 6).
Although all the imaged grains in a particular sample by default were exposed to exactly the same thermal history, both the total number of bainite nucleation events per grain and the time window during which nucleation took place varied significantly between grains. For example, for the isothermal experiment at T = 723 K (450 °C) (Figure 3), 13 bainitic plates were formed within about 20 s in Grain 4, but only three nucleation events in 22 s were recorded for Grain 1. For the experiment at T = 773 K (500 °C) (Figure 4), 10 plates formed within 35 s in Grain 1, while only one plate formed in Grain 8; For the experiment at T = 923 K (550 °C) (Figure 5), eight plates nucleated over 45 s in Grain 2, while only two plates nucleated over 20 s in Grain 4, and six plates nucleated over 85 s in Grain 3. For the experiment at T = 1023 K (650 °C), four plates nucleated over 75 s in Grain 1, while only two nucleated in 13 s in Grain 2.
Both the total number of bainitic plates that nucleated in each experiment and the time window Δt of total nucleation events, i.e., the time difference between the first and last nucleation event, were found to depend on the degree of undercooling (ΔT). For the experiment at T = 723 K (450 °C), nucleation of new bainitic plates stopped 28 s after formation of the first bainitic plate, while at T = 923 K (650 °C), nucleation continued for about 75 s. In addition, the total number of nuclei formed in the different grains was higher at lower transformation temperatures, i.e., bainite formation is more rapid at higher degrees of undercooling.
3.2. Growth
The growth of individual bainitic plates was investigated by measuring the plate lengths from images separated by 1 s in time (i.e., only a fraction of all the images collected at a rate of 15 Hz was used). Figure 7a–c shows three individual images for the experiment at T = 923 K (650 °C). The corresponding plate lengths as a function of time are shown in Figure 7d. The plate growth rates are determined by linear regression, and the corresponding fit lines are also plotted in Figure 7d. It is observed that some plates grow at different rates at different stages of their evolution. In these cases, the velocities of distinct stages are obtained from piecewise linear regression. As shown in Figure 7d, Plate 4 (not contained in Figure 7a–c) first grew at 3.57 μm/s followed by a slower lengthening rate of 0.43 μm/s and then continued at a speed of 4.66 μm/s until it stopped growing abruptly.
The results of all plate lengthening measurements are reported in Figure 8, Figure 9, Figure 10 and Figure 11 for isothermal holding at 723 K, 773 K, 823K and 923 K (450 °C, 500 °C, 550 °C and 650 °C), respectively. In each figure, the relevant stage of the time-temperature profiles is also plotted. Time is set to zero at the onset of isothermal holding. For each plate, the length evolution is indicated by a line drawn through the data points taken at 1-s intervals. The symbol at the start of the line indicates the type of nucleation site (GB, on a plate (OP) or internal with no clear initiation source (IN). The symbol at the end of the line section indicates the microstructural feature at which the plate stopped (GB, OP or IN where IN may also be a topological defect on the surface other than a grain boundary or bainitic plate).
Various combinations of types of nucleation sites and termination sites can be distinguished. Plates that formed at the initial stage of the transformation generally started from the grain boundary and grew until their growth was stopped by impingement with another segment of the grain boundary. Plates that started growing at later stages were also stopped due to previously-formed plates, and thus, these plates grew to a shorter length than the ones formed at the initial stages. No cases of bainite growth continuing in the neighboring grain after impacting a grain boundary were observed. As can also be seen from Figure 8, Figure 9, Figure 10 and Figure 11, most plates stopped due to impingement with either a grain boundary or another bainitic plate. In only very few cases did the bainitic transformation stop within a grain without any microscopically-detectable reason. The plate thickening or widening rates were observed to be slower than the lengthening rates, yet the kinetics could not be quantified due to the limited spatial resolution in the LSCM images and the less clearly-defined boundary. There were no indications that the plate widening was also interrupted due to interactions with other local features or distortions in the microstructure.
The observed lengthening rate of individual plates in a particular experiment showed some variation from plate to plate and between different grains, but overall, the lengthening rates were found to be approximately in the same order of magnitude; see Figure 8, Figure 9 and Figure 10. In contrast, the lengthening rates scattered largely for the highest transformation temperature (Figure 11). In general, a shorter time window for growth, ∆t, and a higher lengthening rate were observed for lower transformation temperatures. Given the effect of transformation temperature on the nucleation rates (Figure 3, Figure 4, Figure 5 and Figure 6) and the growth rates (Figure 8, Figure 9, Figure 10 and Figure 11), one can expect a more rapid bainite transformation at higher undercooling as a cooperative result of both higher nucleation and lengthening rates.
4. Discussion
4.1. Nucleation
As described in the Results Section, plates of bainitic ferrite were observed to nucleate at three different types of location. The total number of observed nucleation phenomena grouped by nucleation sites versus holding temperature is presented in Figure 12. The total number of nucleation events increases by reducing the transformation temperature, reaching its maximum at T = 773 K (500 °C), and decreases for lower temperatures. Nuclei are mainly formed at grain boundaries. Nucleation inside the austenite grains is a rare event and was difficult to observe unambiguously by means of LSCM measurements. Such nucleation events were strongly outnumbered by nucleation events from grain boundaries or newly-formed bainite plates. Nucleation on existing bainitic plates (autocatalytic nucleation) occurs at all transformation temperatures, and its fraction increases at lower transformation temperatures.
Figure 3, Figure 4, Figure 5 and Figure 6 as presented provide only a 2D view of the nucleation rate in different grains, and the differences in nucleation rate between the different grains is likely due to the orientation of the grain with respect to the observed surface. Due to complexity of the nucleation in 3D structures, there is no assumption-free method of quantitatively evaluating and comparing the overall nucleation rate per unit of volume from such 2D observations. The average nucleation rate per unit area versus the temperature range of observation is shown in Figure 13. The average nucleation rate decreases upon increasing isothermal holding temperature from 723 K–823 K (450–650 °C). The scatter in nucleation rates was more pronounced at lower transformation temperatures compared to higher temperatures.
Enhanced analysis of the observed nucleation behavior can be done by comparing the average nucleation rates to those obtained by classical nucleation theory (CNT) [75,76]. According to CNT, the nucleation rate is expressed as a product of two exponential terms: one accounting for the number of stable nuclei n* being formed such that where ΔG* is the activation energy needed for nucleation of the product phase from parent nuclei and kB is the Boltzmann constant. ΔG* can be in general written in as , where Δgv represents the changes in Gibbs energy of phases under para-equilibrium condition and factor Ψ accounts for geometry and interfacial energies between the nucleus and original phase. The other term accounts for cluster dynamics or the frequency with which parent phase atoms attach themselves to the product nuclei cluster, , where QD is the activation energy for diffusion of migrating atoms, so the total nucleation rate, , would be product of these two factors as:
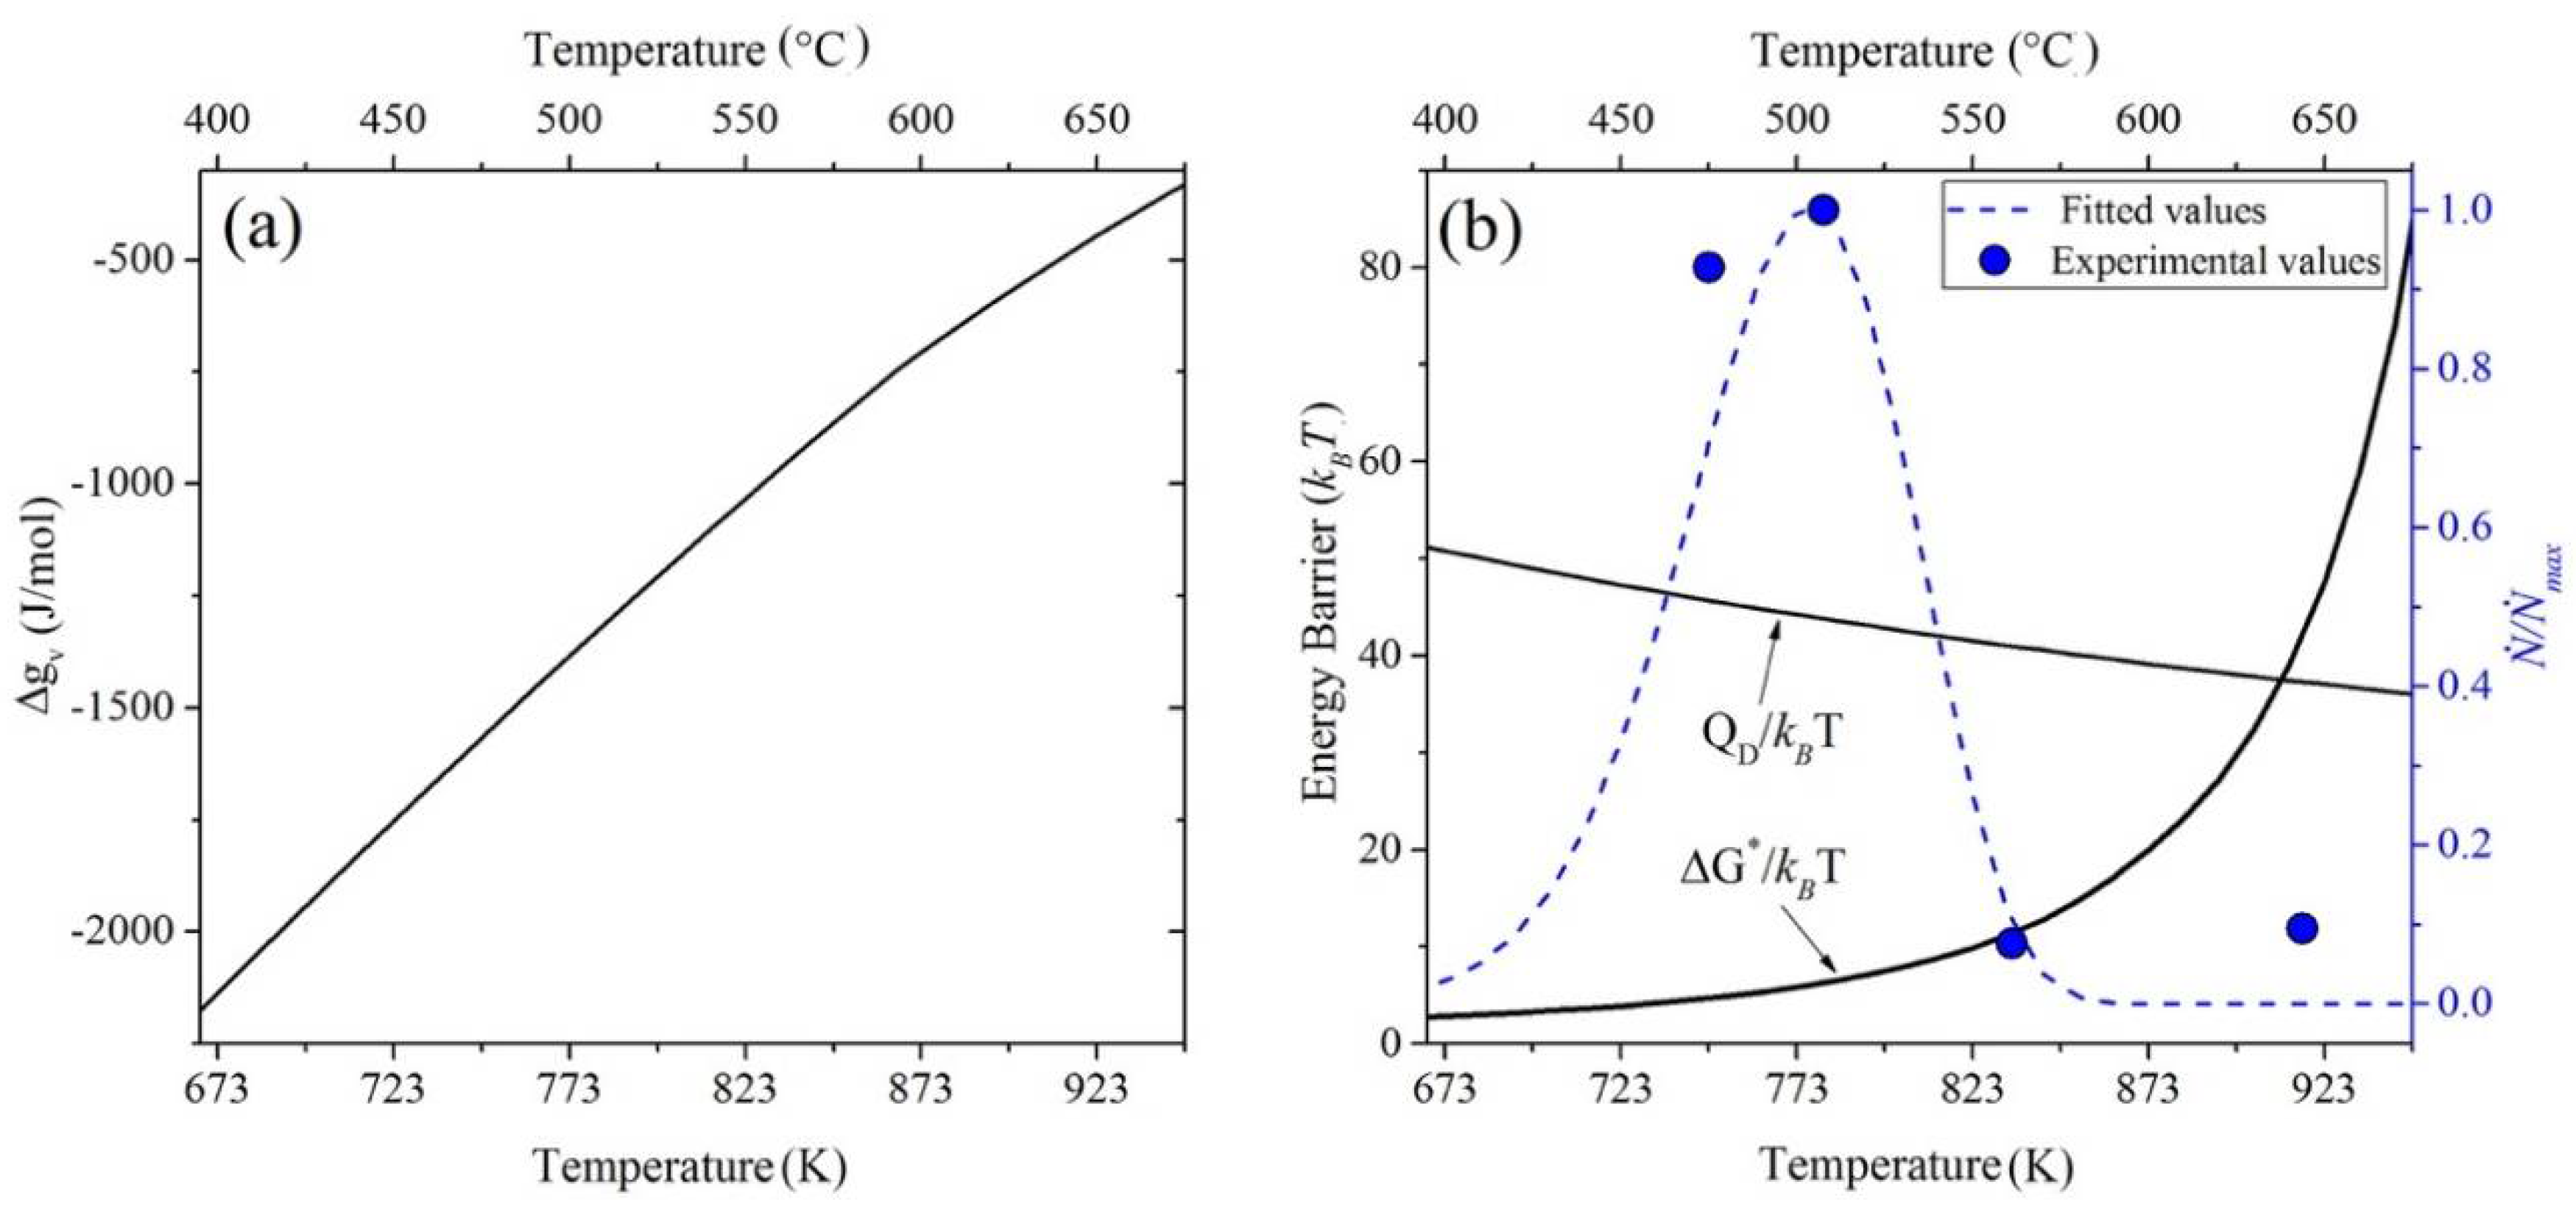
The low nucleation rate at high undercooling is attributed to the high activation energy for diffusion at lower temperatures. At lower undercooling, or at higher transformation temperature, the driving force is too low to produce a perceptible nucleation rate. Using the driving force for nucleation calculated by Thermo-Calc software linked to the TCFE8 database [77], leading to an equilibrium transformation start temperature of 1043 K (770 °C), the best fit of the normalized experimental data to Equation (2) when QD = 4.72 × 10⁻¹⁹ J [78] gives Ψ = 1.2 × 10⁻¹³ J3·mol−2 (with in J·mol−1), which is orders of magnitude smaller than the values predicted for ferrite nucleation [79,80,81]. The values of ΔG* using the fitted parameter of Ψ vary from 3.9kBT–47.5kBT between 723 K (450 °C) and 923 K (650 °C), respectively. These values are higher than the predicted values by Quidort and Bréchet [82] for bainite nucleation in a 0.5 mass% carbon steel varying from 1.1kBT–1.7kBT between 648 K (375 °C) and 773 K (500 °C), but close to the value of 30kBT predicted by van Dijk et al. [83] for barrier-free heterogeneous nucleation of ferrite grains in C35 steel at T = 1003 K (730 °C). The driving force is plotted versus temperature in Figure 14a. The nucleation energy barrier ΔG* and the activation energy QD as multiples of (kBT) are linked to the normalized nucleation rate according to CNT, and these quantities versus temperature are presented in Figure 14b as the best fit to the experimental data.
4.2. Growth
The results in Section 3.2 show the temporal evolution of plate lengths for different isothermal temperatures. The data analysis was done corresponding to a frequency of 1 Hz, though the experimental data were recorded at 15 Hz. To check that the lower sampling frequency did not lead to loss of information, two bainite plate growth events were analyzed both at the lower sampling frequency of 1 Hz and one at the actual data recording frequency of 15 Hz: one plate with a high growth rate and the other one with a lower growth rate. The results of the four analyses are shown in Figure 15a–d. The figures demonstrate that the low frequency data analysis provides complete information with respect to plate growth and that, at the temporal and spatial resolution used, the plate growth is continuous without any jerkiness, while the error associated with low resolution measurements remains between 0.79 and 3.01 µm (equal to 3–13 pixels in 1024 × 1024-pixel images).
Figure 8, Figure 9, Figure 10 and Figure 11 show the evolution of individual plates for the three transformation temperatures. Figure 16 summarizes the average and range of measured lengthening rates during total transformation for bainite plates initiated at grain boundaries, within the grains and on preformed bainite plates for each experiment. Comparing all transformation temperatures, no clear relationship between nucleation site and lengthening rates of bainite plates is observed. However, the average and range of lengthening rate increase remarkably for lower transformation temperatures. In a similar LSCM study, Hu et al. [67] reported different bainite plate lengthening rates during cooling and isothermal holding. Such a difference was not observed in the current experiment.
Now, the growth data are to be compared with the predictions by available models in the literature. The diffusionless hypothesis suggests that the lengthening rate of bainitic plates depends on the nucleation rate of bainite subunits. Due to the complex dependence of the nucleation rate on different fitting parameters (discussed in [46,84]), which actually justifies the nucleation rate of the subunit itself as a fitting parameter, the direct comparison of the experimental data can only be made with the diffusional model proposed for the prediction of the maximum lengthening rate of bainitic plates.
The diffusion-controlled equation of lengthening known as the Zener-Hillert model [68,69] has been recently improved by Leach et al. [85]. Upon removing the original simplifying approximations made by Zener [86], the lengthening rate, , is described by:
where is the effective diffusion coefficient of carbon, is the maximum driving force of transformation, is the energy barrier of the transformation, is molar volume, is the interface energy, , and the mole fraction of carbon at the austenitic side of the interface, the ferritic side of the interface and in the initial austenite phase, is the radius of curvature of the plate tip and is the critical radius for which the growth rate is zero. The effective diffusion coefficient of carbon can be calculated by:
The dependency of carbon diffusivity in austenite on its mole fraction can be calculated by the following expression suggested by Ågren [87]:
Equation (3) has been applied with parameters similar to those used in [88] for modelling the maximum growth rate of bainitic plates at different temperatures assuming an energy barrier B of zero and 400 J mol−1 for growth. The equilibrium composition of austenite (Ae3 line) at low temperatures and transformation driving force have been calculated using Thermo-Calc software linked to the TCFE8 database [77]. The value for B = 400 J mol−1 is selected according to the strain energy barrier concept suggested by Bhadeshia [41,89] to accommodate the displacive nature of bainitic ferrite formation.
Figure 17 shows the predicted maximum lengthening rates according to Equation (3) for the two values for the energy barrier, as well as the experimentally-recorded growth data at the different temperatures. Equation (3) yields a typical C-type growth rate with a maximum shifting to a lower growth rate at a lower temperature upon introducing an energy barrier of 400 J mol−1. In general, the correspondence between the calculated velocities and the experimental data is modest. The actual experimental growth rates at T = 923 K (650 °C) are well captured by the model with B = 400 J mol−1. For T = 823 K (550 °C), the measured lengthening rates are still in the range of the maximum growth rate predicted by the model. However, for lower temperatures, the predicted velocity grossly underestimates the actual values. This could be in line with the other reports describing the possibility of a massive growth mechanism for bainitic plates at low temperatures [63,90,91].
Given the composition of the samples studied, an incomplete bainite transformation phenomenon [32,58,92,93,94] is expected to occur at the transformation temperatures imposed. As can be observed in Figure 8, Figure 9, Figure 10 and Figure 11 (and in the Supplementary Information showing the original recordings of the isothermal transformation experiment at T = 723 K (450 °C)), the lengthening of the majority of bainite plates is independent of the nucleation time and location and terminates on geometrical obstacles of austenite grain boundaries or existing plates. However, widening of all the plates terminating within the austenite grains results in a limited width of the bainitic plates. This indicates that the transformation stasis can be caused by stasis in the widening of the bainitic plates, restricted by a growth-limiting mechanism such as the formation of Mn spike in front of the migrating interface, while the lengthening is assumed to be a massive transformation, i.e., no compositional changes in the bulk material, but a carbon spike in front of the migrating interface. Such a mechanism for incomplete bainite transformation has been previously suggested in a modelling work by Yang et al. [95], where in ferrite transformation with a plate-like morphology, a complete transformation in the lengthening direction and incomplete growth in widening of the plates were predicted; proposing that the global stasis in ferrite formation with a plate-like geometry is due to local stasis in widening of the previously-nucleated plates and not in lengthening, while for an isotropic ferrite morphology, the stasis occurs in all directions of growth.
5. Conclusions
In this study, isothermal bainite transformation in a C-Mn steel has been investigated using in situ LSCM and image analysis. Assuming that the transformation features observed at the sample surface qualitatively reflect the features of the bainite formation in the bulk, the following conclusions are achieved:
- The rate of nucleation (initiation) of bainitic plates is observed to be rather different in different austenite grains.
- The majority of the bainitic plates nucleate on austenite grain boundaries.
- The observed average nucleation rate for bainitic plates is found to be in qualitative agreement with the classical nucleation theory.
- No special relationship is found between the lengthening rate of bainite plates and their nucleation site.
- The predicted values of the maximum lengthening rate by means of an improved diffusional model considering 400 J mol−1 of growth barrier energy are in agreement with experimentally-measured growth rates of bainite plates at high temperatures.
Supplementary Materials
The following are available online at https://www.mdpi.com/2075-4701/8/7/498/s1, Video S1: Sample video of isothermal bainite transformation at 723 K (450 °C).
Author Contributions
Conceptualization, S.v.d.Z. and H.F.; Methodology, S.S., H.F., E.G. and S.v.d.Z.; Investigation, H.F. and E.G.; Data processing, S.S. and H.F.; Writing Draft preparation, S.S. and H.F.; Writing-Review & Editing, S.S., H.F., E.G. and S.v.d.Z; Supervision, S.v.d.Z.; Funding Acquisition S.v.d.Z.
Funding
This research was funded by Arcelor Mittal, France. The Chair of Ferrous Metallurgy, Montanuniversität Leoben, Austria, covered the costs involved with the LSCM experiments.
Acknowledgments
The authors thank Siegfried Schider at the Chair of Ferrous Metallurgy, Montanuniversität Leoben, Austria, for help in the LSCM experiments.
Conflicts of Interest
The authors declare no conflict of interest.
References
- Bhadeshia, H.K.D.H.; Honeycombe, R. Steels: Microstructure and Properties: Microstructure and Properties; Butterworth-Heinemann: Oxford, UK, 2011; ISBN 0080462928. [Google Scholar]
- Aydin, H.; Essadiqi, E.; Jung, I.H.; Yue, S. Development of 3rd generation AHSS with medium Mn content alloying compositions. Mater. Sci. Eng. A 2013, 564, 501–508. [Google Scholar] [CrossRef]
- Matlock, D.K.; Speer, J.G. Third Generation of AHSS: Microstructure Design Concepts. In Microstructure and Texture in Steels; Springer: London, UK, 2009; pp. 185–205. [Google Scholar]
- Capdevila, C.; Cornide, J.; Tanaka, K.; Nakanishi, K.; Urones-Garrote, E. Kinetic transition during ferrite growth in Fe-C-Mn medium carbon steel. Metall. Mater. Trans. A Phys. Metall. Mater. Sci. 2011, 42, 3719–3728. [Google Scholar] [CrossRef] [Green Version]
- Luo, H.; Shi, J.; Wang, C.; Cao, W.; Sun, X.; Dong, H. Experimental and numerical analysis on formation of stable austenite during the intercritical annealing of 5 Mn steel. Acta Mater. 2011, 59, 4002–4014. [Google Scholar] [CrossRef]
- Wang, C.; Cao, W.; Shi, J.; Huang, C.; Dong, H. Deformation microstructures and strengthening mechanisms of an ultrafine grained duplex medium-Mn steel. Mater. Sci. Eng. A 2013, 562, 89–95. [Google Scholar] [CrossRef]
- Zhang, R.; Cao, W.Q.; Peng, Z.J.; Shi, J.; Dong, H.; Huang, C.X. Intercritical rolling induced ultrafine microstructure and excellent mechanical properties of the medium-Mn steel. Mater. Sci. Eng. A 2013, 583, 84–88. [Google Scholar] [CrossRef]
- Bouaziz, O.; Allain, S.; Scott, C.P.; Cugy, P.; Barbier, D. High manganese austenitic twinning induced plasticity steels: A review of the microstructure properties relationships. Curr. Opin. Solid State Mater. Sci. 2011, 15, 141–168. [Google Scholar] [CrossRef]
- De Cooman, B.C. Structure-properties relationship in TRIP steels containing carbide-free bainite. Curr. Opin. Solid State Mater. Sci. 2004, 8, 285–303. [Google Scholar] [CrossRef]
- Lee, Y.K.; Choi, C. Driving force for γ→ε martensitic transformation and stacking fault energy of γ in Fe-Mn binary system. Metall. Mater. Trans. A 2000, 31, 355–360. [Google Scholar] [CrossRef]
- Zaefferer, S.; Ohlert, J.; Bleck, W. A study of microstructure, transformation mechanisms and correlation between microstructure and mechanical properties of a low alloyed TRIP steel. Acta Mater. 2004, 52, 2765–2778. [Google Scholar] [CrossRef]
- Grajcar, A.; Zalecki, W.; Burian, W.; Kozłowska, A. Phase Equilibrium and Austenite Decomposition in Advanced High-Strength Medium-Mn Bainitic Steels. Metals 2016, 6, 248. [Google Scholar] [CrossRef]
- Grajcar, A.; Radwański, K.; Krztoń, H.J. Microstructural Analysis of a Thermomechanically Processed Si-Al TRIP Steel Characterized by EBSD and X-Ray Techniques. Solid State Phenom. 2013, 203–204, 34–37. [Google Scholar] [CrossRef]
- Radwański, K.; Wrożyna, A.; Kuziak, R. Role of the advanced microstructures characterization in modeling of mechanical properties of AHSS steels. Mater. Sci. Eng. A 2015, 639, 567–574. [Google Scholar] [CrossRef]
- Kamoutsi, H.; Gioti, E.; Haidemenopoulos, G.N.; Cai, Z.; Ding, H. Kinetics of Solute Partitioning During Intercritical Annealing of a Medium-Mn Steel. Metall. Mater. Trans. A 2015, 46, 4841–4846. [Google Scholar] [CrossRef]
- Sugimoto, K.; Tanino, H.; Kobayashi, J. Impact Toughness of Medium-Mn Transformation-Induced Plasticity-Aided Steels. Steel Res. Int. 2015, 86, 1151–1160. [Google Scholar] [CrossRef] [Green Version]
- Lee, S.; Lee, K.; De Cooman, B.C. Observation of the TWIP + TRIP Plasticity-Enhancement Mechanism in Al-Added 6 Wt Pct Medium Mn Steel. Metall. Mater. Trans. A 2015, 46, 2356–2363. [Google Scholar] [CrossRef]
- Garcia-Mateo, C.; Sourmail, T.; Caballero, F.G.; Capdevila, C.; García de Andrés, C. New approach for the bainite start temperature calculation in steels. Mater. Sci. Technol. 2005, 21, 934–940. [Google Scholar] [CrossRef] [Green Version]
- Farahani, H.; Xu, W.; van der Zwaag, S. Prediction and Validation of the Austenite Phase Fraction upon Intercritical Annealing of Medium Mn Steels. Metall. Mater. Trans. A 2015, 46, 4978–4985. [Google Scholar] [CrossRef] [Green Version]
- Arlazarov, A.; Gouné, M.; Bouaziz, O.; Hazotte, A.; Petitgand, G.; Barges, P. Evolution of microstructure and mechanical properties of medium Mn steels during double annealing. Mater. Sci. Eng. A 2012, 542, 31–39. [Google Scholar] [CrossRef]
- Lee, J.; Sohn, S.S.; Hong, S.; Suh, B.-C.; Kim, S.-K.; Lee, B.-J.; Kim, N.J.; Lee, S. Effects of Mn Addition on Tensile and Charpy Impact Properties in Austenitic Fe-Mn-C-Al-Based Steels for Cryogenic Applications. Metall. Mater. Trans. A 2014, 45, 5419–5430. [Google Scholar] [CrossRef] [Green Version]
- Sohn, S.S.; Lee, S.; Lee, B.-J.; Kwak, J.-H. Microstructural Developments and Tensile Properties of Lean Fe-Mn-Al-C Lightweight Steels. JOM 2014, 66, 1857–1867. [Google Scholar] [CrossRef]
- Han, J.; Lee, S.-J.; Jung, J.-G.; Lee, Y.-K. The effects of the initial martensite microstructure on the microstructure and tensile properties of intercritically annealed Fe-9Mn-0.05C steel. Acta Mater. 2014, 78, 369–377. [Google Scholar] [CrossRef]
- Gutierrez-Urrutia, I.; Raabe, D. Influence of Al content and precipitation state on the mechanical behavior of austenitic high-Mn low-density steels. Scr. Mater. 2013, 68, 343–347. [Google Scholar] [CrossRef]
- Davenport, E.; Bain, E. Transformation of Austenite at Constant Subcritical Temperatures. Trans. AIME 1930, 90, 117–144. [Google Scholar] [CrossRef]
- Paxton, H.W. Commentary by: Transformation of austenite at constant subcritical temperatures. Metall. Trans. 1970, 1, 3479–3501. [Google Scholar] [CrossRef]
- Aaronson, H.I.; Furuhara, T.; Rigsbee, J.M.; Reynolds, W.T.; Howe, J.M. Crystallographic and mechanistic aspects of growth by shear and by diffusional processes. Metall. Trans. A 1990, 21, 2369–2409. [Google Scholar] [CrossRef]
- Hillert, M. The Nature of Bainite. ISIJ Int. 1995, 35, 1134–1140. [Google Scholar] [CrossRef]
- Hillert, M.; Höglund, L.; Ågren, J. Role of carbon and alloying elements in the formation of bainitic ferrite. Metall. Mater. Trans. A 2004, 35, 3693–3700. [Google Scholar] [CrossRef]
- Caballero, F.G.; Bhadeshia, H.K.D.H. Very strong bainite. Curr. Opin. Solid State Mater. Sci. 2004, 8, 251–257. [Google Scholar] [CrossRef] [Green Version]
- Yang, Z.; Fang, H. An overview on bainite formation in steels. Curr. Opin. Solid State Mater. Sci. 2005, 9, 277–286. [Google Scholar] [CrossRef]
- Aaronson, H.I.; Reynolds, W.T.; Purdy, G.R. The incomplete transformation phenomenon in steel. Metall. Mater. Trans. A 2006, 37, 1731–1745. [Google Scholar] [CrossRef]
- Borgenstam, A.; Hillert, M.; Agren, J. Metallographic evidence of carbon diffusion in the growth of bainite. Acta Mater. 2009, 57, 3242–3252. [Google Scholar] [CrossRef]
- Caballero, F.G.; Garcia-Mateo, C.; Santofimia, M.J.; Miller, M.K.; García de Andrés, C. New experimental evidence on the incomplete transformation phenomenon in steel. Acta Mater. 2009, 57, 8–17. [Google Scholar] [CrossRef] [Green Version]
- Liu, C.; Di, X.; Chen, C.; Guo, X.; Xue, Z. A bainite transformation kinetics model and its application to X70 pipeline steel. J. Mater. Sci. 2015, 50, 5079–5090. [Google Scholar] [CrossRef]
- Gong, W.; Tomota, Y.; Harjo, S.; Su, Y.; Aizawa, K. Effect of prior martensite on bainite transformation in nanobainite steel. Acta Mater. 2015, 85, 243–249. [Google Scholar] [CrossRef]
- Hillert, M. Diffusion in growth of bainite. Metall. Mater. Trans. A 1994, 25, 1957–1966. [Google Scholar] [CrossRef]
- Purdy, G.R.; Hillert, M. Overview No. 38: On the nature of the bainite transformation in steels. Acta Metall. 1984, 32, 823–828. [Google Scholar] [CrossRef]
- Hillert, M. The growth of ferrite, bainite and martensite. In Thermodynamics and Phase Transformations: The Selected Works of Mats Hillert; EDP Sciences: Les Ulis, France, 2006; pp. 111–158. [Google Scholar]
- Hehemann, R.F.; Kinsman, K.R.; Aaronson, H.I. A debate on the bainite reaction. Metall. Trans. 1972, 3, 1077–1094. [Google Scholar] [CrossRef]
- Bhadeshia, H.K.D.H.; Edmonds, D.V. The mechanism of bainite formation in steels. Acta Metall. 1980, 28, 1265–1273. [Google Scholar] [CrossRef]
- Reynolds, W.T.; Li, F.Z.; Shui, C.K.; Aaronson, H.I. The Incomplete transformation phenomenon in Fe-C-Mo alloys. Metall. Trans. A 1990, 21, 1433–1463. [Google Scholar] [CrossRef]
- Reynolds, W.T.; Liu, S.K.; Li, F.Z.; Hartfield, S.; Aaronson, H.I. An investigation of the generality of incomplete transformation to bainite in Fe-C-X alloys. Metall. Trans. A 1990, 21, 1479–1491. [Google Scholar] [CrossRef]
- Quidort, D.; Brechet, Y.J.M. Isothermal growth kinetics of bainite in 0.5% C steels. Acta Mater. 2001, 49, 4161–4170. [Google Scholar] [CrossRef]
- Darken, L.S.; Fisher, R.M. Decomposition of Austenite by Diffusional Processes. In Proc. Symposium in Philadelphia; Interscience Publ.: Bucks, UK, 1962; pp. 249–294. [Google Scholar]
- Matsuda, H.; Bhadeshia, H.K.D.H. Kinetics of the bainite transformation. Proc. R. Soc. A Math. Phys. Eng. Sci. 2004, 460, 1707–1722. [Google Scholar] [CrossRef] [Green Version]
- Quidort, D.; Bréchet, Y. The role of carbon on the kinetics of bainite transformation in steels. Scr. Mater. 2002, 47, 151–156. [Google Scholar] [CrossRef]
- Chang, L.C. Microstructures and reaction kinetics of bainite transformation in Si-rich steels. Mater. Sci. Eng. A 2004, 368, 175–182. [Google Scholar] [CrossRef]
- Singh, S.B.; Bhadeshia, H. Estimation of bainite plate-thickness in low-alloy steels. Mater. Sci. Eng. A 1998, 245, 72–79. [Google Scholar] [CrossRef]
- Wu, K.M.; Kagayama, M.; Enomoto, M. Kinetics of ferrite transformation in an Fe-0.28mass%C-3mass%Mo alloy. Mater. Sci. Eng. A 2003, 343, 143–150. [Google Scholar] [CrossRef]
- Enomoto, M.; Maruyama, N.; Wu, K.M.; Tarui, T. Alloying element accumulation at ferrite/austenite boundaries below the time–temperature–transformation diagram bay in an Fe-C-Mo Alloy. Mater. Sci. Eng. A 2003, 343, 151–157. [Google Scholar] [CrossRef]
- Rees, G.I.; Bhadeshia, H.K.D.H. Bainite transformation kinetics Part 2 Non-uniform distribution of carbon. Mater. Sci. Technol. 1992, 8, 994–1003. [Google Scholar] [CrossRef]
- Takahashi, M. Recent progress: kinetics of the bainite transformation in steels. Curr. Opin. Solid State Mater. Sci. 2004, 8, 213–217. [Google Scholar] [CrossRef]
- Santofimia, M.J.; Caballero, F.G.; Capdevila, C.; García-Mateo, C.; de Andrés, C.G. Evaluation of Displacive Models for Bainite Transformation Kinetics in Steels. Mater. Trans. 2006, 47, 1492–1500. [Google Scholar] [CrossRef] [Green Version]
- Van Bohemen, S.M.C.; Sietsma, J. Modeling of isothermal bainite formation based on the nucleation kinetics. Int. J. Mater. Res. 2008, 99, 739–747. [Google Scholar] [CrossRef]
- Ravi, A.M.; Sietsma, J.; Santofimia, M.J. Exploring bainite formation kinetics distinguishing grain-boundary and autocatalytic nucleation in high and low-Si steels. Acta Mater. 2016, 105, 155–164. [Google Scholar] [CrossRef]
- Chen, H.; van der Zwaag, S. Analysis of ferrite growth retardation induced by local Mn enrichment in austenite created by prior interface passages. Acta Mater. 2013, 61, 1338–1349. [Google Scholar] [CrossRef]
- Chen, H.; Zhu, K.; Zhao, L.; Van Der Zwaag, S. Analysis of transformation stasis during the isothermal bainitic ferrite formation in Fe-C-Mn and Fe-C-Mn-Si alloys. Acta Mater. 2013, 61, 5458–5468. [Google Scholar] [CrossRef]
- Chen, H.; Borgenstam, A.; Odqvist, J.; Zuazo, I.; Goune, M.; Ågren, J.; van der Zwaag, S. Application of interrupted cooling experiments to study the mechanism of bainitic ferrite formation in steels. Acta Mater. 2013, 61, 4512–4523. [Google Scholar] [CrossRef]
- Ko, T.; Cottrell, S.A. The formation of bainite. J. Iron Steel Inst. 1952, 172, 307. [Google Scholar]
- Zhang, D.; Terasaki, H.; Komizo, Y. In situ observation of phase transformation in Fe-0.15C binary alloy. J. Alloys Compd. 2009, 484, 929–933. [Google Scholar] [CrossRef]
- Kolmskog, P.; Borgenstam, A.; Hillert, M.; Hedström, P.; Babu, S.S.; Terasaki, H.; Komizo, Y.I. Direct Observation that Bainite can Grow Below MS. Metall. Mater. Trans. A 2012, 43, 4984. [Google Scholar] [CrossRef]
- Yada, H.; Enomoto, M.; Sonoyama, T. Lengthening Kinetics of Bainitic Plates in Iron-Nickel-Carbon Alloys. ISIJ Int. 1995, 35. [Google Scholar] [CrossRef]
- Kang, M.; Zhang, M.-X.; Zhu, M. In situ observation of bainite growth during isothermal holding. Acta Mater. 2006, 54, 2121–2129. [Google Scholar] [CrossRef]
- Xu, G.; Liu, F.; Wang, L.; Hu, H. A new approach to quantitative analysis of bainitic transformation in a superbainite steel. Scr. Mater. 2013, 68, 833–836. [Google Scholar] [CrossRef]
- Wan, X.L.; Wei, R.; Cheng, L.; Enomoto, M.; Adachi, Y. Lengthening kinetics of ferrite plates in high-strength low-carbon low alloy steel. J. Mater. Sci. 2013, 48, 4345–4355. [Google Scholar] [CrossRef]
- Hu, Z.; Xu, G.; Hu, H.; Wang, L.; Xue, Z. In situ measured growth rates of bainite plates in an Fe-C-Mn-Si superbainitic steel. Int. J. Miner. Metall. Mater. 2014, 21, 371–378. [Google Scholar] [CrossRef]
- Agren, J.; Brechet, Y.; Hutchinson, C.; Philibert, J.; Purdy, G. Thermodynamics and Phase Transformations: The Selected Works of Mats Hillert; EDP Sciences: Les Ulis, France, 2006; ISBN 2868838898. [Google Scholar]
- Hillert, M. Role of interfacial energy during solid-state phase transformations. Jernkontorets Ann. 1957, 141, 757–789. [Google Scholar]
- Trivedi, R.; Pound, G.M. Effect of Concentration-Dependent Diffusion Coefficient on the Migration of Interphase Boundaries. J. Appl. Phys. 1967, 38, 3569–3576. [Google Scholar] [CrossRef]
- Tian, J.; Xu, G.; Wang, L.; Zhou, M.; Hu, H. In Situ Observation of the Lengthening Rate of Bainite Sheaves During Continuous Cooling Process in a Fe–C–Mn–Si Superbainitic Steel. Trans. Indian Inst. Met. 2017, 1–10. [Google Scholar] [CrossRef]
- Chen, H.; Gamsjäger, E.; Schider, S.; Khanbareh, H.; van der Zwaag, S. In situ observation of austenite–ferrite interface migration in a lean Mn steel during cyclic partial phase transformations. Acta Mater. 2013, 61, 2414–2424. [Google Scholar] [CrossRef]
- The Math Works Inc. MATLAB Image Processing Toolbox Realese 2015b; The Math Works Inc.: Natick, MA, USA, 2007. [Google Scholar]
- Pak, J.; Suh, D.W.; Bhadeshia, H.K.D.H. Displacive Phase Transformation and Surface Effects Associated with Confocal Laser Scanning Microscopy. Metall. Mater. Trans. A 2012, 43, 4520–4524. [Google Scholar] [CrossRef] [Green Version]
- Kalikmanov, V.I. Classical Nucleation Theory; Springer: Dordrecht, The Netherlands, 2013; pp. 17–41. [Google Scholar]
- Callister, W.D. Materials Science and Engineering: An Introduction, 7th ed.; John Wiley & Sons: Hoboken, NJ, USA, 2007; ISBN 9780471736967. [Google Scholar]
- Andersson, J.O.; Helander, T.; Höglund, L.; Shi, P.; Sundman, B. Thermo-Calc & DICTRA, computational tools for materials science. Calphad 2002, 26, 273–312. [Google Scholar] [CrossRef]
- Kučera, J.; Stránský, K. Diffusion in iron, iron solid solutions and steels. Mater. Sci. Eng. 1982, 52, 1–38. [Google Scholar] [CrossRef]
- Offerman, S.E.; van Dijk, N.H.; Sietsma, J.; Grigull, S.; Lauridsen, E.M.; Margulies, L.; Poulsen, H.F.; Rekveldt, M.T.; van der Zwaag, S. Grain Nucleation and Growth During Phase Transformations. Science 2002, 298, 1003–1005. [Google Scholar] [CrossRef] [PubMed]
- Clemm, P.; Fisher, J. The influence of grain boundaries on the nucleation of secondary phases. Acta Metall. 1955, 3, 70–73. [Google Scholar] [CrossRef]
- Lange, W.F.; Enomoto, M.; Aaronson, H.I. The kinetics of ferrite nucleation at austenite grain boundaries in Fe-C alloys. Metall. Trans. A 1988, 19, 427–440. [Google Scholar] [CrossRef]
- Quidort, D.; Brechet, Y.J.M. A Model of Isothermal and Non Isothermal Transformation Kinetics of Bainite in 0.5% C Steels. ISIJ Int. 2002, 42, 1010–1017. [Google Scholar] [CrossRef]
- Van Dijk, N.H.; Offerman, S.E.; Sietsma, J.; van der Zwaag, S. Barrier-free heterogeneous grain nucleation in polycrystalline materials: The austenite to ferrite phase transformation in steel. Acta Mater. 2007, 55, 4489–4498. [Google Scholar] [CrossRef]
- Liu, C.; Shi, L.; Liu, Y.; Li, C.; Li, H.; Guo, Q. Acicular ferrite formation during isothermal holding in HSLA steel. J. Mater. Sci. 2016, 51, 3555–3563. [Google Scholar] [CrossRef]
- Leach, L.; Hillert, M.; Borgenstam, A. Modeling C-Curves for the Growth Rate of Widmanstätten and Bainitic Ferrite in Fe-C Alloys. Metall. Mater. Trans. A 2016, 47, 19–25. [Google Scholar] [CrossRef]
- Zener, C. Kinetics of the decomposition of austenite. Trans. Aime 1946, 167, 550–595. [Google Scholar]
- Ågren, J. A revised expression for the diffusivity of carbon in binary Fe-C austenite. Scr. Metall. 1986, 20, 1507–1510. [Google Scholar] [CrossRef]
- Yin, J.; Leach, L.; Hillert, M.; Borgenstam, A. C-Curves for Lengthening of Widmanstätten and Bainitic Ferrite. Metall. Mater. Trans. A 2017, 48, 3997–4005. [Google Scholar] [CrossRef] [Green Version]
- Bhadeshia, H. Bainite in Steels: Theory and Practice, 3rd ed.; Maney Publishing: Leeds, UK, 2015; ISBN 1909662747, 9781909662742. [Google Scholar]
- Enomoto, M.; Sonoyama, T.; Yada, H. Kinetics of Austenite to Ferrite Transformation in 3 mass% Mn Low Carbon Steels. Mater. Trans. JIM 1998, 39, 189–195. [Google Scholar] [CrossRef] [Green Version]
- Howe, J.M. Comparison of the atomic structure, composition, kinetics and mechanisms of interfacial motion in martensitic, bainitic, massive and precipitation face-centered cubic-hexagonal close-packed phase transformations. Mater. Sci. Eng. A 2006, 438–440, 35–42. [Google Scholar] [CrossRef]
- Chen, H.; van der Zwaag, S. On the nature of the bainitic and ferritic transformation stasis in steels. In Proceedings of the PTM2015—2015 International Conference on Solid-Solid Phase Transformations in Inorganic Materials, Whistler, BC, Canada, 28 June–3 July 2015; pp. 37–44. [Google Scholar]
- Chen, H.; Yang, Z.; Zhang, C.; Zhu, K.; van der Zwaag, S. On the transition between grain boundary ferrite and bainitic ferrite in Fe–C–Mo and Fe–C–Mn alloys: The bay formation explained. Acta Mater. 2016, 104, 62–71. [Google Scholar] [CrossRef]
- Chen, H.; Van Der Zwaag, S. An experimental study of the stagnant stage in bainite phase transformations starting from austenite-bainite mixtures. In Proceedings of the TMP 2012—4th International Conference on Thermomechanical Processing of Steels, Sheffield, UK, 10–12 September 2012. [Google Scholar]
- Yang, Z.Z.; Xu, W.; Yang, Z.Z.; Zhang, C.; van der Zwaag, S. A 2D analysis of the competition between the equiaxed ferritic and the bainitic morphology based on a Gibbs Energy Balance approach. Acta Mater. 2016, 105, 317–327. [Google Scholar] [CrossRef]
Figure 1.
Demonstration of MATLAB’s image viewing toolbox imtool for estimating the μm equivalent of pixel measurement according to the scale bar and measuring length of the ferrite plate (unit of measurement in pixels).
Figure 1.
Demonstration of MATLAB’s image viewing toolbox imtool for estimating the μm equivalent of pixel measurement according to the scale bar and measuring length of the ferrite plate (unit of measurement in pixels).

Figure 2.
Bainite plate nucleation observed at three distinct locations: (a) on grain boundaries (GB); (b) on preformed bainite (OP) and (c) inside the grain (IN).
Figure 2.
Bainite plate nucleation observed at three distinct locations: (a) on grain boundaries (GB); (b) on preformed bainite (OP) and (c) inside the grain (IN).
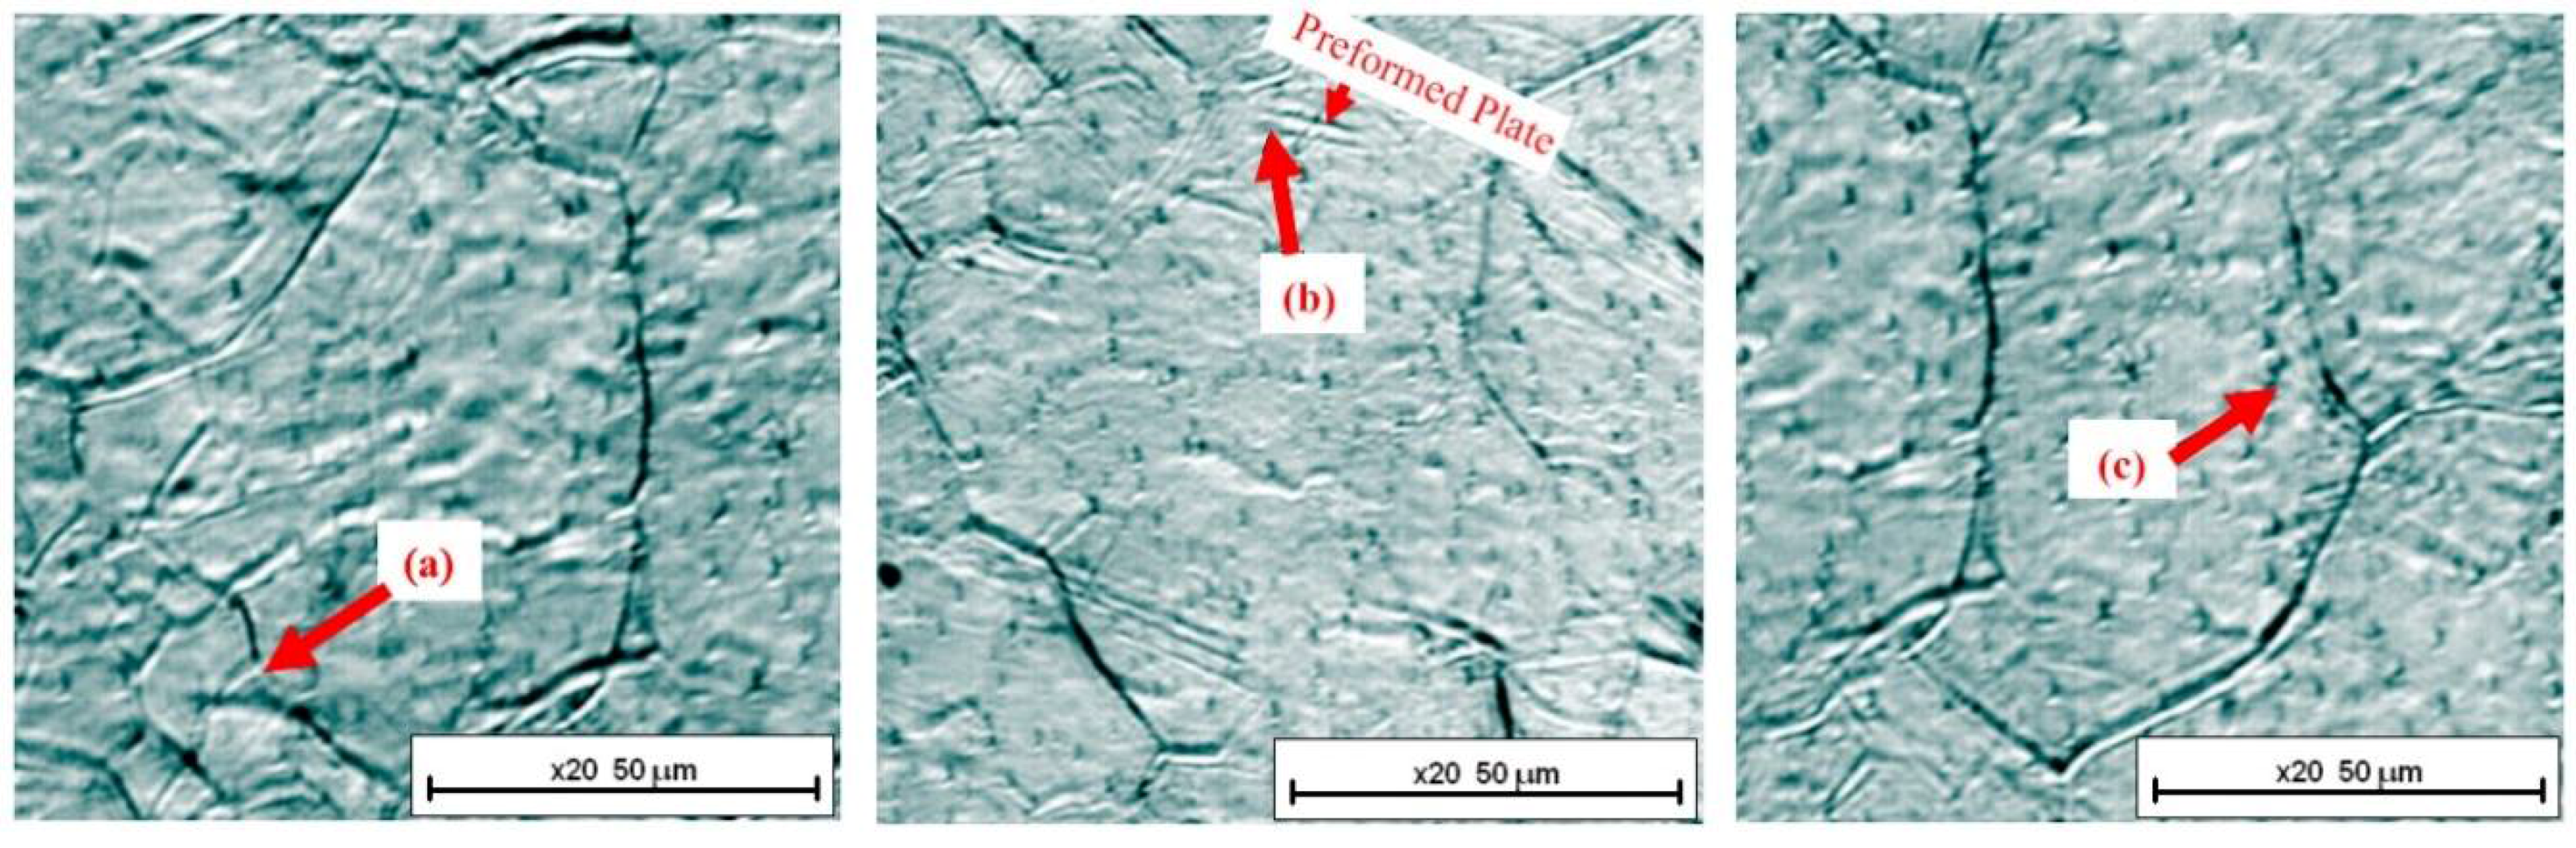
Figure 3.
Temperature and nucleation sequence versus time of bainitic ferrite plates in Fe-0.2C-1.5Mn-2.0Cr during isothermal holding treatment at 723 K (450 °C).
Figure 3.
Temperature and nucleation sequence versus time of bainitic ferrite plates in Fe-0.2C-1.5Mn-2.0Cr during isothermal holding treatment at 723 K (450 °C).
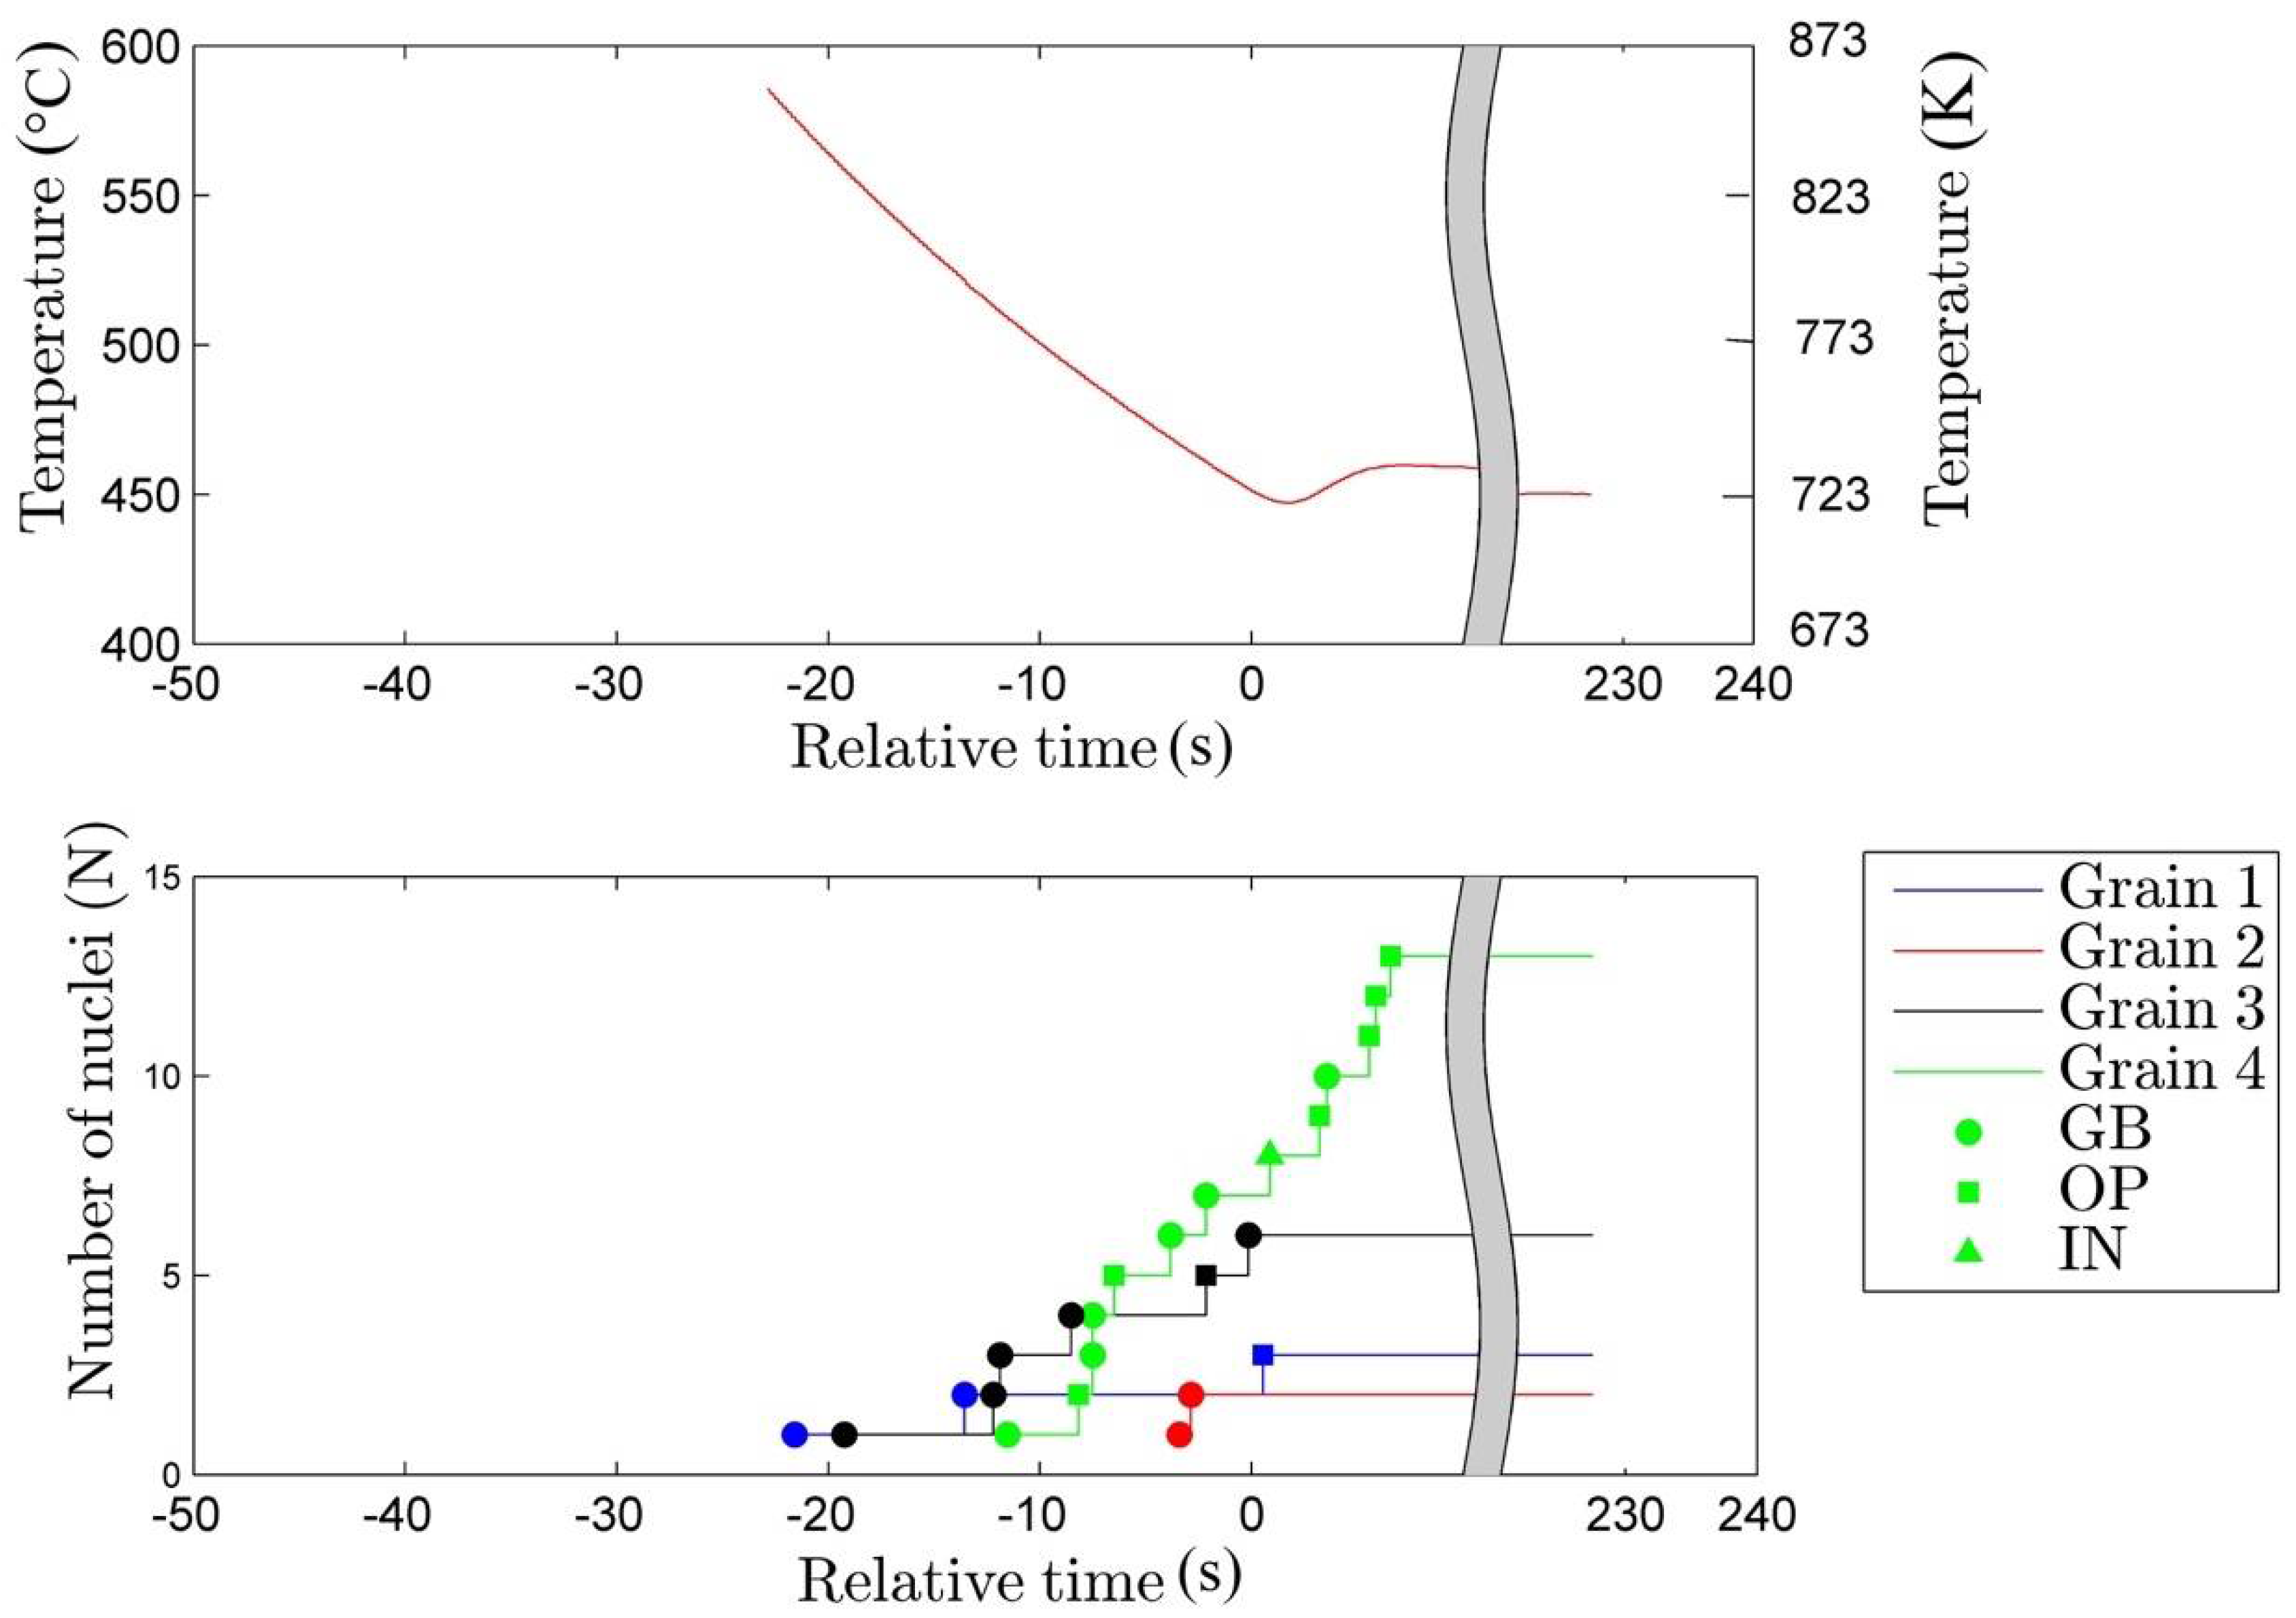
Figure 4.
Temperature and nucleation sequence versus time of bainitic ferrite plates in Fe-0.2C-1.5Mn-2.0Cr during isothermal holding treatment at 773 K (500 °C).
Figure 4.
Temperature and nucleation sequence versus time of bainitic ferrite plates in Fe-0.2C-1.5Mn-2.0Cr during isothermal holding treatment at 773 K (500 °C).

Figure 5.
Temperature and nucleation sequence versus time of bainitic ferrite plates in Fe-0.2C-1.5Mn-2.0Cr during isothermal holding treatment at 823 K (550 °C).
Figure 5.
Temperature and nucleation sequence versus time of bainitic ferrite plates in Fe-0.2C-1.5Mn-2.0Cr during isothermal holding treatment at 823 K (550 °C).
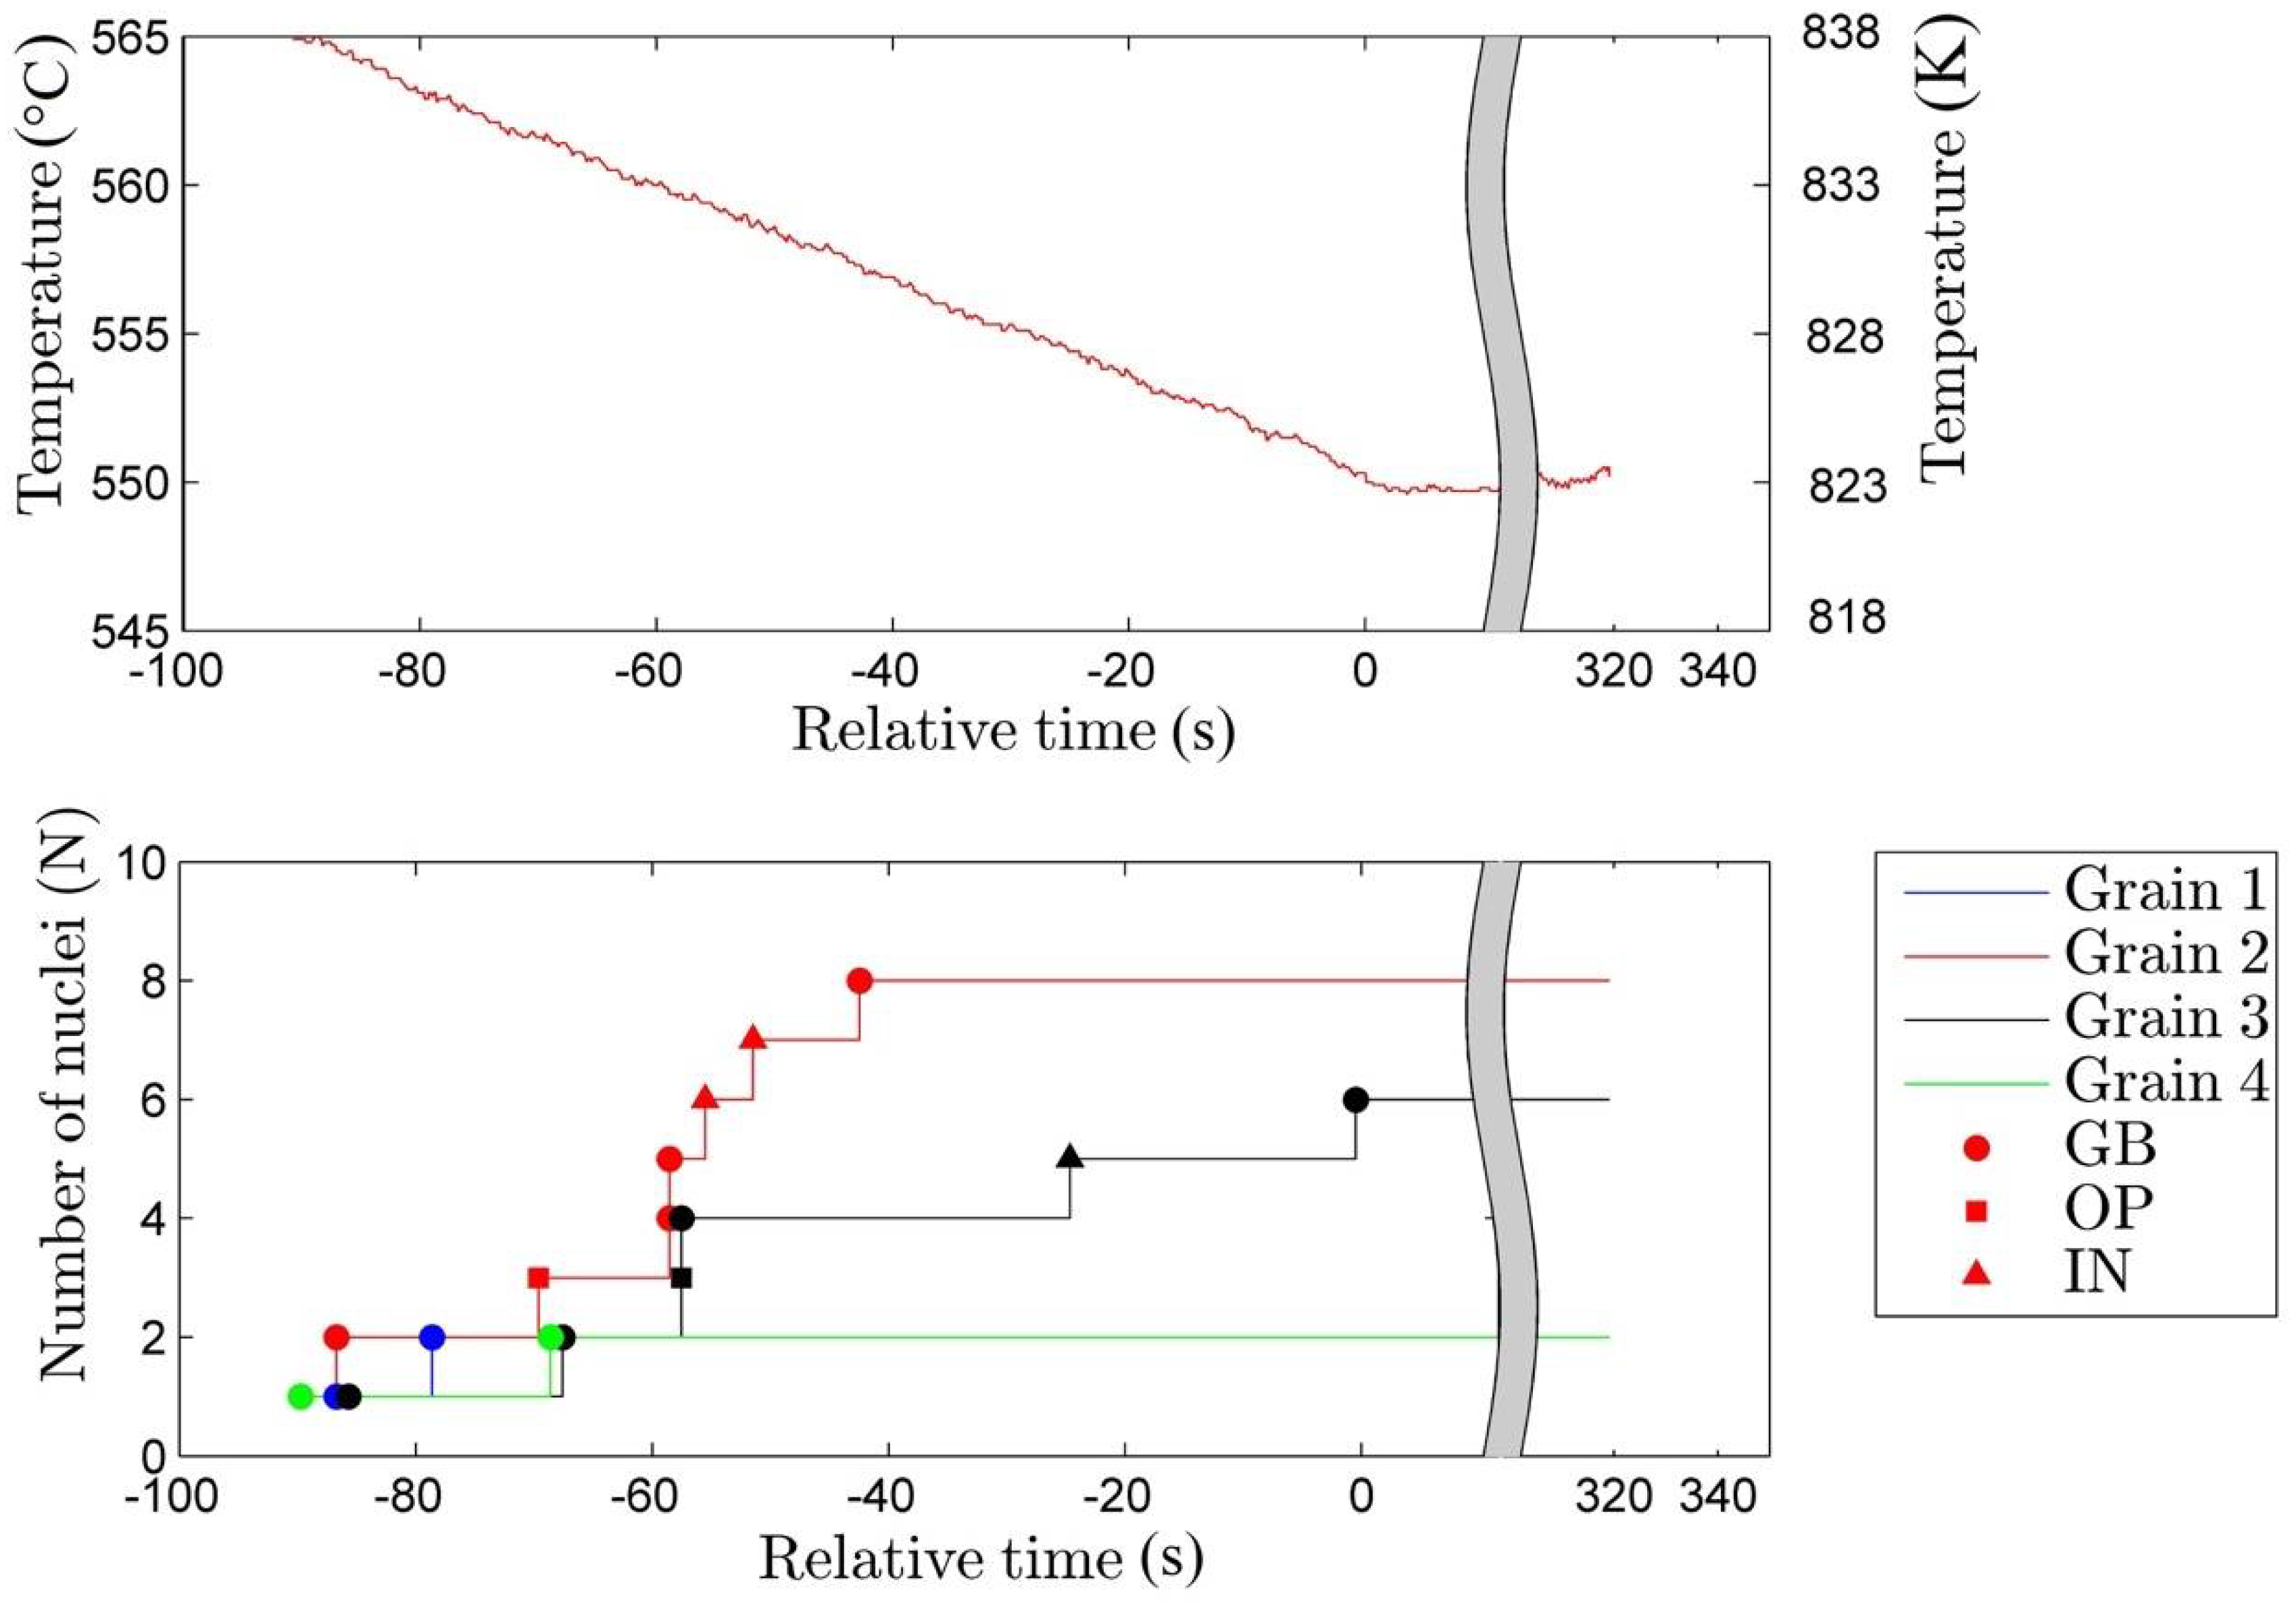
Figure 6.
Temperature and nucleation sequence versus time of bainitic ferrite plates in Fe-0.2C-1.5Mn-2.0Cr during isothermal holding treatment at 923 K (650 °C).
Figure 6.
Temperature and nucleation sequence versus time of bainitic ferrite plates in Fe-0.2C-1.5Mn-2.0Cr during isothermal holding treatment at 923 K (650 °C).

Figure 7.
(a–c) Micrographs showing the growth of bainitic ferrite plates during holding at 923 K (650 °C) at various stages of the isothermal holding time and (d) length versus time plot of the corresponding plates and their lengthening rate.
Figure 7.
(a–c) Micrographs showing the growth of bainitic ferrite plates during holding at 923 K (650 °C) at various stages of the isothermal holding time and (d) length versus time plot of the corresponding plates and their lengthening rate.

Figure 8.
Temperature versus time and temporal plate growth sequence of bainitic ferrite plates in Fe-0.2C-1.5Mn-2.0Cr during isothermal holding treatment at 723 K (450 °C).
Figure 8.
Temperature versus time and temporal plate growth sequence of bainitic ferrite plates in Fe-0.2C-1.5Mn-2.0Cr during isothermal holding treatment at 723 K (450 °C).
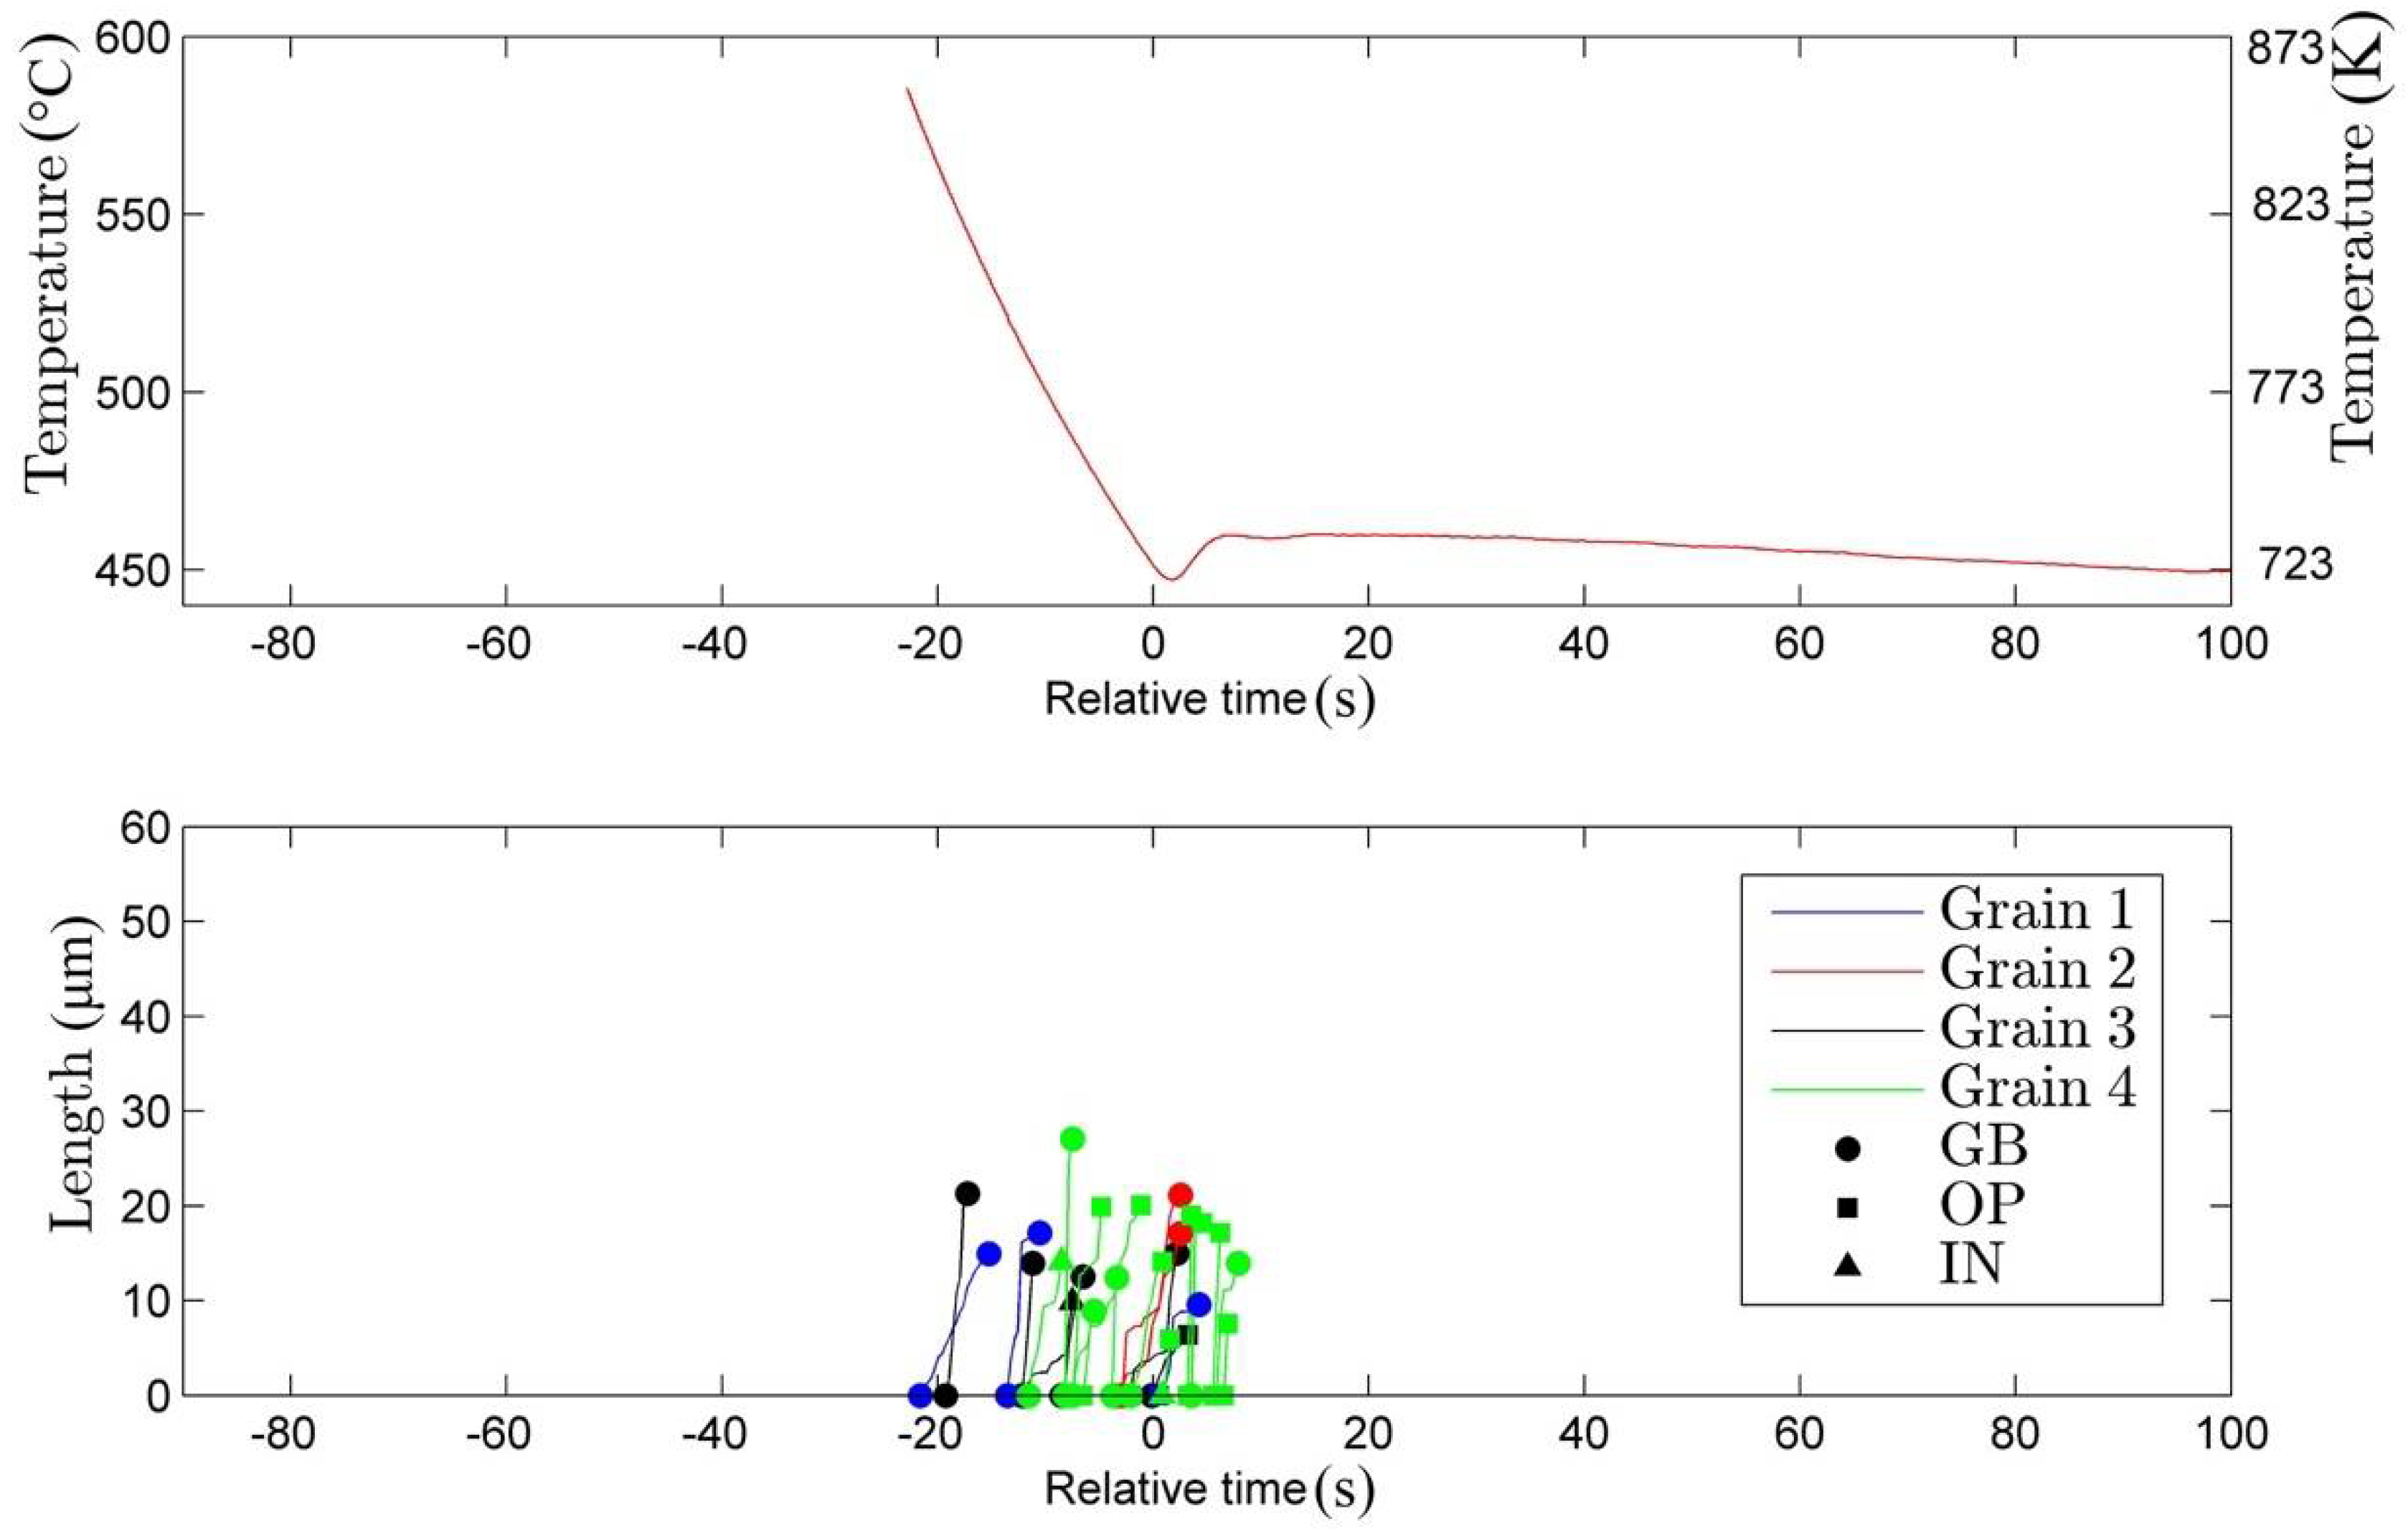
Figure 9.
Temperature versus time and temporal plate growth sequence of bainitic ferrite plates in Fe-0.2C-1.5Mn-2.0Cr during isothermal holding treatment at 773 K (500 °C).
Figure 9.
Temperature versus time and temporal plate growth sequence of bainitic ferrite plates in Fe-0.2C-1.5Mn-2.0Cr during isothermal holding treatment at 773 K (500 °C).

Figure 10.
Temperature versus time and temporal plate growth sequence of bainitic ferrite plates in Fe-0.2C-1.5Mn-2.0Cr during isothermal holding treatment at 823 K (550 °C).
Figure 10.
Temperature versus time and temporal plate growth sequence of bainitic ferrite plates in Fe-0.2C-1.5Mn-2.0Cr during isothermal holding treatment at 823 K (550 °C).

Figure 11.
Temperature versus time and temporal plate growth sequence of bainitic ferrite plates in Fe-0.2C-1.5Mn-2.0Cr during isothermal holding treatment at 923 K (650 °C).
Figure 11.
Temperature versus time and temporal plate growth sequence of bainitic ferrite plates in Fe-0.2C-1.5Mn-2.0Cr during isothermal holding treatment at 923 K (650 °C).

Figure 12.
Total number of observed nucleation events grouped by the observed nucleation sites versus the isothermal temperature of each experiment.
Figure 12.
Total number of observed nucleation events grouped by the observed nucleation sites versus the isothermal temperature of each experiment.

Figure 13.
Temperature dependence on the average nucleation rate per unit area.
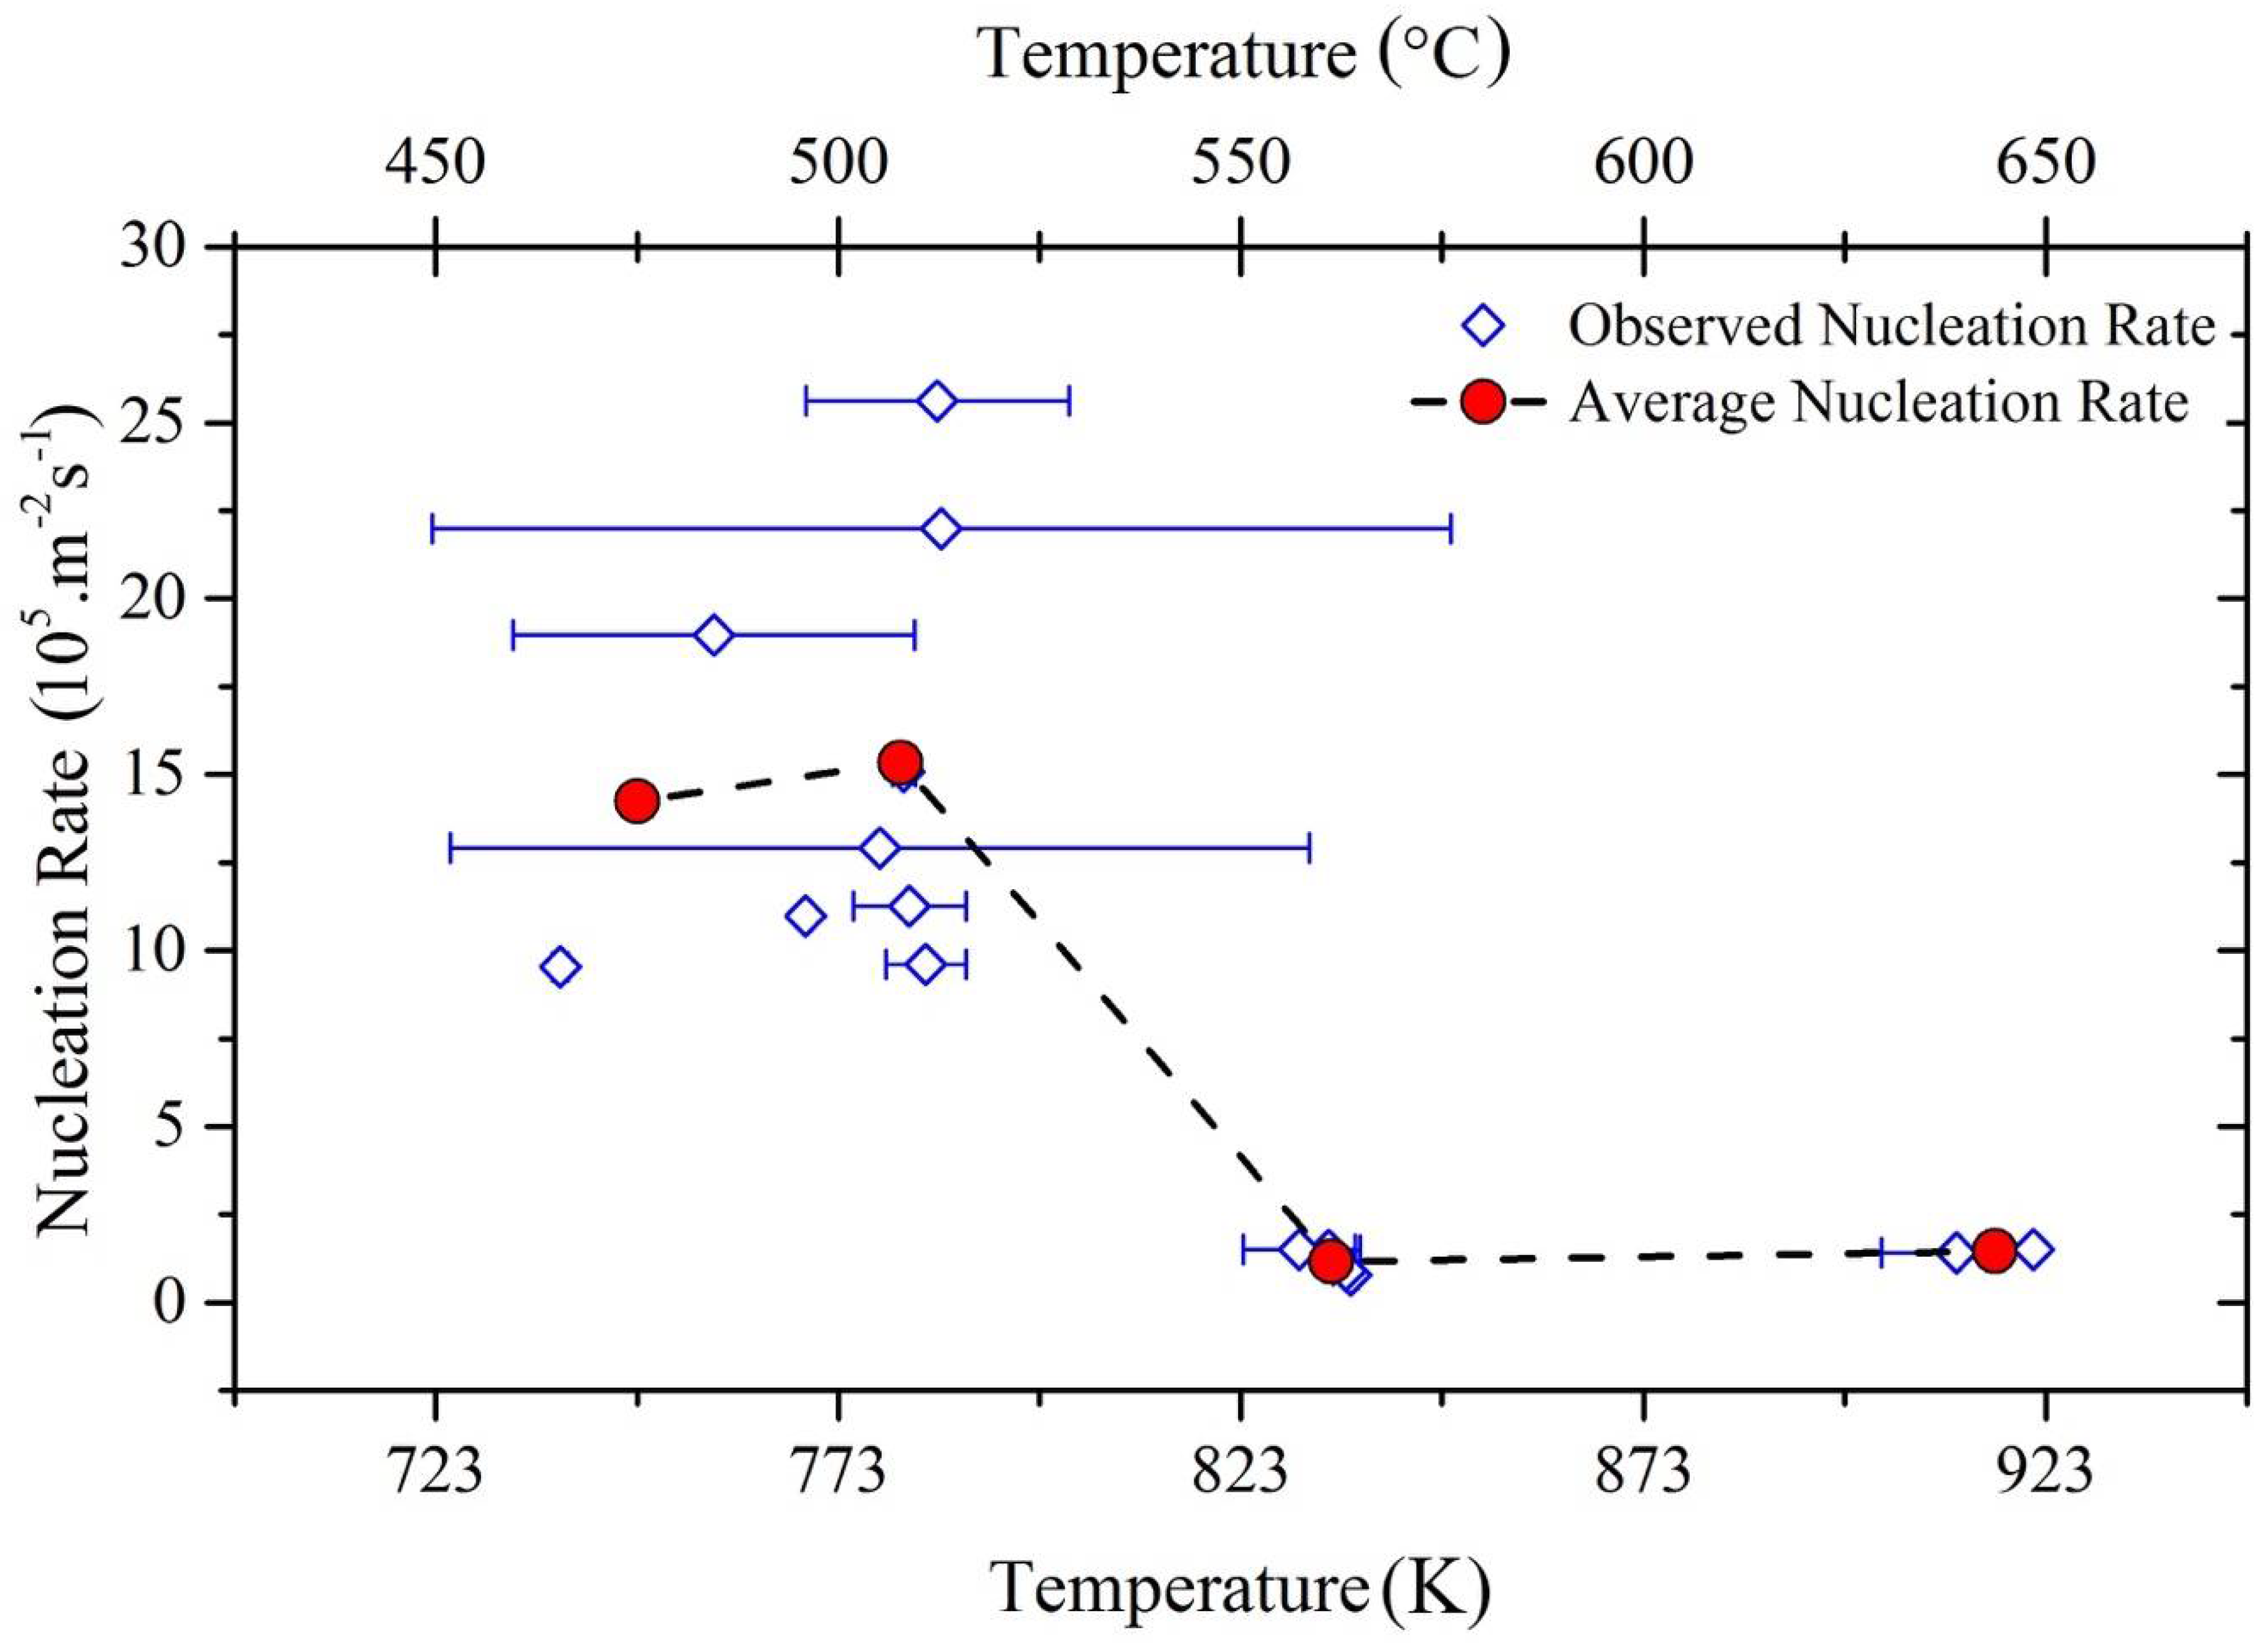
Figure 14.
(a) Nucleation driving force and (b) fitted energy barrier and nucleation rate according to classical nucleation theory.
Figure 14.
(a) Nucleation driving force and (b) fitted energy barrier and nucleation rate according to classical nucleation theory.

Figure 15.
High time resolution measurements on plates observed in Fe-0.2C-1.5Mn-2.0Cr at isothermal holding conditions: (a) T = 723 K (450 °C); (b) T = 773 K (500 °C); (c) T = 823 K (550 °C); and (d) T = 923 K (650 °C).
Figure 15.
High time resolution measurements on plates observed in Fe-0.2C-1.5Mn-2.0Cr at isothermal holding conditions: (a) T = 723 K (450 °C); (b) T = 773 K (500 °C); (c) T = 823 K (550 °C); and (d) T = 923 K (650 °C).

Figure 16.
Lengthening rates of bainite plates (in logarithmic scale) observed to nucleate and grow during the cooling step and the isothermal holding step at different locations, namely grain boundary (GB), inside the grain (IN) and on preformed bainite (OP) at (a) T = 723 K (450 °C), (b) T = 773 K (500 °C), (c) T = 823 K (550 °C) and (d) T = 923 K (650 °C).

Figure 17.
Predicted maximum lengthening rates with Equation (3) in logarithmic scale and the experimentally-recorded growth data at different temperatures.
Figure 17.
Predicted maximum lengthening rates with Equation (3) in logarithmic scale and the experimentally-recorded growth data at different temperatures.


Table 1.
Testing matrix containing the details of the alloy composition and thermal treatments applied with in situ optical recording.
Table 1.
Testing matrix containing the details of the alloy composition and thermal treatments applied with in situ optical recording.
| Steel Composition (mass%) | Austenitizing Temperature | Isothermal Treatment Temperature | ||
|---|---|---|---|---|
| C | Mn | Cr | ||
| 0.2 | 1.5 | 2.0 | 1223 K (950 °C) | 723 K (450 °C) |
| 1233 K (960 °C) | 773 K (500 °C) | |||
| 1233 K (960 °C) | 823 K (550 °C) | |||
| 1373 K (1100 °C) | 923 K (650 °C) | |||
© 2018 by the authors. Licensee MDPI, Basel, Switzerland. This article is an open access article distributed under the terms and conditions of the Creative Commons Attribution (CC BY) license (http://creativecommons.org/licenses/by/4.0/).
Share and Cite
MDPI and ACS Style
Sainis, S.; Farahani, H.; Gamsjäger, E.; Van der Zwaag, S. An In-Situ LSCM Study on Bainite Formation in a Fe-0.2C-1.5Mn-2.0Cr Alloy. Metals 2018, 8, 498. https://doi.org/10.3390/met8070498
AMA Style
Sainis S, Farahani H, Gamsjäger E, Van der Zwaag S. An In-Situ LSCM Study on Bainite Formation in a Fe-0.2C-1.5Mn-2.0Cr Alloy. Metals. 2018; 8(7):498. https://doi.org/10.3390/met8070498
Chicago/Turabian StyleSainis, Salil, Hussein Farahani, Ernst Gamsjäger, and Sybrand Van der Zwaag. 2018. "An In-Situ LSCM Study on Bainite Formation in a Fe-0.2C-1.5Mn-2.0Cr Alloy" Metals 8, no. 7: 498. https://doi.org/10.3390/met8070498
Note that from the first issue of 2016, this journal uses article numbers instead of page numbers. See further details here.