Article

An In Vitro Corrosion Study of Open Cell Iron Structures with PEG Coating for Bone Replacement Applications

by
Lucia Haverová
1,
Renáta Oriňaková
1,*,
Andrej Oriňak
1,
Radka Gorejová
1,
Matej Baláž
2,
Petr Vanýsek
3,4,
Miriam Kupková
5,
Monika Hrubovčáková
5,
Pavol Mudroň
6,
Jozef Radoňák
7,
Zuzana Orságová Králová
1 and
Andrea Morovská Turoňová
1
1
Department of Physical Chemistry, Faculty of Science, P. J. Šafárik University in Košice, Moyzesova 11, SK-04154 Košice, Slovakia
2
Department of Mechanochemistry, Institute of Geotechnics, Slovak Academy of Sciences, Watsonova 45, SK-04001 Košice, Slovakia
3
Department of Electrical and Electronic Technology, Brno University of Technology, Technická 3058/10, CZ-61200 Brno, Czech Republic
4
Department of Chemistry and Biochemistry, Northern Illinois University, DeKalb, IL 60115, USA
5
Institute of Materials Research, Slovak Academy of Sciences, Watsonova 47, SK-04001 Košice, Slovakia
6
Clinic of Ruminants, University of Veterinary Medicine and Pharmacy in Košice, Komenskeho 73, SK-04181 Košice, Slovakia
7
1st Department of Surgery, P. J. Šafárik University, Trieda SNP 1, SK-040 11 Košice, Slovakia
*
Author to whom correspondence should be addressed.
Metals 2018, 8(7), 499; https://doi.org/10.3390/met8070499
Submission received: 15 May 2018 / Revised: 15 June 2018 / Accepted: 26 June 2018 / Published: 28 June 2018

Abstract

:
Iron-based substrates with polyethylene glycol coating were prepared as possible materials for biodegradable orthopedic implants. Biodegradable materials that provide mechanical support of the diseased tissue at the time of implanting and then disappear gradually during the healing process are sometimes favored instead of permanent implants. The implant degradation rate should match the time of the tissue regrowth. In this work, the degradation behavior of iron-based foams was studied electrochemically during immersion tests in Hanks’ solution. The corrosion rate of the polyethylene glycol-coated samples increased and the corrosion potential shifted to more negative values. This indicates an enhanced degradation rate as compared to the uncoated material, fulfilling the goal of being able to tune the degradation rate. It is the interfacial interaction between the hydrophilic polymer layer and the iron surface that is responsible for the enhanced oxidation rate of iron.

Graphical Abstract

1. Introduction

Degradable materials represent a new generation of implantable systems. These materials are currently intensively studied, because of their potential use as implants in orthopedic and cardiovascular surgery [1]. These novel kinds of implants can adapt to the needs of the human body in which they are implanted. Their role is to support initially the formation of the healing injured tissues and subsequently to degrade gradually, while the tissue function is repaired [2,3,4,5,6]. The degradable implant approach brings great benefits over the techniques used today. The biodegradable implants can enhance and facilitate the treatment and reduce the number of invasive procedures, as well as save costs [5,6,7,8,9,10,11,12,13].
Biomaterials suitable for degradable bone implant applications must exhibit appropriate mechanical [14] and biological properties [15,16,17]. They must be flexible, mechanically tough, nontoxic, biocompatible [18,19,20], and their corrosion rate must match the intended purpose [21,22,23]. Such materials are based on biocompatible metals such as magnesium, iron, and zinc [22,24,25] which gradually corrode. Scientists make great efforts to prevent the corrosion of industrial structures [26,27] and permanent medical devices [28]. However, the corrosion process is desired in the degradation of temporary metal implants. There are a number of publications about degradable orthopedic implants based on magnesium [25,29]; however, fewer studies exist on biodegradable bone implants based on iron [30,31,32,33]. Iron can provide certain advantages over magnesium-based devices, such as higher strength, hardness, wear resistance, and toughness. Magnesium has also a drawback because its corrosion rate is rather fast and during its oxidation a significant amount of hydrogen gas is released, which also causes appreciable local change in the pH [29,34,35,36]. Iron, with its slower corrosion rate, is considered an interesting candidate for use as a biodegradable implant material and preliminary in vivo studies have already shown that it has potential for medical applications [37].
Iron is eobiotic and present in all cells of the human body. It is essential in the formation of hemoglobin and helps to convert provitamin beta-carotene to active the vitamin [38]. Its presence in the body arising from the corroding implant will therefore not interfere with normal physiological functions unless a threshold limit is exceeded [39]. While the benefits that iron-based degradable biomaterials provide are promising, the iron degradation rate for this purpose is slow. This slow degradation rate can have similar disadvantages to those of permanent implants [40,41,42]. To overcome this problem, addition of appropriate alloying elements to iron [43] or implant surface treatment, for example the creation of a porous polymer film, can hasten the degradation rate [44].
Coatings are used to alter the bioactivity and modify the surface properties of metallic implants. Up to 75% of coating materials for degradable iron-based biomaterials studied for use in bone repair and regeneration are ceramic coatings based on hydroxyapatite and other calcium phosphates. The second largest group of coating materials represents polymers. Bioceramic coatings improve biocompatibility and the bone bonding ability of metallic implants, in addition to and enhancing bone integration [45,46,47]. The diverse effects of bioceramic coatings on the mechanical and corrosion behavior of coated materials were observed depending on the composition, amount, size, structure, morphology, and deposition method of the coating layer [45,48,49,50]. The combination of bioceramics with polymer in composite coating led to the desired mechanical properties (elastic modulus, tensile strength) and beneficial influence on cell adhesion and differentiation [33,51,52]. The application of biodegradable polymer coatings represents a new approach to tailor the degradation behavior of iron materials for bone repair. The polymeric coating of the implant can help to improve osseointegration, bone growth, and regeneration [44]. The poly(lactic-co-glycolic acid) (PLGA) coating increased the degradation rate and mechanical properties (compressive strength, toughness) of porous iron samples [53]. Polyethylene glycol (PEG) is often used as the coating material for implants [54]. PEG is a biocompatible polymer that is soluble in water. It is nontoxic, possesses non-antigenicity and immunogenicity, it does not damage biological molecules and cells, and it suppresses platelet adhesion. Because PEG is hydrophilic, it can dissolve in water, especially if the PEG film on the surface of materials is formed by physical absorption [55].
Because the material surface is in direct contact with body tissues, it is necessary to adjust its chemical, physical, biological, and morphological properties to a specific application [56]. Moreover, the success of an implant depends also on the shape or form of the applied material [7]. The shape, internal structure, and design of the implant must be adapted to the characteristics of the replaced tissue [56]. The optimal design for bone applications seems to be an open cell structure that is similar to the bone tissue construction itself [57]. Such a structure can be achieved by using powder metallurgy, which is a simple, inexpensive, and effective method [58,59,60]. The mechanical properties of devices with an open cell structure are determined by the material, porosity (morphology, size, and distribution of pores), and density of the created foam [61,62]. The resulting product can have a near-net shape with uniform morphology [58,59,63], which can enable the use of the porous materials in very specific applications [64,65].
The aim of the present study was to prepare open cell structures based on carbonyl iron by the powder metallurgy method, coated with PEG. To the best of our knowledge, this is the first time that a polymeric coating layer was used to affect the degradation rate of iron foam biomaterials. The effect of the polymer coating on the corrosion properties of the prepared structures was evaluated. A combination of the nonhomogeneous corrosion attack (pitting) in the iron layer and the oxidative degradation of the PEG layer is suggested as the main form of degradation. The mechanical and tensile properties of coated iron foams are critical for their use for in vivo trauma instruments. The influence of PEG coating layer on biocompatibility and mechanical properties of these materials is the subject of future studies.

2. Materials and Methods

2.1. Cellular Structure Preparation

Cellular iron structures were prepared by the impregnation of polyurethane foam (PUR) (Filtren® TM 25133 with the cell size 1060–1600 µm, Eurofoam TP spol. s r.o., Brno, Czech Republic) with a suspension formed by 7 g of carbonyl iron powder (CIP) provided by BASF, Ludwigshafen, Germany (type CC d50 3.8–5.3, 3.8–5.3 μm) in 6 mL of ultrapure water with 200 mg of gelatin. Gelatin (Sigma-Aldrich, St. Louis, MO 63103, USA) was dissolved in water at 60 °C. The composition of CIP was 99.5% Fe, 0.05% C, 0.01% N, and 0.18% O. The foam impregnation was carried out for 24 h. Then the prepared structures were sintered in a tube furnace Aneta 1 (ANETA, Trenčianská Teplá, Slovak Republic). At first, the formed material was held at 450 °C for 2 h in a nitrogen atmosphere. The final structure was obtained by sintering at 1120 °C for 1 h in a reduction atmosphere (90% N2, 10% H2), resulting in the full removal of the polyurethane foam.

2.2. Coating of the Iron Samples

Iron foams in form of cylinders (Ø 10 mm, h 20 mm) with a density of about 24 kg/m3 were coated with polyethylene glycol 4000 (PEG) (Sigma-Aldrich, St. Louis, MO 63103, USA) through a sol-gel process. Three solutions with 5, 10, and 15 wt. % PEG were prepared by dissolving the polymer in 96% ethanol (Mikrochem spol. s.r.o., Pezinok, Slovak Republic). The prepared solutions were equilibrated at room temperature for 24 h. Ultrasonically cleaned specimens (in acetone, ethanol, and distilled water for 10 min each) were immersed in the PEG solutions for 3 h at a laboratory temperature. Subsequently, the coated iron structures were dried for 3 h at 45 °C. The abbreviations for the final materials studied in this work are Fe-PEG1, Fe-PEG2, Fe-PEG3 for the samples immersed into 5, 10, and 15 wt. % PEG solution, respectively.

2.3. Material Characterization

The microstructure of the samples was visualized by a scanning electron microscope (SEM) coupled with an energy dispersive spectrometer (EDX) (JSM-7000F, JEOL, Tokyo, Japan with EDX INCA, Oxford Instruments, Abingdon, UK).
The specific surface area (SBET) of the foams was determined by a low-temperature nitrogen adsorption method using a NOVA 1200 e Surface Area and Pore Size Analyzer (Quantachrome Instruments, London, UK). The values were calculated using the Brunauer-Emmett-Teller (BET) theory.
The FT-IR spectra were recorded using a Tensor 29 infrared spectrometer (Bruker Optik GmbH, Ettlingen, Germany) using the attenuated total reflection (ATR) method.
The Raman spectra were recorded using a Renishaw inVia spectrophotometer (Renishaw UK Sales Ltd., Wotton-under-Edge, UK). All spectra were recorded using a 532-nm laser from 100 cm−1 to 4000 cm−1, at a 50% laser power. The samples were exposed to the laser for 10 s. All experiments were performed at room temperature. Each spectrum represents the average of five measurements.

2.4. Electrochemical Degradation Test

2.4.1. Potentiodynamic Polarization

The electrochemical degradation tests were carried out using an Autolab PGSTAT 302 N potentiostat (Metrohm, Herisau, Switzerland). The measurements were conducted in a three-electrode system with an Ag/AgCl/KCl (3 mol/L) reference electrode, a platinum counter electrode, and an iron sample as the working electrode. Corrosion was studied in Hanks’ solution (pH = 7.4) (composition in Table 1). A constant temperature of 37 ± 2 °C was maintained during the experiment. The potentiodynamic polarization studies were carried out from −900 mV to 200 mV (vs. Ag/AgCl/KCl (3 mol/L)) at a polarization scan rate of 0.1 mV/s. The corrosion rate (CR in mm/year) was calculated using Equation (1) based on ASTM G59 [66]:
C R = j c o r r   K   E W ρ
where jcorr is the current density (µA/cm2), K is a constant that defines the units for the corrosion rate (3.27 × 10⁻³ for CR in mm/year), EW is the equivalent weight (27.92 g/eq for Fe), and ρ is the density of iron (7.86 g/cm3). In each analysis three samples were studied.

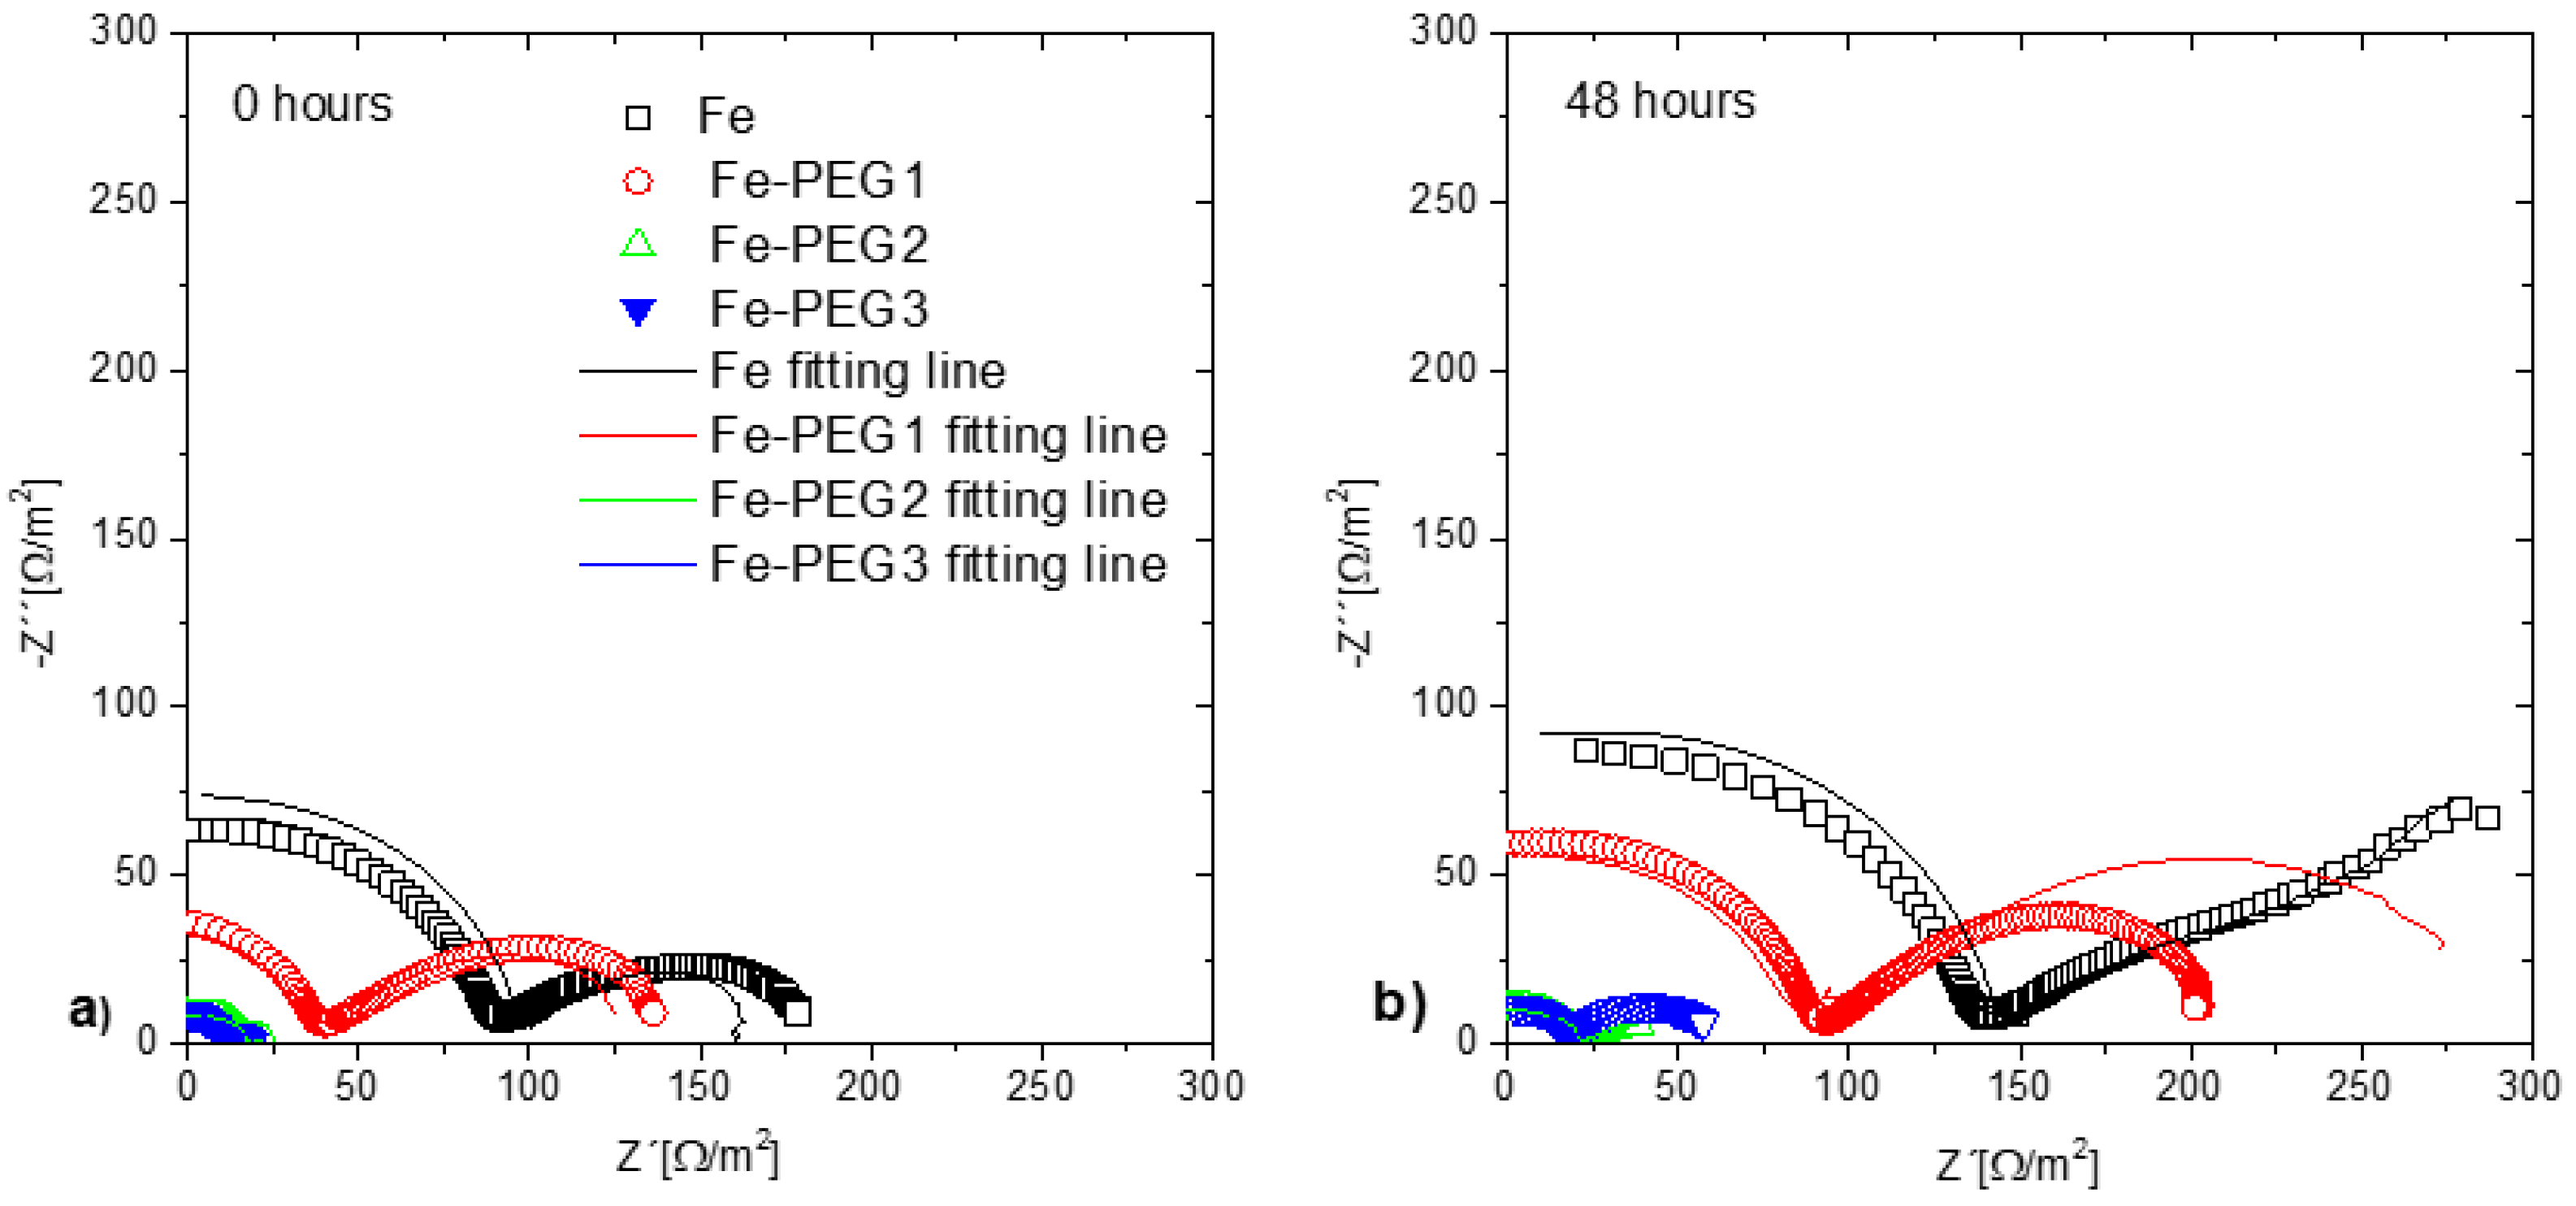
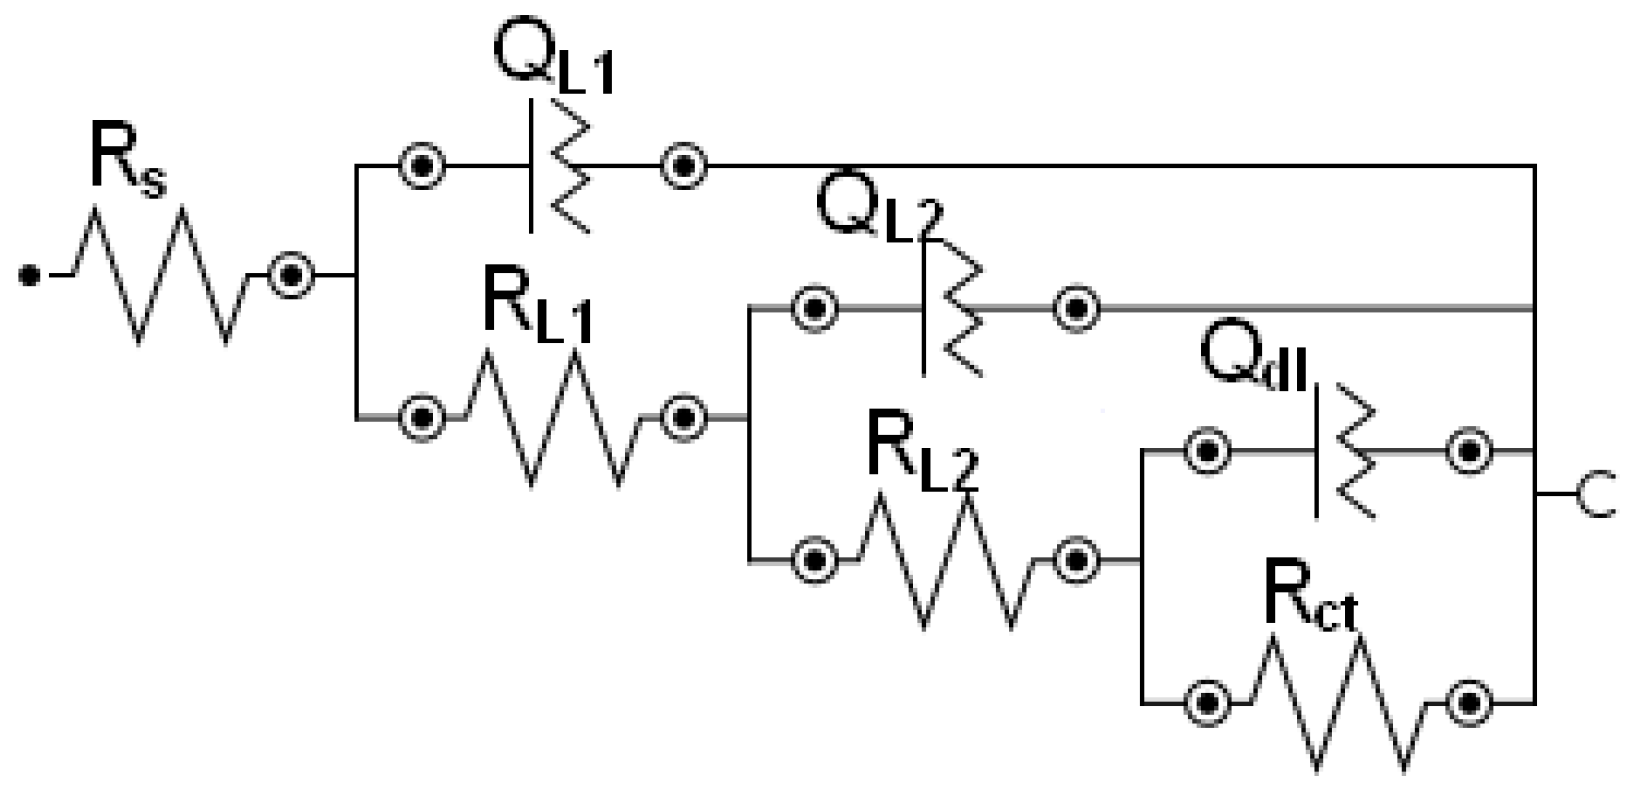
2.4.2. Electrical Impedance Spectroscopy

Electrical impedance spectroscopy (EIS) measurements were performed on the samples immersed in Hanks’ solution using an Autolab PGSTAT 302 N potentiostat (Metrohm, Herisau, Switzerland) and the same three-electrode setup as that used for the potentiodynamic polarization. The EIS measurements were carried out in the frequency range from 10 mHz to 100 kHz with an AC perturbation amplitude of 10 mV. The bias DC potential was equal to the open circuit potential (OCP) determined before the EIS measurements. Three groups of iron open cell structures were examined. The first group consisted of the samples not yet corroded in Hanks’ solution. The next two ensembles were examined after immersion in Hanks’ solution for 24 h and 48 h.

2.5. Static Immersion Test

At first, the samples were weighted to obtain initial weights and then the samples were ultrasonically cleaned in acetone and ethanol for 10 min each. Experimental specimens were immersed in 10 mL of Hanks’ solution for 12 weeks and the temperature was kept at 37 °C using a heating mantle. Samples were taken out from the solution after every 7 days of treatment, ultrasonically cleaned in ethanol and distilled water for 10 min each, air dried, and weighed. The corrosion rate (CR in mm/year) was calculated from the mass changes using Equation (2) based on ASTM G31 standard [67]:
C R = 8.76 × 10 4   ( m i m f ) ρ   A   t
where mi and mf are the initial mass (g) and final mass after corrosion (g), A is the exposed surface area of the sample (cm2), ρ is the density (g/cm3), and t is the immersion time (h). In each analysis three samples were studied.

3. Results

The amount of the polymeric coating deposited onto the surface of the sintered iron samples was determined from the mass differences after and before the coating layer deposition. The values were about 8 mg, 20 mg, and 35 mg for the Fe-PEG1, Fe-PEG2, and Fe-PEG3 samples, respectively. This corresponded to the content of the PEG in the coated samples of about 0.8 wt. %, 1.5 wt. %, and 3.0 wt. %, respectively. The interaction between PEG and iron metal is due to a dipole-cation binding between the ether group of the polymer and the positive charge of the partially oxidized surface of the carbonyl iron substrate. The specific surface area (SBET) of all samples was measured. The values of SBET were 0.48 m2/g, 0.80 m2/g, and 0.61 m2/g for uncoated iron, Fe-PEG1, and the Fe-PEG2 samples, respectively. The value of SBET for Fe-PEG3 was below the detection limit of the instrument and thus led to an unsatisfactory measurement. The low value could be associated with lower porosity and smoothing of the edges of iron structures caused by the formation of a more coherent coating layer with a higher content of PEG.

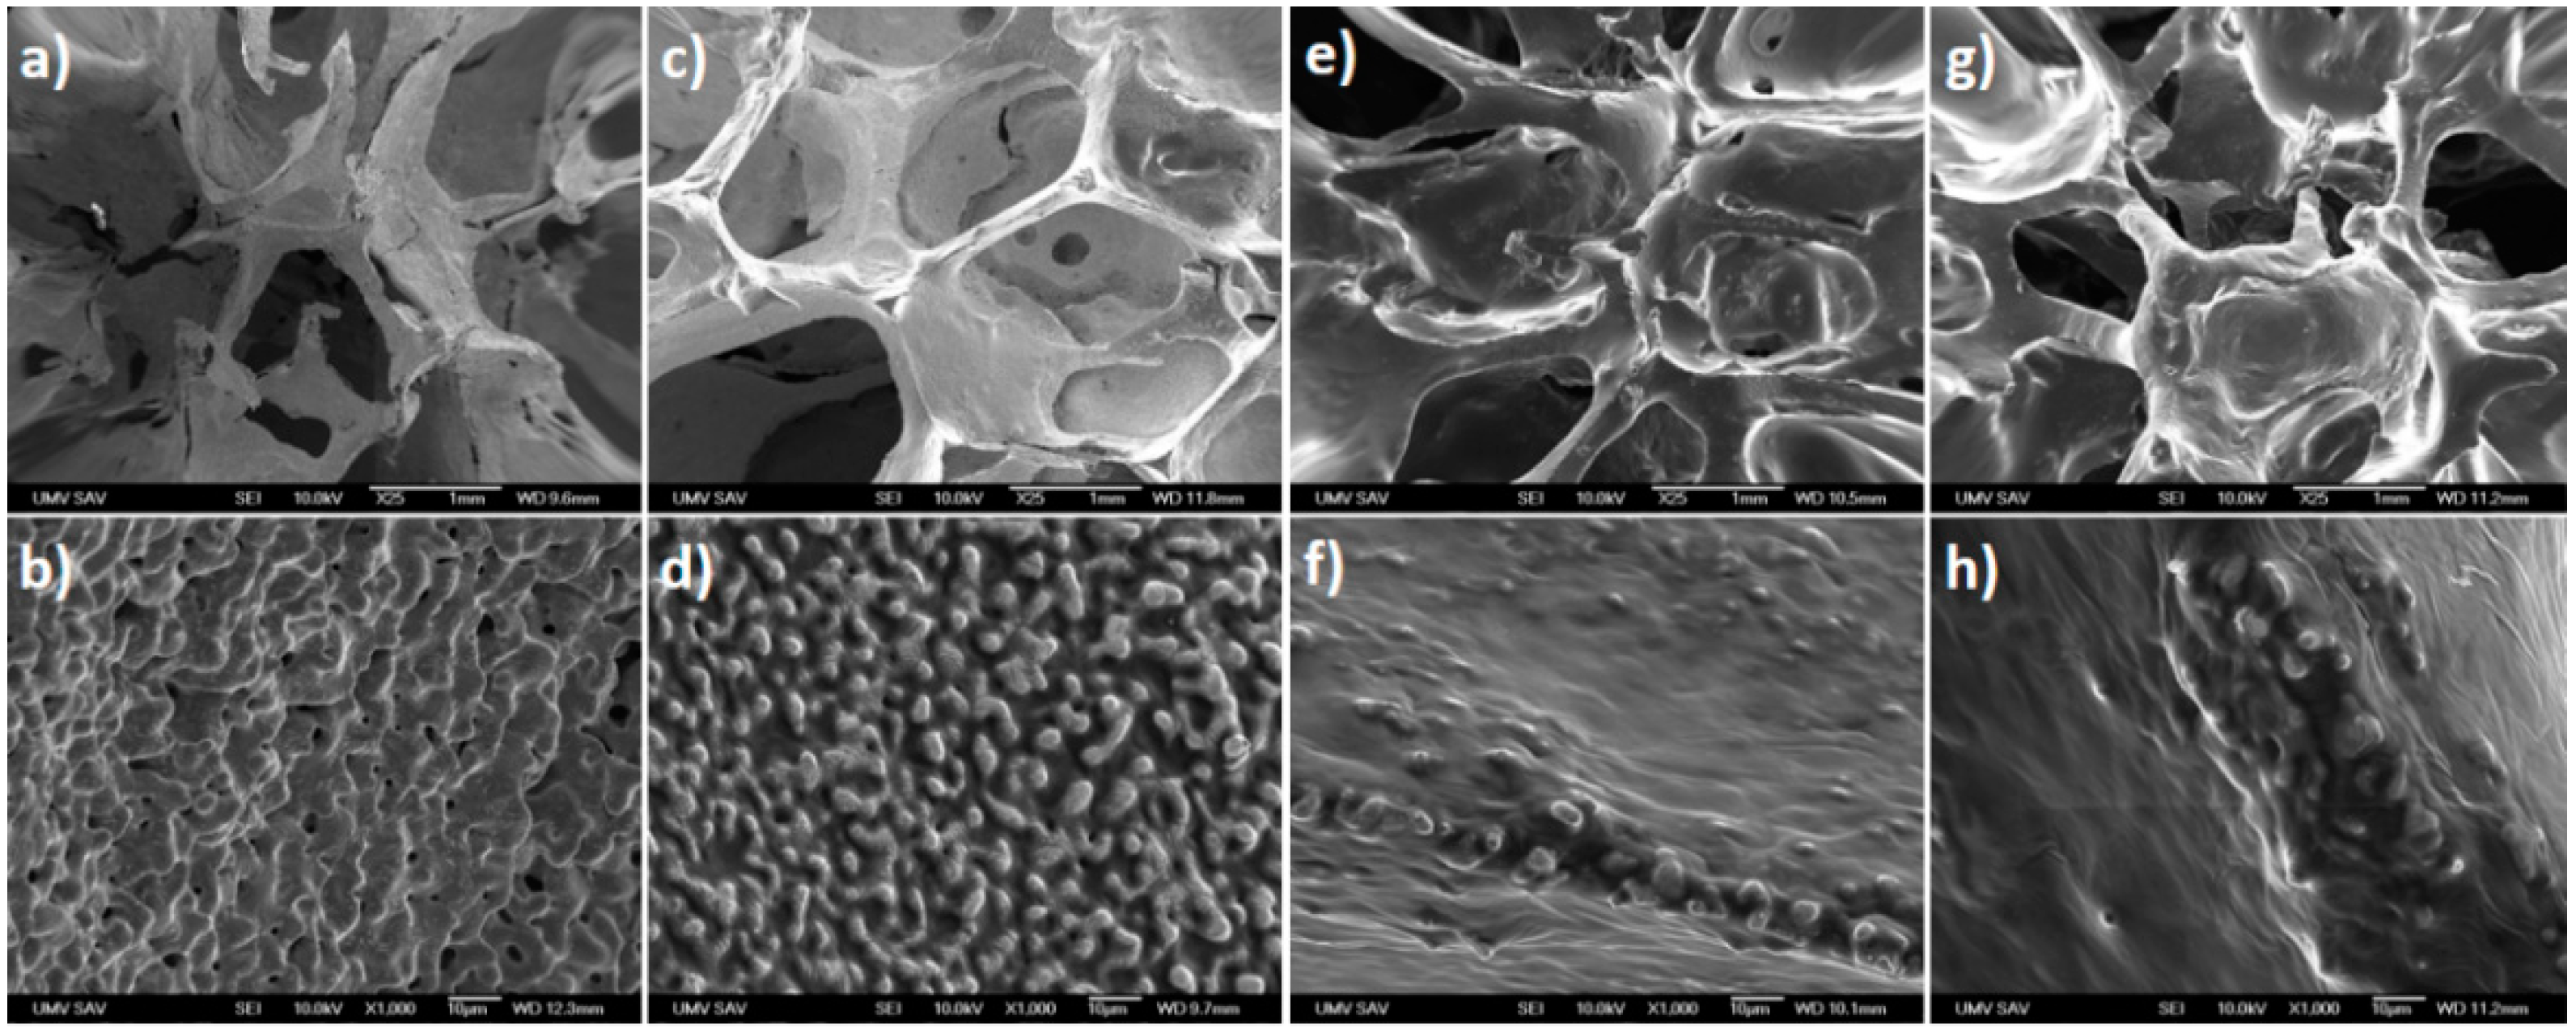
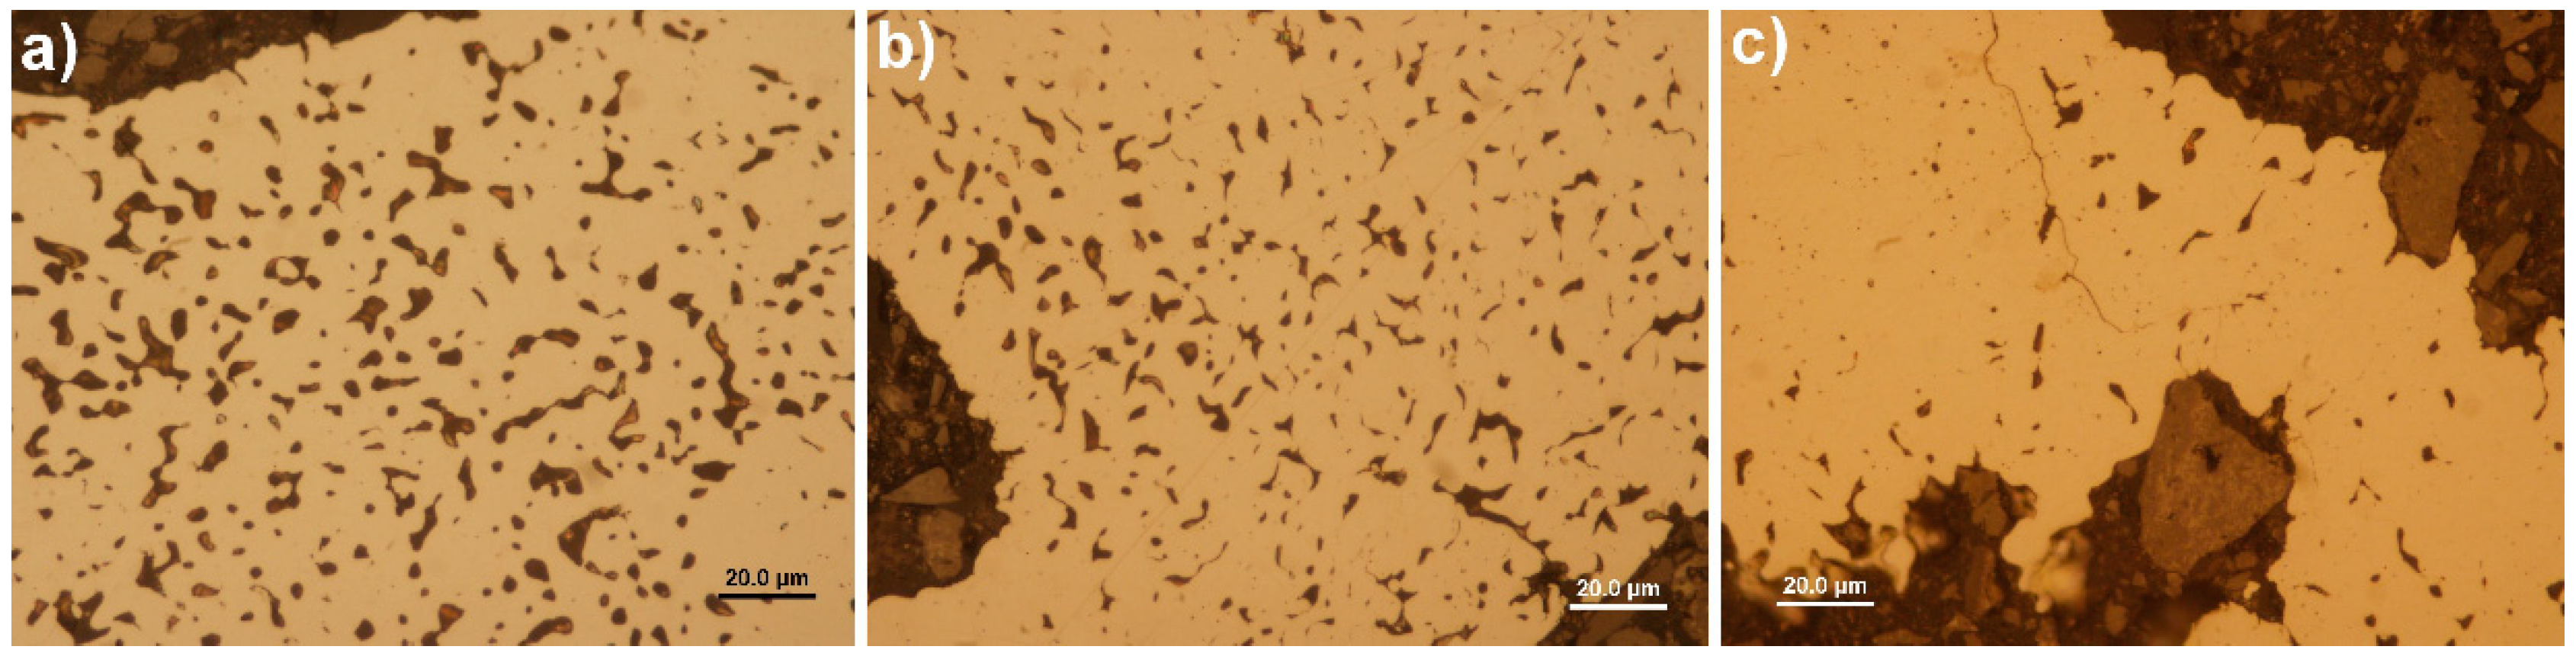
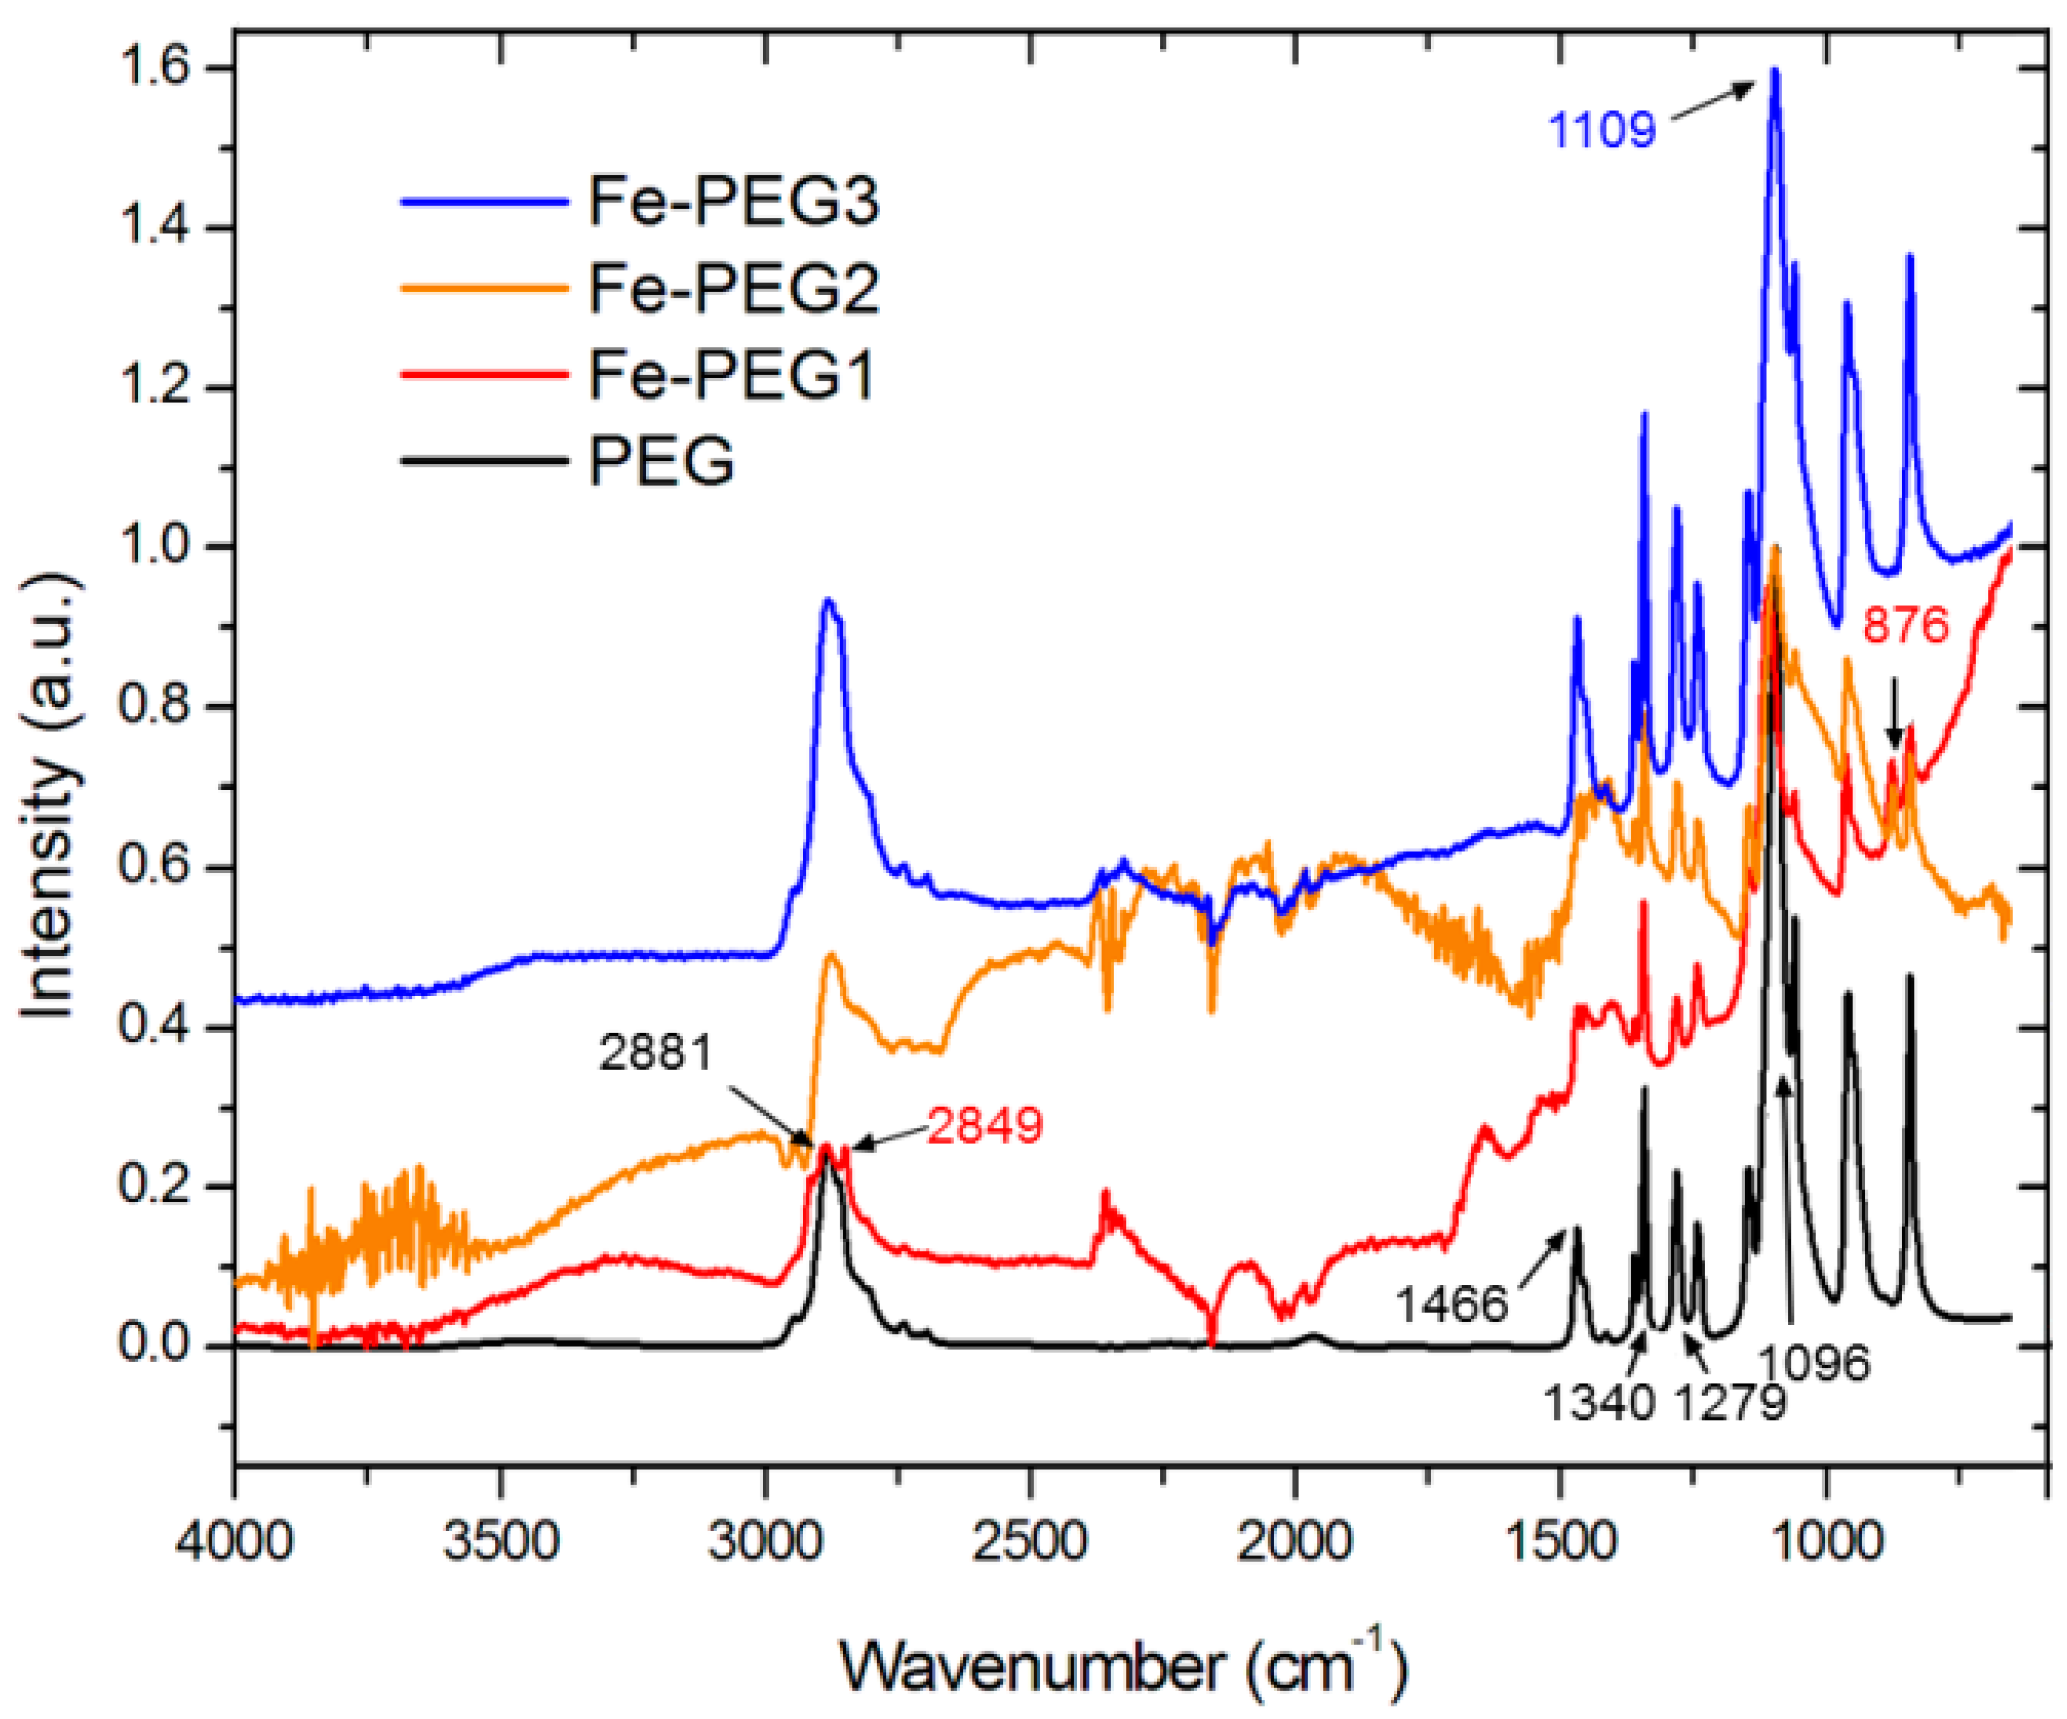
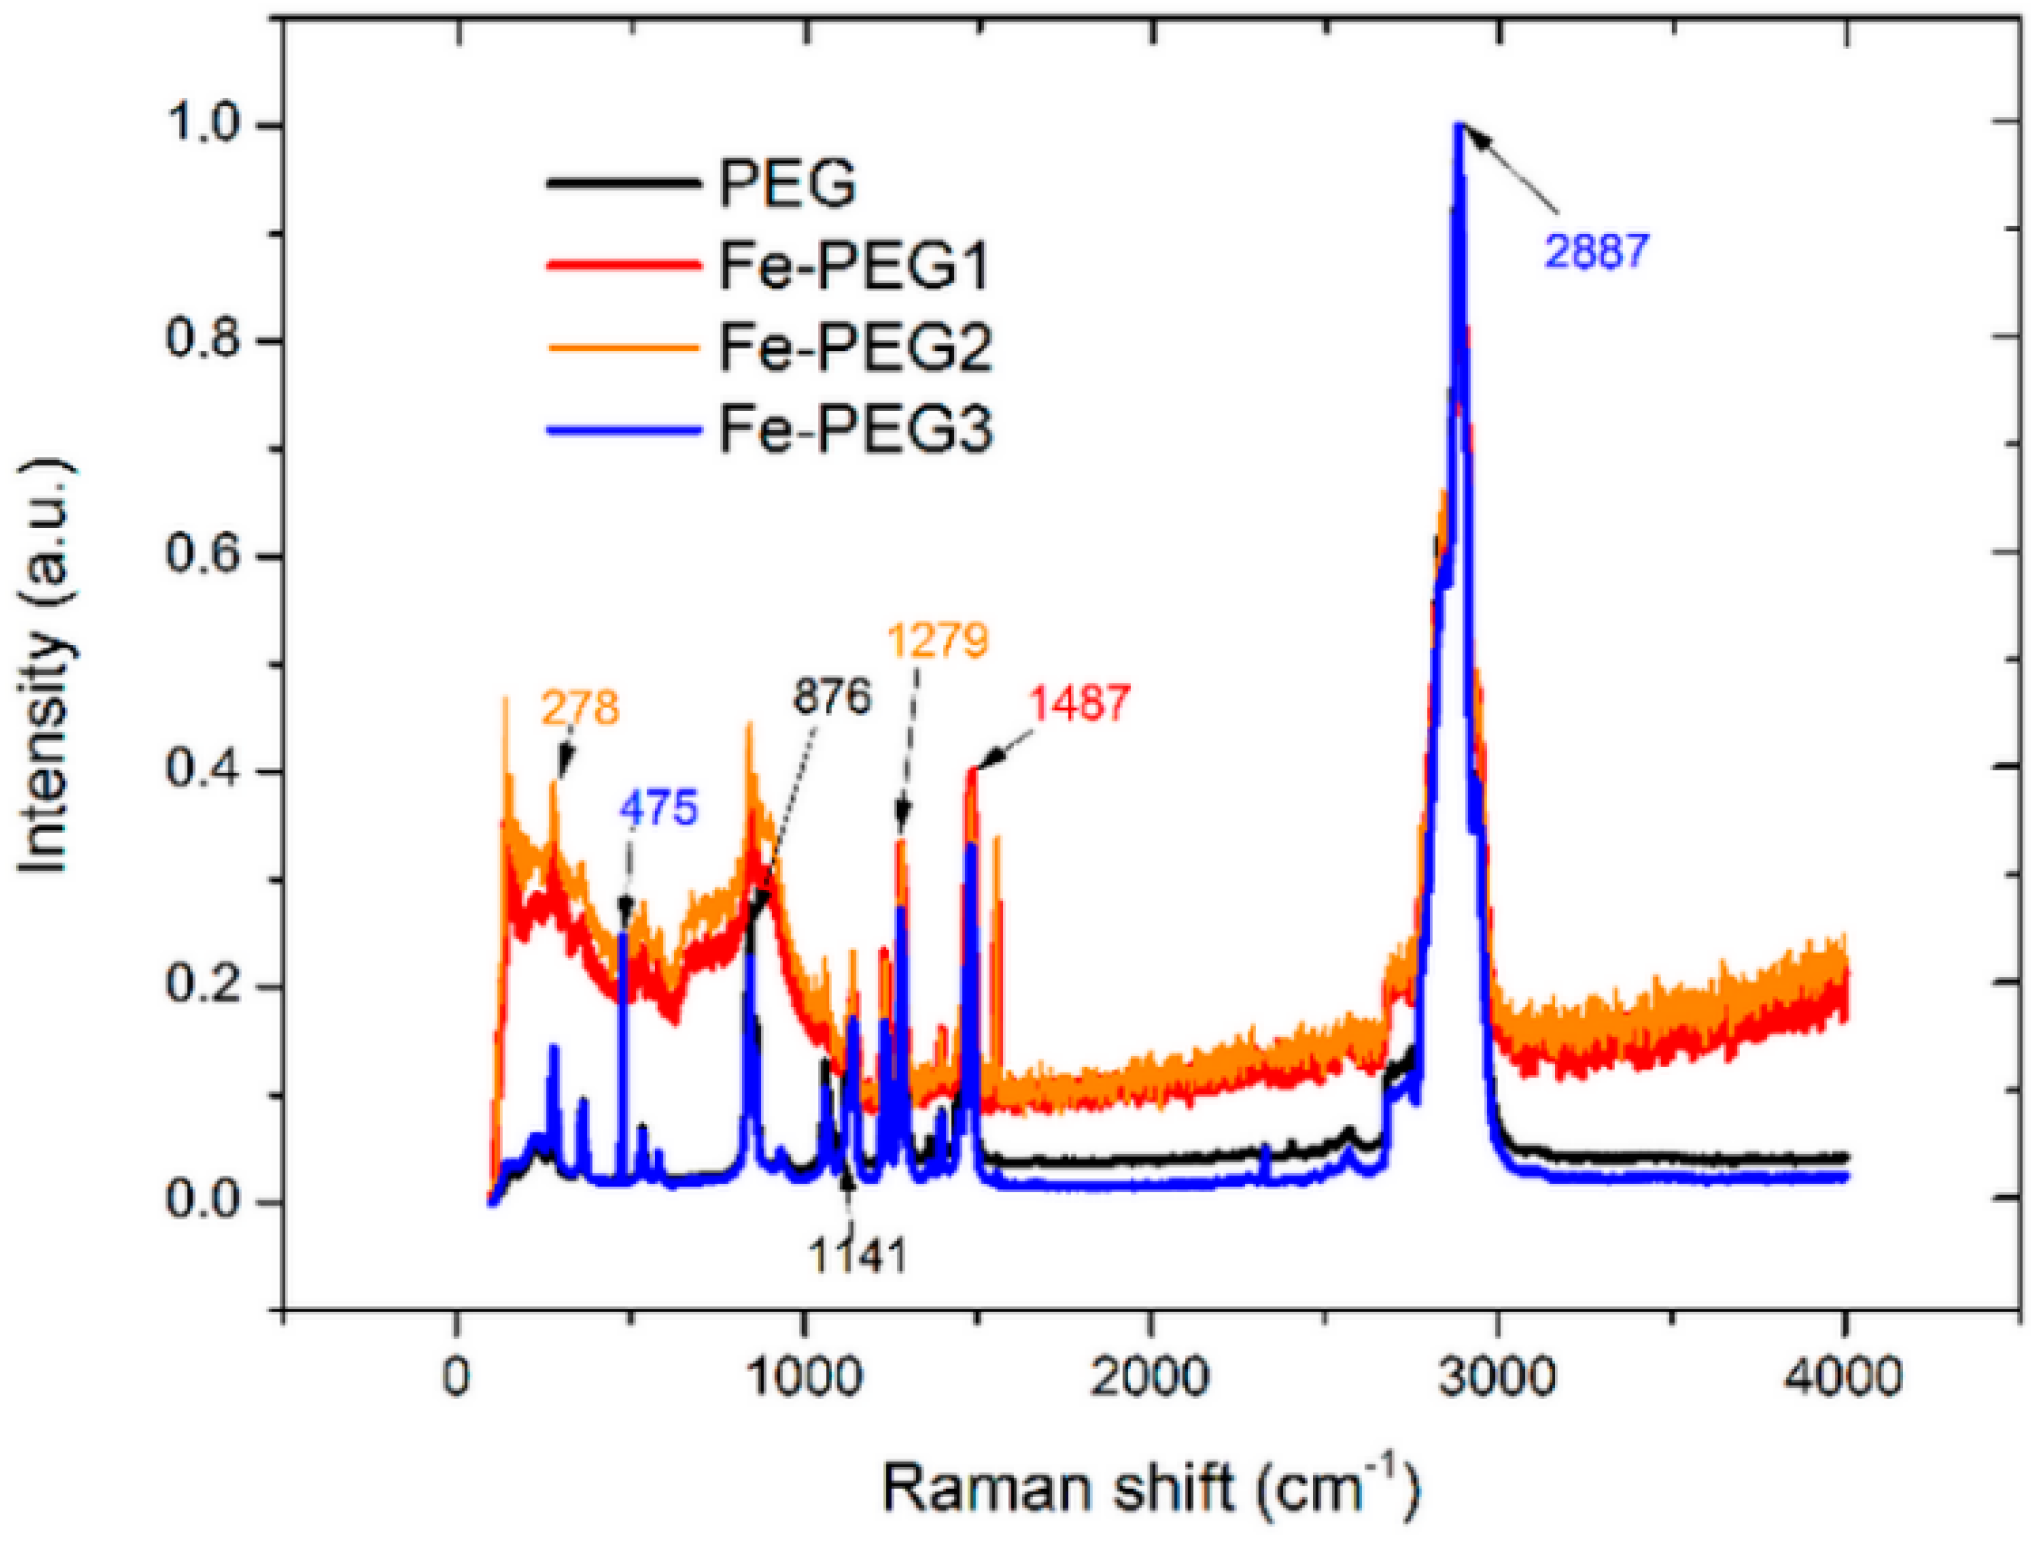
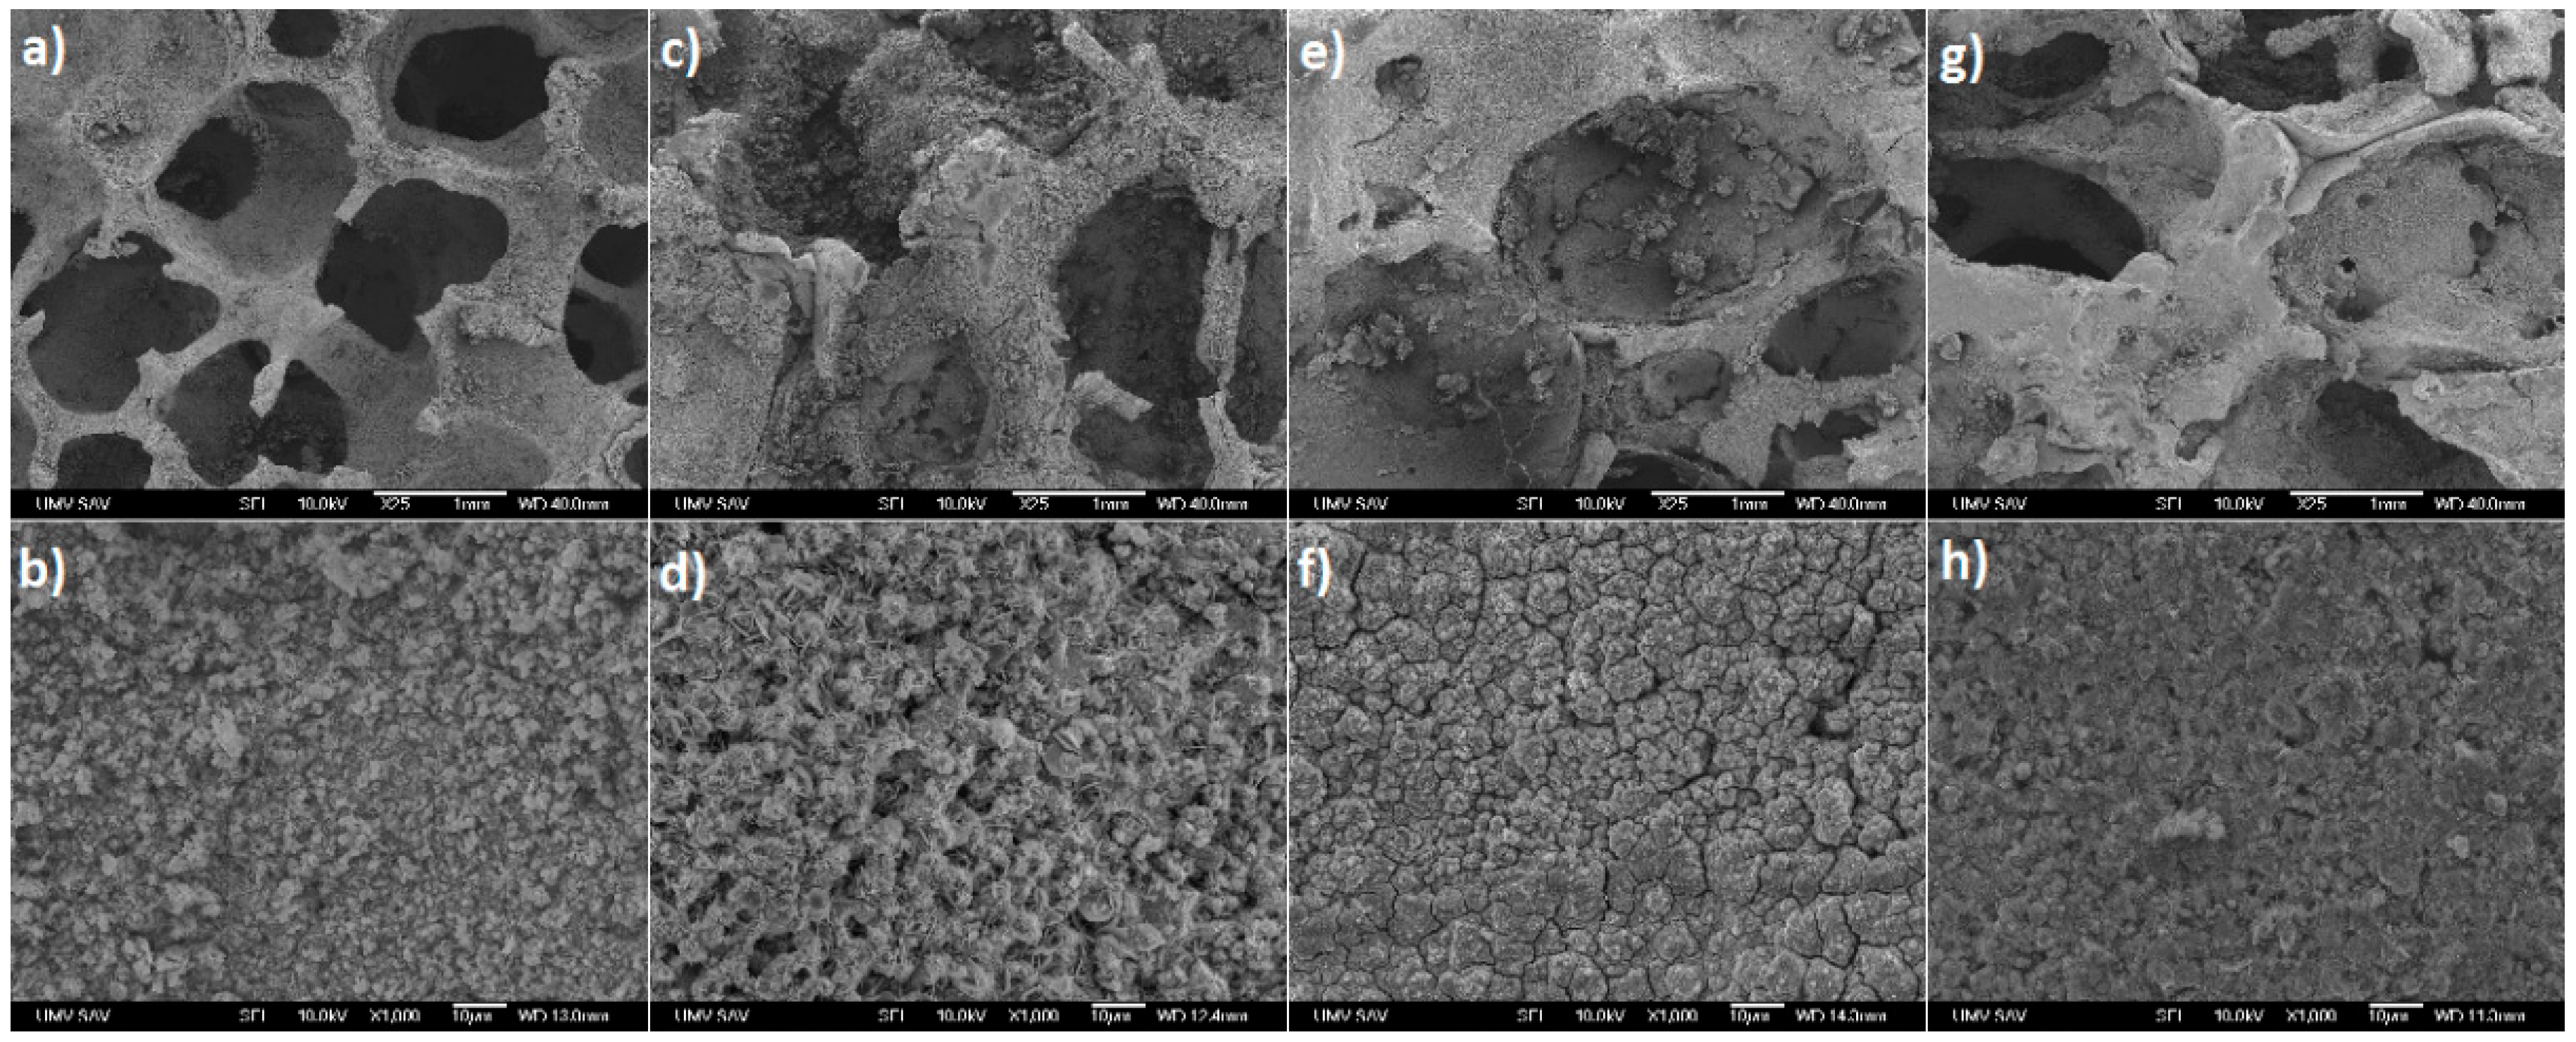
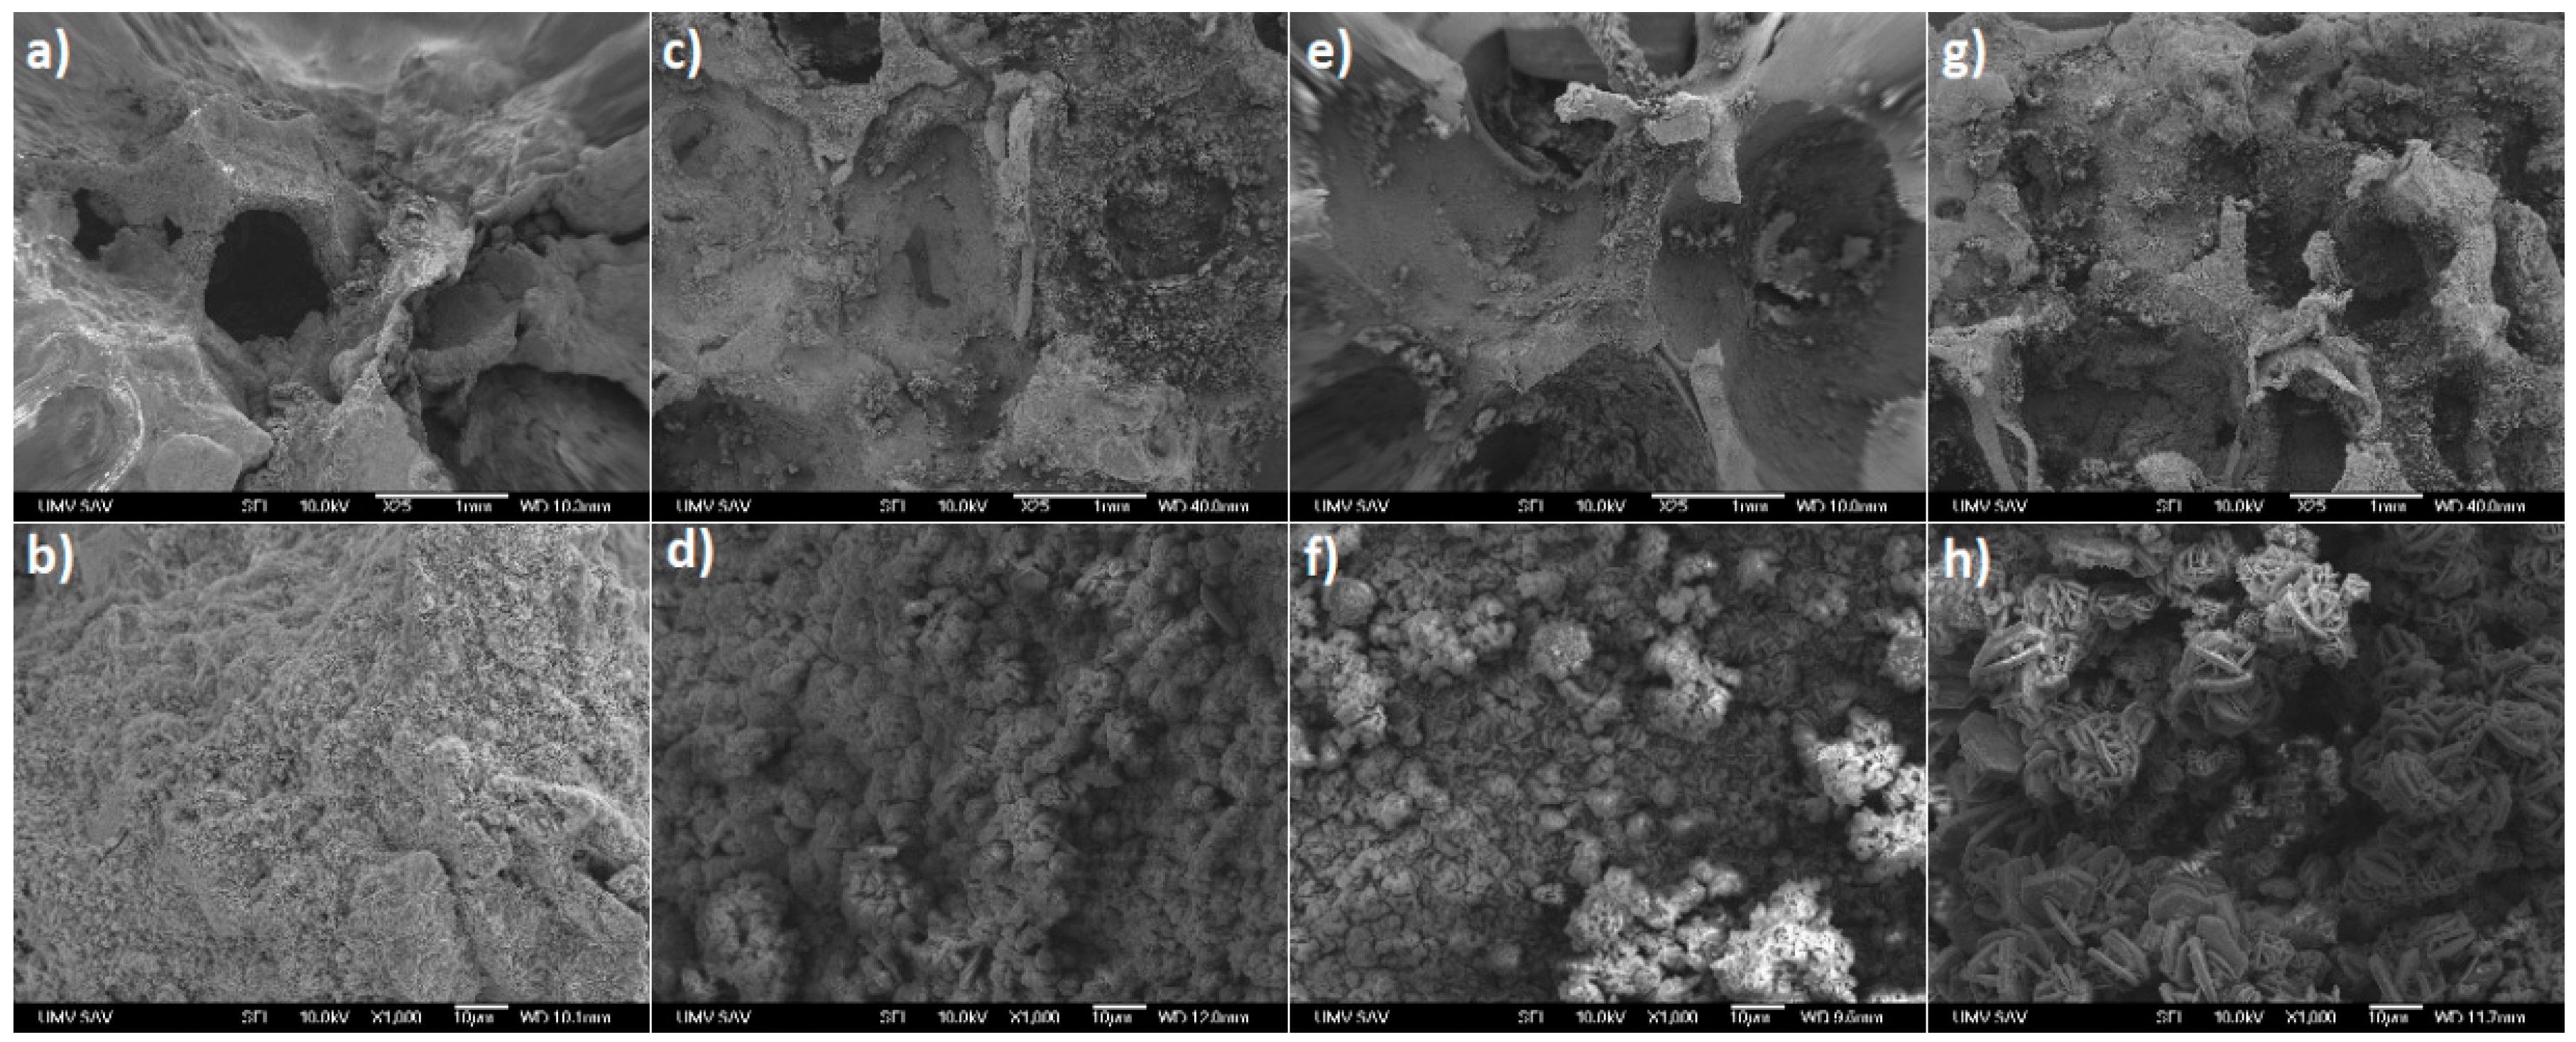
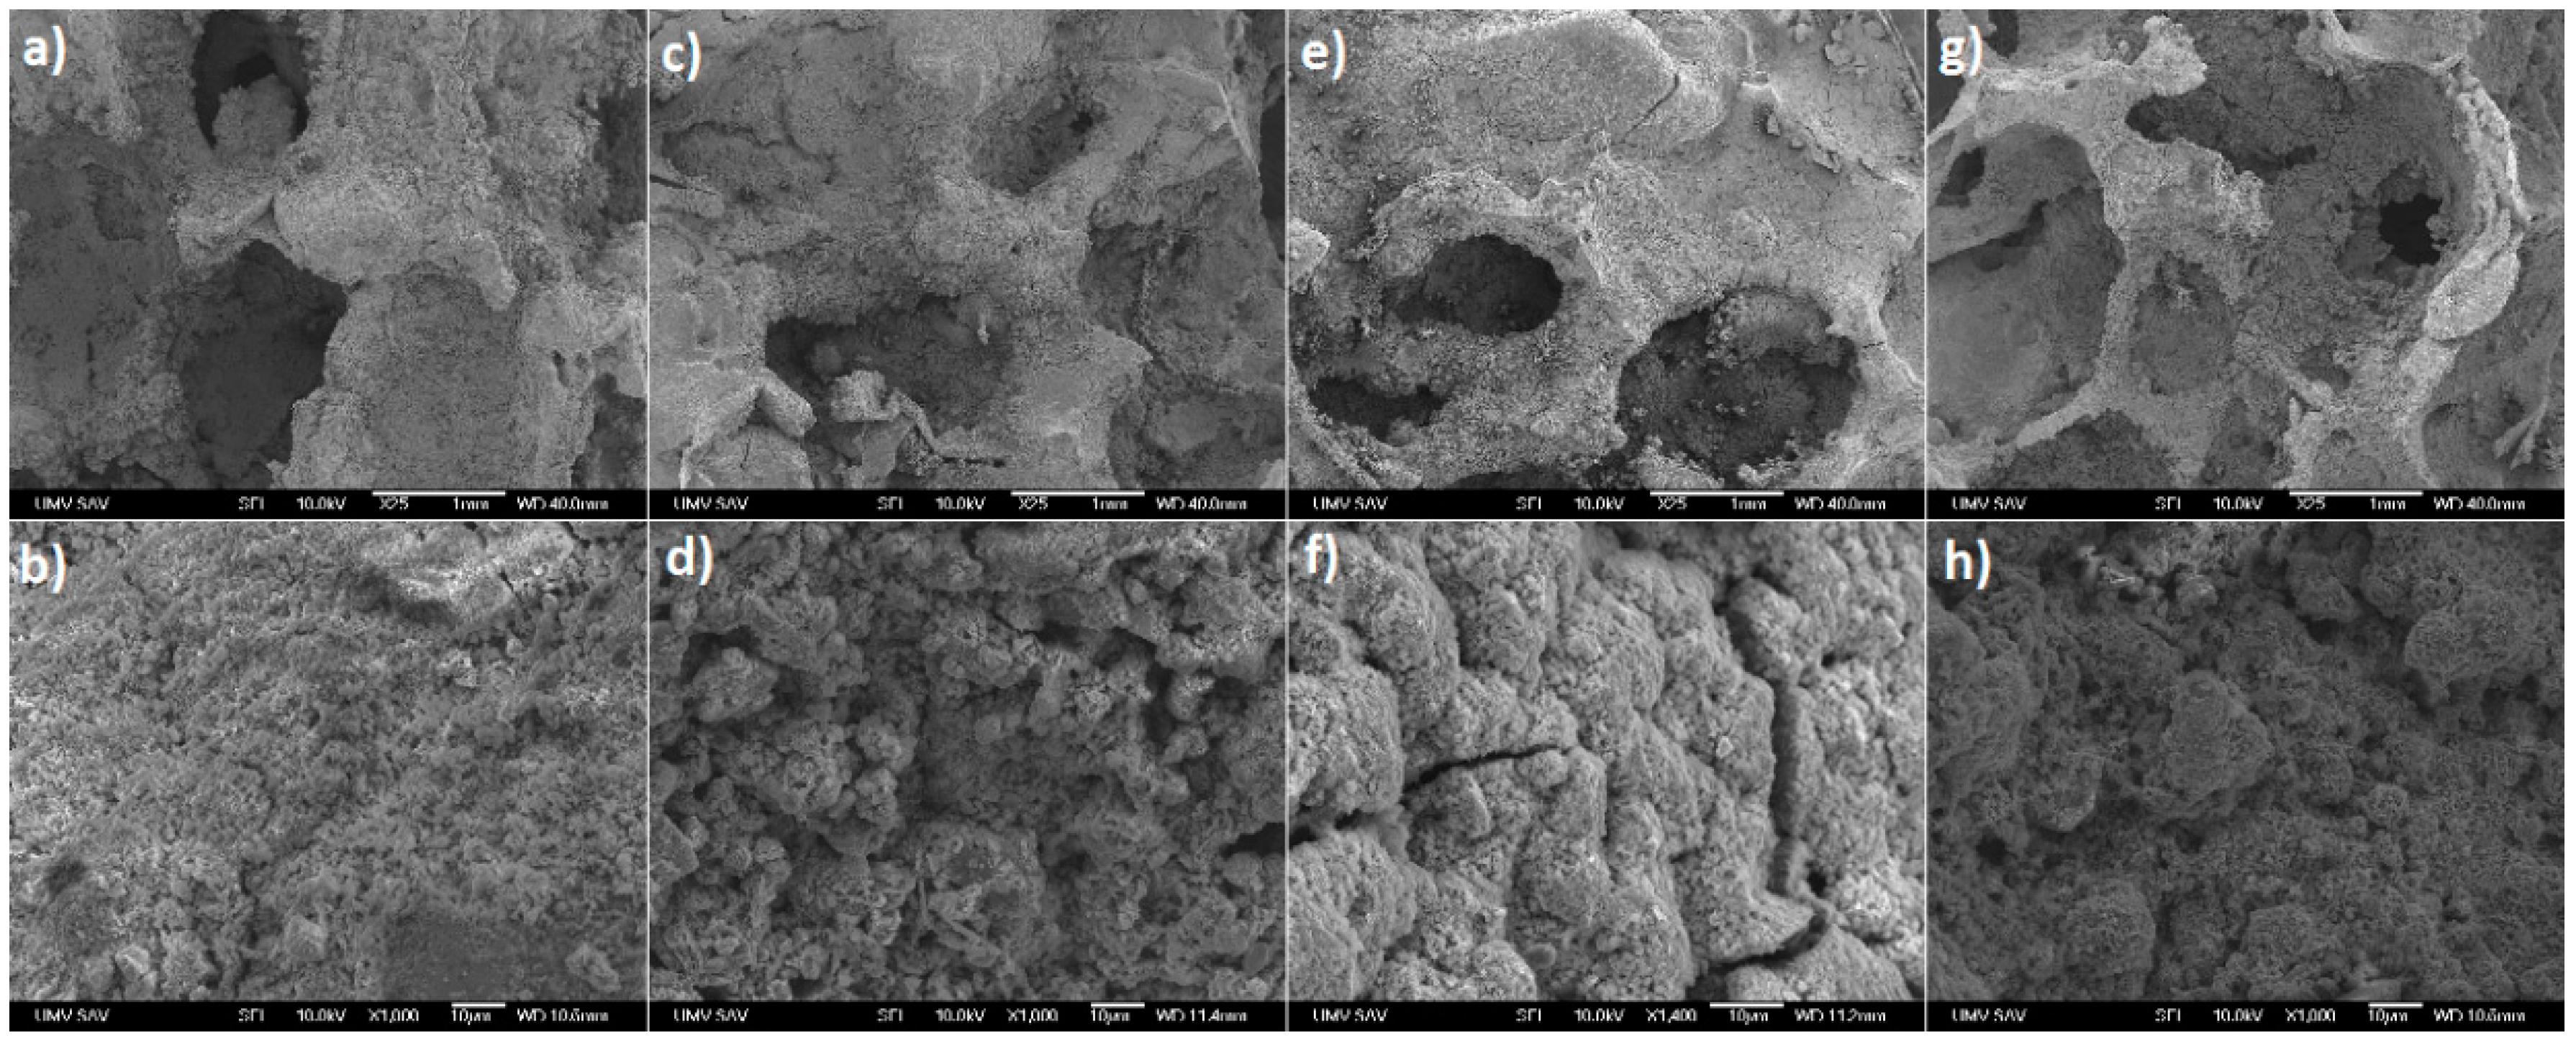
3.1. Surface Morphology and Composition

The final state of the iron-based structures was achieved by sintering the iron-impregnated PUR foam. The appearance of the porous iron samples was similar to the void structure of the PUR foam. The sintered materials contained spherical macropores sized from 350 μm to 1700 μm. The strut thickness between individual macropores was about 100–250 μm (Figure 1). As can be seen from Figure 1, the addition of the polymer coating resulted in the smoothing of the edges of the iron structures. However, the insertion of the PEG film did not cause any significant change of the macropore size. The surface of the iron specimens without a polymer coating layer was covered with fine nodes with numerous pores (size 1–9 μm), as can be seen at a higher magnification (Figure 1b). These fine nodes were also present in the Fe-PEG1 sample (Figure 1c,d). However, the pores in these specimens were wholly or partially filled up with polymer and were smaller (size up to 3 μm) than the pores of the as-prepared iron samples without the PEG film. The roughness of the samples with higher amounts of PEG coating (Fe-PEG2 and Fe-PEG3) was completely smoothed out by the polymeric layer, and the surface of the prepared materials was more compact, uniform, and homogenous (Figure 1e–h).
The micrographs of the cross-sections of the iron samples with PEG coating pointing to the difference in porosity changing with PEG loading are shown in Figure 2. It is evident that the samples are highly porous and the polymer material is present mainly on the surface of the iron foam. The highest porosity among the tested samples was observed for the Fe-PEG1 sample. The Fe-PEG2 sample contained slightly smaller and less open pores. The Fe-PEG3 sample exhibited the lowest porosity due to the higher amount of PEG entering into the pores of the iron substrate, causing a reduction of the pore size.
Figure 3 shows distribution of the polymer coating layer (black layer emphasized by the arrows) on the surface of the Fe-PEG3 sample. The polymer layer is considerably discontinuous. The approximate thickness of the PEG coating obtained from the micrographs of the cross-sections of the coated samples was 150–1000 μm.
Energy-dispersive X-ray (EDX) analysis was used to determine the content of the main components on the surface of the PEG-coated porous specimens. The average elemental composition of the surface of the coated iron samples is summarized in Table 2.
The potential interaction between PEG and iron was investigated by means of infrared and Raman spectroscopy. Because of the fact that the intensities of the spectra of all Fe-PEG composites were too low, the spectra were normalized on an arbitrary scale. The results are presented in Figure 4 and Figure 5.
In the infrared spectrum of pure PEG, a very intense peak at 2881 cm−1 corresponding to the stretching vibration of C–H group was recorded. The bending vibrations corresponding to the same group were found at 1466 cm−1 and 1340 cm−1 and the stretching vibrations, corresponding to O–H and C=O groups, were registered at 1279 cm−1 and 1096 cm−1, respectively.
The Raman spectrum (Figure 5) confirms the results obtained by infrared spectrometry (Figure 4). The internal vibrations of the methylene group give rise to peaks recorded at 2887 cm−1 and 1482 cm−1. The intense peak recorded at 2887 cm−1 corresponds to stretching vibration, and the peak at 1482 cm−1 is the result of the bending vibration of a C–H group. The twisting vibrations corresponding to the same group were found at 1285 cm−1 and 1232 cm−1, and the stretching vibrations corresponding to the C–C and C=O groups were registered at 1142 cm−1 and 1052 cm−1, respectively. The bands at 876 cm−1 were recorded in the IR spectrum only for Fe-PEG1 and Fe-PEG2 samples, and those observed in the Raman spectra for all of the samples were assigned to the skeletal vibrations of PEG. The C–C–O bending vibration appears at 533 cm−1. The band at 225 cm−1 corresponds to the skeletal deformation mode of PEG.

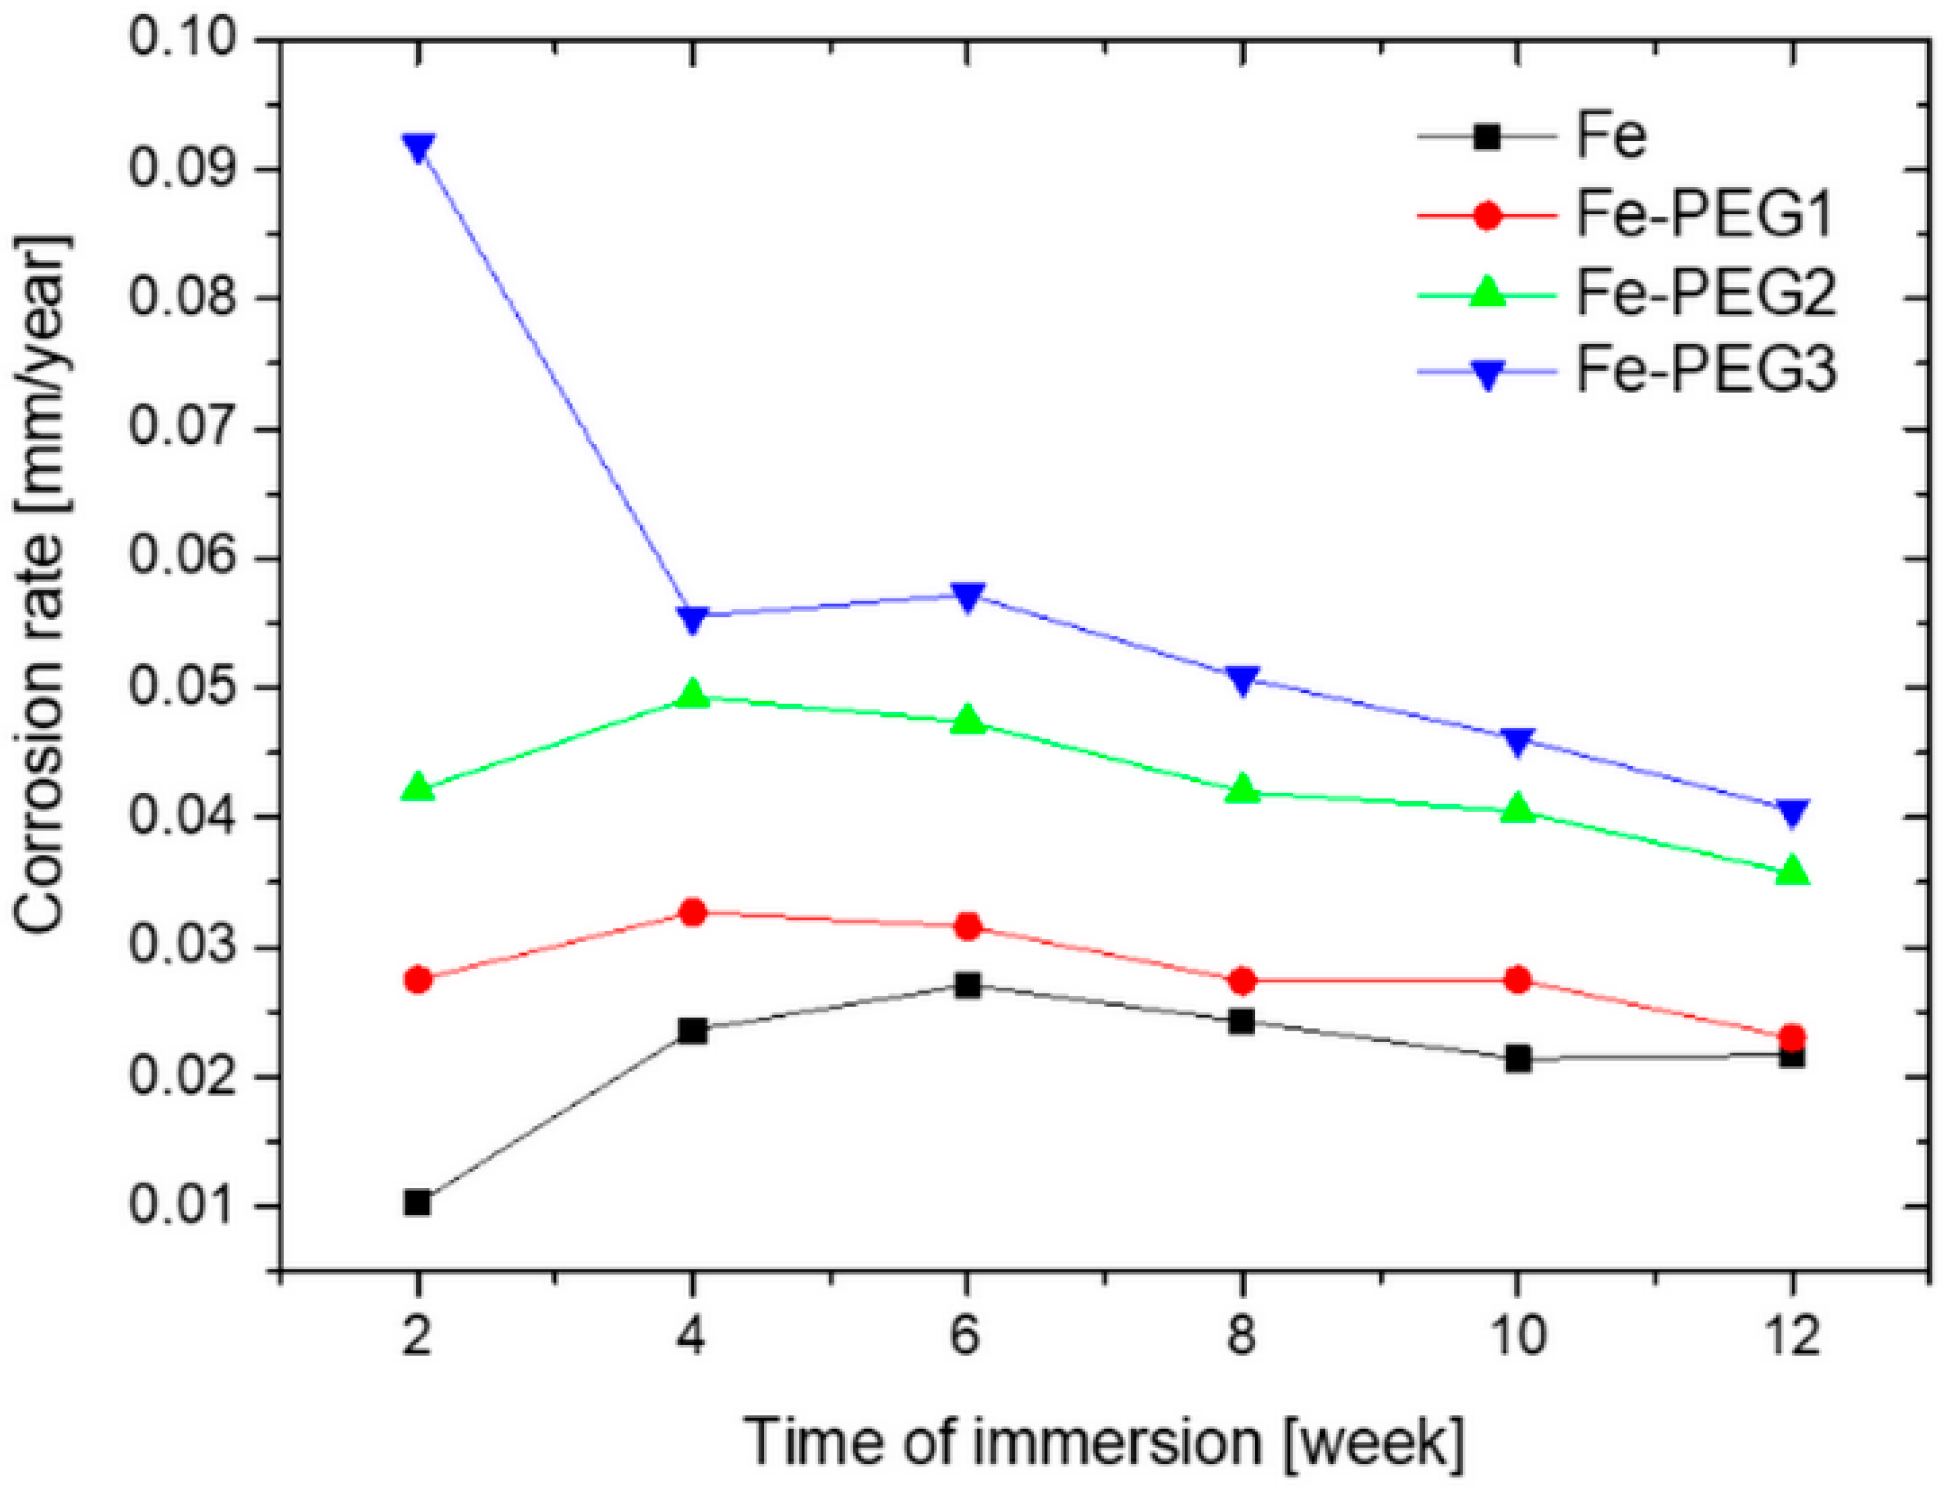
3.2. Immersion Tests

The preliminary results of the immersion corrosion tests are given in Reference [68]. A more detailed study followed here. The micrographs of the corroded surface of all specimens after 4, 8, and 12 weeks of immersion in Hanks’ solution at 37 °C are shown in Figure 6, Figure 7 and Figure 8. The presence of degradation products was identified by the EDX analysis of the corroded sample surfaces [68]. The amount of the corrosion products increased by extending the immersion in Hanks’ solution from 4 to 12 weeks for all specimens. The non-homogeneous corrosion leading to the rupture of struts of the open cell porous solids and the formation of the thin layer of the corrosion products were observed on the surface of all specimens after 4 weeks of degradation, as documented in Figure 6. The degree of sintered samples’ damage rose with the increasing time of immersion. As can be seen from Figure 7, the whole surface of the porous structure was completely covered with degradation products after 8 weeks of immersion in Hanks’ solution. Extended crack formation, considerable dissolution of the struts, and the accumulation of degradation products on the surface of the cellular samples were observed, as shown in Figure 8, after 12 weeks of the immersion test.
Mass loss was assessed by periodic weighing of the samples, which were first thoroughly rinsed and dried. The mass losses of iron samples immersed in Hanks’ solution for a period of 12 weeks are listed in Table 3. The mass changes were caused by the generation of soluble or non-adhering corrosion products and by the dissolution of the sintered samples. An increase in mass loss was observed in all examined samples in the course of the whole period of the test.
The values of the corrosion rate determined from the immersion test are shown in Table 4 and Figure 9. For the calculation of the corrosion rate of the Fe-PEG3 sample, we used the value of SBET for the bare Fe sample (0.48 m2/g) since the BET method did not provide satisfactory results for the surface area of this sample. The highest corrosion rates were observed after 4 or 6 weeks of immersion in Hanks’ solution, with the exception of the sample with the highest content of the hydrophilic PEG coating, for which the highest corrosion rate was observed after 2 weeks of immersion (0.0919 mm/year). The values of the corrosion rate in the fourth week of immersion were 0.0236 mm/year, 0.0327 mm/year, 0.0493 mm/year, and 0.0555 mm/year, for the uncoated Fe as well as the Fe-PEG1, Fe-PEG2, and Fe-PEG3 samples, respectively. Afterwards, a gradual decline in the values of the degradation rate for all samples was observed, presumably due to the corrosion products’ layer formation.

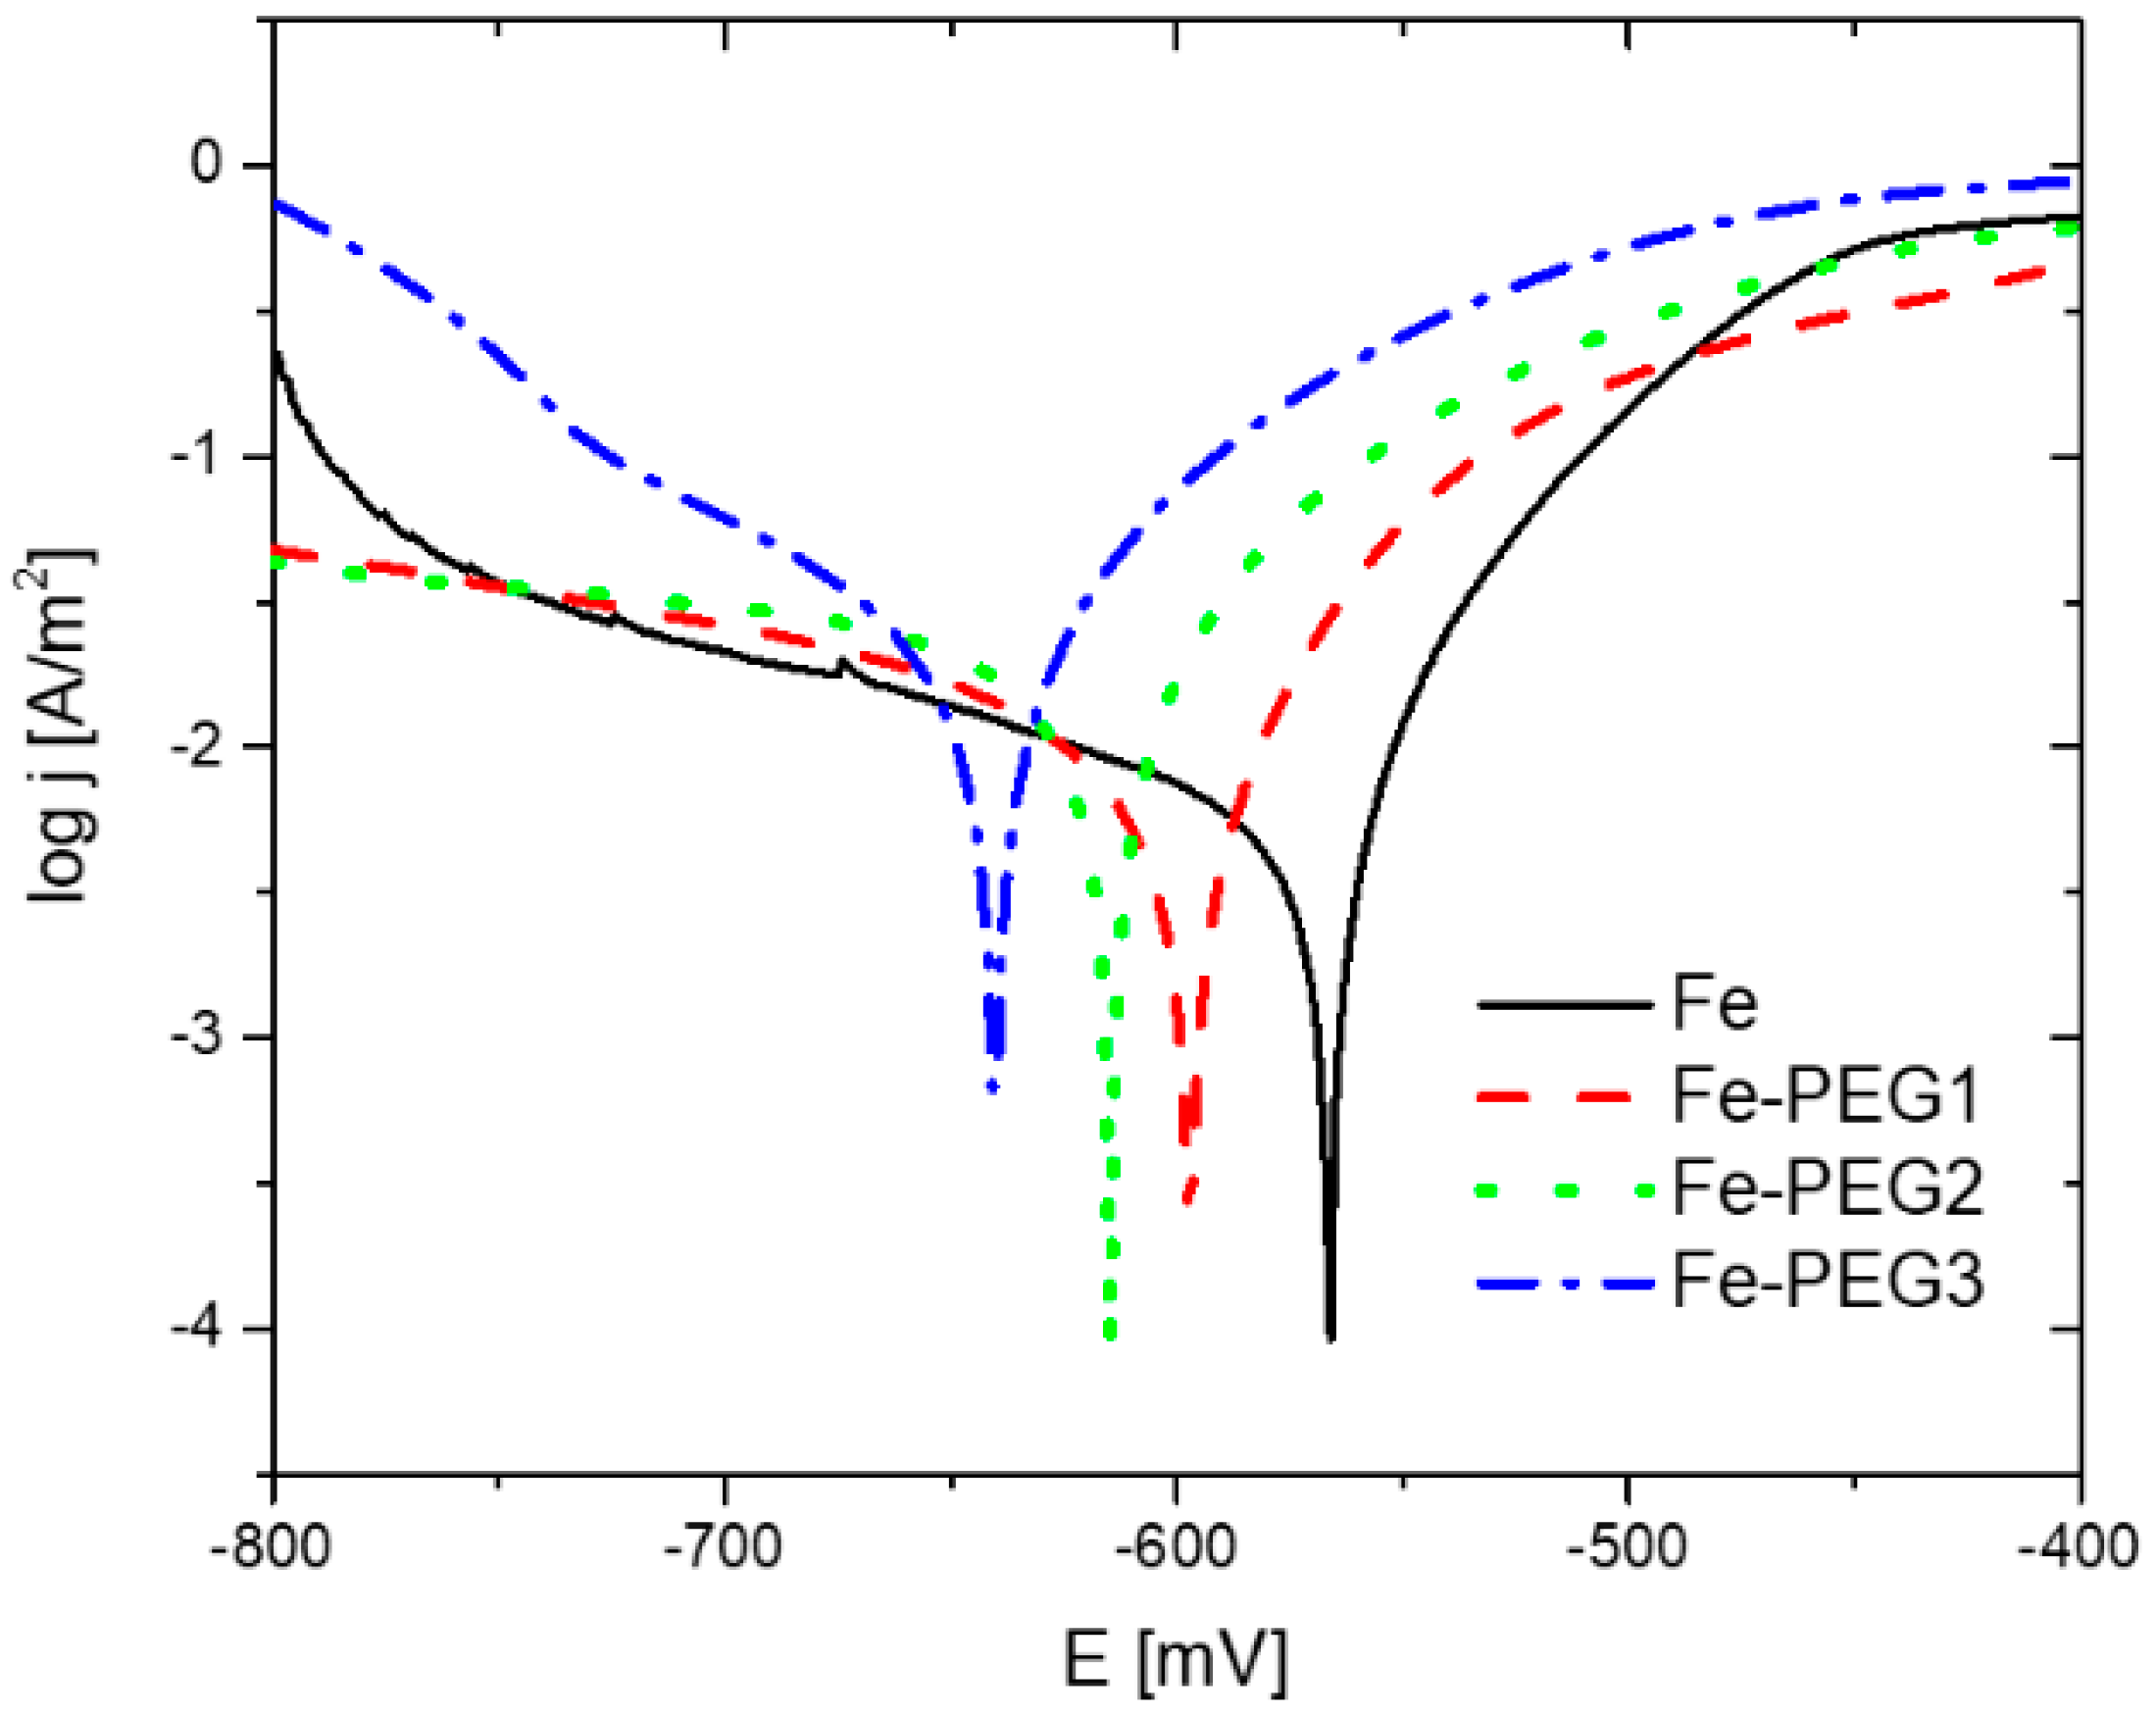
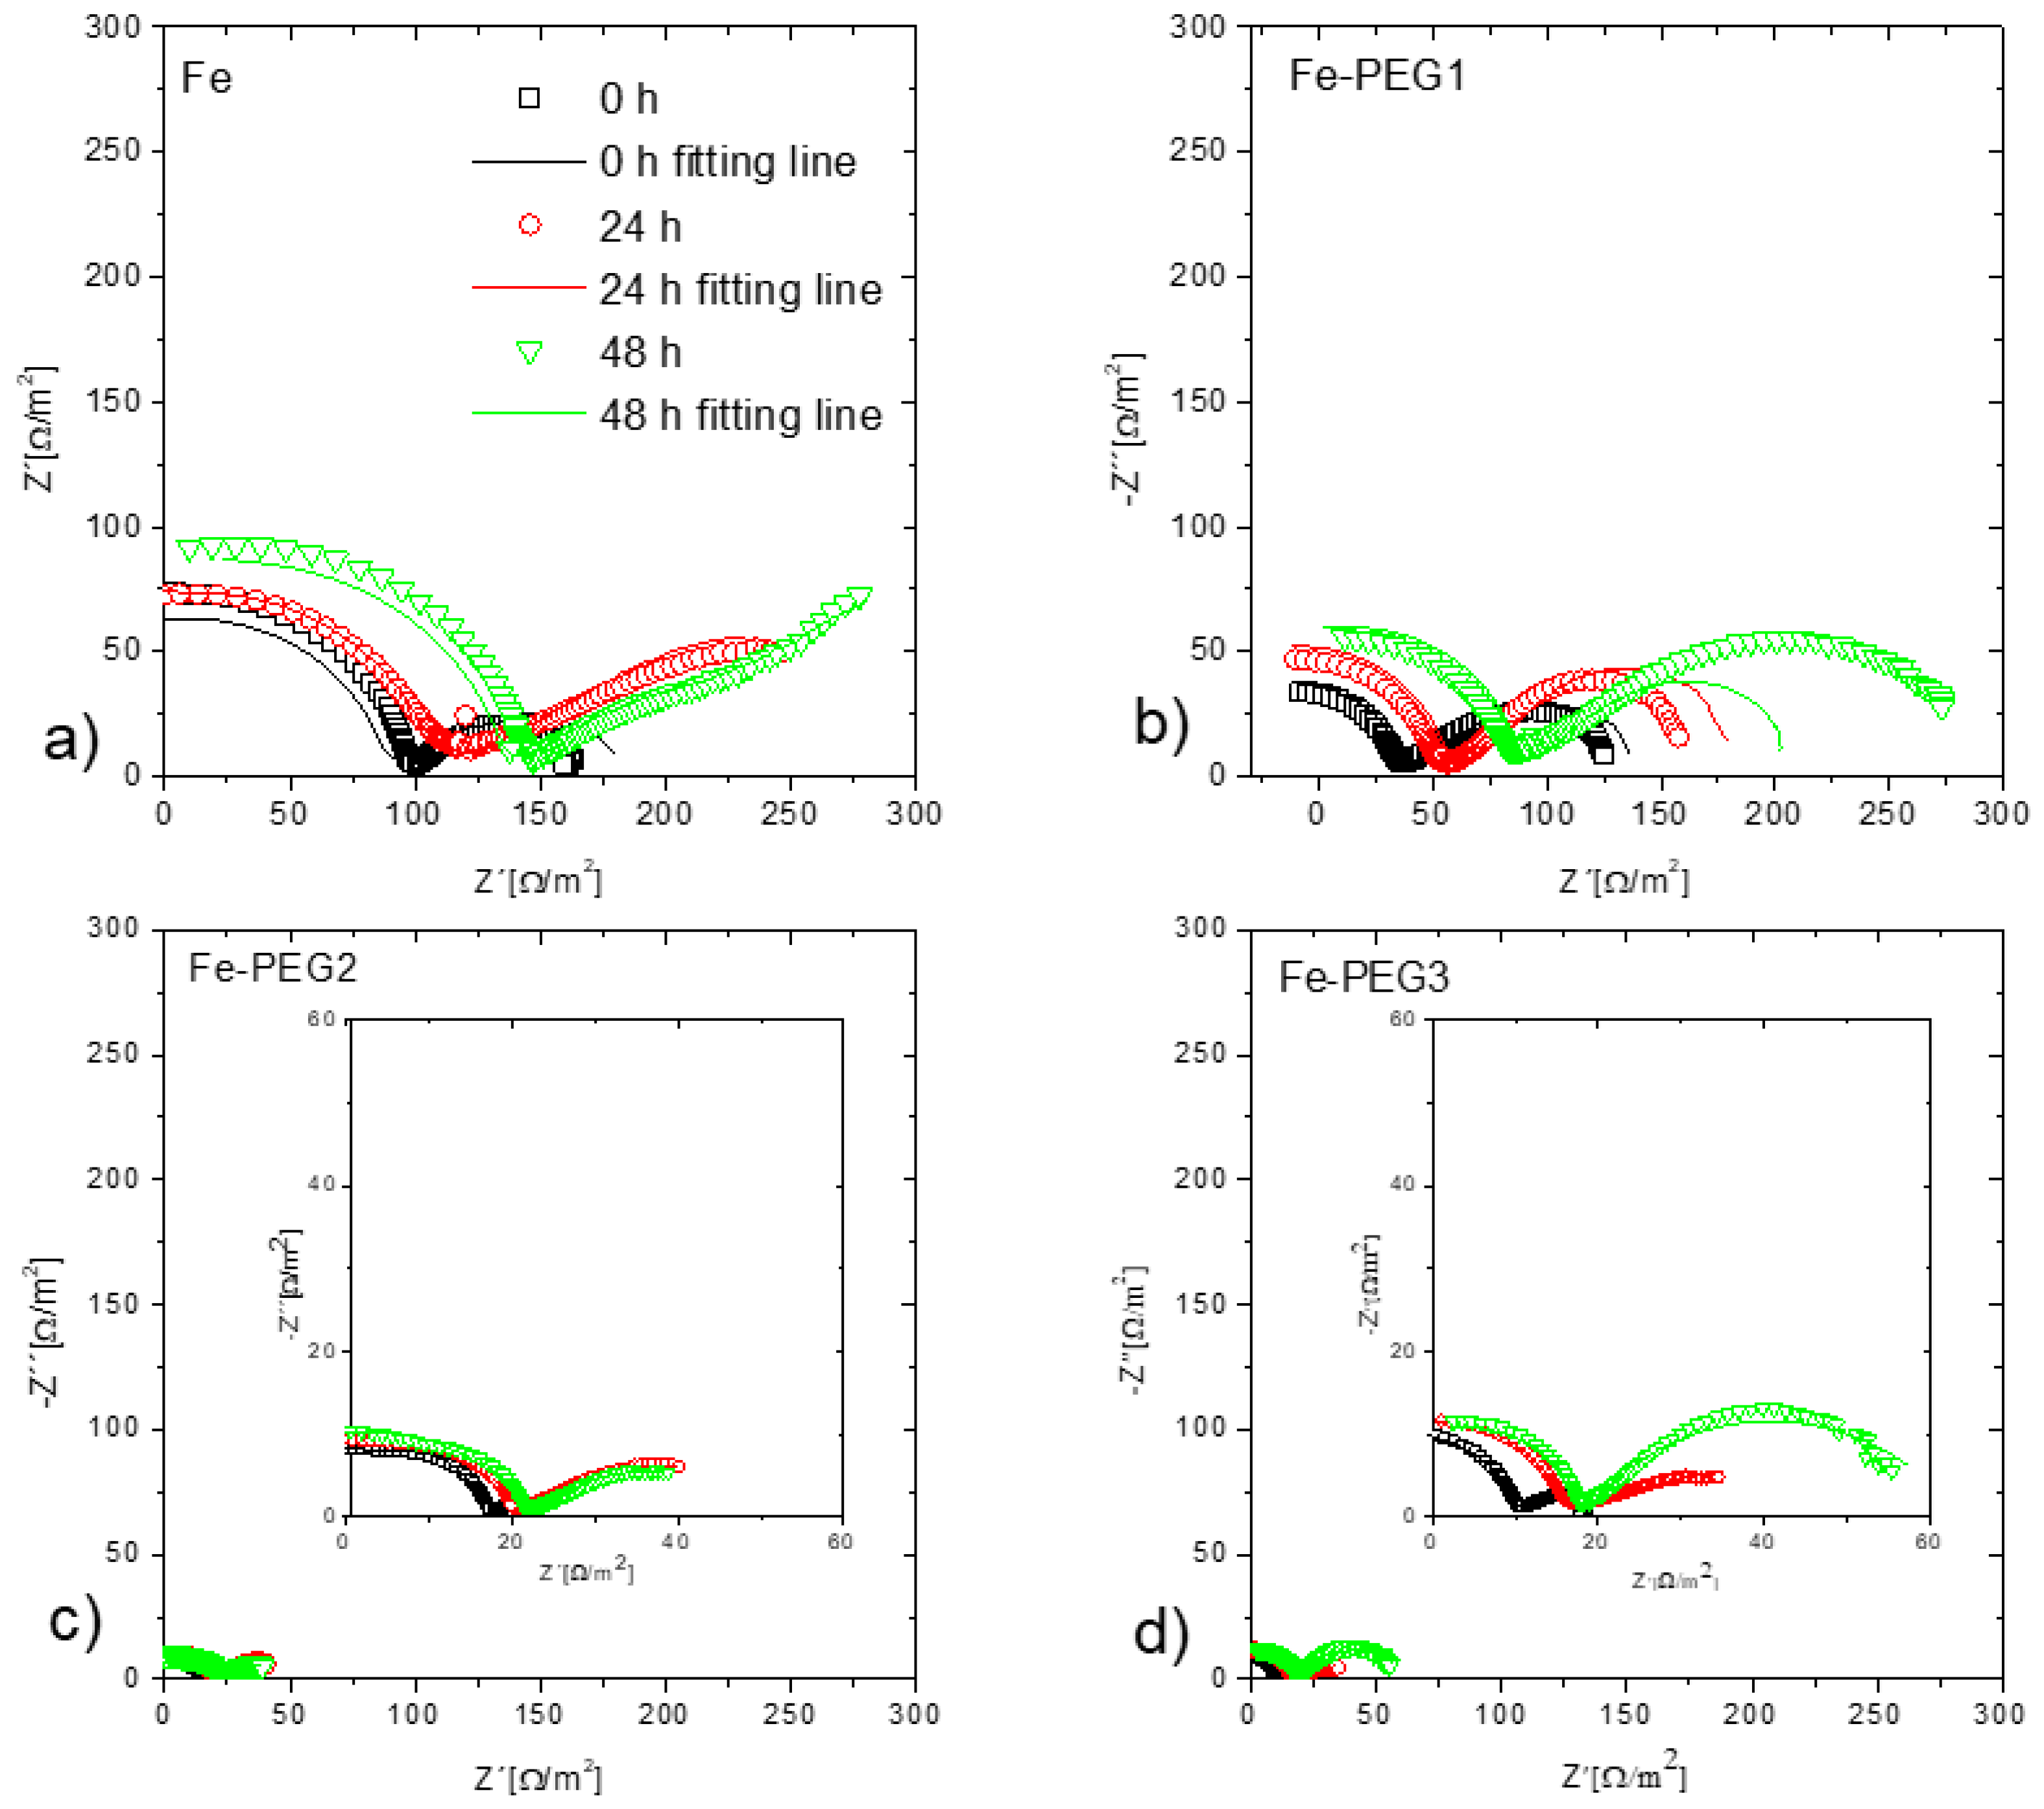
3.3. Electrochemical Corrosion Behavior

The corrosion behavior of the prepared porous samples was studied by the anodic polarization method in Hanks’ solution at 37 °C. Representative potentiodynamic polarization curves (Tafel plots) for PEG-coated samples, together with the uncoated iron sample, are shown in Figure 10. The reproducibility of the Tafel plots was good. It should be noted that the BET method did not provide a satisfactory result for the surface area of the Fe-PEG3 sample due to the low signal, and thus we used the value of SBET for the bare Fe sample (0.48 m2/g) to calculate the current density of this sample. The corrosion potential (Ecorr vs. Ag/AgCl/KCl (3 mol/L)) and corrosion current density (jcorr) were both calculated from the intersection of the extrapolated anodic and cathodic Tafel lines. Since the obtained curves did not exhibit the typical Tafel form, they were evaluated for both Tafel and non-Tafel behavior. A non-Tafel behavior of the examined material can be caused by the inhomogeneity of the sample surface and irregular structure of the porous samples [69]. The values of Ecorr (vs. Ag/AgCl/KCl (3 mol/L)), jcorr, and CR determined for Tafel and non-Tafel behavior of curves are listed in Table 5.
The presence of a PEG coating on the surface of iron samples resulted in a higher susceptibility to corrosion, expressed by a shift of the corrosion potential to more negative values and an increase in the current density. Corrosion rates determined from Tafel plots by Tafel evaluation were 0.438 mm/year, 0.536 mm/year, 0.617 mm/year, and 0.703 mm/year for Fe, Fe-PEG1, Fe-PEG2, and Fe-PEG3 samples, respectively. Corrosion rates determined by non-Tafel evaluation were 0.360 mm/year, 0.494 mm/year, 0.596 mm/year, and 0.670 mm/year for Fe, Fe-PEG1, Fe-PEG2, and Fe-PEG3 samples, respectively. The highest value of jcorr was observed for the Fe-PEG3 sample and the lowest jcorr was obtained for the bare Fe sample. The same behavior was observed for Tafel and non-Tafel evaluation, but jcorr values obtained for the non-Tafel evaluation were slightly lower. The shift of Ecorr (vs. Ag/AgCl/KCl (3 mol/L)) to more negative values indicates that the polarization occurred mostly at the cathode and hence the corrosion rates of the PEG-coated iron samples were cathodically controlled [53]. The value of the corrosion potential decreased with increasing amounts of PEG on the surface of the porous iron material.
The EIS measurements were performed before immersion (0 h) and after 24 h and 48 h immersion of the samples in Hanks’ solution. Nyquist plots of the three cellular samples obtained before and after immersion in Hanks’ solution are shown in Figure 11. The corrosion process of iron materials in a solution with neutral pH is influenced by the formation of corrosion products at the surface. This corrosion product layer acts as an inhibitor and the properties of the layer are dependent on the medium in which the corrosion takes place, on the hydrodynamic conditions, and on the duration of exposure [70]. The Nyquist plots indicate the same trends as the results obtained from the potentiodynamic polarization curves. The impedance value of the tested samples decreased in the sequence: Fe, Fe-PEG1, Fe-PEG2, Fe-PEG3 (Figure 12), indicating the increase in corrosion susceptibility. The same trend was observed for all samples before immersion and after immersion in Hanks’ solution for 24 h and 48 h. An increase in the impedance value was observed for each sample with prolonged time of immersion in Hanks’ solution. The lowest impedance values were detected for the specimens before immersion, and the highest values were observed for the samples after 48 h of immersion. Considering that the Nyquist plots of the Fe sample after 24 h and 48 h of immersion included mainly a linear diffusion part, it can be concluded that a charge transfer occurred rapidly.
The EIS spectra of the uncoated and the PEG-coated samples were modeled using the chosen equivalent circuits shown in Figure 13, where Rs is the solution resistance, RL1 is the pore resistance, RL2 is the resistance of polymer layer or corrosion products, and Rct is the charge transfer resistance. QL1, QL2, and Qdl are the constant phase elements (CPE) which correspond to the PEG film, the passive film, and the electrical double layer, respectively. It should be observed that other equivalent circuit arrangements with seven components could be drawn, with an identical electrical response (albeit different component values) and an overall satisfactory fit. This particular circuit was chosen because of its convergence and also because it fit the results for all three samples, thus making the comparison of the different impedance behaviors relevant. The solid/solution interface was characterized by the charge transfer resistance (Rct) and by the double layer capacitance (Qdl), which depends on the increase of the wetted metal area. Qdl was calculated (taking the CPE value as the capacitance) according to the following equation:
Q d l = ( 2 π f m a x R c t ) 1
where fmax is the frequency at which the imaginary impedance component is at a maximum (which in this case was 0.01 Hz). The Rct values (Table 6) for all samples before and after immersion in Hanks’ solution increased in the following order: Fe-PEG3, Fe-PEG2, Fe-PEG1, Fe. The highest Rct values were found for the pure iron structure and the lowest values were obtained for Fe-PEG3 sample in all cases. The value of Rct decreased with prolonged immersion for each individual sample. The highest Qdl values were obtained for the Fe-PEG3 material and the lowest for the Fe specimen before and after corrosion in Hanks’ solution. An increase of Qdl for the Fe sample, while a decrease of Qdl values of PEG-coated samples, were observed with prolonged immersion from 0 to 48 h (Table 6). This decrease indicates a loss of wetted area on the coated surface due to the enhanced formation of degradation products as a result of the faster degradation. Yusop et al. [53] obtained similar results during the examination of porous iron structures with PLGA coating. They noticed lower impedance and Rct values for samples with polymer coating compared to uncoated iron samples. This trend was also observed in our experiment.

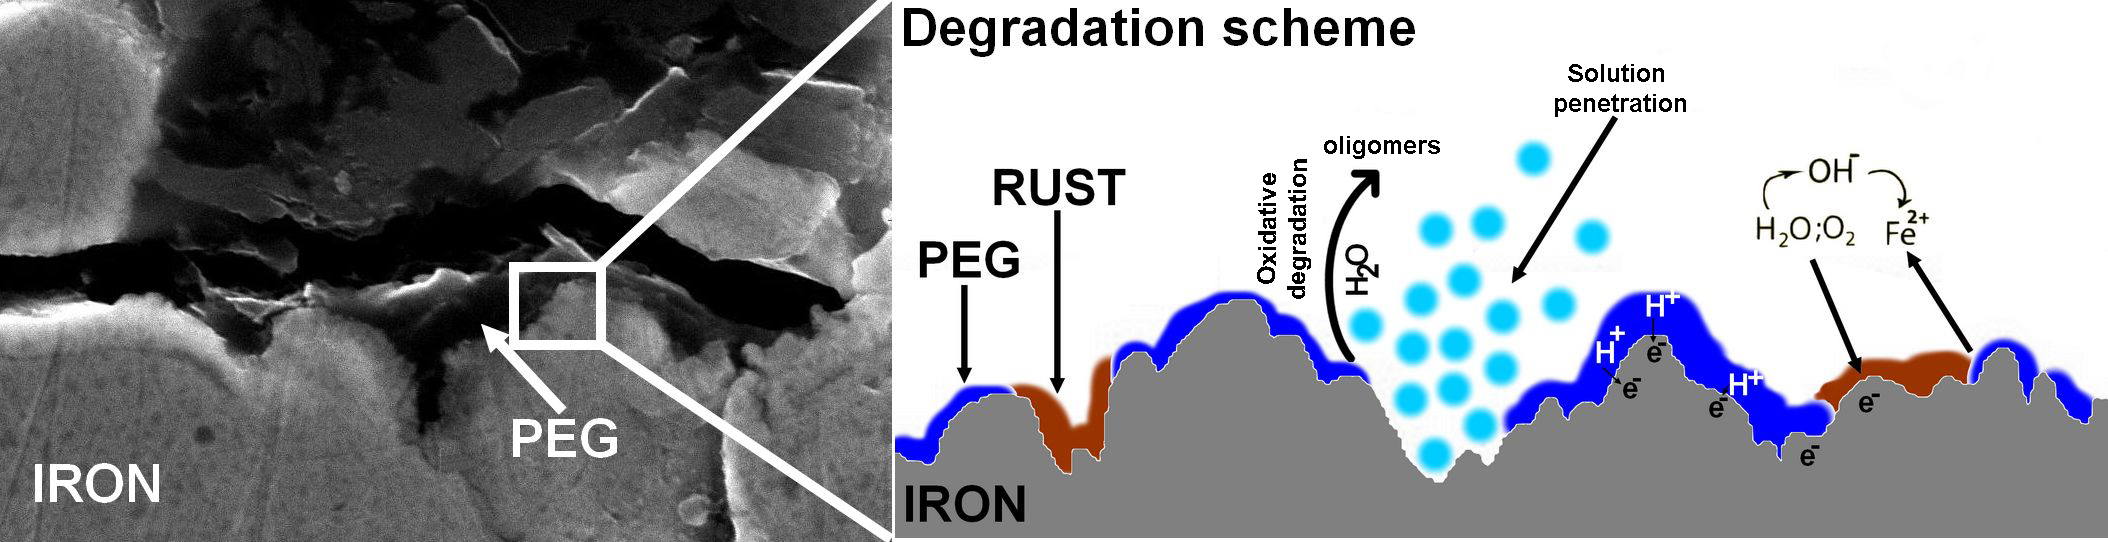
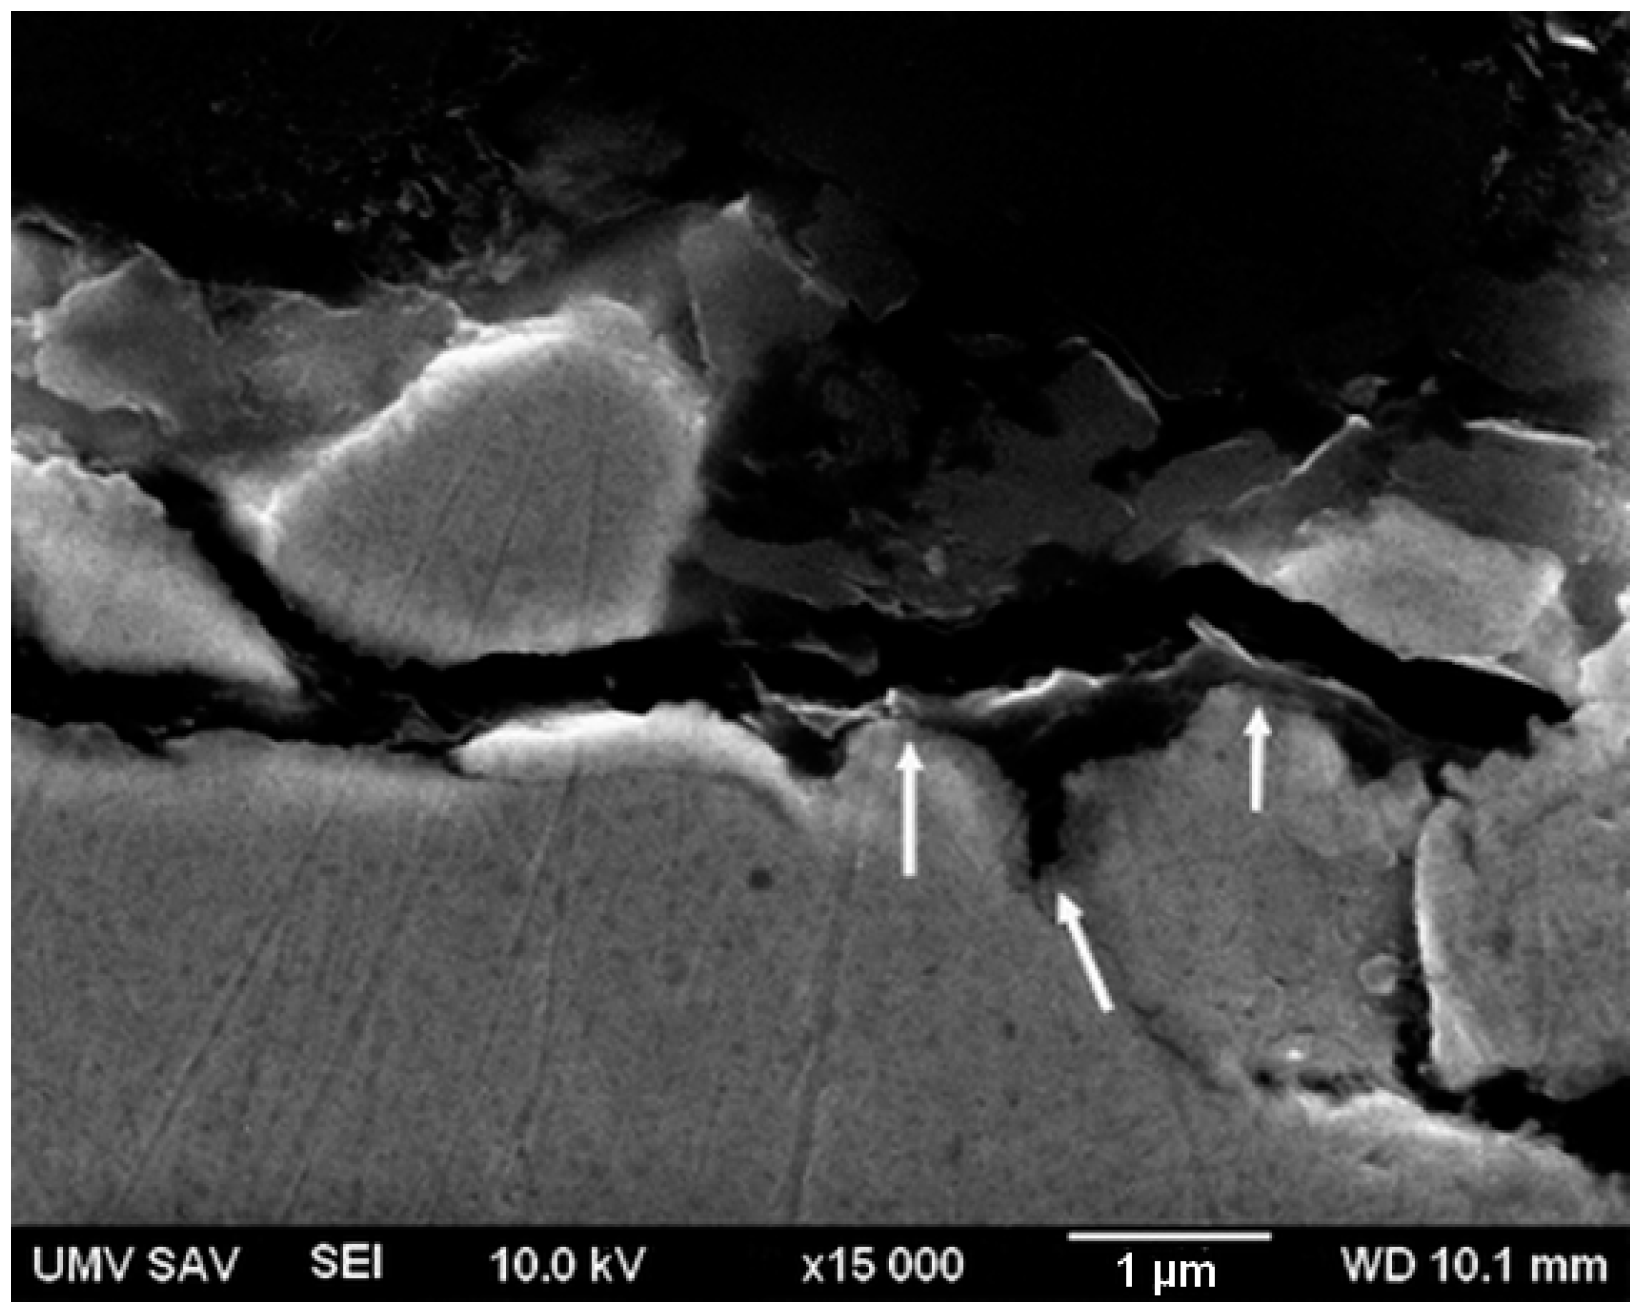
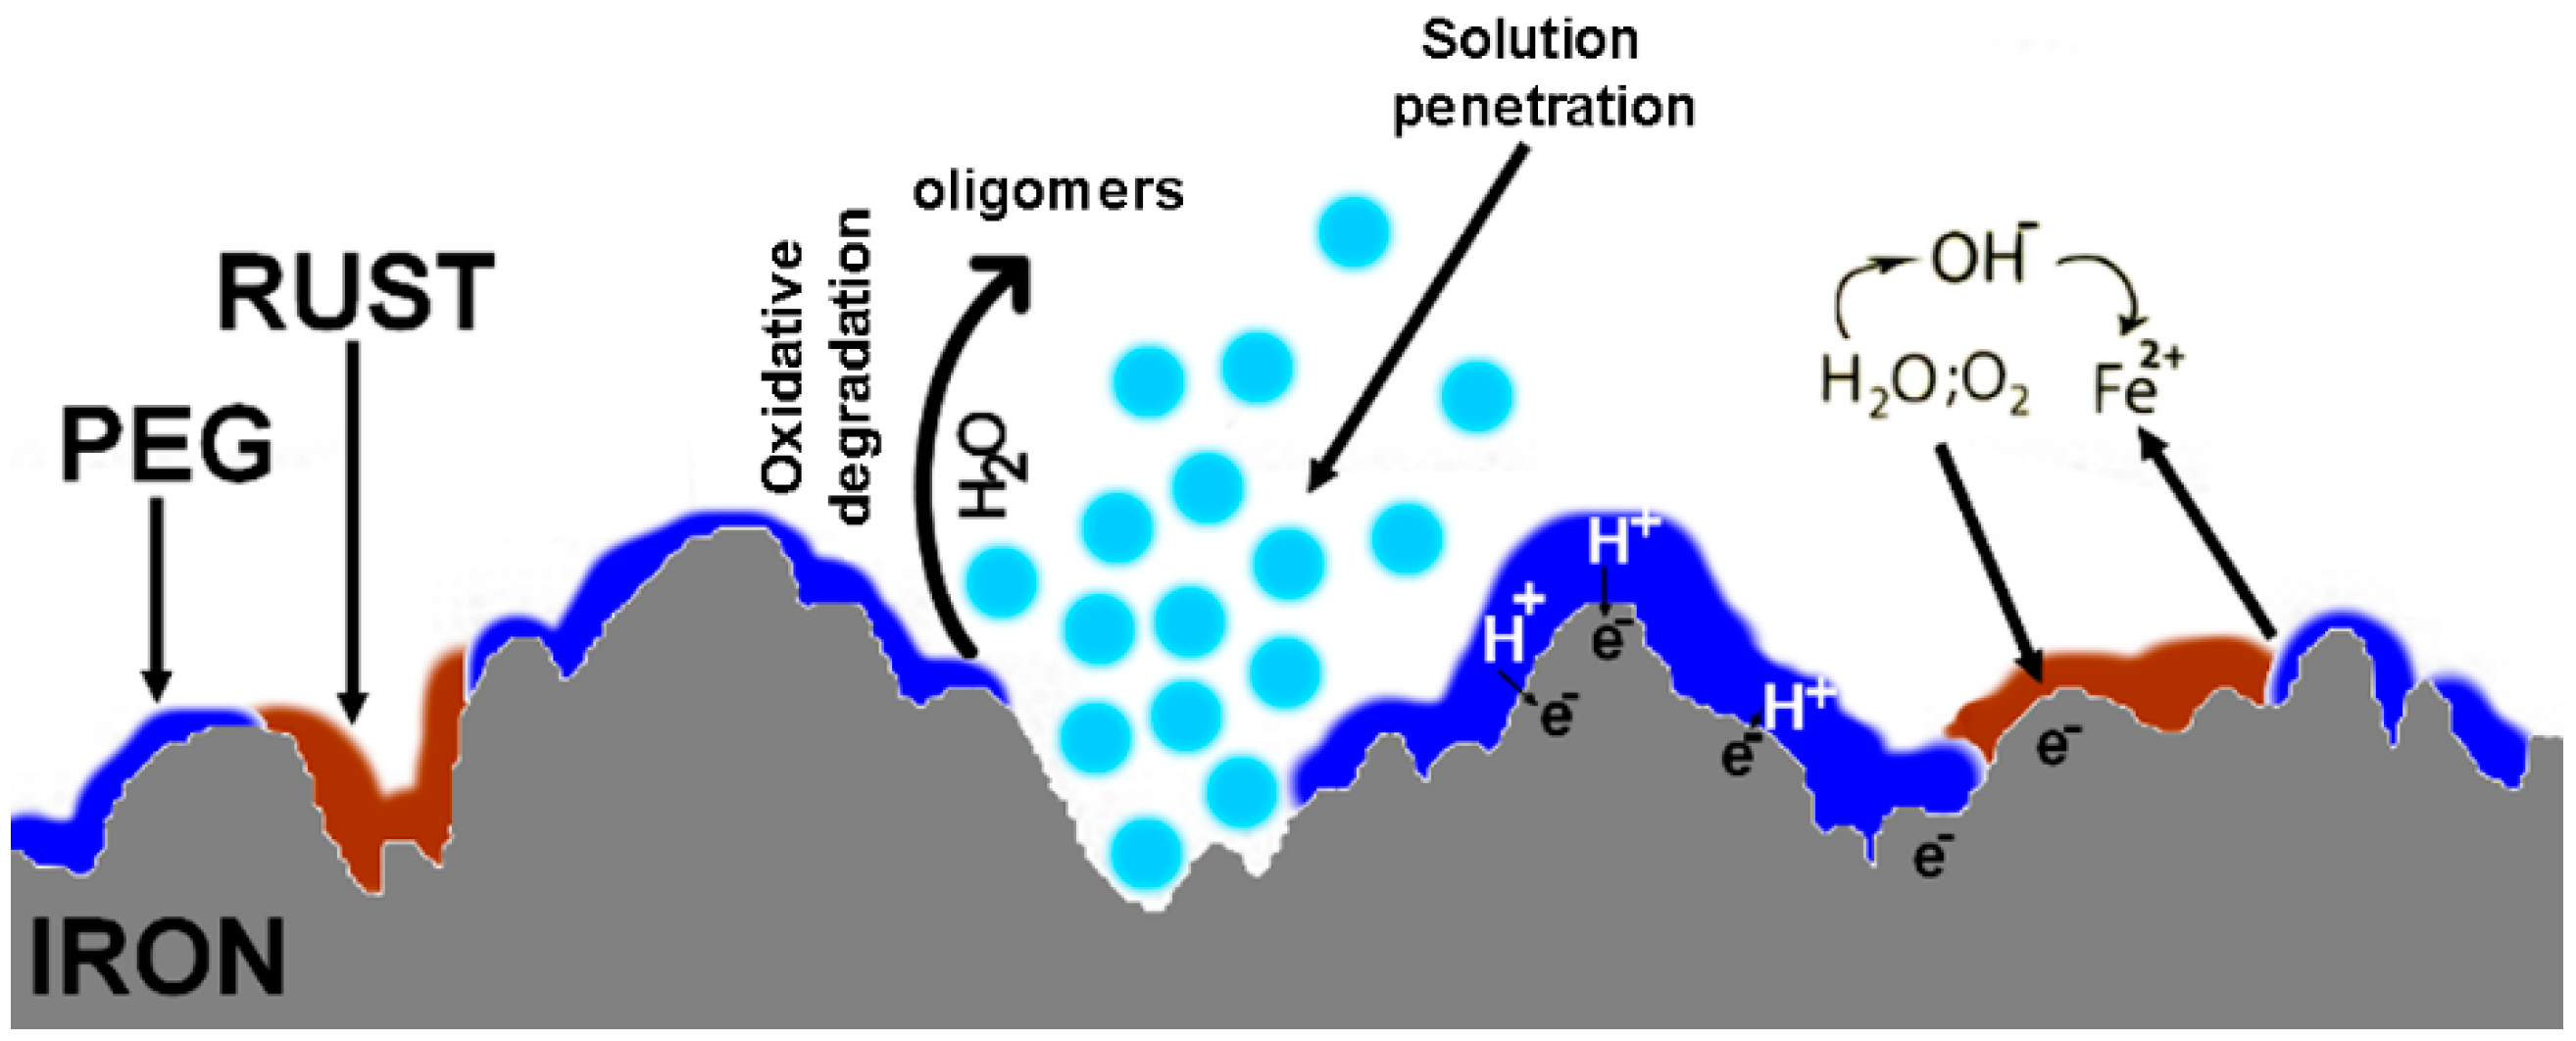
3.4. Degradation Mechanism

Open cell iron structures with PEG coatings are novel degradable biomaterials. There are known processes of degradation of the individual components of the prepared samples. However, the degradation behavior of the Fe-PEG composite material has not yet been investigated. The iron degradation process in aqueous solution begins with the oxidation of iron. It consists of an electrochemical process that starts with the following anodic (4) and cathodic (5) reactions:
Fe     Fe 2 + + 2 e
O 2 + 2 H 2 O + 4 e 4 OH
The reaction of the Fe2+ cations with OH anions results in the formation of ferrous hydroxide (6). Some of the Fe2+ cations can be oxidized to Fe3+ ions (7), if oxygen and alkaline pH are present. Then, these ions can react to form ferric hydroxide (8).
Fe 2 + + 2 OH Fe ( OH ) 2
Fe 2 + Fe 3 + + e
Fe 3 + + 3 OH Fe ( OH ) 3
In the presence of oxygen and chloride ions, FeO(OH) precipitates and the formation of magnetite (9) occurs:
Fe ( OH ) 2 + 2 FeO ( OH ) Fe 3 O 4 + H 2 O
During in vitro tests a layer of precipitated degradation products forms, which usually exhibits a brownish color and consists of hydroxides originating from the reactions above [71,72].

4. Discussion

The presence of a PEG layer on the surface of iron samples was proven by SEM micrographs, EDX analysis, and FT-IR and Raman spectroscopy. From the SEM micrographs (Figure 1) and EDX analyses (Table 2) of the surface of sintered samples, it can be seen that the polymeric layer on the surface of the Fe-PEG2 sample is discontinuous compared to the Fe-PEG3 sample, which contains only polymer on the surface. Hence, zero weight percent of iron was detected on the surface of the Fe-PEG3 material by EDX analysis (Table 2). The content of carbon in the examined samples increased with increasing amounts of PEG on the surface of the iron cellular structures. The small amount of carbon and oxygen originating from the carbonyl iron powder was also noted on the surface of the Fe sample without the PEG coating layer.
In order to investigate the surface properties of the prepared PEG-coated porous materials, the specific surface area value of all samples was measured. In general, it can be seen that the values of SBET are very low. This is contrary to the study of Park et al. [73]; however, the authors of that work used a different synthetic approach which favored the formation of a porous composite. In a very similar report to ours [74], the SBET values were not reported. The introduction of the low amount of PEG into the structure of iron results in only a slight specific surface area increase of the whole material, while the value of the specific surface area decreased with increasing content of the PEG coating. The SBET value of the sample with the lowest content of PEG (Fe-PEG1) increased (0.80 m2/g) as compared to the bare iron sample (0.48 m2/g). This is probably due to the formation of a discontinuous PEG layer consisting of small isolated islands of PEG on the surface of the Fe substrate. The next increase in the PEG content led to a decrease in the SBET value to 0.61 m2/g for Fe-PEG2 and to a value below the detection limit for Fe-PEG3.
The results of the infrared spectroscopy presented in Figure 4 are in good agreement with recent literature [75,76]. The intensity of the spectra of the samples with the low PEG content (Fe-PEG1 and Fe-PEG2) was quite low, and therefore some peaks are not interpreted, as they are within the noise level. Although no significant changes of the peak positions in the Fe-PEG samples in comparison to pure PEG were seen, some slight changes took place. This is in agreement with studies dealing with Au/PEG [77] or Se/PEG composites [78].
The Raman spectrum (Figure 5) confirms the results obtained by infrared spectrometry (Figure 4). The obtained Raman spectra (Figure 5) correlate well with other publications [79,80]. The peak positions of Fe-PEG samples are almost identical to those of pure PEG in the infrared spectra as well. The intensity of the Raman spectra, similar to the intensity of the infrared spectra, was also very low.
The corrosion behavior of the sintered iron samples was examined by potentiodynamic polarization, electrochemical impedance, and an immersion test. The extension of corrosion during the static immersion test was observed by SEM micrographs (Figure 6, Figure 7 and Figure 8).
An increase in mass loss in all examined samples during the whole period of the test was observed from the mass loss values of iron samples immersed in Hanks’ solution, as listed in Table 3. More significant mass loss was observed for the coated samples compared to the bare Fe sample, indicating faster degradation [68]. This might be associated with the local change of pH due to PEG hydrolysis [81]. The Fe-PEG3 structure showed the most distinctive mass loss up until the fourth week of immersion. Thereafter, the Fe-PEG2 specimen exhibited somewhat higher values of mass loss [68]. The total mass loss after 12 weeks of immersion was about 6% for the uncoated Fe sample, while it was 10–12% for the PEG-coated samples. Qi et al. [82] demonstrated that the coating of biodegradable aliphatic polyester could accelerate iron corrosion due to the acidic degradation products.
The PEG coating caused an increase in the corrosion rate of the coated iron samples, as compared to the uncoated sample (Table 4, Figure 9). Moreover, the degradation accelerated with the increased PEG content. The Fe-PEG3 specimen degraded the quickest out of all of the tested materials. The values of the corrosion rate in the twelfth week of immersion were 0.0217 mm/year, 0.0230 mm/year, 0.0357 mm/year, and 0.0406 mm/year, for the uncoated Fe, and for the Fe-PEG1, Fe-PEG2, and Fe-PEG3 samples, respectively. Also, Yusop et al. [53] achieved higher levels of degradation rate in their materials with PLGA compared to bare iron samples, due to the effect of PLGA hydrolysis.
The corrosion rates calculated from the electrochemical test using Equation (1) are summarized in Table 5. The PEG film caused an increase in the degradation rate of the samples with a polymeric layer compared to the iron sample without PEG coating. The highest values of the degradation rate calculated from the Tafel and non-Tafel evaluation were obtained for the Fe-PEG3 sample, while the Fe specimen exhibited the smallest corrosion rate. These results correlate with the findings of the immersion corrosion tests and are in good agreement with the study of Yusop et al. [53]. They discovered that PLGA coating on an iron biomaterial leads to the increase of Ecorr and jcorr, as well as the increase of the corrosion rate. The corrosion rates determined from Tafel plots were 0.11 mm/year, 0.42 mm/year, and 0.72 mm/year for porous pure iron, PLGA-coated porous iron, and PLGA-infiltrated porous iron, respectively.
The corrosion mechanism of iron in a physiological solution was extensively studied. In the case of PEG, a hydrophilic compound [83], the most common degradation pathway is hydrolysis or oxidation [73,84]. At pH 7.4, the PEG chain is cleaved into oligomers with different numbers of repeating units [85]. The degradation products of PEG can be eliminated in vivo by the kidneys [86]. The interfacial interaction between the hydrophilic polymer layer and the iron surface generates the increasing degradation of iron. The degradation begins by the oxidative degradation of the PEG coating layer followed by the formation of defects in the polymer layer because the hydrophilic polymers undergo bulk degradation [87]. The defects allow the penetration of a solution into the iron substrate. The process of PEG degradation also induces the release of hydrogen atoms [88]. Protons can react with the electrons at the iron surface, leading to hydrogen evolution, passing iron ions into the degradation medium and its reduction, and thereafter to the inhibition of oxygen diffusion as a consequence of corrosion products’ layer formation. All of these processes enable and enhance the iron degradation [89]. A schematic representation of the Fe-PEG sample degradation process is shown in Figure 14.

5. Conclusions

A metallurgical replication method was used to prepare iron-based open cell structures. This material is intended to constitute the structural element for a possible temporary in vivo implant. The iron surface was coated throughout the open cell structure by polyethylene glycol to various degrees. The PEG coating was accomplished by a sol-gel process. The surface of the porous structures was rendered more compact and homogenous with increasing amounts of the polymer.
The presence of the PEG coating on the sample surface is instrumental to enhance the rate of iron metal degradation. The PEG layer caused a shift of the corrosion potential to more negative values together with an increase in the corrosion rate as compared to uncoated iron materials. Impedance measurements show in a series of Nyquist plots that the charge transfer resistance of the studied samples was the highest for the uncoated iron specimens and decreased continuously with increasing amounts of PEG. Thus, the degradation rate increased with increasing amounts of PEG. A combination of the pitting corrosion in the iron layer and the oxidation of the PEG layer are suggested as the two main reasons for the enhanced degradation.
Coating the sintered open cell foam iron samples with a PEG layer led to an increase in the degradation rate in a tunable fashion based on the initial amount of PEG deposited on the substrate. This identifies the material and the method of its treatment as a promising approach to fabricating biodegradable implant materials for bone applications. Future experiments will aim to verify the biocompatibility and mechanical properties of such structures.

Author Contributions

Conceptualization, R.O. and A.O.; formal analysis, P.V.; investigation, L.H., R.G., M.B., P.V., M.K., M.H., P.M., Z.O.K., and A.M.T.; resources, J.R.; supervision, R.O.; writing—original draft, L.H.; writing—review and editing, R.O.

Funding

This research received no external funding.

Acknowledgments

This work was supported by the Projects APVV-16-0029, APVV-0677-11, and APVV-14-0103 of the Slovak Research and Development Agency, VEGA 1/0074/17, VEGA 2/0044/18, and VEGA 2/0100/15 of the Slovak Scientific Grant Agency, and VVGS-PF-2016-72645 of Pavol Jozef Šafárik University. The authors would like to thank Zuzana Jurašeková, from the Department of Biophysics and Center for Interdisciplinary Biosciences, Faculty of Science, P. J. Šafárik University for facilitating the measurement of the Raman spectra.

Conflicts of Interest

The authors declare no conflict of interest.

Glossary

Aexposed surface area of the sample (cm2)
BETBrunauer-Emmett-Teller theory
CIPcarbonyl iron powder, iron powder produced from decomposition of iron(0) pentacarbonyl
CPEconstant phase element
CRcorrosion rate (in millimeters per year in thickness assuming uniform corrosion)
Ecorrcorrosion potential (vs. Ag/AgCl/KCl(3 mol/L))
EDXenergy-dispersive X-ray (spectrometry analysis)
EISelectrical impedance spectroscopy
EWequivalent weight (27.92 g/eq for Fe)
Fe-PEG1sample immersed into 5 wt. % PEG solution
Fe-PEG2sample immersed into 10 wt. % PEG solution
Fe-PEG3sample immersed into 15 wt. % PEG solution
fmaxfrequency at which the imaginary impedance component is at a maximum
IRinfrared (spectra)
jcorrthe current density (µA/cm2)
miinitial mass (g)
mffinal mass after corrosion (g)
OCPopen circuit potential
PEGpolyethylene glycol, a sample designation
PEG1iron foam with 0.8 wt. % PEG
PEG2iron foam with 1.5 wt. % PEG
PEG3iron foam with 3.0 wt. % PEG
PLGApoly(lactic-co-glycolic acid)
PURpolyurethane (foam)
Qvalue parameter of the constant phase element
Qdlapproximate double layer capacitance, based on a constant phase element
QL1constant phase element that corresponds to the PEG film
QL2constant phase element that corresponds to the passive film
Rctcharge transfer resistance
RL1pore resistance
RL2resistance of the polymer layer or corrosion products
Rssolution resistance
ρdensity (g/cm3)
SBETsurface area determined by the Brunauer-Emmett-Teller method
SEMscanning electron microscopy
timmersion time (h)

References

  1. Prasad, K.; Bazaka, O.; Chua, M.; Rochford, M.; Fedrick, L.; Spoor, J.; Symes, R.; Tieppo, M.; Collins, C.; Cao, A.; et al. Metallic Biomaterials: Current Challenges and Opportunities. Materials 2017, 10, 884. [Google Scholar] [CrossRef] [PubMed]
  2. Grogan, J.A.; O’Brien, B.J.; Leen, S.B.; McHugh, P.E. A corrosion model for bioabsorbable metallic stents. Acta Biomater. 2011, 7, 3523–3533. [Google Scholar] [CrossRef] [PubMed]
  3. Wegener, B.; Sievers, B.; Utzschneider, S.; Müller, P.; Jansson, V.; Rößler, S.; Quadbeck, P. Microstructure, cytotoxicity and corrosion of powder-metallurgical iron alloys for biodegradable bone replacement materials. Mater. Sci. Eng. B 2011, 176, 1789–1796. [Google Scholar] [CrossRef]
  4. Yoo, Y.W.; Park, G.J.; Lee, W.K. Surface modification of coralline scaffold for the improvement of biocompatibility and bioactivity of osteoblast. J. Ind. Eng. Chem. 2016, 33, 33–41. [Google Scholar] [CrossRef]
  5. Nasution, A.; Murni, N.S.; Sing, N.B.; Idris, M.H.; Hermawan, H. Partially degradable friction-welded pure iron–stainless steel 316L bone pin. J. Biomed. Mater. Res. Part B Appl. Biomater. 2015, 103, 31–38. [Google Scholar] [CrossRef] [PubMed]
  6. He, J.; He, F.L.; Li, D.W.; Liu, Y.L.; Liu, Y.Y.; Ye, Y.J.; Yin, D.C. Advances in Fe-based biodegradable metallic materials. RSC Adv. 2016, 6, 112819–112838. [Google Scholar] [CrossRef]
  7. Purnama, A.; Hermawan, H.; Couet, J.; Mantovani, D. Assessing the biocompatibility of degradable metallic materials: State-of-the-art and focus on the potential of genetic regulation. Acta Biomater. 2015, 6, 1800–1807. [Google Scholar] [CrossRef] [PubMed]
  8. Badar, M.; Lünsdorf, H.; Evertz, F.; Rahim, M.I.; Glasmacher, B.; Hauser, H.; Mueller, P.P. The formation of an organic coat and the release of corrosion microparticles from metallic magnesium implants. Acta Biomater. 2013, 9, 7580–7589. [Google Scholar] [CrossRef] [PubMed]
  9. Pan, Y.; He, S.; Wang, D.; Huang, D.; Zheng, T.; Wang, S.; Chen, C. In Vitro degradation and electrochemical corrosion evaluations of microarc oxidized pure Mg, Mg-Ca and Mg-Ca-Zn alloys for biomedical applications. Mater. Sci. Eng. C 2015, 47, 85–96. [Google Scholar] [CrossRef] [PubMed]
  10. Rössig, C.; Angrisani, N.; Helmecke, P.; Besdo, S.; Seitz, J.M.; Welke, B.; Reifenrath, J. In Vivo evaluation of a magnesium-based degradable intramedullary nailing system in a sheep model. Acta Biomater. 2015, 25, 369–383. [Google Scholar] [CrossRef] [PubMed]
  11. Böstman, O.; Pihlajamäki, H. Clinical biocompatibility of biodegradable orthopaedic implants for internal fixation: A review. Biomaterials 2000, 21, 2615–2621. [Google Scholar] [CrossRef]
  12. Liu, F.; Chen, C.; Niu, J.; Pei, J.; Zhang, H.; Huang, H.; Yuan, G. The processing of Mg alloy micro-tubes for biodegradable vascular stents. Mater. Sci. Eng. C 2015, 48, 400–407. [Google Scholar] [CrossRef] [PubMed]
  13. Narushima, T. New-generation metallic biomaterials. In Metals for Biomedical Devices, 1st ed.; Niinomi, M., Ed.; Woodhead Publishing: Sawston, UK, 2010; pp. 355–378. ISBN 9781845699246. [Google Scholar]
  14. Riaz, U.; Nwaoha, C.; Ashraf, S.M. Recent advances in corrosion protective composite coatings based on conducting polymers and natural resource derived polymers. Prog. Org. Coat. 2014, 77, 743–756. [Google Scholar] [CrossRef]
  15. Wang, S.; Xu, Y.; Zhou, J.; Li, H.; Chang, J.; Huan, Z. In Vitro degradation and surface bioactivity of iron-matrix composites containing silicate-based bioceramic. Bioact. Mater. 2017, 2, 10–18. [Google Scholar] [CrossRef] [PubMed]
  16. Zhen, Z.; Xi, T.; Zheng, Y. A review on in vitro corrosion performance test of biodegradable metallic materials. Trans. Nonferrous Met. Soc. China 2013, 23, 2283–2293. [Google Scholar] [CrossRef]
  17. Mouzou, E.; Paternoster, C.; Tolouei, R.; Purnama, A.; Chevallier, P.; Dubé, D.; Prima, F.; Mantovani, D. In Vitro degradation behavior of Fe-20Mn-1.2C alloy in three different pseudo-physiological solutions. Mater. Sci. Eng. C 2016, 61, 564–573. [Google Scholar] [CrossRef] [PubMed]
  18. Saqaei, M.; Fathi, M.; Edris, H.; Mortazavi, V. Preparation and biocompatibility evaluation of bioactive glass–forsterite nanocomposite powder for oral bone defects treatment applications. Mater. Sci. Eng. C 2015, 56, 409–416. [Google Scholar] [CrossRef] [PubMed]
  19. Matusiewicz, H. Potential release of in vivo trace metals from metallic medical implants in the human body: From ions to nanoparticles—A systematic analytical review. Acta Biomater. 2014, 10, 2379–2403. [Google Scholar] [CrossRef] [PubMed]
  20. Vojtěch, D.; Kubásek, J.; Čapek, J.; Pospíšilová, I. Comparative mechanical and corrosion studies on magnesium, zinc and iron alloys as biodegradable metals. Mater. Technol. 2015, 49, 877–882. [Google Scholar] [CrossRef]
  21. Heiden, M.; Kustas, A.; Chaput, K.; Nauman, E.; Johnson, D.; Stanciu, L. Effect of microstructure and strain on the degradation behavior of novel bioresorbable iron–manganese alloy implants. J. Biomed. Mater. Res. A 2015, 103, 738–745. [Google Scholar] [CrossRef] [PubMed]
  22. Lin, W.; Qin, L.; Qi, H.; Zhang, D.; Zhang, G.; Gao, R.; Qiu, H.; Xia, Y.; Cao, P.; Wang, X.; et al. Long-term In Vivo corrosion behavior, biocompatibility and bioresorption mechanism of a bioresorbable nitrided iron scaffold. Acta Biomater. 2017, 54, 454–468. [Google Scholar] [CrossRef] [PubMed]
  23. Chen, Y.; Smith, C.; Sankar, J. Recent advances on the development of magnesium alloys for biodegradable implants. Acta Biomater. 2014, 10, 4561–4573. [Google Scholar] [CrossRef] [PubMed]
  24. Hampp, C.; Angrisani, N.; Reifenrath, J.; Bormann, D.; Seitz, J.M.; Meyer-Lindenberg, A. Evaluation of the biocompatibility of two magnesium alloys as degradable implant materials in comparison to titanium as non-resorbable material in the rabbit. Mater. Sci. Eng. C 2013, 33, 317–326. [Google Scholar] [CrossRef] [PubMed]
  25. Wang, J.; Witte, F.; Xi, T.; Zheng, Y.; Yang, K.; Yang, Y.; Chan, K. Recommendation for modifying current cytotoxicity testing standards for biodegradable magnesium-based materials. Acta Biomater. 2015, 21, 237–249. [Google Scholar] [CrossRef] [PubMed]
  26. Halama, M.; Kreislova, K.; Lysebettens, J.V. Prediction of Atmospheric Corrosion of Carbon Steel Using Artificial Neural Network Model in Local Geographical Regions. Corrosion 2011, 67, 1–6. [Google Scholar] [CrossRef]
  27. Halama, M.; Tkáč, J.; Monbaliu, O.; Zhu, Y. Non-destructive technique for evaluation of degradation on solar cells. Mater. Sci. Forum 2015, 811, 3–10. [Google Scholar] [CrossRef]
  28. Hendry, J.A.; Pilliar, R.M. The fretting corrosion resistance of PVD surface-modified orthopedic implant alloys. J. Biomed. Mater. Res. 2001, 58, 156–166. [Google Scholar] [CrossRef]
  29. Razavi, M.; Fathi, M.H.; Meratian, M. Microstructure, mechanical properties and bio-corrosion evaluation of biodegradable AZ91-FA nanocomposites for biomedical applications. Mater. Sci. Eng. A 2010, 527, 6938–6944. [Google Scholar] [CrossRef]
  30. Alabbasi, A.; Liyanaarachichi, S.; Kannan, B.M. Polylactic acid coating on a biodegradable magnesium alloy: An in vitro degradation study by electrochemical impedance spectroscopy. Thin Solid Films 2012, 520, 6841–6844. [Google Scholar] [CrossRef]
  31. Mukhametkaliyev, T.; Surmeneva, M.A.; Vladescu, A.; Cotrut, C.M.; Braic, M.; Dinu, M.; Vranceanu, M.D.; Pana, I.; Mueller, M.; Surmenev, R.A. A biodegradable AZ91 magnesium alloy coated with a thin nanostructured hydroxyapatite for improving the corrosion resistance. Mater. Sci. Eng. C 2017, 75, 95–103. [Google Scholar] [CrossRef] [PubMed]
  32. Su, Y.; Champagne, S.; Trenggono, A.; Tolouei, R.; Mantovani, D.; Hermawan, H. Development and characterization of silver containing calcium phosphate coatings on pure iron foam intended for bone scaffold applications. Mater. Des. 2018, 148, 124–134. [Google Scholar] [CrossRef]
  33. Wen, Z.; Zhang, L.; Chen, C.; Liu, Y.; Wu, C.; Dai, C. A construction of novel iron-foam-based calcium phosphate/chitosan coating biodegradable scaffold material. Mater. Sci. Eng. C 2013, 33, 1022–1031. [Google Scholar] [CrossRef] [PubMed]
  34. Chou, D.T.; Wells, D.; Hong, D.; Lee, B.; Kuhn, H.; Kumta, P.N. Novel processing of iron–manganese alloy-based biomaterials by inkjet 3-D printing. Acta Biomater. 2013, 9, 8593–8603. [Google Scholar] [CrossRef] [PubMed]
  35. Čapek, J.; Kubásek, J.; Vojtěch, D.; Jablonská, E.; Lipov, J.; Ruml, T. Microstructural, mechanical, corrosion and cytotoxicity characterization of the hot forged FeMn30 (wt. %) alloy. Mater. Sci. Eng. C 2016, 58, 900–908. [Google Scholar] [CrossRef] [PubMed]
  36. Čapek, J.; Vojtěch, D. Microstructural and mechanical characteristics of porous iron prepared by powder metallurgy. Mater. Sci. Eng. C 2014, 43, 494–501. [Google Scholar] [CrossRef] [PubMed]
  37. Liu, B.; Zehng, Y.F.; Ruan, L. In Vitro investigation of Fe30Mn6Si shape memory alloy as potential biodegradable metallic material. Mater. Lett. 2011, 65, 540–543. [Google Scholar] [CrossRef]
  38. Chen, Q.; Thouas, G.A. Metallic implant biomaterials. Mater. Sci. Eng. R Rep. 2015, 87, 1–57. [Google Scholar] [CrossRef]
  39. Zheng, Y.F.; Gu, X.N.; Witte, F. Biodegradable metals. Mater. Sci. Eng. R Rep. 2014, 77, 1–34. [Google Scholar] [CrossRef]
  40. Schinhammer, M.; Gerber, I.; Hänzi, A.C.; Uggowitzer, P.J. On the cytocompatibility of biodegradable Fe-based alloys. Mater. Sci. Eng. C 2013, 33, 782–789. [Google Scholar] [CrossRef] [PubMed]
  41. Törne, K.; Larsoon, M.; Norlin, A.; Weissenrieder, J. Degradation of zinc in saline solutions, plasma, and whole blood. J. Biomed. Mater. Res. Part B Appl. Biomater. 2016, 104, 1141–1151. [Google Scholar] [CrossRef] [PubMed]
  42. Obayi, C.S.; Tolouel, R.; Paternoster, C.; Turgeon, S.; Okorie, B.A.; Obikwelu, D.O.; Cassar, G.; Buhagiar, J.; Mantovani, D. Influence of cross-rolling on the micro-texture and biodegradation of pure iron as biodegradable material for medical implants. Acta Biomater. 2015, 17, 68–77. [Google Scholar] [CrossRef] [PubMed]
  43. Li, H.; Zheng, Y.; Qin, L. Progress of biodegradable metals. Prog. Nat. Sci. 2014, 24, 414–422. [Google Scholar] [CrossRef] [Green Version]
  44. Agarwal, R.; García, A.J. Biomaterial strategies for engineering implants for enhanced osseointegration and bone repair. Adv. Drug Deliv. Rev. 2015, 94, 53–62. [Google Scholar] [CrossRef] [PubMed] [Green Version]
  45. Ulum, M.F.; Arafat, A.; Noviana, D.; Yusop, A.H.; Nasution, A.K.; Abdul, K.M.R.; Hermawan, H. In Vitro and In Vivo degradation evaluation of novel iron-bioceramic composites for bone implant applications. Mater. Sci. Eng. C 2014, 36, 336–344. [Google Scholar] [CrossRef] [PubMed]
  46. Mahapatro, A. Bio-functional nano-coatings on metallic biomaterials. Mater. Sci. Eng. C 2015, 55, 227–251. [Google Scholar] [CrossRef] [PubMed]
  47. McEntire, B.J.; Bal, B.S.; Rahaman, M.N.; Chevalier, J.; Pezzotti, G. Ceramics and ceramic coatings in orthopaedics. J. Eur. Ceram. Soc. 2015, 35, 4327–4369. [Google Scholar] [CrossRef]
  48. Dehestani, M.; Adolfsson, E.; Stanciu, L.A. Mechanical properties and corrosion behavior of powder metallurgy iron-hydroxyapatite composites for biodegradable implant applications. Mater. Des. 2016, 109, 556–569. [Google Scholar] [CrossRef]
  49. Oriňaková, R.; Oriňak, A.; Kupková, M.; Hrubovčáková, M.; Bučková, L.M.; Giretová, M.; Medvecký, Ľ.; Dobročka, D.; Patruš, O.; Kaľavský, F. In Vitro degradation and cytotoxicity evaluation of iron biomaterials with hydroxyapatite film. Int. J. Electrochem. Sci. 2015, 10, 8158–8174. [Google Scholar]
  50. Huang, Y.; Ding, Q.; Han, S.; Yan, Y.; Pang, X. Characterisation, corrosion resistance and in vitro bioactivity of manganese-doped hydroxyapatite films electrodeposited on titanium. J. Mater. Sci. Mater. Med. 2013, 24, 1853–1864. [Google Scholar] [CrossRef] [PubMed]
  51. Daculsi, G.; Goyenvalle, E.; Cognet, R.; Aguado, E.; Suokas, E.O. Ostoconductive properties of poly(96L/4D-lactide)/beta-tricalcium phosphate in long term animal model. Biomaterials 2011, 32, 3166–3177. [Google Scholar] [CrossRef] [PubMed] [Green Version]
  52. Mehdipour, M.; Afshar, A. A study of the electrophoretic deposition of bioactive glass-chitosan composite coating. Ceram. Int. 2012, 38, 471–476. [Google Scholar] [CrossRef]
  53. Yusop, A.H.M.; Daud, N.M.; Nur, H.; Kadir, M.R.A.; Hermawan, H. Controlling the degradation kinetics of porous iron by poly (lactic-co-glycolic acid) infiltration for use as temporary medical implants. Sci. Rep. 2015, 15, 1–17. [Google Scholar] [CrossRef] [PubMed]
  54. Pidhatika, B.; Rodenstein, M.; Chen, Y.; Rakhmatullina, E.; Mühlebach, A.; Acikgöz, C.; Konradi, R. Comparative stability studies of poly(2-methyl-2-oxazoline) and poly(ethylene glycol) brush coatings. Biointerphases 2012, 7, 1. [Google Scholar] [CrossRef] [PubMed]
  55. Alcantar, A.N.; Aydil, S.E.; Israelachvili, N.J. Polyethylene glycol-coated biocompatible surfaces. J. Biomed. Mater. Res. B Appl. Biomater. 2000, 51, 343–351. [Google Scholar] [CrossRef]
  56. Bauer, S.; Schmuki, P.; von der Mark, K.; Park, J. Engineering biocompatible implant surfaces: Part I: Materials and surfaces. Prog. Mater. Sci. 2013, 58, 261–326. [Google Scholar] [CrossRef]
  57. Oriňaková, R.; Oriňak, A.; Bučková, L.M.; Labbanczová, E.; Kupková, M.; Hrubovčáková, M.; Fedorková, A. Biodegradable Open Cell Iron Foams for Skeletal Application. Powder Metall. Prog. 2012, 12, 219–223. [Google Scholar]
  58. Kalantari, S.M.; Arabi, H.; Mirdamadi, S.; Mirsalehi, S.A. Biocompatibility and compressive properties of Ti-6Al-4V scaffolds having Mg element. J. Mech. Behav. Biomed. Mater. 2015, 48, 183–191. [Google Scholar] [CrossRef] [PubMed]
  59. Park, J.; Lee, S.; Kang, S.; Jeon, J.; Lee, S.H.; Kim, H.K.; Choi, H. Complex effects of alloy composition and porosity on the phase transformations and mechanical properties of powder metallurgy steels. Powder Technol. 2015, 284, 459–466. [Google Scholar] [CrossRef]
  60. Oriňak, A.; Oriňaková, R.; Orsagová Králová, Z.; Morovská Turoňová, A.; Kupková, M.; Hrubovčáková, M.; Džunda, R. Sintered metallic foams for biodegradable bone replacement materials. J. Porous Mater. 2014, 21, 131–140. [Google Scholar] [CrossRef]
  61. Hedayati, R.; Sadighi, M.; Mohammadi-Aghdam, M.; Zadpoor, A.A. Effect of mass multiple counting on the elastic properties of open-cell regular porous biomaterials. Mater. Des. 2016, 89, 9–20. [Google Scholar] [CrossRef]
  62. Čapek, J.; Vojtěch, D. Properties of porous magnesium prepared by powder metallurgy. Mater. Sci. Eng. C 2013, 33, 564–569. [Google Scholar] [CrossRef] [PubMed]
  63. Reihaniam, M.; Asadullahpour, S.R.; Hajarpour, S.; Gheisari, K. Application of neural network and genetic algorithm to powder metallurgy of pure iron. Mater. Des. 2011, 32, 3183–3188. [Google Scholar] [CrossRef]
  64. Alavi, R.; Trenggono, A.; Champagne, S.; Hermawan, H. Investigation on Mechanical Behavior of Biodegradable Iron Foams under Different Compression Test Conditions. Metals 2017, 7, 202. [Google Scholar] [CrossRef]
  65. Zarebski, K.; Putyra, P. Iron powder-based graded products sintered by conventional method and by SPS. Adv. Powder Technol. 2015, 26, 401–408. [Google Scholar] [CrossRef]
  66. ASTM. Standard Test Method for Conducting Potentiodynamic Polarization Resistance Measurements; ASTM: West Conshohocken, PA, USA, 2009. [Google Scholar]
  67. ASTM. Standard Guide for Laboratory Immersion Corrosion Testing of Metals; ASTM: West Conshohocken, PA, USA, 2012. [Google Scholar]
  68. Markušová-Bučková, L.; Oriňaková, R.; Oriňak, A.; Gorejová, R.; Kupková, M.; Hrubovčáková, M.; Baláž, M.; Kovaľ, K. Static Corrosion Test of Porous Iron Material with Polymer Coating. Powder Metall. Prog. 2016, 16, 99–106. [Google Scholar] [CrossRef]
  69. McCafferty, E. Validation of corrosion rates measured by the Tafel extrapolation method. Corros. Sci. 2015, 47, 3202–3215. [Google Scholar] [CrossRef]
  70. Jüttner, K. Electrochemical impedance spectroscopy (EIS) of corrosion processes on inhomogeneous surfaces. Electrochim. Acta 1990, 35, 1501–1508. [Google Scholar] [CrossRef]
  71. Zhu, S.; Huang, N.; Xu, L.; Zhang, Y.; Liu, H.; Sun, H.; Leng, Y. Biocompatibility of pure iron: In Vitro assessment of degradation kinetics and cytotoxicity on endothelial cells. Mater. Sci. Eng. C 2009, 29, 1589–1592. [Google Scholar] [CrossRef]
  72. Moravej, M.; Purnama, A.; Fiset, M.; Couet, J.; Mantovani, D. Electroformed pure iron as a new biomaterial for degradable stents: In vitro degradation and preliminary cell viability studies. Acta Biomater. 2010, 6, 1843–1851. [Google Scholar] [CrossRef] [PubMed]
  73. Park, H.; Park, Y.M.; Oh, S.K.; You, K.M.; Lee, S.H. Enhanced reduction of nitrate by supported nanoscale zero-valent iron prepared in ethanol-water solution. Environ. Technol. 2009, 30, 261–267. [Google Scholar] [CrossRef] [PubMed]
  74. Bonder, J.M.; Zhang, Y.; Kiick, K.L.; Papaefthymiou, V.; Hadjipanayis, G.C. Controlling synthesis of Fe nanoparticles with polyethylene glycol. J. Magn. Magn. Mater. 2007, 311, 658–664. [Google Scholar] [CrossRef]
  75. Shameli, K.; Bin Ahmad, M.; Jazayeri, S.D.; Sedaghat, S.; Shabanzadeh, P.; Jahangirian, H.; Mahdavi, M.; Abdollahi, Y. Synthesis and characterization of polyethylene glycol mediated silver nanoparticles by the green method. Int. J. Mol. Sci. 2012, 13, 6639–6650. [Google Scholar] [CrossRef] [PubMed]
  76. Chieng, B.W.; Ibrahim, N.A.; Yunus, W.M.Z.W.; Hussein, M.Z. Poly(lactic acid)/poly(ethylene glycol) polymer nanocomposites: Effects of graphene nanoplatelets. Polymers 2013, 6, 93–104. [Google Scholar] [CrossRef]
  77. Seol, S.K.; Kim, D.; Jung, S.; Chang, W.S.; Kim, J.T. One-step synthesis of PEG-coated gold nanoparticles by rapid microwave heating. J. Nanomater. 2013, 2013, 1–6. [Google Scholar] [CrossRef]
  78. Zheng, S.; Li, X.; Zhang, Y.; Xie, Q.; Wong, Y.S.; Zheng, W.; Chen, T. PEG-nanolized ultrasmall selenium nanoparticles overcome drug resistance in hepatocellular carcinoma HepG2 cells through induction of mitochondria dysfunction. Int. J. Nanomed. 2012, 7, 3939–3949. [Google Scholar]
  79. Yamini, D.; Venkatasubbu, G.D.; Kumar, J.; Ramakrishnan, V. Raman scattering studies on PEG functionalized hydroxyapatite nanoparticles. Spectrochim. Acta Part A Mol. Biomol. Spectrosc. 2014, 117, 299–303. [Google Scholar] [CrossRef] [PubMed]
  80. Samuel, A.Z.; Umapathy, S. Energy funneling and macromolecular conformational dynamics: A 2D Raman correlation study of PEG melting. Polym. J. 2014, 46, 330–336. [Google Scholar] [CrossRef]
  81. Zustiak, S.P.; Leach, J.B. Hydrolytically degradable poly(ethylene glycol) hydrogel scaffolds with tunable degradation and mechanical properties. Biomacromolecules 2010, 11, 1348–1357. [Google Scholar] [CrossRef] [PubMed]
  82. Qi, Y.; Qi, H.; He, Y.; Lin, W.; Li, P.; Qin, L.; Hu, Y.; Chen, L.; Liu, Q.; Sun, H.; et al. Strategy of Metal–Polymer Composite Stent to Accelerate Biodegradation of Iron-Based Biomaterials. ACS Appl. Mater. Interfaces 2018, 10, 182–192. [Google Scholar] [CrossRef] [PubMed]
  83. Tamariz, E.; Rios-Ramírez, A. Biodegradation of medical purpose polymeric materials and their impact on biocompatibility. In Biodegradation—Life of Science; Chamy, R., Ed.; InTech: London, UK, 2013; pp. 1–29. [Google Scholar]
  84. Vierra, A.C.; Margues, A.T.; Guedes, R.M.; Tita, V. Material model proposal for biodegradable materials. Procedia Eng. 2011, 10, 1597–1602. [Google Scholar] [CrossRef]
  85. Loh, X.J. The effect of pH on the hydrolytic degradation of poly (ε-caprolactone)-block-poly(ethylene glycol) copolymers. J. Appl. Polym. Sci. 2013, 127, 2046–2056. [Google Scholar] [CrossRef]
  86. Dumitriu, S.; Popa, V.I. Polymeric Biomaterials: Medicinal and Pharmaceutical Applications; Taylor & Francis Group: New York, NY, USA, 2013; Volume 2, ISBN 9781420094695. [Google Scholar]
  87. Kannan, M.B. Biodegradable polymeric coatings for surface modification of magnesium-based biomaterials. In Surface Modification of Magnesium and Its Alloys for Biomedical Applications, Volume II: Modification and Coating Techniques, 1st ed.; Narayanan, T.S., Park, I.S., Lee, M.H., Eds.; Elsevier: Cambridge, MA, USA, 2015; ISBN 978-1-78242-078-1. [Google Scholar]
  88. Ulbricht, J.; Jordan, R.; Luxenhofer, R. On the biodegradability of polyethylene glycol, polypeptoids and poly(2-oxazoline)s. Biomaterials 2014, 35, 4848–4861. [Google Scholar] [CrossRef] [PubMed]
  89. Flis, J.; Zakroczymski, T.; Kleshnya, V.; Kobiela, T.; Duś, R. Changes in hydrogen entry rate and in surface of iron during cathodic polarisation in alkaline solutions. Electrochim. Acta 1999, 44, 3989–3997. [Google Scholar] [CrossRef]
Figure 1. SEM micrographs of the surface of the open cell iron samples with a gradually increasing load of polyethylene glycol (PEG): Fe sample (a,b); Fe-PEG1, 0.8 wt. % PEG (c,d); Fe-PEG2, 1.5 wt. % PEG (e,f); and Fe-PEG3, 3.0 wt. % PEG (g,h). Details of the surfaces shown above at a higher magnification (b,d,f,h).
Metals 08 00499 g001
Figure 2. Microstructure of open cell iron samples with increasing amounts of PEG coating: Fe-PEG1, 0.8 wt. % PEG (a); Fe-PEG2, 1.5 wt. % PEG (b); Fe-PEG3, 3.0 wt. % PEG (c).
Metals 08 00499 g002
Figure 3. Representative cross-sectional micrograph of the polymer coating layer on the surface of Fe-PEG3 sample containing, 3.0 wt. % PEG (white arrows point to the interface).
Metals 08 00499 g003
Figure 4. FT-infrared spectra of pure PEG (black line, bottom) and the Fe-PEG composites (in order from bottom to top: Fe-PEG1—red line, Fe-PEG2—orange line, Fe-PEG3—blue line).
Metals 08 00499 g004
Figure 5. Raman spectra of pure PEG (black line) and the Fe-PEG composites (Fe-PEG1—red line, Fe-PEG2—orange line, Fe-PEG3—blue line).
Metals 08 00499 g005
Figure 6. SEM micrographs of sintered iron samples after 4 weeks of corrosion in Hanks’ solution: Fe sample without any PEG (a,b); Fe-PEG1, 0.8 wt. % PEG (c,d); Fe-PEG2, 1.5 wt. % PEG (e,f); and Fe-PEG3, 3.0 wt. % PEG (g,h). Detail of the surfaces above at a higher magnification (b,d,f,h).
Metals 08 00499 g006
Figure 7. SEM micrographs of sintered iron samples after 8 weeks of corrosion in Hanks’ solution: Fe sample without PEG (a,b); Fe-PEG1, 0.8 wt. % PEG (c,d); Fe-PEG2, 1.5 wt. % PEG (e,f); and Fe-PEG3, 3.0 wt. % PEG (g,h). Detail of the surfaces above at a higher magnification (b,d,f,h).
Metals 08 00499 g007
Figure 8. SEM micrographs of sintered iron samples after 12 weeks of corrosion in Hanks’ solution: Fe sample without PEG (a,b); Fe-PEG1, 0.8 wt. % PEG (c,d); Fe-PEG2, 1.5 wt. % PEG (e,f); and Fe-PEG3, 3.0 wt. % PEG (g,h). Detail of the surfaces above at a higher magnification (b,d,f,h).
Metals 08 00499 g008
Figure 9. Corrosion rate of open cell iron samples with and without the PEG film obtained from immersion tests in Hanks’ solution.
Metals 08 00499 g009
Figure 10. Potentiodynamic polarization curves of open cell iron samples with and without the PEG film obtained in Hanks’ solution at pH 7.4 and 37 °C at a scan rate 0.1 mV/s.
Metals 08 00499 g010
Figure 11. Nyquist plots of uncoated and PEG-coated iron samples before (black) and after immersion (red—24 h, green—48 h) in Hanks’ solution: Fe sample (a); Fe-PEG1 (b) Fe-PEG2 (c); Fe-PEG3 (d).
Metals 08 00499 g011
Figure 12. Nyquist plots of open cell iron samples with and without PEG coating before immersion (a) and after immersion in Hanks’ solution for 48 h (b).
Metals 08 00499 g012
Figure 13. Equivalent circuit used for the modeling of the electrical impedance spectroscopy (EIS) spectra of sintered iron samples with and without PEG coating before degradation and after immersion in Hanks’ solution for 24 and 48 h. Rs is the solution resistance, RL1 is the pore resistance, RL2 is the resistance of polymer layer or the corrosion products, and Rct is the charge transfer resistance. QL1, QL2, and Qdl are the constant phase elements.
Metals 08 00499 g013
Figure 14. Schematic representation of the Fe-PEG sample degradation process.
Metals 08 00499 g014
Table 1. Composition of Hanks’ solution.
ComponentConcentration (g/L)
NaCl8.00
KCl0.40
CaCl20.14
MgSO4·7H2O0.06
NaH2PO4·2H2O0.06
NaHCO30.35
Glucose1.00
KH2PO40.60
MgCl2·6H2O0.10
Table 2. Chemical composition of the surface of sintered iron samples, uncoated and coated with different amounts of the PEG layer.
ElementChemical Composition (wt. %)
FeFe-PEG1Fe-PEG2Fe-PEG3
Fe K98.4085.8756.350
C K0.5311.4235.5059.32
O K1.072.718.1540.68
Table 3. The average values of mass losses of open cells iron samples after 12 weeks of static corrosion in Hanks’ solution.
WeekSample Mass Loss (wt. %)
FeFe-PEG1Fe-PEG2Fe-PEG3
00000
10.36 ± 0.020.82 ± 0.060.93 ± 0.061.09 ± 0.07
20.45 ± 0.042.03 ± 0.122.38 ± 0.144.04 ± 0.28
30.57 ± 0.043.22 ± 0.253.89 ± 0.304.70 ± 0.30
42.06 ± 0.164.82 ± 0.425.55 ± 0.414.88 ± 0.34
53.03 ± 0.246.26 ± 0.506.91 ± 0.565.97 ± 0.55
63.57 ± 0.336.70 ± 0.598.03 ± 0.817.54 ± 0.68
74.16 ± 0.297.25 ± 0.588.77 ± 0.708.62 ± 0.78
84.25 ± 0.418.08 ± 0.909.44 ± 1.198.93 ± 0.71
94.29 ± 0.319.30 ± 0.8410.41 ± 0.929.66 ± 0.77
104.70 ± 0.6010.12 ± 1.0011.42 ± 1.1610.13 ± 0.82
114.88 ± 0.3910.13 ± 0.7911.87 ± 1.0710.67 ± 0.99
125.73 ± 0.6310.14 ± 0.9212.05 ± 1.0810.72 ± 0.89
Table 4. The values of static corrosion rate for each material immersed in Hanks’ solution for 2, 4, 6, 8, 10, and 12 weeks.
Time of Immersion (weeks)Corrosion Rate (mm/year)
FeFe-PEG1Fe-PEG2Fe-PEG3
20.0103 ± 0.00150.0275 ± 0.00380.0421 ± 0.00430.0919 ± 0.0059
40.0236 ± 0.00180.0327 ± 0.00610.0493 ± 0.00470.0555 ± 0.0064
60.0271 ± 0.00190.0316 ± 0.00500.0474 ± 0.00410.0572 ± 0.0053
80.0243 ± 0.00210.0274 ± 0.00330.0420 ± 0.00430.0508 ± 0.0046
100.0214 ± 0.00330.0275 ± 0.00400.0405 ± 0.00470.0461 ± 0.0046
120.0217 ± 0.00150.0230 ± 0.00200.0357 ± 0.00190.0406 ± 0.0034
Table 5. Values of Ecorr, jcorr, and CR for the uncoated Fe sample and samples with PEG film evaluated for the Tafel and non-Tafel behavior of potentiodynamic polarization curves.
UnitFeFe-PEG1Fe-PEG2Fe-PEG3
Tafel evaluationEcorrmV−566 ± 3−600 ± 5−614 ± 6−640 ± 4
jcorrμA/m20.613 ± 0.0410.746 ± 0.0410.859 ± 0.0550.978 ± 0.077
CRmm/year0.438 ± 0.0290.536 ± 0.0260.617 ± 0.0430.703 ± 0.058
Non-Tafel evaluationEcorrmV−566 ± 2−598 ± 3−613 ± 3−641 ± 2
jcorrμA/m20.501 ± 0.0370.6886 ± 0.0340.830 ± 0.0400.933 ± 0.062
CRmm/year0.360 ± 0.0310.494 ± 0.0290.5967 ± 0.0390.670 ± 0.037
Table 6. Impedance parameters of uncoated and PEG-coated open cell Fe samples at fmax = 0.01 Hz.
Impedance ParameterUnitTime of ImmersionFeFe-PEG1Fe-PEG2Fe-PEG3
RctΩ m20 h157.0875.5159.9522.57
24 h120.5183.4066.4055.21
48 h94.8485.5966.4557.92
QdlμF/cm20 h10.1421.0926.5670.55
24 h13.2119.0923.9828.84
48 h16.7918.6023.9627.49

