Article

Multiscale Modelling of Hydrogen Transport and Segregation in Polycrystalline Steels

1
Max-Planck-Institut für Eisenforschung, Max-Planck-Straße 1, 40237 Düsseldorf, Germany
2
Institute for Energy and Climate Research, Forschungszentrum Jülich, 52425 Jülich, Germany
3
Jülich-Aachen Research Alliance (JARA Energy), RWTH Aachen University, 52056 Aachen, Germany
4
Steel Institute, RWTH Aachen University, 52072 Aachen, Germany
*
Author to whom correspondence should be addressed.
Metals 2018, 8(6), 430; https://doi.org/10.3390/met8060430
Submission received: 30 April 2018 / Revised: 1 June 2018 / Accepted: 4 June 2018 / Published: 7 June 2018
(This article belongs to the Special Issue First-Principles Approaches to Metals, Alloys, and Metallic Compounds)

Abstract

:
A key issue in understanding and effectively managing hydrogen embrittlement in complex alloys is identifying and exploiting the critical role of the various defects involved. A chemo-mechanical model for hydrogen diffusion is developed taking into account stress gradients in the material, as well as microstructural trapping sites such as grain boundaries and dislocations. In particular, the energetic parameters used in this coupled approach are determined from ab initio calculations. Complementary experimental investigations that are presented show that a numerical approach capable of massive scale-bridging up to the macroscale is required. Due to the wide range of length scales accounted for, we apply homogenisation schemes for the hydrogen concentration to reach simulation dimensions comparable to metallurgical process scales. Via a representative volume element approach, an ab initio based scale bridging description of dislocation-induced hydrogen aggregation is easily accessible. When we extend the representative volume approach to also include an analytical approximation for the ab initio based description of grain boundaries, we find conceptual limitations that hinder a quantitative comparison to experimental data in the current stage. Based on this understanding, the development of improved strategies for further efficient scale bridging approaches is foreseen.

1. Introduction

Hydrogen embrittlement (HE) can be defined as the structural degradation of materials resulting from exposure to hydrogen and often leading to abrupt and premature failure [1,2,3,4,5,6,7]. HE in complex engineering materials is increasingly commonplace in key application areas, such as hydrogen-based energy conversion cycles [8,9], high strength materials synthesis and coatings [10], marine and deep sea technology as well as structural components in the oil and gas industries [11]. While there is a critical need for such technologies to meet increasing worldwide energy demands, the damage risks associated with HE has become a substantial bottleneck for further development.
Despite considerable effort, the mechanistic causes for HE are not yet completely understood owing to its complex nature [12,13,14]. The competition of different defects for aggregating hydrogen, especially between dislocations and grain boundaries, poses a crucial as well as intricate subject of investigation in hydrogen embrittlement. Especially for dislocations and grain boundaries, the competitive picture is complemented by possibly cooperative damage facilitation, as hydrogen transport to grain boundaries via slip transfer. Currently, some viable mechanisms proposed in the literature are: (i) hydrogen enhanced de-cohesion (HEDE), (ii) hydrogen enhanced localized plasticity (HELP), (iii) hydride-induced embrittlement, and (iv) hydrogen induced super-abundant vacancy (HISAV) formation. In the HEDE mechanism, hydrogen diffusion to and its subsequent interaction with the strained atomic bonds at the crack tip, result in a lowering of the cohesive energy of the material [15], thus making it easier to form a Griffith crack [16,17,18]. The HELP mechanism was proposed to account for observations of localized plasticity at the crack tip in a range of metallic systems [2,19]. It is based on the influence of hydrogen in reducing the mobility of dislocations by screening their interaction stress fields [20,21]. The corresponding increase in plasticity is highly localized owing to the heterogeneous hydrogen distribution due to stress concentrations in the material, and thus culminates prematurely in ductile fracture.
These failure mechanisms and failure-inducing effects depend on localised chemistry, stress and deformation state, and the defects accessible to damage initiation. We therefore aim at the development of an efficient, massively scale-bridging approach that allows for catching process-relevant states of steel products, including massive deformations, high defect densities and varying chemical loadings. The approach of choice is a coupled crystal plasticity finite element (CPFEM) phase field model that is implemented in the Düsseldorf Advanced Material Simulation Kit (DAMASK) [22]. It operates on the macroscale and therefore employs representative volume element (RVE) descriptions that allow for including electronic and atomistic scale information about the system via efficient averaging in terms of composite models.
The manuscript is organised as follows: in Section 2, our recent experimental findings in ferritic steels, which exhibit grain boundary related hydrogen embrittlement, are presented. Hereby, we motivate the subsequent theoretical considerations. In Section 3, the continuum model is introduced, followed by a brief description of the implementation and the ab initio-based parametrisation. In Section 4, the analytic ab initio based approximations for the influence of dislocations on hydrogen aggregation are introduced and we compare the analytic composite model and the fully numerically resolved full-field simulation results. Based on the excellent agreement, we extend the composite model by an efficient, ab initio based description of grain boundaries. We recognise the conceptual difficulties to include grain boundaries in terms of a composite model in an RVE spirit. Finally, in Section 5, we summarise the insights gained and relate them to potential future approaches to the inherently massively scale bridging problem of hydrogen embrittlement.

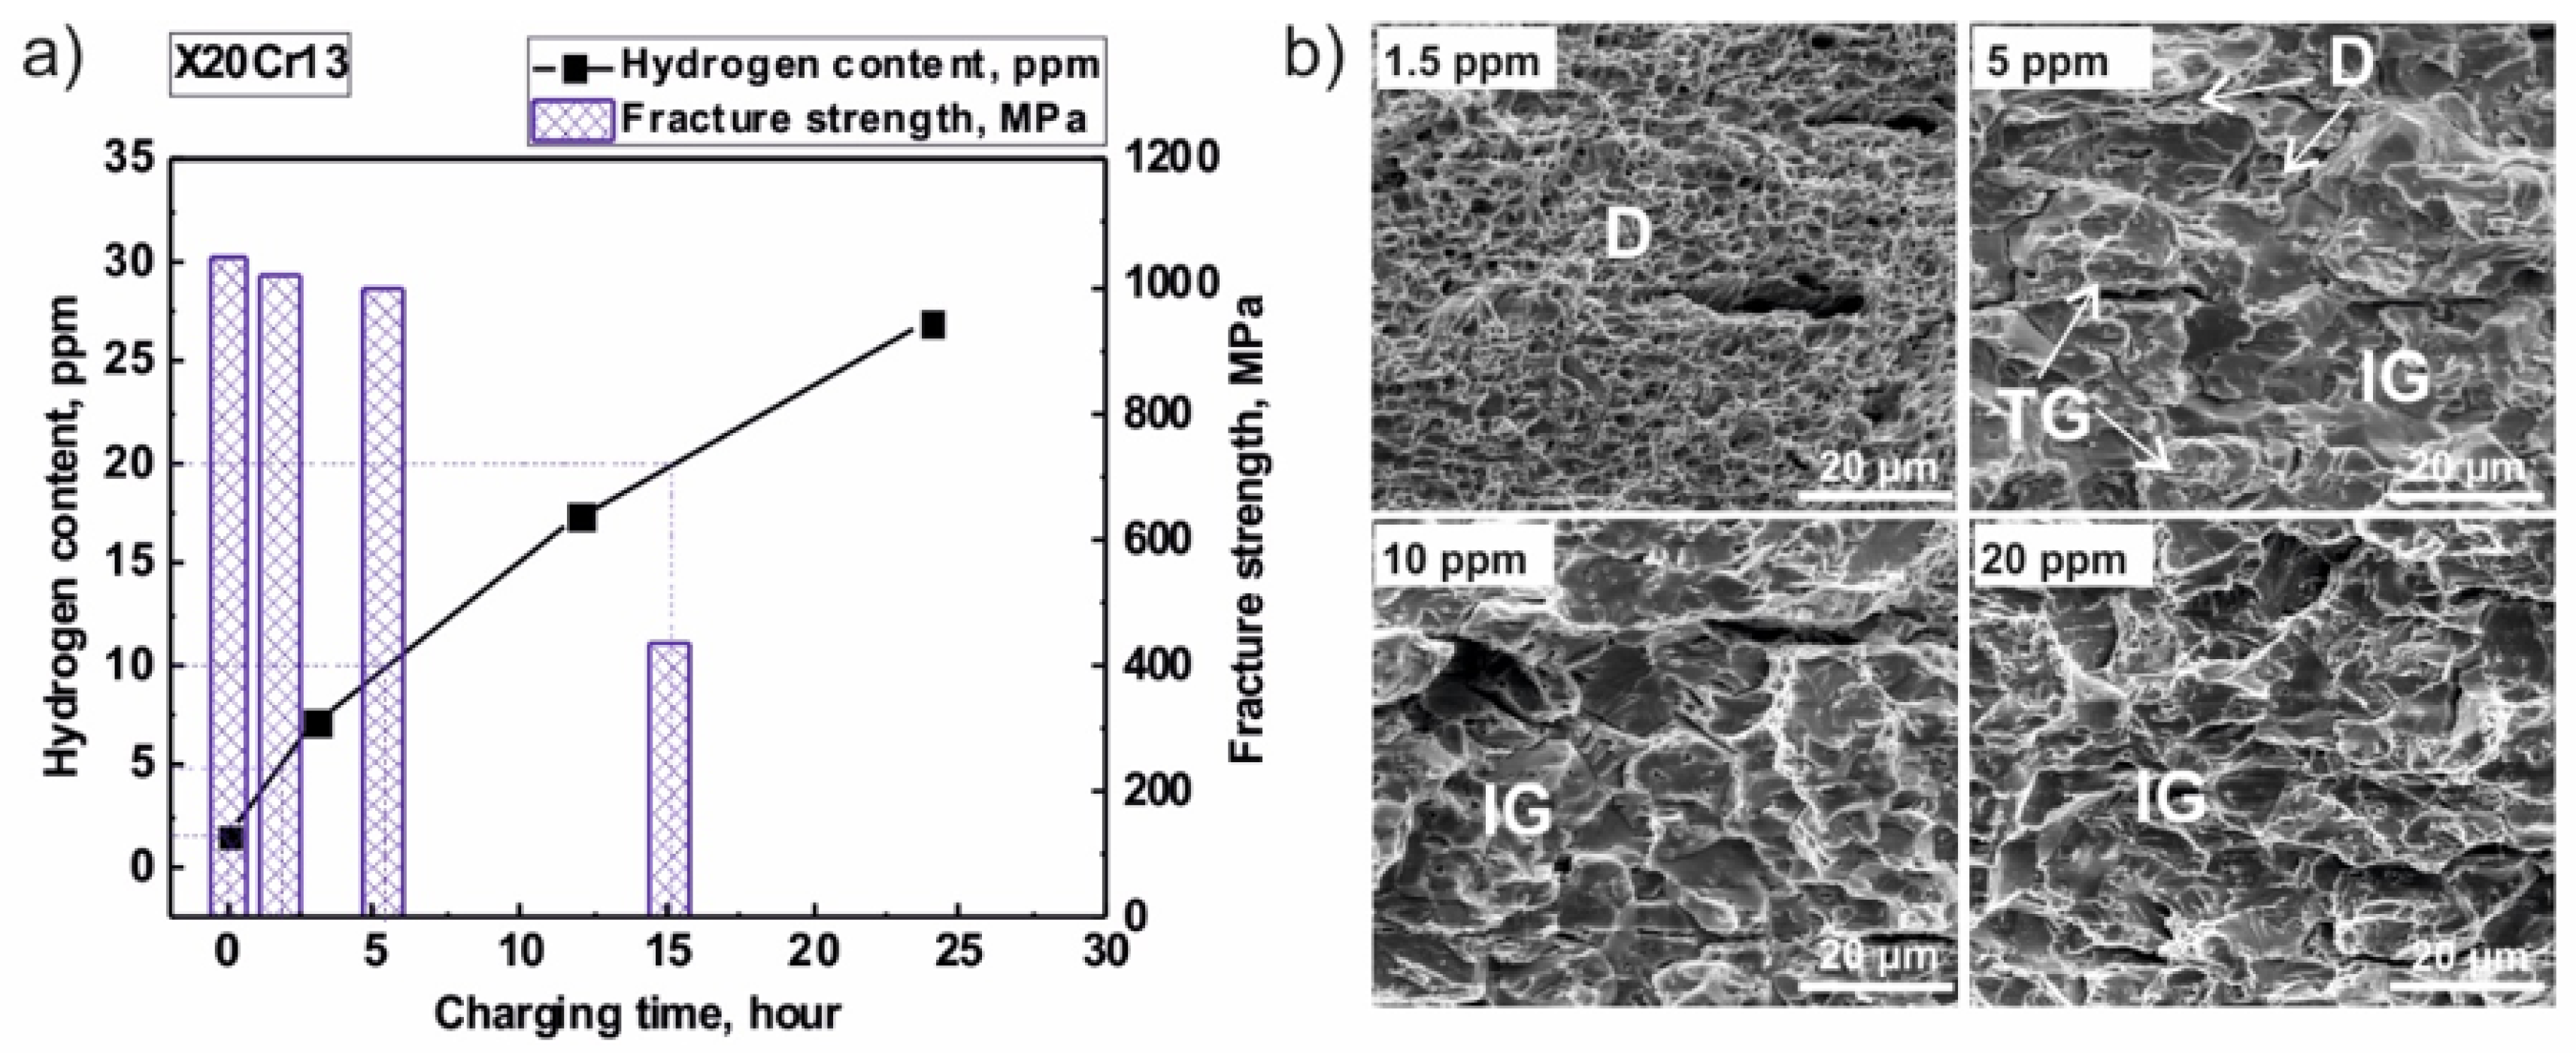
2. Experimental Findings

Our theoretical considerations are complemented by experimental measurements of hydrogen-charged martensitic steel samples, focusing on fracture strength and hydrogen saturation. As we are interested in a qualitative estimate for the difference in hydrogen concentration in steel due to defects relative to a basic Sievert’s law estimate, a cold rolled martensitic stainless steel X20Cr13 is chosen. Here, we expect a high dislocation density and a pronounced effect of defect-mediated hydrogen aggregation.
Figure 1 shows an example of hydrogen induced cracking in a cold rolled martensitic stainless steel X20Cr13 with the chemical composition 0.2% C and 13% Cr in weight percent. The material was pre-charged with hydrogen in 0.05 M H 2 SO 4 and 1.4 g/L Thiourea at the overpotential of −800 mV S C E from 0–24 h to bring in different amounts of hydrogen into the material. Hydrogen charging was carried out with potentiostat High-Power 96 from Bank GmbH, Pohlheim, Germany . A Calomel electrode was used as a reference electrode and a platinum net was used as the counter electrode. Before charging, the specimen surfaces were ground sequentially from #320 to #800 SiC grit paper and finally polished with 6 μ m diamond paste on canvas. After charging, the material was stored in liquid N 2 before hydrogen measurement by hot extraction with the hydrogen analysis equipment LECO RH402. Figure 1a shows the evolution of hydrogen contents according to the charging period. It reveals the material obtained as high as 27 ppm hydrogen after 24 h hydrogen charging. According to the Sievert’s law, the solid solubility of hydrogen in pure iron under hydrogen pressure of 100 bar at room temperature accounts for 2 × 10 7 , which is extremely low compared to the amount of hydrogen measured in this experiment [23]. Therefore, it is assumed the oversaturated hydrogen due to the hydrogen charging is associated with hydrogen at dislocations and grain boundaries. Figure 1a also reveals the sharp reduction of fracture strength due to the charged hydrogen after a slow strain rate test at the strain rate of 10 6 s 1 , which is reduced from 1046 MPa to 432 MPa when the amount of hydrogen is raised from 1.5 ppm to 20 ppm. Slow strain rate tests were performed with a constant extension machine from Zwick, Ulm, Germany, with a maximum load of 30 kN. The tensile specimens are in dog-bone shape with the geometry A25. Figure 1b illustrates the fracture surface from the failed slow strain rate specimens. The as delivered X20Cr13 has the initial hydrogen content of 1.5 ppm, which exhibits fully ductile (D) fracture feature with very fine dimple sizes. After charging with 5 ppm hydrogen, the fracture surface changes to mixed transgranular (TG) and intergranular (IG) cleavage and a few ductile islands. The cracks are propagating through the prior austenite grain boundaries as well as the martensite lath. By further increasing the charged hydrogen, the TG and IG fractures become more prominent. In association with the sharp reduction in fracture strength, the high amount of charged hydrogen is assumed to be accumulating at the prior austenite grain boundaries and reduces the grain boundary cohesion force.
The complexity of the possible interpretation of the reported observations suggests a theoretical approach that reaches the experimental dimensions. On the other hand, it also needs to catch essential aspects of atomistic and electronic interaction of the hydrogen with the dominant species, here presumably dislocations and grain boundaries. In the following section, the ab initio informed crystal plasticity model is introduced, which we extend to include the effective description of these defect species in the context of hydrogen aggregation.

3. Model Formulation

The description of the entire model covers several aspects on multiple length scales. For an extended discussion of the model, see [24]. Following the continuum picture of the crystal plasticity model and hydrogen transport, the numerical implementation is briefly introduced. Based on the continuum picture, we explain which insights and parameters from the quantum mechanical level we use for the scale-bridging approach, and briefly discuss the ab initio model.

3.1. Continuum Model Formulation

Let B 0 R 3 be a microstructural domain of interest, with boundary B 0 . The deformation resulting from an applied loading defines a field, χ ( x ) : x B 0 y B , mapping points x in the reference configuration B 0 to points y in the deformed configuration B and a concentration field, c H ( x ) : x B 0 [ 0 , 1 ] , of the fraction of interstitial lattice positions occupied by hydrogen. The total free energy density of this system is composed of mechanical, chemical and gradient contributions:
f total = f mech + f chem + f grad .
The constitutive model for the mechanical free energy density is presented first. Here, the total deformation gradient, F = grad χ , is multiplicatively decomposed into an elastic, chemical interstitial and plastic component as
F = F e F i F p .
The elastic deformation gradient, F e , determines the stress at a material point, where an anisotropic elastic stiffness, C , relates the elastic GreenLagrange strain measure [25], E , to the second Piola–Kirchhoff stress measure, S [25]:
E = 1 2 ( F e T F e I ) ,   and S = C E .
The chemical deformation gradient, F i , is determined from the hydrogen concentration, c H ,
F i = ϵ H c H I
and results from the interstitial volumetric change associated with solute hydrogen occupancy, ϵ H . As we explain in more detail in Section 3.2, the concentration field c H will be evaluated based on different equilibrium approximations. These distinguish whether no defects, dislocations or dislocations and grain boundaries are present in the system. The plastic deformation gradient evolves according to the flow rule
F ˙ p = L p F p ,
where the plastic velocity gradient, L p , is driven by the stress through the plasticity model. The crystal plasticity model used in the present study, is an adoption of the phenomenological description of Peirce et al. [26] for face-centered cubic crystals. The plastic velocity gradient L p is composed of the slip rates γ ˙ α on each of the 12 BCC {1 1 0}〈1 1 1〉 slip systems, which are indexed by α = 1 , , 12 .
L p = α γ ˙ α b α n α ,
where b α and n α are unit vectors along the slip direction and slip plane normal, respectively. The slip rates are given by
γ ˙ α = γ ˙ 0 τ α g α n sgn τ α
in terms of the resolved shear stress, τ α = S · ( b α n α ) . The slip resistances on each slip system, g α , evolve asymptotically towards g with shear γ β ( β = 1 , , 12 ) according to the relationship
g ˙ α = γ ˙ β h 0 1 g β / g a sgn 1 g β / g h α β
with parameters h 0 and a. The interaction between different slip systems is captured by the hardening matrix h α β .
The constitutive model represents an implicit system of equations to be solved for a consistent elastic and plastic deformation gradient (for details see [27]). The mechanical free energy density is then given by
f mech = 1 2 S · E
and its minimization results in mechanical equilibrium in terms of the first Piola–Kirchhoff stress measure, P ,
δ f mech δ χ = Div P = 0 .
The chemical free energy density for this system is based on the regular solution model
f chem = 1 Ω E H c H + k B T [ c H ln c H + ( 1 c H ) ln ( 1 c H ) ] ,
where Ω is the atomic volume, k B is the Boltzmann constant, T is the temperature and E H is a hydrogen enthalpy. Though E H belongs to bulk Fe, the development of the hydrogen energy description given in the subsequent part of this publication will also include dislocations and grain boundaries.
Following [28], the free energy of the interface is given by
f grad = κ | Grad c H | 2 ,
where κ is the surface energy parameter associated with the diffuse pore–matrix interface. The evolution of the conserved concentration field is then given by the modified Cahn–Hilliard equation
c H ˙ = Grad · M H Grad μ H ,
where M H is the mobility of the hydrogen solute. Their chemical potential μ H is thermodynamically determined from the free energy density
μ H = δ f total δ c H = δ f mech δ c H + E H Ω + k B T Ω ln c H 1 c H ,
where the mechanical coupling with μ H is obtained through Equation (4).

3.2. Numerical Implementation of the Continuum Model

For the numerical implementation of the chemoelastoplastic model, the Düsseldorf Advanced Material Simulation Kit (DAMASK) [22] is used, an open source crystal plasticity finite element library. For the sake of simplicity, we exemplarily introduce here representative volume elements (RVEs) used for simulations of fcc materials. The respective numerical parameters will be described correspondingly in the results part.
RVEs belong to the group of statistical approaches to achieve a representative homogenization of a material’s microstructure for a macroscopic model. For plasticity models, the varying quantity typically is the dislocation density. In Figure 2, an example of the RVE for a dislocation density of ρ = 1 × 10 15 m 2 is shown. The dislocation density ρ is given as ρ = N d / V , where N is the number of dislocations, d the circumference of the dislocation line, modeled as ellipse, and V the volume of the simulation box. The semi major-axis is labelled a, the semi minor-axis b. The dimensions of the dislocation lines are a = 15 nm ± 3 nm and b = 7 nm ± 3 nm , where ± 3 nm here means that, for each individual dislocation line, a value from the interval ( 3 : 3 ) is randomly added to the corresponding basic value of a and b. The dislocations are equally distributed on all 12 slip systems, i.e., on all 12 slip planes, only one dislocation is initially set, and the two additional dislocations are randomly distributed to a slip system. These dislocations are randomly positioned on the corresponding slip systems. Such an RVE thus includes 25 different microstructural phases, i.e., 12 phases enclosed by the dislocations, the 12 dislocations and the matrix phase.

3.3. Atomistic Parameterisation

A key aim of the present work has been to determine the parameters of the continuum model from atomistic simulation. One important parameter is the effective binding energy of H in the vicinity of a dislocation. Evaluating such a binding energy is challenging for a number of reasons. Firstly, the long-range strain field around an ideal straight-line dislocation leads to the requirement of large simulation cells to avoid elastic artifacts. Moreover, care must be taken to avoid interactions between the interstitial H and its periodic images in the direction of the dislocation line. A third issue is that a large number of possible configurations must be considered in order to obtain reliable sampling of the potential energy surfce for hydrogen around such a dislocation.
In order to solve these issues, we utilise the environmental tight-binding (ETB) approach [29,30], which enables the rapid evaluation of energies and forces for systems of arbitrary chemistry, within a quantum-mechanical framework. The current approach requires the full eigenvalue spectrum of a one-electron Hamiltonian matrix, thus solving the one-electron Schrödinger equation within a local atomic-orbital basis set. Due to the cubic scaling of the eigenvalue problem, the present implementation is limited to systems of the order of 10 3 atoms. The reliability of the approach for the Fe-H system has been demonstrated by examining the H segregation behaviour at a selection of grain boundaries in α -Fe [30].
The chosen dislocation is the a / 2 111 screw dislocation in α -Fe, the behaviour of which is highly relevant for plastic deformation of iron at low temperatures. In order to circumvent the problem of long-range strain fields around a dislocation, and to avoid electronic surface effects arising from the application of elastic boundary conditions, the well-known quadrupole construction [31] is used, which allows for the study of dislocations within a periodic cell. In this approach, sketched schematically in Figure 3, a periodic arrangement of dislocations of opposite Burgers vectors is made, such that the long-range strain field is eliminated. One must take care that the distance between dislocation pairs is sufficiently large so that their mutual interaction (which is of course long-ranged) does not overshadow the effect under scrutiny. In these simulations, a rectangular arrangement of periodic dislocations is chosen, which allows for the computationally convenient use of an orthorhombic unit cell in the simulations; we found that a cell of 672 atoms is necessary to avoid significant augmentation of the core structures of the dislocations.
Having obtained the relaxed dislocation configuration, the next stage is to assess the binding energy of hydrogen to this dislocation. In order to avoid interactions between H atoms and their periodic images, the simulation cell is extended by doubling the number of atomic planes along the direction of the Burgers vector, thus resulting in a H-free simulation cell of 1344 atoms. By numerical simulation, we find that the dislocation has an effective binding range of ∼5 Å from the centre of the core. Within this radius, 72 plausible interstitial sites for H are found (per Burgers vector), and the binding energy of each of these is evaluated (see Figure 4). The maximum value of the binding energy (with respect to a single H atom in a tetrahedral site in bulk α -Fe) is found to be 0.34 eV at the core of the dislocation. The median value of the binding energies is E ¯ bind = 0.14 eV, for a core radius r c = 5 Å. To account for the entropic contribution of the dislocations, E ¯ bind is shifted by k B T ln ( V d i s l o c a t i o n / V v o x e l ) in the scale bridging simulations.
While it would be possible to resolve the detailed picture presented in Figure 4 on a continuum level when we stick to small simulation volumina or low defect complexities, see the results reported [20,21], reaching process-relevant simulation boxes in the CPFEM approach requires further homogenziation. Therefore, to make a connection to the continuum picture, we choose the binding energies over a representative volume, such that the average H concentration within that volume corresponds to the expected density of occupied interstitial sites with respect to the bulk H chemical potential. The occupation of all interstitial sites within the dislocation line region will be one-half; this choice corresponds to selecting the median value of the binding energy distribution function. We note that, from the results obtained in terms of such comprisingly homogenised models, it is still possible to reconstruct the distinct site occupations, but this is restricted to fully relaxed states.
For the parametrisation of grain boundaries, we refer to the results published in [15] for α Fe. They show the dependence of the binding energy of hydrogen at an interstitial site on the spatial distance to the grain boundary. Precisely, we refer to the calculations for a Σ 3 [ 1 1 ¯ 0 ] ( 112 ) grain boundary. The resulting binding energy shows a pronounced attraction with binding energies from 150 to 330 meV in a distance of about 2 Angstroms, while in distances from 2 to 7 Angstroms from the grain boundary plane, the binding energy ranges from 10 to 40 meV.

4. Results and Discussion

Here, the results of our investigations are presented and it is discussed how they can be interpreted in the context of grain boundary hydrogen embrittlement. On the phenomenological side, our main interest is in the competition between dislocation and grain boundaries in the aggregation of hydrogen. On the methodological side, the main goal is a quantitative scale transfer from the quantum mechanical description of hydrogen at dislocations and grain boundaries to an elastoplastic deformation model on the macroscale that reflects hydrogen aggregation. Apparently, one of the core challenges in such approaches is the reduction of complexity of the model while still catching the essential effects. We reduce the complexity step by step, which allows us to consider in each stage of simplification the loss of accuracy we inevitably tolerate in the description.

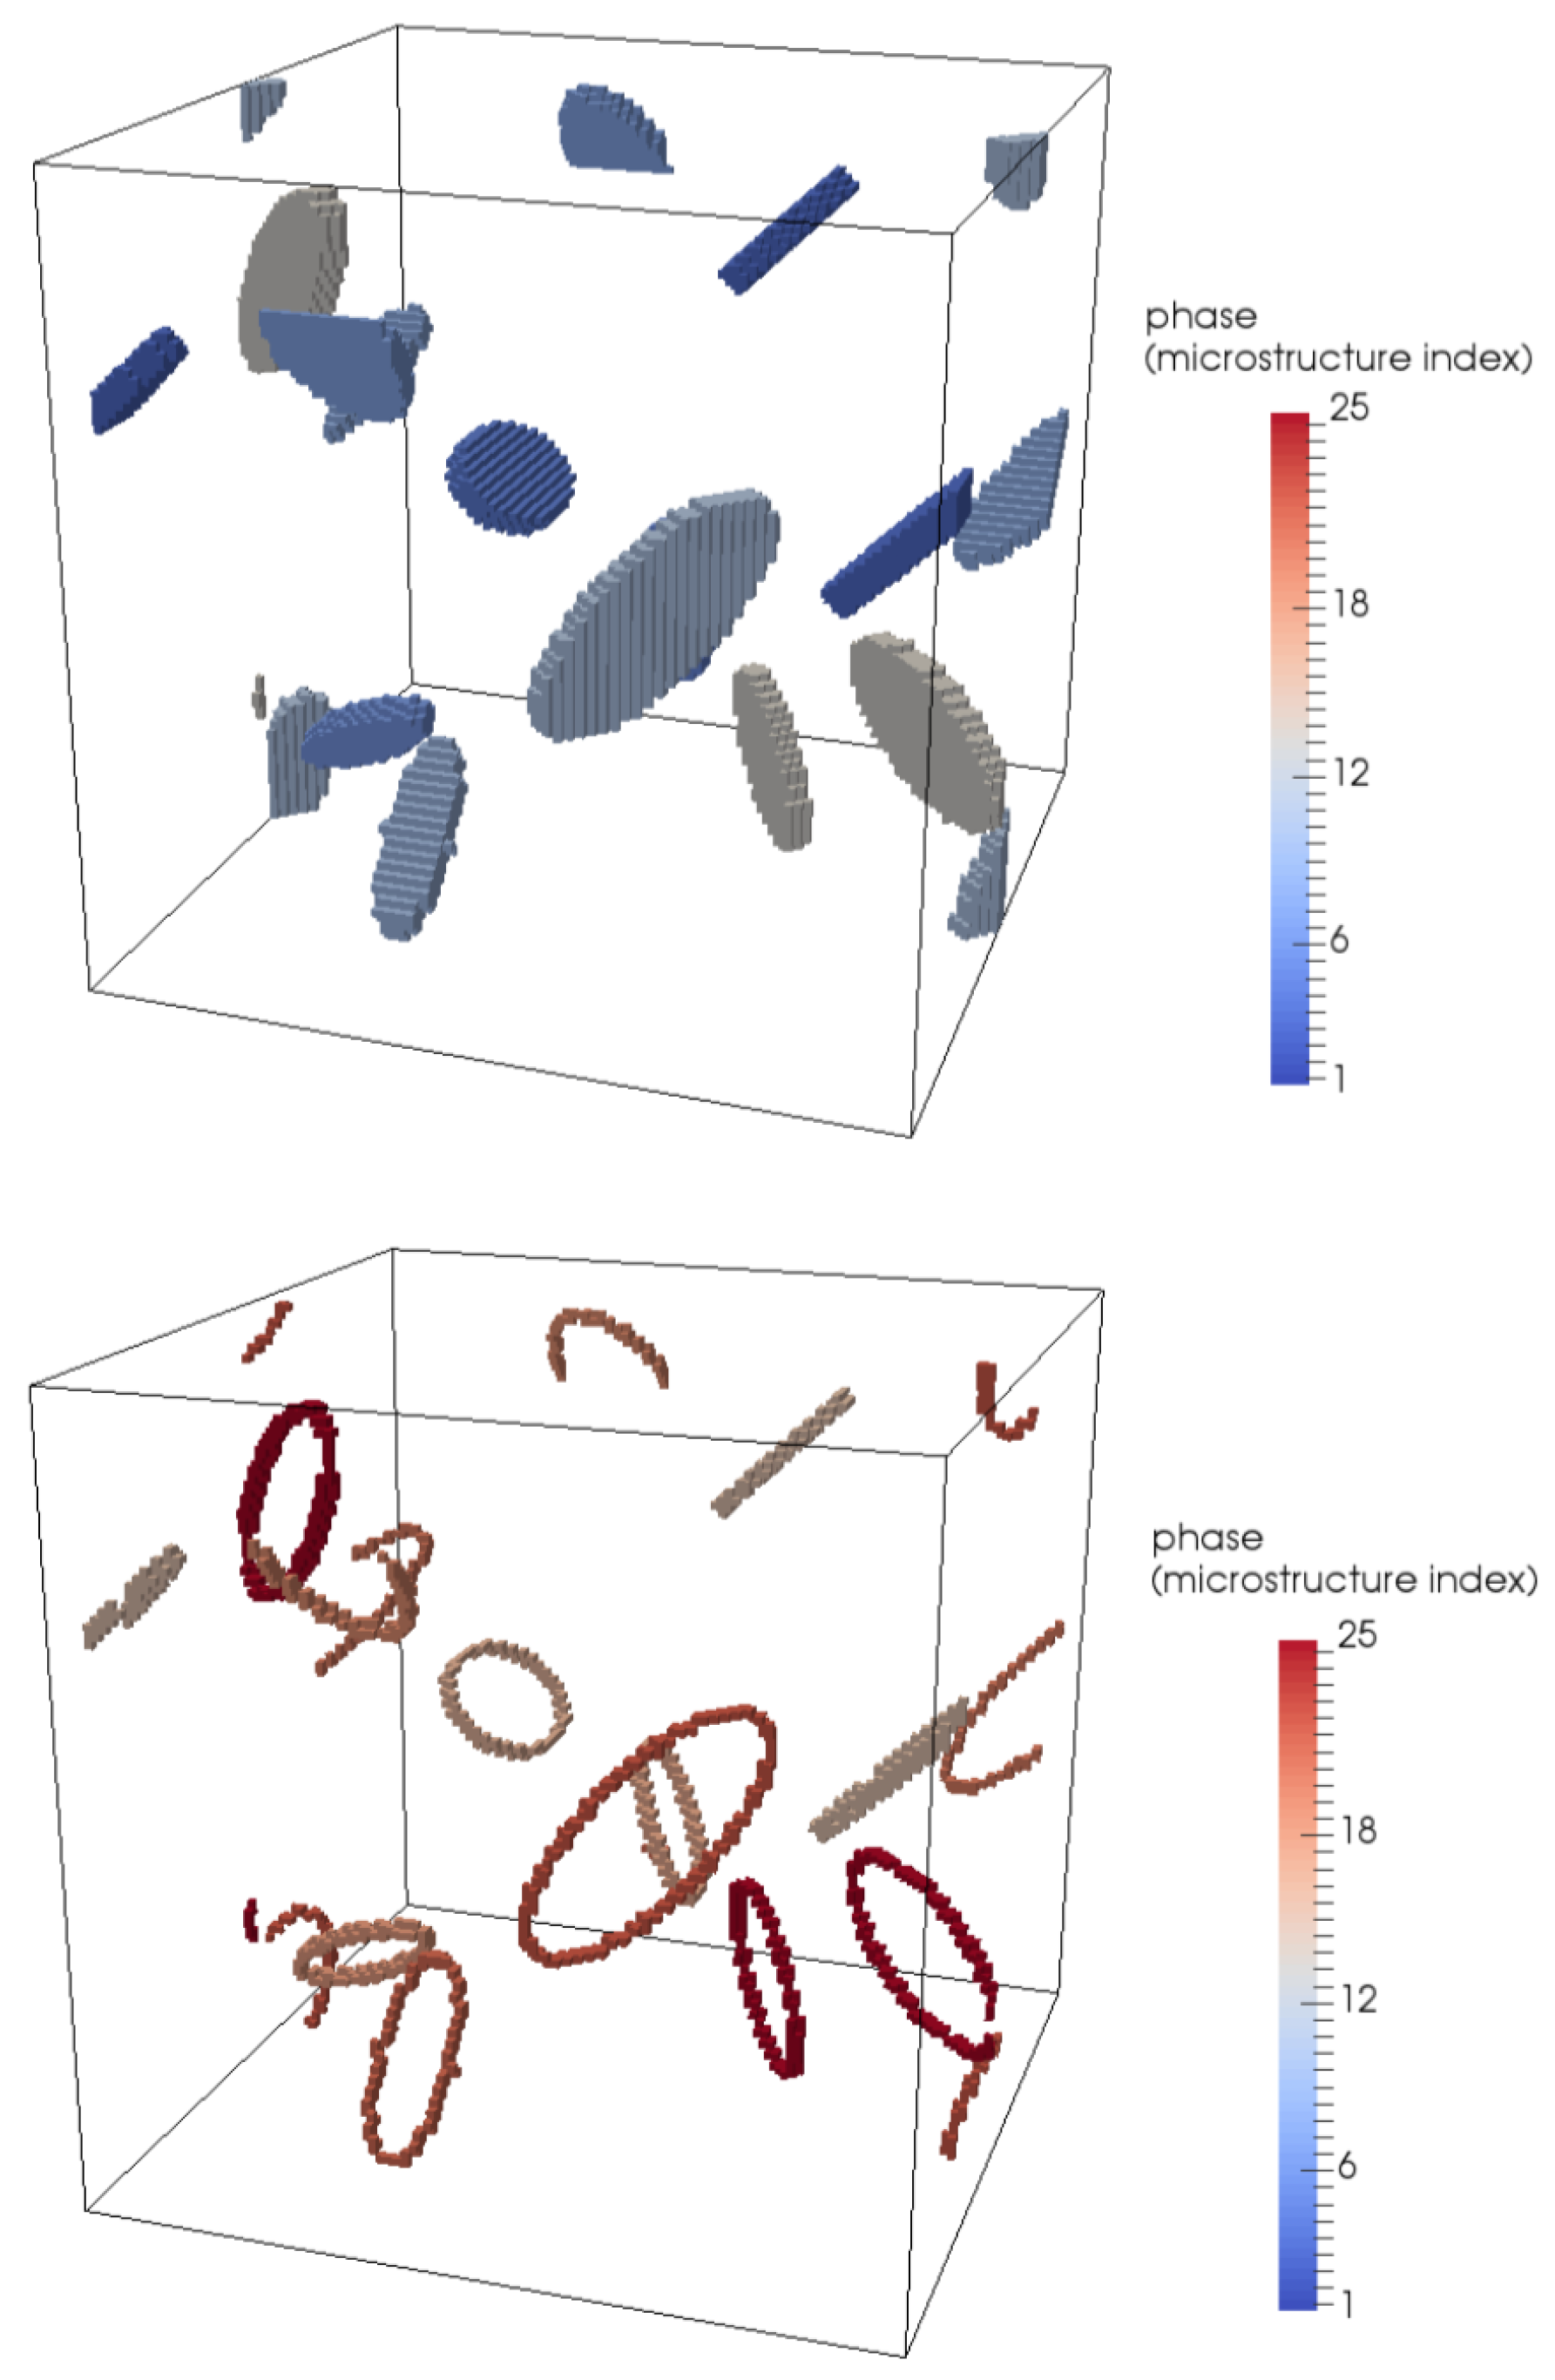
4.1. Modelling Hydrogen Aggregation Considering Dislocation Effects

We aim at the introduction of a composite model for the chemical potential and hydrogen concentration in the RVEs. This approach introduces an analytic approximation for the non-mechanical contributions to the hydrogen chemical potential, leading to a decrease of the computational expense of the simulations. Therefore, we begin with the comparison of the corresponding analytical approximations for the hydrogen distribution in volume elements with and without dislocations to results from analoguous simulations. These approximations are valid for a single volume element. The most basic approximation excludes also the influence of dislocations, leading to an average concentration profile
c ( μ , E ) = exp μ E k B T 1 + exp μ E k B T
with an average chemical potential μ = μ and formation energy E = E 0 for the bulk description. To include the dependence on the dislocation density in the model, the average concentration is split into bulk and dislocation contributions:
c = c bulk + ν dis c dis c bulk .
Here, ν dis is the volume fraction of the dislocation cores and ν bulk the volume fraction of the bulk, which are defined as ν dis = π r c 2 ρ and ν bulk = 1 ν dis , whereby r c describes the radius of the dislocation core and, therefore, π r c 2 describes the cross-sectional area of the dislocation line. The system is described in a stationary state c ˙ = 0 , and mechanical contributions are neglected. Equality of the chemical potentials then provides expression for the concentration for the bulk and the dislocations as c bulk = c ( μ , E 0 ) and c dis = c ( μ , E d i s ) where we can, based on the calculations in Section 3.3, set E dis = E ¯ bind .
When comparing the predictions based on the composite analytical model, Equation (15), to the full field simulation results in Figure 5, we see that just the inclusion of the averaged dislocation densities is a strict requirement for the accuracy of the approximation. While the performance of the analytical approximation is convincing when dislocations are included, the situation becomes much more complex as soon as we introduce grain boundaries in the system to simulate polycrystalline samples.

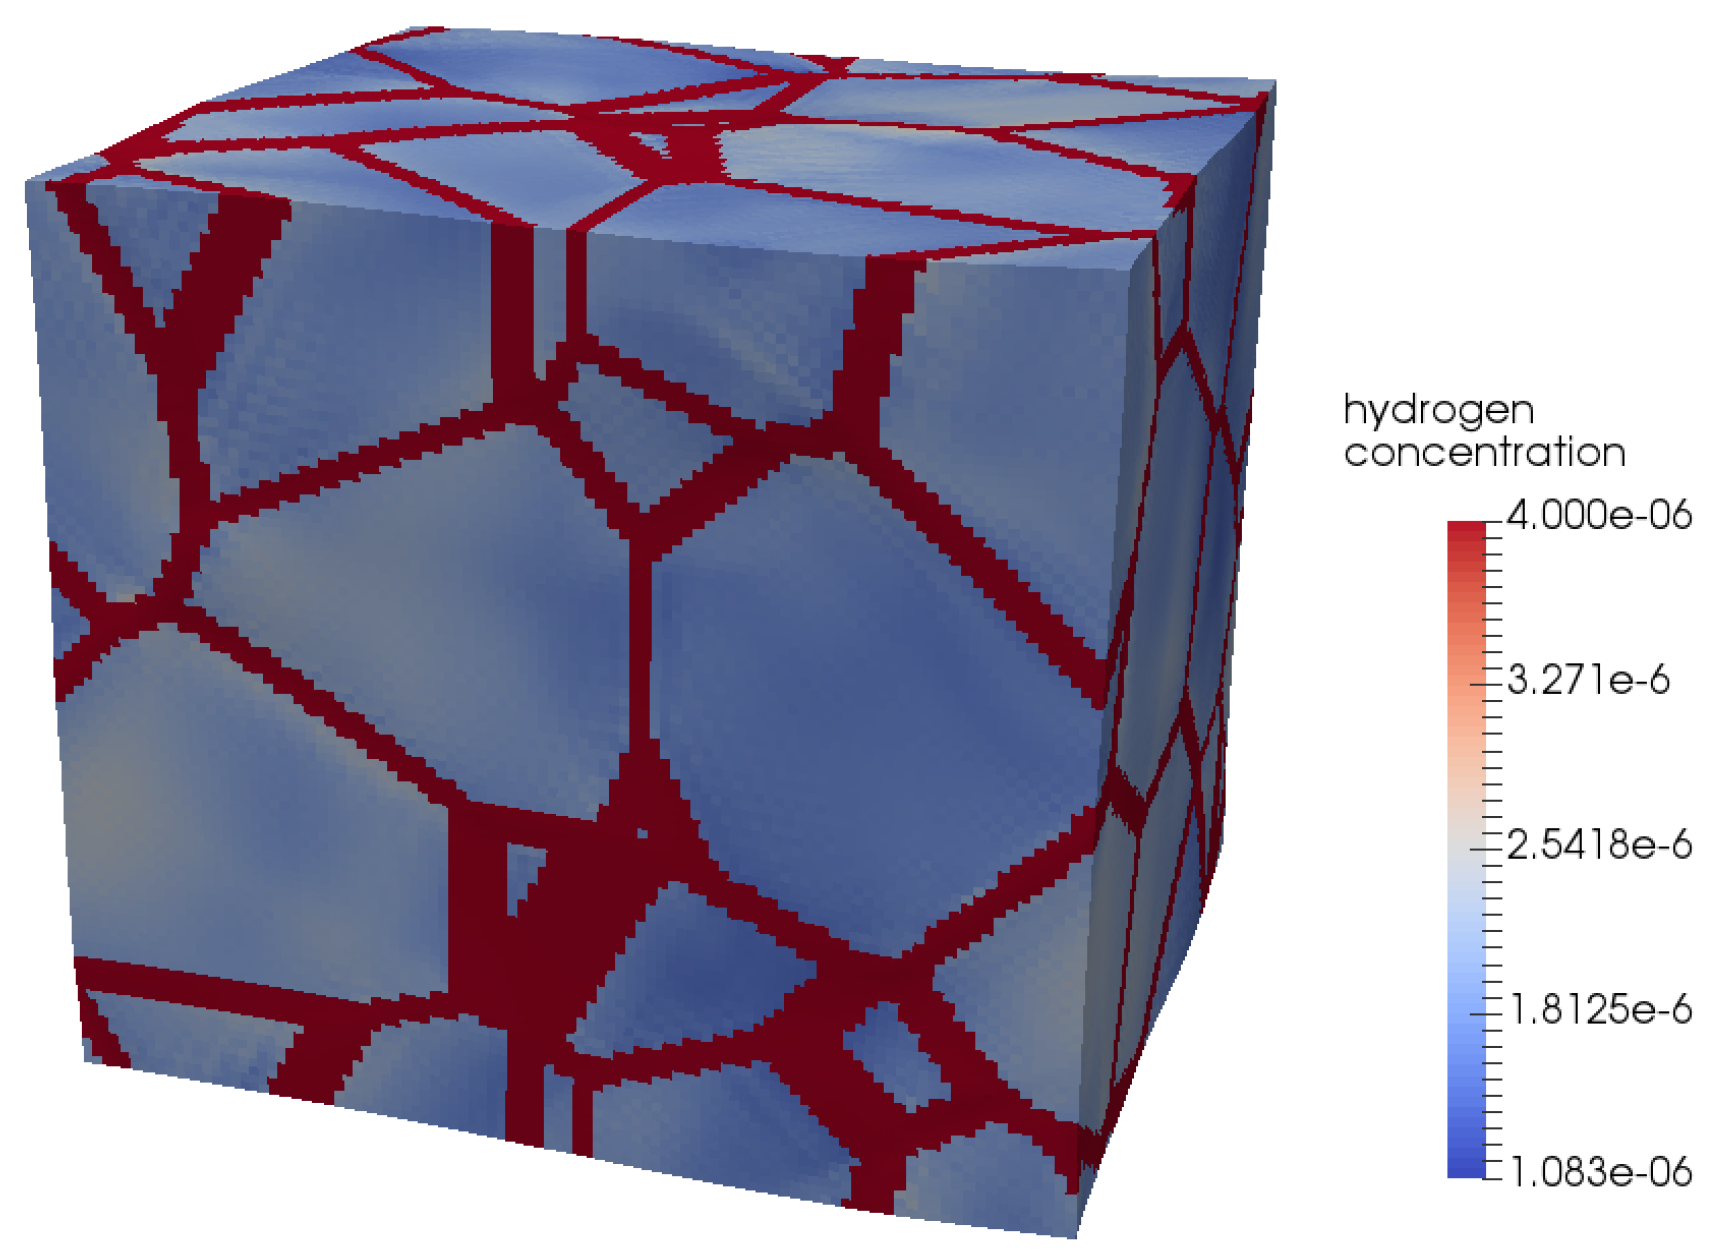
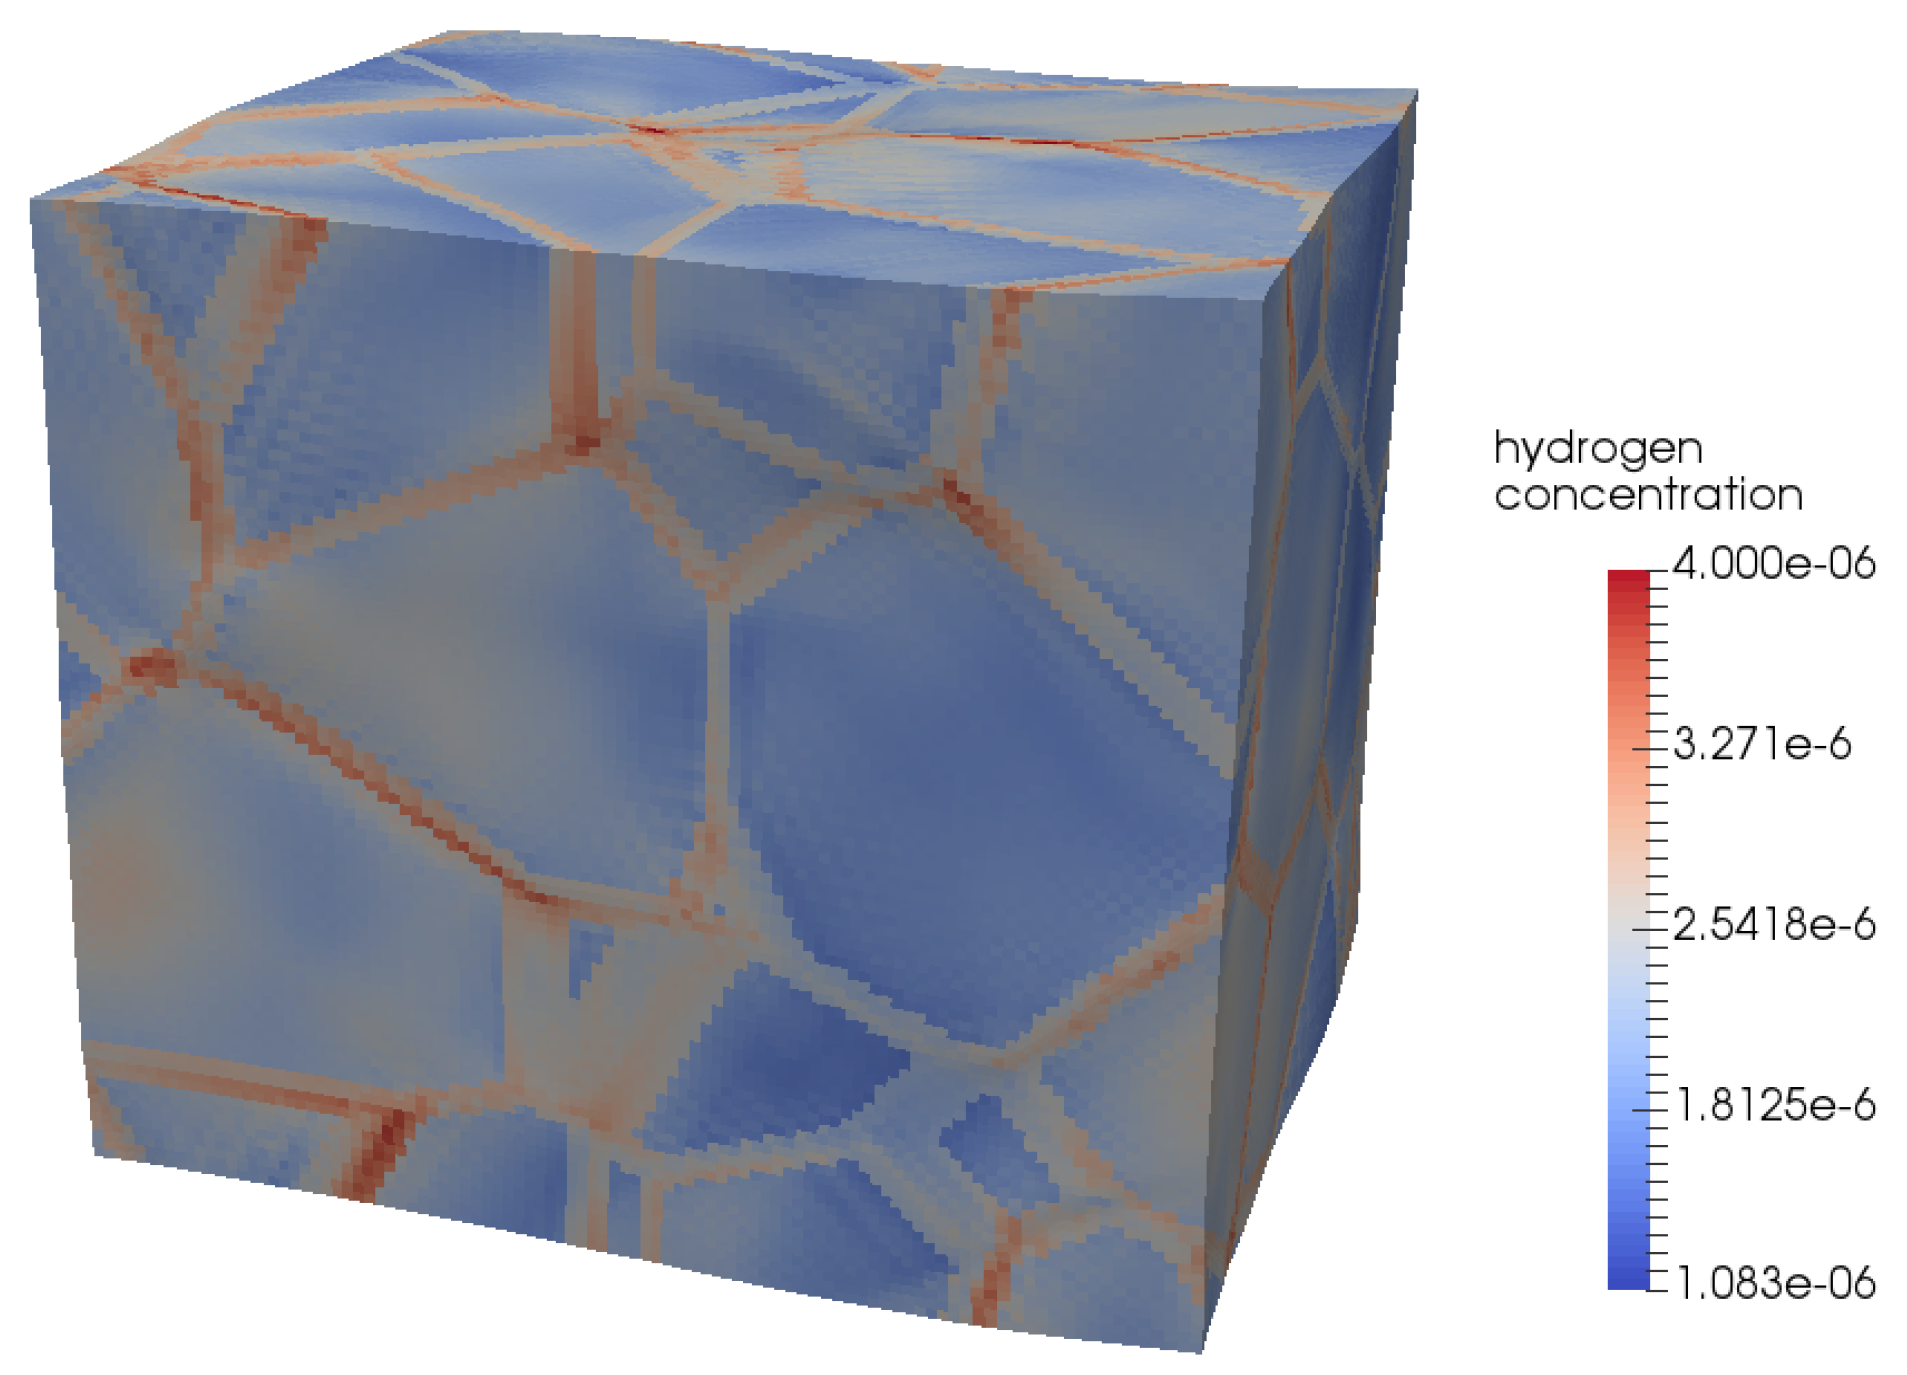
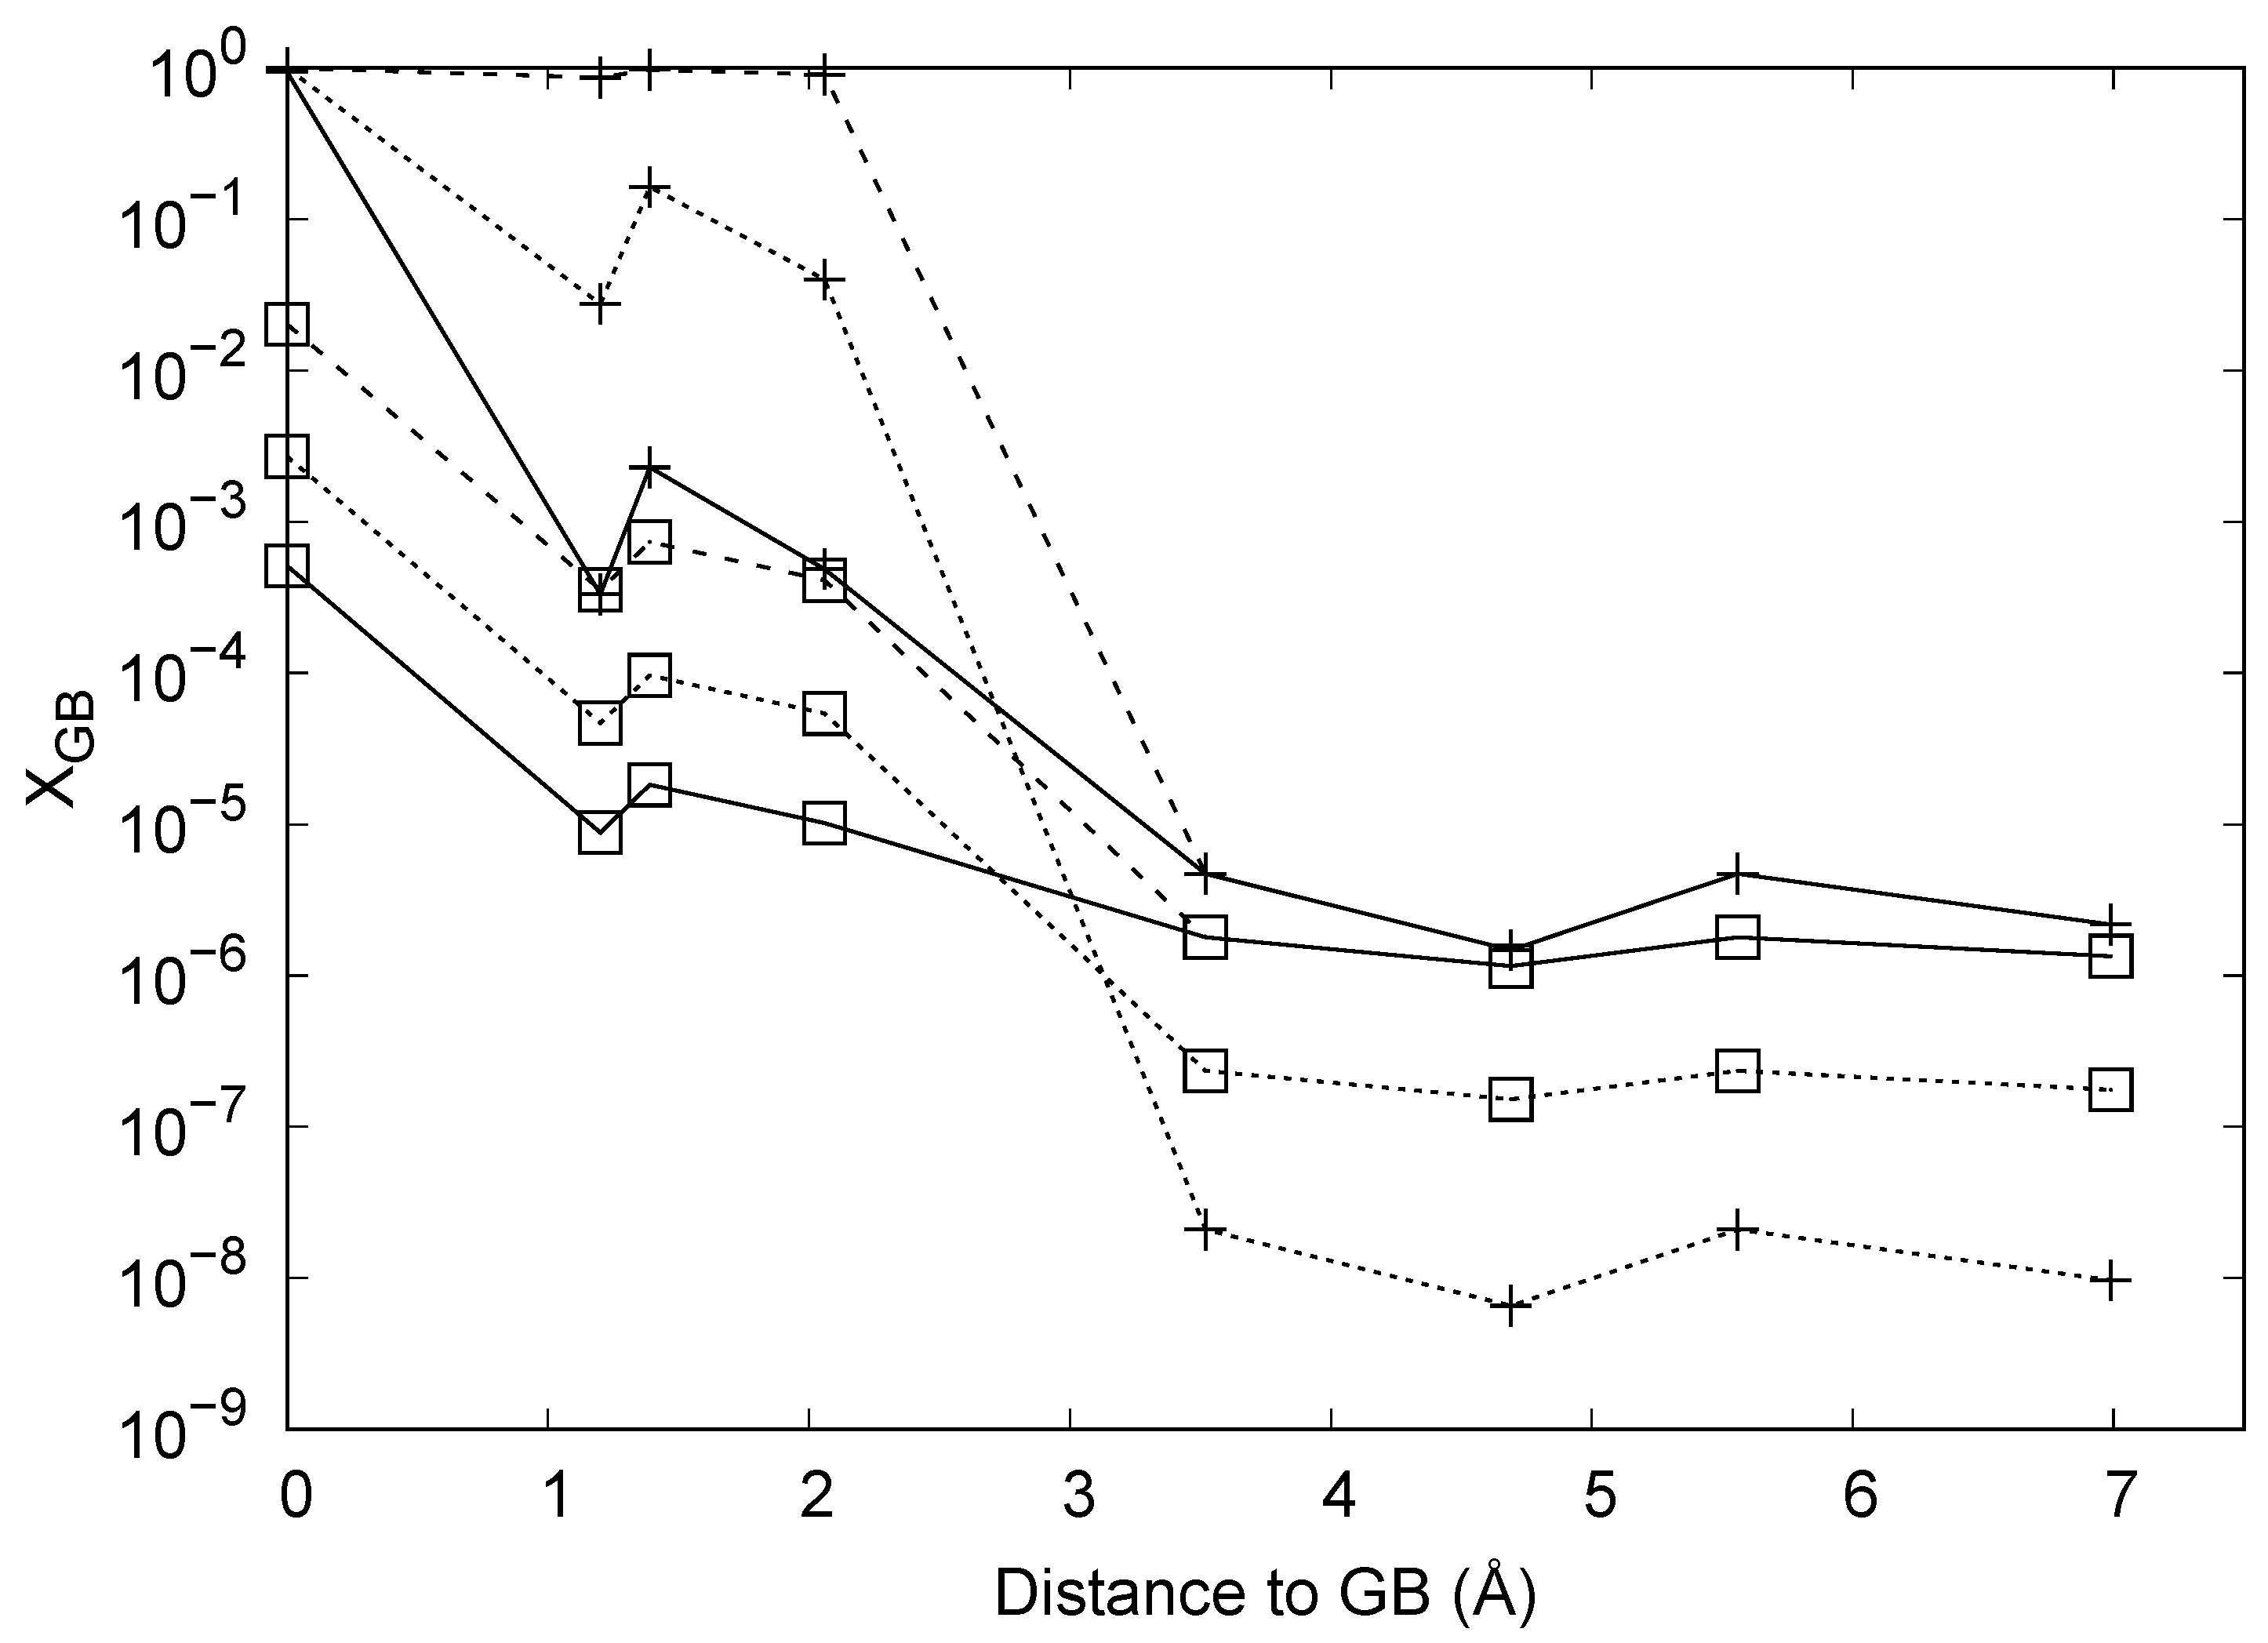
4.2. Modelling Hydrogen Aggregation Considering Dislocation and Grain Boundary Effects

We distinguish two contributions to the hydrogen aggregation at grain boundaries here: on the one side, the stress concentration at the grain boundaries when the system is subjected to mechanical load and, on the other hand, the binding energies and binding length scales to the grain boundaries when the system is free from external stresses. For the latter, we introduce a voxel averaging scheme that allows us to include results from the ab initio calculations that are reported in [15] (see Figure 6).
Here, L voxel is the length of the voxel and l GB the range of attractive sites associated with the grain boundary. Then, the volume fraction of the grain boundary is defined as
ν GB = l GB L voxel .
The average hydrogen concentration in this voxel can then be expressed as
c = c ( μ , E 0 ) bulk + ν dis c dis ( μ , E bind ) ( c bulk ( μ , E 0 ) + ν GB c GB c bulk ( μ , E 0 ) .
Via the ab initio results from [15], the concentration becomes dependent on the distance to the grain boundary as E GB = E GB ( r ) when r is the distance from the grain boundary, thus
c G B = 1 l G B 0 l G B c G B ( r ) d r .
However, the grain boundary fraction we introduce via this scheme is then fixed for a given voxel length, which leads to undesirable effects. When the voxel length is set to L v o x e l = 1 μ m, we obtain a hydrogen concentration profile as shown in Figure 7, corresponding to an estimated grain boundary fraction of ∼10 3 . This scenario shows basically no remaining hydrogen segregation at the dislocations in the grains. To reduce the grain boundary fraction to values that show less dominant hydrogen aggregation at the grain boundaries, a voxel length of about 100 micrometres has to be chosen (see the simulation result obtained for that case in Figure 8). However, in that case, the numerical parametrisation implies a solution of the elastoplastic equations on an undesirably large spatial scale.
At this point, we have to recognise that defining a representative grain boundary binding energy, which can be used to obtain a composite model, i.e., analytical description, is a rather ineffective approach in comparison to the composite model for the dislocations. The spatial distribution of dislocations can be assumed to suffice the requirements to be fulfilled for a representative volume element definition, but the distribution of grain boundaries is subject to complex geometric constraints. Furthermore, the characteristic length scale of the grain boundary distribution is typically several orders of magnitude larger than the characteristic length scale of the dislocation distribution. This comparably small density requires larger representative volumes for the composite model, which would introduce further inaccuracies to the model.
To reflect the simulation results, we relate them to classical McLean [32] segregation profiles based on the same ab initio data sets. This includes estimates for the hydrogen segregation from dislocations to grain boundaries and the effect of hydrogen enrichment at the grain boundaries on segregation to further increased concentration levels.
We estimate the influence of a locally hydrogen enriched grain boundary region on the segregation behaviour of additional hydrogen to those remaining attractive sites at the grain boundary. For this sake, we assume that the work of volume expansion due to the hydrogen is the dominant contribution to the solution energies. Furthermore, we assume that the change in the work of volume expansion under hydrogen solution with increasing hydrogen content is dominated by the change of the bulk modulus of the region at the grain boundary.
Therefore, we consider the following two limiting cases. First, when no other hydrogen atoms are present at the GB, the resulting segregation profile in a simple McLean picture is just based on the energies reported in [15]. In the second limiting case, we assume that half of all locally available, attractive sites, i.e., with a formation enthalpy 0.25 eV, are populated. For the Σ 3 [ 1 1 ¯ 0 ] ( 112 ) bcc grain boundary, this corresponds to a minimum of three hydrogen atoms per volume V 10 28 m 3 , which is in the order of 10% at hydrogen at the grain boundary. To estimate the difference in the segregation energy, assume Δ E e l = ν Δ B 0 is assumed, with bulk modulus contrast Δ B 0 and partial molar volume of hydrogen ν . The exact elastic grain boundary data we need is not available, but the change of the bulk modulus due to the hydrogen aggregation at the grain boundary is estimated based on the bulk results reported in [33]. The resulting change Δ B 0 is approximated as 15 GPa. For the partial molar volume of hydrogen, we refer to the comprising studies summarized in [34], which suggest a constant value of 1.7 × 10 6 m 3 /mol of atomic hydrogen (half of a H 2 molecule) over wide temperature and pressure ranges. The shift for the segregation energy then amounts to Δ E e l 15 × 1.7 × 10 3 / N A eV/J, i.e., Δ E e l 255 meV.
This value certainly represents a grain boundary that is very densely populated by hydrogen. As the most attractive sites are restricted to a distance of 1–2 Angstroms away from the grain boundary, we assume that the elastic shift of the segregation energies only affects those sites that lie in this area. For the Σ 3 grain boundary investigated in [15], this corresponds to the four sites within approx. 2 Angstroms distance.
The resulting segregation profiles are shown in Figure 9, and the effect of the local elastic softening on the segregation profile is partially compensated when also dislocations as hydrogen traps are taken into account. While the detailed data presented in Figure 4 shows a maximal attraction of 0.34 eV in the area close to the dislocation core, we use here the averaged dislocation binding energy of 0.14 eV, corrected by an entropic contribution about k B T ln ( V d i s l o c a t i o n / V v o x e l ) . This is consistent as it reproduces an occupation of the dislocation-associated sites, which is reasonable for hydrogen enriched regions, and we make a similar assumption for the estimate of the occupation shift due to the hydrogen induced elastic softening. For an interpretation in the context of macroscopic metallurgical processes, a more detailed description of the ambient hydrogen chemical potential is required. Apart from the surface properties of the samples, especially surface roughness and surface porosity, the humidity of the atmosphere is also essential. When the samples are subjected to large thermal gradients due to heat treatment, the distribution of hydrogen at grain boundaries and dislocations close to the surface will change depending on the distance to the surface.
This resulting effect of hydrogen binding to dislocations and hydrogen enrichment due to reduced mechanical resistance to hydrogen aggregation is a high local hydrogen density at the grain boundary. Though these results are based on estimates for the bulk modulus contrast and an effective dislocation binding energy, which result from a site occupation median, they exhibit the weakness of ferritic grain boundaries to hydrogen accumulation. For increasingly high levels of hydrogen aggregation to the grain boundary, as they are required for hydrogen embrittlement, a kinetic transport of hydrogen is required in addition to thermodynamically driven transport. As recently pointed out in [35], hydrogen shielded slip transfer to grain boundaries might offer not only a source for grain boundary stress concentration, but also this non-thermodynamical hydrogen transport process.
At this point, it is worth discussing the effect of the presence of hydrogen atoms along the grain boundaries on the plastic behavior on the polycrystalline metals. Recent simulations [35] show that hydrogen atoms have multiple effects of the dislocation–GB interactions. First of all, the segregated hydrogen atoms can develop stress field around the grain boundaries. These stress fields which stem from the misfit volumetric strain of the H atoms can attract/repel the dislocations. Thus, the average slip along the GBs can change [35]. This change promotes the accumulation of slip in local regions along the boundary that can lead to the formation of nano-cracks and voids.
Moreover, the presence of H atoms can not only significantly increase the critical shear stress needed for resolving the lattice dislocation in the grain boundaries, but it can also change the nature of the GB–dislocation interaction. The presence of H atoms can block the dissociation of the lattice dislocations into GB-dislocation. Thus, the slip either remains along the grain boundary or is transited to the adjacent grain at significantly higher stresses. This leads to the formation of more populated pile-ups and eventually leads to intergranular fracture of the grain boundary surfaces. The dislocations that are present in the pile ups can attract hydrogen atoms and deliver it to the grain boundary. As shown in previous studies in nickel, these extra hydrogen atoms can reduce the fracture energy significantly [36] and make brittle fracture favourable. This intergranular fracture cannot be achieved by considering only the equilibrium segregation hydrogen atoms along the boundary [37]. However, clarification of the kinetic aspects of this process needs further investigation.

5. Conclusions

Within our attempt to find efficient and predictive models for hydrogen segregation based on ab initio data, we present an analytic composite model for dislocation RVEs. Due to the comparably homogeneous distribution of dislocations, the length scales of defect separation and defect extent are unproblematic for the representative volume approach for dislocations and we can introduce an effective binding energy that leads to good agreement in the efficient composite model and full field simulations. When extended to also include grain boundaries in an RVE spirit, also based on ab initio determined binding energies, we recognise a conceptual difficulty of the analytical model. This challenge originates from the strong seperation of the length scales describing defect extent and defect distribution in the case of grain boundaries. A thorough approach to this problem would first demand a comprising analysis of the limitations of scale transfers between the description of grain boundaries on the ab initio scale and within the crystal plasticity picture, which models grain boundaries indirectly. Therefore, one of the key challenges is the vast combinatorical complexity of compositional and structural degrees of freedom in grain boundaries. On the one hand, the computational expense of state-of-the-art grain boundary calculations, which still exhibit substantial discrepancies to experimental measurements, is enormous. On the other hand, there are few approximative schemes available to interpolate or extrapolate data sets to differing grain boundaries, even if such data sets are available. Consequently, any comparability to experiments is limited to well defined model systems at the moment.
Apart from this methodological challenge, the simulations and theoretical considerations predict a strong hydrogen segregation in atomic distance from grain boundaries well in competition with dislocation based aggregation when local hydrogen occupation is elevated at the grain boundary. This competition between hydrogen segregation at dislocation and grain boundaries is also observed in the experimental measurements. In the low hydrogen concentration condition, the cleavage fracture indicates weak interaction between diffusive hydrogen and grain boundary, whereas the interaction becomes intensified with a higher amount of hydrogen. Therefore, there is still a challenge to quantitatively define the critical hydrogen contents leading to grain boundary decohesion for different material groups.

Author Contributions

All authors of the manuscript have contributed to the investigations that produced the presented results and the writing of the manuscript.

Acknowledgments

This work has been supported by the Collaborative Research Center 761 “Stahl ab initio” of the German Research Foundation. The authors gratefully acknowledge the computing time on the supercomputer JURECA at Forschungszentrum Jülich.

Conflicts of Interest

The authors declare no conflict of interest.

References

  1. Petch, N.J. The lowering of fracture-stress due to surface adsorption. Philos. Mag. 1956, 1, 331–337. [Google Scholar] [CrossRef]
  2. Birnbaum, H.K.; Sofronis, P. Hydrogen-enhanced localized plasticity—A mechanism for hydrogen-related fracture. Mater. Sci. Eng. A 1994, 176, 191–202. [Google Scholar] [CrossRef]
  3. Kirchheim, R. Reducing grain boundary, dislocation line and vacancy formation energies by solute segregation. I. Theoretical background. Acta Mater. 2007, 55, 5129–5138. [Google Scholar] [CrossRef]
  4. Kirchheim, R. Reducing grain boundary, dislocation line and vacancy formation energies by solute segregation: II. Experimental evidence and consequences. Acta Mater. 2007, 55, 5139–5148. [Google Scholar] [CrossRef]
  5. Lynch, S. Environmentally assisted cracking: Overview of evidence for an adsorption-induced localised-slip process. Acta Metall. 1988, 36, 2639–2661. [Google Scholar] [CrossRef]
  6. Nagumo, M. Hydrogen related failure of steels—A new aspect. Mater. Sci. Technol. 2004, 20, 940–950. [Google Scholar] [CrossRef]
  7. Takai, K.; Shoda, H.; Suzuki, H.; Nagumo, M. Lattice defects dominating hydrogen-related failure of metals. Acta Mater. 2008, 56, 5158–5167. [Google Scholar] [CrossRef]
  8. Crabtree, G.W.; Dresselhaus, M.S.; Buchanan, M.V. The hydrogen economy. Phys. Today 2004, 57, 39–44. [Google Scholar] [CrossRef] [Green Version]
  9. Turner, J.A. Sustainable hydrogen production. Science 2004, 305, 972–974. [Google Scholar] [CrossRef] [PubMed]
  10. Figueroa, D.; Robinson, M. The effects of sacrificial coatings on hydrogen embrittlement and re-embrittlement of ultra high strength steels. Corros. Sci. 2008, 50, 1066–1079. [Google Scholar] [CrossRef]
  11. Rhodes, P. Environment-assisted cracking of corrosion-resistant alloys in oil and gas production environments: A review. Corrosion 2001, 57, 923–966. [Google Scholar] [CrossRef]
  12. Barrera, O.; Bombac, D.; Chen, Y.; Daff, T.; Galindo-Nava, E.; Gong, P.; Haley, D.; Horton, R.; Katzarov, I.; Kermode, J.; et al. Understanding and mitigating hydrogen embrittlement of steels: A review of experimental, modelling and design progress from atomistic to continuum. J. Mater. Sci. 2018, 53, 6251–6290. [Google Scholar] [CrossRef]
  13. Jemblie, L.; Olden, V.; Akselsen, O.M. A review of cohesive zone modelling as an approach for numerically assessing hydrogen embrittlement of steel structures. Philos. Trans. R. Soc. A 2017, 375, 20160411. [Google Scholar] [CrossRef] [PubMed] [Green Version]
  14. Koyama, M.; Akiyama, E.; Lee, Y.K.; Raabe, D.; Tsuzaki, K. Overview of hydrogen embrittlement in high-Mn steels. Int. J. Hydrogen Energy 2017, 42, 12706–12723. [Google Scholar] [CrossRef]
  15. Du, Y.A.; Ismer, L.; Rogal, J.; Hickel, T.; Neugebauer, J.; Drautz, R. First-principles study on the interaction of H interstitials with grain boundaries in α- and γ-Fe. Phys. Rev. B 2011, 84, 144121. [Google Scholar] [CrossRef]
  16. Troiano, A.R. The role of hydrogen and other interstitials in the mechanical behavior of metals. Trans. ASM 1960, 52, 54–80. [Google Scholar] [CrossRef]
  17. Oriani, R. A mechanistic theory of hydrogen embrittlement of steels. Ber. Bunsengesellsch. Phys. Chem. 1972, 76, 848–857. [Google Scholar]
  18. Oriani, R.; Josephic, P. Equilibrium aspects of hydrogen-induced cracking of steels. Acta Metall. 1974, 22, 1065–1074. [Google Scholar] [CrossRef]
  19. Baechem, C. A New Model for Hydrogen-Assisted Cracking. Met. Trans. 1972, 3, 437–451. [Google Scholar]
  20. Von Pezold, J.; Lymperakis, L.; Neugebeauer, J. Hydrogen-enhanced local plasticity at dilute bulk H concentrations: The role of H–H interactions and the formation of local hydrides. Acta Mater. 2011, 59, 2969–2980. [Google Scholar] [CrossRef]
  21. Leyson, G.; Grabowski, B.; Neugebauer, J. Multiscale description of dislocation induced nano-hydrides. Acta Mater. 2015, 89, 50–59. [Google Scholar] [CrossRef]
  22. Roters, F.; Eisenlohr, P.; Kords, C.; Tjahjanto, D.; Diehl, M.; Raabe, D. DAMASK: The Duesseldorf Advanced Material Simulation Kit for studying crystal plasticity using an FE based or a spectral numerical solver. Procedia IUTAM 2012, 3, 3–10. [Google Scholar] [CrossRef]
  23. Hirth, J. Effects of hydrogen on the properties of iron and steel. Metall. Trans. A 1980, 11, 861–890. [Google Scholar] [CrossRef]
  24. Shanthraj, P.; Sharma, L.; Svendsen, B.; Roters, F.; Raabe, D. A phase field model for damage in elasto-viscoplastic materials. Comput. Methods Appl. Mech. Eng. 2016, 312, 167–185. [Google Scholar] [CrossRef]
  25. Nemat-Nasser, S.; Hori, M. Micromechanics: Overall Properties of Heterogenous Materials; Elsevier North-Holland: Amsterdam, The Netherlands, 1999. [Google Scholar]
  26. Peirce, D.; Asaro, R.; Needleman, A. Material rate dependence and localized deformation in crystalline solids. Acta Metall. 1983, 31, 1951–1976. [Google Scholar] [CrossRef]
  27. Roters, F.; Eisenlohr, P.; Hantcherli, L.; Tjahjanto, D.; Bieler, T.; Raabe, D. Overview of constitutive laws, kinematics, homogenization and multiscale methods in crystal plasticity finite-element modeling: Theory, experiments, applications. Acta Mater. 2010, 58, 1152–1211. [Google Scholar] [CrossRef]
  28. Cahn, J.W.; Hilliard, J.E. Free energy of a nonuniform system. I. Interfacial free energy. J. Chem. Phys. 1958, 28, 258–267. [Google Scholar] [CrossRef]
  29. McEniry, E.J.; Drautz, R.; Madsen, G. Environmental tight-binding modeling of nickel and cobalt clusters. J. Phys. Condens. Matter 2013, 25, 115502. [Google Scholar] [CrossRef] [PubMed]
  30. McEniry, E.J.; Hickel, T.; Neugebauer, J. Hydrogen behaviour at twist {110} grain boundaries in α-Fe. Philos. Trans. A 2017, 375, 20160402. [Google Scholar] [CrossRef] [PubMed]
  31. Clouet, E.; Ventelon, L.; Willaime, F. Dislocation core field. II. Screw dislocation in iron. Phys. Rev. B 2011, 84, 224107. [Google Scholar] [CrossRef]
  32. Lejcek, P. Grain Boundary Segregation in Metals; Springer: Berlin, Germany, 2010. [Google Scholar]
  33. Psiachos, D.; Hammerschmidt, T.; Drautz, R. Ab initio study of the modification of elastic properties of alpha-iron by hydrostatic strain and by hydrogen interstitials. Acta Mater. 2011, 59, 4255–4263. [Google Scholar] [CrossRef]
  34. Peisl, H. Topics in Applied Physics: Hydrogen in Metals I; Springer: Berlin, Germany, 1978. [Google Scholar]
  35. Tehranchi, A. Atomistic Mechanisms of Hydrogen Embrittlement; EPFL: Lausanne, Switzerland, 2017; p. 165. [Google Scholar]
  36. Tehranchi, A.; Curtin, W. Atomistic study of hydrogen embrittlement of grain boundaries in nickel: II. Decohesion. Model. Simul. Mater. Sci. Eng. 2017, 25, 075013. [Google Scholar] [CrossRef] [Green Version]
  37. Tehranchi, A.; Curtin, W. Atomistic study of hydrogen embrittlement of grain boundaries in nickel: I. Fracture. J. Mech. Phys. Solids 2017, 101, 150–165. [Google Scholar] [CrossRef] [Green Version]
Figure 1. Hydrogen induced cracking in a cold rolled X20Cr13 martensitic stainless steel. (a) the evolution of hydrogen contents according to the hydrogen charging time and the fracture strength according to the hydrogen charging time determined by a slow strain rate test at the strain rate of 10 6 s 1 ; (b) fracture surfaces from the failed slow strain rate specimens with different amounts of pre-charged hydrogen.
Metals 08 00430 g001
Figure 2. Here, the inner of a dislocation and the dislocation line are shown separately. top: the microstructure index 2–13 refers to the inner of dislocations, bottom: the microstructure index 14–25 refers to dislocation loops. Microstructure index 1 refers to the matrix and is not shown.
Metals 08 00430 g002
Figure 3. Schematic images of the quadrupole dislocation construction used in the simulation. The blue arrows indicate the helicity of the dislocations, with “up” and “down” arrows corresponding to screw dislocations of Burgers vectors b = a / 2 111 and b , respectively. The red circles indicate the effective binding range.
Metals 08 00430 g003
Figure 4. Each vertical line corresponds to one data point (due to symmetry, some points overlap). The colors correspond to the distances from the dislocation core, measured by the radius R. The red circles correspond to the 24 points closest to the dislocation core (R < 2.87 Å), the green squares are in the “intermediate range” (2.87 Å < R < 4.04 Å), with the blue points belong are the outermost 24 points. The density of states (DOS) curve is generated by broadening the delta functions by a Lorentzian function of width k B T/2 (T = 300 K), with the integral under the DOS curve being normalised to 1.
Metals 08 00430 g004
Figure 5. Comparison of the numerical solution (blue) with the old analytical solution (red), which includes no dislocation density and the new analytical solution (green) for different dislocation densities. Including the dislocation density substantially improves the accuracy of the analytically approximation.
Metals 08 00430 g005aMetals 08 00430 g005b
Figure 6. Illustration of grain boundary and dislocation volume voxel averaging.
Metals 08 00430 g006
Figure 7. Simulation of a polycrystal containing dislocations with a binding energy to grain boundaries and a voxel size of L v o x e l = 1 μ m.
Metals 08 00430 g007
Figure 8. Simulation of a polycrystal containing dislocations with a binding energy to grain boundaries and a voxel size of L v o x e l = 100 μ m.
Metals 08 00430 g008
Figure 9. Segregation profiles for the sites in the vicinity of the grain boundary. The curves with cross symbols correspond to a temperature of 300 K, the curves with box symbols correspond to a temperature of 800 K. For both temperatures, the solid lines correspond to the segregation from a bcc bulk site with formation enthalpy Δ E = 0.25 eV to the sites with energies and spatial distance to the grain boundary plane as reported in [15]. The dashed curves assume that the segregating hydrogen atom moves into a hydrogen enriched region which is limited to those sites within 2 Angstroms distance to the grain boundary plane. The hydrogen enriched zone has a reduced bulk modulus, and the resulting shift is about 255 meV. The dotted lines correspond to data that takes account that high local plasticity densities act as effective traps and that the hydrogen has to overcome the binding energy of about 140 meV. We note that the hydrogen is absorbed into the dislocations both for 300 K and 800 K from those sites that are more than 2 Angstroms away, expressed by positive segregation energies. This leads to a weak depopulation of this region at 800 K and a pronounced depopulation at 300 K.
Metals 08 00430 g009

