Numerical Investigation and Experimental Validation of Motion and Distribution of Nonmetallic Inclusions in Argon Protection Electroslag Remelting Process


Abstract
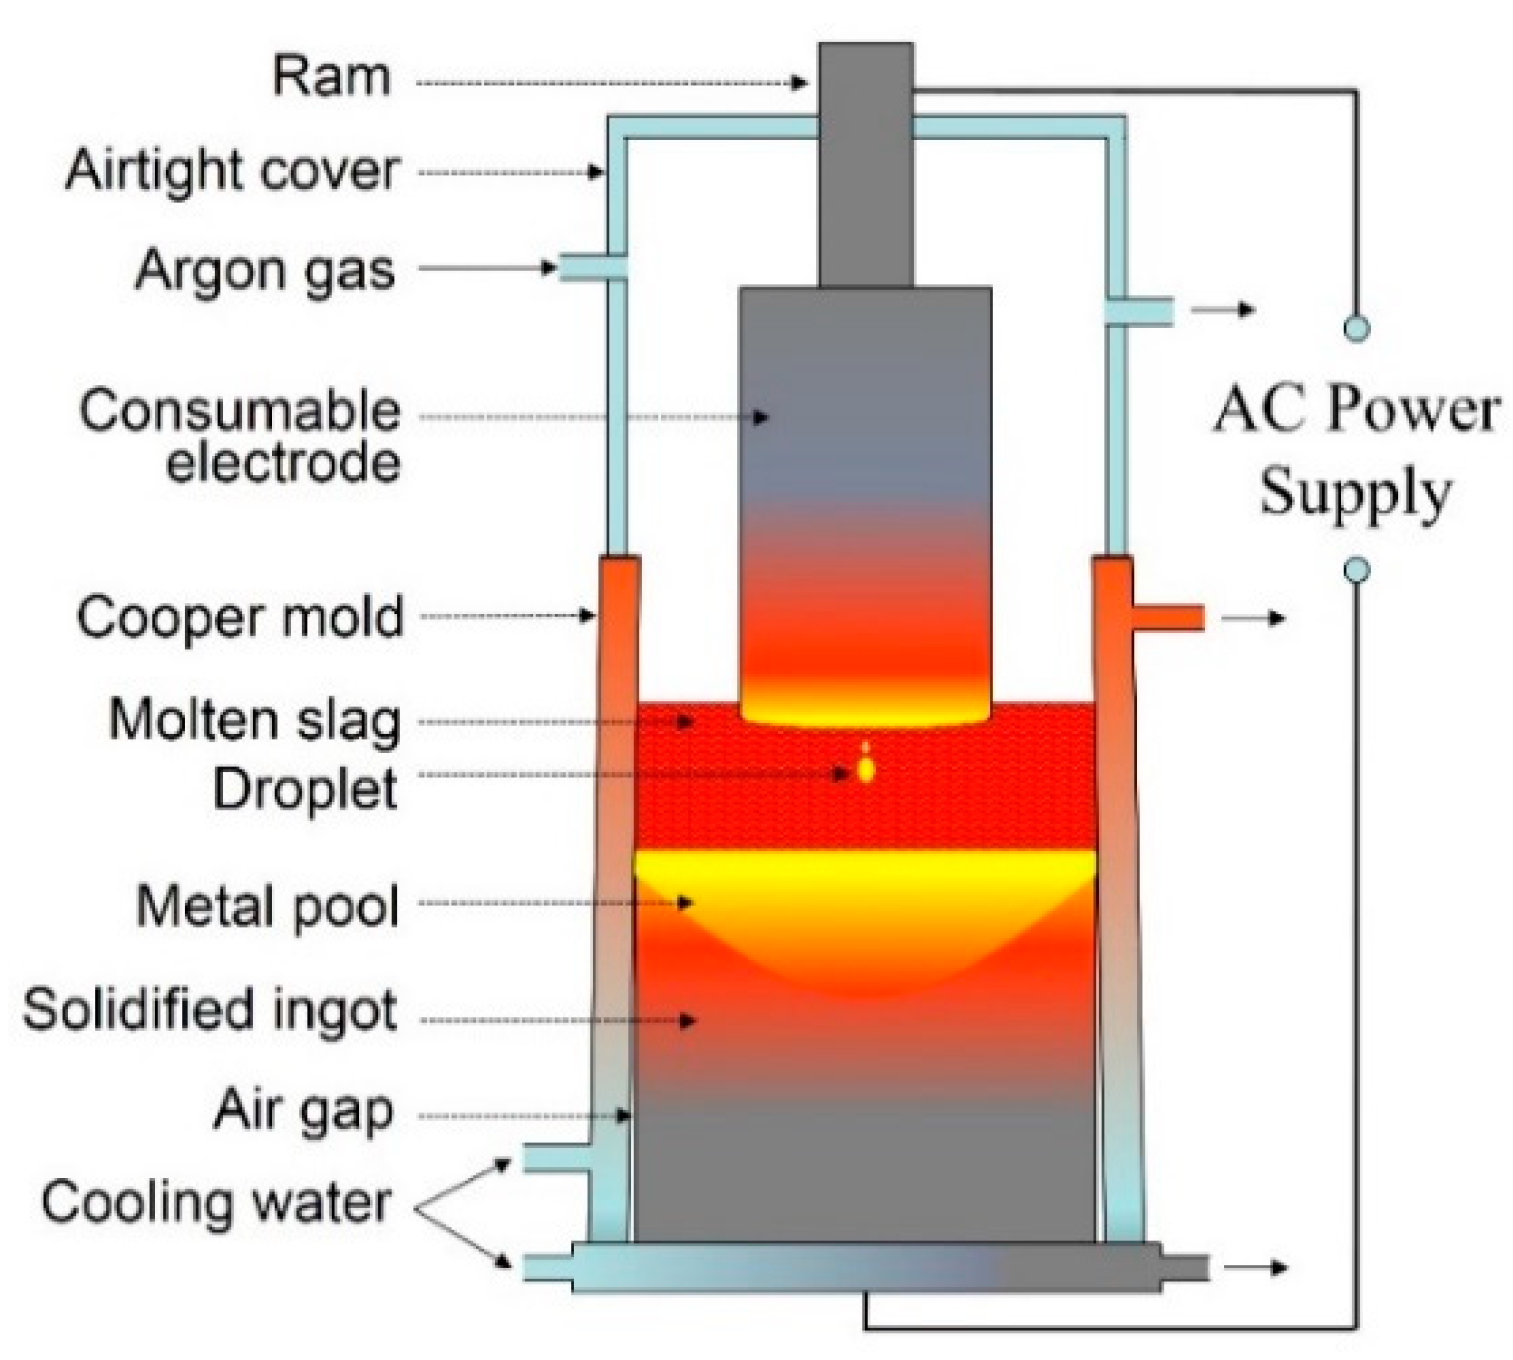
:1. Introduction
2. Model Description
2.1. Electromagnetism
2.2. Fluid Flow
2.3. Heat Transfer and Solidification
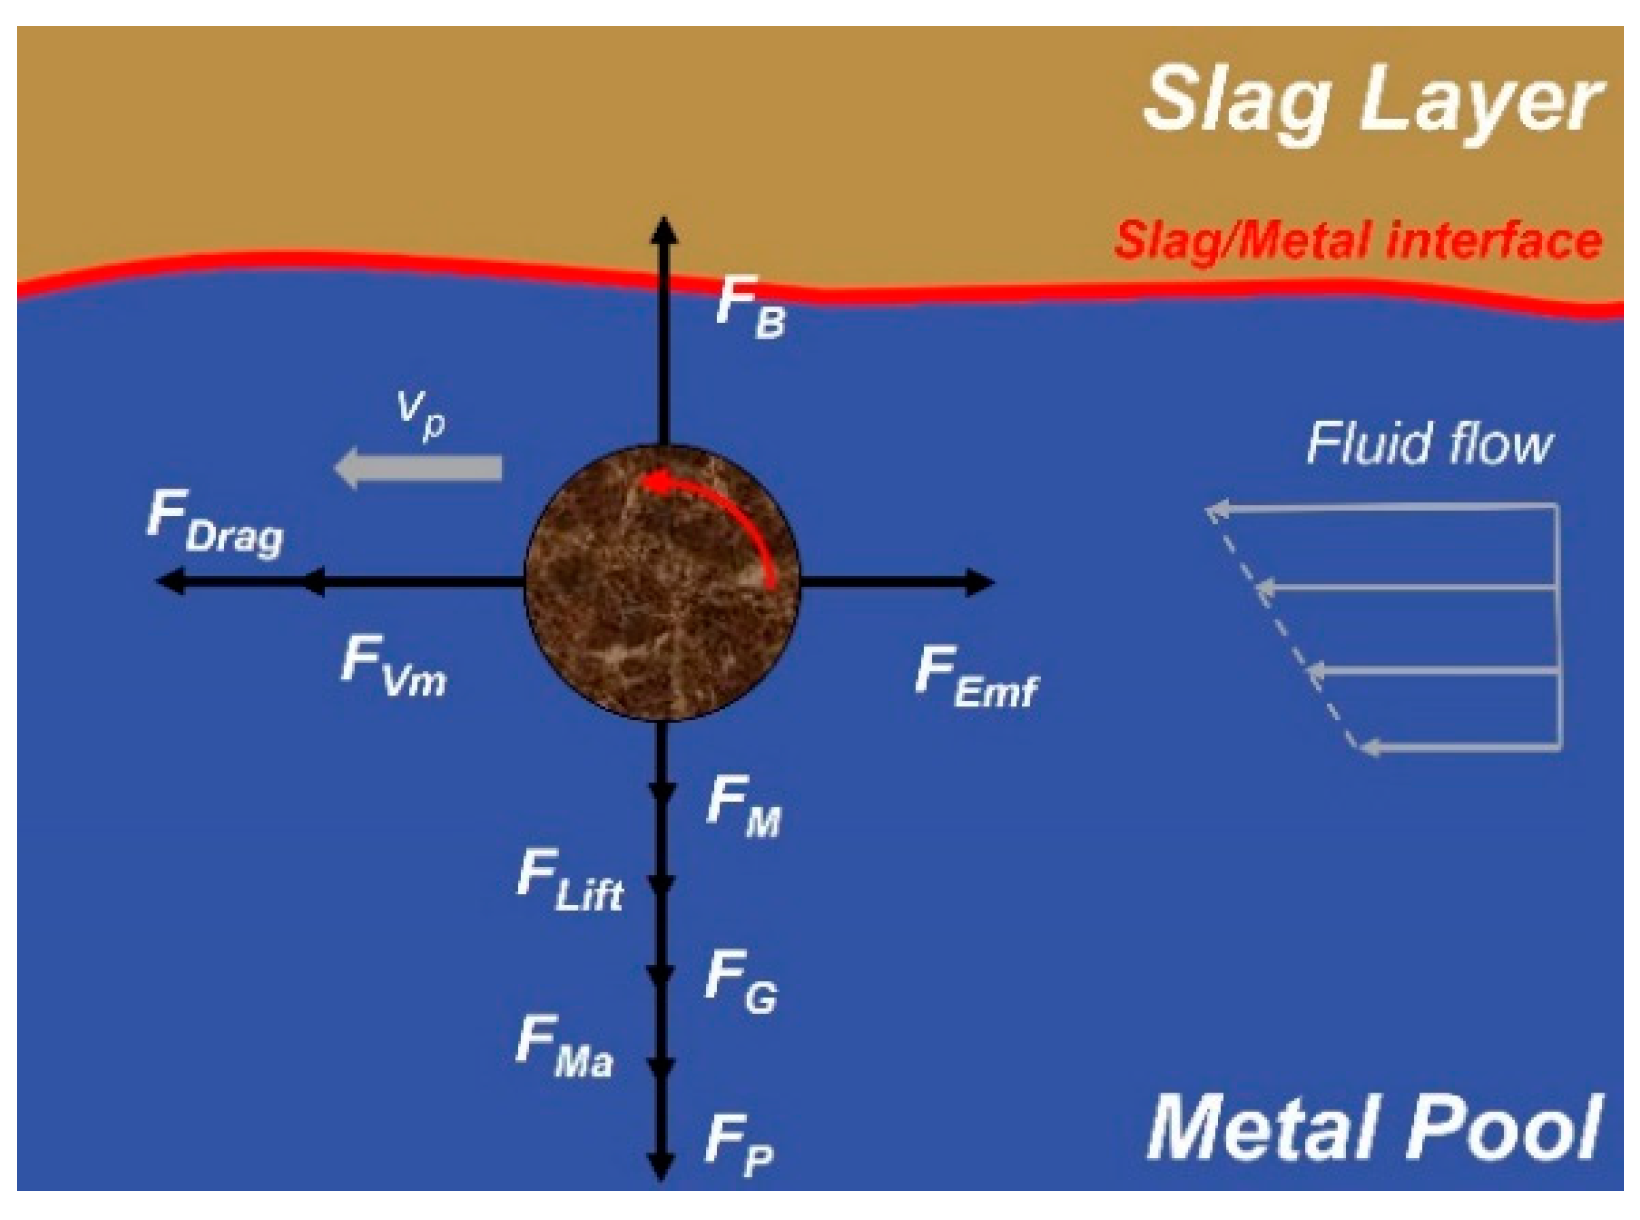
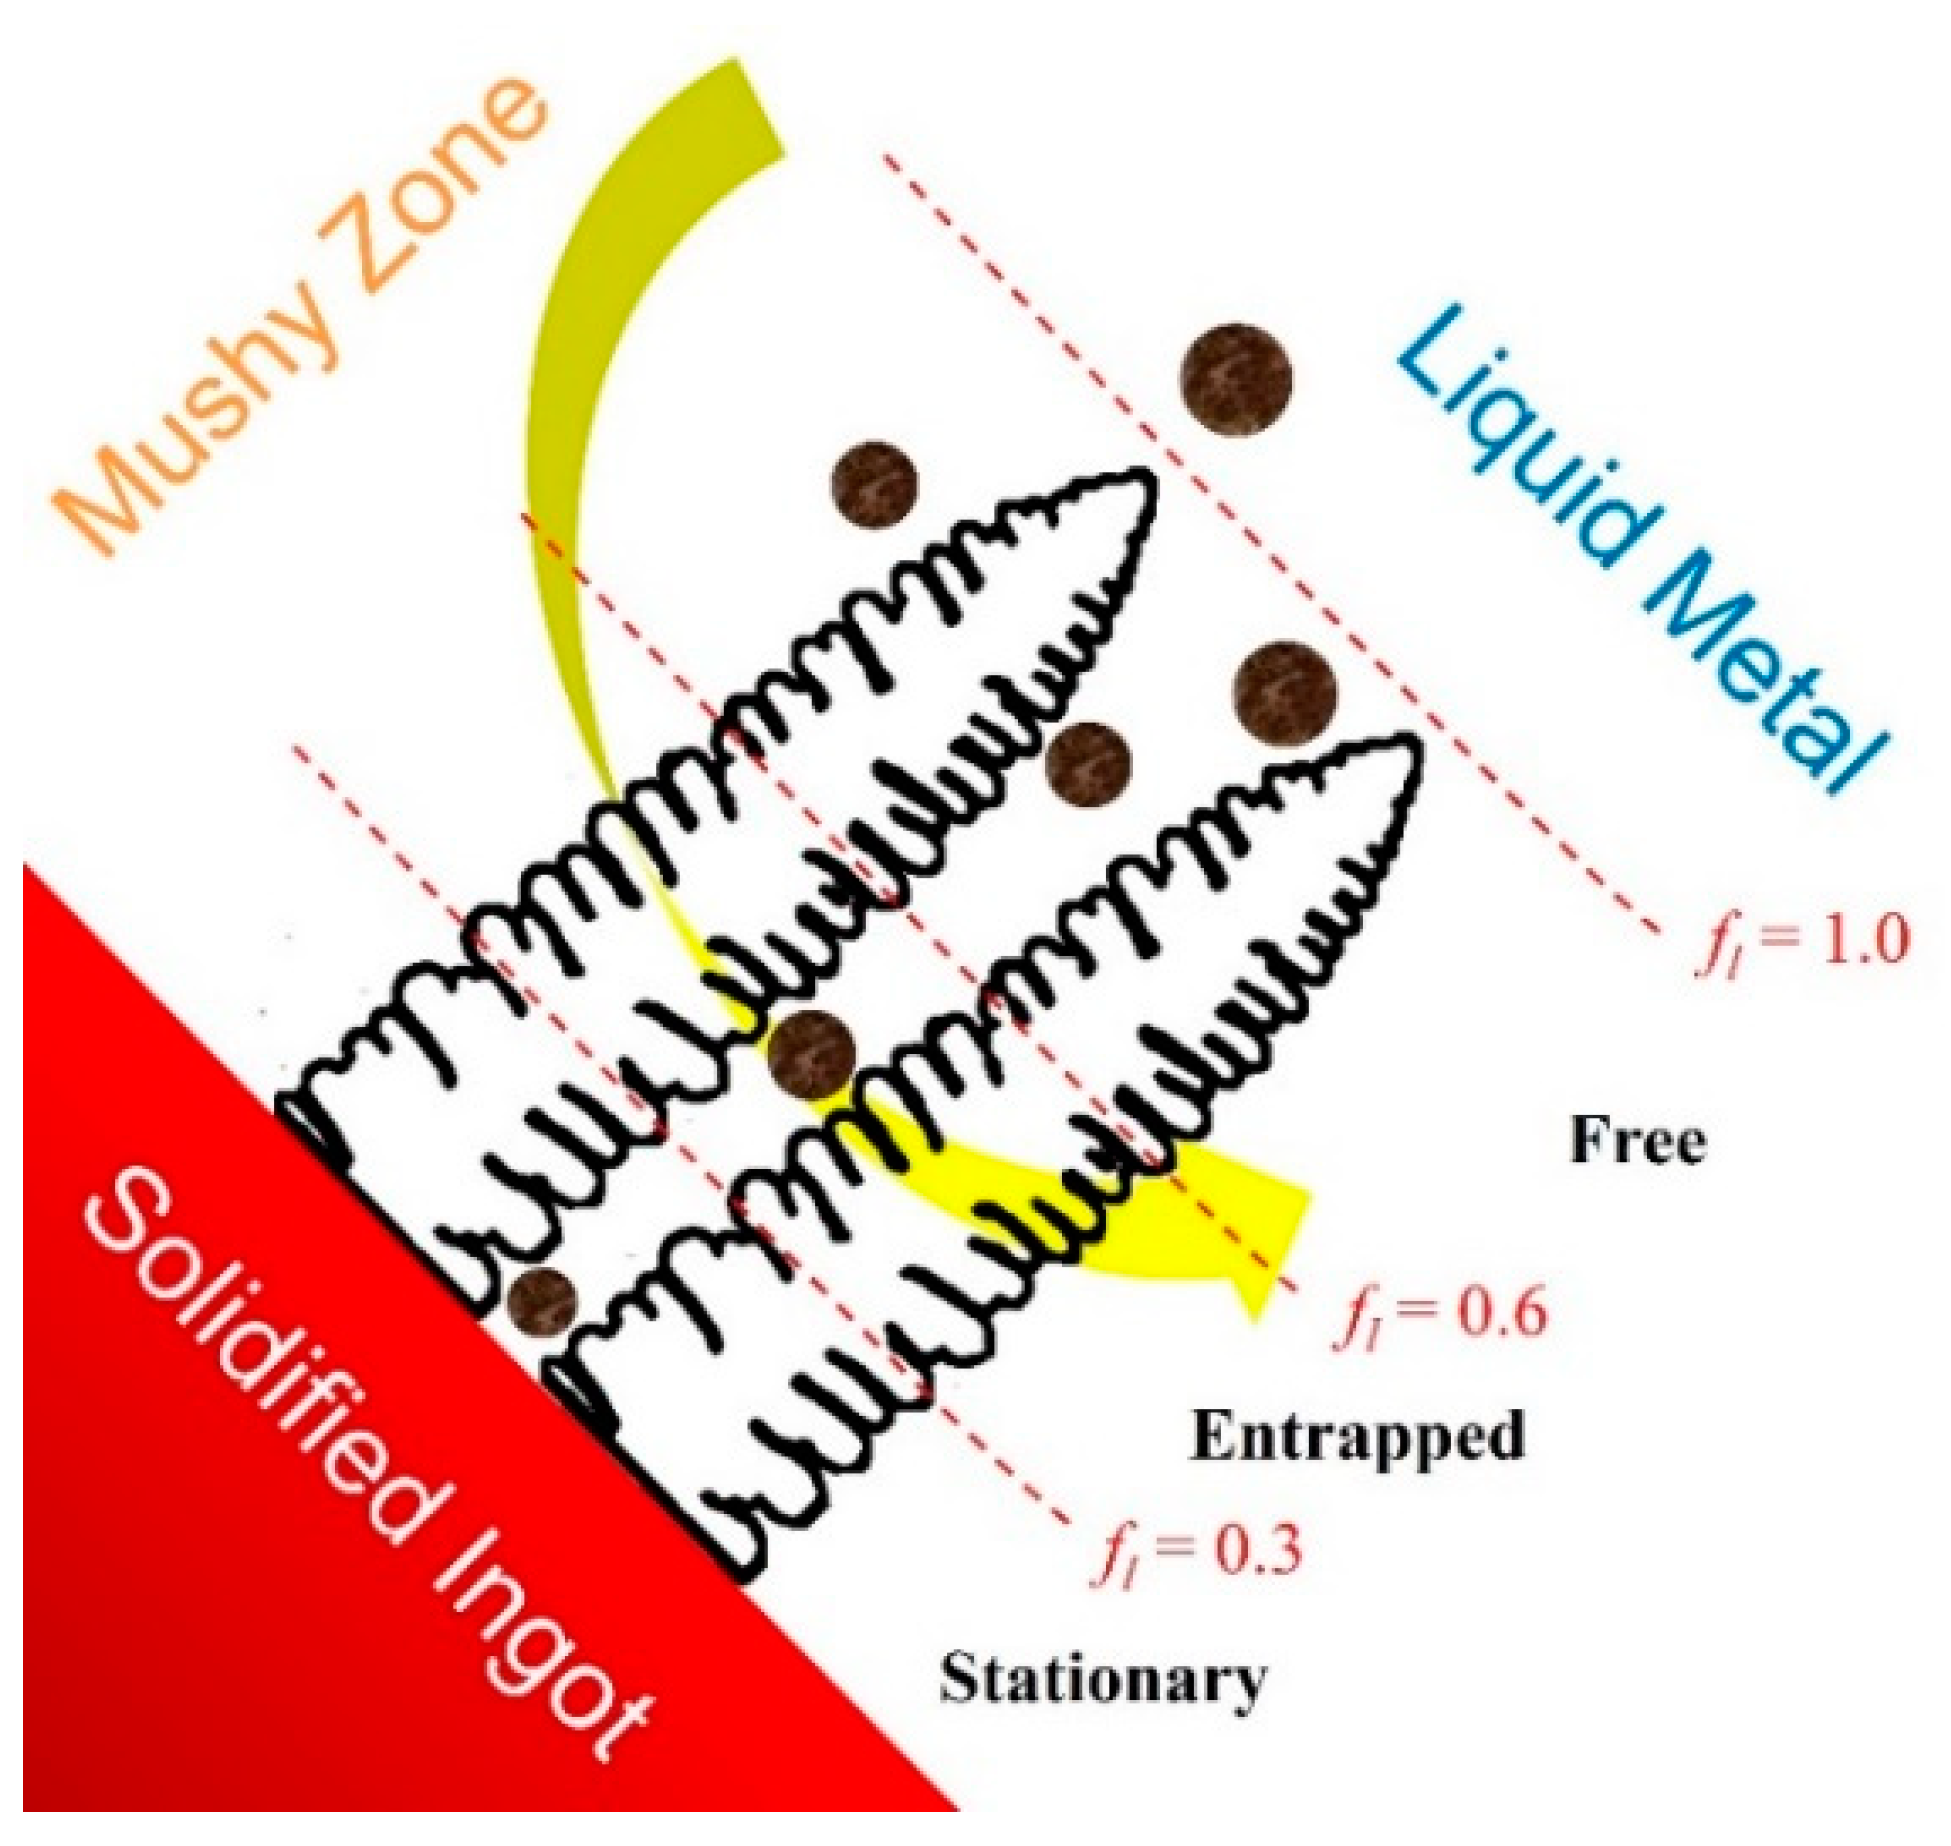
2.4. Inclusion Motion
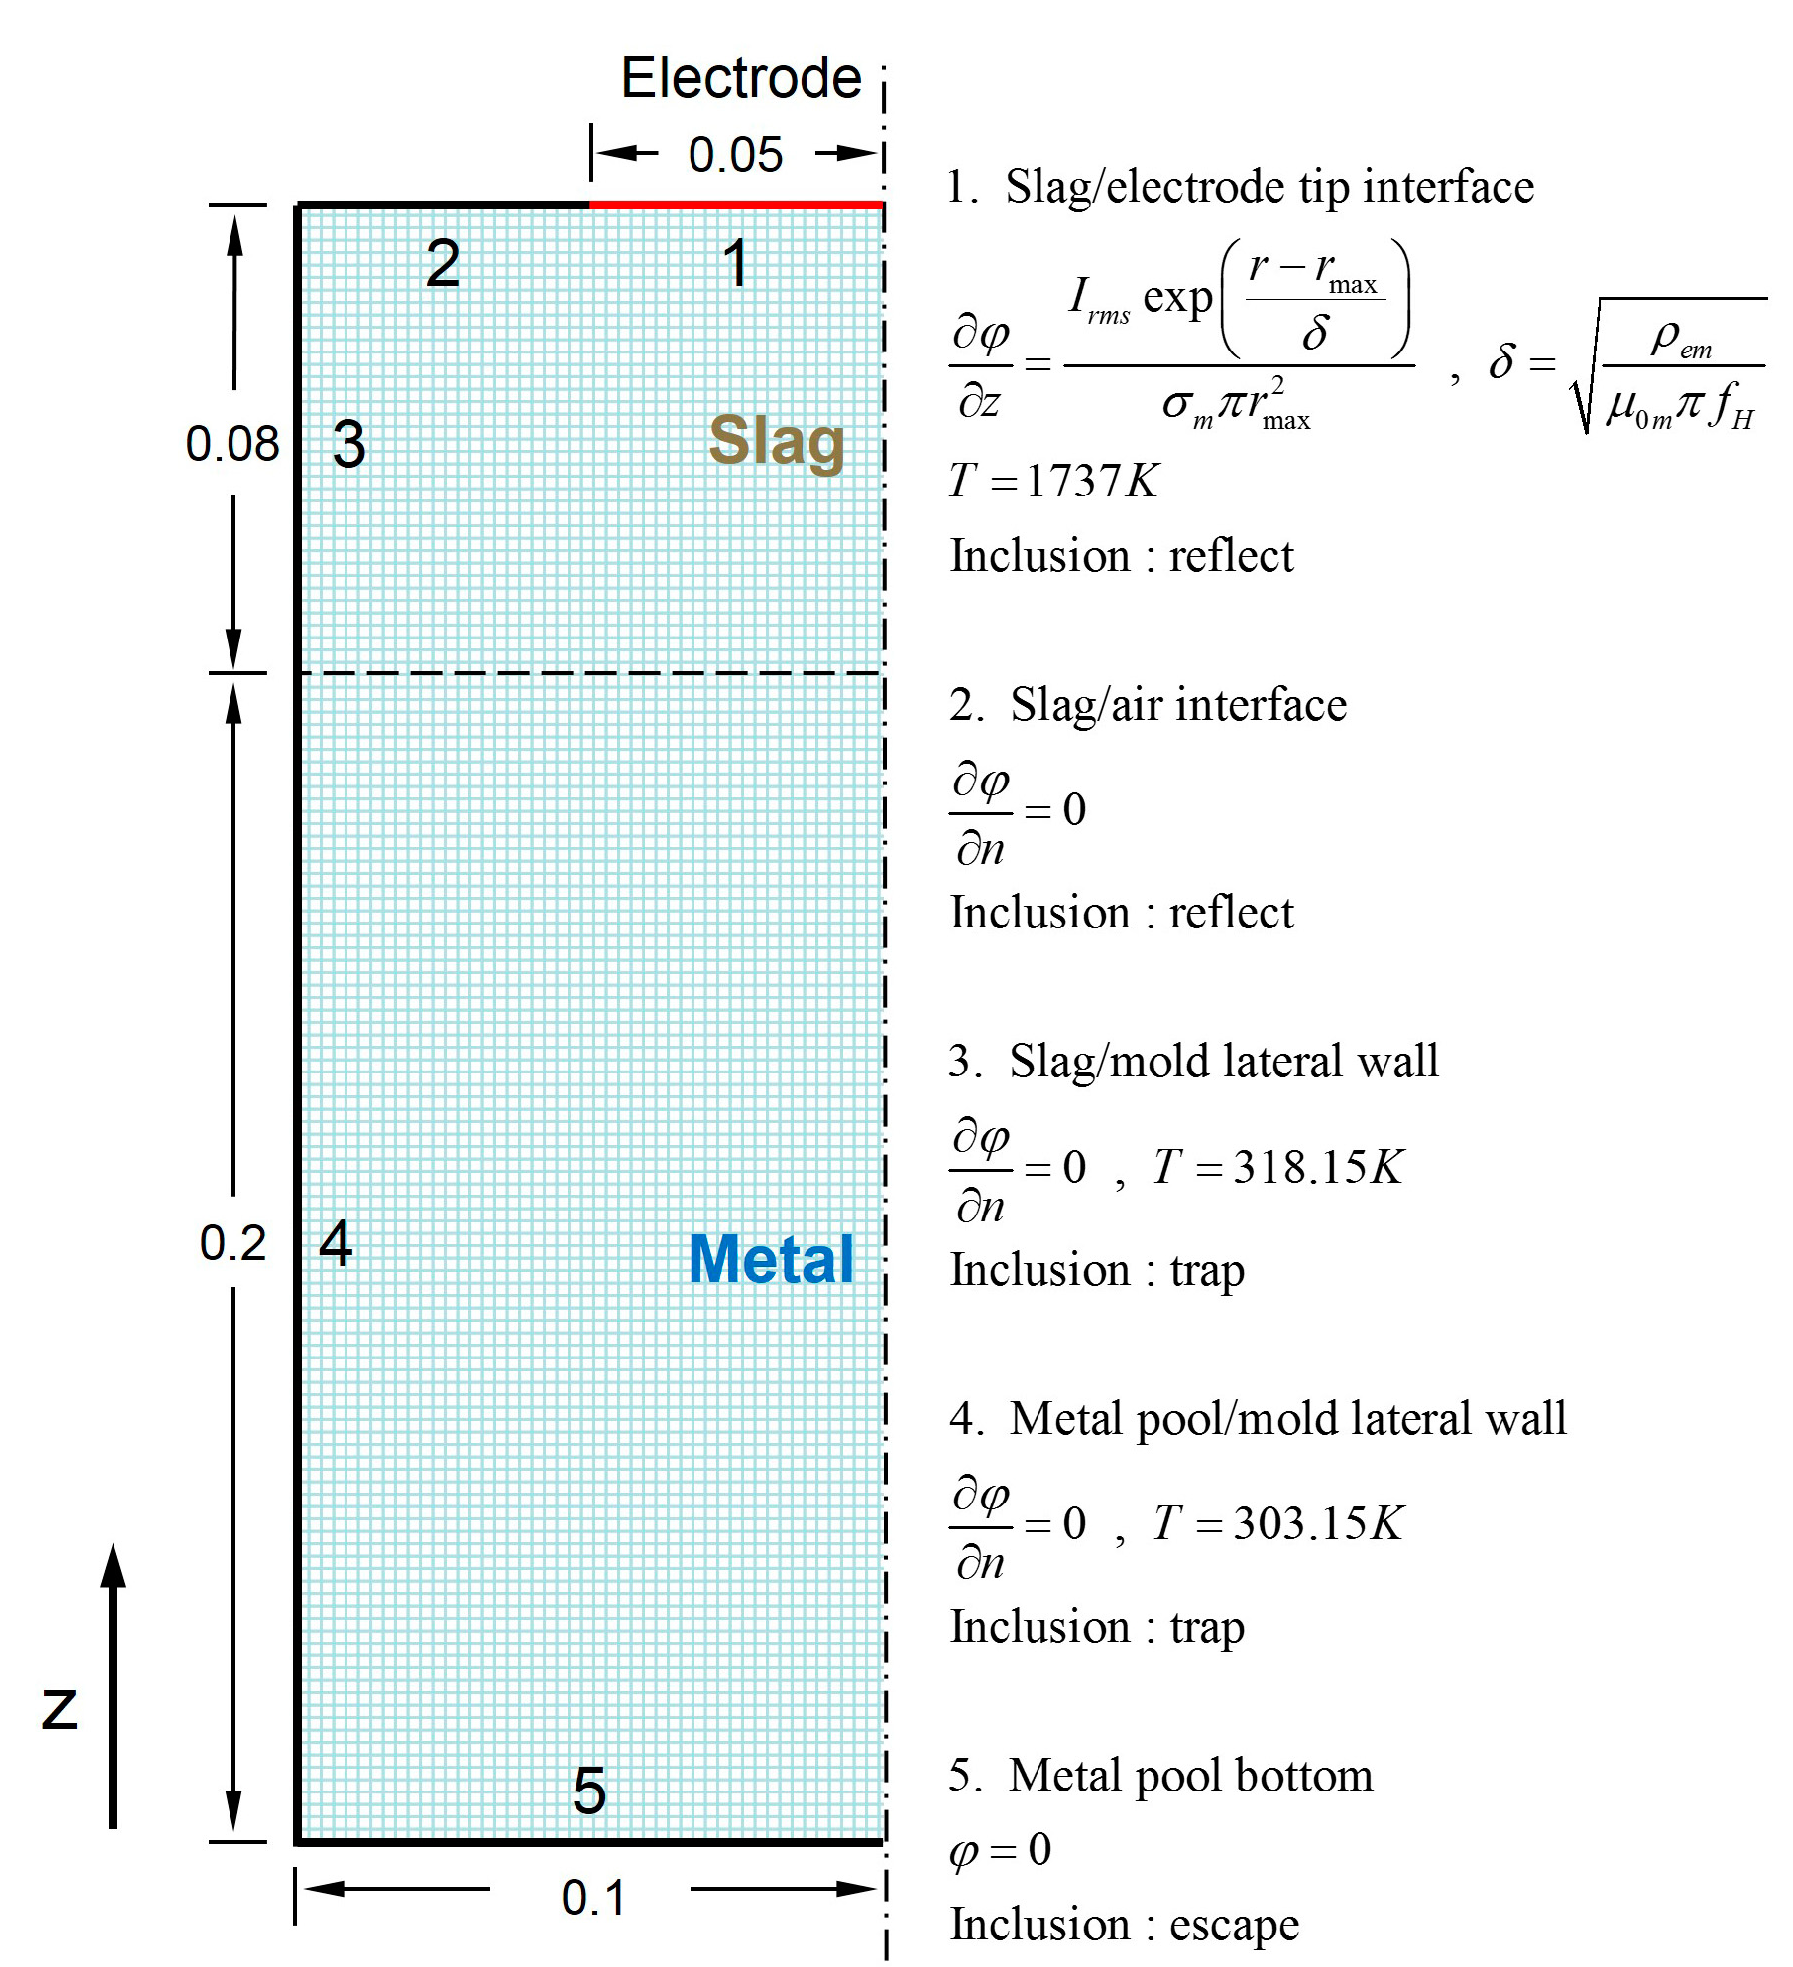
2.5. Boudnary Conditions
3. Calculation Procedure
4. Results and Discussion
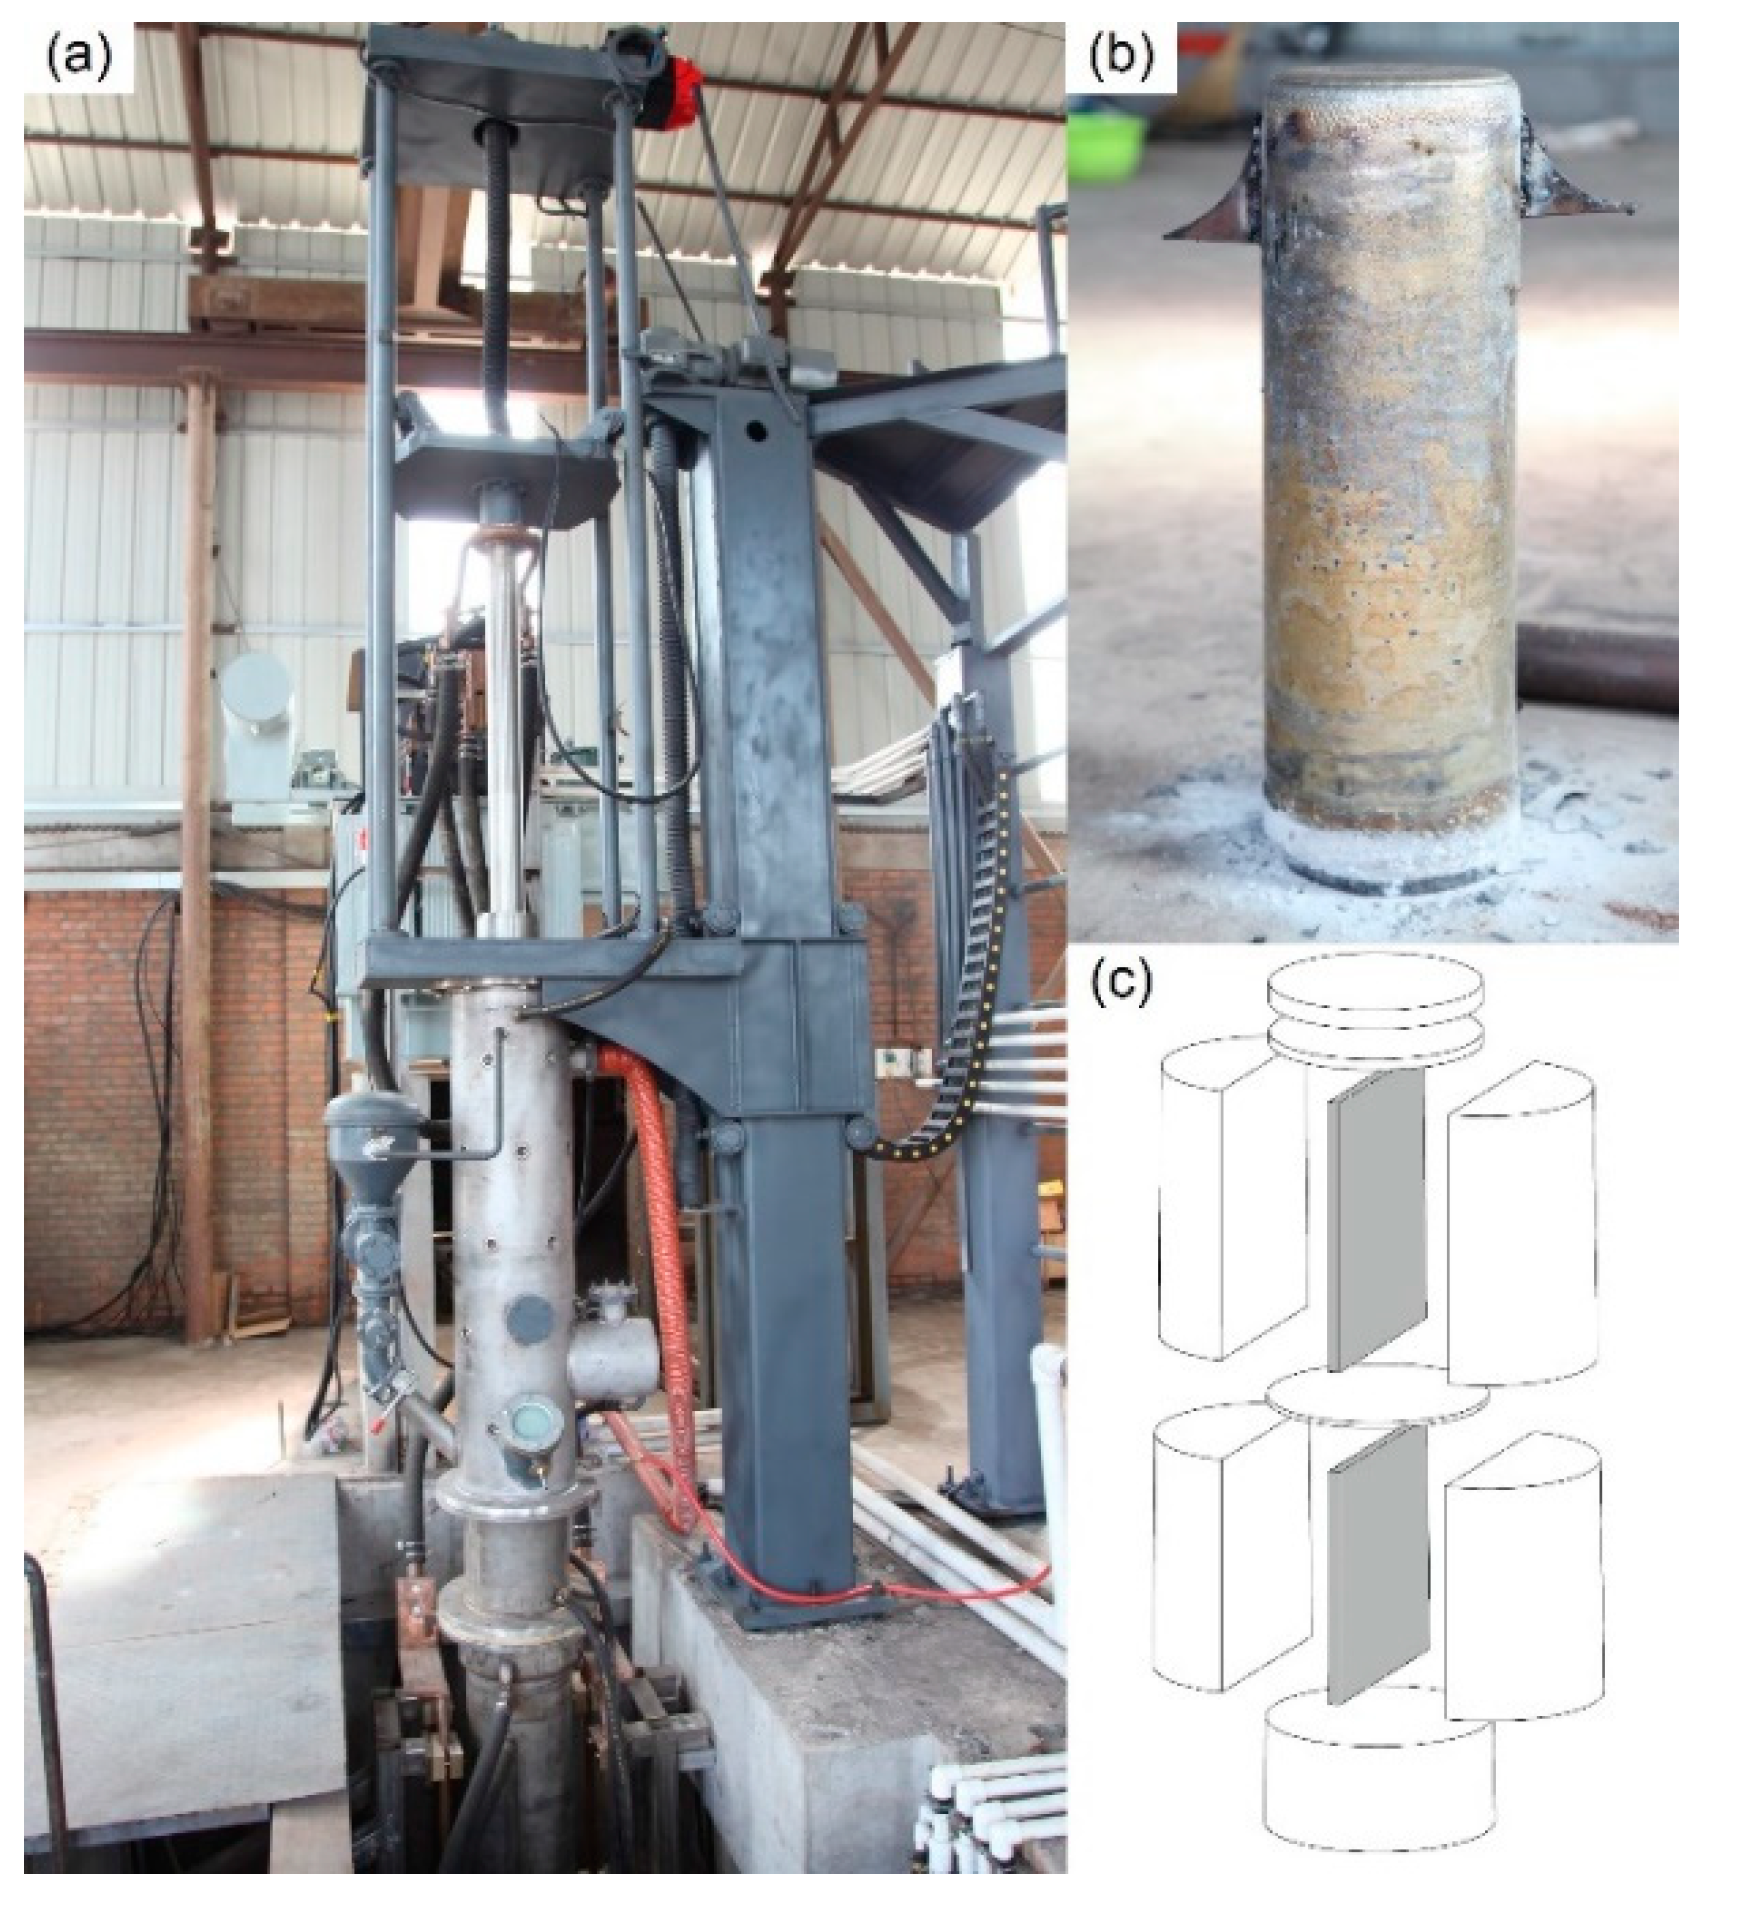
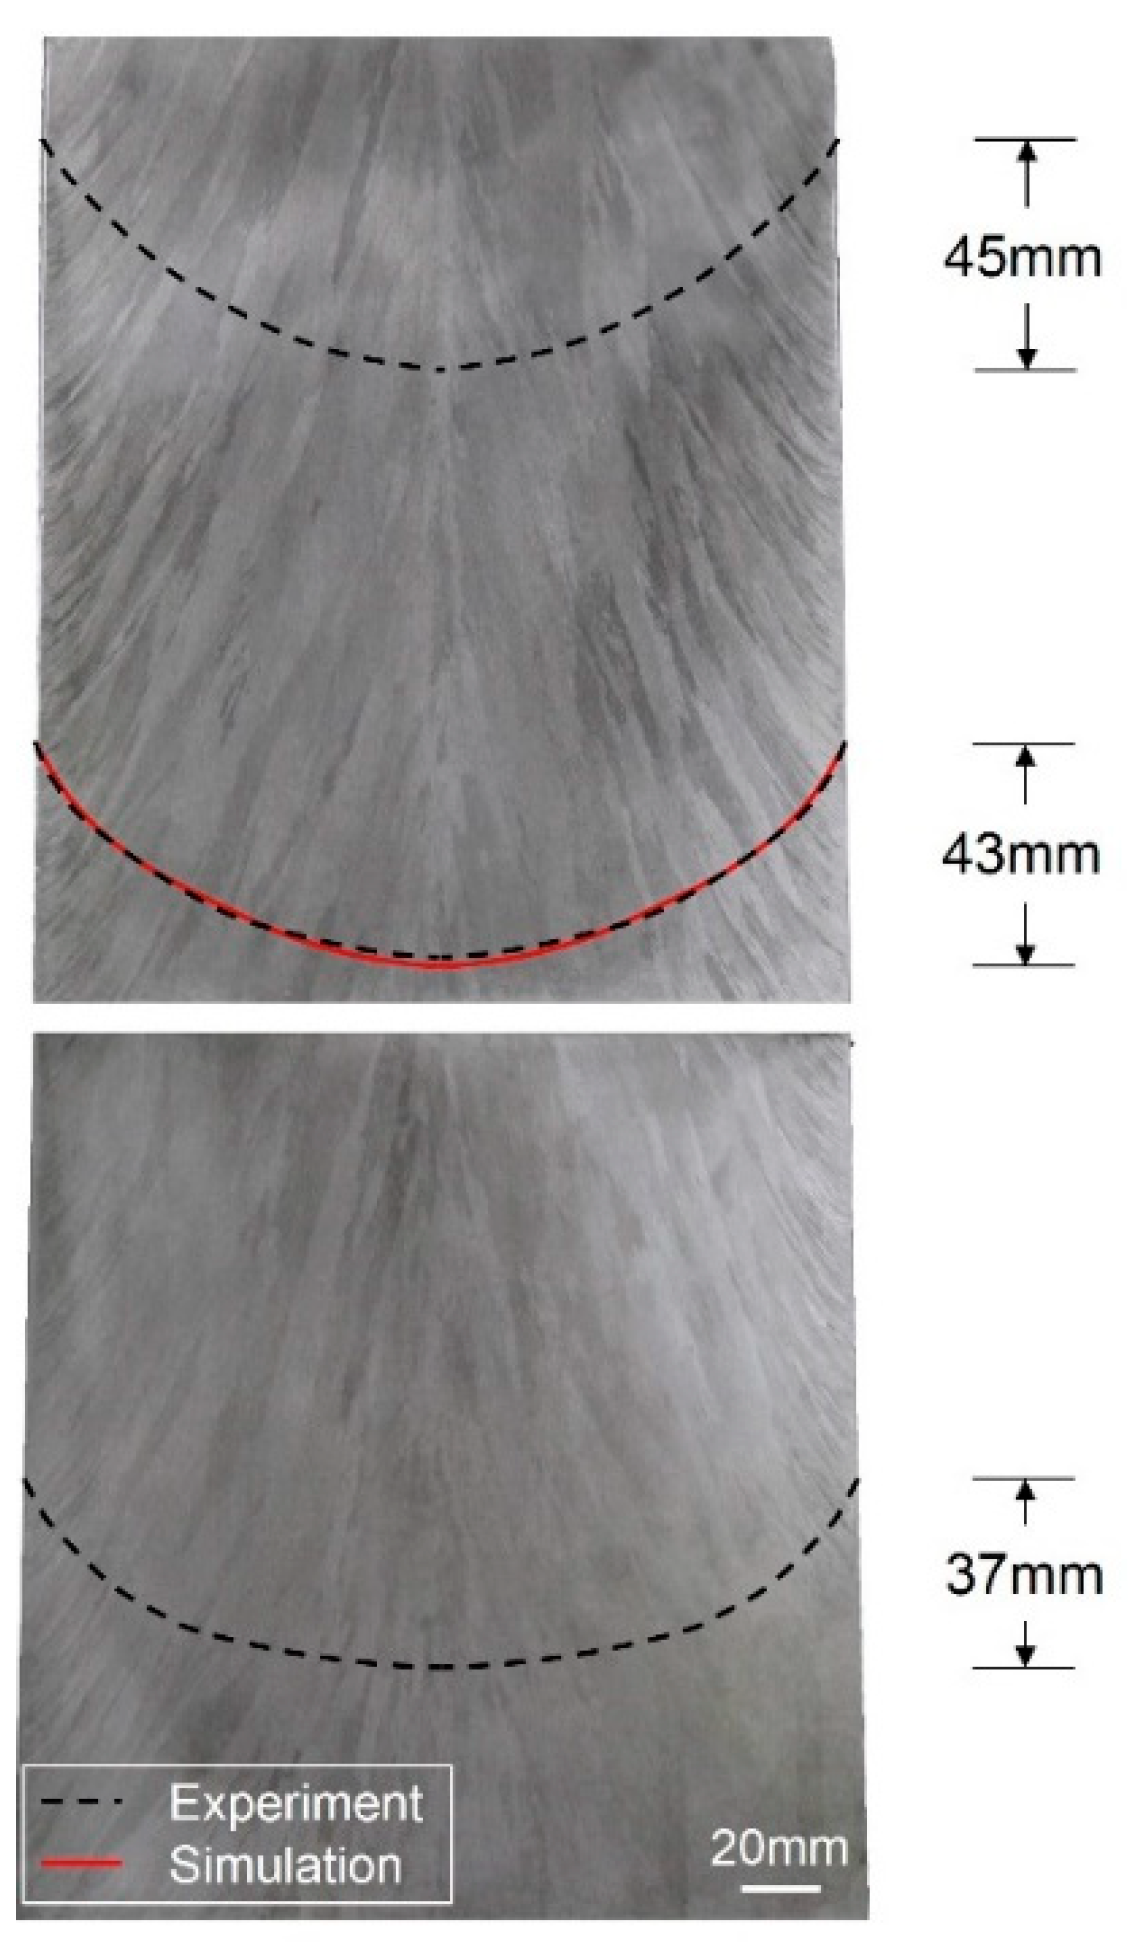
4.1. Experiment Details and Model Validation
4.2. MHD (Magnetohydrodynamics) Fluid Flow and Temperature Distribution
4.3. Inclusion Motion and Distribution
5. Conclusions
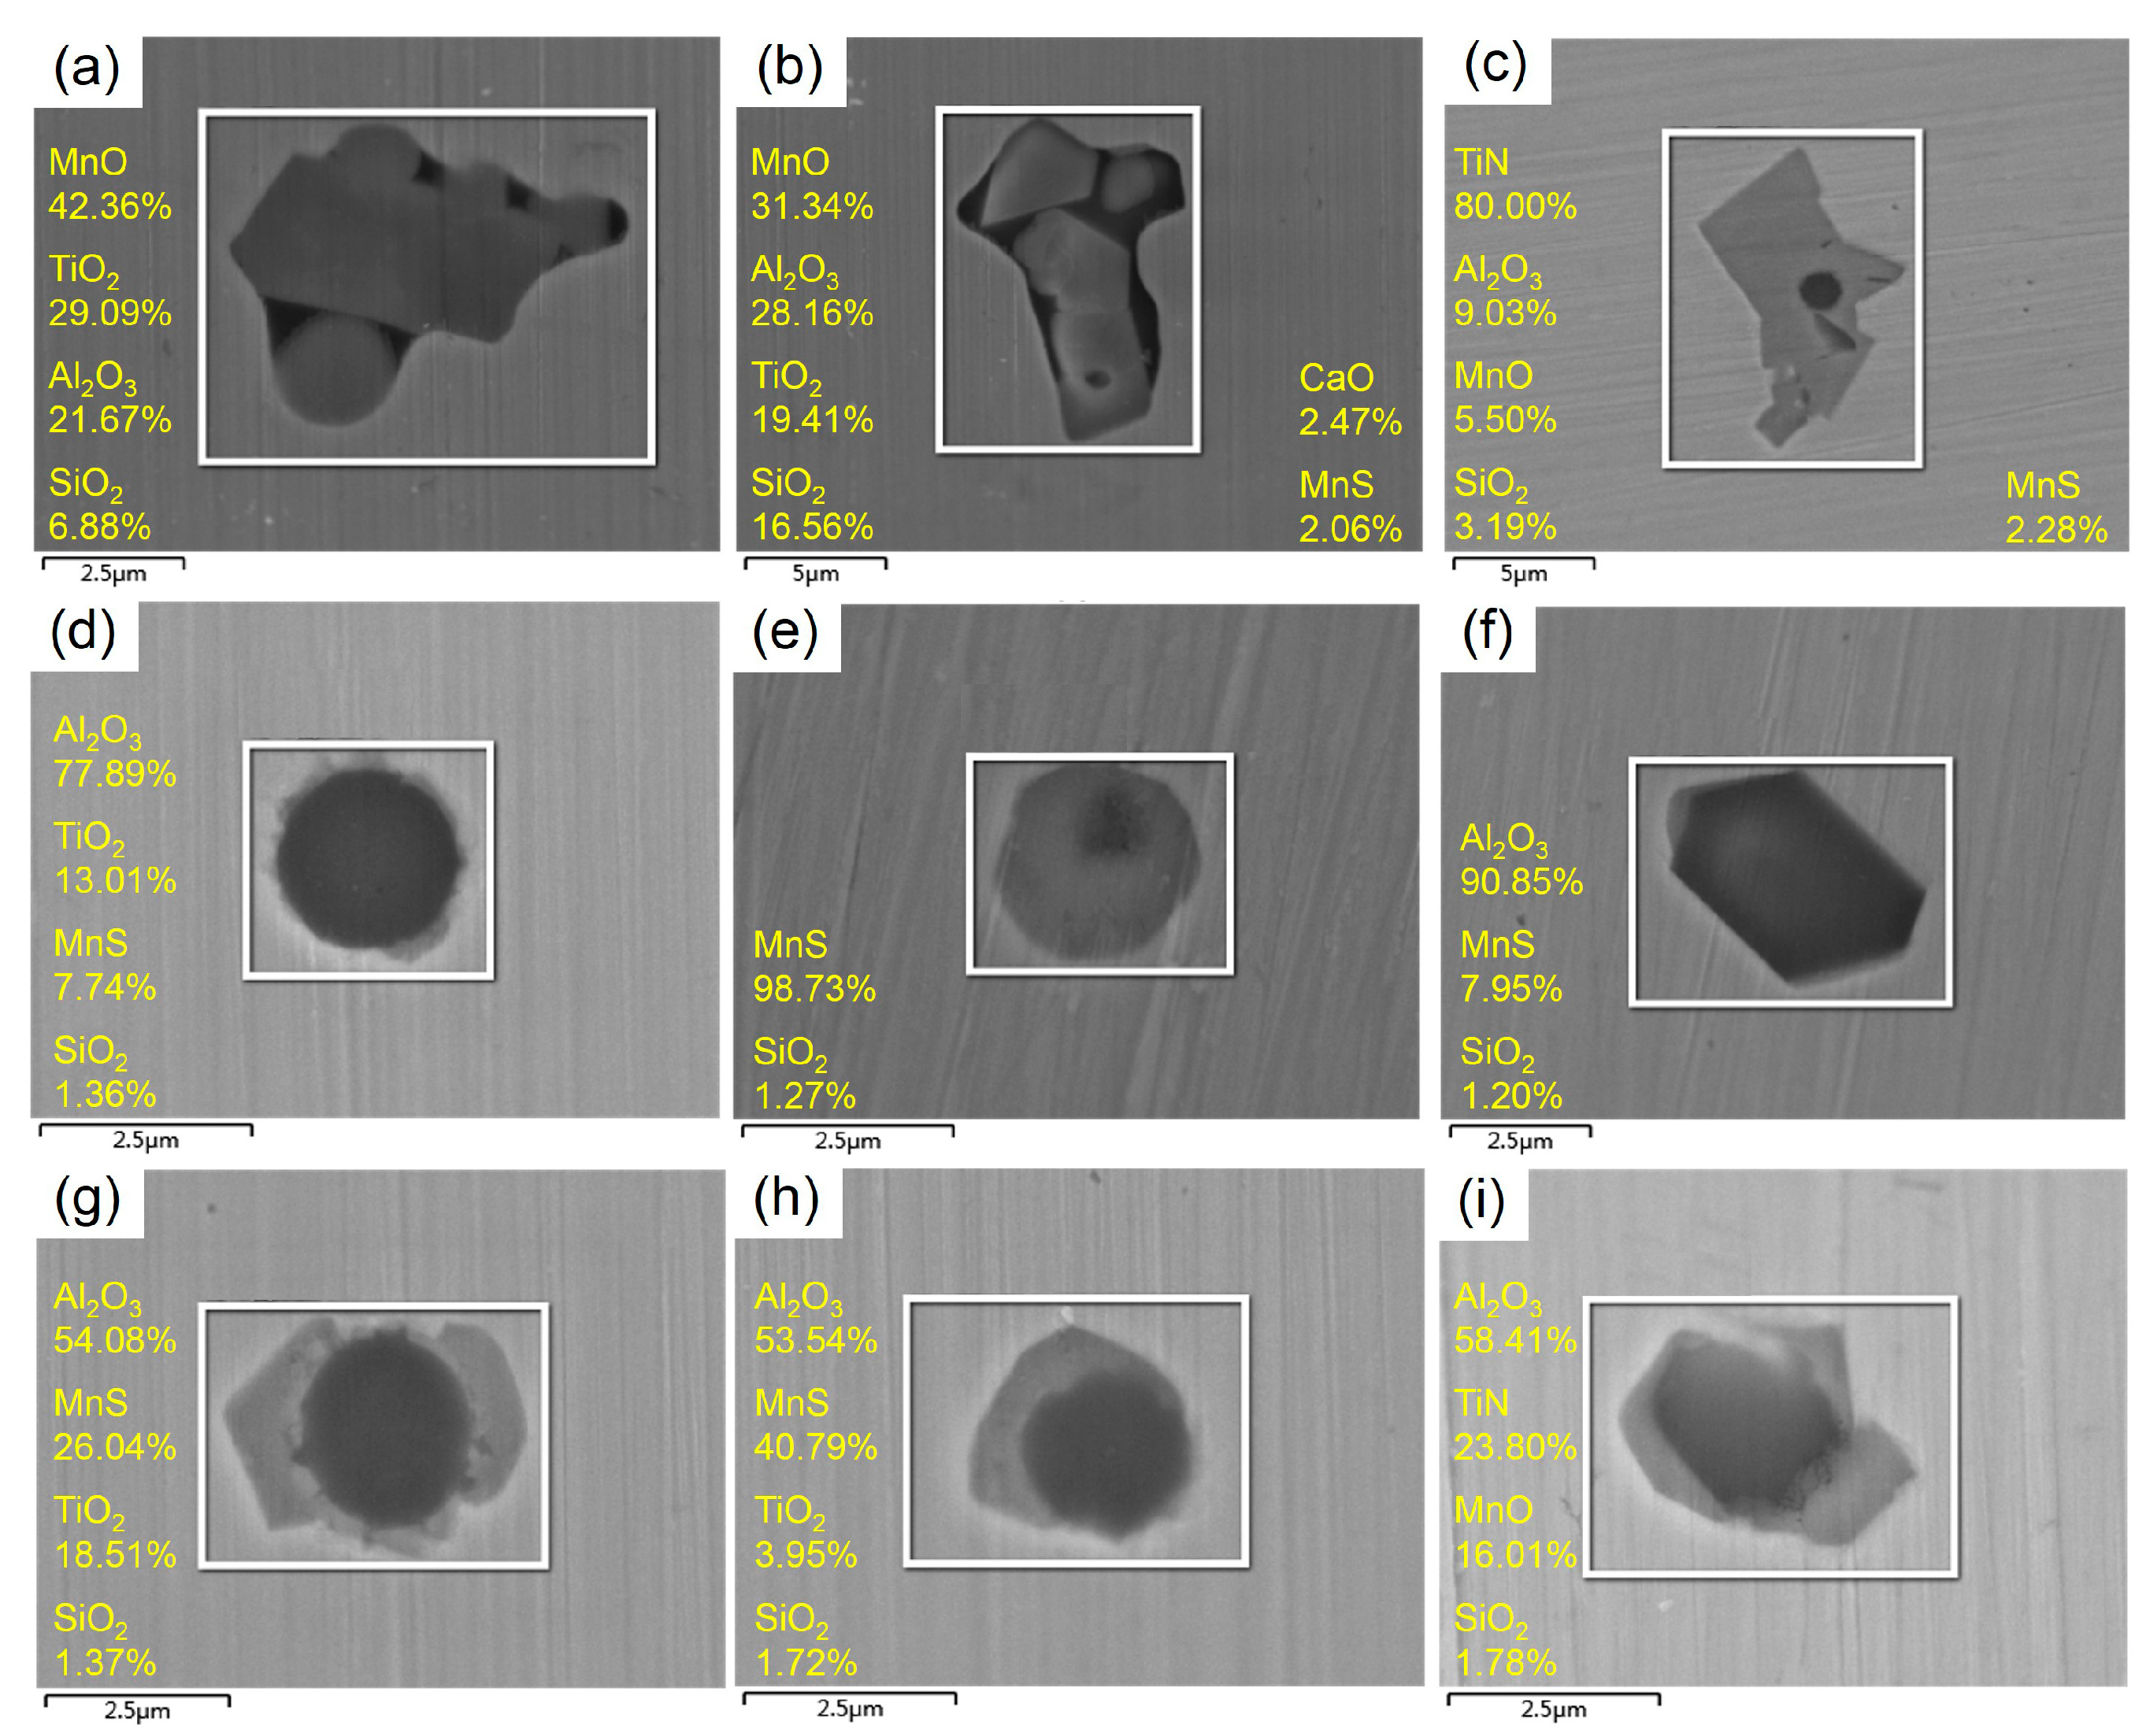
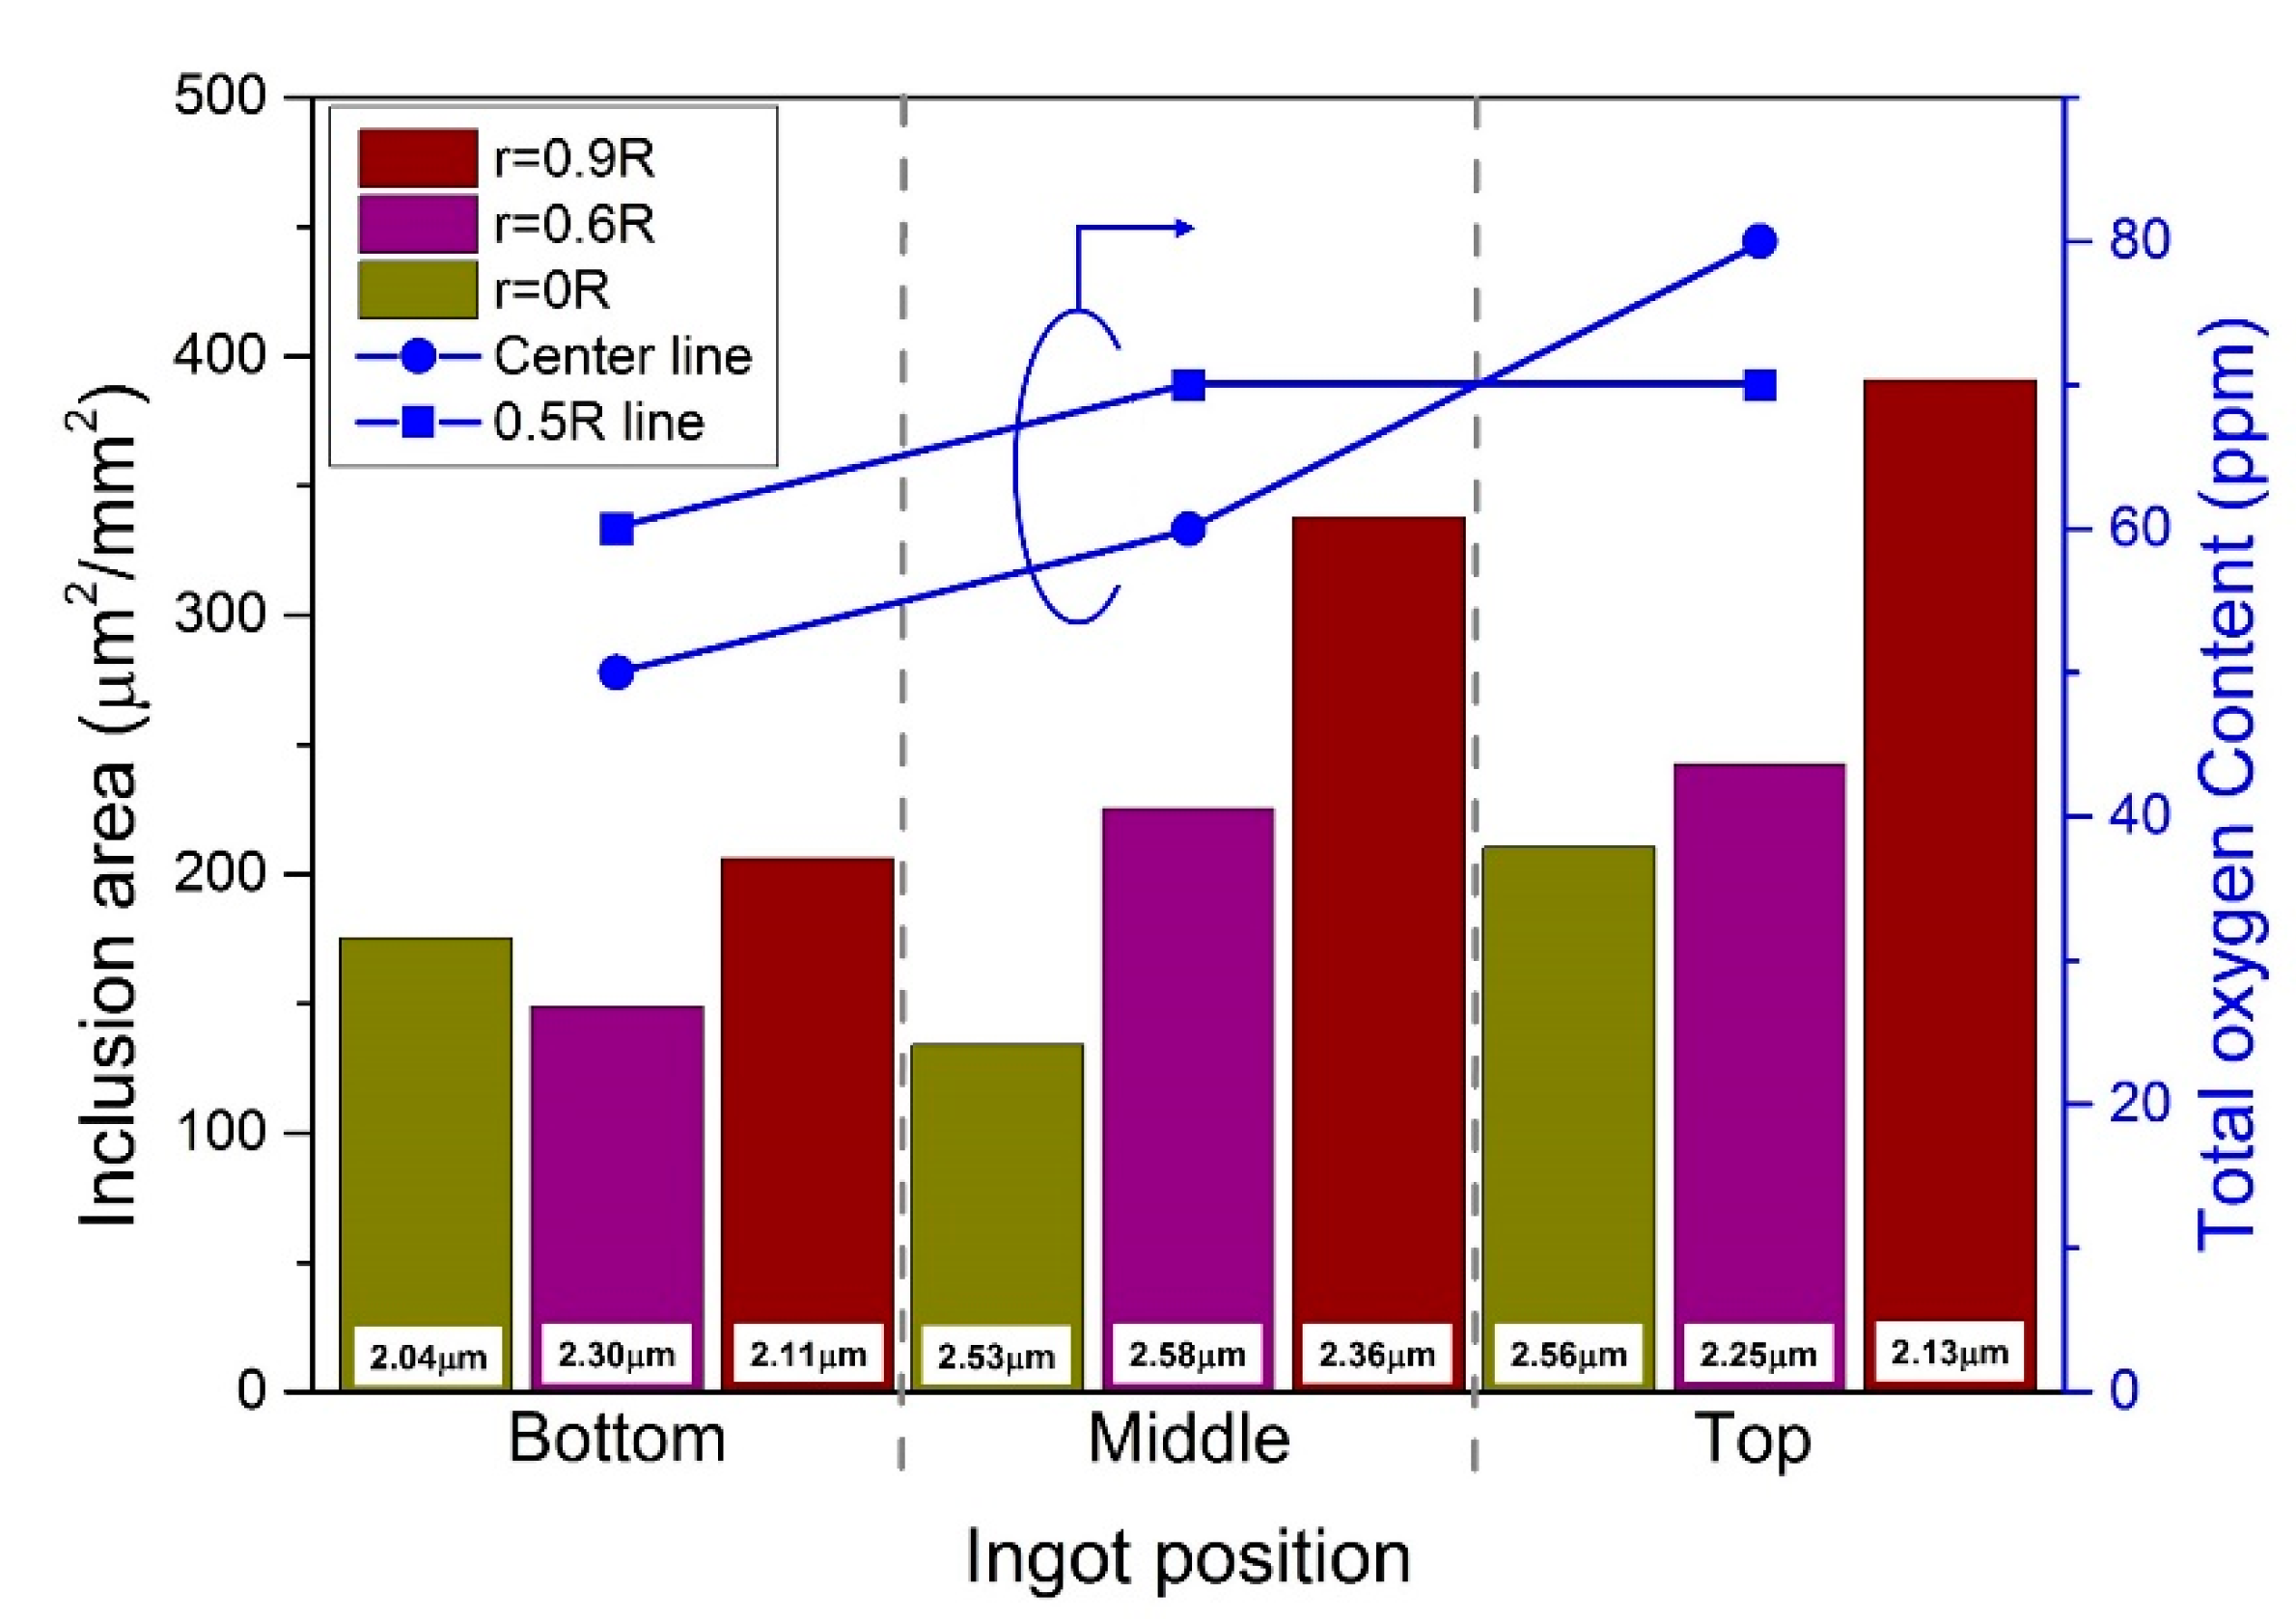
- The experiment shows that the growths of columnar crystals are dominant in the ESR ingot. The typical inclusions in ESR ingot are Al2O3 core surrounded by an outer sulfide layer and pure MnS inclusions. Most of the oxide inclusions are near-spherical with a smaller size than that in electrode. The total area of inclusions increases from center toward ingot surface, while the average equivalent diameter decreases.
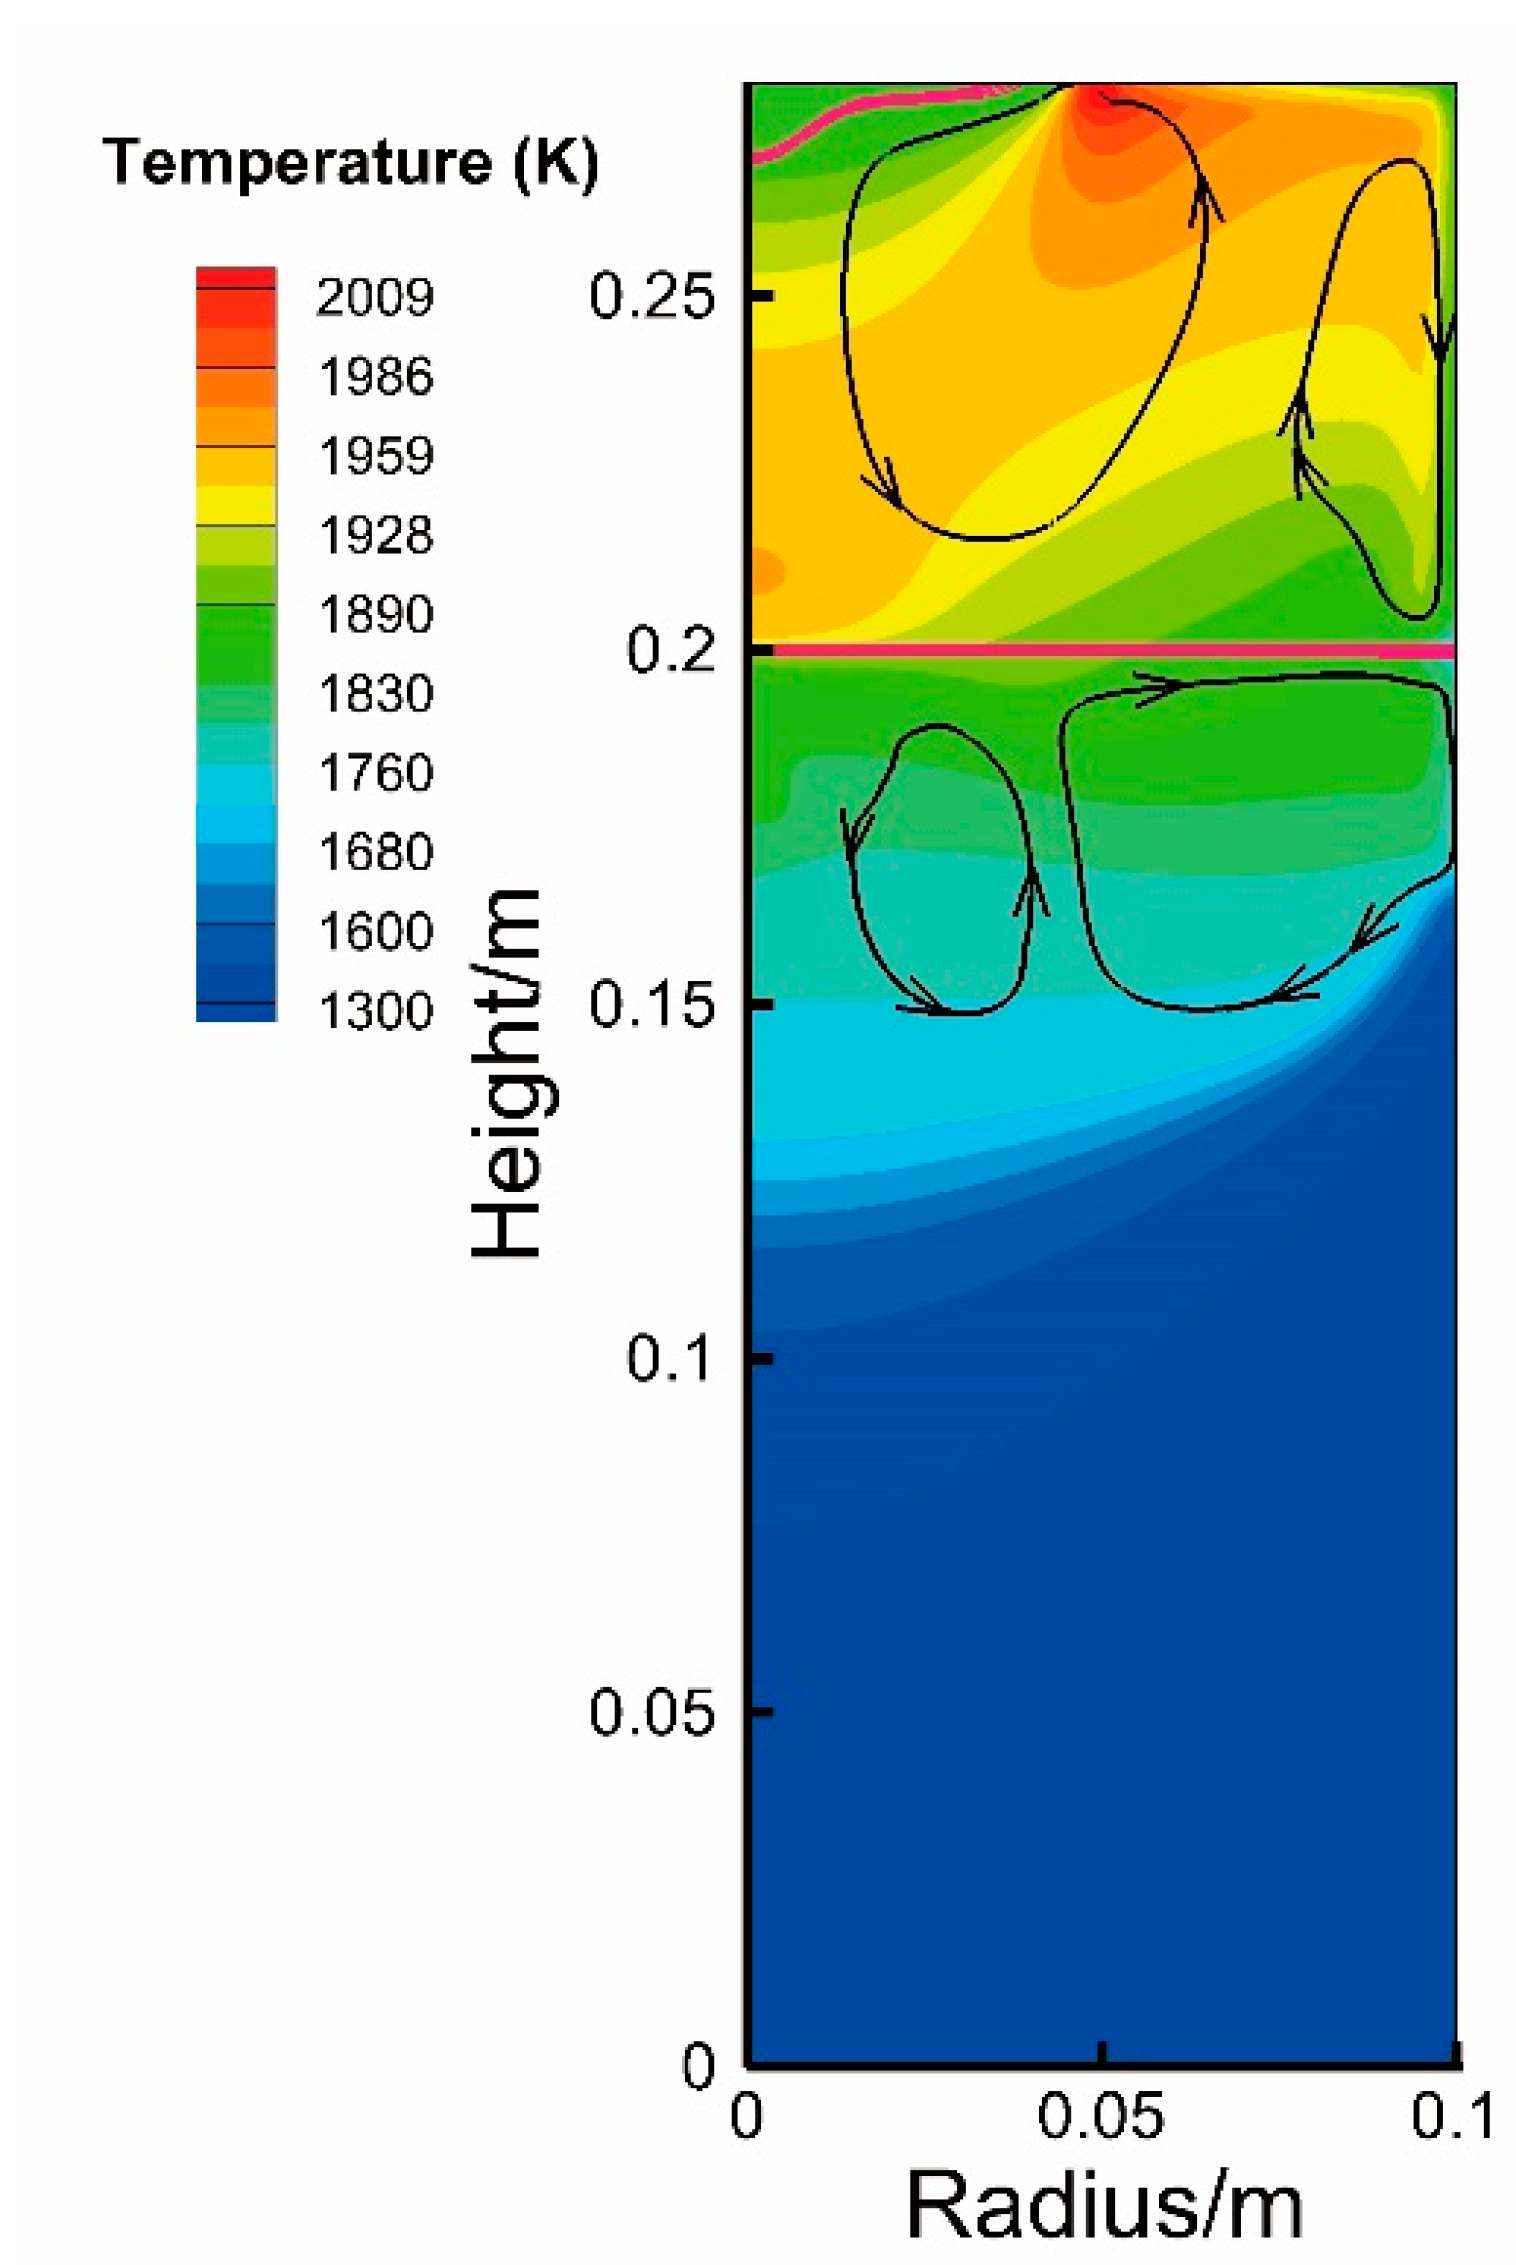
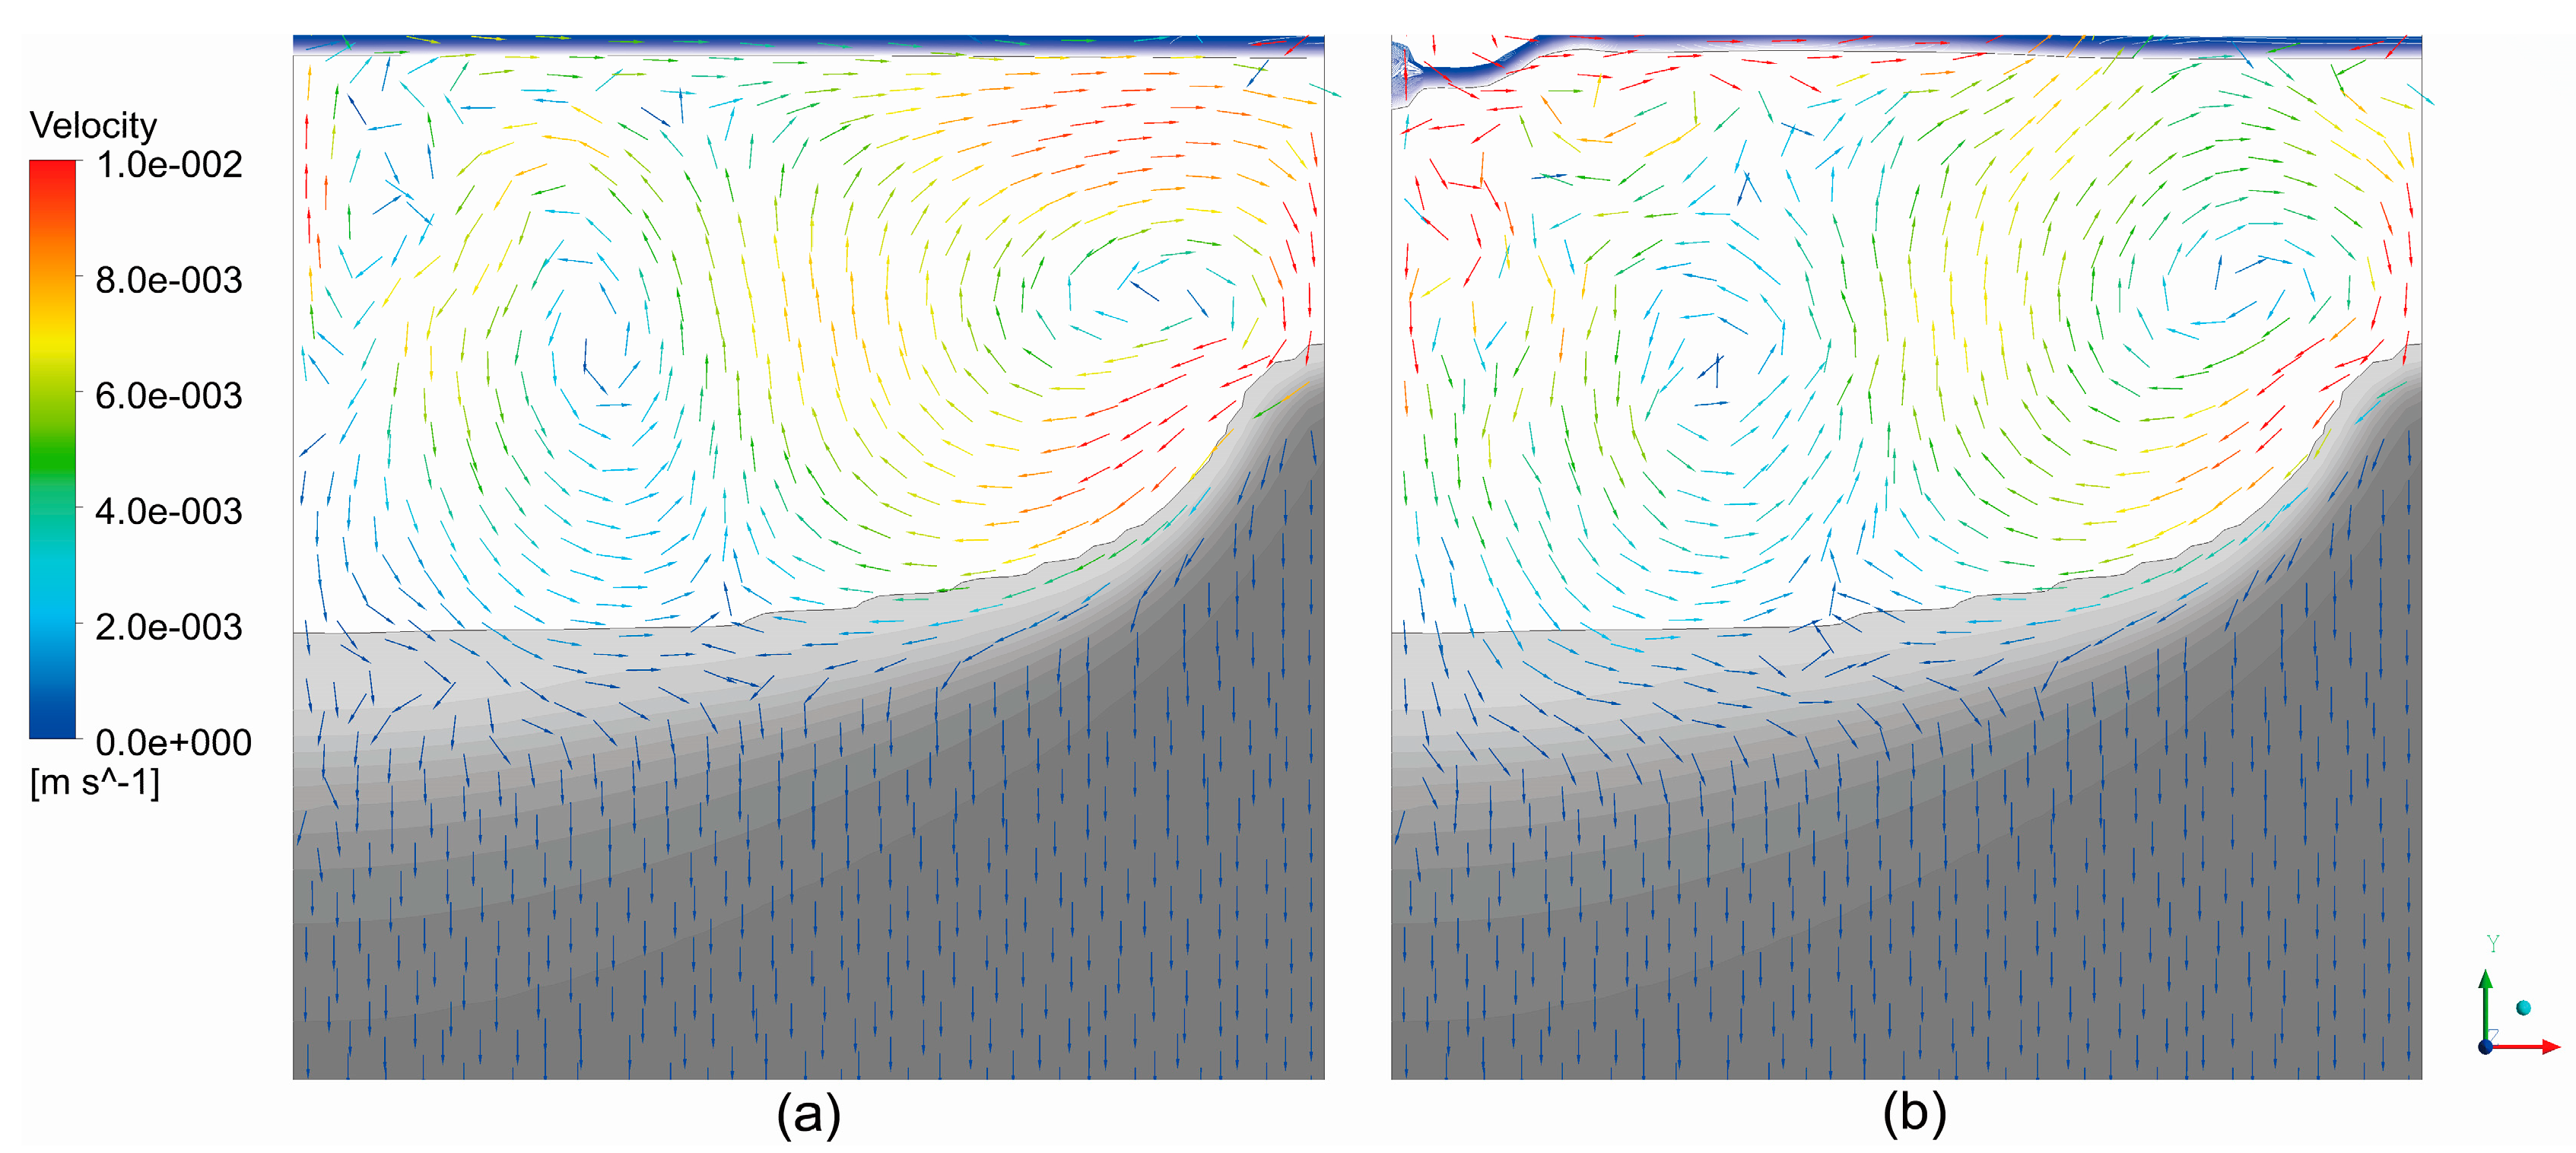
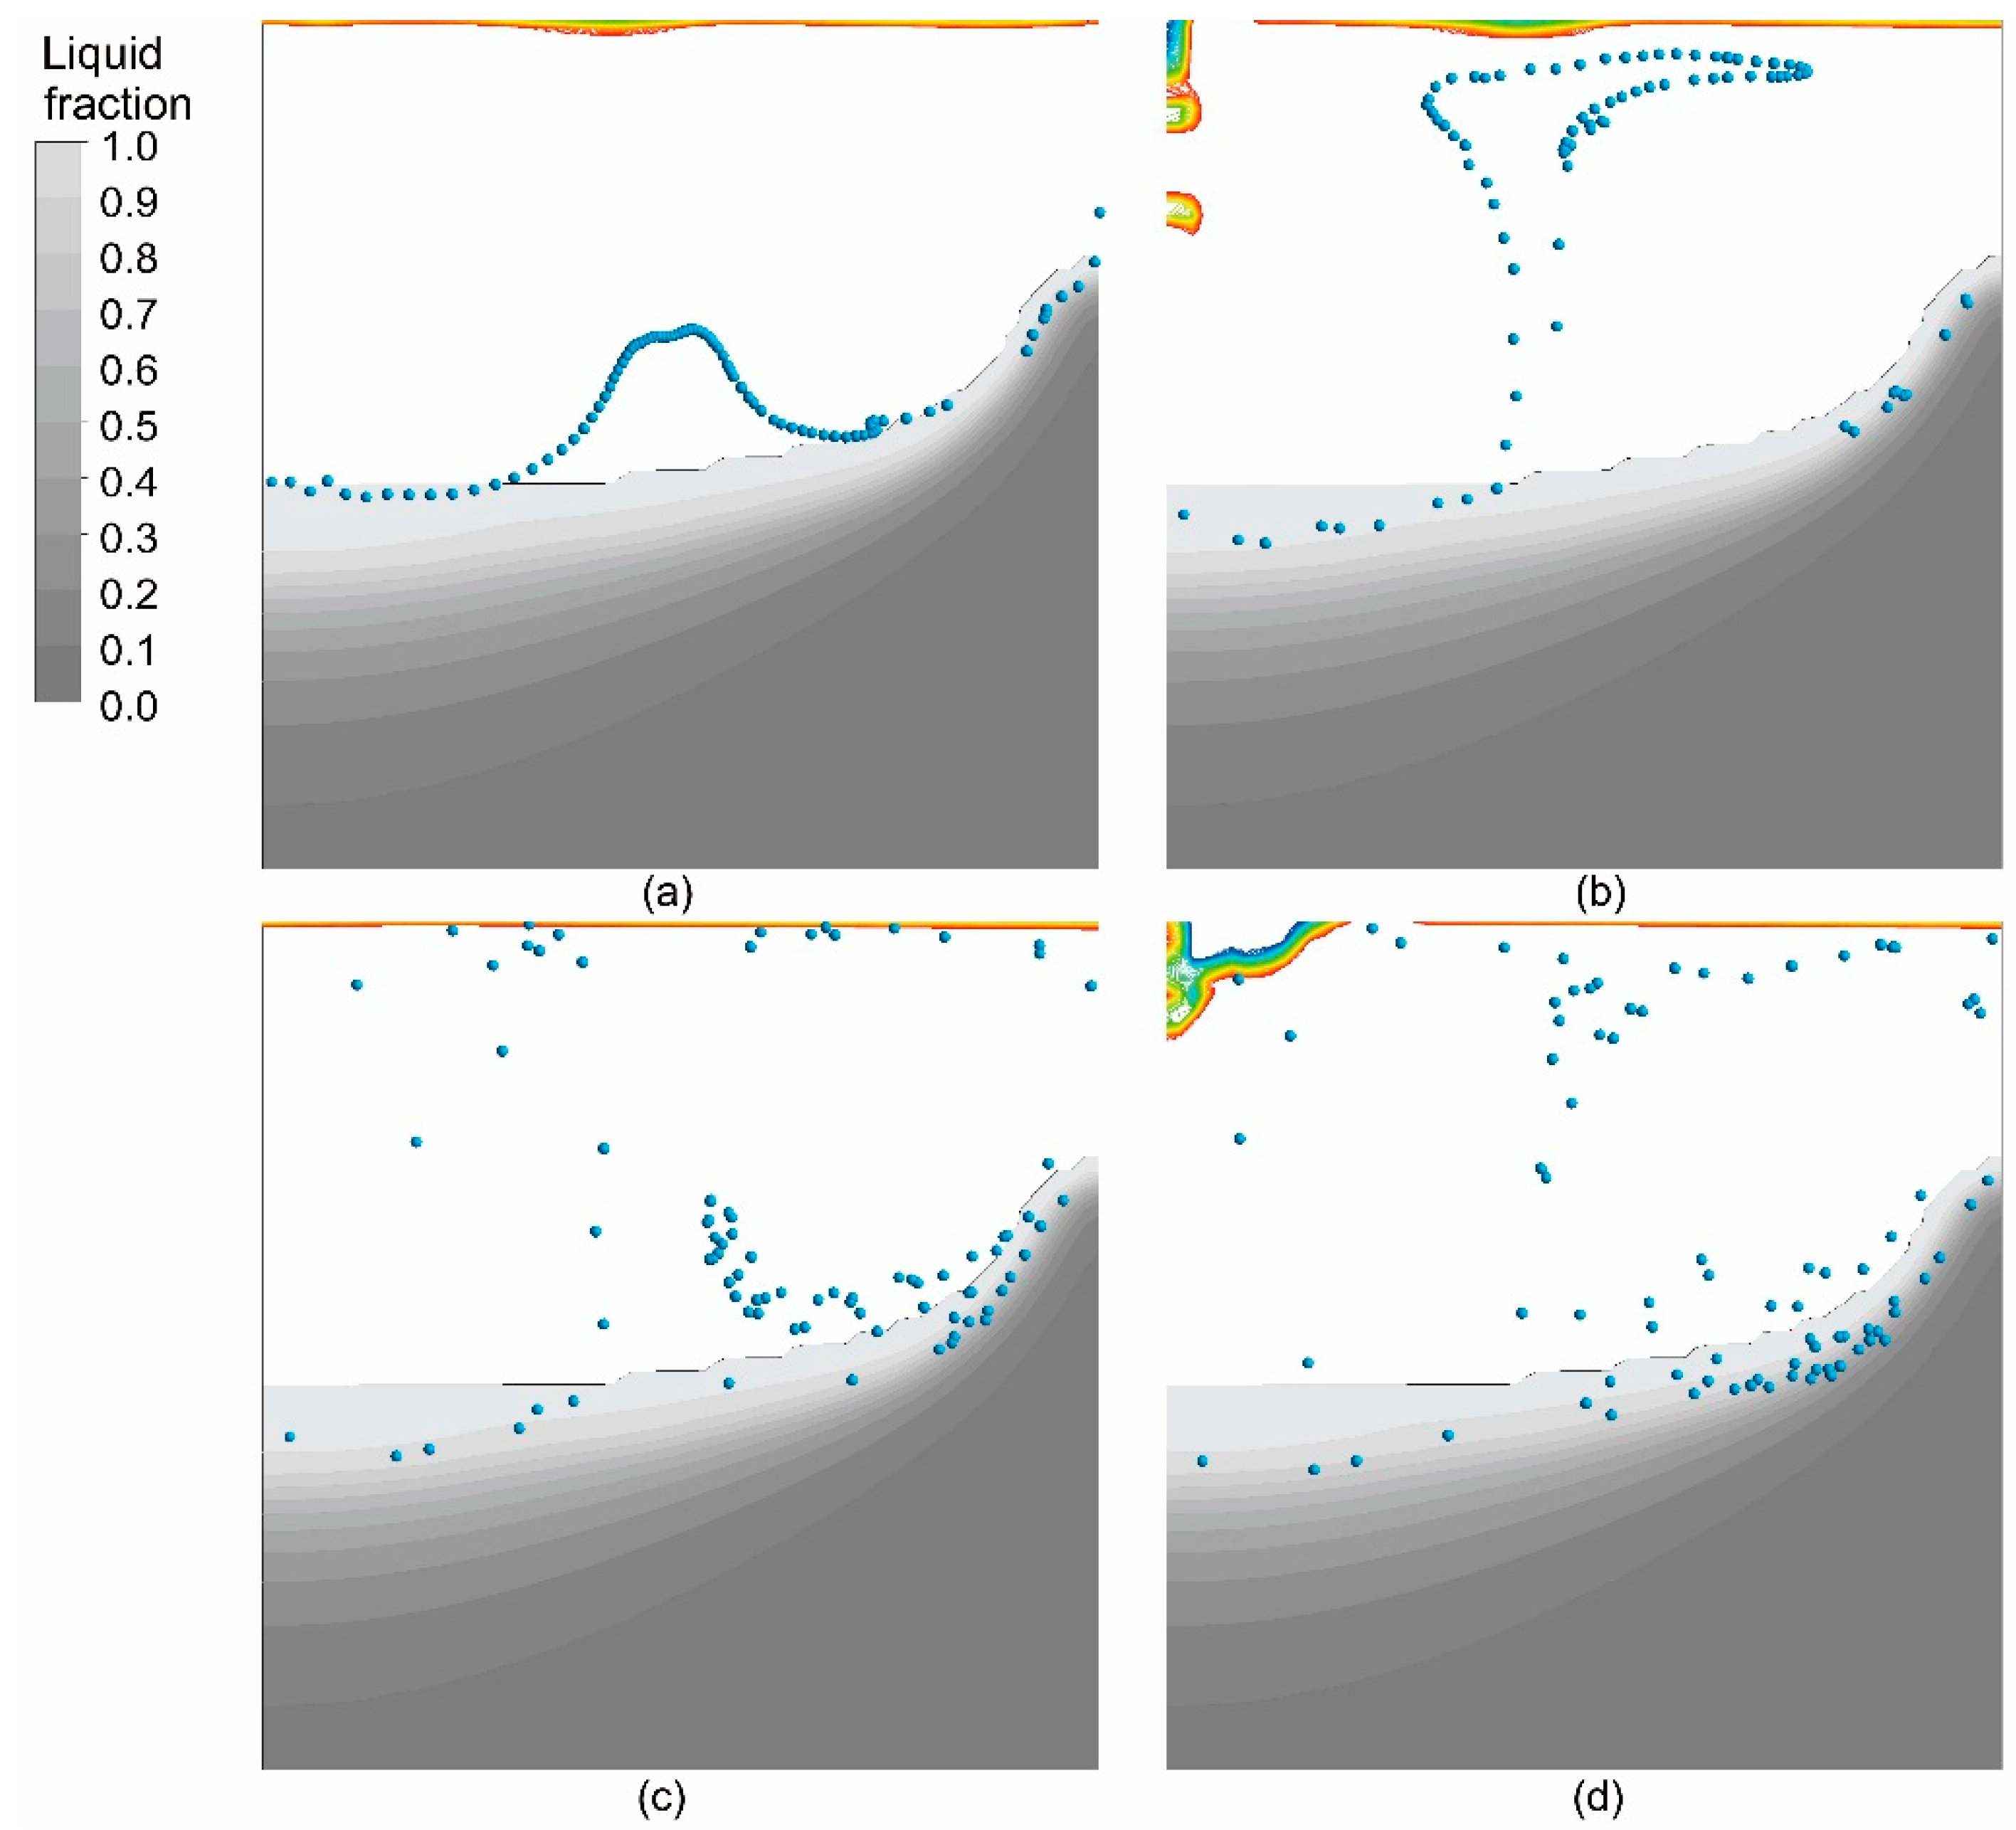
- The thermal buoyancy force plays a major role in the metal pool, and it drives a descending flow near the mold. The descending flow sweeps through the solidification front inward carrying the inclusions. A reverse smaller vortex is observed in the center. A rising flow is hence produced at 0.5 radius. The velocity decreases with the reduction of liquid fraction in the mushy zone.
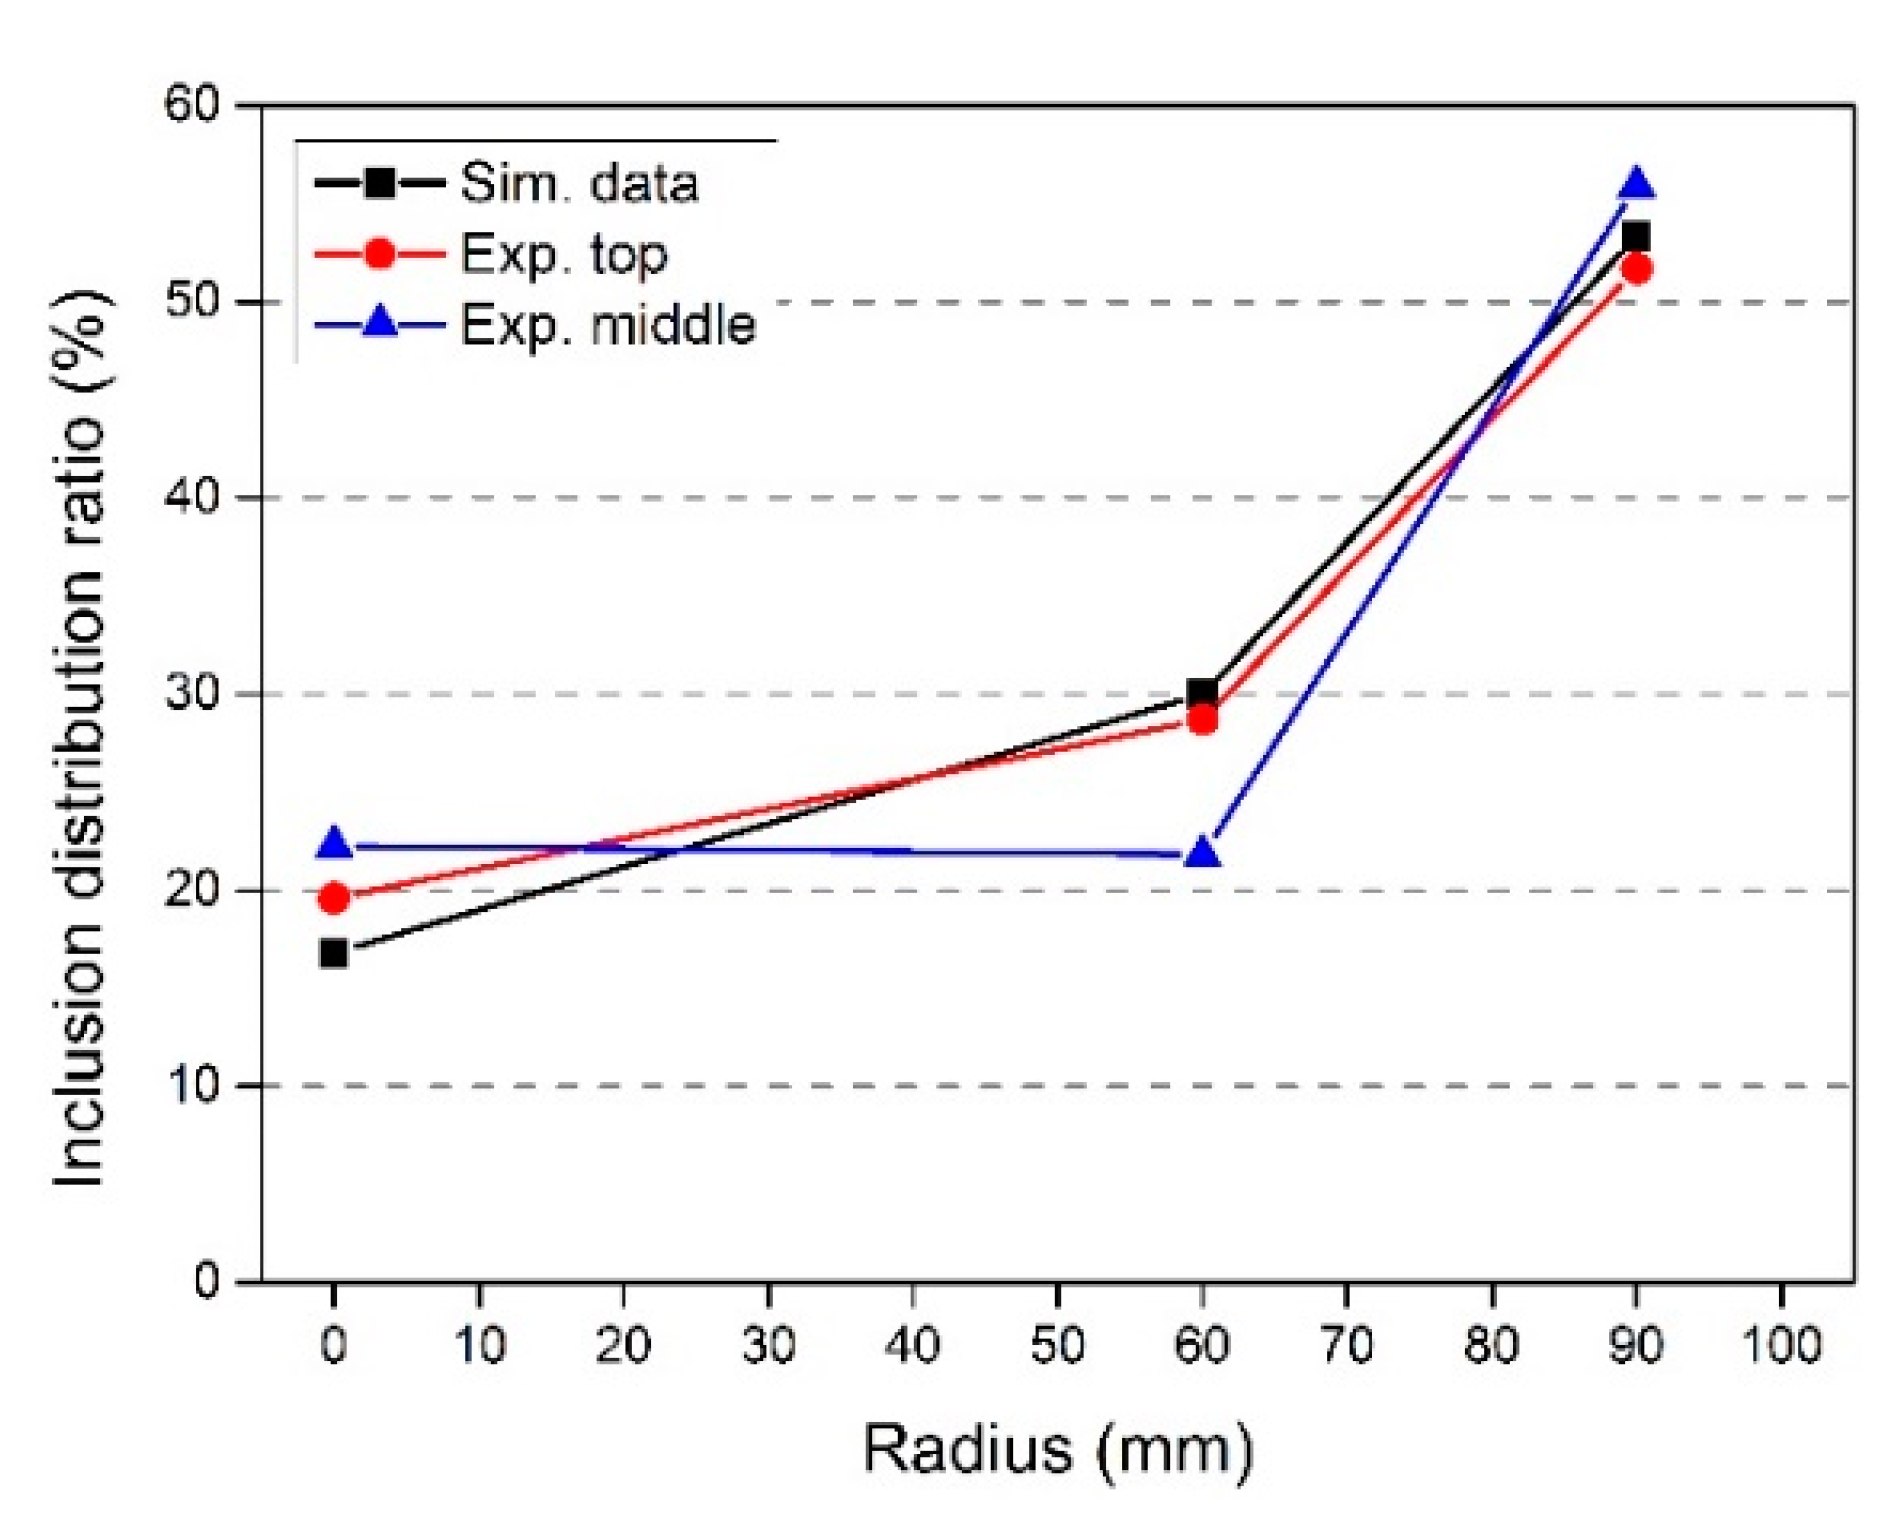
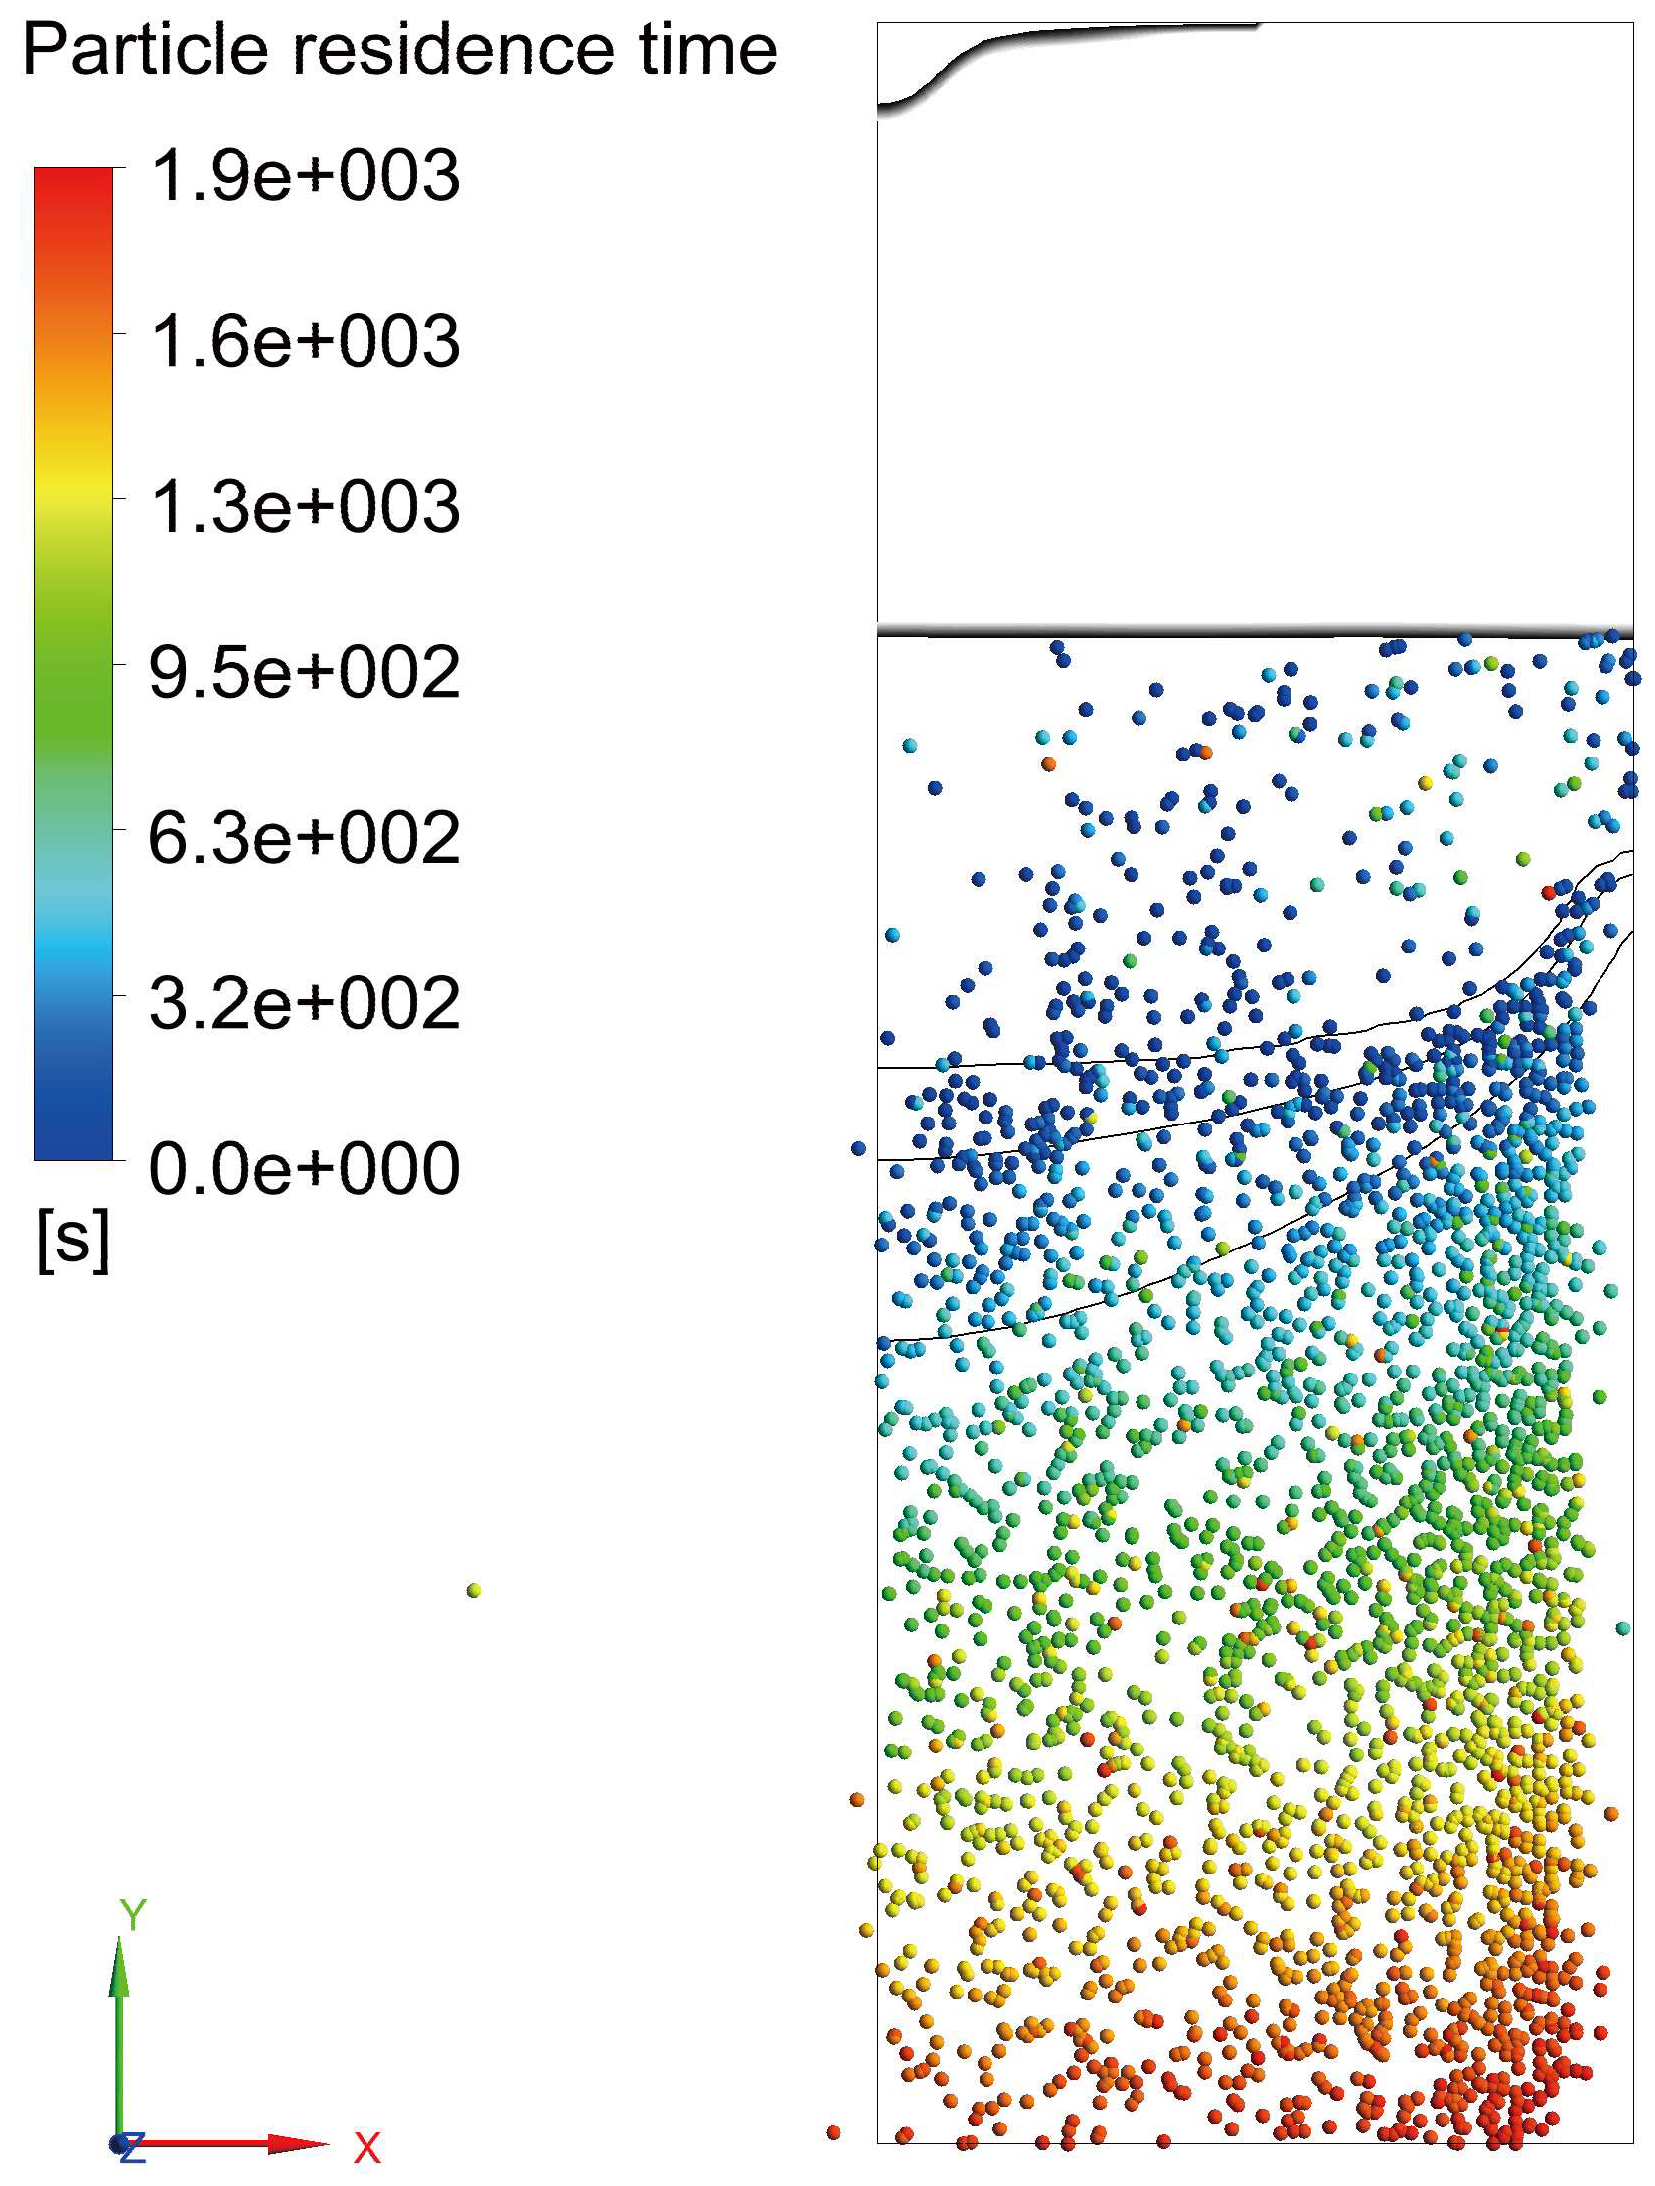
- The simulated result overall shows that the inclusion amount increases along radius. A denser distribution of inclusions is observed at the region ranging from 0.7 to 0.9 radius. A slight decrease when ranging from 0.3 to 0.4 radius is observed because of a local rising flow. Few inclusions are entrapped near the mold due to the strong descending flow. The earlier generated inclusions are mainly the distribution in the lower part of ingot, but a small proportion is still located in the upper part.
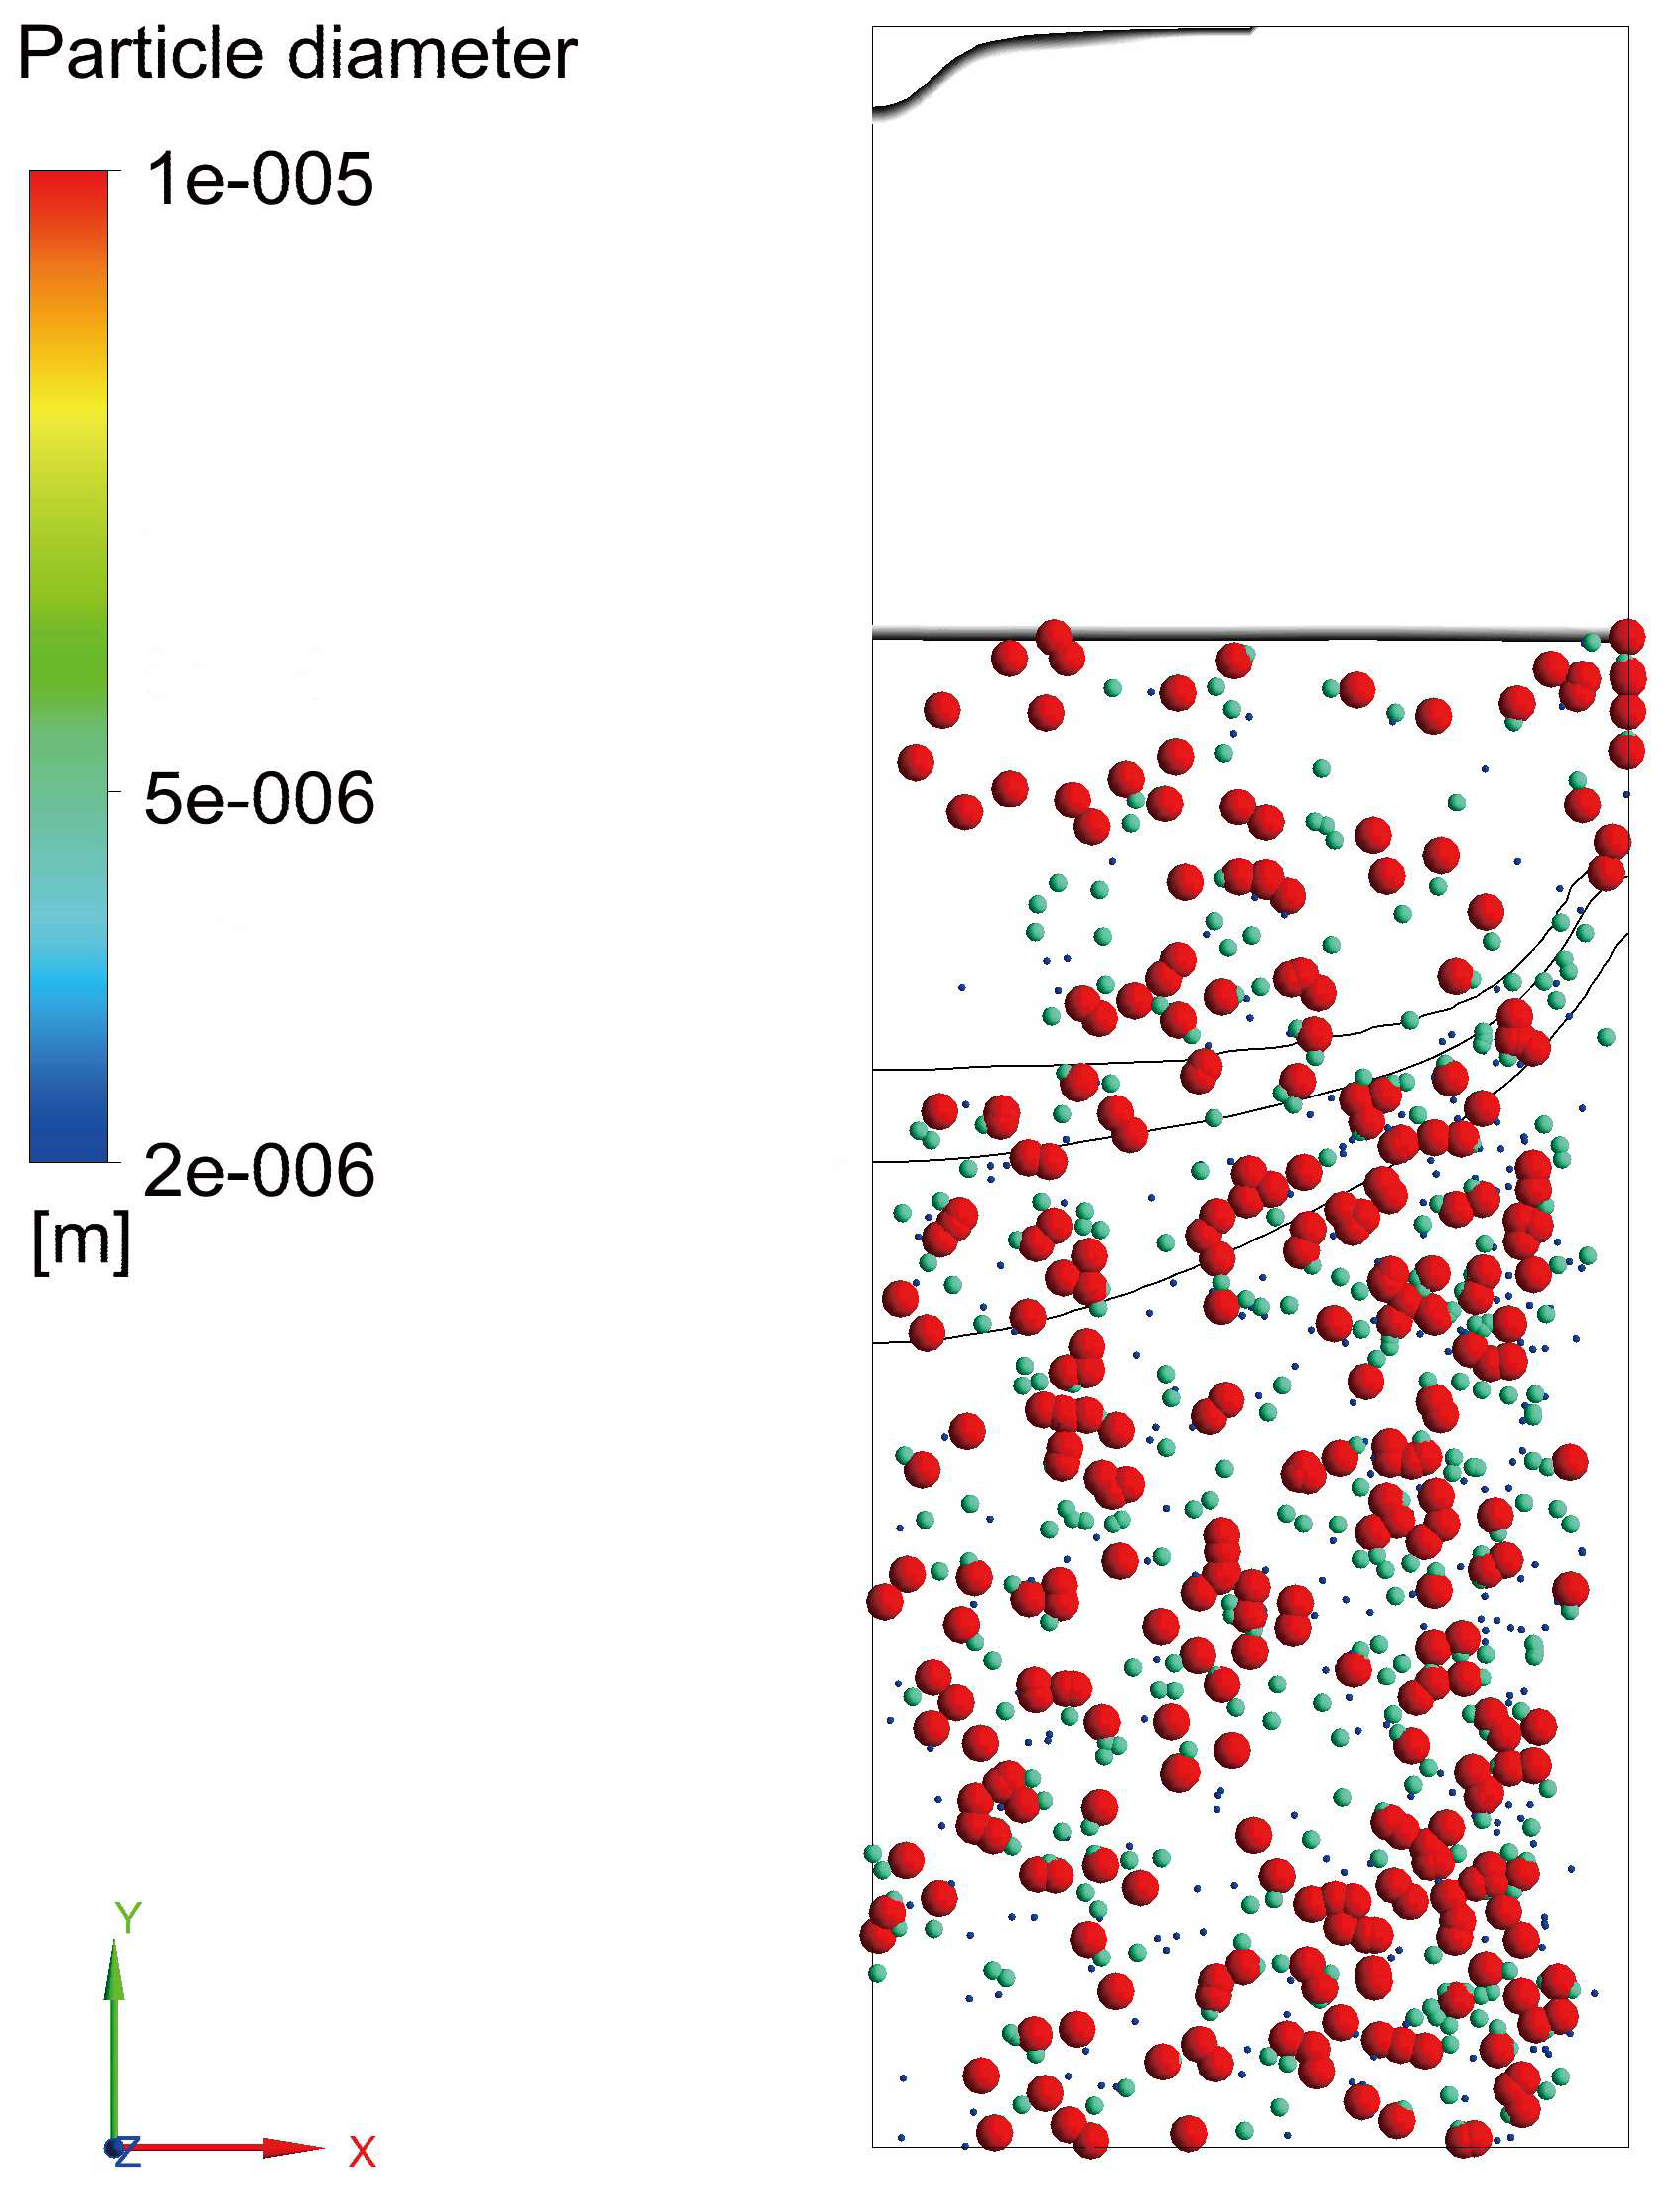
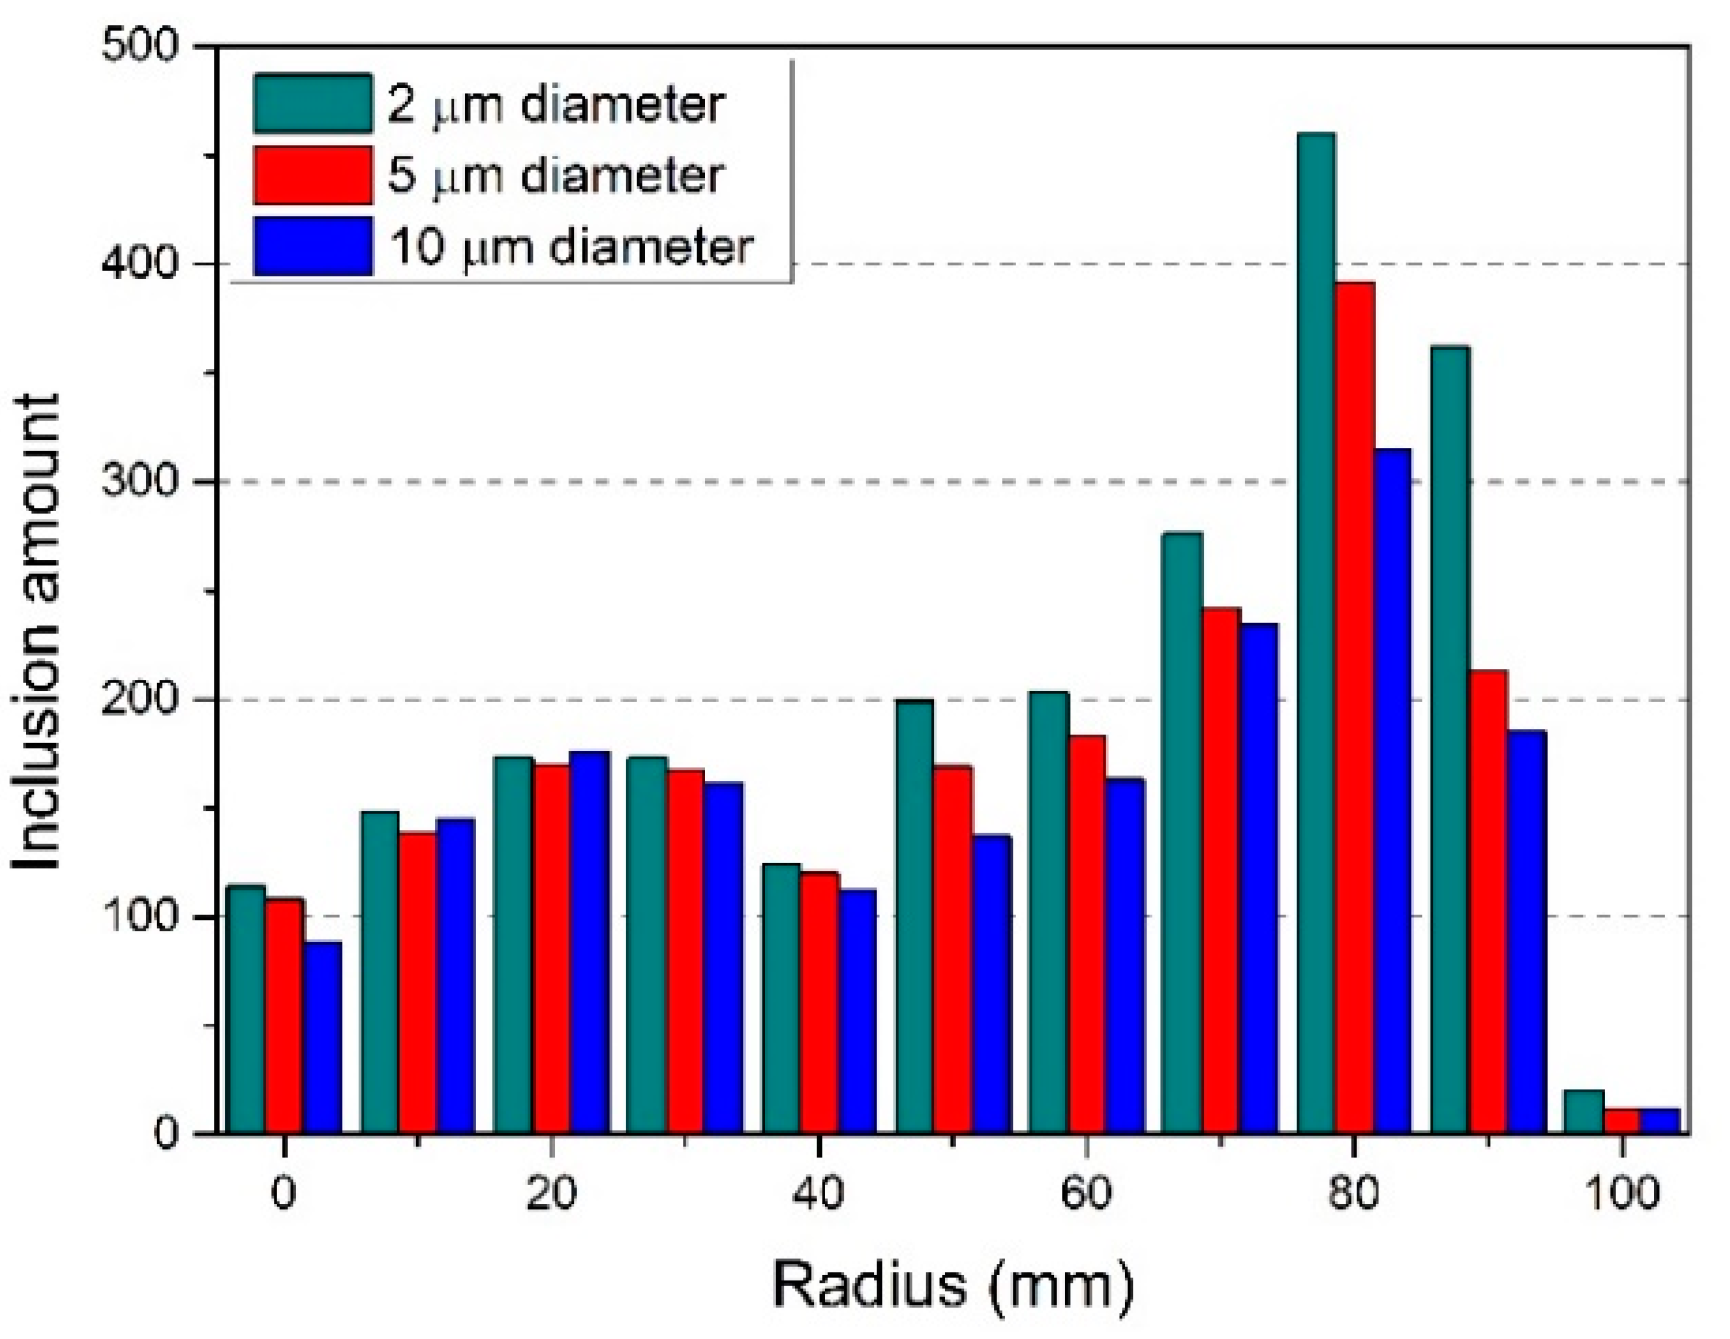
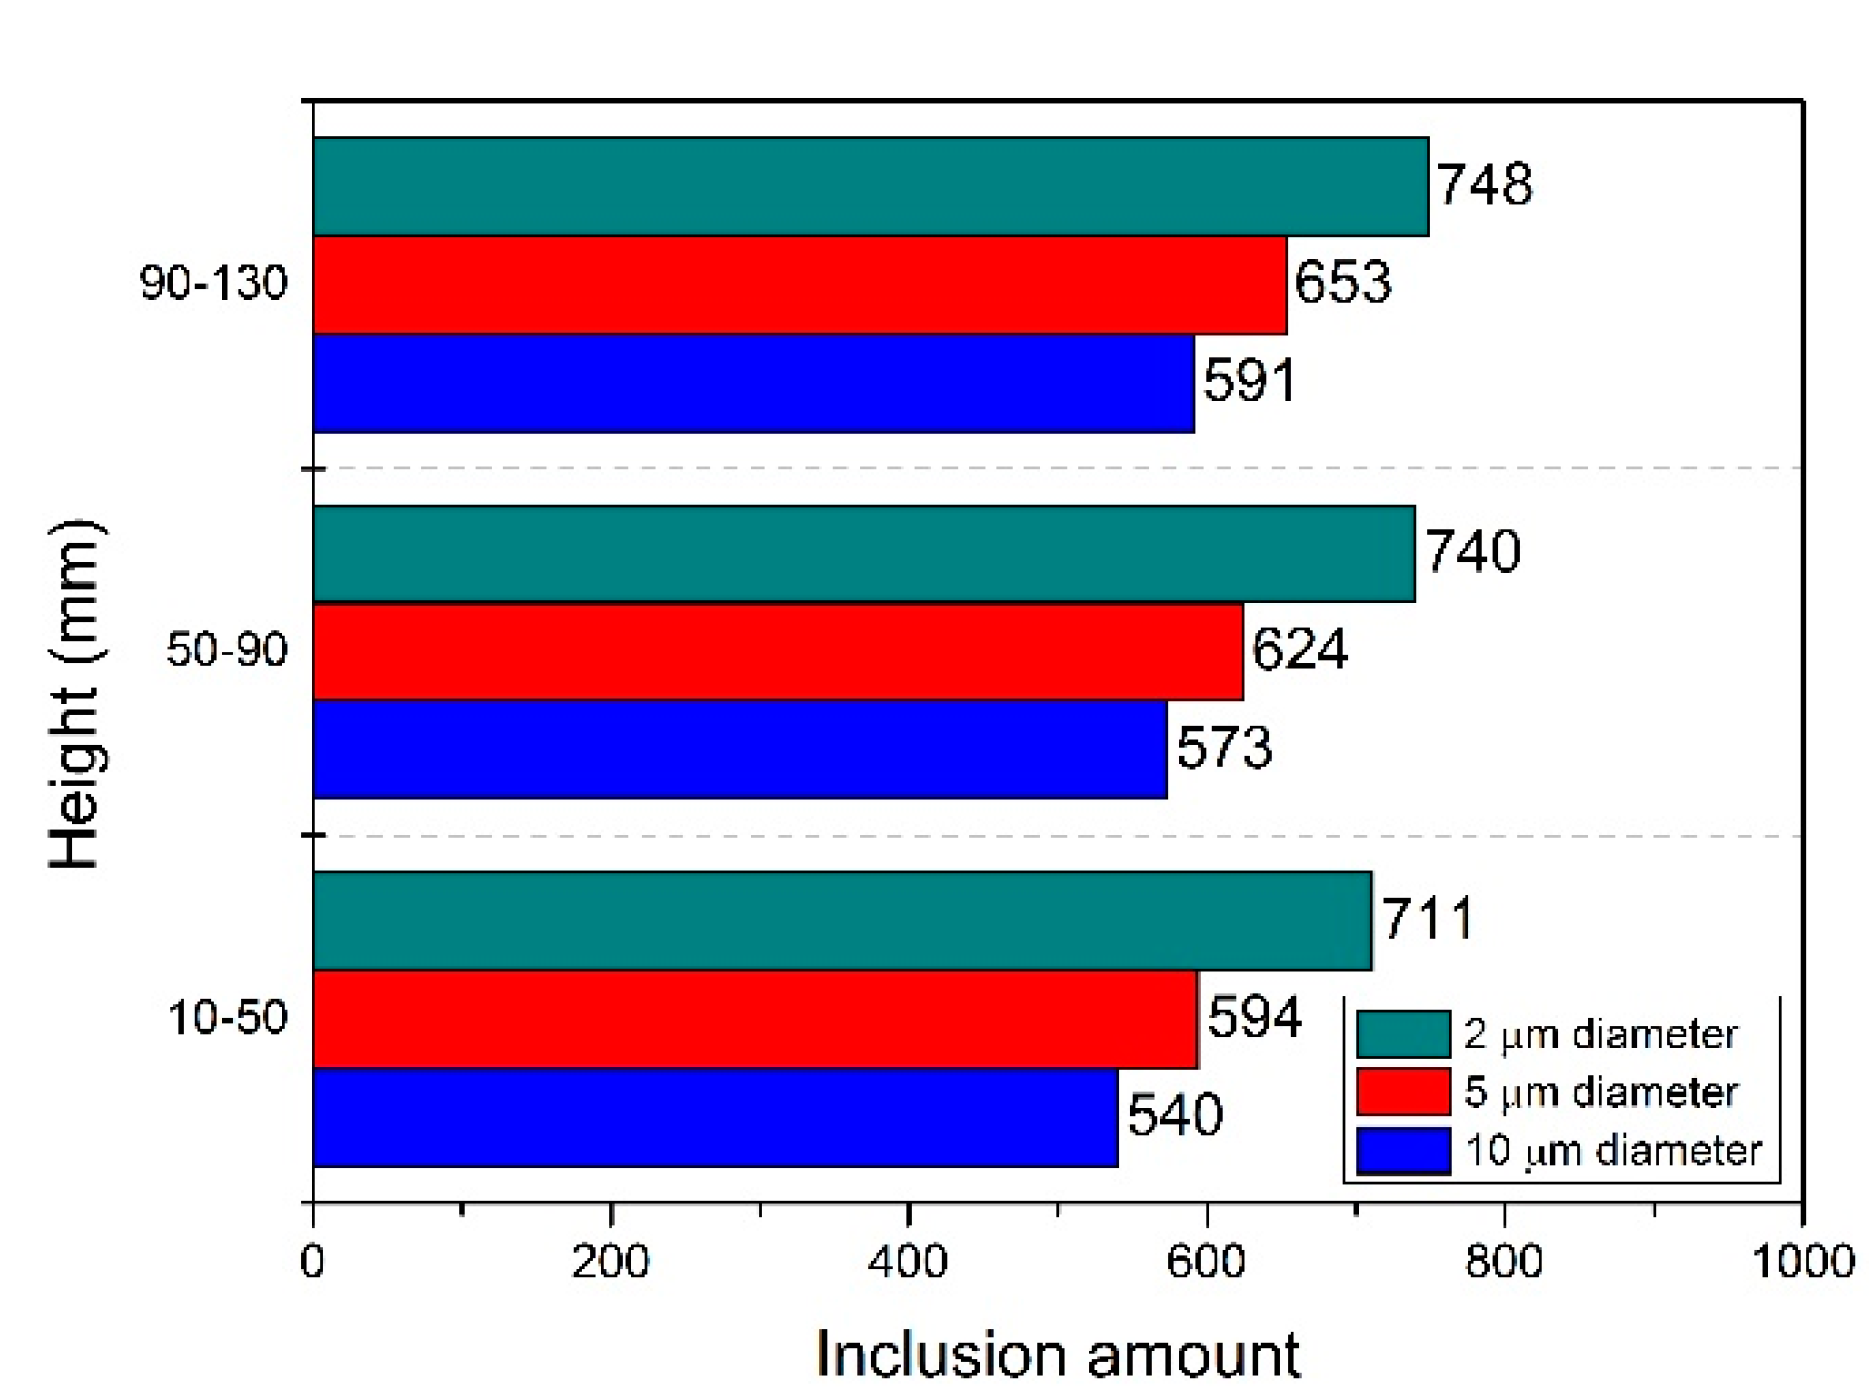
- There are no significant difference among the inclusion amount with different particle diameters in the center of ingot, but the smaller inclusions are clearly more than the larger ones at the region from 0.7 to 0.9 radius.
- The inclusion amount increases with height. The total amounts of inclusions with diameter of 2 μm, 5 μm and 10 μm in ingot are 2199, 1871, and 1704, respectively. The imposed buoyancy and floatation contribute to this phenomenon.
Author Contributions
Acknowledgments
Conflicts of Interest
Nomenclature
| magnetic potential vector (V·s/m) | |
| projected particle surface area (m2) | |
| magnetic flux density (T) | |
| solute concentration | |
| drag force coefficient | |
| corrected coefficient of Joule heating | |
| Magnus force coefficient | |
| virtual mass force model constant | |
| particle diameter (m) | |
| electric flux density (C/m2) | |
| internal energy of mixture phase (J/kg) | |
| electric field intensity (N/C) | |
| electric current frequency (Hz) | |
| liquid fraction | |
| buoyancy force (N/m3) | |
| damping force in the mushy zone (N/m3) | |
| buoyancy force (N/m3) | |
| drag force (N/m3) | |
| Lorentz force (N/m3) | |
| electromagnetic pressure force (N/m3) | |
| gravity force (N/m3) | |
| lift force (N/m3) | |
| Magnus force (N/m3) | |
| Marangoni force (N/m3) | |
| pressure gradient force (N/m3) | |
| surface tension (N/m3) | |
| virtual mass force (N/m3) | |
| gravitational acceleration (m/s2) | |
| magnetic field intensity (A/m) | |
| current density (A/m2) | |
| turbulent kinetic energy (m2/s2) | |
| effective thermal conductivity (W/(m·K)) | |
| permeability (μm) | |
| constant, 2.594 | |
| latent heat of fusion (J/kg) | |
| mass of a particle (kg) | |
| normal vector | |
| pressure (Pa) | |
| Joule heating (W/m3) | |
| source term | |
| time (s) | |
| temperature (K) | |
| liquidus temperature (K) | |
| solidus temperature (K) | |
| velocity of mixture phase (m/s) | |
| velocity of particle (m/s) | |
| Greek symbols | |
| volume fraction of metal | |
| electrical conductivity (Ω−1·m−1) | |
| surface tension (N/m3) | |
| density of mixture phase (kg/m3) | |
| electric resistance of metal (Ω·m) | |
| density of particle (kg/m3) | |
| viscosity (Pa·s) | |
| permeability of vacuum (T·m/A) | |
| vacuum permittivity (F/m) | |
| effective viscosity (Pa·s) | |
| turbulent viscosity (Pa·s) | |
| utilization rate of Joule heating for the melting of electrode | |
| characteristic length | |
| Gaussian-distributed random number | |
| electrical potential (V) | |
| relative fluid-particle angular velocity (rad/s) | |
References
- Wang, Q.Q.; Zhang, L.F.; Seetharaman, S.; Yang, S.; Yang, W.; Wang, Y. Detection of non-metallic inclusions in centrifugal continuous casting steel billets. Metall. Mater. Trans. B 2016, 47, 1594–1612. [Google Scholar] [CrossRef]
- Ludwig, A.; Kharicha, A.; Wu, M.H. Modeling of multiscale and multiphase phenomena in materials processing. Metall. Mater. Trans. B 2014, 45, 36–43. [Google Scholar] [CrossRef]
- Fu, J. An investigation of mechanism on the removal of oxide inclusions during ESR process. Acta Metall. Sin. 1979, 15, 526–539. [Google Scholar]
- Kharicha, A.; Korp, J.; Wu, M.; Ludwig, A. Investigations on the origin of radial distribution of non metallic inclusions in ESR ingot. In Proceedings of the Cleansteel 8, Budapest, Hungary, 14–16 May 2012. [Google Scholar]
- Mitchell, A. Oxide inclusion behavior during consumable electrode remelting. Ironmak. Steelmak. 1974, 1, 172–179. [Google Scholar]
- Dong, Y.W.; Jiang, Z.H.; Cao, Y.L.; Hou, D. Effect of slag on inclusions during electroslag remelting process of die steel. Metall. Mater. Trans. B 2014, 45, 1315–1324. [Google Scholar] [CrossRef]
- Yang, L.; Cheng, G.G.; Li, S.J.; Zhao, M.; Feng, G.P. Generation mechanism of TiN inclusion for GCr15SiMn during electroslag remelting process. ISIJ Int. 2015, 55, 1901–1905. [Google Scholar] [CrossRef]
- Paar, A.; Schneider, R.; Zeller, P.; Reiter, G.; Paul, S.; Würzinger, P. Effect of electrical parameters on type and content of non-metallic inclusions after electro-slag-remelting. Steel Res. Int. 2014, 85, 570–578. [Google Scholar] [CrossRef]
- Ludwig, A.; Wu, M.H.; Kharicha, A. Simulation in metallurgical processing: Recent developments and future perspectives. JOM 2016, 160, 1–7. [Google Scholar] [CrossRef]
- Kelkar, K.M.; Patankar, S.V.; Srivatsa, S.K.; Minisandram, R.S.; Evans, D.G.; de Barbadillo, J.J.; Smith, R.H.; Helmink, R.C.; Mitchell, A.; Sizek, H.A. Computational modeling of electroslag remelting (ESR) process used for the production of high-performance alloys. In Proceedings of the International Symposium on Liquid Metal Processing and Casting, Austin, TX, USA, 22–25 September 2013. [Google Scholar]
- Kharicha, A.; Karimi-Sibaki, E.; Wu, M.H.; Ludwig, A. Review on modeling and simulation of electroslag remelting. Steel Res. Int. 2018, 89, 11–30. [Google Scholar] [CrossRef]
- Weber, V.; Jardy, A.; Dussoubs, B.; Ablitzer, D.; Ryberon, S.; Schmitt, V.; Hans, S.; Poisson, H. A comprehensive model of the electroslag remelting process: Description and validation. Metall. Mater. Trans. B 2009, 40, 271–280. [Google Scholar] [CrossRef]
- Choudhary, M.; Szekely, J. The effect of temperature dependent electrical conductivity on flow and temperature fields in slags in ESR systems. Metall. Trans. B 1981, 12, 418–421. [Google Scholar] [CrossRef]
- Dilawari, A.H.; Szekely, J.; Eagar, T.W. Electromagnetically and thermally driven flow phenomena in electroslag welding. Metall. Trans. B 1978, 9, 371–381. [Google Scholar] [CrossRef]
- Karimi-Sibaki, E.; Kharicha, A.; Bohacek, J.; Wu, M.H.; Ludwig, A. A dynamic mesh-based approach to model melting and shape of an ESR electrode. Metall. Mater. Trans. B 2015, 46, 2049–2061. [Google Scholar] [CrossRef]
- Wang, Q.; He, Z.; Li, G.Q.; Li, B.K.; Zhu, C.Y.; Chen, P.J. Numerical investigation of desulfurization behavior in electroslag remelting process. Int. J. Heat Mass Trans. 2017, 104, 943–951. [Google Scholar] [CrossRef]
- Brackbill, J.U.; Kothe, D.B.; Zemach, C. A continuum method for modeling surface tension. J. Comput. Phys. 1992, 100, 335–354. [Google Scholar] [CrossRef]
- Singh, A.K.; Basu, B.; Ghosh, A. Role of appropriate permeability model on numerical prediction of macrosegregation. Metall. Mater. Trans. B 2006, 37, 799–809. [Google Scholar] [CrossRef]
- Hirt, C.W.; Nichols, B.D. Volume of fluid (VOF) method for the dynamics of free boundaries. J. Comput. Phys. 1981, 39, 201–225. [Google Scholar] [CrossRef]
- Huang, X.C.; Li, B.K.; Liu, Z.Q. A coupled mathematical model of oxygen transfer in electroslag remelting process. Int. J. Heat Mass Tran. 2018, 120, 458–470. [Google Scholar] [CrossRef]
- Wang, Q.; He, Z.; Li, G.Q.; Li, B.K. Numerical investigation on species transport in electroslag remelting dual alloy ingot. Appl. Therm. Eng. 2016, 103, 419–427. [Google Scholar] [CrossRef]
- Ni, J.; Incropera, F.P. Extension of the continuum model for transport phenomena occurring during metal alloy solidification-Ι. The conservation equations. Int. J. Heat Mass Tran. 1995, 38, 1271–1284. [Google Scholar] [CrossRef]
- Schneider, M.C.; Beckermann, C. Formation of macrosegregation by multicomponent thermosolutal convection during the solidification of steel. Metall. Mater. Trans. A 1995, 26, 2373–2388. [Google Scholar] [CrossRef]
- Fezi, K.; Yanke, J.; Krane, M.J.M. Macrosegregation during electroslag remelting of alloy 625. Metall. Mater. Trans. B 2015, 46, 766–779. [Google Scholar] [CrossRef]
- Kumar, A.; Založnik, M.; Combeau, H. Study of the influence of mushy zone permeability laws on macro- and meso-segregations predictions. Int. J. Therm. Sci. 2012, 54, 33–47. [Google Scholar] [CrossRef]
- Li, L.M.; Li, B.K.; Liu, Z.Q. Modeling of spout-fluidized beds and investigation of drag closures using OpenFOAM. Powder Technol. 2017, 305, 364–376. [Google Scholar] [CrossRef]
- Thomas, B.G.; Yuan, Q.; Mahmood, S.; Liu, R.; Chaudhary, R. Transport and entrapment of particles in steel continuous casting. Metall. Mater. Trans. B 2014, 45, 22–35. [Google Scholar] [CrossRef]
- Zhang, L.F.; Aoki, J.; Thomas, B.G. Inclusion removal by bubble flotation in a continuous casting mold. Metall. Mater. Trans. B 2006, 37, 361–379. [Google Scholar] [CrossRef]
- Sun, X.S.; Sakai, M. Three-dimensional simulation of gas-solid-liquid flows using the DEM-VOF method. Chem. Eng. Sci. 2015, 134, 531–548. [Google Scholar] [CrossRef]
- Wang, Q.; Squires, K.D.; Chen, M.; Mclaughlin, J.B. On the role of the lift force in turbulence simulations of particle deposition. Int. J. Multiphase Flow 1997, 23, 749–763. [Google Scholar] [CrossRef]
- Guo, D.; Irons, G.A. Modeling of gas-liquid reactions in ladle metallurgy: Part II. Numerical simulation. Metall. Mater. Trans. B 2000, 31, 1457–1464. [Google Scholar] [CrossRef]
- Takahashi, K.; Taniguchi, S. Electromagnetic separation of nonmetallic inclusion from liquid metal by imposition of high frequency magnetic field. ISIJ Int. 2003, 43, 820–827. [Google Scholar] [CrossRef]
- Rubinow, S.I.; Keller, J.B. The transverse force on a spinning sphere moving in a viscous fluid. J. Fluid Mech. 1961, 11, 447–459. [Google Scholar] [CrossRef]
- Mukai, K.; Lin, W. Motion of small particles in solution with a interfacial tension gradient and engulfment of the particles by solidifying interface. Tetsu to Hagane 1994, 80, 35–40. [Google Scholar] [CrossRef]
- Yamazaki, M.; Natsume, Y.; Harada, H.; Ohsasa, K. Numerical simulation of solidification structure formation during continuous casting in Fe-0.8 mass% C alloy using cellular automaton method. ISIJ Int. 2006, 46, 903–908. [Google Scholar] [CrossRef]
- Kharicha, A.; Ludwig, A.; Wu, M.H. On melting of electrodes during electro-slag remelting. ISIJ Int. 2014, 54, 1621–1628. [Google Scholar] [CrossRef]
- Mithcell, A.; Joshi, S. The thermal characteristics of the electroslag process. Metall. Trans. B 1973, 4, 631–642. [Google Scholar]
- Mitchell, A. Solidification in remelting processes. Mater. Sci. Eng. A 2005, 413, 10–18. [Google Scholar] [CrossRef]
- Wang, Q.; Gosselin, L.; Li, B.K. Effect of rotating electrode on magnetohydrodynamic flow and heat transfer in electroslag remelting process. ISIJ Int. 2014, 54, 2821–2830. [Google Scholar] [CrossRef]
- Dilawari, A.H.; Szekely, J. Heat transfer and fluid flow phenomena in electroslag refining. Metall. Trans. B 1978, 9, 77–87. [Google Scholar] [CrossRef]


| Parameter | Value |
|---|---|
| Physical properties of metal | |
| Density, kg/m3 | 7700 |
| Viscosity, Pa·s | 0.0061 |
| Specific heat, J/kg·K | 752 |
| Thermal conductivity, W/m·K | 30.5 |
| Electric conductivity, Ω−1·m−1 | 7.14 × 10⁵ |
| Magnetic permeability, H/m | 1.257 × 10⁻⁶ |
| Liquidus/Solidus, K | 1707/1632 |
| Latent heat of fusion, kJ/kg | 270 |
| Thermal coefficient of cubical expansion, K−1 | 2 × 10⁻⁴ |
| Physical properties of slag | |
| Density, kg/m3 | 2800 |
| Viscosity, Pa·s | 0.0025 |
| Specific heat, J/kg·K | 1255 |
| Thermal conductivity, W/m·K | 10.5 |
| Electric conductivity, Ω−1·m−1 | |
| Magnetic permeability, H/m | 1.257 × 10⁻⁶ |
| Thermal coefficient of cubical expansion, K−1 | 1 × 10⁻⁴ |
| Operating condition | |
| Current, A | 3100 |
| Frequency, Hz | 50 |
| Inclusion diameter, μm | 2, 5, 10 |
© 2018 by the authors. Licensee MDPI, Basel, Switzerland. This article is an open access article distributed under the terms and conditions of the Creative Commons Attribution (CC BY) license (http://creativecommons.org/licenses/by/4.0/).
Share and Cite
Huang, X.; Li, B.; Liu, Z.; Li, X.; Sun, M. Numerical Investigation and Experimental Validation of Motion and Distribution of Nonmetallic Inclusions in Argon Protection Electroslag Remelting Process. Metals 2018, 8, 392. https://doi.org/10.3390/met8060392
Huang X, Li B, Liu Z, Li X, Sun M. Numerical Investigation and Experimental Validation of Motion and Distribution of Nonmetallic Inclusions in Argon Protection Electroslag Remelting Process. Metals. 2018; 8(6):392. https://doi.org/10.3390/met8060392
Chicago/Turabian StyleHuang, Xuechi, Baokuan Li, Zhongqiu Liu, Xianglong Li, and Meijia Sun. 2018. "Numerical Investigation and Experimental Validation of Motion and Distribution of Nonmetallic Inclusions in Argon Protection Electroslag Remelting Process" Metals 8, no. 6: 392. https://doi.org/10.3390/met8060392