Article

DFT Study of Azole Corrosion Inhibitors on Cu2O Model of Oxidized Copper Surfaces: I. Molecule–Surface and Cl–Surface Bonding

1
Department of Physical and Organic Chemistry, Jožef Stefan Institute, Jamova 39, SI-1000 Ljubljana, Slovenia
2
Faculty of Chemisty and Chemical Technology, University of Ljubljana, Večna pot 113, SI-1000 Ljubljana, Slovenia
*
Author to whom correspondence should be addressed.
Metals 2018, 8(5), 310; https://doi.org/10.3390/met8050310
Submission received: 21 February 2018 / Revised: 16 April 2018 / Accepted: 20 April 2018 / Published: 1 May 2018
(This article belongs to the Special Issue Corrosion Inhibition)

Abstract

:
The adsorption of three simple azole molecules—imidazole, triazole, and tetrazole—and Cl on various sites of several Cu 2 O(111)- and Cu 2 O(110)-type surfaces, including Cu and O vacancies, was characterized using density functional theory (DFT) calculations; the three molecules can be seen as models of azole corrosion inhibitors and Cl as a corrosion activator. Both non-dissociative and dissociative adsorption modes were considered for azole molecules; the latter involves the N–H bond cleavage, hence we also addressed the adsorption of H, which is a co-product of the dissociative adsorption. We find that molecules and Cl bind much stronger to unsaturated Cu sites compared to saturated ones. Dissociated molecules bind considerably stronger to the surface compared to the intact molecules, although even the latter can bind rather strongly to specific unsaturated Cu sites. Bader analysis reveals that binding energies of dissociated molecules at various Cu sites correlate with Bader charges of Cu ions before molecular adsorption, i.e., the smaller the Cu charge, the stronger the molecular bonding. All three azole molecules display similar non-dissociative adsorption energies, but significant difference between them appears for dissociative adsorption mode, i.e., dissociated triazole and tetrazole bind much stronger than dissociated imidazole because the former two can form two strong N–Cu bonds, but imidazole cannot due to its incompatible molecular geometry. Dissociative adsorption is consequently favorable only for triazole and tetrazole, but only at oxygen vacancy sites, where it proceeds barrierlessly (or almost so). This observation may suggest that, for imidazole, only the neutral form, but, for triazole and tetrazole, also their deprotonated forms are the active species for inhibiting corrosion under near neutral pH conditions, where copper surfaces are expected to be oxidized. As for the comparison with the Cl–surface bonding, the calculations indicate that only dissociated triazole and tetrazole bind strong enough to rival the Cl–surface bonds.

1. Introduction

Some organic molecules are well known for their ability to slow down the corrosion of metals. Among them, azoles—five-membered heterocyclic molecules containing one or more nitrogen atoms—are well known as corrosion inhibitors for copper [1,2,3,4]. Although the mechanism by which organic molecules inhibit corrosion is usually not known, it is nevertheless widely accepted that strong adsorption of inhibitor molecules represents an important step in achieving the inhibitory effect. Indeed, Bockris stated that organic molecules must be adsorbed to become inhibitors [5]. From this point of view, it is therefore important to characterize the molecule–surface bonding in the context of corrosion inhibition. It is here where density functional theory (DFT) based first-principle modeling, utilizing the periodic slab representation of the surface, can provide useful information and consequently helps opening a way towards a more rational design of new corrosion inhibitors [6,7,8,9]. It should be noted, though, that the inhibitor–surface bonding itself is far from synonymous with inhibition of corrosion. Instead, it represents only one aspect towards an atomic-scale understanding of corrosion protection mechanisms. For a more thorough approach, which involves a deconstruction of various relevant elements and their integration into a multiscale model, see the recent paper of Taylor et al. [10]. Another promising approach, aimed towards the rational design of new corrosion inhibitors, utilizes machine-learning methods (e.g., see the recent review of Winkler [11]), with which it is possible to generate reasonably robust and predictive quantitative models, but the success comes at the expense of much lower mechanistic insight compared to computationally intensive physics-based methods [12,13].
This paper is Part I of a two-part article series (for Part II, see ref [14]) that represents the continuation of the research of our group on the characterization of the adsorption of imidazole, triazole, and tetrazole—used as archetypal models of azole corrosion inhibitors—on copper surfaces by means of DFT calculations as to provide an atomic-scale insight into the chemistry of azole–copper bonding. Molecular structures of imidazole, triazole, and tetrazole are shown in Scheme 1. In previous publications, the adsorption of these molecules was characterized on metallic Cu(111) [15,16] as well as on Cu 2 O(111) [17]. It was shown that neutral molecules bind weakly to Cu(111) via unsaturated N heteroatoms through σ -type bonding and the magnitude of adsorption energy decreases from imidazole to tetrazole. In contrast to neutral molecules, deprotonated molecules bind strongly to Cu(111). This is particularly true for triazole and tetrazole, which form two strong N–Cu bonds, whereas imidazole cannot due to steric reasons associated with its molecular geometry. This observation suggested that, for imidazole, the neutral form and, for triazole and tetrazole, their deprotonated forms are the active species for inhibiting corrosion [16]. Experimental measurements partly supported this inference [18]. However, oxide-free copper surfaces are more relevant at acidic pH, but, under other conditions, copper surfaces are often oxidized [19]. To this end, we have chosen Cu 2 O as a model of the oxidized copper surface and, in our previous publication [17], we characterized the non-dissociative adsorption of these molecules on Cu 2 O(111) and Cu 2 O(111)-w/o-Cu CUS surfaces. In the current two-part article series, we extend that study in two ways: first, we consider additional Cu 2 O surfaces and, secondly, we also consider the feasibility of dissociative adsorption that results from the cleavage of the N1–H bond upon adsorption; this mode of adsorption was not considered in our previous publication.
The following Cu 2 O surfaces are considered within the current two-part article series: (i) Cu 2 O(111); (ii) Cu 2 O(111) w / o +1Cu CUS ; (iii) Cu 2 O(111)-w/o-Cu CUS ; (iv) Cu 2 O(111)-recon-( 3  ×  3 )R30 ; (v) Cu 2 O(110):CuO; and (vi) Cu 2 O(110):CuO-w-Ovac. These surface models along with the logic behind their labels are described below in technical Section 2.3, while their structures are shown in Figure 1 and Figure 2. Among them, only the surface model (i) is stoichiometric, while the rest are non-stoichiometric. The choice of the currently utilized surface models was motivated by considering stability issues of pristine and molecularly covered surfaces. The stability of various Cu 2 O surfaces in oxygen atmosphere was characterized in detail by Soon et al. [20,21] by means of DFT-GGA calculations. The Cu 2 O(111)-w/o-Cu CUS and Cu 2 O(110):CuO surfaces were found to be the stablest; the former under oxygen-lean and the latter under oxygen-rich conditions. The scanning tunneling microscopy (STM) study of Önsten et al. [22] seems to have identified the Cu 2 O(111)-w/o-Cu CUS structure (according to their nomenclature, this surface was labeled as model B of the ( 1 × 1 ) terminated surface). In addition, they also observed the ( 3  ×  3 )R30 reconstructed Cu 2 O(111) surface, which contains one-third of a monolayer of ordered oxygen vacancies, and proposed two surface models: model A, which contains only oxygen-vacancies, and model B, which contains also copper vacancies (this model is currently designated as Cu 2 O(111)-recon-( 3  ×  3 )R30 ). On the basis of combined experimental–computational study of methanol dehydrogenation on ( 3  ×  3 )R30 reconstructed Cu 2 O(111), Besharat et al. [23] recently argued in favor of model B, but then the same group of authors also showed that adsorption data of SO 2 strongly suggest model A with the corollary that the surface likely consists of mixture of A and B phases [24]. However, it should be noted that adsorbates can alter the stability of surfaces—a clear example is shown in Part II [14]—hence it is questionable whether one can reliably deduce the structure (or stability) of bare surfaces on the basis of adsorption data.
Recently, Nilius et al. [25] drew attention to the well-known drawback of GGA, which underestimates band gaps and fails to correctly reproduce absolute positions of the band-edges. They showed that GGA too strongly favors non-stoichiometric Cu 2 O(111)-w/o-Cu CUS against stoichiometric Cu 2 O(111), i.e., GGA predicted cost of non-stoichiometry is too small. Using the HSE hybrid functional, they showed, in agreement with their STM experiments, that stoichiometric Cu 2 O(111) becomes more stable than Cu 2 O(111)-w/o-Cu CUS under oxygen-lean conditions. Although we currently use the GGA approach, which is susceptible to the aforementioned problem (it should be noted that even GGA+U does not perform well for Cu 2 O [26], see Appendix A), we nevertheless find that the stoichiometric Cu 2 O(111) surface is stabilized by adsorbed species—i.e., energetic deficiency of coordinatively unsaturated Cu ions is compensated by their stronger bonding to adsorbates.
In the current Part I, we focus on the molecule–surface bonding as well as on the feasibility of dissociative adsorption at various sites on Cu 2 O surfaces, including the O vacancy sites, and compare the adsorption bonding of azole molecules as corrosion inhibitors to that of chloride as a prototype corrosion activator. In Part II [14], we address intermolecular lateral interactions and thermodynamic stability of identified adsorption structures by means of two-dimensional phase diagrams. Due to obvious modeling reasons, the adsorption is considered at a solid/vacuum interface, although, in the context of corrosion inhibition, it would be more appropriate to consider adsorption at a solid/water interface.

2. Technical Details and Definitions

2.1. Computational Details

DFT calculations were performed with the generalized gradient approximation (GGA) of Perdew–Burke–Ernzerhof (PBE) [28]. This choice is motivated on the one hand by the observation that the GGA+U method, which is often used for the description of transition-metal oxides, does not substantially improve the band-gap of Cu 2 O [26,29] and on the other hand by the fact that hybrid functionals (e.g., HSE) are computationally way too expensive for our available resources. In order to have some idea on how the +U correction would affect the results, we provide some comparison between the PBE and PBE+U methods in Appendix A.
The pseudopotential method with ultrasoft pseudopotentials (US-PP) was used [30,31]. The Kohn–Sham orbitals were expanded in a plane-wave basis set up to a kinetic energy cutoff of 30 Ry (240 Ry for the charge density cutoff). Brillouin zone (BZ) integrations were performed employing the special-point technique [32] using Marzari–Vanderbilt cold smearing [33] of 0.01 Ry. All calculations were done using the PWscf code from the Quantum ESPRESSO distribution [34,35], whereas visualization and molecular graphics were produced by the XCRYSDEN graphical package [36].

2.2. Cu 2 O as a Model of Oxidized Copper Surface

In compliance with our previous publication [17], we used Cu 2 O slabs without a metal support underneath as a model of oxidized copper surfaces. Such models are appropriate for cases where the oxide layer on top of metal is not ultrathin (note that the reactivity of few Å thick oxide films supported on metals can be very different from the reactivity of bulk oxides [37]). The average thickness of Cu 2 O oxide layer formed on Cu immersed in 3 wt. % NaCl solution was estimated experimentally to be about 2 . 2 ± 0 . 3  nm [38], which seems sufficient to make the current model adequate.
Cuprite structure of Cu 2 O consists of interlaced Cu fcc and O bcc lattices, displaced by (1/4, 1/4, 1/4) with respect to one another. Each Cu atom is linearly coordinated to two O atoms and each O atom is tetrahedrally coordinated to four Cu atoms. The experimental lattice parameter of Cu 2 O bulk is 4.27 Å [39], whereas our PBE calculated value is 4.35 Å.

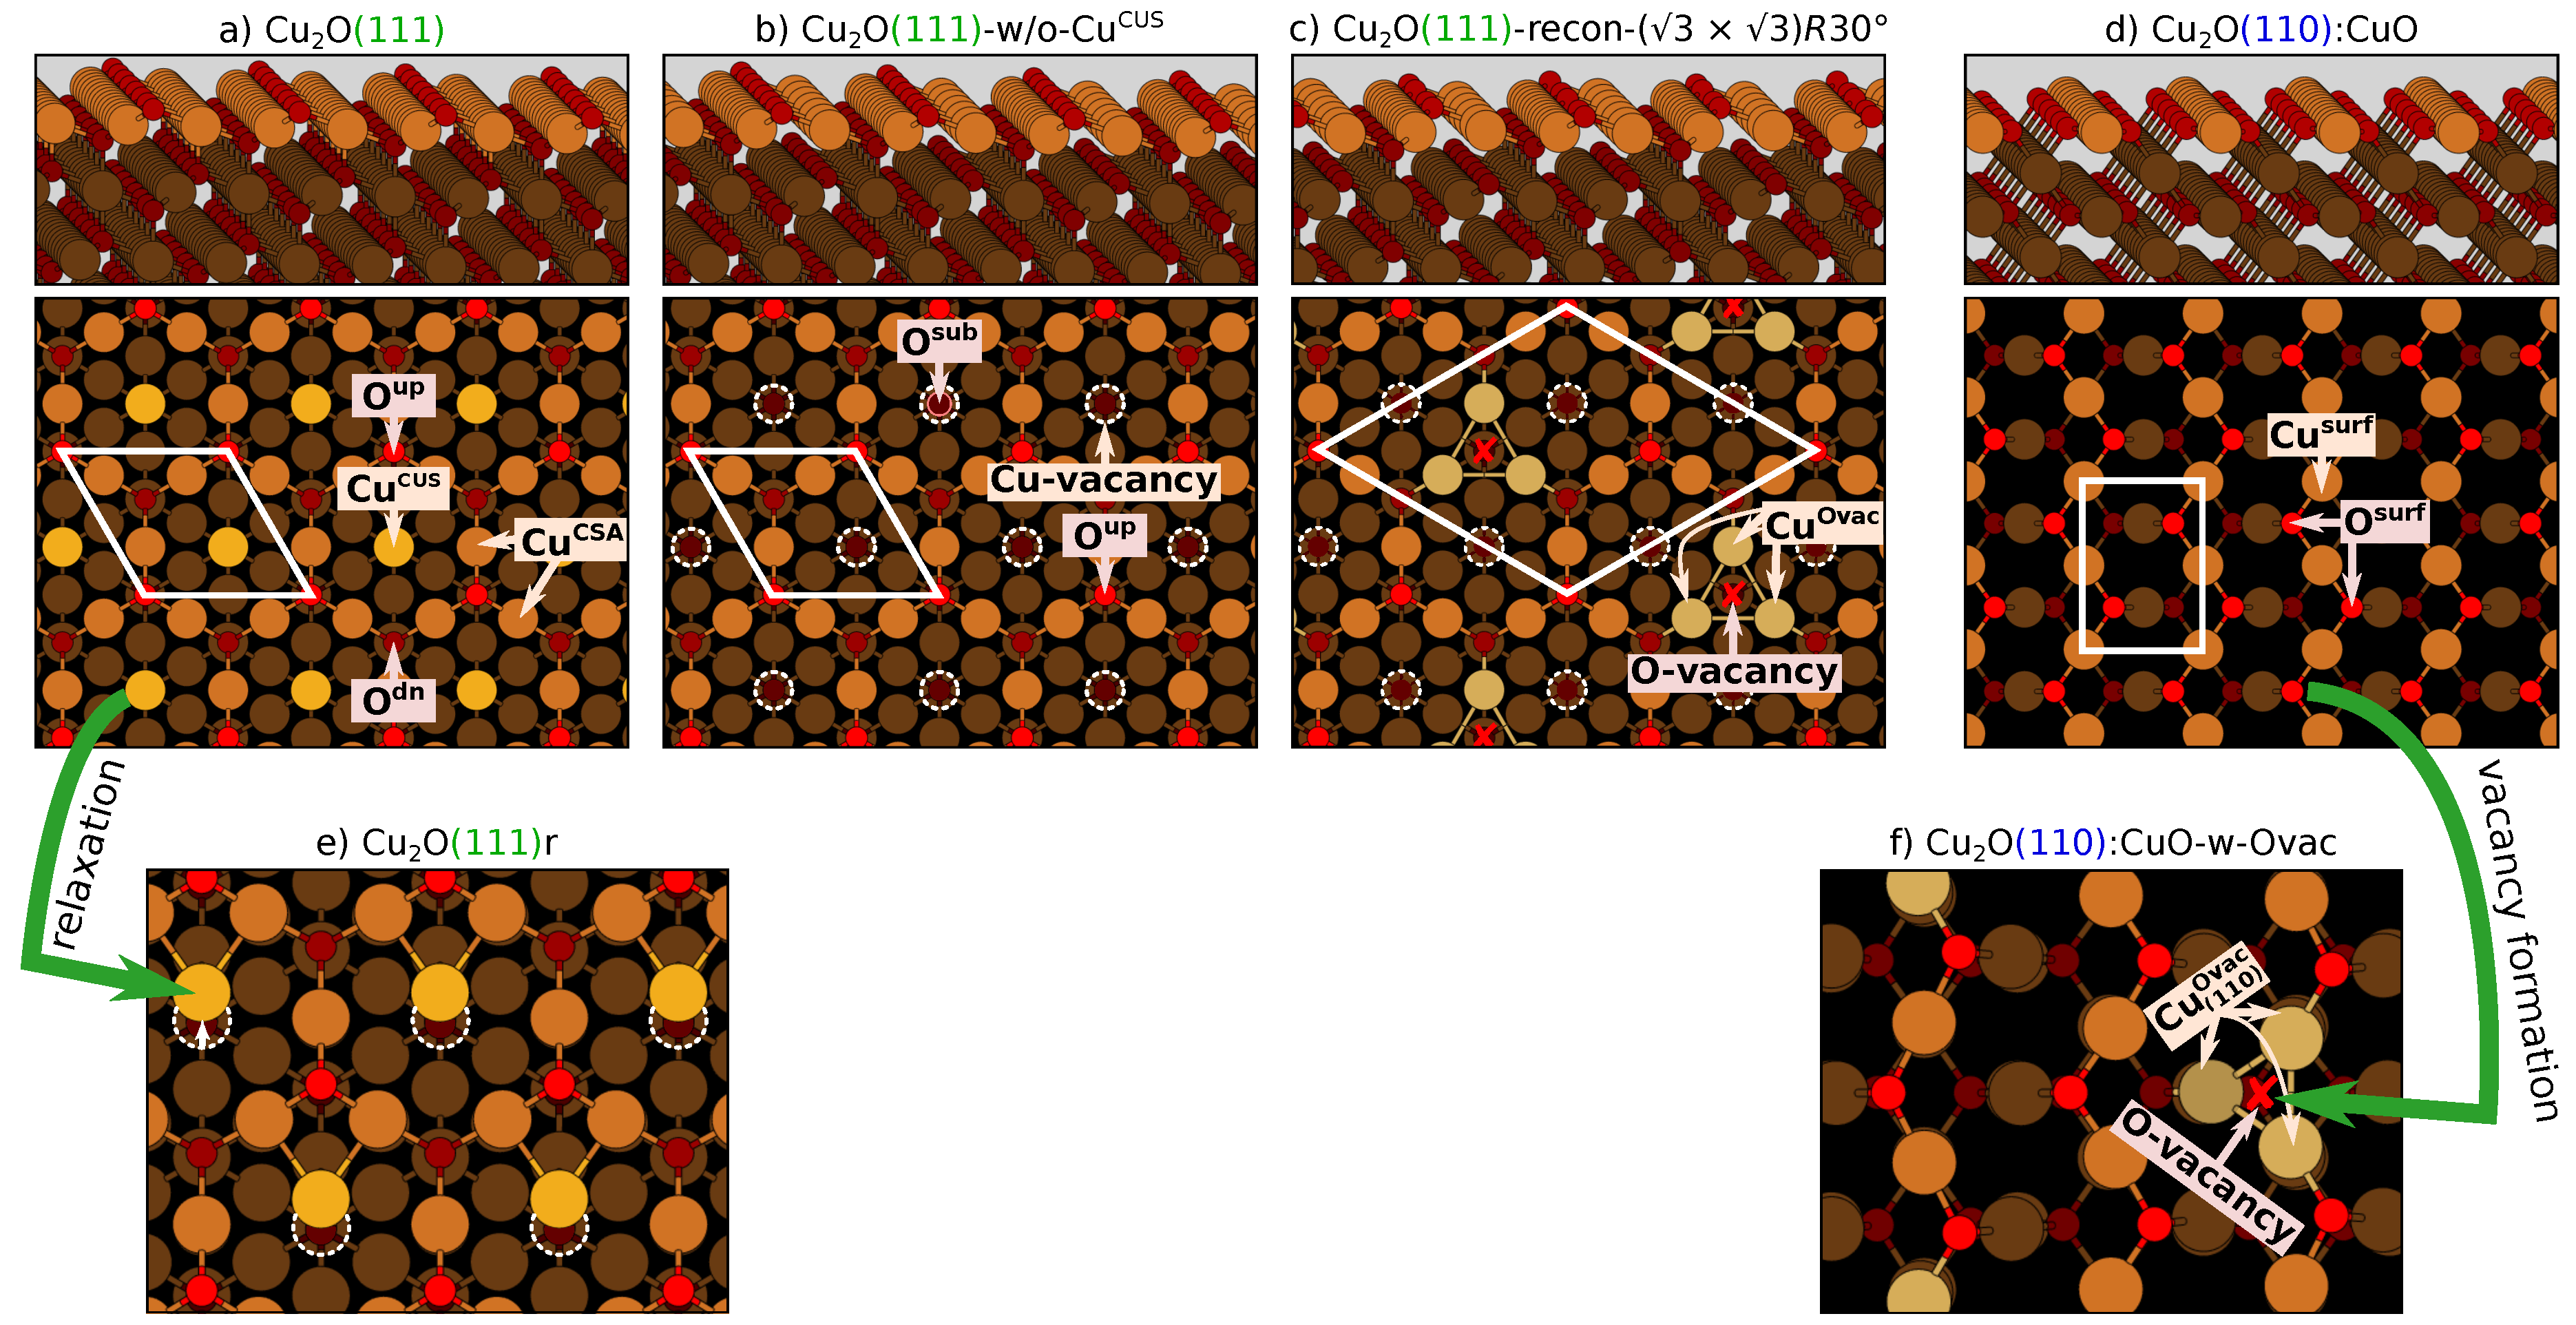
2.3. Description of Considered Surfaces
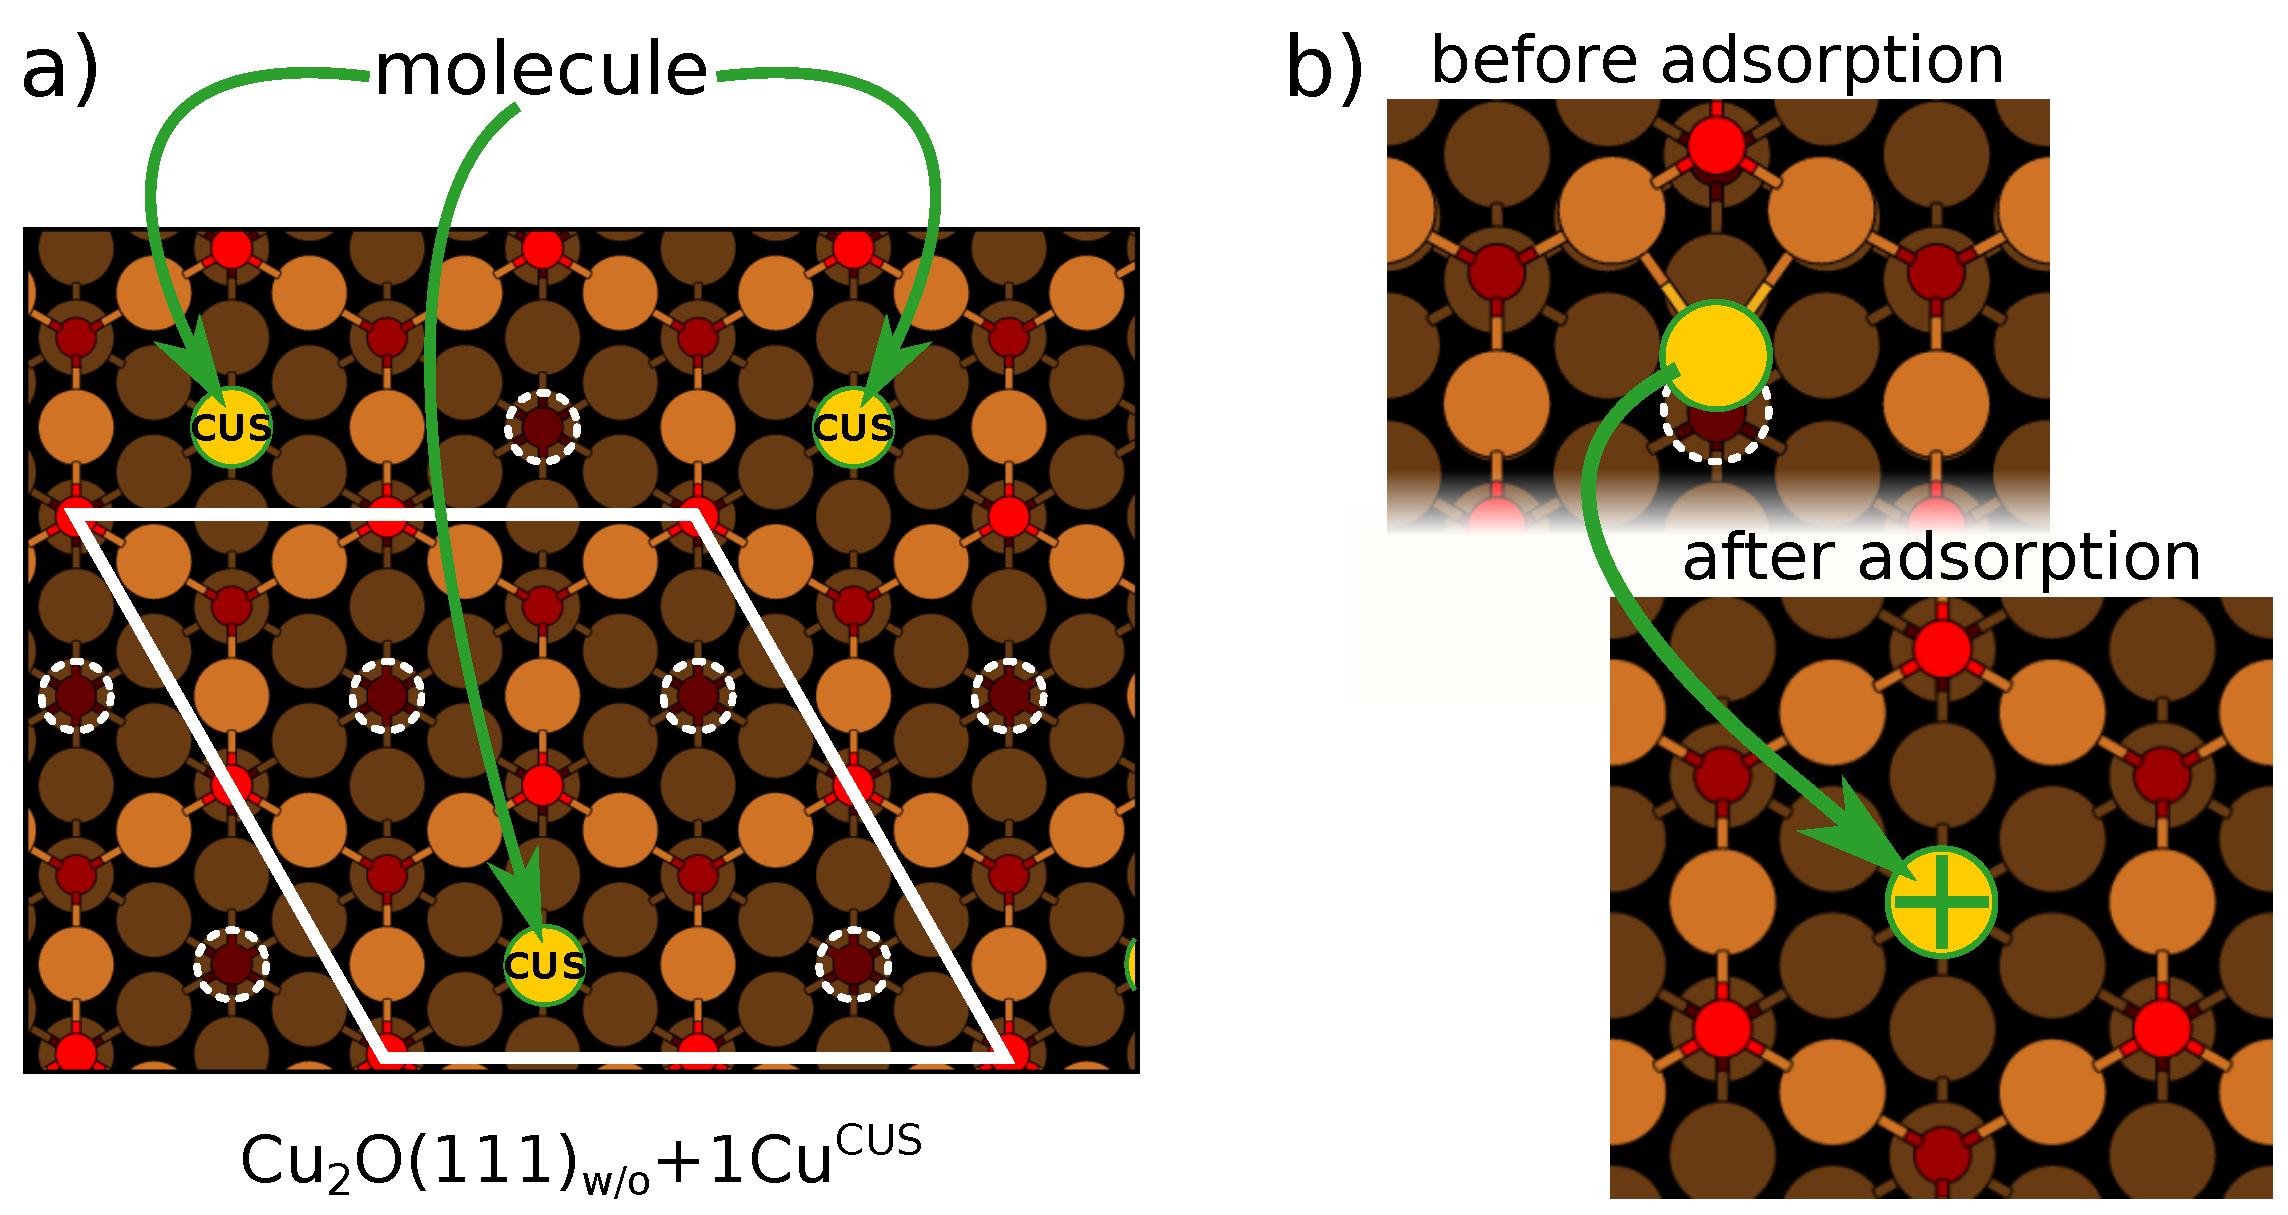
Figure 1 shows structures of Cu 2 O surfaces considered in this work. These are either based on Cu 2 O(111) (Figure 1a–c,e) or Cu 2 O(110) (Figure 1d,f). Beware that the visualization of Cu 2 O structures is based on atomic radii, hence Cu ions are shown as bigger and O ions as smaller balls, even though the use of ionic radii would be physically more appropriate. Perspective side-view plots (top narrower panels) reveal that Cu 2 O(111) slab consists of O–Cu–O trilayers, whereas Cu 2 O(110) slab consists of CuO–Cu bilayers. Top-view plots (bottom panels) show that (111) surface is tiled with centered hexagons consisting of Cu (bigger brownish balls) and O (smaller reddish balls) ions. Among the shown structures, only the pristine Cu 2 O(111) is stoichiometric (Figure 1a,e). Its surface trilayer contains two distinct copper ions: a coordinatively saturated (CSA) and coordinatively unsaturated (CUS), labeled as Cu CSA and Cu CUS , respectively (the Cu CUS ions are colored more yellowish). It also contains two distinct oxygen ions: O up (colored brighter) and O dn (darker), where the superscripts indicate that they are located above (up) and below (dn) the surface Cu layer, respectively (O up is CUS and O dn is CSA). It should be noted that the high-symmetry Cu 2 O(111) is not stable, and it relaxes such that the Cu CUS ions displace laterally toward two adjacent Cu CSA ions if the symmetry is broken (cf. Figure 1a,e). The resulting relaxed surface is labeled as Cu 2 O(111)r, where “r” stands for “relaxed”.
Figure 1b shows the Cu 2 O(111)-w/o-Cu CUS structure, which is the Cu 2 O(111) that lacks the Cu CUS ions (notation “-w/o-Cu CUS ” stands for “Cu 2 O(111) without Cu CUS ions”); Cu CUS -vacancies are indicated by white dashed circles. The O ions bellow Cu CUS -vacancies are named as O sub , where “sub” stands for “subsurface”.
The last considered Cu 2 O(111)-type structure is the surface observed experimentally by Önsten et al. [22] and referred to by them as model B of the reconstructed surface due to ordered oxygen vacancies, which can be described with the ( 3  ×  3 )R30 supercell (Figure 1c); we label this structure as Cu 2 O(111)-recon-( 3  ×  3 )R30 , where “recon” stands for “reconstructed”. It can be derived from Cu 2 O(111)-w/o-Cu CUS because it lacks the Cu CUS ions, but, in addition, one third of O up ions are missing. The respective O-vacancies are indicated with red crosses in Figure 1c. Each O-vacancy is surrounded by three Cu CUS ions, labeled as Cu Ovac (“Ovac” stands for oxygen vacancy) to distinguish them from Cu CUS ions of pristine Cu 2 O(111); note that the two CUS type Cu ions have structurally different environments. The Cu Ovac ions therefore always appear in triplets and we use the term “Cu Ovac site” to designate the site composed of these three ions. We do not consider Önsten’s model A of the ( 3  ×  3 )R30 reconstructed surface—the difference between the two models is that model B lacks Cu CUS ions—because no new types of Cu and O ions are introduced in model A.
Figure 1d depicts the structure of the Cu 2 O(110):CuO surface. Because the Cu 2 O(110) slab consists of CuO–Cu bilayers, the respective stoichiometric slab is polar (terminated with a CuO layer on one side and a Cu layer on the other side). To avoid the use of a polar slab, the Cu 2 O(110) is modeled with a symmetric slab terminated with the CuO layer on both sides (hence the denotation Cu 2 O(110):CuO). This slab is non-stoichiometric, i.e., it is Cu deficient. The surface CuO layer consists of zigzag O–Cu–O–Cu rows, which consist of CSA Cu ions and CUS O ions, named as Cu surf and O surf , where “surf” stands for surface (note that on the nonrelaxed ideal bulk-cut (110) surface both Cu surf and O surf are located at the same height, that is, on the surface plane). We also consider an oxygen vacancy on Cu 2 O(110):CuO (Figure 1f), which results in a triplet of unsaturated Cu ions beneath it; this triplet has the same local structure as the Cu Ovac site on Cu 2 O(111)-recon-( 3  ×  3 )R30 ; these ions are designated as Cu ( 110 ) Ovac and the respective surface is labeled as Cu 2 O(110):CuO-w-Ovac, where the “-w-Ovac” suffix stands for “with oxygen vacancy”.
It should be noted that non-stoichiometric Cu 2 O surfaces containing Cu-vacancies possess a sizable magnetic moment. Our calculated value (about 1.3  μ B per Cu-vacancy) is in fair agreement with that reported by Li et al. [40]. Despite the sizable magnetic moment, the energy difference between magnetic (spin-polarized) and non-magnetic (spin-unpolarized) total energies is rather small, being about 30 meV per Cu-vacancy. When, in addition to Cu vacancies, O vacancies are also present (e.g., Cu 2 O(111)-recon-( 3  ×  3 )R30 model), then both magnetic moments as well as the difference between magnetic (spin-polarized) and non-magnetic (spin-unpolarized) total energies are reduced. Hence, the results presented herein were obtained with non-magnetic surface calculations.

2.4. An Issue with C u C U S Sites: A Cu 2 O(111) w / o +1 C u C U S Model

As mentioned above, the high-symmetry stoichiometric Cu 2 O(111) is not stable: if the symmetry is broken, then each Cu CUS ion relaxes laterally toward two adjacent Cu CSA ions in the direction pointing to nearby O up ions. The resulting Cu 2 O(111)r is by about 4 meV/Å 2 more stable than its high-symmetry analogue [27]. In Figure 1e, all the Cu CUS ions are depicted to relax in the same direction. However, there are three symmetry equivalent directions along which a given Cu CUS ion may relax; these are 120 apart from each other and point towards the nearby O up ion. Each Cu CUS ion may therefore relax in one of these three directions, leading to different possible Cu CUS relaxation patterns, which, according to our calculations, display slightly different relaxation energies. This can result in some spurious, though small, contribution to adsorption energy because molecular adsorption may further lower the symmetry and result in different relaxation patterns of the nearby Cu CUS ions. To minimize this potential artifact, the surface model used for the adsorption onto Cu CUS site is modified so that all Cu CUS ions, except those that bond to adsorbed molecules, are removed. The resulting model can be seen as a Cu 2 O(111)-w/o-Cu CUS containing Cu CUS defects, where the number of Cu CUS ions equals the number of adsorbed molecules (Figure 2a). This model is designated as Cu 2 O(111) w / o +1Cu CUS , where the subscript “w/o” is a shorthand for “w/o-Cu CUS ” and the suffix “+1Cu CUS ” conveys that there is one Cu CUS ion per adsorbed molecule. Note that, at a molecular coverage of one molecule per ( 1 × 1 ) unit-cell, the Cu 2 O(111) w / o +1Cu CUS model becomes synonymous with the stoichiometric Cu 2 O(111).
The choice of the Cu 2 O(111) w / o +1Cu CUS model can be further justified by the fact that the relaxed stoichiometric Cu 2 O(111)r, though being a local minimum structure, is not thermodynamically stable [27]. However, in our previous study [17], we showed that molecular adsorption is able to compensate the thermodynamic deficiency of Cu CUS ions. Hence, it seems appropriate to maintain only those Cu CUS ions that bond with adsorbed molecules.
Cu CUS ions display one further interesting characteristic: on the bare surface, they relax laterally as discussed above (cf. Figure 1e). However, when a Cu CUS ion bonds with an adsorbed molecule, then it shifts back to the high-symmetry position (Figure 2b). Apparently, the adsorbed molecule sufficiently diminishes the unsaturated character of Cu CUS , thus withdrawing its need to bond with nearby Cu CSA ions. To better reflect the molecule–surface bond strength, the binding and adsorption energies at Cu CUS sites are calculated with respect to the high-symmetry position of Cu CUS ion on the pristine surface. The energy difference between high- and low-symmetry position of Cu CUS ion is 0.13 eV for Cu 2 O(111)–( 1 × 1 ), 0.04 eV for Cu 2 O(111) w / o +1Cu CUS –( 2 × 2 ), and vanishes for Cu 2 O(111) w / o +1Cu CUS –( 3 × 3 ).

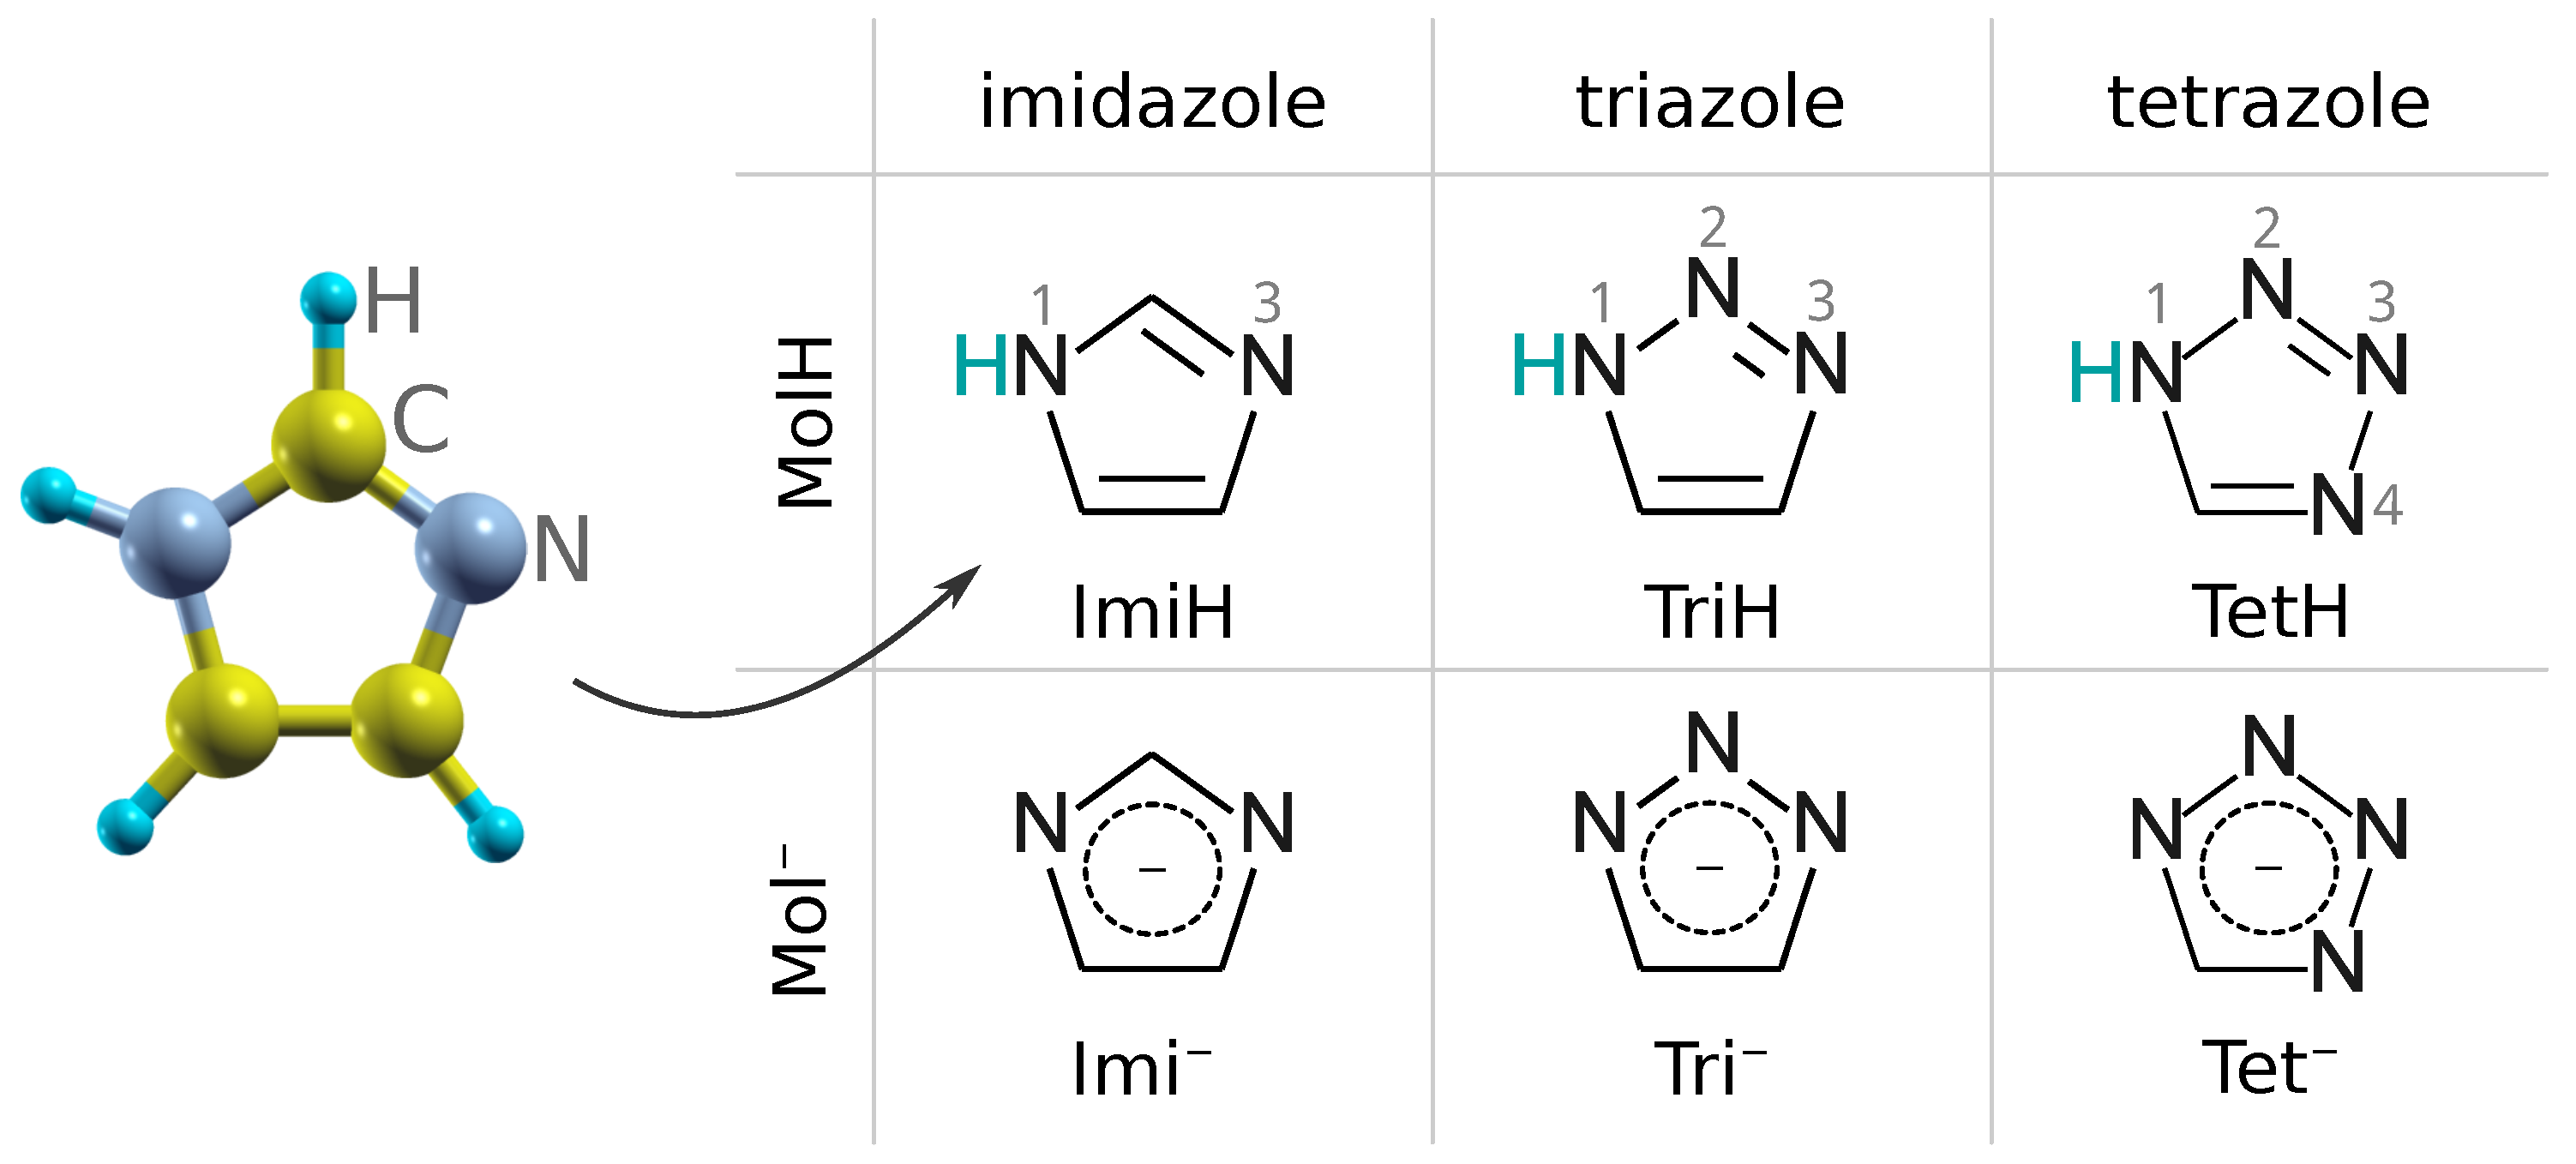
2.5. Molecular Labels

The labels MolH, Mol , and Mol designate azole molecules in neutral, deprotonated, and radical form, respectively, whereas Mol is used as a generic label for a dissociated molecule—a molecule with the N1–H bond broken and stripped of the pertinent H—when the charge of the species is not of concern. ImiH, TriH, and TetH are shorthand labels for intact imidazole, triazole, and tetrazole, respectively. For other speciation forms, analogous designations as for MolH are used (cf. Scheme 1), e.g., for imidazole, the respective labels are Imi , Imi , and Imi.

2.6. Adsorption Calculations

Adsorption calculations on Cu 2 O(111)-type surfaces were modeled with slabs consisting of four O–Cu–O trilayers, whereas Cu 2 O(110):CuO was modeled with slabs consisting of five layers, that is, two CuO–Cu bilayers plus an extra CuO layer at the bottom of the slab. For Cu 2 O(111)-type surfaces, the bottom trilayer and, for Cu 2 O(110):CuO, the bottom bilayer were constrained to bulk positions, while all other degrees of freedom were relaxed. Molecules were adsorbed on the top side of the slab and the thickness of the vacuum region—the distance between the top of the ad-molecule and the adjacent slab—was set to about 20 Å. Dipole correction of Bengtsson [41] was applied to cancel an artificial electric field that develops along the direction normal to the slab due to periodic boundary conditions imposed on the electrostatic potential. Molecular adsorption was modeled with the ( 2 × 2 ) supercell for Cu 2 O(111) based models, ( 3  ×  3 )R30 supercell for the Cu 2 O(111)-recon-( 3  ×  3 )R30 , and 2 1 0 2 supercell for the Cu 2 O(110):CuO based models using the ( 2 × 2 × 1 ), ( 2 × 2 × 1 ), and ( 3 × 2 × 1 ) uniformly shifted k-meshes for the BZ integrations, respectively. Many different adsorption configurations were considered; however, only the most stable identified configurations (per molecule, per surface, and per adsorption type) are presented and discussed herein.
We consider molecular (or non-dissociative) as well as dissociative adsorption of azole molecules. In the latter, the N1–H bond (cf. Scheme 1) is broken upon adsorption. Non-dissociative adsorption of azole molecules is described as:
MolH + MolH ,
whereas dissociative adsorption can be written as:
MolH + 2 Mol + H ,
where standalone ∗ designates a free adsorption site, while MolH∗, Mol∗, and H∗ denote adsorbed species. The respective molecular and dissociative adsorption energies (per adsorbed molecule) are calculated as:
E ads = E MolH / slab ( E slab + E MolH )
and
1 1 E ads diss = E Mol + H / slab ( E slab + E MolH ) ,
where E MolH , E slab , E MolH / slab , and E Mol + H / slab are the total energies of isolated intact MolH molecule, clean slab, MolH/slab, and coadsorbed Mol+H/slab system, respectively.
To estimate how strong the dissociated molecule, H, and Cl bind to the surface, we utilize the binding energy ( E b ) or the bond-strength (D); the E b is calculated as:
E b = E A / slab ( E slab + E A ) ,
where A stands for adsorbate (Mol, H, or Cl) and the meaning of the energy terms is analogous to those defined above. By convention, the bond-strength D is positive and hence opposite to binding energy, D = E b . Note that E b is calculated with respect to isolated radicals (Mol , H , or Cl ) and not ions (Mol , H + , or Cl ); isolated radical species were calculated with spin-polarized calculations. Note that for non-dissociative adsorption the binding energy is equivalent to adsorption energy, i.e.,
E b = E ads for non dissociative adsorption .
The relative stability of molecular vs. dissociative adsorption can be evaluated by considering the dissociation reaction occurring at the surface:
MolH + Mol + H .
The respective dissociation energy is calculated as:
Δ E = E Mol + H / slab E MolH / slab = E ads diss E ads
and dissociative adsorption is favored over the non-dissociative adsorption when Δ E < 0 .

2.6.1. Charge Density Difference

The formation of a chemical bond between the adsorbate and the surface can be characterized in terms of the charge density difference, Δ ρ ( r ) , defined as:
Δ ρ ( r ) = ρ A / slab ( r ) ρ slab ( r ) ρ A ( r ) ,
where the subscripts have the same meaning as in Equation (5). For Δ ρ ( r ) calculations, the geometries of the “slab” and standalone “A” structures are kept the same as in the “A/slab” system.

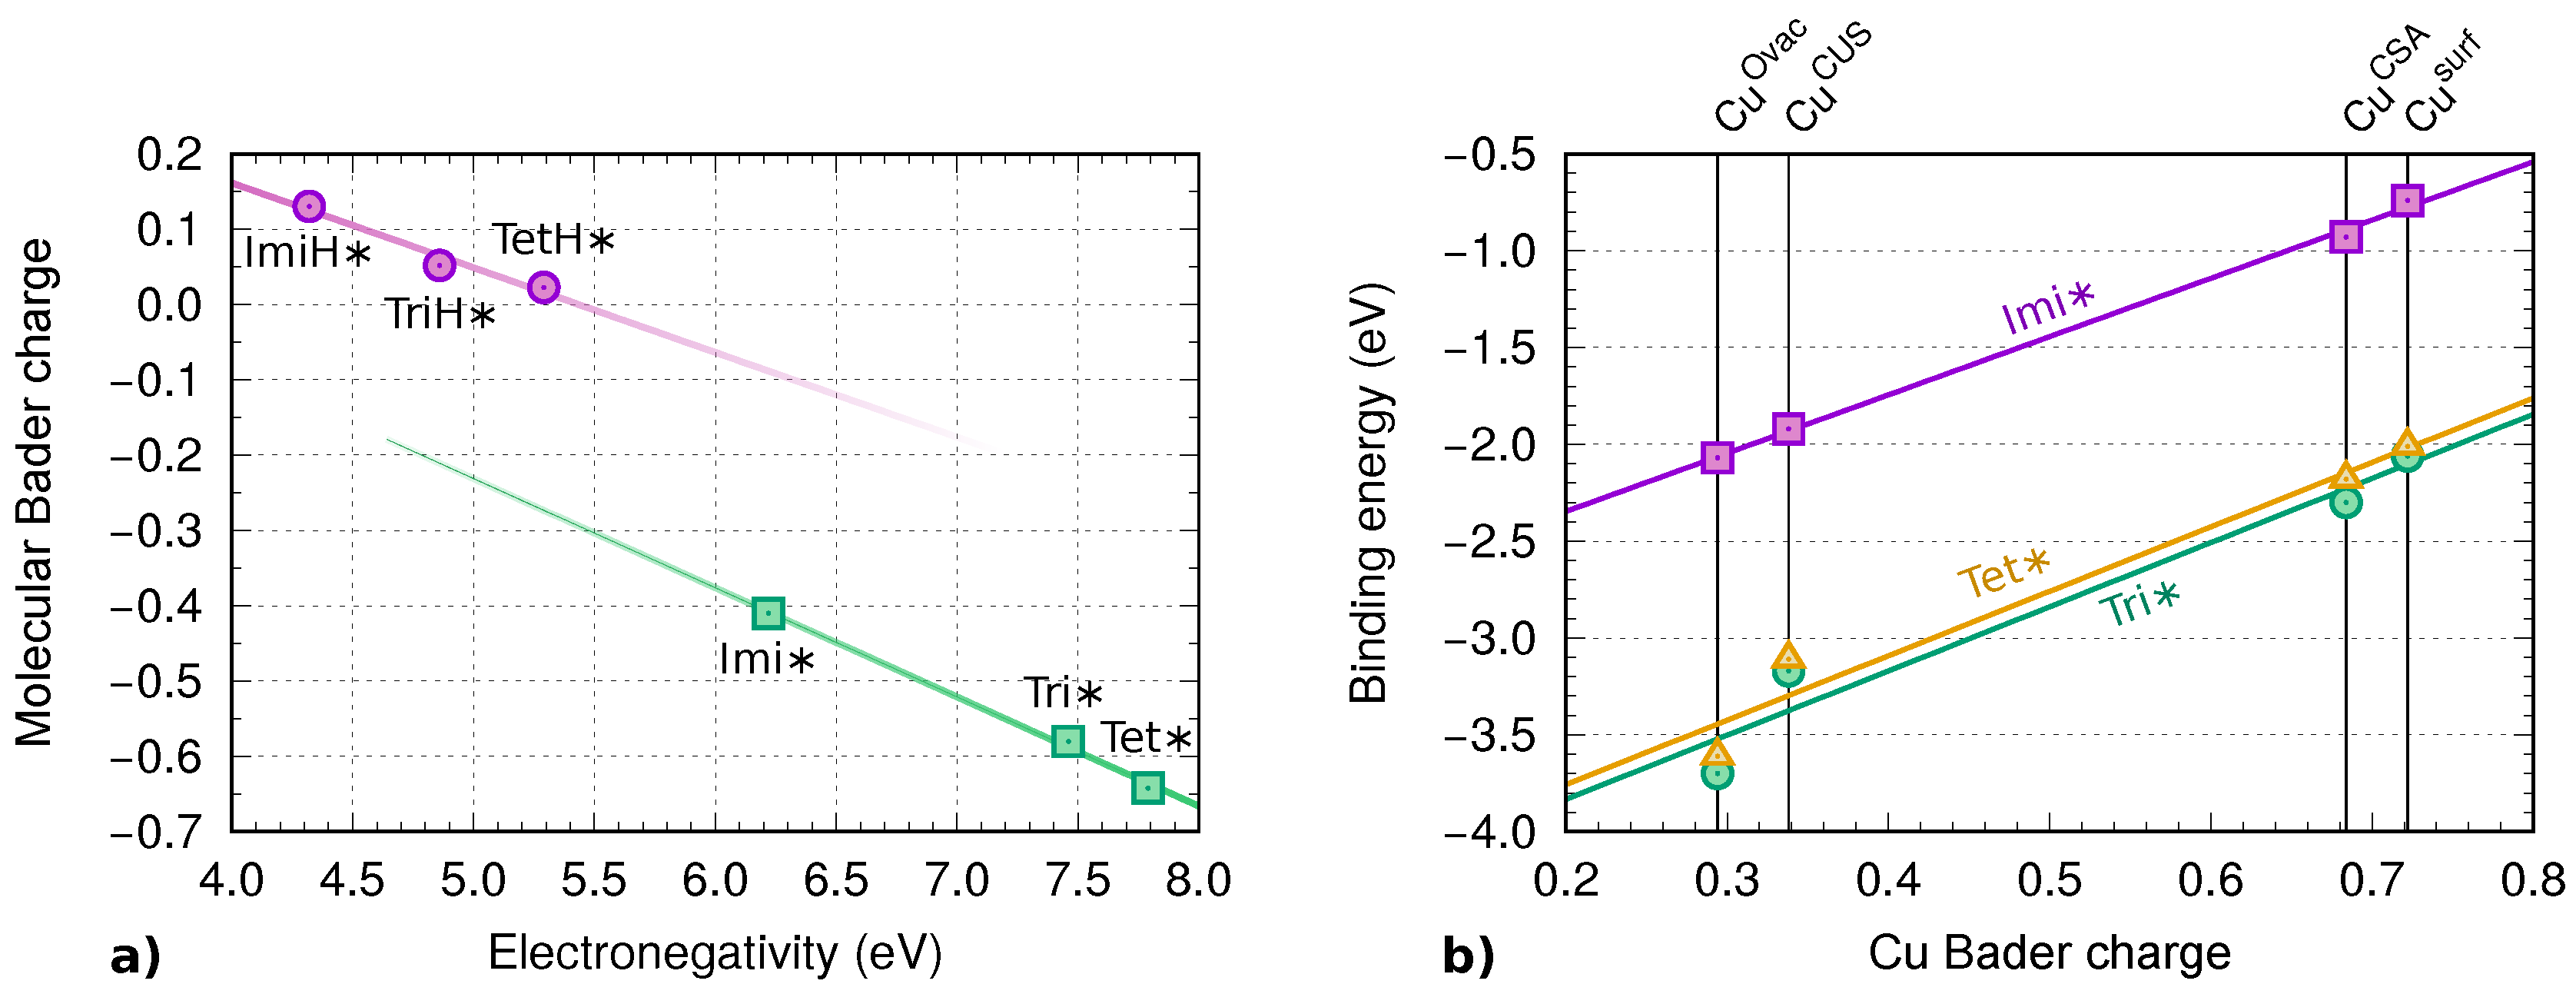
2.6.2. Bader Charge Analysis

Bader charges [42] were calculated by first generating charge densities with single point self- consistent-field calculations of US-PP optimized structures using the projector-augmented-wave (PAW) potentials [43] with 40 Ry and 1000 Ry kinetic energy cutoffs for wave-functions and charge densities, respectively, and then computing the Bader charges using the bader program [44,45].

2.6.3. Dissociation Activation Energies

Dissociation activation energies were calculated using the climbing-image nudged-elastic-band (CI-NEB) method [46,47] that models an elementary reaction step as the minimum energy path (MEP) connecting the initial state (IS) with the final state (FS). The configuration with the maximum energy along the MEP is the transition state (TS) and the activation energy is calculated as the difference between the TS and IS energies, E TS E IS . For the precise location of the TS, the threshold for the magnitude of the atomic forces was set below 40 meV/Å.

3. Results

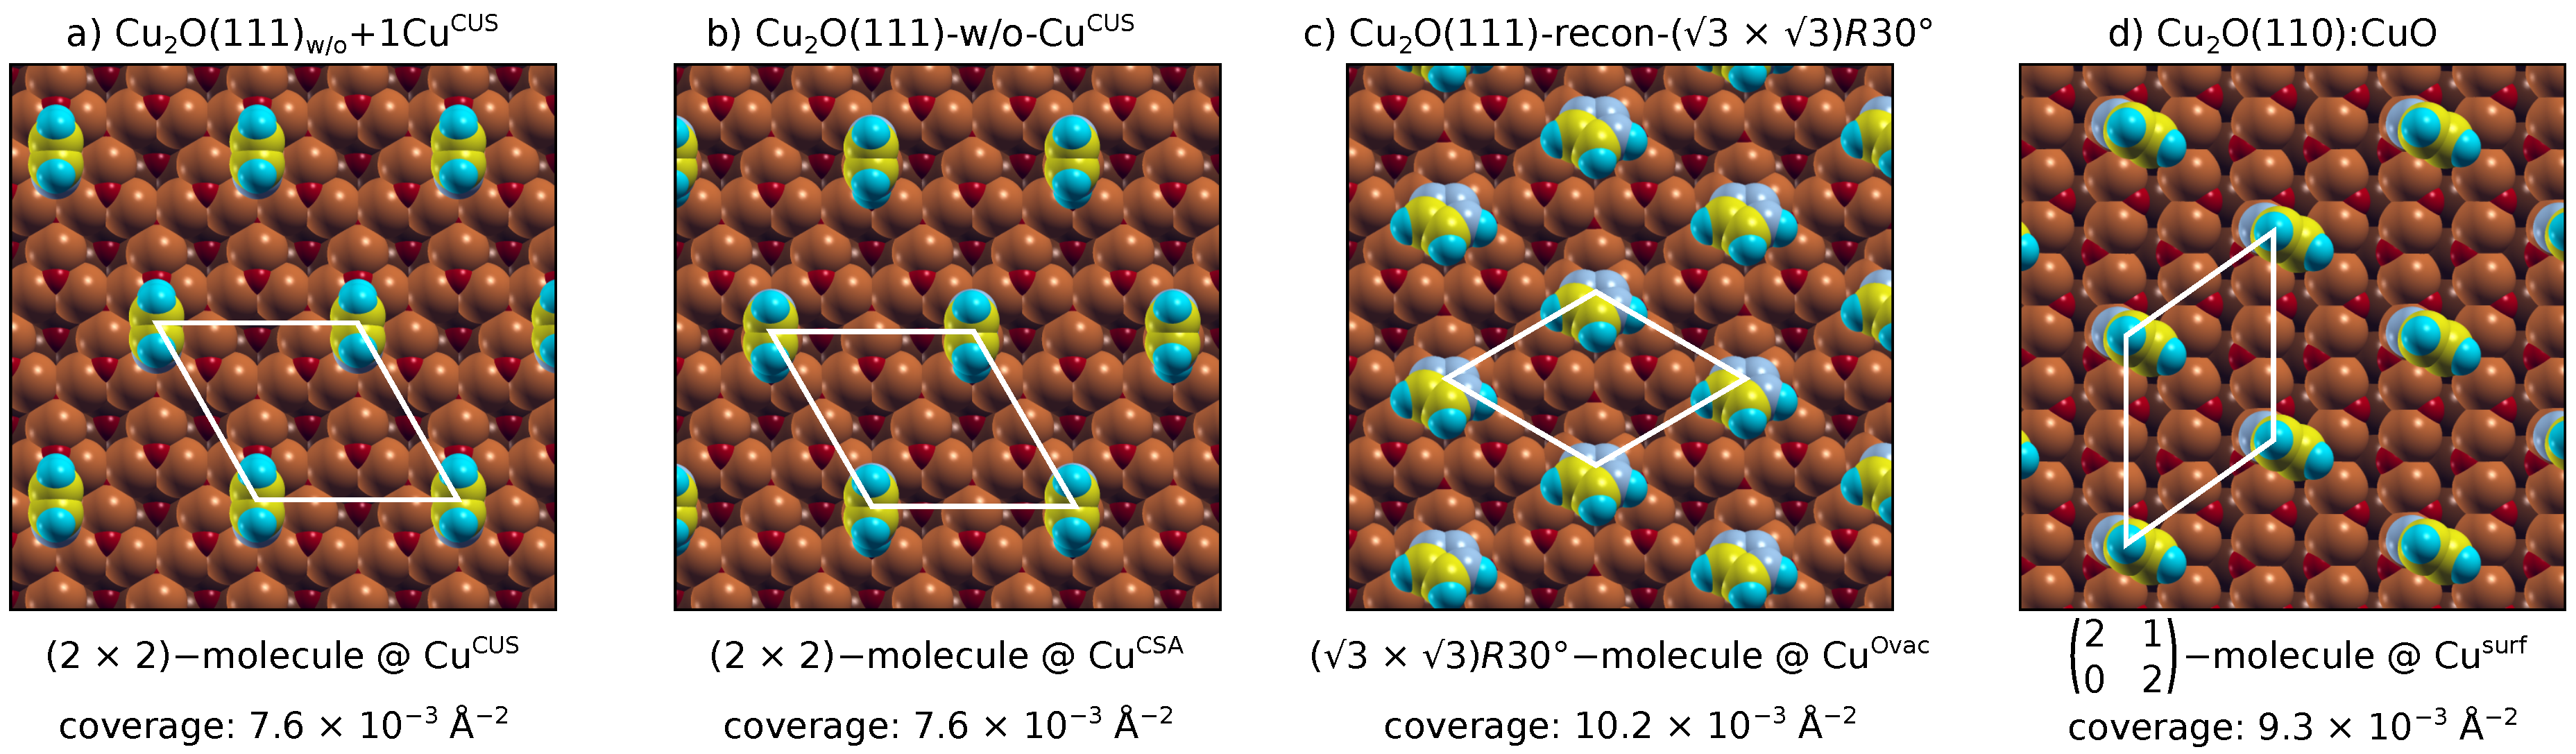
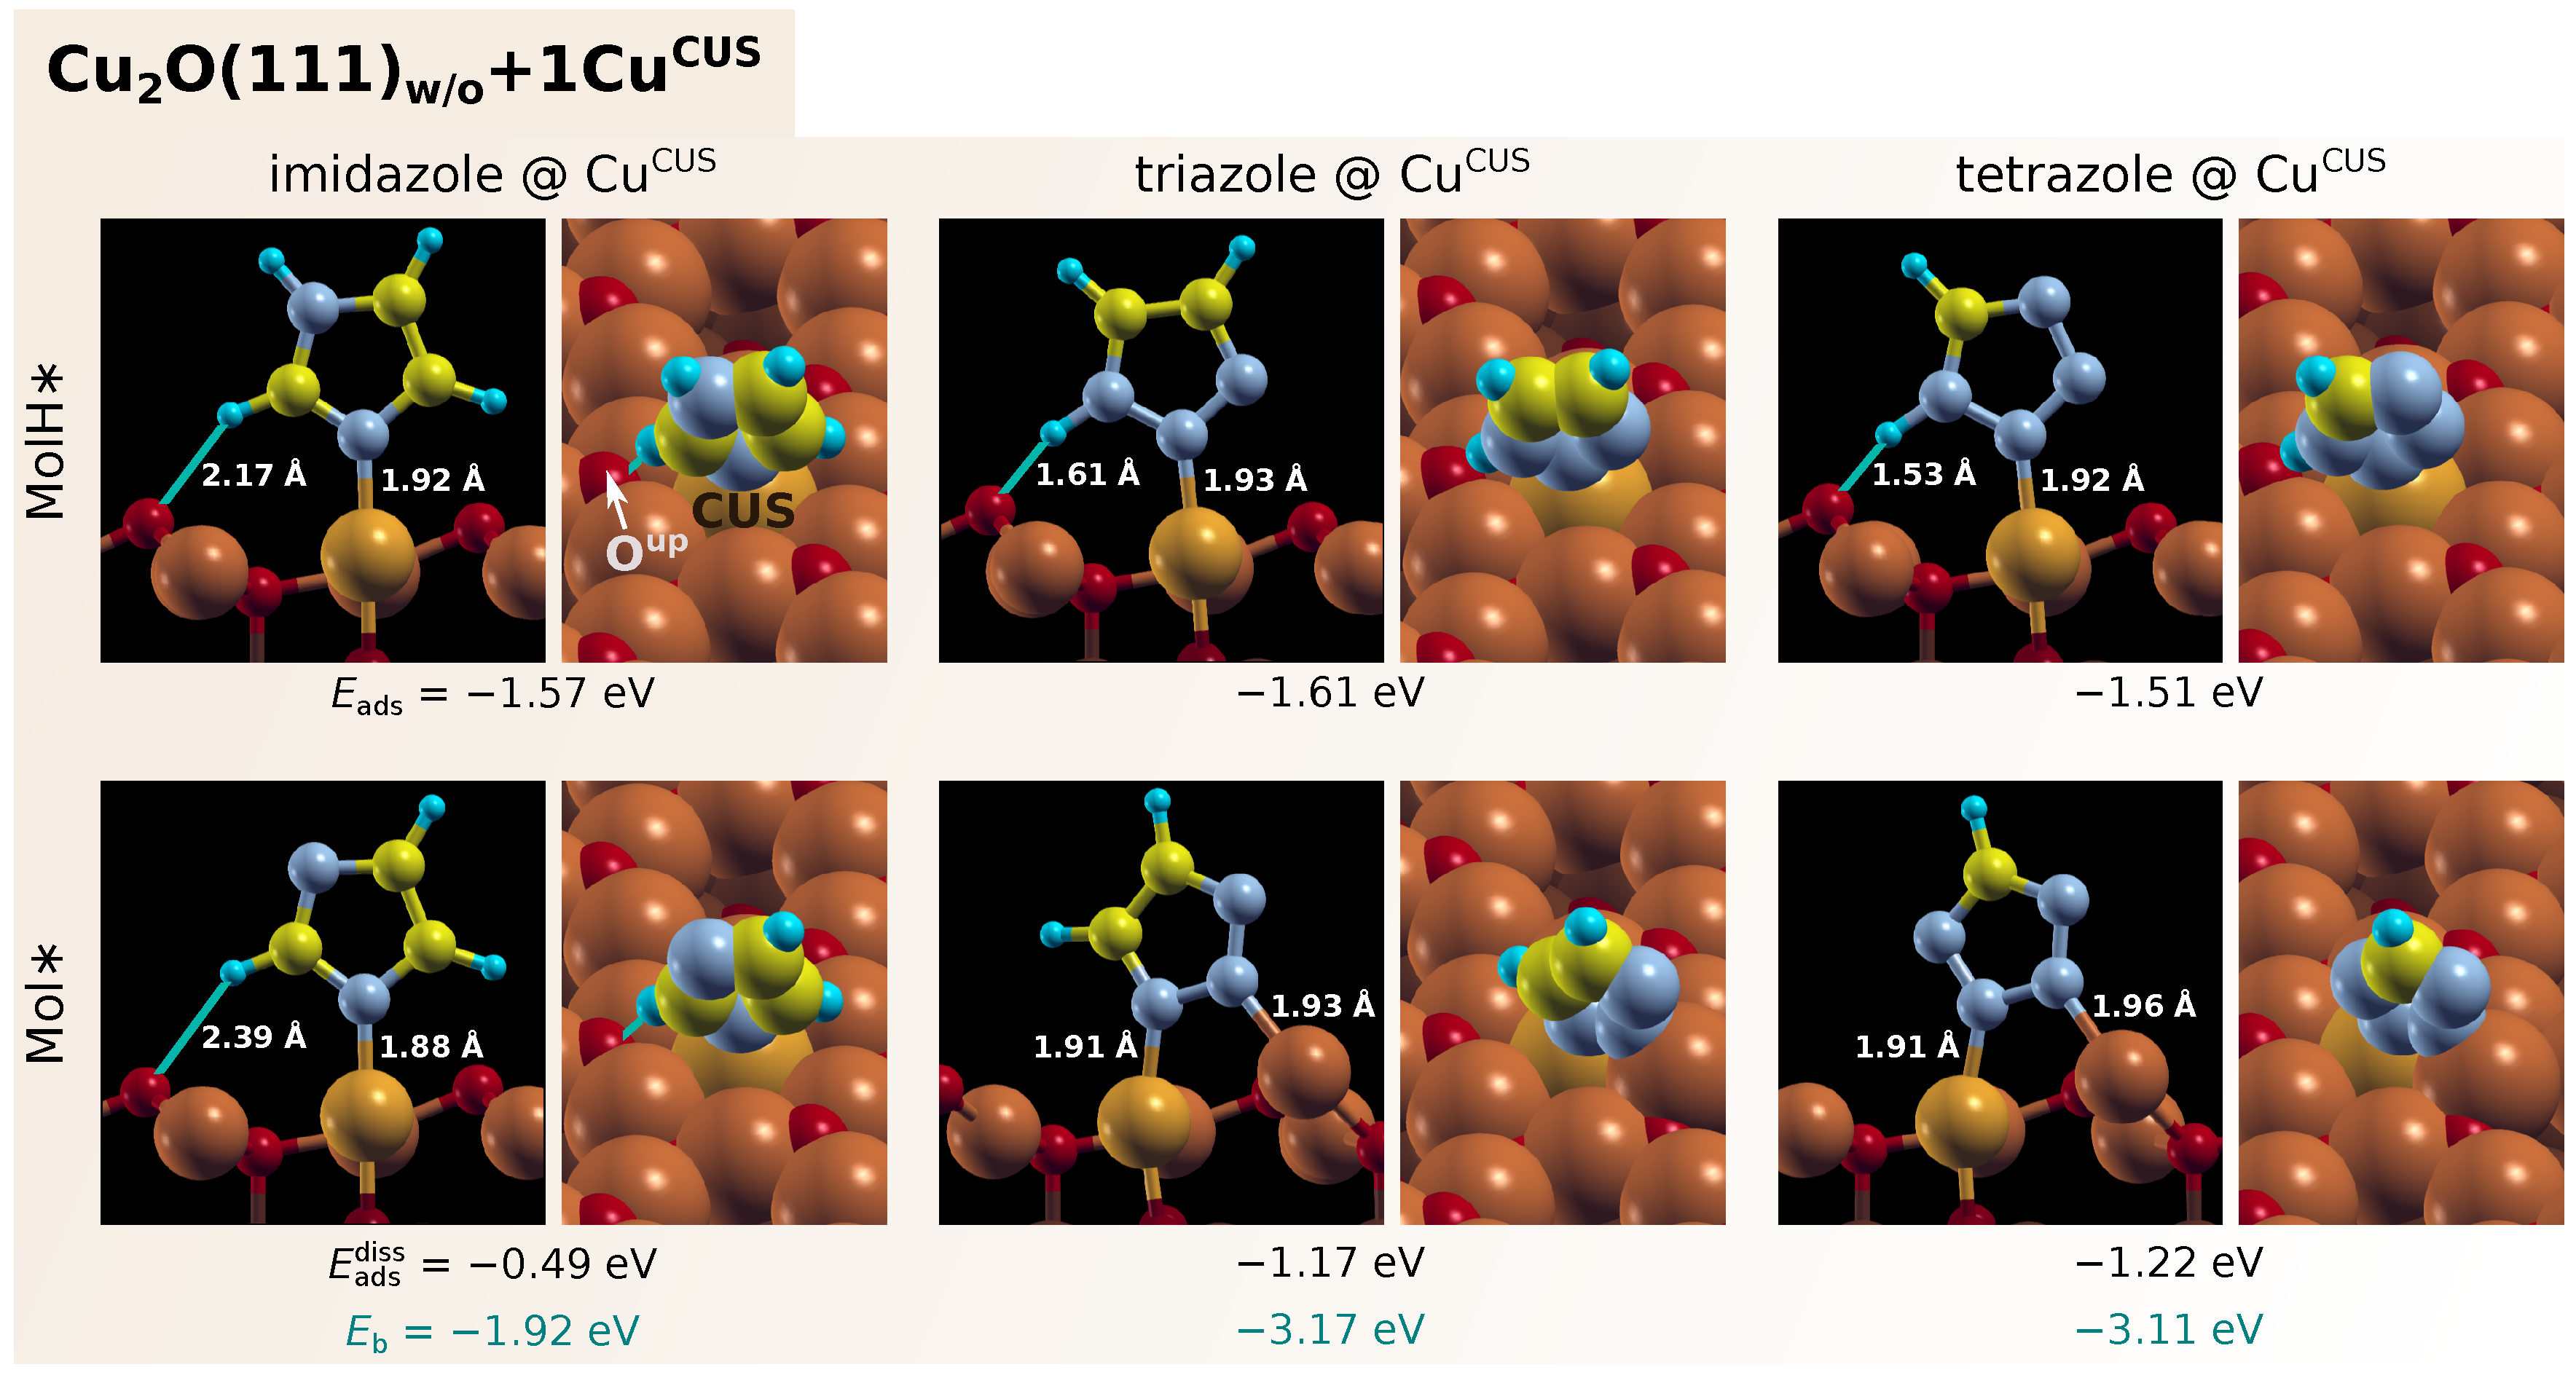
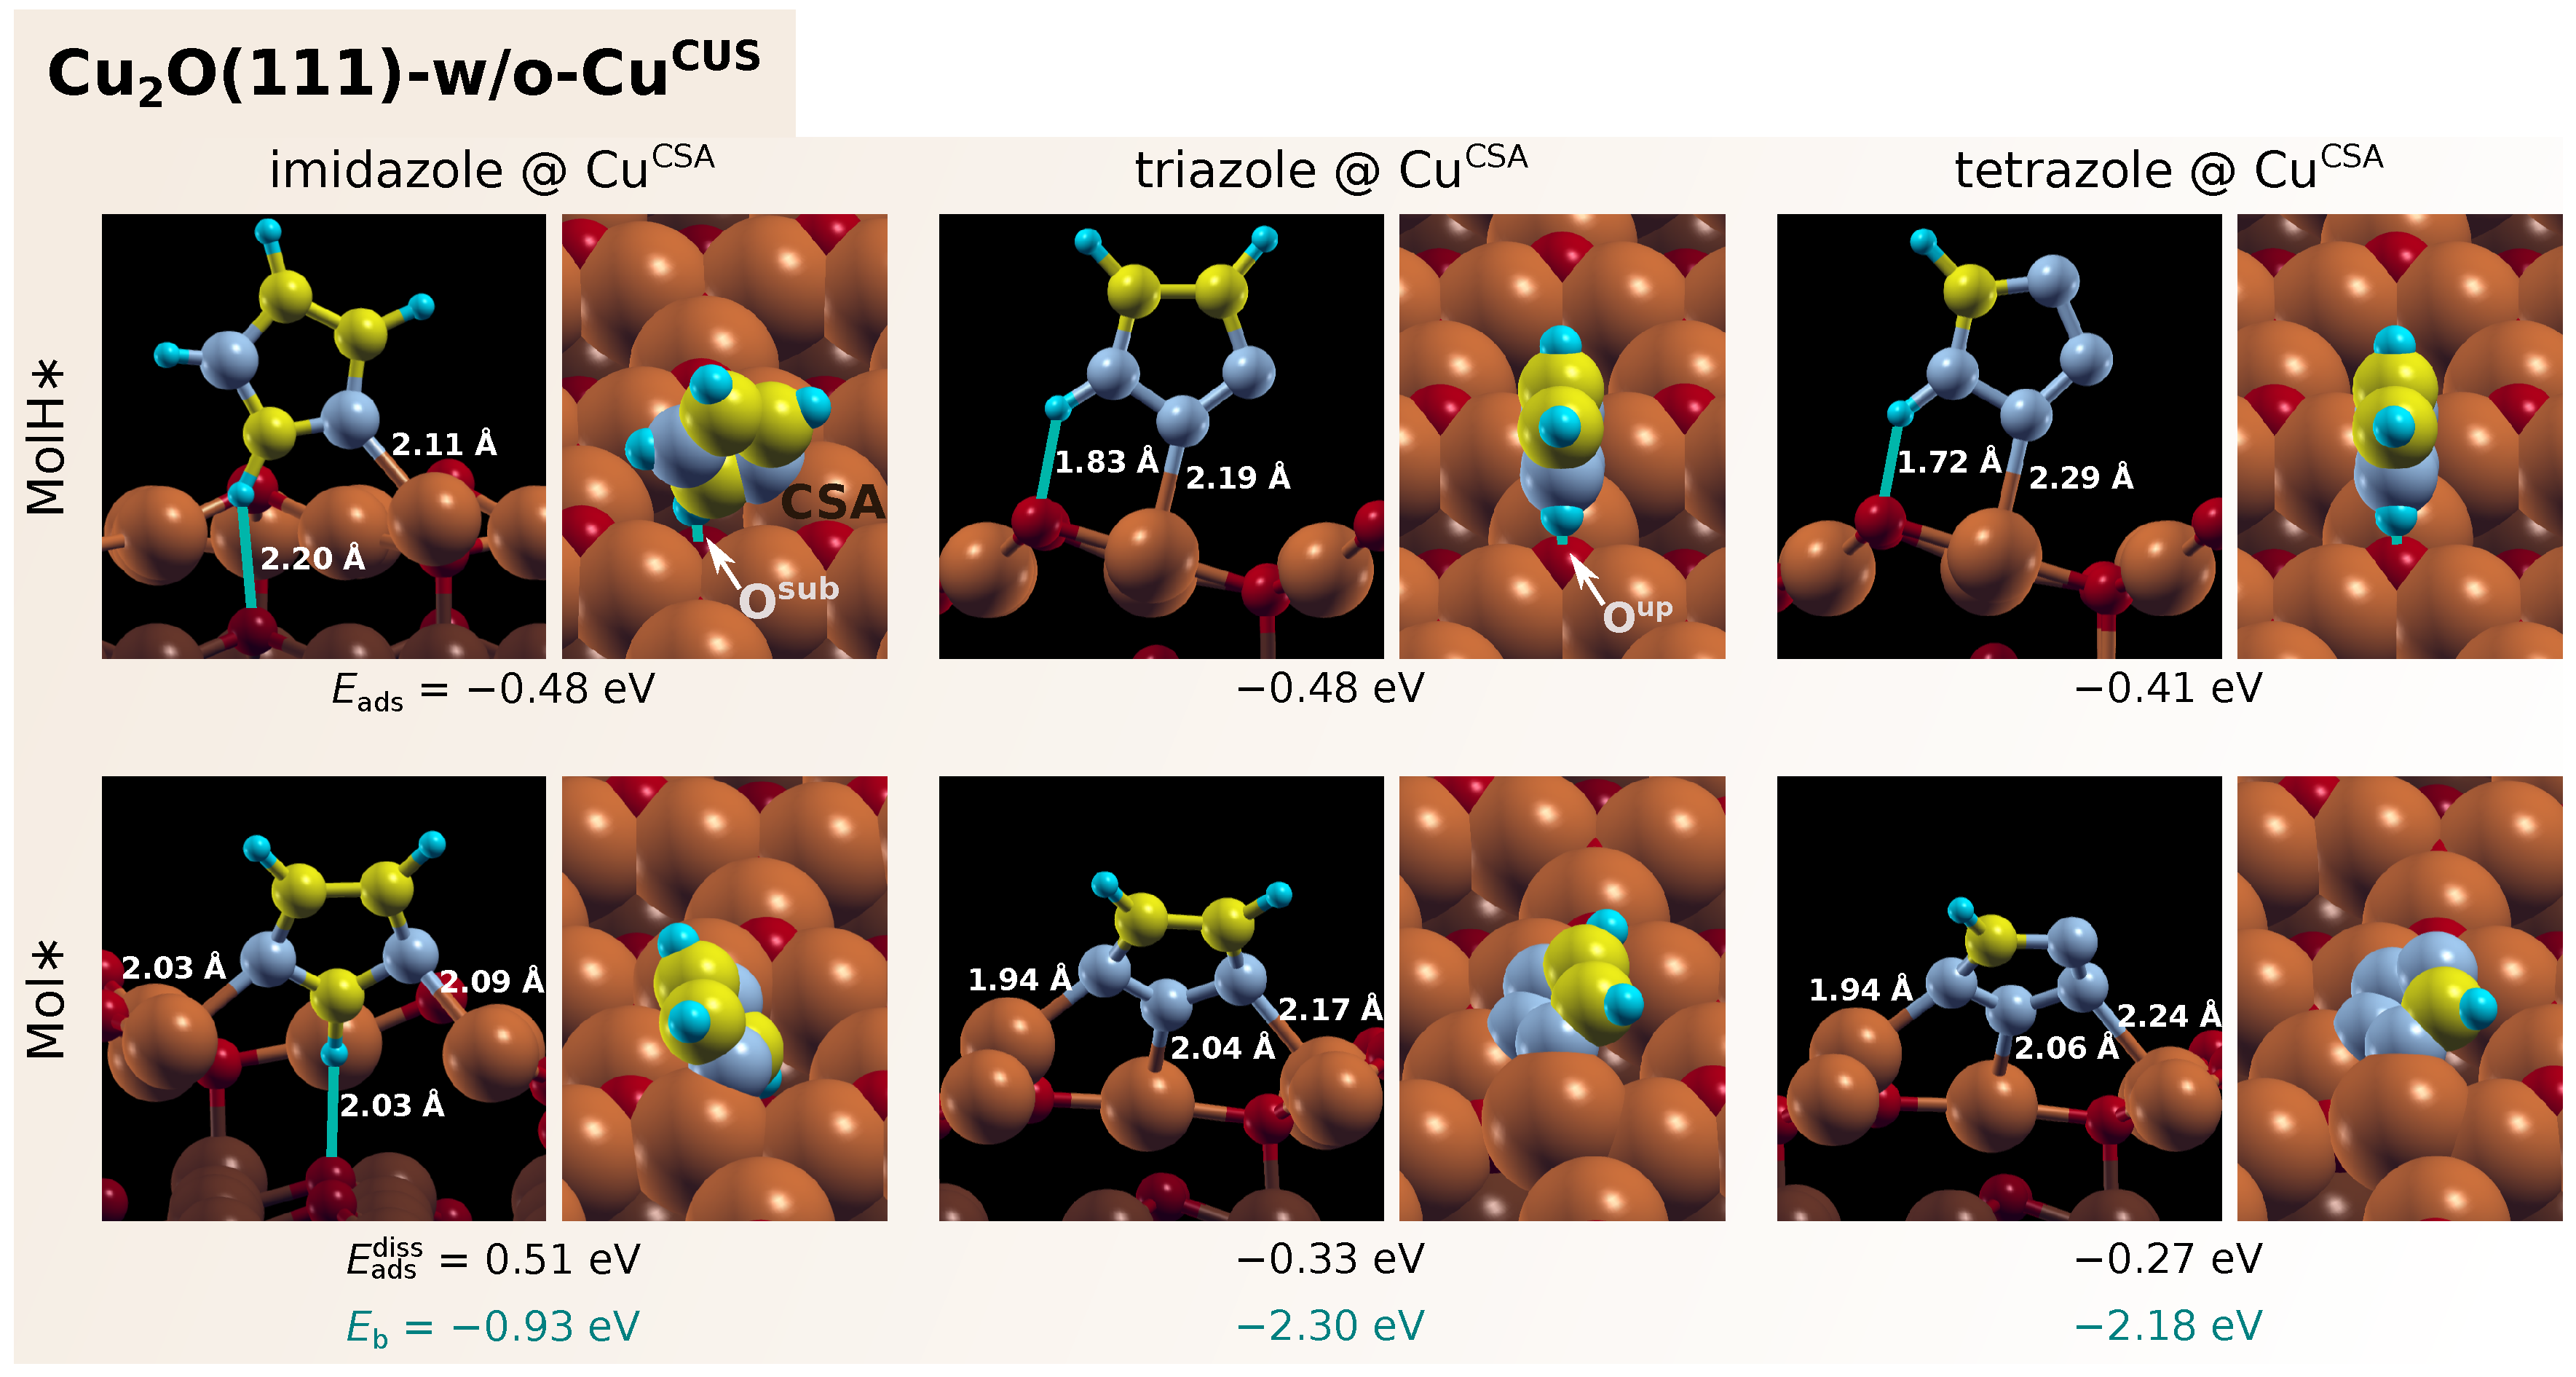
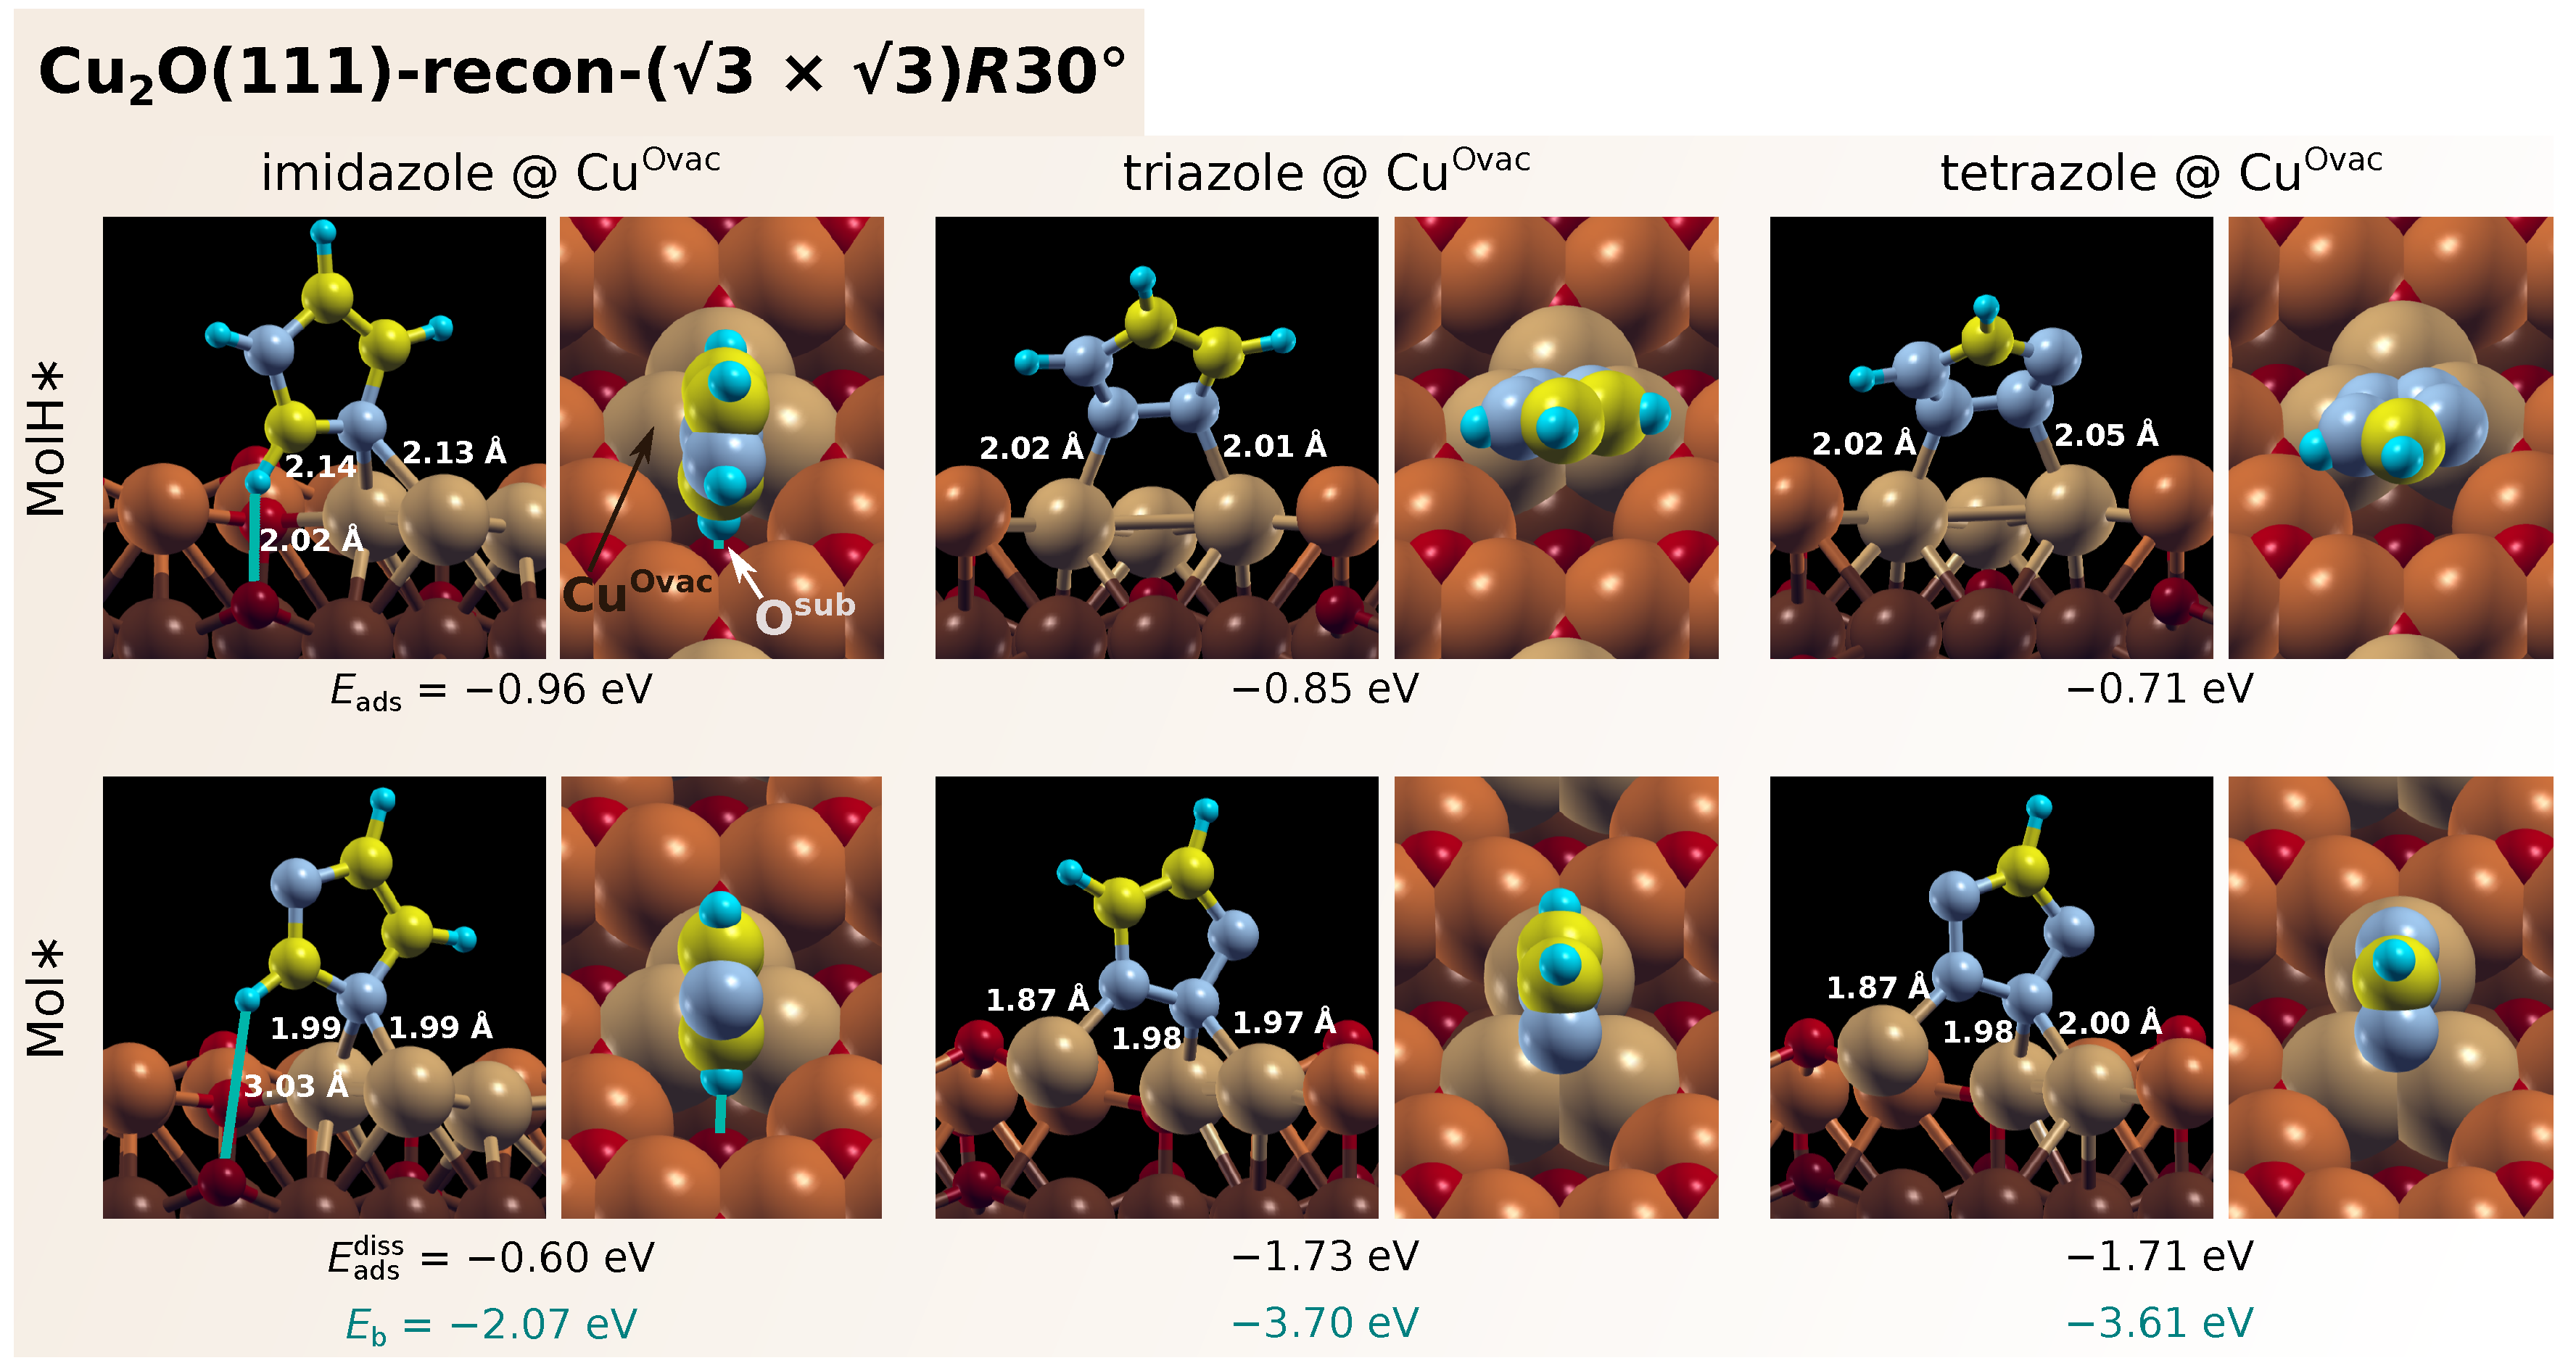
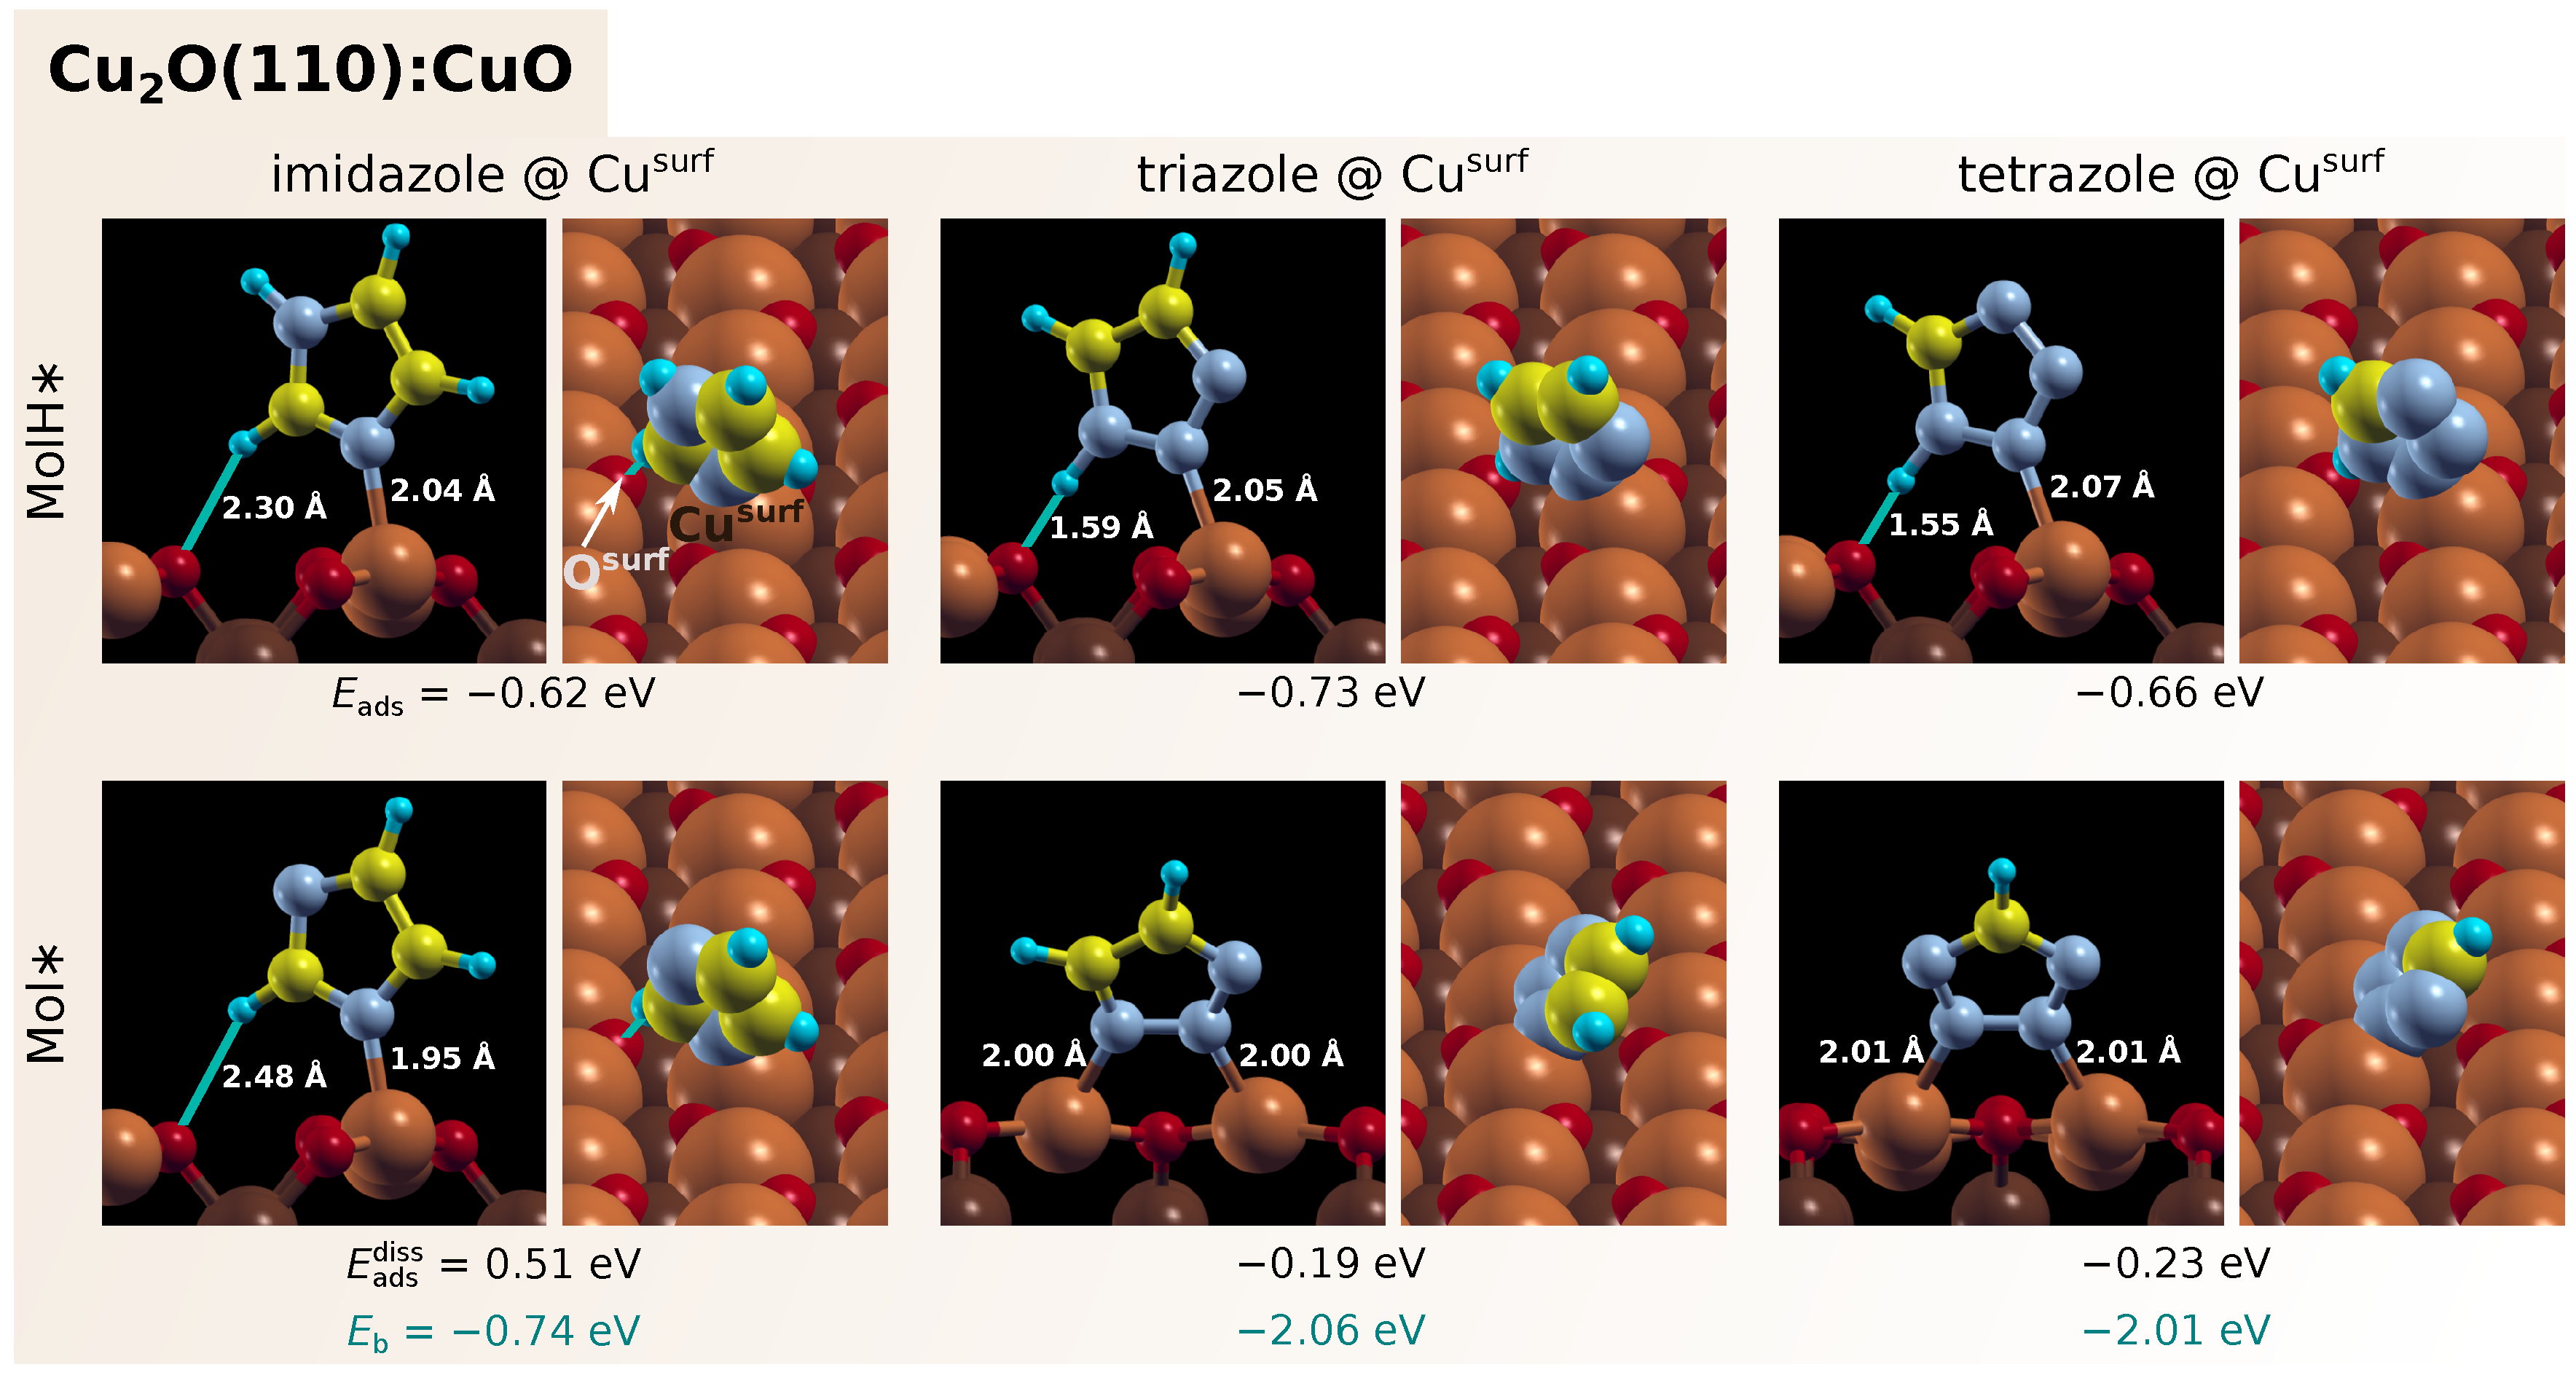
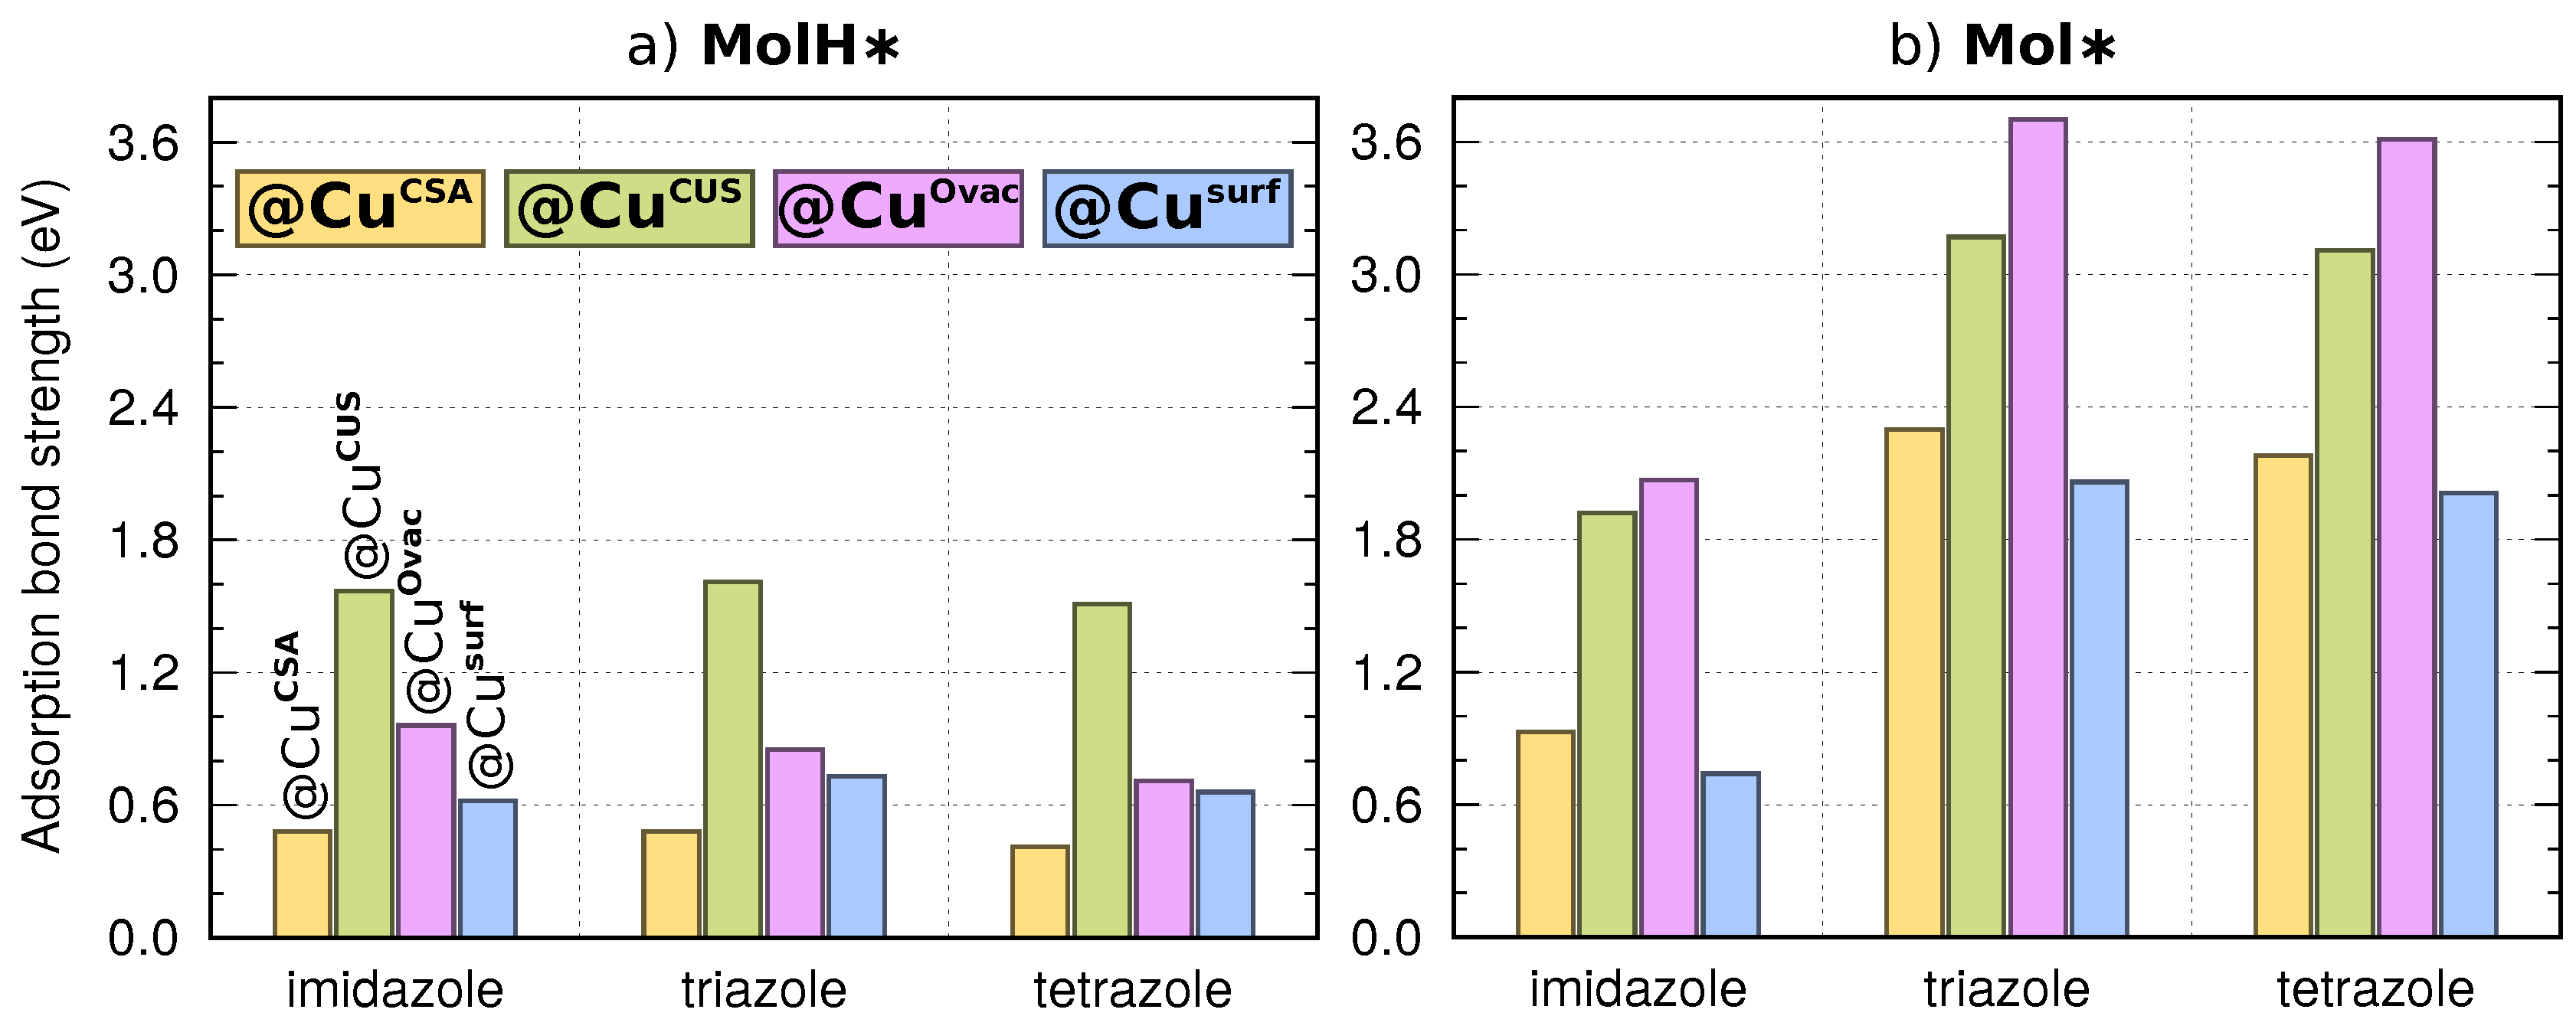
3.1. Adsorption of Standalone Molecules at Lower Coverage

The focus of this section is on the molecule–surface interactions (lateral intermolecular interactions will be considered in Part II [14]), hence we will analyze the adsorption at lower coverage. By lower coverage, we do not mean an extra low coverage, but instead some intermediate coverage, which is low enough that it allows for focusing predominantly on the molecule–surface interactions, even though at such coverage the long-ranged dipole–dipole interactions [15,17,48] may not yet be insignificant. To this end, calculations were performed by adsorbing a single molecule in the following surface supercells: ( 2 × 2 ) for the two Cu 2 O(111) based structures (Figure 3a,b), ( 3 × 3 )R30 for the reconstructed Cu 2 O(111) structure (Figure 3c), and 2 1 0 2 for the Cu 2 O(110):CuO (Figure 3d).
Figure 4, Figure 5, Figure 6 and Figure 7 display the most stable identified non-dissociative (MolH∗, top panels) and dissociative (Mol∗, bottom panels) adsorption modes—adsorption energies and molecule–surface bond lengths are also reported—for imidazole (left), triazole (middle), and tetrazole (right) on the four considered surface models, in particular: bonding to Cu CUS of Cu 2 O(111) w / o +1Cu CUS (Figure 4), Cu CSA of Cu 2 O(111)-w/o-Cu CUS (Figure 5), Cu Ovac of Cu 2 O(111)-recon-( 3 × 3 )R30 (Figure 6), and Cu surf of Cu 2 O(110):CuO (Figure 7). To facilitate the comprehension of binding energy trends of the adsorption structures presented in these figures, the respective binding energy magnitudes are presented schematically in Figure 8.
Intact molecules (MolH) typically adsorb with the molecular plane perpendicular to the surface (or nearly so) and form one N–Cu bond and one X–H⋯O hydrogen bond (X = C2 for ImiH or N1 for TriH and TetH), except when bonding to Cu Ovac sites (Figure 6), where ImiH binds with the N3 atom to two adjacent Cu Ovac ions and forms the C2–H⋯O sub hydrogen bond. TriH and TetH would also adsorb analogously via the N2 atom to two adjacent Cu Ovac ions and form the N1–H⋯O sub hydrogen bond; however, in this geometry, the N1–H bond breaks barrierlessly for TriH∗ and TetH∗ (this issue is considered in more detail in Section 3.3.3). Hence, alternative adsorption forms, which are less susceptible to N1–H bond cleavage, are depicted in Figure 6; in these forms, the TriH∗ and TetH∗ bind in a tilted geometry without hydrogen bonding and form two N–Cu Ovac bonds, such that each of the two N atoms (N2 and N3) binds to a different Cu Ovac ion.
It is evident from Figure 8a that all three molecules display similar non-dissociative adsorption energies; the largest binding energy difference between the two intact molecules adsorbed at a specific site is displayed by the ImiH and TetH bonded to Cu Ovac , 0.25 eV. Figure 8 further reveals that, in general, the molecules bind stronger to CUS than to CSA sites, although the specific geometry of the adsorption site matters, i.e., the two CUS and the two CSA sites display different reactivity and the trend of the non-dissociative adsorption bond strength is: Cu CUS ≫ Cu Ovac > Cu surf > Cu CSA . In particular, the bonding of intact molecules to Cu CUS sites is rather strong with the bond strength of about 1.5 eV, whereas at other sites it is considerably weaker, between 0.7 and 1 eV at Cu Ovac , about 0.7 eV at Cu surf , and about 0.5 eV at Cu CSA . Strong molecular adsorption at Cu CUS site is evident also from the N–Cu bond lengths, which are about 1.9 Å at Cu CUS and more than 2.0 Å at other sites.
In contrast to non-dissociative adsorption modes, where all the molecules display similar binding energies, considerable differences between the molecules appear for dissociative adsorption modes. In particular, dissociated imidazole (Imi∗) binds considerably weaker than dissociated triazole (Tri∗) and tetrazole (Tet∗). The reason is due to the molecular geometry: triazole and tetrazole have adjacent N atoms, but imidazole does not. Hence, Tri∗ and Tet∗ bond with at least two N atoms to Cu sites, whereas Imi∗ usually binds to the surface only with a single N atom because the other N atom is located on the other side of the molecule and is not available for bonding with the surface when imidazole adsorbs with its molecular plane perpendicularly to the surface (or nearly so). Similar differences between imidazole and triazole/tetrazole were also observed on metallic Cu(111) [16]. Note that in some cases Imi∗ can bond with both N atoms to the surface, provided its molecular plane is sufficiently tilted, but the resulting two N–Cu bonds are frustrated and such bonding is only by about 0.2 eV stronger than the single-atom perpendicular boning; e.g., this happens on Cu 2 O(111)-w/o-Cu CUS (Figure 5) and on Cu(111) [18]. The single N atom bonding of imidazole is also the reason that the difference in adsorption bond-strength between dissociated Imi∗ and intact ImiH∗ is considerably smaller compared to those displayed by triazole and tetrazole, i.e., for imidazole the Mol∗ vs. MolH∗ the difference ranges from 0.1 eV at Cu surf to 1.1 eV at Cu Ovac , whereas, for triazole and tetrazole, it ranges from about 1.6 eV at Cu CUS to about 2.9 eV at Cu Ovac . The difference between the MolH∗ and Mol∗ binding is the largest at the Cu Ovac site because the Mol∗ species bind the strongest to it, but the MolH∗ species bind the strongest to Cu CUS instead. Namely, for intact MolH species, a single N–Cu bond is sufficient for effective adsorption (note that Cu CUS ion is standalone), whereas, for strong adsorption of dissociated Mol∗ species, at least two N–Cu bonds are required. The Cu Ovac site is therefore preferred for Mol∗ species because it consists of three adjacent Cu Ovac ions (see Figure 1) and can form two strong N–Cu Ovac bonds (Tri∗ and Tet∗ form one single and one bifurcated N–Cu Ovac bond, Figure 6), but, at the Cu CUS site, the Mol∗ species can form only one N–Cu CUS bond; Tri∗ and Tet∗ thus form the second bond with the adjacent Cu CSA ion (Figure 4), which is considerably less reactive. The trend of the adsorption bond-strength of Mol∗ at different surface sites is therefore Cu Ovac > Cu CUS ≫ Cu CSA > Cu surf (Figure 8). For Imi , the respective binding energies are about 2 . 1 , 1 . 9 , 0 . 9 , and 0 . 7 eV at Cu Ovac , Cu CUS , Cu CSA , and Cu surf , respectively, whereas, for Tri∗ and Tet , these values are about 3 . 7 , 3 . 1 , 2 . 2 , and 2 . 0 eV, respectively.
Given the fact that Mol∗ species bind the strongest to the Cu Ovac site (i.e., at the oxygen vacancy), we also modeled the adsorption of Mol at an O-vacancy on Cu 2 O(110):CuO surface using the Cu 2 O(110):CuO-w-Ovac model (cf. Figure 1f). Note that O-vacancy at Cu 2 O(110):CuO results in a triplet of unsaturated Cu ions beneath it; this triplet has the same local structure as the Cu Ovac site on Cu 2 O(111)-recon-( 3 × 3 )R30 . The resulting structures along with binding energies are shown in Figure 9. The binding energies of Mol∗ at Cu ( 110 ) Ovac site on Cu 2 O(110):CuO-w-Ovac are very similar to those obtained at Cu Ovac site on Cu 2 O(111)-recon-( 3 × 3 )R30 (compare Figure 9 with the bottom part of Figure 6).

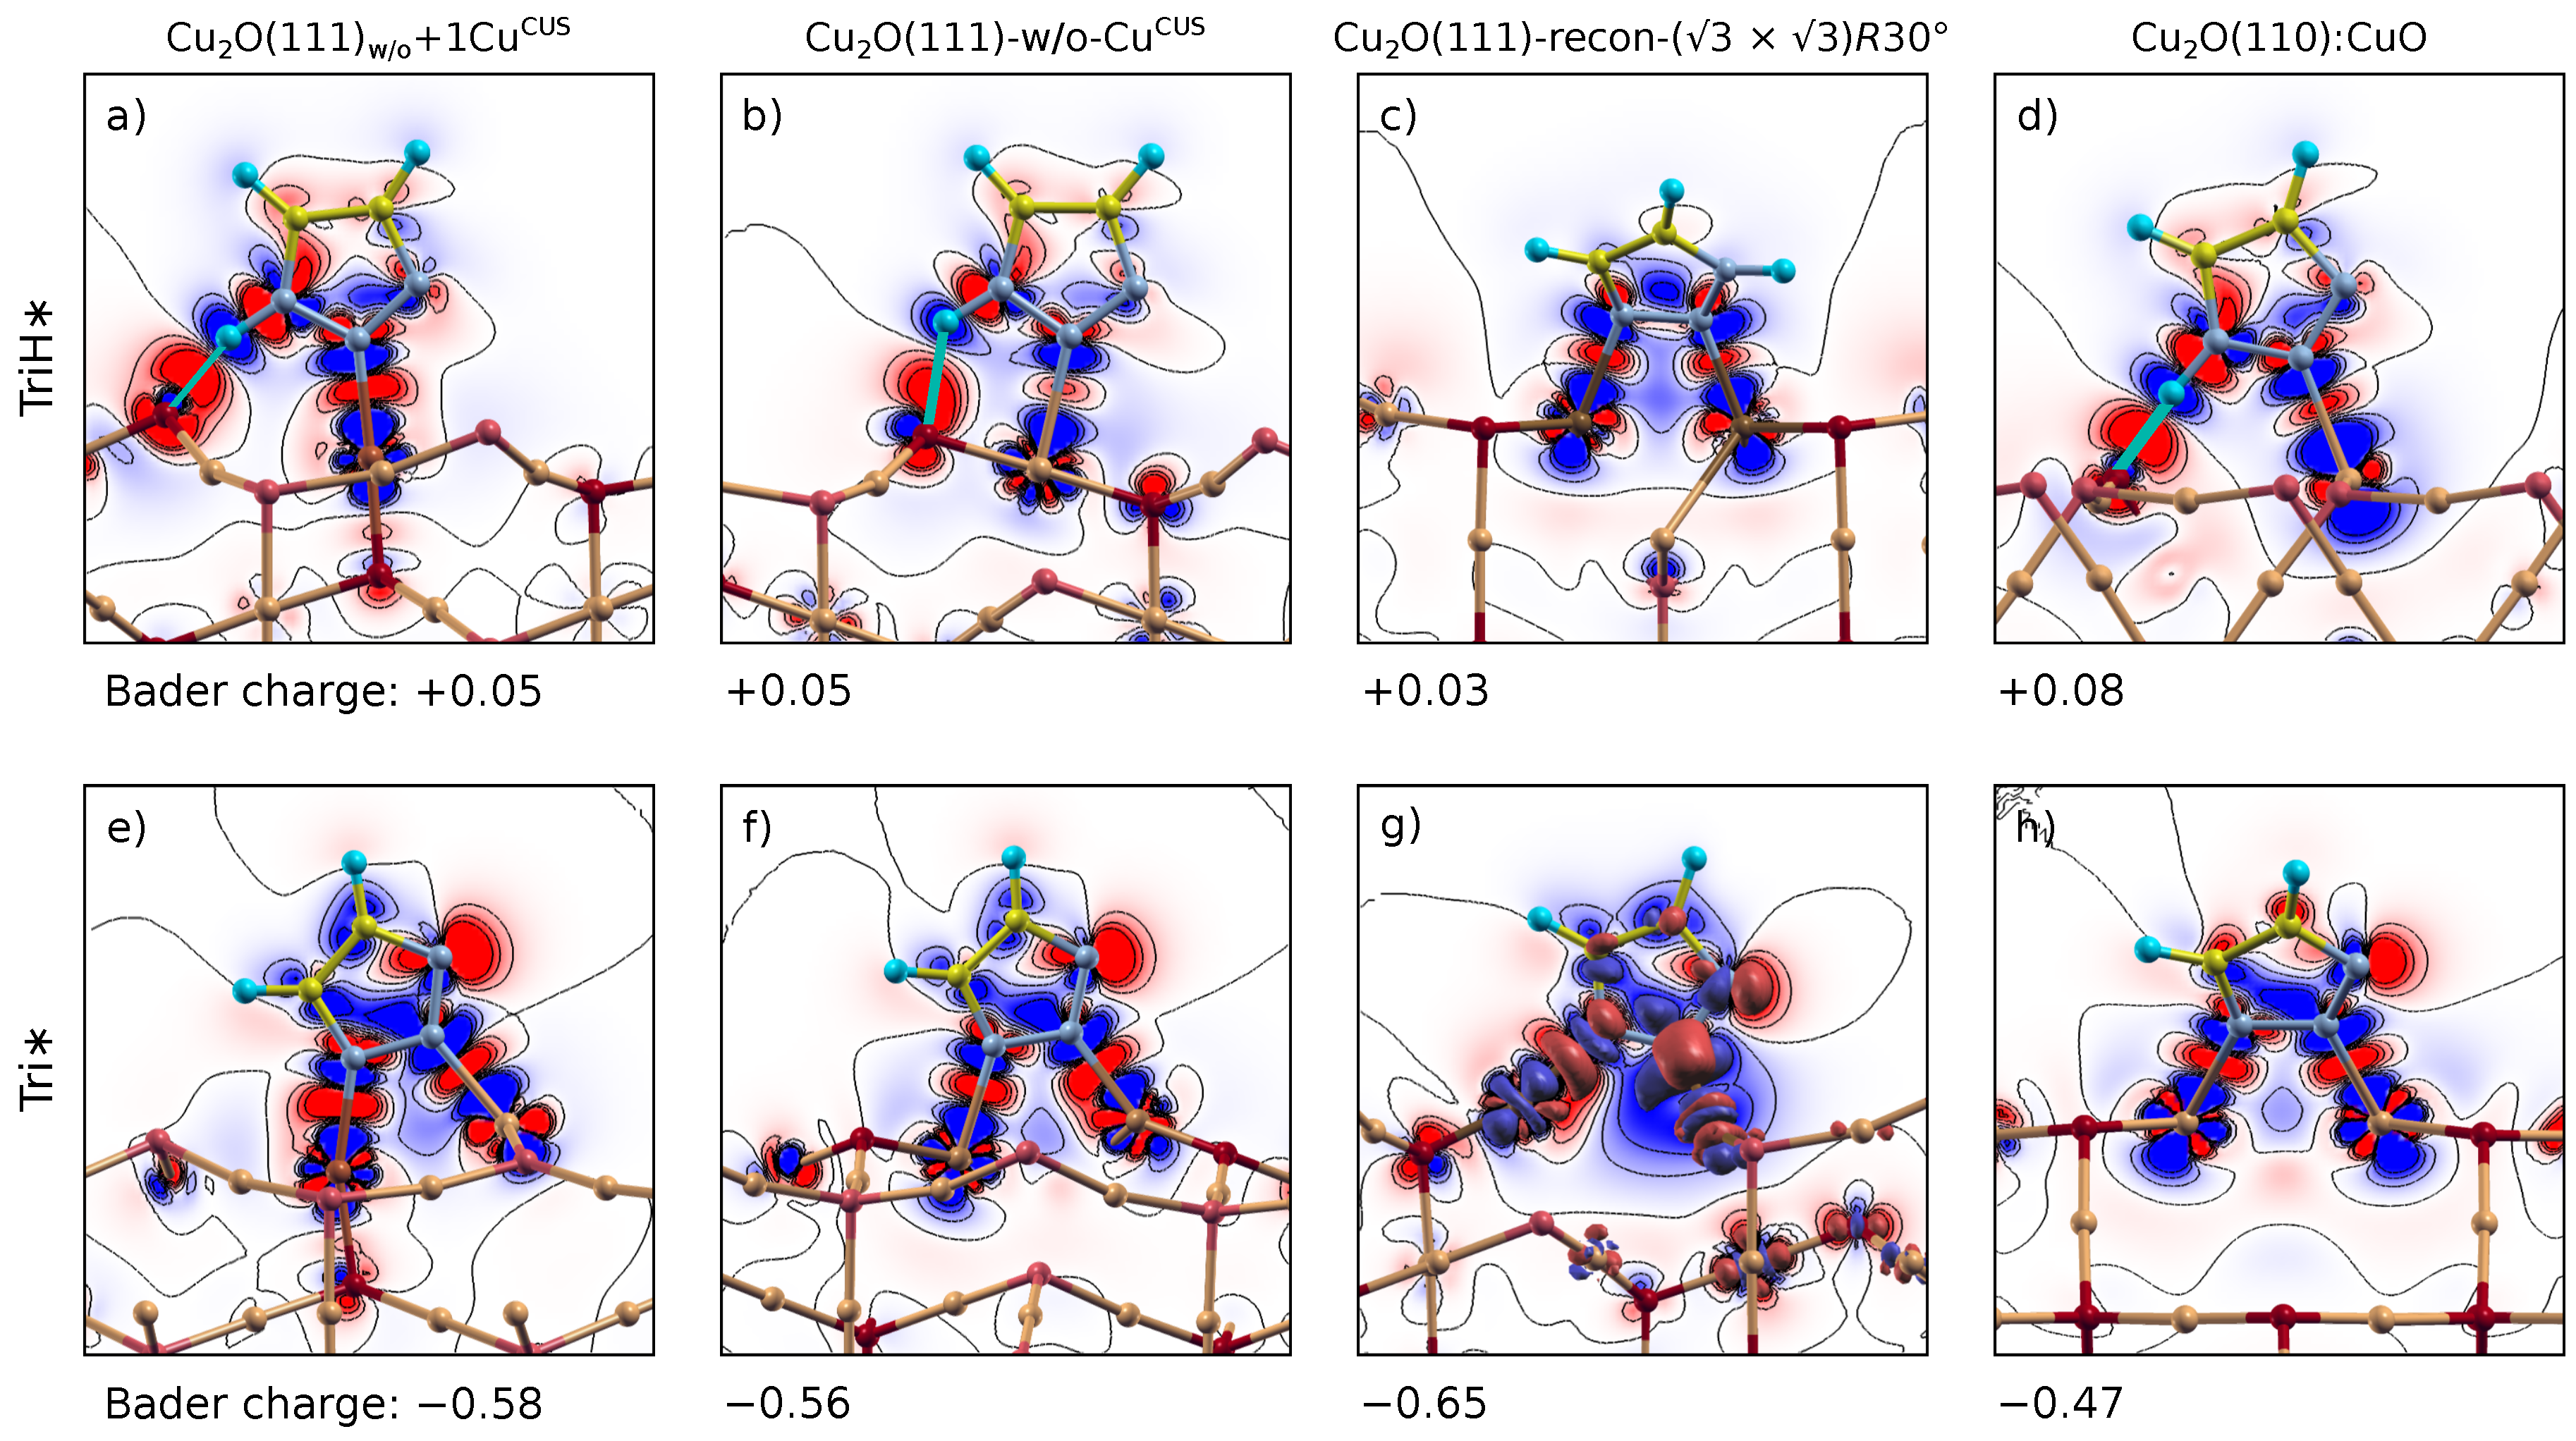
3.2. Electronic Structure Analysis

To shed some light onto the nature of the molecule–surface bonding, we utilize the charge density difference, Δ ρ ( r ) of Equation (9), which is presented in Figure 10, where red (blue) color represents the electron charge excess (deficient) regions; top-row shows the MolH–surface and bottom-row the Mol–surface bonding. For the sake of brevity, the Δ ρ ( r ) is plotted only for the triazole molecule, which was chosen because its electronegativity and chemical-hardness are in between that of imidazole and tetrazole [15] (triazole can thus be seen to represent the average behavior of the three).
As for the TriH–surface bonding (top-row), the Δ ρ ( r ) plots clearly reveal the N–Cu bonds (note the red electron charge accumulation lobe in the midst of the N–Cu bonds) as well as the N1–H⋯O hydrogen bonds (note the red charge accumulation region above the O ion in the direction towards the H atom of the triazole). The intensity of the red charge accumulation lobe in the midst of the N–Cu bonds follows the reactivity trend of Cu ions towards the bonding to MolH, i.e., Cu CUS > Cu Ovac > Cu surf > Cu CSA . Indeed, the N–Cu CSA bond clearly displays the faintest red lobe. Bader population analysis reveals that the charge of TriH∗ is slightly positive on all considered Cu sites, ranging from +0.03 on Cu 2 O(111)-recon-( 3 × 3 )R30 site to +0.08 on Cu 2 O(110):CuO.
As for dissociated adsorption modes, the Δ ρ ( r ) plots reveal that Tri–surface bonding is stronger than the TriH–surface bonding because the charge accumulation and deficit regions are more intense for the former, in particular, the red electron charge accumulation lobes in the midst of the N–Cu bonds are more intense for Tri∗ compared to TriH∗. According to Bader population analysis, the Tri∗ is negatively charged, but it is not fully anionic. Instead, it is about midway between the Tri radical and Tri anion. In particular, molecular charges are 0 . 58 , 0 . 56 , 0 . 65 , and 0 . 47 for Tri∗ bonded to Cu CUS , Cu CSA , Cu Ovac , and Cu surf , respectively. These Bader charges moderately correlate with Tri∗ binding energies at these sites (the correlation coefficient is 0.91), i.e., the larger the negative charge of Tri∗ is, the stronger is its bonding. The charges obtained on the first three sites, which belong to Cu 2 O(111) type surfaces, are similar to the Tri∗ charge of 0 . 61 obtained on Cu(111) [16].
We further calculated Bader charges for all the three molecules adsorbed on the Cu CUS site (Table 1). For intact MolH∗, Bader charges are +0.13, +0.05, and +0.02 for imidazole, triazole, and tetrazole, respectively, whereas, for dissociated Mol∗, Bader charges are 0 . 41 , 0 . 58 , and 0 . 64 for Imi∗, Tri∗, and Tet∗, respectively. Bader charges thus follow the imidazole > triazole > tetrazole trend (i.e., tetrazole has the most negative charge) for both MolH∗ and Mol∗ adsorption modes, which is in accordance with their Mulliken electronegativity, i.e., imidazole is the least and tetrazole the most electronegative [16]. Respective correlations between molecular Bader charges of adsorbed molecules and their electronegativities are shown in Figure 11a (Mulliken electronegativities are taken from Ref. [16] and were calculated from vertical ionization potentials (I) and electron affinities (A) that were obtained from the X X + + e and X X + e reactions, respectively, where X Mol or MolH). It is worth noting that these molecular Bader charges show no relation to the adsorption bonding trend for the three molecules, which may seem surprising although such behavior is not unknown. For example, Stenlid et al. [49] observed recently in their study of several probe molecules on TiO 2 nanoparticles that larger charge transfer does not necessarily lead to stronger interaction energies. In contrast to molecular charges, Bader charges of bare Cu ions before molecular adsorption (+0.72, +0.68, +0.34, and +0.29 for Cu surf , Cu CSA , Cu CUS , and Cu Ovac , respectively) correlate remarkably well with adsorption binding energies of dissociated molecules, i.e., the smaller the charge of the Cu ion is, the stronger is its bonding with the Mol∗ (Figure 11b). Dissociated molecules are negatively charged in the adsorbed state and it seems that the less the Cu ion is positively charged, the easier is the charge flow to the molecule and consequently the Cu ion is more susceptible to bonding with Mol∗.
In contrast, such correlations are much weaker for neutral molecules—the correlation coefficients are only 0.80, 0.67, and 0.62 for ImiH∗, TriH∗, and TetH∗, respectively—and the reason for this can be associated with the following two observations: (i) the adsorption induced charge transfer for MolH∗ is very small and in the opposite direction with respect to that of Mol∗ and (ii) the MolH–surface bonding also involves an H-bond, which is due to the availability of the nearby O ion, and it can be seen from the top row of Figure 10 that some sites have a more appropriate geometry than others for the formation of an H-bond. Although the adsorption energies of MolH∗ and Bader charges of bare Cu ions do not show the same trend—the adsorption energies display the Cu CUS < Cu Ovac < Cu surf < Cu CSA and Cu Bader charges the Cu Ovac < Cu CUS < Cu CSA < Cu surf trend—it is possible to make a classification into the following two groups: (i) unsaturated Cu CUS and Cu Ovac ions are less positively charged and bind MolH stronger, whereas (ii) saturated Cu surf and Cu CSA ions are more positively charged and bind MolH weaker.

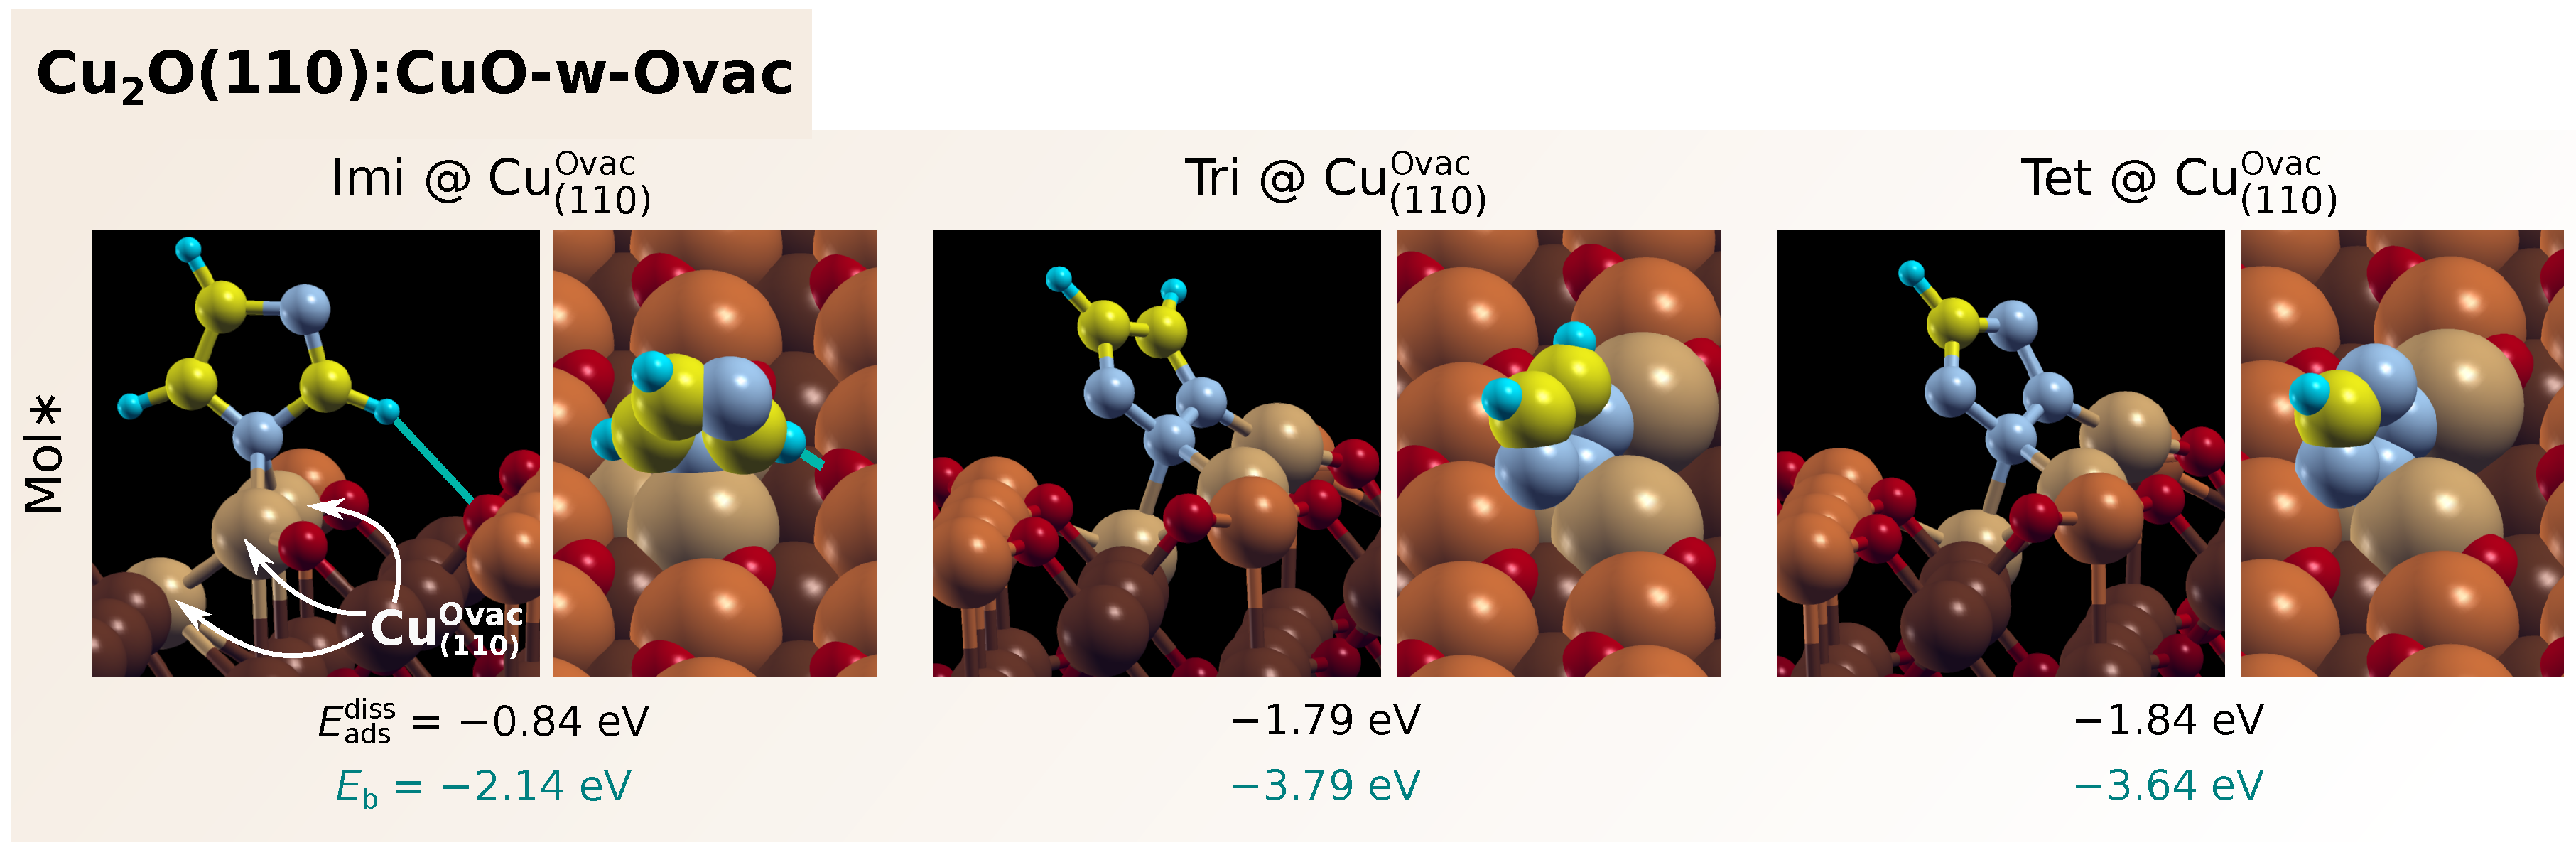
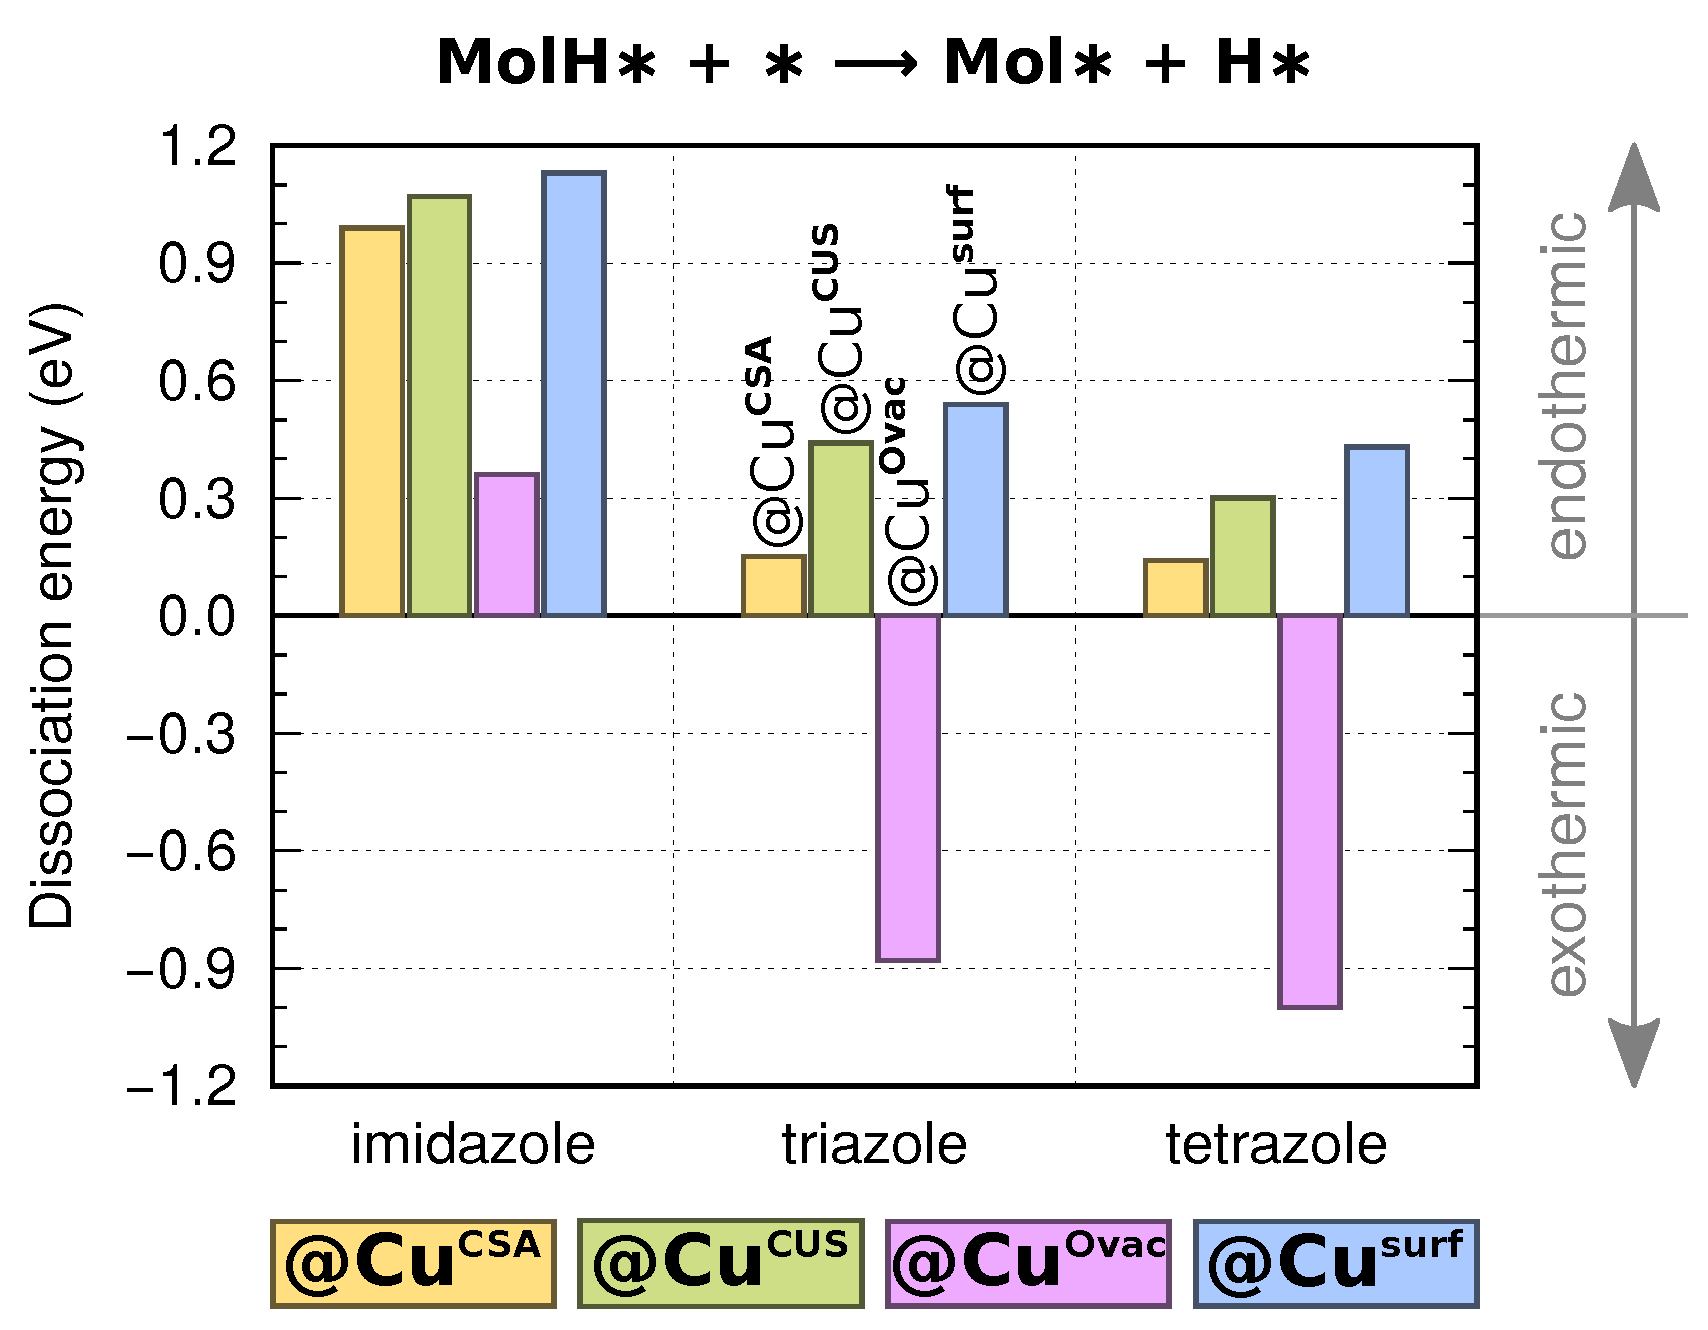
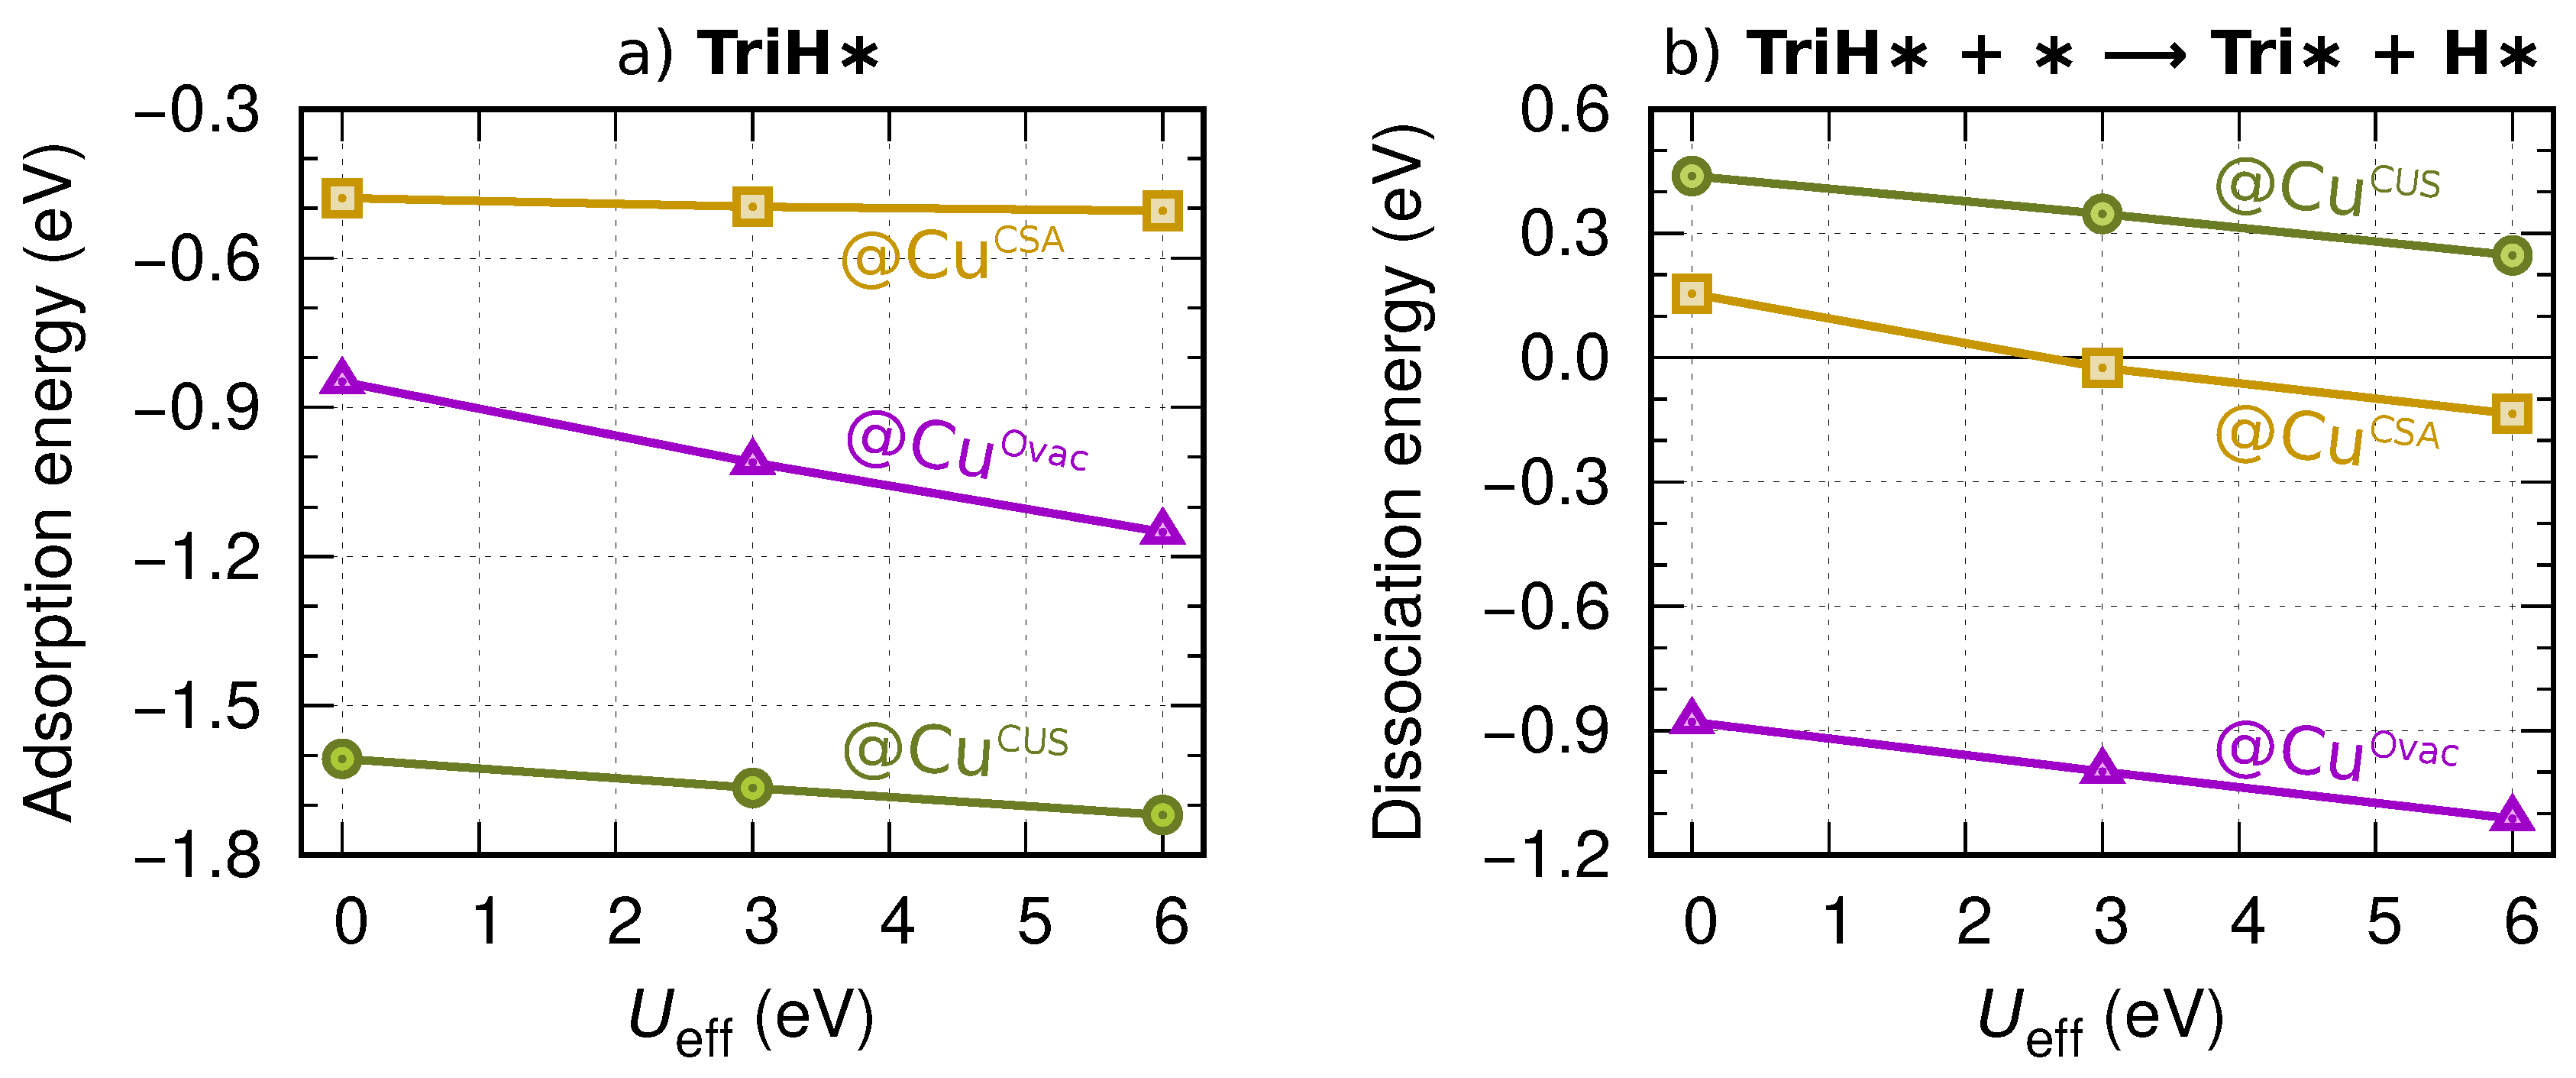
3.3. Dissociation of Adsorbed Azole Molecules, MolH∗ + ∗ → Mol∗ + H∗

Despite the fact that dissociated Mol∗ species bind considerably stronger to the surface than intact MolH∗ species (Figure 8), the stronger bonding is not sufficient to compensate for the cost of the N1–H bond cleavage in the majority of currently considered cases. This is evident from Figure 12, which plots the dissociation energy for the MolH∗ + ∗→ Mol∗ + H∗ reaction. The respective dissociation reaction is exothermic only if E ads diss < E ads , cf. Equation (8), and this condition is met only for triazole and tetrazole bonded to O vacancies, that is, Cu Ovac sites on Cu 2 O(111)-recon-( 3 × 3 )R30 and Cu ( 110 ) Ovac sites on Cu 2 O(110):CuO-w-Ovac (the latter sites are not considered in Figure 12). The results for triazole are in good agreement with those published previously for benzotriazole [27]: the Δ E values for both molecules are about 0.1, 0.4, and 0.5 eV at Cu CSA , Cu CUS , and Cu surf sites, respectively. Figure 12 further reveals that dissociation is by far the most endothermic for imidazole, which is due to the small difference in adsorption bond-strength between intact ImiH∗ and dissociated Imi∗ discussed above; this small difference stems from single N atom bonding of Imi∗.

3.3.1. Bonding of H to Various Sites on Cu 2 O Surfaces

To complete the description of the dissociation reaction, MolH∗ + ∗→ Mol∗ + H∗, we also need to describe the bonding of H to various sites on Cu 2 O surfaces. It seems intuitive to assume that H∗ bonds to O surface sites. Calculations indeed confirm this anticipation; however, they also reveal that H can bond strongly to unsaturated Cu ions (Table 2), in agreement with previous studies [23,50]. Notably, H binds the strongest to hollow site consisting of three adjacent Cu Ovac or Cu ( 110 ) Ovac ions ( E b = 3 . 3 eV), i.e., by about 0.3 eV stronger than to unsaturated O sub ( E b = 3 . 0 eV) and O up ( E b = 2 . 9 eV) sites. Table 2 summarizes the calculated adsorption data for H adsorbed at various sites on Cu 2 O surfaces, whereas the corresponding structures are depicted in Figure 13. Our calculated H–O and H–Cu bond lengths are in good agreement with those reported in the literature [23,50]. Bader analysis reveals that although H bonded to O sites is positively charged, it is not fully a proton—its Bader charge is about +0.6. In agreement with Yu et al. [50], we also find that the Bader charge of H adsorbed to unsaturated Cu sites is significantly negative, being about 0 . 2 at Cu CUS and 0 . 3 at Cu Ovac and Cu ( 110 ) Ovac , while the charge of H adsorbed at saturated Cu sites is close to zero.

3.3.2. Co-Adsorption of Mol and H

Comparison of Mol∗ data presented in Figure 8 and H∗ data presented in Table 2 clearly reveals that, after the dissociation, the preferred co-adsorption structures consist of Mol∗ bonded to Cu sites and H∗ bonded to O sites; the latter thus forms an OH group at the surface. This is true even for Cu Ovac and Cu ( 110 ) Ovac sites, to which H∗ binds stronger than to O sites. However, the H∗ preference for Cu Ovac sites (0.3 eV) is considerably smaller compared to that of Mol∗ (about 1.4 eV; this number is the difference between the E b of Mol∗ on Cu CSA and Cu Ovac sites). The dissociation of adsorbed azole molecules can therefore be written such that the formation of an OH∗ group is indicated:
MolH + O Mol + OH ,
where O∗ indicates a given lattice O ion at the surface of Cu 2 O.

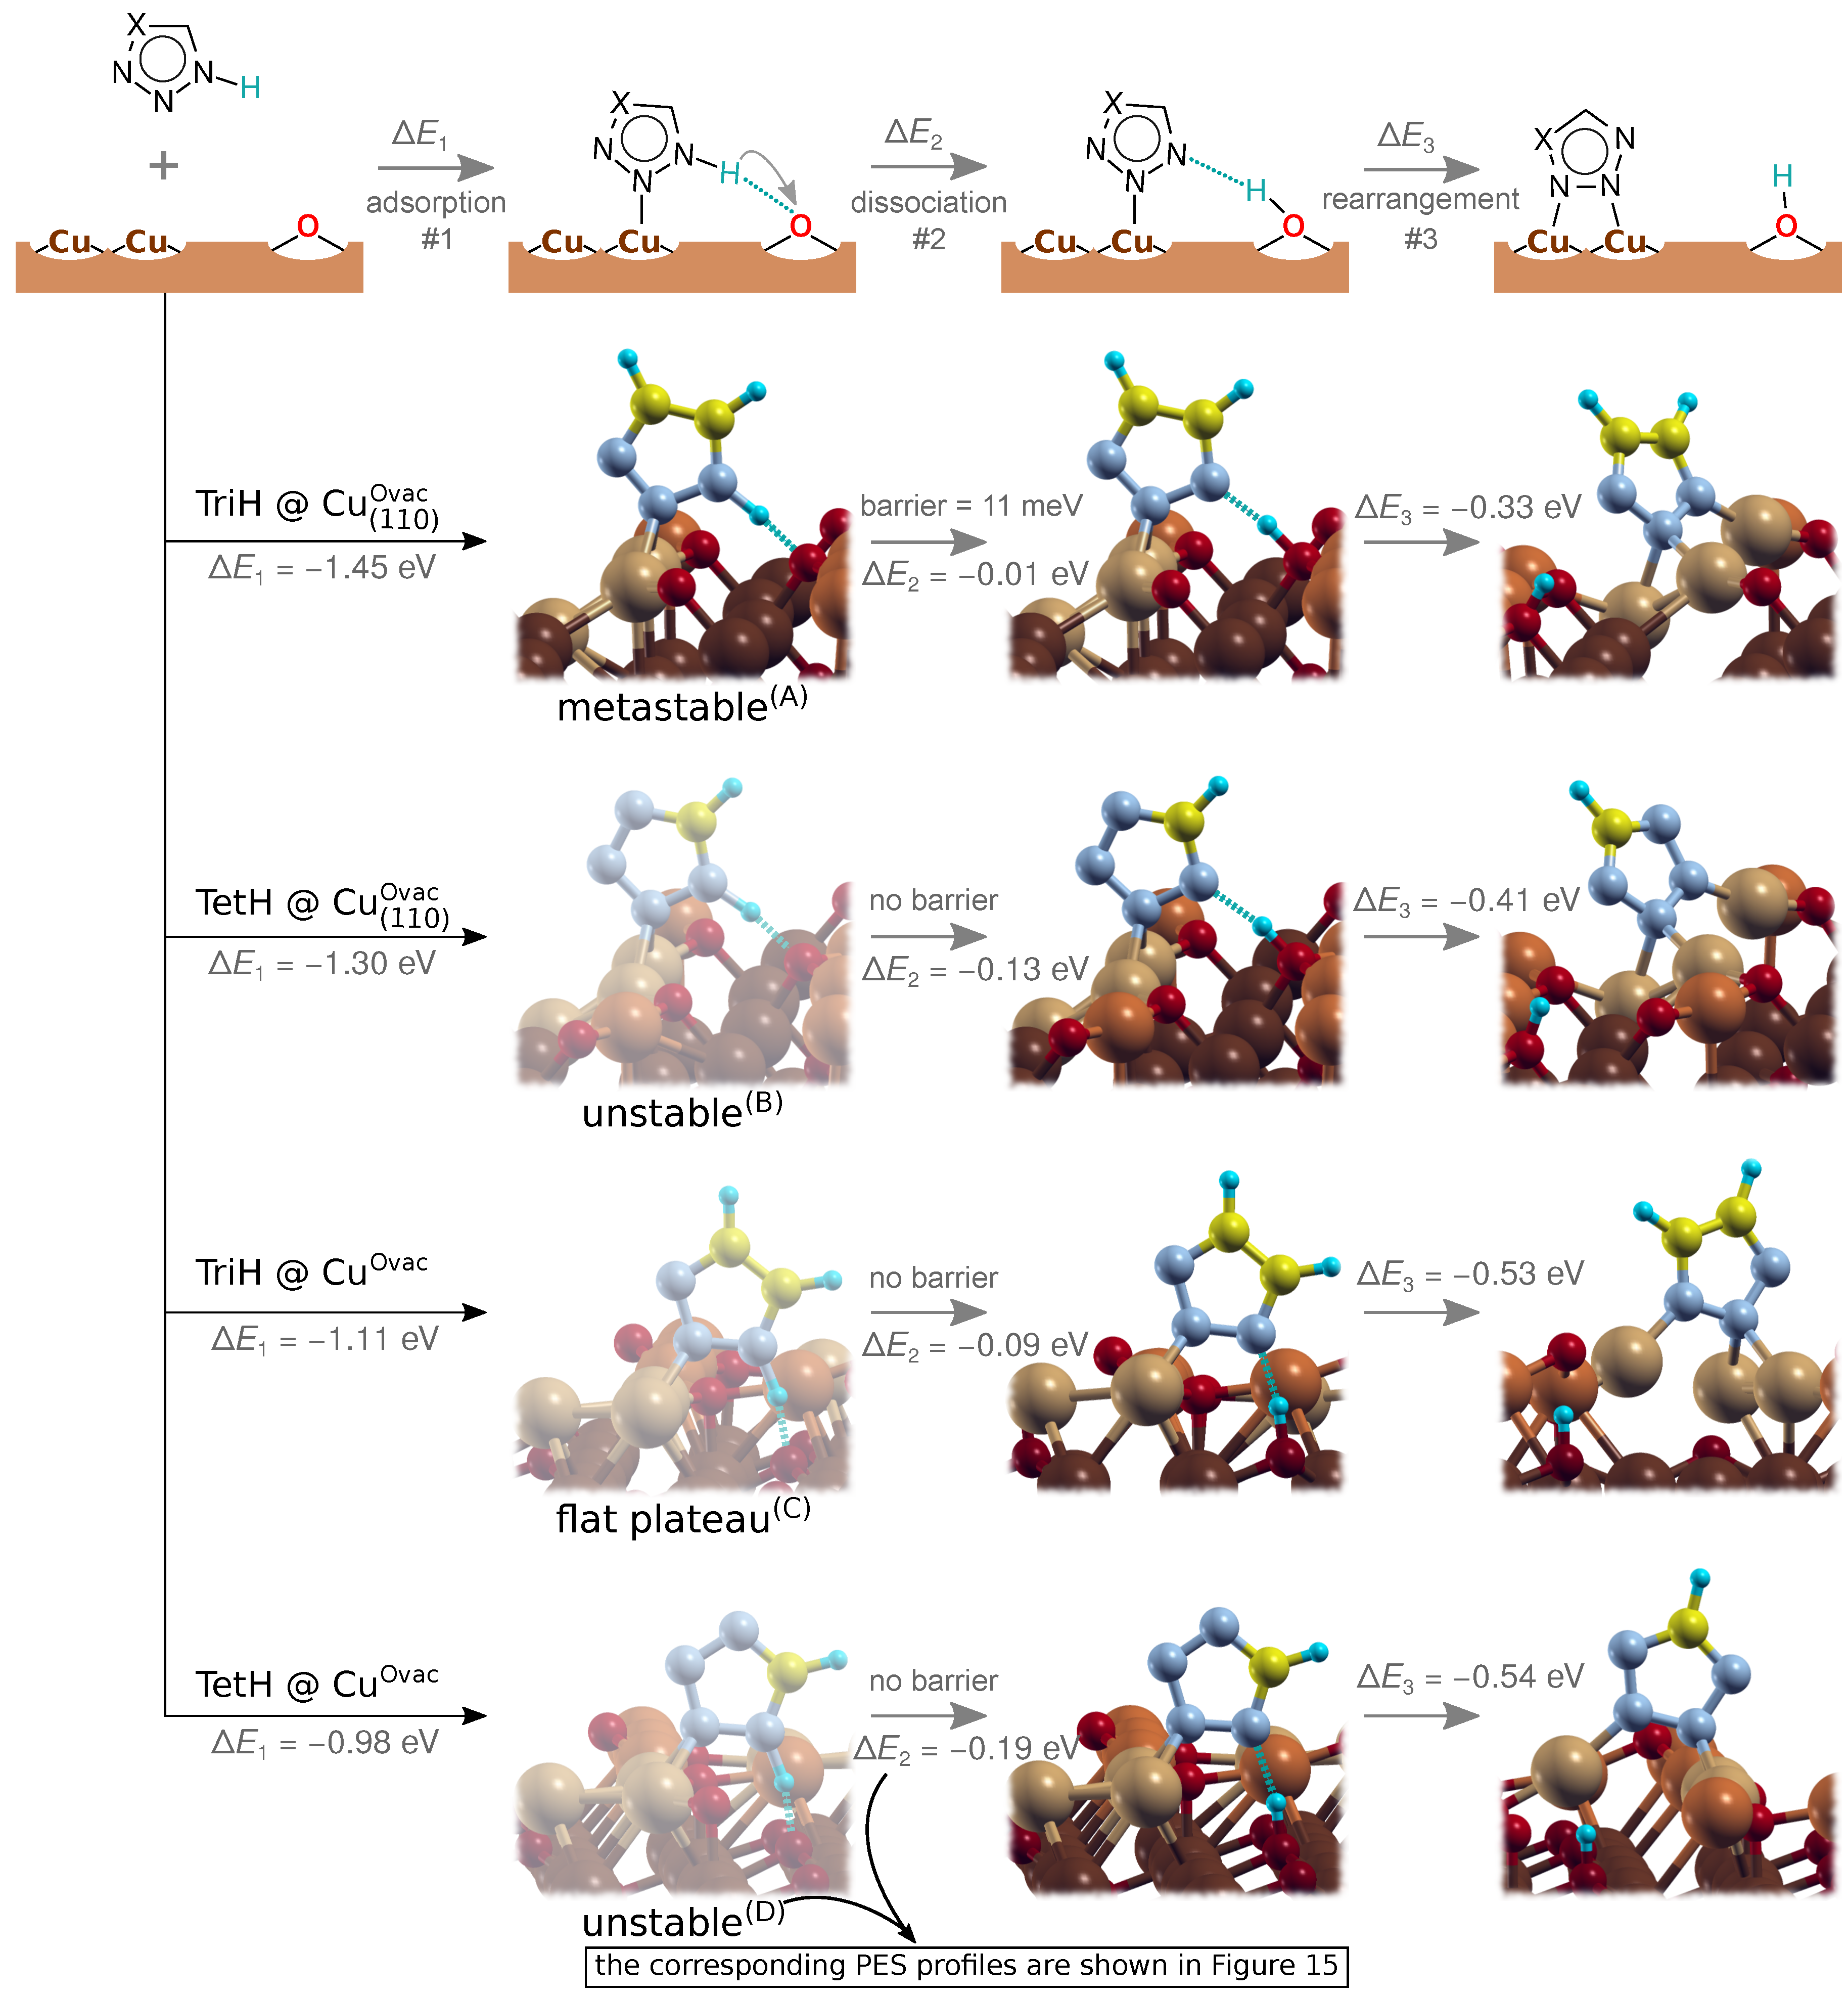
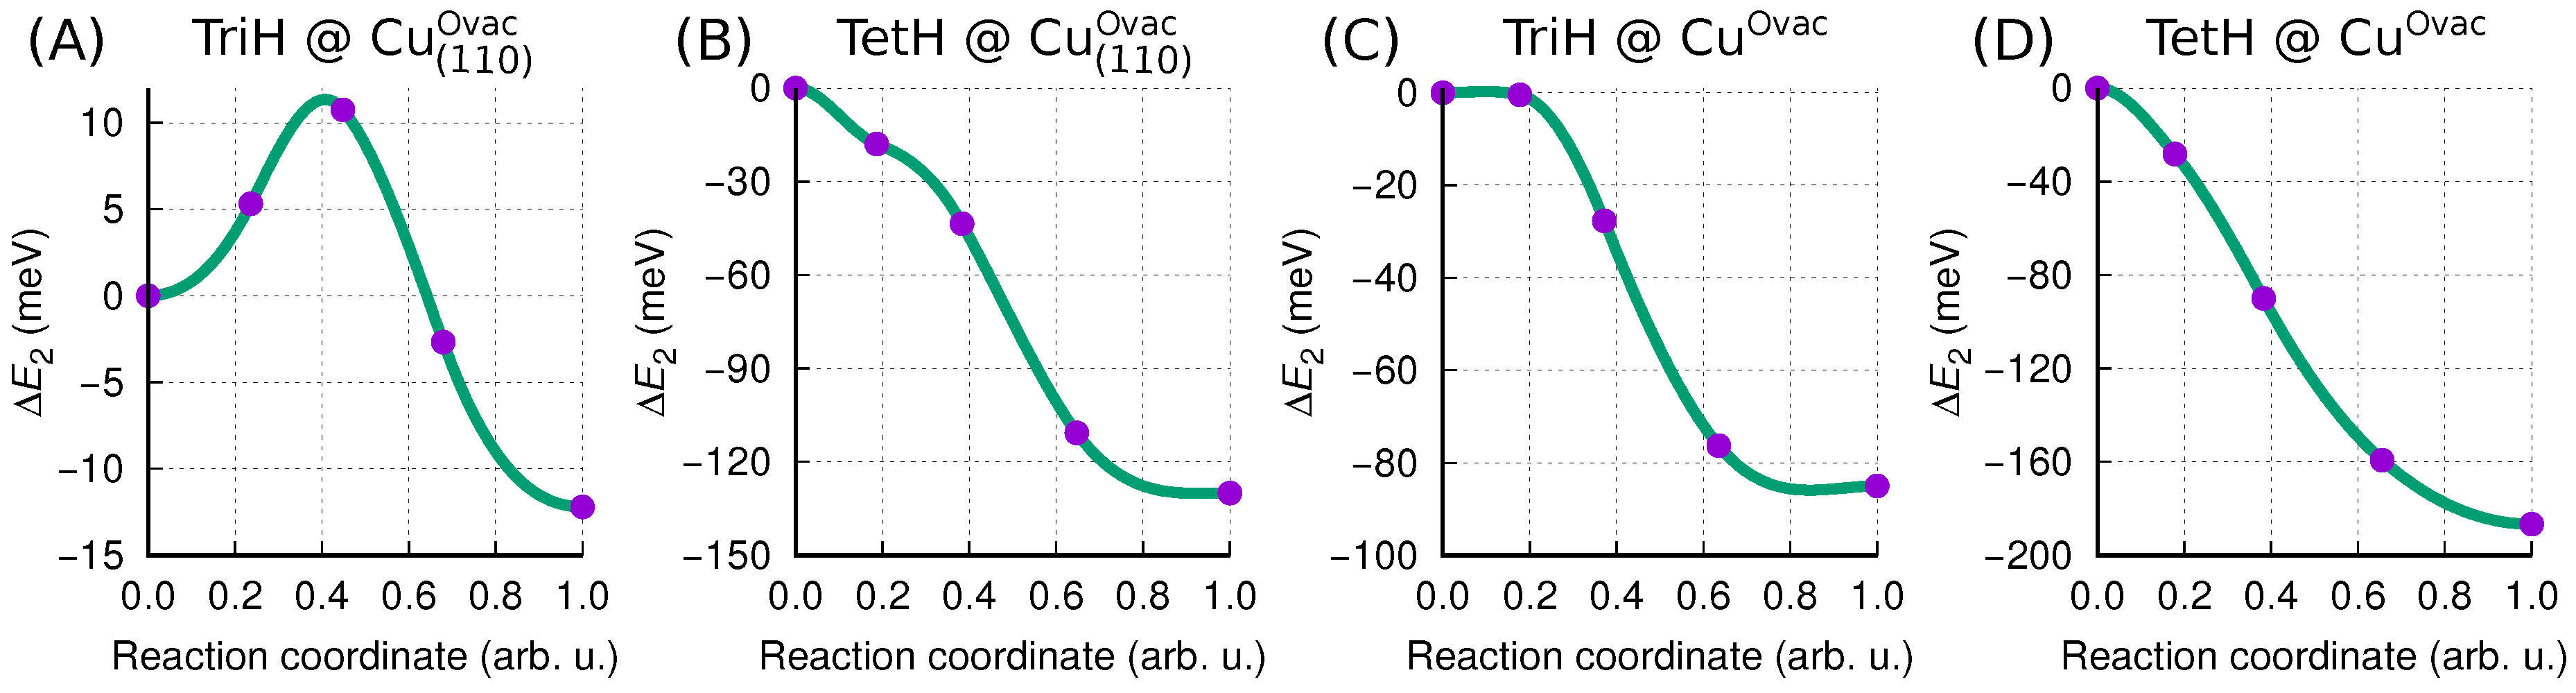
3.3.3. Mechanistic Insight into MolH∗ + O∗ → Mol∗ + OH∗ Dissociation

Figure 14 schematically illustrates the mechanism of dissociative adsorption of triazole and tetrazole on oxygen vacancy Cu Ovac and Cu ( 110 ) Ovac sites along with the involved energy differences. These two sites are specifically considered because the dissociation is favorable only thereon (cf. Figure 12). According to our calculations, the dissociation of triazole and tetrazole on these sites is very facile. Namely, for a properly oriented molecule, the dissociation of the N1–H bond proceeds either without a barrier or with a marginal energy barrier (Figure 15). In particular, the N1–H bond cleavage is barrierless for triazole on Cu Ovac site and for tetrazole on both types of oxygen vacancy site, whereas, for triazole on Cu ( 110 ) Ovac , the dissociation barrier is only 11 meV. The N1–H bond cleavage is therefore much easier at oxygen vacancy sites on Cu 2 O compared to pristine metallic Cu surfaces, where the energy barrier was calculated to be about 1 eV for benzotriazole [51]. It is worth noting that oxygen vacancy sites were found to be reactive also for the cleavage of the N–H bond of benzotriazole [52] and the O–H bond of methanol [23]. However, at few other sites on Cu 2 O surfaces, where dissociation of azole molecules is endothermic, the opposite occurs, i.e., on Cu CSA and Cu CUS sites a properly oriented Mol∗ + OH∗ transforms into MolH∗ + O∗ either barrierlessly for triazole or with a vanishing barrier of about 10 meV for tetrazole.
Finally, it should be noted that Bader analyses (Table 1 and Table 2) reveal that it is not fully appropriate to designate the dissociation of adsorbed azole molecules as the MolH ads Mol ads + H ads + because the charge of the two product species is significantly different from 1 and + 1 . This is why we write the dissociation of adsorbed azole molecule either as MolH + Mol + H or as MolH + O Mol + OH , where the suffix ∗ indicates the adsorbed species without any reference to its charge.

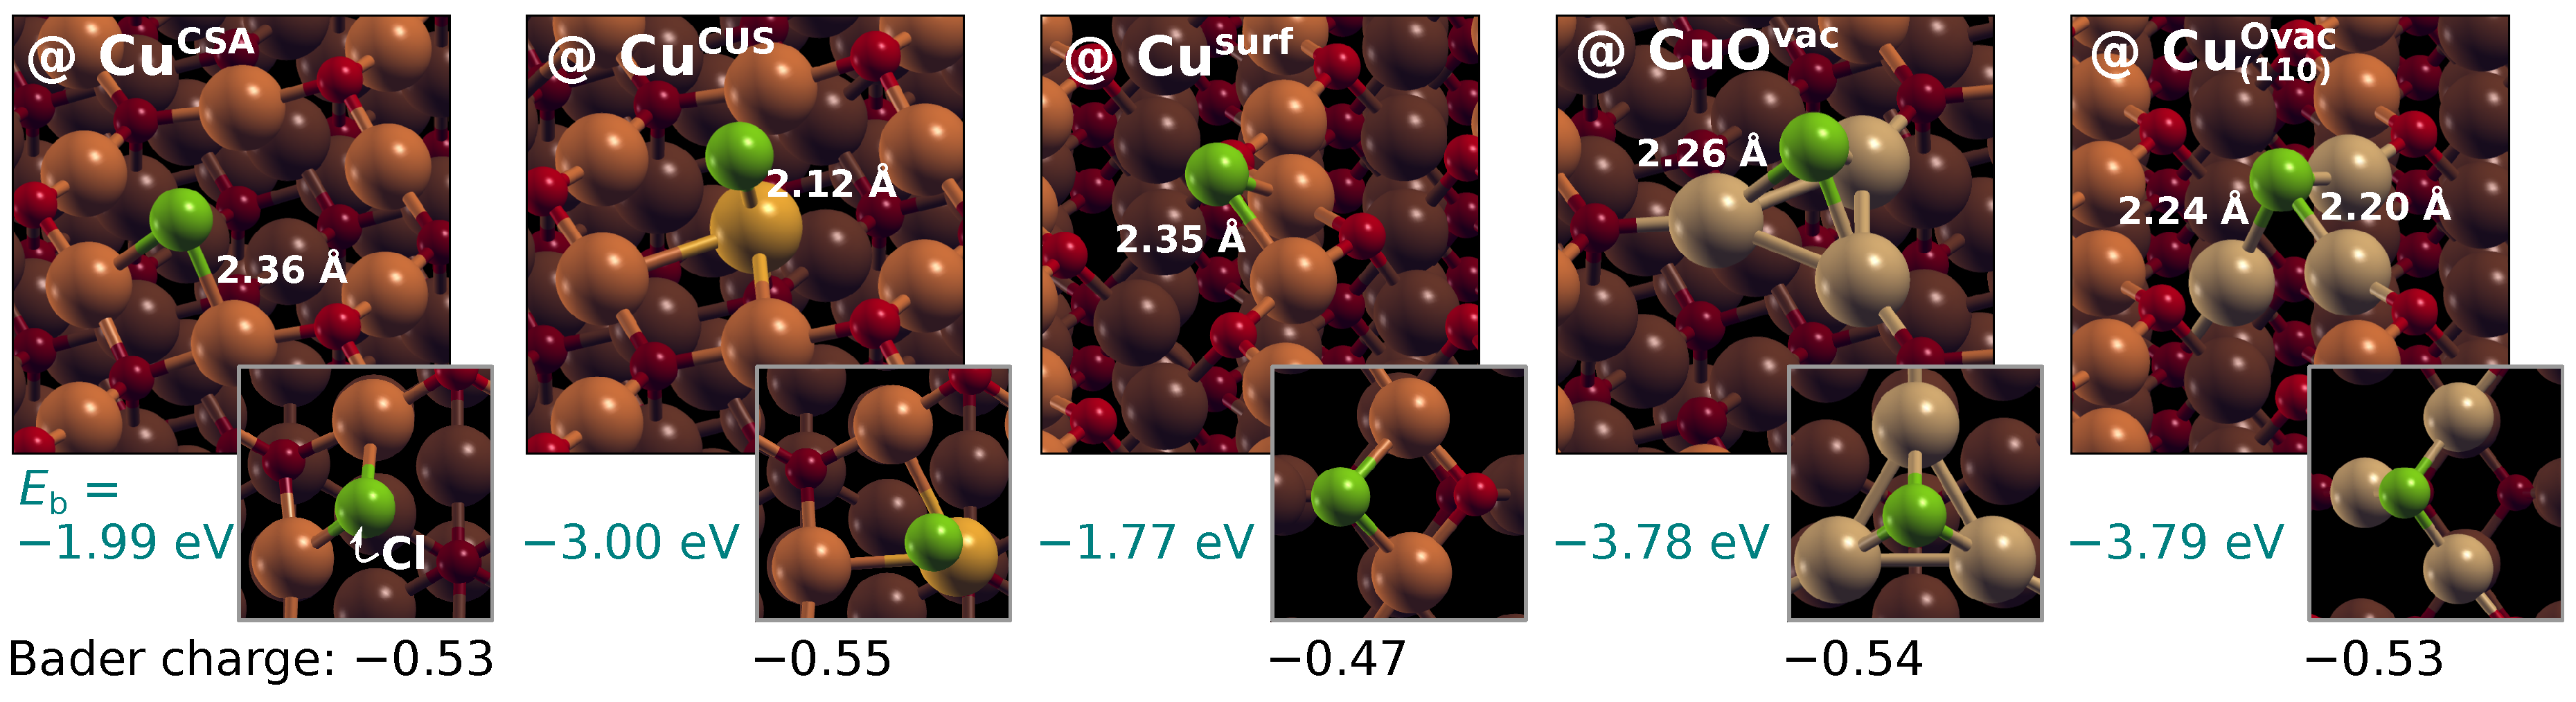
3.4. Comparison between Molecular and Chloride Adsorption

The comparison between azole and chloride adsorption is of interest because corrosion is usually promoted by some reactive corrosive species and chloride can be seen as a prototypical corrosion activator. Moreover, the inhibitive effect of azoles for corrosion of copper in chloride media has often been investigated (e.g., see ref [2]).
Figure 16 shows the most stable identified adsorption structures of Cl∗ at various Cu sites on Cu 2 O surfaces along with the respective binding energies and Bader charges. Similarly as reported above for Mol∗, Cl∗ is also not fully anionic. Instead, its Bader charge is about 0 . 5 at all considered sites. Cl∗ binds the strongest to oxygen vacancy Cu Ovac and Cu ( 110 ) Ovac sites ( E b = 3 . 8 eV), followed by the Cu CUS sites ( E b = 3 . 0 eV), whereas the bonding to saturated Cu CSA and Cu surf ions is considerably weaker ( E b = 2 . 0 and 1 . 8 eV, respectively). These Cl–surface bond strengths are considerably stronger than those displayed by intact azole molecules (cf. Figure 8a). Only triazole and tetrazole molecules in dissociated Mol∗ form interact with the surface strongly enough to rival the Cl–surface bonds. A similar trend was also observed on metallic Cu surfaces [6,53]. To facilitate the comparison between the Cl∗ and Mol∗ adsorption bonding, Table 3 tabulates the respective binding energies. Note that the bonding of Imi∗ is considerably weaker compared to that of Cl∗, Tri∗, and Tet∗ and the reason was already explained above, i.e., for strong bonding, the Mol∗ has to form at least two strong N–Cu bonds, which is not possible for imidazole due to its incompatible geometry. As for the comparison of E b between Cl∗, Tri∗, and Tet∗, the molecules bond somewhat stronger than Cl∗ to Cu CSA , Cu surf , and Cu CUS sites, whereas the opposite is true on Cu Ovac and Cu ( 110 ) Ovac sites. The adsorption bonding of Tri∗, Tet∗, and Cl∗ is therefore comparable in strength and this may be of relevance for the competitive adsorption scenario as a plausible mechanism of corrosion inhibition, i.e., Tri∗ and Tet∗ may hinder the adsorption of Cl∗; note that chloride is known to induce faster thinning and eventual breakdown of the passive film, followed by pit nucleation [54,55]. However, to go beyond this crude qualitative statement is not appropriate because current calculations were performed in a vacuum, while corrosion typically occurs at the solid/water interface.

3.5. Adsorption of Molecules from Vacuum and Aqueous-Phase: Differences

The above comparison between molecular and chloride adsorption reveals that only Tri∗ and Tet∗ adsorb strong enough to rival the Cl–surface bonds. However, there is an important point to keep in mind when considering the results presented above in the context of corrosion inhibition. Namely, due to obvious modeling reasons, the calculations were performed at a solid/vacuum interface, whereas, for corrosion, the solid/water interface is relevant. The adsorption at the latter interface is competitive (or substitutional) because the surface is always covered with solvent molecules and also with other species, such as hydroxyls. Thus, a given molecule will adsorb only if its adsorption is competitive enough to substitute other species from the surface. In contrast, at the solid/vacuum interface, the surface is clean and the molecule adsorbs readily unless its interaction with the surface is repulsive. Furthermore, the solvent considerably affects the energetics of adsorption because during the adsorption the molecule must get rid, at least partially, of its solvation shell and also displace solvent molecules from the surface. To get the first idea about the effect of solvent on adsorption energetics, one can compare the molecular solvation free energy with the in vacuo adsorption energy: if the former is significantly stronger than the latter, then the molecule is unlikely to adsorb, because it interacts more strongly with the solvent than the surface. The solvation free energies, as calculated by the COSMO (conductor-like screening model) implicit solvent model, are about 3 eV for Mol and Cl and about 0 . 5 eV for MolH [16,53]. Comparing these values with the corresponding binding energies implies that Mol and Cl are unlikely to adsorb at coordinatively saturated Cu sites on Cu 2 O surfaces not only because they instead prefer to bond to unsaturated Cu sites, but moreover because these species interact more strongly with the solvent than with the CSA sites (i.e., solvation free energies are about 3 eV, while CSA binding energies are about 2 eV).
Current results show that dissociated Mol∗ species bond considerably stronger to Cu 2 O surfaces than the intact MolH∗ molecules, which is due to the more reactive nature of Mol species that stems from its dangling bond at N1. This argument is not hindered by the fact that the binding energies were calculated with respect to the isolated Mol radical (see Appendix B). However, despite the much stronger adsorption bonding of Mol∗ and Cl∗ species, we can reasonably anticipate that the net adsorption energy difference between MolH and Mol is considerably diminished in aqueous-phase [16,52] because charged Mol and Cl species interact strongly not only with the substrate, but also with the solvent. This implies that adsorption from the aqueous-phase involves the change from one stable environment (solvent) to another one (surface), hence the adsorption energy is to a significant extent given by the net difference between the two strong interactions. We can therefore reasonably infer that the net aqueous-phase adsorption energies of Mol and Cl are considerably smaller in magnitude than the respective in vacuo energies.

4. Conclusions

By means of DFT calculations, we characterized the adsorption bonding of three simple azole molecules (imidazole, triazole, tetrazole), H, and Cl on five different Cu 2 O surfaces—Cu 2 O(111) w / o +1Cu CUS , Cu 2 O(111)-w/o-Cu CUS , Cu 2 O(111)-recon-( 3 × 3 )R30 , Cu 2 O(110):CuO, and Cu 2 O(110):CuO-w-Ovac—and consequently on five different Cu sites: Cu CUS , Cu CSA , Cu surf , Cu Ovac , and Cu ( 110 ) Ovac , respectively. We find that, in general, unsaturated Cu sites bond adsorbates much stronger than saturated sites. Among them, the O vacancy sites, which consists of a triplet of unsaturated Cu ions, are found particularly reactive towards the dissociation of triazole and tetrazole (N1–H bond cleavage); these sites display similar characteristics on both (111) and (110) surfaces, which we attribute to their similar local geometry. The dissociation of triazole and tetrazole at O vacancy site is assisted by the adjacent surface O ion because the N1–H bond cleavage proceeds by H transfer from the molecule to the nearby O ion, thus forming a surface OH group: the bond cleavage proceeds barrierlessly (or nearly so) thus being remarkably easier than on pristine metallic Cu surfaces, where the energy barrier is on the order of 1 eV for benzotriazole. Despite this large difference in a dissociation activation barrier, Bader analysis reveals that dissociated triazole and tetrazole display a similar charge on Cu 2 O and on pristine Cu(111) surfaces, about 0 . 6 . Indeed, Bader charges of adsorbed molecules show no relation to the strength of the molecule–surface bond. Instead, the Bader charges of bare Cu ions before molecular adsorption correlate remarkably well with the adsorption binding energies of the dissociated molecules, i.e., the smaller the charge of the Cu ion, the stronger is the molecule–surface bond.
While all three azole molecules display similar non-dissociative adsorption energies, dissociated triazole and tetrazole adsorb considerably stronger than dissociated imidazole, which is also why the dissociation is favorable only for triazole and tetrazole. Indeed, dissociated triazole and tetrazole adsorb strong enough to rival the Cl–surface bonding. While it is tempting to associate this dissociation tendency of the three molecules to their pKa constants (note that imidazole is considerably more basic than triazole and tetrazole and consequently less susceptible to deprotonation; their pKa constants at 25 C for MolH ( aq ) Mol ( aq ) + H ( aq ) + are 14.5 [56], 9.4 [57], and 4.7 [58], respectively), we believe that this correlation is coincident in the current case. This tendency is instead related to molecular geometry because triazole and tetrazole can form two strong N–Cu bonds, but imidazole cannot due to its incompatible molecular geometry. This observation may be of relevance to corrosion inhibition studies, when considering the speciation of a given inhibitor—i.e., which speciation form is in the majority at a given pH—because the active molecular species at the surface may differ from the molecular form that is in the majority in the solution not only because the pH in the bulk solution and the local pH near the surface can differ significantly, but also because the chemical characteristics of the solvent and the surface are different and, moreover, because the solvent is a 3D system while the surface is a 2D system. The latter implies that geometric steric requirements of the two can differ appreciably and, precisely in this aspect, the imidazole differs from triazole and tetrazole.

Author Contributions

Anton Kokalj and Dunja Gustinčič conceived and designed the computational study. Dunja Gustinčič performed a large majority of the calculations, while Anton Kokalj performed NEB, GGA+U, and magnetic surface calculations. Data were analyzed and the paper was written jointly by both authors.

Acknowledgments

The authors thank Matic Lozinšek and Matic Poberžnik for valuable discussions and for their careful reading of the manuscript. The authors acknowledge the financial support from the Slovenian Research Agency (Grant No. P2-0393). This work is a part of the M-Era.Net project “Coin Desc: Corrosion inhibition and dealloying descriptors”, co-financed by the Slovenian Ministry of Education, Science, and Sport (Grant No. C3330-17-500074).

Conflicts of Interest

The authors declare no conflict of interest.

Abbreviations

The following abbreviations are used in this manuscript:
DFTdensity functional theory
GGAgeneralized gradient approximation
GGA+U+U corrected GGA, where U stands for screened on-site Coulomb interaction
PBEPerdew–Burke–Ernzerhof
BZBrillouin zone
CSAcoordinatively saturated
CUScoordinatively unsaturated
PESpotential energy surface
MEPminimum energy path
CI-NEBclimbing-image nudged-elastic-band
US-PPultrasoft pseudopotentials
STMscanning tunneling microscopy

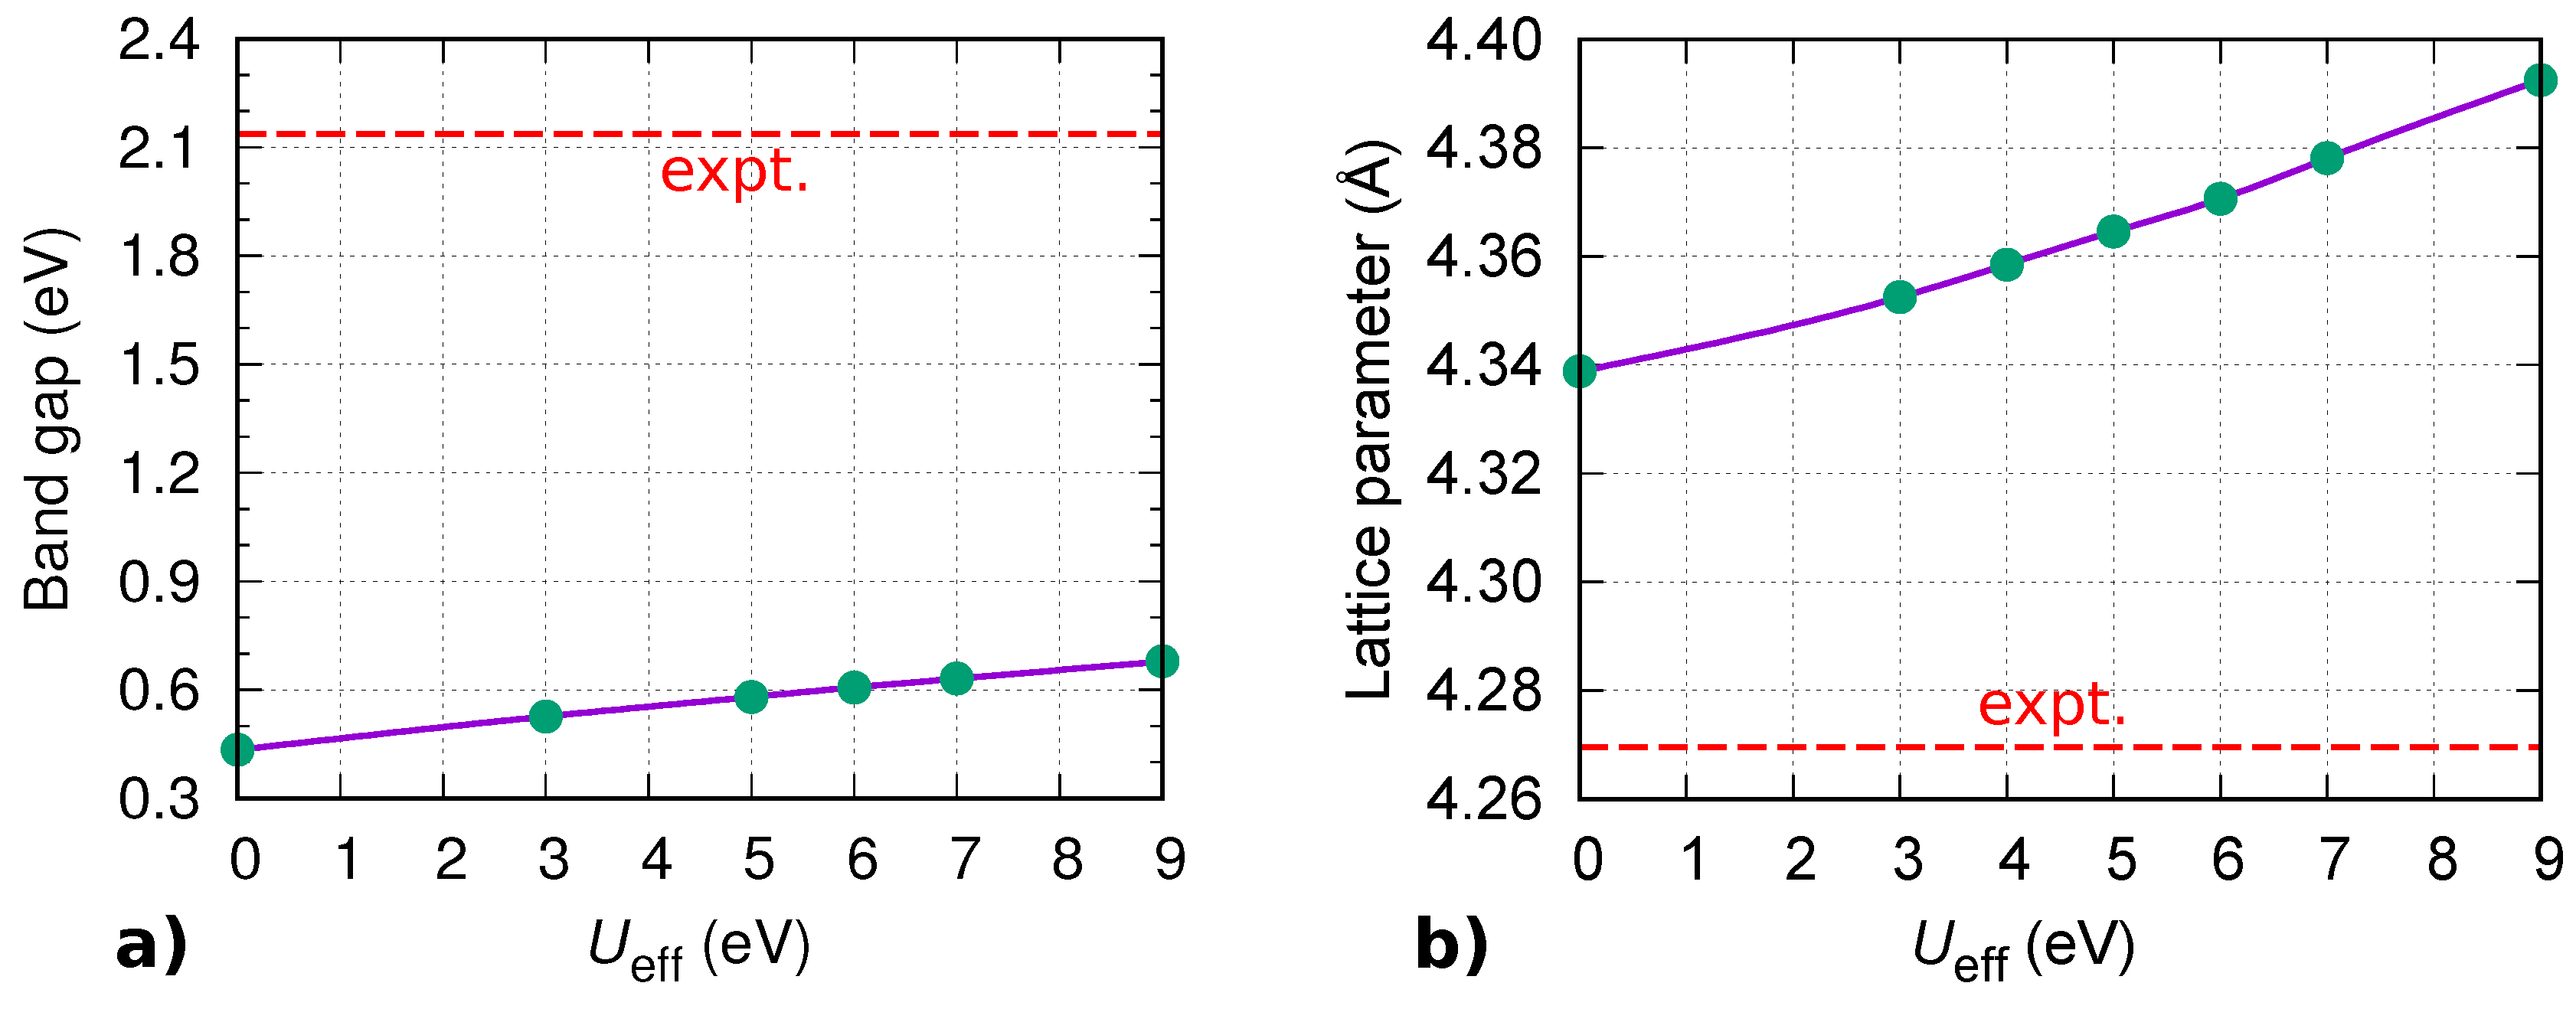
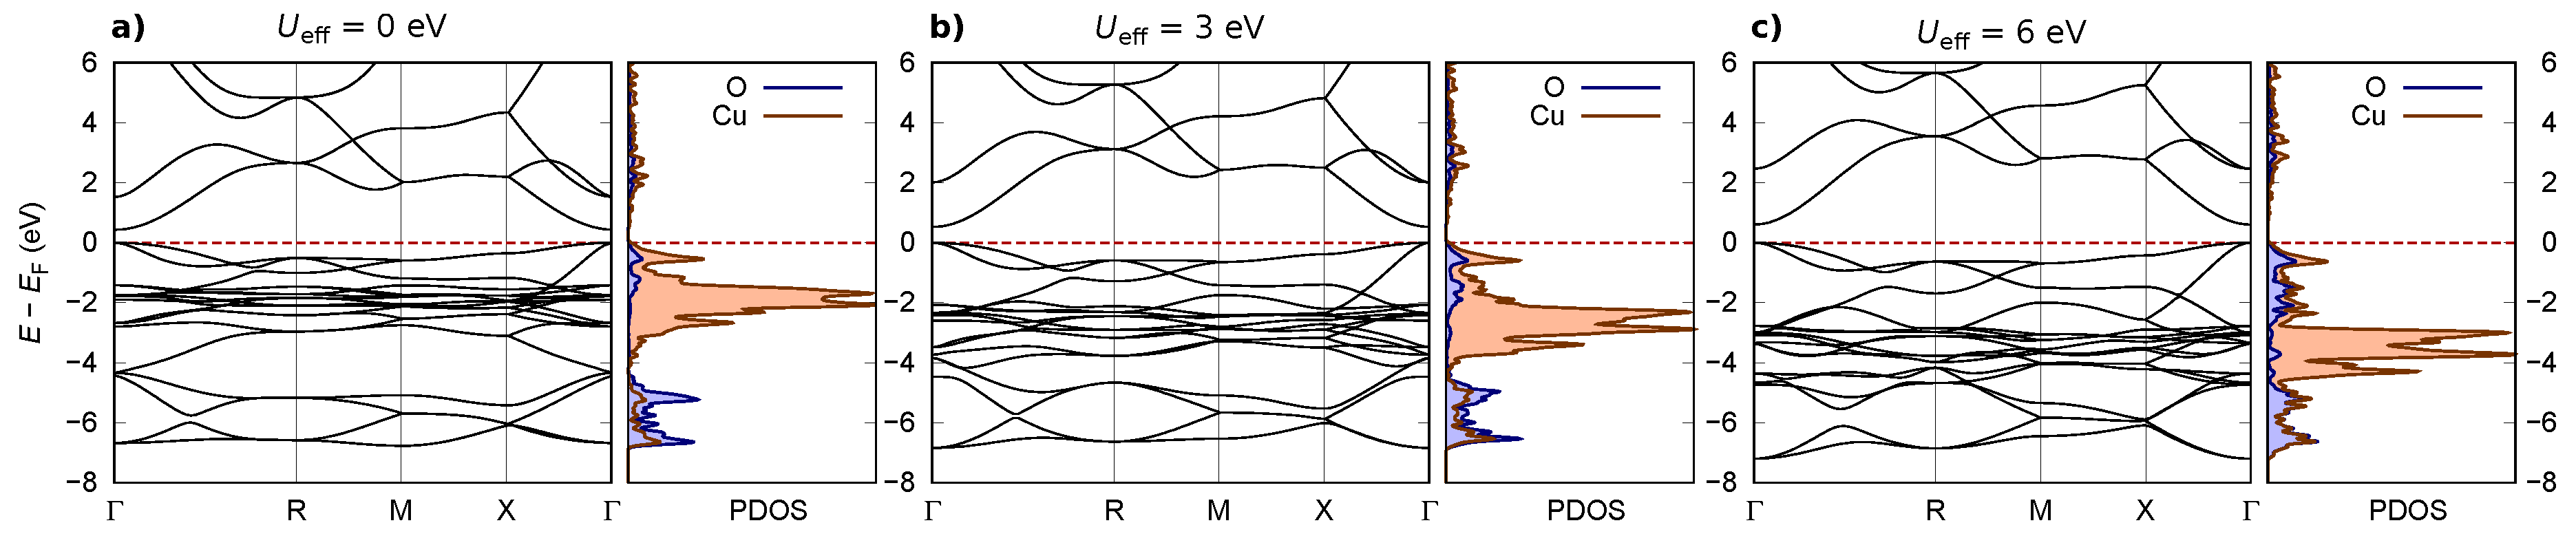
Appendix A. Effect of Hubbard U Parameter on Electronic and Adsorption Properties

Given that the results presented in this paper are obtained with plain GGA, which is known to underestimate band gaps and fails to correctly reproduce absolute positions of band-edges, we present below the effect of the Hubbard U parameter on the electronic and adsorption properties. To this end, we have used the simplified version of GGA+U method of Cococcioni and de Gironcoli [59]. The GGA+U method is often used, due to its computational efficiency, to correct for the aforementioned problems, although, for copper-oxides, it does not perform well [26]. Figure A1a plots the band gap of Cu 2 O bulk as a function of U eff = U J parameter (applied to Cu d orbitals), where U and J are parameters describing screened on-site Coulomb and exchange interactions, respectively. Note that the values used in the literature for the U eff parameter of Cu 2 O range from 3 to 8 eV [23,24,26,29,60,61]; Yu and Carter [60] reported the ab initio calculated value of 3.6 eV. It is evident from the figure that the +U correction only marginally increases the band gap, i.e., from the value of 0.43 eV for U eff = 0 eV (plain PBE) to the value of 0.68 eV at U eff = 9 eV, in fair agreement with previous literature reports [26,29], whereas the experimental value is 2.17 eV [62]. Although GGA+U fails to significantly correct the band gap problem, further inspection reveals (Figure A2) that it downshifts the position of the Cu d-band. As for the structural properties, Figure A1b shows that the Cu 2 O lattice parameter increases with increasing U eff , from 4.34 Å for plain PBE to 4.39 Å for U eff = 9 eV. According to our calculations, the +U correction thus slightly worsens the agreement with experiment because the experimental value is 4.27 Å. This is in variance with previous studies [26,29,60,61], which reported that the lattice parameter decreases with the increasing value of U eff . We therefore made several further tests (also using the PAW potentials), but the lattice parameter always increased with the increasing U eff .
Figure A1. Effect of Hubbard U eff parameter (applied to Cu d orbitals) on (a) band gap and (b) lattice parameter of Cu 2 O bulk. Experimental values are also given (red-dashed line).
Metals 08 00310 g0a1
Figure A2. Effect of Hubbard U eff parameter (applied to Cu d orbitals) on band structure and density of states of Cu 2 O bulk projected (PDOS) onto Cu and O ions. The top of the valence band is chosen as the zero energy.
Metals 08 00310 g0a2
Finally, we address the effect of the +U correction on the adsorption characteristics of triazole at three different sites on Cu 2 O(111) type surfaces. Given that our lattice parameter increases with U eff , which is in variance with literature reports, we also tested the effect of lattice parameter on the adsorption properties. Hence, we made calculations for two sets of lattice parameters, i.e., at the PBE+U optimized values and at the value given by the PBE. Differences between the two sets of adsorption results were insignificant and we report below results only for the GGA+U optimized lattice parameters. Figure A3a plots non-dissociative adsorption energies ( E ads ) of triazole at Cu CSA , Cu CUS , and Cu Ovac sites. It can be seen that the +U correction has almost no effect on the adsorption energy at the least reactive Cu CSA site, whereas at more reactive unsaturated Cu CUS and Cu Ovac sites, the adsorption bond strength increases with increasing U eff . In particular, it increases by 0.1 eV and 0.2 eV for Cu CUS and Cu Ovac sites, respectively, as passing from U eff = 0 to 6 eV. In addition to the enhancement of the molecule–surface bond, the +U correction also favors the dissociation of triazole at these sites (Figure A3b), i.e., the exothermicity of dissociation increases by about 0.2 eV as passing from U eff = 0 to 6 eV (note also that at about U eff = 3 eV dissociation at Cu CSA becomes favorable). Apart from these differences, Figure A3 further suggests that the relative stability of molecular adsorption at various sites is not affected by the +U correction.
The bottom line of this analysis is that the +U correction does not remedy the band-gap problem of Cu 2 O bulk, slightly changes its lattice parameter, moderately enhances the molecule–surface bond strength, relatively favors molecular dissociation, and finally does not alter the reactivity trend of the adsorption sites. Given that one of the principle objectives of this paper is to emphasize the importance of dissociated molecular forms, in this case, using GGA can be considered a more conservative approach because GGA+U relatively favors dissociation with respect to GGA.
Figure A3. Effect of Hubbard U eff parameter (applied to Cu d orbitals) on (a) non-dissociative adsorption energy ( E ads ) of triazole and (b) dissociation energy ( Δ E ) of triazole at Cu CSA , Cu CUS , and Cu Ovac sites. Calculations for Cu CSA and Cu CUS sites were performed with one molecule per ( 2 × 2 ) supercell, whereas, for the Cu Ovac site, the ( 3 × 3 )R30 supercell was used, i.e., molecular coverages are the same as those shown in Figure 3.
Metals 08 00310 g0a3

Appendix B. Binding Energies of Mol∗ and Cl∗

Binding energies of Mol∗ and Cl∗, as reported in this article, were calculated with respect to the isolated Mol (or Cl ) radical. However, binding energies can be recalculated with respect to the Mol (or Cl ) anion as:
E b ( ) = E b + E EA Φ ,
where E EA is the adiabatic electron affinity of the Mol (or Cl ) and Φ is the work-function [6]. It was shown that, for current azole molecules on Cu(111), the binding energies calculated with respect to the Mol anion are even more exothermic than those calculated with respect to the Mol radical [16]. The same is true on Cu 2 O surfaces, namely, the E EA Φ contribution of Equation (A1) is negative for all the three molecules. In particular, the experimental work-function of Cu 2 O is about 5 eV [63], whereas the calculated electron affinities of Mol are all smaller, being 2.63, 3.57, and 4.04 eV for Imi , Tri , and Tet , respectively [16]. Also for chloride the binding energy calculated with respect to the Cl anion is more exothermic than that calculated with respect to the Cl radical, because the calculated electron affinity of Cl is 3.69 eV [6].

References

  1. Kuznetsov, Y.; Kazansky, L. Physicochemical aspects of metal protection by azoles as corrosion inhibitors. Russ. Chem. Rev. 2008, 77, 219–232. [Google Scholar] [CrossRef]
  2. Antonijević, M.M.; Milić, S.M.; Petrović, M.B. Films formed on copper surface in chloride media in the presence of azoles. Corros. Sci. 2009, 51, 1228–1237. [Google Scholar] [CrossRef]
  3. Antonijević, M.M.; Petrović, M.B. Copper corrosion inhibitors. A review. Int. J. Electrochem. Sci. 2008, 3, 1–28. [Google Scholar]
  4. Mihajlović, M.B.P.; Antonijević, M.M. Copper Corrosion Inhibitors. Period 2008–2014. A Review. Int. J. Electrochem. Sci. 2015, 10, 1027–1053. [Google Scholar]
  5. Bockris, J.O.; Reddy, A.K.N. Modern Electrochemistry, 2nd ed.; Kluwer Academic/Plenum Publishers: New York/Boston, NY, USA, 2000; Volume 2B. [Google Scholar]
  6. Kokalj, A.; Peljhan, S.; Finšgar, M.; Milošev, I. What Determines the Inhibition Effectiveness of ATA, BTAH, and BTAOH Corrosion Inhibitors on Copper? J. Am. Chem. Soc. 2010, 132, 16657–16668. [Google Scholar] [CrossRef] [PubMed]
  7. Costa, D.; Ribeiro, T.; Cornette, P.; Marcus, P. DFT Modeling of Corrosion Inhibition by Organic Molecules: Carboxylates as Inhibitors of Aluminum Corrosion. J. Phys. Chem. C 2016, 120, 28607–28616. [Google Scholar] [CrossRef]
  8. Costa, D.; Marcus, P. Adsorption of Organic Inhibitor Molecules on Metal and Oxidized Surfaces Studied by Atomistic Theoretical Methods. In Molecular Modeling of Corrosion Processes; John Wiley & Sons, Inc.: Hoboken, NJ, USA, 2015; pp. 125–156. [Google Scholar]
  9. Kokalj, A.; Costa, D. Molecular Modeling of Corrosion Inhibitors. In Reference Module in Chemistry, Molecular Sciences and Chemical Engineering; Encyclopedia of Interfacial Chemistry: Surface Science and Electrochemistry; Elsevier: Amsterdam, The Netherlands, 2018; Volume 6.1, pp. 332–345. Available online: https://www.sciencedirect.com/science/article/pii/B9780124095472134444 (accessed on 25 April 2018).
  10. Taylor, C.D.; Chandra, A.; Vera, J.; Sridhar, N. Multiphysics modelling, quantum chemistry and risk analysis for corrosion inhibitor design and lifetime prediction. Faraday Discuss. 2015, 180, 459–477. [Google Scholar] [CrossRef] [PubMed]
  11. Winkler, D.A. Predicting the Performance of Organic Corrosion Inhibitors. Metals 2017, 7, 553. [Google Scholar] [CrossRef]
  12. Winkler, D.A.; Breedon, M.; Hughes, A.E.; Burden, F.R.; Barnard, A.S.; Harvey, T.G.; Cole, I. Towards chromate-free corrosion inhibitors: Structure-property models for organic alternatives. Green Chem. 2014, 16, 3349–3357. [Google Scholar] [CrossRef]
  13. Winkler, D.A.; Breedon, M.; White, P.; Hughes, A.E.; Sapper, E.D.; Cole, I. Using high throughput experimental data and in silico models to discover alternatives to toxic chromate corrosion inhibitors. Corros. Sci. 2016, 106, 229–235. [Google Scholar] [CrossRef]
  14. Gustinčič, D.; Kokalj, A. DFT Study of Azole Corrosion Inhibitors on Cu2O Model of Oxidized Copper Surfaces: II. Lateral Interactions and Thermodynamic Stability. Metals 2018, 8, 311. [Google Scholar] [CrossRef]
  15. Kovačević, N.; Kokalj, A. DFT Study of Interaction of Azoles with Cu(111) and Al(111) Surfaces: Role of Azole Nitrogen Atoms and Dipole–Dipole Interactions. J. Phys. Chem. C 2011, 115, 24189–24197. [Google Scholar] [CrossRef]
  16. Kovačević, N.; Kokalj, A. The relation between adsorption bonding and corrosion inhibition of azole molecules on copper. Corros. Sci. 2013, 73, 7–17. [Google Scholar] [CrossRef]
  17. Gustinčič, D.; Kokalj, A. A DFT study of adsorption of imidazole, triazole, and tetrazole on oxidized copper surfaces: Cu2O(111) and Cu2O(111)-w/o-CuCUS. Phys. Chem. Chem. Phys. 2015, 17, 28602–28615. [Google Scholar] [CrossRef] [PubMed]
  18. Kovačević, N.; Milošev, I.; Kokalj, A. How relevant is the adsorption bonding of imidazoles and triazoles for their corrosion inhibition of copper? Corros. Sci. 2017, 124, 25–34. [Google Scholar] [CrossRef]
  19. Pourbaix, M. Atlas of Electrochemical Equilibria in Aqueous Solutions, 2nd ed.; NACE, Cebelcor: Houston, TX, USA, 1974. [Google Scholar]
  20. Soon, A.; Todorova, M.; Delley, B.; Stampfl, C. Thermodynamic stability and structure of copper oxide surfaces: A first-principles investigation. Phys. Rev. B 2007, 75, 125420–125429. [Google Scholar] [CrossRef]
  21. Soon, A.; Todorova, M.; Delley, B.; Stampfl, C. Erratum: Thermodynamic stability and structure of copper oxide surfaces: A first-principles investigation [Phys. Rev. B 75, 125420 (2007)]. Phys. Rev. B 2007, 76, 129902. [Google Scholar] [CrossRef]
  22. Önsten, A.; Göthelid, M.; Karlsson, U.O. Atomic structure of Cu2O(111). Surf. Sci. 2009, 603, 257–264. [Google Scholar] [CrossRef]
  23. Besharat, Z.; Stenlid, J.H.; Soldemo, M.; Marks, K.; Önsten, A.; Johnson, M.; Öström, H.; Weissenrieder, J.; Brinck, T.; Göthelid, M. Dehydrogenation of methanol on Cu2O(100) and (111). J. Chem. Phys. 2017, 146, 244702. [Google Scholar] [CrossRef] [PubMed]
  24. Soldemo, M.; Stenlid, J.H.; Besharat, Z.; Johansson, N.; Önsten, A.; Knudsen, J.; Schnadt, J.; Göthelid, M.; Brinck, T.; Weissenrieder, J. Interaction of Sulfur Dioxide and Near-Ambient Pressures of Water Vapor with Cuprous Oxide Surfaces. J. Phys. Chem. C 2017, 121, 24011–24024. [Google Scholar] [CrossRef]
  25. Nilius, N.; Fedderwitz, H.; Groß, B.; Noguera, C.; Goniakowski, J. Incorrect DFT-GGA predictions of the stability of non-stoichiometric/polar dielectric surfaces: The case of Cu2O(111). Phys. Chem. Chem. Phys. 2016, 18, 6729–6733. [Google Scholar] [CrossRef] [PubMed]
  26. Scanlon, D.O.; Morgan, B.J.; Watson, G.W. Modeling the polaronic nature of p-type defects in Cu2O: The failure of GGA and GGA+U. J. Chem. Phys. 2009, 131, 124703. [Google Scholar] [CrossRef] [PubMed]
  27. Kokalj, A.; Peljhan, S. Density Functional Theory Study of Adsorption of Benzotriazole on Cu2O Surfaces. J. Phys. Chem. C 2015, 119, 11625–11635. [Google Scholar] [CrossRef]
  28. Perdew, J.P.; Burke, K.; Ernzerhof, M. Generalized Gradient Approximation Made Simple. Phys. Rev. Lett. 1996, 77, 3865–3868. [Google Scholar] [CrossRef] [PubMed]
  29. Isseroff, L.Y.; Carter, E.A. Importance of reference Hamiltonians containing exact exchange for accurate one-shot GW calculations of Cu2O. Phys. Rev. B 2012, 85, 235142. [Google Scholar] [CrossRef]
  30. Vanderbilt, D. Soft self-consistent pseudopotentials in a generalized eigenvalue formalism. Phys. Rev. B 1990, 41, 7892–7895. [Google Scholar] [CrossRef]
  31. Ultrasoft Pseudopotentials for H, C, N, O, and Cu Were Taken from the Quantum Espresso Pseudopotential. (files: H.pbe-rrkjus.UPF, C.pbe-rrkjus.UPF, N.pbe-rrkjus.UPF, O.pbe-rrkjus.UPF, Cl.pbe-n-van.UPF, and Cu.pbe-d-rrkjus.UPF). 2017. Available online: http://www.quantum-espresso.org/pseudopotentials (accessed on 21 August 2017).
  32. Monkhorst, H.J.; Pack, J.D. Special points for Brillouin zone integrations. Phys. Rev. B 1976, 13, 5188–5192. [Google Scholar] [CrossRef]
  33. Marzari, N.; Vanderbilt, D.; De Vita, A.; Payne, M.C. Thermal Contraction and Disordering of the Al(110) Surface. Phys. Rev. Lett. 1999, 82, 3296–3299. [Google Scholar] [CrossRef]
  34. Giannozzi, P.; Baroni, S.; Bonini, N.; Calandra, M.; Car, R.; Cavazzoni, C.; Ceresoli, D.; Chiarotti, G.L.; Cococcioni, M.; Dabo, I.; et al. QUANTUM ESPRESSO: A modular and open-source software project for quantum simulations of materials. J. Phys. Condens. Matter 2009, 21, 395502. [Google Scholar] [CrossRef] [PubMed]
  35. Giannozzi, P.; Andreussi, O.; Brumme, T.; Bunau, O.; Nardelli, M.B.; Calandra, M.; Car, R.; Cavazzoni, C.; Ceresoli, D.; Cococcioni, M.; et al. Advanced capabilities for materials modelling with Quantum ESPRESSO. J. Phys. Condens. Matter 2017, 29, 465901. [Google Scholar] [CrossRef] [PubMed]
  36. Kokalj, A. XCrySDen-a new program for displaying crystalline structures and electron densities. J. Mol. Graph. Modell. 1999, 17, 176–179. [Google Scholar] [CrossRef]
  37. Costa, D.; Ribeiro, T.; Mercuri, F.; Pacchioni, G.; Marcus, P. Atomistic Modeling of Corrosion Resistance: A First Principles Study of O2 Reduction on the Al(111) Surface Covered with a Thin Hydroxylated Alumina Film. Adv. Mater. Interfaces 2014, 1, 1300072. [Google Scholar] [CrossRef]
  38. Finšgar, M.; Peljhan, S.; Kokalj, A.; Kovač, J.; Milošev, I. Determination of the Cu2O Thickness on BTAH-Inhibited Copper by Reconstruction of Auger Electron Spectra. J. Electrochem. Soc. 2010, 157, C295–C301. [Google Scholar] [CrossRef]
  39. Lide, D.R. (Ed.) CRC Handbook of Chemistry and Physics, 85th ed.; CRC Press: Boca Raton, FL, USA, 2005. [Google Scholar]
  40. Li, C.; Wang, F.; Li, S.; Sun, Q.; Jia, Y. Stability and electronic properties of the O-terminated Cu2O(111) surfaces: First-principles investigation. Phys. Lett. A 2010, 374, 2994–2998. [Google Scholar] [CrossRef]
  41. Bengtsson, L. Dipole correction for surface supercell calculations. Phys. Rev. B 1999, 59, 12301–12304. [Google Scholar] [CrossRef]
  42. Bader, R.F.W. Atoms in Molecules: a Quantum Theory; Oxford University Press: New York, NY, USA, 1990. [Google Scholar]
  43. Blöchl, P.E. Projector augmented-wave method. Phys. Rev. B 1994, 50, 17953–17979. [Google Scholar] [CrossRef]
  44. Tang, W.; Sanville, E.; Henkelman, G. A grid-based Bader analysis algorithm without lattice bias. J. Phys. Condens. Matter 2009, 21, 084204. [Google Scholar] [CrossRef] [PubMed]
  45. Arnaldsson, A.; Tang, W.; Henkelman, G. Computer Program for Bader Charge Analysis. Available online: http://theory.cm.utexas.edu/henkelman/code/bader/ (accessed on 21 August 2017).
  46. Henkelman, G.; Jonsson, H. Improved tangent estimate in the nudged elastic band method for finding minimum energy paths and saddle points. J. Chem. Phys. 2000, 113, 9978–9985. [Google Scholar] [CrossRef]
  47. Henkelman, G.; Uberuaga, B.P.; Jonsson, H. A climbing image nudged elastic band method for finding saddle points and minimum energy paths. J. Chem. Phys. 2000, 113, 9901–9904. [Google Scholar] [CrossRef]
  48. Kokalj, A. Electrostatic model for treating long-range lateral interactions between polar molecules adsorbed on metal surfaces. Phys. Rev. B 2011, 84, 045418. [Google Scholar] [CrossRef]
  49. Stenlid, J.H.; Johansson, A.J.; Brinck, T. Local Lewis Acidity of (TiO2)n (n = 7–10) Nanoparticles Characterized by DFT-Based Descriptors: Tools for Catalyst Design. J. Phys. Chem. C 2017, 121, 27483–27492. [Google Scholar] [CrossRef]
  50. Yu, X.; Zhang, X.; Wang, H.; Wang, Z.; Feng, G. High-Coverage H2 Adsorption on the Reconstructed Cu2O(111) Surface. J. Phys. Chem. C 2017, 121, 22081–22091. [Google Scholar] [CrossRef]
  51. Kokalj, A.; Peljhan, S.; Koller, J. The Effect of Surface Geometry of Copper on Dehydrogenation of Benzotriazole. Part II. J. Phys. Chem. C 2014, 118, 944–954. [Google Scholar] [CrossRef]
  52. Kokalj, A. Ab initio modeling of the bonding of benzotriazole corrosion inhibitor to reduced and oxidized copper surfaces. Faraday Discuss. 2015, 180, 415–438. [Google Scholar] [CrossRef] [PubMed]
  53. Peljhan, S.; Koller, J.; Kokalj, A. The Effect of Surface Geometry of Copper on Adsorption of Benzotriazole and Cl. Part I. J. Phys. Chem. C 2014, 118, 933–943. [Google Scholar] [CrossRef]
  54. Marcus, P.; Maurice, V.; Strehblow, H.H. Localized corrosion (pitting): A model of passivity breakdown including the role of the oxide layer nanostructure. Corros. Sci. 2008, 50, 2698–2704. [Google Scholar] [CrossRef]
  55. Maurice, V.; Marcus, P. Passive films at the nanoscale. Electrochim. Acta 2012, 84, 129–138. [Google Scholar] [CrossRef]
  56. Walba, H.; Isensee, R.W. Acidity Constants of Some Arylimidazoles and Their Cations. J. Org. Chem. 1961, 26, 2789–2791. [Google Scholar] [CrossRef]
  57. Yet, L. Five-Membered Heterocycles with Three Heteroatoms: Triazoles. In Modern Heterocyclic Chemistry; Alvarez-Builla, J., Vaquero, J.J., Barluenga, J., Eds.; Wiley-VCH Verlag GmbH & Co. KGaA: Weinheim, Germany, 2011; pp. 989–1045. [Google Scholar]
  58. Boraei, A.A.A. Acidity Constants of Some Tetrazole Compounds in Various Aqueous–Organic Solvent Media. J. Chem. Eng. Data 2001, 46, 939–943. [Google Scholar] [CrossRef]
  59. Cococcioni, M.; de Gironcoli, S. Linear response approach to the calculation of the effective interaction parameters in the LDA + U method. Phys. Rev. B 2005, 71, 035105. [Google Scholar] [CrossRef]
  60. Yu, K.; Carter, E.A. Communication: Comparing ab initio methods of obtaining effective U parameters for closed-shell materials. J. Chem. Phys. 2014, 140, 121105. [Google Scholar] [CrossRef] [PubMed]
  61. Mishra, A.K.; Roldan, A.; de Leeuw, N.H. CuO surfaces and CO2 activation: A dispersion-corrected DFT+U study. J. Phys. Chem. C 2016, 120, 2198–2214. [Google Scholar] [CrossRef]
  62. Meyer, B.K.; Polity, A.; Reppin, D.; Becker, M.; Hering, P.; Klar, P.J.; Sander, T.; Reindl, C.; Benz, J.; Eickhoff, M.; et al. Binary copper oxide semiconductors: From materials towards devices. Phys. Status Solidi B 2012, 249, 1487–1509. [Google Scholar] [CrossRef]
  63. Caballero-Briones, F.; Artes, J.M.; Diez-Perez, I.; Gorostiza, P.; Sanz, F. Direct Observation of the Valence Band Edge by in Situ ECSTM-ECTS in p-Type Cu2O Layers Prepared by Copper Anodization. J. Phys. Chem. C 2009, 113, 1028–1036. [Google Scholar] [CrossRef]
Scheme 1. Skeletal formulas of imidazole, triazole, and tetrazole in neutral form (MolH, top row) and deprotonated form (Mol , bottom row); deprotonated molecules lack the proton at the N1 atom, i.e., the cyan colored H in the top row. Numbering of N atoms is also indicated (top row). Labels ImiH, TriH, and TetH designate the neutral imidazole, triazole, and tetrazole, respectively, whereas their deprotonated forms are designated as Imi , Tri , and Tet . Atom coloring as used in this work is indicated on the ball-and-stick model of imidazole shown on the left.
Metals 08 00310 sch001
Figure 1. (ad) side- and top-views of considered Cu 2 O surface structures with various Cu (bigger brown balls) and O (smaller red balls) ions labeled graphically. The unit cell of each surface structure is indicated with a white parallelogram. (a) high-symmetry stoichiometric Cu 2 O(111), which contains two distinct copper sites, Cu CUS and Cu CSA . O up and O dn denote O sites located above and below the plane of surface Cu ions, respectively; (b) non-stoichiometric Cu 2 O(111)-w/o-Cu CUS , which lacks Cu CUS ions; corresponding Cu-vacancies are indicated by a white dashed circles and the O ions bellow them are named O sub ; (c) structure of the Cu 2 O(111)-recon-( 3 × 3 )R30 surface, which lacks Cu CUS sites and one third of O up ions; corresponding O-vacancies are indicated with red crosses and are surrounded by three coordinatively unsaturated Cu ions named Cu Ovac ; (d) structure of Cu 2 O(110):CuO, which consists of zigzag patterns of Cu surf and O surf ions (note that Cu surf is coordinatively saturated); (e) high-symmetry positions of Cu CUS ions of Cu 2 O(111) are not stable and each ion relaxes laterally toward two adjacent Cu CSA ions if the symmetry is broken [27]: the corresponding relaxed structure is designated as Cu 2 O(111)r, where “r” stands for “relaxed”; (f) by forming an oxygen vacancy on Cu 2 O(110):CuO, a triplet of unsaturated Cu ions is formed; this triplet has the same local structure as those on Cu 2 O(111)-recon-( 3 × 3 )R30 , hence the resulting unsaturated Cu ions are designated as Cu ( 110 ) Ovac ; respective surface is labeled as Cu 2 O(110):CuO-w-Ovac.
Metals 08 00310 g001
Figure 2. (a) Cu 2 O(111) w / o +1Cu CUS model used for molecular adsorption at Cu CUS sites. In this model, the number of Cu CUS ions equals the number of adsorbed molecules, i.e., the Cu CUS ion is present only if the molecule binds to it. A ( 2 × 2 ) supercell is drawn with a white parallelogram: notice only one Cu CUS ion (yellow colored ball with green outline) and three Cu-vacancies (white dashed circles) per supercell; (b) on the bare surface, Cu CUS ions relax laterally toward the Cu CSA ions, but upon molecular adsorption the Cu CUS ions shift back to high-symmetry position.
Metals 08 00310 g002
Figure 3. Top-views of triazole adsorbed at (a) Cu 2 O(111) w / o +1Cu CUS ; (b) Cu 2 O(111)-w/o-Cu CUS ; (c) Cu 2 O(111)-recon-( 3 × 3 )R30 ; and (d) Cu 2 O(110):CuO. Molecules are drawn with the respective van der Waals radii, whereas surface atoms are drawn with smaller radii. Supercells are indicated graphically with white parallelograms on each structure and also specified along with molecular coverage below each snapshot.
Metals 08 00310 g003
Figure 4. The most stable identified adsorption structures of imidazole (left), triazole (middle), and tetrazole (right) at the Cu CUS site on Cu 2 O(111) w / o +1Cu CUS surface model for non-dissociative (MolH∗, top) and dissociative (Mol∗, bottom) adsorption modes; for the latter mode, the H-coadsorbate is not shown. The calculations were performed with one molecule bonded to the only Cu CUS site in the ( 2 × 2 ) supercell (see the top-view in Figure 3a). Molecular adsorption ( E ads ), dissociative adsorption ( E ads diss ), and binding ( E b ) energies as well as molecule–surface bond lengths are also given; these energies are calculated with respect to high-symmetry position of the Cu CUS ion in the bare substrate as to better represent the molecule–surface bond strength. The energy difference between high- and low-symmetry position of Cu CUS ion is 0.04 eV for Cu 2 O(111) w / o +1Cu CUS –( 2 × 2 ).
Metals 08 00310 g004
Figure 5. As in Figure 4, but for bonding at the Cu CSA site of Cu 2 O(111)-w/o-Cu CUS . The calculations were performed with one molecule per ( 2 × 2 ) supercell; see also the top-view in Figure 3b.
Metals 08 00310 g005
Figure 6. As in Figure 4, but for bonding at the Cu Ovac site of Cu 2 O(111)-recon-( 3 × 3 )R30 . The calculations were performed with one molecule per ( 3 × 3 )R30 unit cell; see also the top-view in Figure 3c.
Metals 08 00310 g006
Figure 7. As in Figure 4, but for bonding at the Cu surf site of Cu 2 O(110):CuO. The calculations were performed with one molecule per 2 1 0 2 supercell; see also the top-view in Figure 3d.
Metals 08 00310 g007
Figure 8. Bond-strengths for (a) MolH∗ and (b) Mol∗ adsorption modes of imidazole, triazole, and tetrazole at considered Cu sites. Values are calculated as in Figure 4, Figure 5, Figure 6 and Figure 7 according to the Equation (5). The association between sites and surfaces is the following: Cu CSA corresponds to Cu 2 O(111)-w/o-Cu CUS , Cu CUS to Cu 2 O(111) w / o +1Cu CUS , Cu Ovac to Cu 2 O(111)-recon-( 3 × 3 )R30 , and Cu surf to Cu 2 O(110):CuO.
Metals 08 00310 g008
Figure 9. The most stable identified adsorption modes of Imi∗, Tri∗, and Tet∗ at the Cu ( 110 ) Ovac site on 2 1 0 2 –Cu 2 O(110):CuO-w-Ovac. Dissociative adsorption energies ( E ads diss ), binding energies ( E b ), and molecule–surface bond lengths are also stated.
Metals 08 00310 g009
Figure 10. Charge density difference and molecular Bader charge for triazole in neutral (top row) and dissociated (bottom row) forms bonded at Cu CUS , Cu CSA , Cu Ovac , and Cu surf sites of (a,e) Cu 2 O(111) w / o +1Cu CUS ; (b,f) Cu 2 O(111)-w/o-Cu CUS ; (c,g) Cu 2 O(111)-recon-( 3 × 3 )R30 ; and (d,h) Cu 2 O(110):CuO surfaces, respectively. Plots are drawn with seven contours in linear scale from −0.006 to +0.006 e / a 0 3 and in (g) also the ±0.006 e / a 0 3 isosurfaces are shown. The blue (red) color represents the electron deficient (excess) regions, i.e., electron charge moved from blue to red regions. For Tri∗ on Cu 2 O(111)-w/o-Cu CUS , the second stablest identified adsorption structure is shown instead of the stablest because the latter is highly tilted and forms three out-of-plane N–Cu bonds (hence, it is not possible to plot the three bonds simultaneously on a single contour plotting plane).
Metals 08 00310 g010
Figure 11. (a) correlations between Bader charges of adsorbed molecules and their Mulliken electronegativities for neutral (MolH∗) and dissociated (Mol∗) forms of imidazole, triazole, and tetrazole at the Cu CUS site; (b) correlations between binding energies of dissociated molecules with Bader charges of Cu ions before adsorption (correlation coefficients are 0.999, 0.976, and 0.981 for Imi∗, Tri∗, and Tet∗, respectively).
Metals 08 00310 g011
Figure 12. Dissociation energies ( Δ E ) for imidazole, triazole, and tetrazole at considered Cu sites, i.e., Cu CSA of Cu 2 O(111)-w/o-Cu CUS , Cu CUS of Cu 2 O(111) w / o +1Cu CUS , Cu Ovac of Cu 2 O(111)-recon-( 3 × 3 )R30 , and Cu surf of Cu 2 O(110):CuO. Dissociation energies are calculated as Δ E = E ads diss E ads and refer to the reaction on the surface, MolH + Mol + H . Note that the dissociation of imidazole is endothermic on all considered surfaces, whereas for triazole and tetrazole the dissociation is exothermic on the Cu 2 O(111)-recon-( 3 × 3 )R30 .
Metals 08 00310 g012
Figure 13. Snapshots of optimized structures of H adsorbed at various O (top row) and Cu (bottom row) sites on Cu 2 O surfaces. Note that, upon adsorption of H onto O dn site, the O dn shifts upwards above the plane of surface Cu CSA ions; hence, the H @ O dn appears visually similar to H @ O up .
Metals 08 00310 g013
Figure 14. Schematic illustration of triazole and tetrazole dissociation at oxygen vacancy sites (top row) and the snapshots of the involved structures. Dissociative adsorption is decomposed into three elementary steps and the respective energy changes are stated: (1) adsorption of MolH ( Δ E 1 ), (2) dissociation of MolH∗ by the H transfer from the molecule to the nearby surface O ion ( Δ E 2 ), and (3) further stabilization of Mol∗ by forming another N–Cu bond (rearrangement, Δ E 3 ). If the molecule adsorbs properly oriented, with the N1–H bond pointing somewhere towards a nearby O ion, then the cleavage of N1–H bond proceeds either barrierlessly or with a vanishingly small barrier; the corresponding NEB calculated minimum energy paths on the potential energy surfaces (PES) are shown in Figure 15. Beware that the two shown TetH∗ structures are not local minima and were obtained by constraining the N1–H bond-length; also triazole at Cu Ovac is not a local minimum on the PES but instead a wide plateau. These three structures are shown as faded to indicate their instability. The shown TriH @ Cu Ovac and TetH @ Cu Ovac structures display more exothermic adsorption energies than those considered in Figure 6, but note that the current structures are not stable minima on the PES.
Metals 08 00310 g014
Figure 15. Calculated minimum energy paths on the PES for the dissociation of TriH∗ and TetH∗ on oxygen vacancy sites, i.e., the elementary step #2 in Figure 14. Beware that due to small energy differences the energy unit of the ordinate axis is meV and not eV. The labels (AD) comply with the labels written below the MolH∗ structures in Figure 14.
Metals 08 00310 g015
Figure 16. Snapshots of optimized structures of Cl∗ (green balls) at various Cu sites on Cu 2 O surfaces; larger images show the perspective view and smaller images depict the top view. Cl∗ binding energies and Bader charges as well as Cl–Cu bond-lengths are also given. The same supercells were used as for adsorption of azole molecules, cf. Figure 3.
Metals 08 00310 g016
Table 1. Calculated molecular Bader charges for molecules adsorbed at various sites on Cu 2 O surfaces. Positive (negative) values of Bader charge indicate positively (negatively) charged species.
Adsorbate Cu CUS Cu CSA Cu Ovac Cu surf
ImiH∗+0.13
TriH∗+0.05+0.05+0.03+0.08
TetH∗+0.02
Imi∗−0.41
Tri∗−0.58−0.56−0.65−0.47
Tet∗−0.64
Table 2. Calculated data for H adsorbed at various surface sites on Cu 2 O surfaces. Positive (negative) values of Bader charge, q Bader , indicate positively (negatively) charged species; d H O and d H Cu designate the H–O and H–Cu bond lengths. The same supercells were used as for adsorption of azole molecules, cf. Figure 3.
Surface-Site E b q Bader d H O d H Cu
(Ion, Symmetry)(eV)(e)(Å)(Å)
O dn , top−1.88+0.620.97
O up , top−2.89+0.630.98
O sub , top−3.02+0.620.98
O surf , tilted-top−3.16+0.640.98
Cu CSA , tilted-top−1.03−0.06 1.51
Cu surf , top−1.22−0.02 1.49
Cu CUS , top−1.97−0.22 1.49
Cu Ovac , hollow−3.27−0.34 1.67
Cu ( 110 ) Ovac , hollow−3.34−0.33 1.66, 1.68
Table 3. Comparison of calculated binding energies of Cl∗ and Mol∗ at various considered sites on Cu 2 O surfaces. Binding energies are calculated with respect to isolated Cl and Mol radicals. Note that the binding of Imi∗ is inferior, but the binding of Tri∗ and Tet∗ is comparable to that of Cl∗.
Surface-Site E b (eV)
Cl∗Imi∗Tri∗Tet∗
(111)-type surfaces
    Cu CSA −1.99 0 . 93 −2.30−2.18
    Cu CUS −3.00 1 . 92 −3.17−3.11
    Cu Ovac −3.78 2 . 07 −3.70−3.61
(110)-type surfaces
    Cu surf −1.77 0 . 74 −2.06−2.01
    Cu ( 110 ) Ovac −3.79 2 . 14 −3.79−3.61

