The Natural Aging Effect on Hardenability in Al-Mg-Si: A Complex Interaction between Composition and Heat Treatment Parameters

Materials Science and Engineering, Michigan Technological University, 1400 Townsend Dr, Houghton, MI 49931, USA
*
Author to whom correspondence should be addressed.
Metals 2018, 8(5), 309; https://doi.org/10.3390/met8050309
Submission received: 2 April 2018
/
Revised: 23 April 2018
/
Accepted: 26 April 2018
/
Published: 1 May 2018
Abstract
:The technological relevance of Al-Mg-Si alloys has been rapidly growing over the last decade. Of particular interest to current and future applications is the problematic negative effect of prior natural aging on subsequent artificial age hardening. The influence of natural aging is dependent on both processing and compositional variables and has origins that are far from well-understood. This work examines the hardenability of 6000 series alloys under a wide range of conditions, paying particular attention to the natural aging effect. Experimental variables include alloy composition (Mg + Si, Mg/Si), cooling rate after solutionization, and duration of prior natural aging. Hardenability was evaluated with full hardness and conductivity aging curves for each condition, as well as select Transmission Electron Microscopy (TEM). Results are discussed based on the actions of naturally aged solute clusters during artificial aging. In particular, a complex interaction between vacancy concentration, cluster stability, and precipitation driving force is suggested.
1. Introduction
Wrought aluminum alloys are currently of particular technological interest in the transportation industry due to their high strength to density ratio and relative ease of production. Chiefly among these are 6000 series alloys (Al-Mg-Si), which are commonly used as vehicle structural or body components [1,2]. These alloys gain the majority of their strength through a fine distribution of strengthening particles, which can be precipitated with a dedicated heat treatment or integrated into the manufacturing process.
There are two essential components to a precipitation strengthening treatment: high temperature solutionization (often accompanied by hot deformation), followed by artificial aging (AA) at an intermediate temperature (around 175 °C). In practice, the solutionization and artificial aging steps rarely occur in direct succession, so the material is stored intermittently at room temperature for an extended period of time. For high strength engineering alloys, this period of intermittent storage, known as natural aging (NA), has long been known to have a detrimental effect on AA hardenability [3,4,5]. This ‘negative NA effect’ is typically due to coarser distributions and/or lower volume fractions of strengthening precipitates [6,7,8,9,10,11,12,13,14], which is attributed to the prior formation of solute clusters during NA, and a multitude of suggested influences on the AA precipitation process [15,16,17,18,19,20,21,22].
Natural aging itself is an exceptionally complicated process, involving several time-dependent steps which have been resolved with measurements of resistivity, Differential Scanning Calorimetry (DSC), and Positron Annihilation Lifetime Spectroscopy (PALS) [23,24,25,26,27,28,29,30,31]. In general, the processes that occur during NA temporal evolution are thought to be first dominated by the movement of vacancies and silicon solutes, followed by the movement of magnesium [27,29,32]. Bulk properties rapidly change during the first several hours of NA, and continue at a more gradual pace for months/years thereafter.
The formation of low temperature ‘phases’ (e.g., NA clusters) from a supersaturated solid solution is strongly assisted by a non-equilibrium concentration of (quenched-in) vacancies [33,34]. Additionally, substitutional solute atoms Si and (debatably) Mg have attractive interaction energies with vacancies in an FCC-Al matrix [35,36], which leads to a kinetic stabilization of excess vacancies (i.e., longer times before annihilation at sinks) during aging [37]. Based on this, the process of natural aging and clustering of solutes can also be interpreted as the binding/trapping of mobile vacancies [19,38]. Strengthening precipitation during artificial aging requires a high degree of solute supersaturation to provide thermodynamic driving force, as well as ‘free’ (i.e., un-trapped) vacancy concentration to allow sufficient solute diffusion/mobility [39]. As such, the negative impact of NA has been speculated, and recently verified to be the result of the presence of NA clusters (that do not appreciably aid in nucleation) during AA precipitation, and the corresponding depletion of mobile solute/vacancies [40].
Although reasonably successful work-arounds have been created to combat the negative effect of NA (e.g., immediate ‘pre-aging’ [41,42,43,44]), a one-size-fits-all solution is not obtainable. This is primarily due to both a strong variable and interaction dependence of compositional and heat treatment parameters (which is the focus of this paper). For high strength (high solute) alloys, prior NA leads to an ubiquitous negative effect on initial AA hardening kinetics, However recent studies have identified a dependence of the Mg:Si ratio on later (~peak) AA hardening behavior and recoverability (with respect to the influence of prior NA) [12,45]. Even more recently, this has been shown to be a result of an Mg/Si dependence on NA cluster thermal stability, and a corresponding difference in cluster behavior (i.e., dissolution versus growth/coalescence) at elevated temperature [40]. Somewhat puzzlingly, prior NA can have minimal or even positive hardenability impacts for low-strength (low-solute) alloys [45,46,47]; the reasons for this contrast remain controversial and relatively unstudied due to their reduced technological relevance compared to the high-strength counterparts. Nevertheless, this is one of the topics discussed here.
The vast majority of studies concerning the relationship between prior NA and AA achieve supersaturation through a fast (e.g., water) quench. Although quench sensitivity of Al-Mg-Si alloys has received attention with respect to precipitation [48,49,50], the interaction between cooling rate and natural aging on precipitation has received less attention [51]. The current work is a continuation of the results presented in [45], and is intended as a comprehensive ‘screening’ study, used to investigate the interactions between quench parameters, prior NA, and bulk composition. Results are analyzed in accordance with the conceptual explanation discussed above ([19,40]), and highlight the importance of NA cluster thermal stability, quenched-in and trapped vacancy concentration, and precipitation driving force.
2. Experimental
Six model alloys were cast using an induction furnace and permanent mold into 3.5″ (88.9 mm) diameter billets. No grain refiner was used to eliminate any unwanted interactions with the natural aging/clustering process. The compositions are listed in Table 1 and shown in comparison to several common commercial alloys in Figure 1. As can be seen, the compositions vary in terms of relative (Mg/Si) and absolute (Mg + Si) solute content. Two nominal overall solute contents were used, Mg + Si ≈ 0.7 wt % and 1.4 wt %, designating ‘low strength’ and ‘high strength’ alloys, respectively. Additionally, three different bulk Mg/Si ratios were used (for each Mg + Si content) of roughly 2.4, 0.7, and 0.3 by weight. These ratios represent Mg-rich, balanced, and Si-rich bulk compositions (where ‘balanced’ refers to the roughly 1Mg:1Si atomic ratio of the most potent strengthening precipitate, β″ [52,53]).
A relatively constant addition of 0.2% Fe was included to maintain consistency with reasonably clean commercial alloys, and allow primary and secondary precipitation of Fe-containing intermetallics to control cast and extruded/recrystallized grain structure. Trace amounts (0.05%) of Mn were also included to stabilize the desired α-Al(Fe,Mn)Si phase during homogenization, as its (spherical) morphology and (Si-poor) composition are ultimately less detrimental to properties [54,55].
Based on cast grain size and Thermo-Calc/DICTRA simulations [56], billets were homogenized for 144 h at 575 °C (848 K). Optical microscopy comparison of cast and homogenized microstructures revealed the intended spheroidization of large, Chinese-script primary Fe-intermetallics. Homogenized billets were then extruded into 7/8″ (22 mm) rod using a 550 ton laboratory-scale direct extrusion press, yielding a reduction ratio of ~16. Extruded rod was straightened/stretched to 1.5% elongation, and sectioned into ½″ (12.7 mm) cylinders for heat treatment and testing. Each heat treatment began with a dedicated solutionization of 1.25 h (4.5 ks) at 560 °C (833 K) to ensure maximum supersaturation and grain structure uniformity (recrystallization).
Following solution treatment (ST), all alloys underwent five distinct aging treatments, which are shown in Figure 2a–c using in-situ time/temperature profiles (for heat and cooling steps). Illustrated in Figure 2a, some samples were water quenched (WQ) from the solution temperature, naturally aged for either 0.5 or 4 h (1.8 ks or 14.4 ks) before ultimate artificial aging at 175 °C (448 K) [45]. Prior NA times were chosen to illustrate the extreme significance of even short storage times (which result in the most rapid NA changes). Figure 2b shows the direct quench (DQ) condition, in which samples were directly quenched into the AA treatment in a molten salt bath (50/50 molar ratio of KNO3/NaNO2). Finally, Figure 2c shows the air cooled (AC) condition: Here, samples were cooled in ambient air on a ceramic brick, and subsequently naturally/artificially aged in an identical manner as the WQ condition. ‘Natural aging’ was chosen to begin when samples cooled to a temperature of 65 °C, as this temperature is below the typical lower limit of pre-aging treatments [22]. This is an important distinction because immediate pre-aging, generally performed around 100 °C [42], is thought to produce a different ‘type’ of solute cluster that is capable of aiding the nucleation of strengthening precipitates during eventual AA [14,15,17,57].
To establish the hardening behavior during artificial aging, samples were water quenched with roughly equal spacing in the logarithm of time. In order to severely limit further natural aging/maturing prior to testing (particularly for short AA durations when remaining supersaturation is likely), samples were stored in an ultra-cold freezer at −80 °C and intermittently kept in a dry ice isopropanol bath during surface preparation. A minimum of six Vickers macro-hardness (20 kg load) and ten electrical conductivity (Fischer SMP10 eddy current conductivity probe) measurements were taken on each heat-treated specimen. Based on the hardness and electrical conductivity curves, select samples were prepared into transmission electron microscopy foils, electro-polished, and imaged in a JEOL JEM-2010 TEM at 200 keV to qualitatively assess the precipitate distribution.
3. Results
In this study, aging behavior is assessed through hardness and conductivity curves. Through those curves, the degree of micro- and nano-structural changes is inferred. Before detailing experimental results, Table 2 generalizes the relevant known/possible structural changes during natural and artificial aging, and their resulting impacts on hardness and conductivity. As will be extensively discussed throughout this text, the degree to which these microstructural changes occur (and physical properties altered) is highly dependent on the experimental variables studied herein. Nevertheless, these basic trends guide the analysis that follows.
3.1. High Strength (Mg + Si = 1.4 wt %) Alloys
3.1.1. Water Quench (WQ)
Results of the high strength alloys are organized to allow for several key comparisons. Figure 3a–c (which is reproduced from [45], and included here because of the direct applicability) illustrates the influence of the duration of prior NA (0.5, 4 h) after a rapid quench, on AA hardenability.
The balanced alloy (Mg/Si ≈ 0.7), with bulk composition closest to that of the most potent precipitate (β″) expectedly achieves the highest overall hardness (Figure 3b). Initial hardening kinetics are aided by a Si-rich chemistry (Mg/Si ≈ 0.3, Figure 3a), particularly with minimal prior NA; similar studies have also identified this boost, which is due to enhanced GP-zone formation [58]. Regarding the anticipated influence of room temperature storage, prolonged prior NA has a detrimental effect on initial AA hardening kinetics for all (high strength) compositions. As was noted in the original work [45], the key finding here is a compositional (Mg/Si) dependence on the recoverability of the negative influence of prior NA. Comparing the two extremes (Figure 3a,c), it is obvious that the Si-rich composition displays a complete recovery of (peak) hardness after sufficient time at AA temperature. In contrast, the AA hardness of the Mg-rich composition with prolonged prior NA is never fully recovered, and a negative effect of roughly 8 Hv is present from the peak- to over-aged condition. The influence of prior NA on the balanced alloy (Figure 3b) appears to be intermediate between that of the Si-rich and Mg-rich counterparts. That is, a full recovery is evident, however it does not occur until later AA durations, compared to the Si-rich alloy.
The corresponding temporal evolution of AA conductivity is given in Figure 4a–c. Generally speaking, any defect in a crystalline lattice (e.g., solutes, vacancies, precipitates, clusters) decreases conductivity compared to the perfect crystal (i.e., FCC-Al). The degree to which conductivity is reduced is dependent on the associated defect spacing and electronic scattering power. Classic precipitation transformations increase bulk conductivity because compared to a homogenous distribution of solutes, precipitate spacing is much larger, which overcomes the increase in scatter power (from solutes to precipitates). However, the formation of solute clusters (i.e., during natural aging) results in a decrease in conductivity because the small increase in distance does not overcome the increase in scattering power [59,60]. The measured conductivity change during natural aging for the alloys investigated here is also shown in Figure 4a–c, plotted on the secondary x and y axes. Regarding this, it should be noted that several researchers have suggested multiple (2–3) ‘stages’ with logarithmic time dependence in the evolution of NA conductivity/resistivity [23,24,61]. Given the time resolution of these data, this is difficult to evaluate, however it also appears to be Mg/Si dependent. Specifically, the most Si-rich alloy (Figure 4a) is nearly linear (in Log(time)) for the duration of investigated NA, but increasing Mg/Si leads to the possibility of multiple stages (i.e., up to 3 in the Mg-rich alloy).
Similar to hardness, the evolution of AA conductivity, with respect to prior NA, is also a function of bulk Mg:Si ratio. In all cases, conductivity in the early stages of AA is lower following prolonged prior NA, and an eventual recovery ensues. The AA time associated with this recovery is indicated in Figure 4 and increases with bulk Mg/Si ratio, from roughly 4 to 40 h (for Si-rich to Mg-rich alloys, respectively). Additionally, for the Mg-rich alloy, and to some extent the balanced alloy, the conductivity in the 4 h prior NA condition continues to rise above that of the 0.5 h prior NA condition.
The TEM images in Figure 5 qualitatively show the precipitate microstructures corresponding to the near-peak aged state (10.8 h AA) in the Si- and Mg-rich alloy, for both prior NA conditions. In the Si-rich alloy, precipitate distribution appears slightly finer with minimal prior NA (Figure 5a,b), however the two microstructures are similar, correlating to the full recovery of hardness seen in Figure 3a. On the other hand, after peak-aging of the Mg-rich alloy, precipitate microstructures show a more significant influence of prior NA (i.e., prolonged NA leads to much coarser distributions, seen in Figure 5c,d). This correlates well with the un-recoverable hardness increment seen in Figure 3c.
3.1.2. Air Cooling (AC)
Figure 6a–c shows the AA hardness evolution of high strength alloys after ambient air cooling from the solution treatment (with variable prior NA). Also included for comparative purposes, and plotted semi-transparently, are the (water quenched) results just discussed. The Si-rich composition (Figure 6a) again shows an initial negative effect of prolonged NA on hardening kinetics, and a full recovery of peak-aged hardness. Interestingly, at long AA times (>50 h) the AC + 4 h NA condition over-ages faster than its 0.5 h NA counterpart. In comparison to the WQ condition, AC induces a similar magnitude of the initial NA effect, and significantly reduced hardening kinetics after both durations of prior NA (i.e., quench sensitivity regardless of prior NA). Aging of the balanced alloy after AC (Figure 6b) results in quite similar behavior compared to the WQ condition, i.e., a slight negative NA effect and minimal quench sensitivity. Perhaps most interestingly, air cooling of the Mg-rich alloy (Figure 6c) results in a much smaller, nearly constant negative NA impact (of only a few Hv), compared to the water quench. Additionally, this alloy exhibits quench sensitivity for short (0.5 h) prior NA, but quench insensitivity for longer prior NA (4 h). In fact, considering only the 4 h NA condition, air cooling results in beneficial AA hardening behavior, i.e., equivalent kinetics and higher peak hardness (Figure 6c).
The evolutions of conductivity throughout AA (for both prior NA conditions), as well as during NA itself, are shown in Figure 7a–c. The continuous conductivity decreases during NA show that the process of NA clustering is active even after slow (air) cooling, as also evidenced by its resulting influence on AA behavior. Again, AA conductivity for each alloy is initially lower after prolonged NA, and an eventual recovery ensues. The recovery time increases with bulk Mg/Si content, from ~8 h to ~87 h AA (for Si-rich and Mg-rich compositions, respectively); with respect to conductivity trends seen after a water quench (Figure 4), these recovery times are considerably longer. The large deviation seen in the Si-rich alloy after long AA times (Figure 7a) correlates to its rapid over-aging (Figure 6a), in which precipitate spacing increases (coarsening), and matrix solute content is further depleted due to the continuous solute (particularly Mg) enrichment of transition phases en-route to equilibrium [15,25,26].
3.1.3. Direct Quench (DQ)
The direct quench condition is presented next, and compared to the 0.5 h NA (followed by AA) condition; by doing so, we can assess the influence of all time, in a state of supersaturation, below 175 °C (i.e., room temperature storage as well as AA heating ramp). AA hardening behavior is shown in Figure 8a–c. The influence of the direct quench, in comparison to traditional quench and re-heat, indeed varies with bulk Mg/Si, however not with the same trends as seen for WQ or AC (Figure 3 and Figure 6). Here, both of the unbalanced (Si-rich and Mg-rich) alloys show reduced initial hardening kinetics and similar/slightly lower peak strengths (Figure 8a,c). In contrast, the balanced alloy displays overall enhanced aging behavior: faster hardening, similar/higher peak strength, and improved thermal stability (i.e., slower over-aging). The long AA time points indicating thermal stability were double checked, and good agreement was found.
The AA conductivity curves corresponding to the DQ and WQ + 0.5 h NA conditions are shown in Figure 9a–c. In general, the DQ aging treatment provides higher conductivity for all compositions. For the two most Si-rich compositions (Mg/Si ≈ 0.3 and 0.7), traditional quench/re-heat conductivity recovers at long AA times; for the Mg-rich alloy (Mg/Si ≈ 2.4), DQ conductivity remains greater for the full duration of artificial aging. The most pronounced increase in conductivity due to DQ is for the balanced alloy (Figure 9b), which relates to the rapid hardening (i.e., depletion of solute) as discussed above (Figure 8b).
3.2. Low Strength (Mg + Si = 0.7 wt %) Alloys
3.2.1. Water Quench (WQ)
Figure 10a–c shows the AA hardening behavior of the low strength alloys after WQ, and the influence of prolonged prior NA. Compared to their high strength counterparts, these alloys show severely reduced hardening kinetics and only subtle strengthening potential due to a drastically lower supersaturation. The impact of prior NA duration is also less significant and the same dependence on Mg/Si is not seen. For the Si-rich alloy, there may be a slight negative effect on hardening behavior, while no significant effect is seen in the Mg-rich alloy. For the Mg-rich alloy particularly, these effects are difficult to judge based on the lack of a significant aging response. The balanced alloy again shows the largest hardening response, and even displays a slight positive influence of prolonged prior NA. This result has been reported in the literature previously for low-strength alloys [46,47].
The influence of prior NA on AA conductivity is also virtually non-existent for these low-strength compositions, as seen in Figure 11a–c. In fact, the conductivity does not appreciably change during NA itself (also included in Figure 11a–c). Similar results have been reported before, however more detailed analysis techniques (such as PALS) have indicated that at least some of the NA processes may still be active [24,29,62].
3.2.2. Air Cooling (AC)
The AA hardening behavior after air cooling is shown below (Figure 12a–c). Also included for comparison, and plotted semi-transparently, are the WQ curves just discussed. Interestingly, the influence of prolonged prior NA becomes more pronounced after air cooling, where a beneficial hardening response is induced for all alloys studied. In the presence of a short duration (0.5 h) of NA, the quench sensitivity is dependent on the Mg:Si ratio in the same way as the high strength alloys; namely, Si- and Mg-rich alloys are quench sensitive, while the balanced composition is not. Conversely, following prolonged (4 h) NA, the AA hardening of all compositions is not sensitive to the quench rate. From a vacancy annihilation standpoint (as discussed later), this is rather intuitive and has also been previously reported [51].
Corresponding to the enhanced hardening behavior, AA conductivity after air cooling (Figure 13a–c) becomes increased with prolonged prior NA. This is in spite of the fact that the NA processes that occur after AC (or WQ, as noted earlier) in low-strength samples are too subtle to detect with the current conductivity measurements (Figure 13a–c secondary axes).
3.2.3. Direct Quench (DQ)
Finally, the DQ aging behavior for low strength alloys is shown below, and compared to the traditional water quench (0.5 h NA) and re-heat condition; hardening and conductivity curves are shown in Figure 14a–c and Figure 15a–c, respectively. The direct quench aging treatment is obviously highly ineffective for low-solute compositions. Compared to traditional WQ, DQ results in severely reduced hardening kinetics (incubation periods of well over 10 h AA), as well as diminished achievable strength. Conductivity curves largely correlate with the slower precipitation (hardening kinetics), and coarser precipitate nanostructure (reduced achievable strength).
4. Discussion
The results presented above can be qualitatively explained by considering concepts already published in the literature, and assuming a complex interaction between bulk composition and the various processes that occur during (and as a result of) different thermal histories. Before going into specifics, it is prudent to mention general aspects corresponding to as-quenched (WQ) and as-cooled (AC) nanostructures.
As a result of a rapid water quench to room temperature, a high degree of both solute and vacancy supersaturation is achieved (which by nature is unstable). For the WQ rate used here, vacancy site fractions on the order of 1 × 10⁵ can be expected [63,64]. For comparison, the equilibrium site fraction at the AA temperature of 175 °C is around 3 × 10⁸, while room temperature equilibrium is much lower (~2 × 10¹²) [25]. During natural aging (and possibly as early as during the quench itself [15,24,65,66]), several concurrent processes occur. In terms of solute atoms, NA clusters form by vacancy-aided (short range) diffusion; in terms of vacancies, some (excess) vacancies slowly annihilate at sinks, while others get trapped/immobilized in developing clusters as discussed in the Introduction. Since the vacancy fraction immediately after a quench is several orders of magnitude less than the fraction of solutes (1 × 10²) and eventual NA clusters (as determined by atom probe tomography [8,40,67,68,69]), it is logical to assume that prolonged natural aging drastically reduces the available (free/untrapped) vacancy concentration, as well as solute supersaturation. Also as mentioned in the Introduction, these are the two key factors necessary for strengthening precipitation (during AA).
For air cooling, several additional factors must be accounted for. In 6000 series alloys, slow cooling typically leads to the high temperature precipitation of β and β’/B’ [49,50,70]; Given the extreme Si-rich composition used in this work (Mg/Si ≈ 0.3), we also suspect precipitation of pure Si to be likely. Additionally, time at intermediate temperature (below those necessary for precipitation [22]) likely results in cluster formation during cooling. Intermediate temperature clustering is well known to occur during immediate (post-quench) pre-aging (~100 °C) [14,15,17,71], and has also been shown to occur during interrupted quenching (similar to DQ treatment here) at temperatures below that of AA [72,73]. Relative to NA clusters, these intermediate temperature clusters are larger and more compositionally balanced; they are generally thought to be beneficial to AA hardening (and combat the negative effects of NA) by aiding in the nucleation of subsequent precipitation. Lastly, the effect of cooling rate on quenched-in vacancies must be considered: For the AC rate used here (shown in Figure 2c), vacancy site fraction around 1 × 10⁷ is expected [63,64], indicating an approximate 100-fold reduction compared to the water quench. All of these aspects do not eliminate subsequent NA clustering, however they do reduce NA clustering kinetics (as seen in Figure 4a–c and Figure 7a–c). NA after AC therefore either grows existing clusters or forms new ones.
4.1. High Strength (Mg + Si = 1.4 wt %) Alloys
4.1.1. NA Effect on AA—Water Quench
For the sake of the continuity of this discussion, the conclusions presented in [45] will also be recounted here. Subsequent strengthening precipitation during AA after prolonged NA is negatively affected by a reduction in driving force and solute mobility, which manifests itself as reduced hardening kinetics (seen in Figure 3a–c) and typical coarse precipitate nanostructures (seen throughout the literature [6,7,8,9,10,11,12,13,14]). This impact on initial AA hardening behavior is seen for all of the high-strength alloys studied here. The eventual recovery of strength (and precipitate distribution) seen in the Si-rich composition (Figure 3a and Figure 5a,b), but not in the Mg-rich composition (Figure 3c and Figure 5c,d) can be explained by considering the thermal stability of NA clusters at the AA temperature of 175 °C [40]. As mentioned earlier, the formation of solute clusters lowers bulk electrical conductivity. During AA, the presence of NA clusters directly lowers conductivity, and also indirectly slows the increase of conductivity via slower precipitation kinetics. This explains the initially reduced AA conductivity seen for all compositions following prolonged NA (Figure 4a–c). At longer durations of AA, however, the conductivity of the 4 h NA condition is eventually recovered with respect to the 0.5 h NA condition. In the cases of the Si-rich and balanced alloys, which display a full recovery of peak strength, the relatively small conductivity difference is recovered prior to the peak-aged condition. Figure 16 plots the AA time associated with peak hardness (as prior NA does not substantially change the peak AA time) and conductivity recovery, for each of the alloys. As is seen (in Figure 3c, Figure 4c, and Figure 15), the Mg-rich alloy uniquely shows no recovery of peak strength, and the large conductivity difference is not recovered until well beyond the peak AA time (i.e., after the start of over-aging/coarsening).
Since the peak-aged condition generally corresponds to near maximum precipitate volume fraction (and solute depletion), it is believed that the un-recoverable negative influence of AA strength (in Mg-rich alloys) is due to the thermal stability of NA clusters and their sustained presence during artificial aging/precipitation (leading to coarser precipitate distributions as seen in Figure 5c,d); this agrees with recently published APT findings of nearly identical alloys [40]. For naturally aged Si-rich compositions, the early stages of AA consist of concurrent precipitation and slow cluster dissipation, as suggested by [7,40,74]. The dissipation of NA clusters (although not fast enough to prevent an initial negative influence) slowly replenishes the matrix with mobile solute atoms and vacancies, which aid in delayed precipitation and an eventual recovery of strength [19,40,75,76]. Conversely, the opposite is true for Mg-rich compositions: during AA these thermally stable clusters may continue to slowly grow, however they are broadly incapable of aiding in nucleation of strengthening precipitates (e.g., by acting as nucleation sites or directly transforming) as suggested by [6,16,17,40].
4.1.2. NA Effect on AA—Air Cooled
Figure 17a–c plots the difference in AA hardening behavior between both prior NA conditions as a function of AA time, for both WQ and AC. In order to separate the effects of prior NA for each quench condition, primary and secondary x-axes are used to visually normalize the plots to the peak aged time. The influence of the quench rate itself on aging behavior (i.e., quench sensitivity) will be discussed in later subsections. In all cases, the negative NA effect is either reduced (Si-rich and Mg-rich alloys) or unchanged (balanced alloy) by air cooling. This was expected based off the depletion of supersaturation during slow cooling (and associated reduction of NA clustering kinetics) as mentioned in the introduction to this Discussion.
However, when considering the impact of quench rate on the AA evolution of that negative effect, some differences become apparent. For the Si-rich composition, although the negative effect is reduced, its evolution is essentially unchanged; in other words, prior NA reduces AA hardening kinetics, but a full recovery of the peak-aged state still occurs (regardless of quench rate). In contrast, for the Mg-rich composition, AC severely reduces the negative effect en-route to the peak aged state, and a roughly constant negative influence of ~3 Hv is seen. It is believed that intermediate temperature clusters formed during slow cooling (>RT, <T(AA)) are capable of acting similarly to clusters formed during pre-aging [14,15,17,71] or interrupted quenching [72,73]; i.e., as nucleation sites or pre-formed nuclei for strengthening precipitation. However, this would only be true if the advantageous pre-formed clusters are stable at the AA temperature. For Si-rich compositions, cluster thermal instability and dissolution/dissipation during AA would negate these positive effects, leading to a similar negative NA effect (as WQ). For Mg-rich compositions, the opposite conclusions can be drawn, leading to a reduced NA effect on hardenability as is seen here.
Figure 18 shows the approximate AA times corresponding to peak hardness and conductivity recovery after AC. In relation to WQ (Figure 16), longer times are expectedly required for all cases. Again the Mg-rich alloy shows a conductivity recovery time far in excess of the peak-aged condition, indicating thermal stability (of NA clusters or growth of pre-formed clusters during cooling). The dependence of cluster stability on Mg/Si brings about an interesting concern for 6000 series alloys: Sufficiently low bulk Mg/Si ratios may render the process of pre-aging ineffective at combating the negative effect of NA for the most industrially relevant (short) aging treatments. Although literature comparisons are relatively limited, similar studies have revealed an identical compositional dependence on WQ hardness recoverability [12], and also the proposed compositional dependence of pre-aging efficacy; i.e., pre-aging ineffective for an Si-rich alloy, and effective for higher Mg/Si ratios [77].
4.1.3. Quench Sensitivity—NA Itself
The NA conductivity curves of Figure 7a–c show that even after air cooling, at least some of the NA clustering processes are still active. Interestingly, however, slow cooling delays the onset of NA conductivity change (compared to WQ, Figure 4a–c), which is more significant for higher bulk Mg/Si contents. Although a detailed natural aging study is beyond the scope of this work, a simple explanation is provided here. Precipitation during cooling has been found to have only a local impact on matrix supersaturation, i.e., solute depletion in the vicinity of the precipitate, but not in the bulk matrix [78]. This explains the observations of higher initial NA conductivity following AC, and sustained NA clustering response. The delayed NA rate is likely due to two factors: reduced initial vacancy concentration, and intermediate temperature clustering during cooling. As mentioned before, clusters formed between ambient and AA temperatures (21 °C < T < 175 °C) are comparatively large and fairly compositionally balanced (close to 1Mg:1Si) [14,15,17,71]. As such, the Mg/Si dependence on the AC delay in NA clustering (Figure 7a–c) may simply be a result of the as-cooled matrix compositions: Given a certain amount of high-temperature precipitation, intermediate temperature clustering of a balanced Mg:Si ratio would essentially exaggerate the already Mg-rich and Si-rich matrix compositions. Since the diffusivity of Mg in FCC-Al is lower than that of Si [79], this may lead to slower NA kinetics, particularly for solid solutions of high Mg/Si ratio.
4.1.4. Quench Sensitivity—AA after Minimal NA
With respect to quench sensitivity with minimal prior NA, Figure 6 (WQ + 0.5 h NA vs. AC + 0.5 h NA) shows that slow cooling has a detrimental effect on hardening response for the high strength Si- and Mg-rich alloy, but not for the balanced counterpart. When quench sensitivity is assessed by AA hardening response, the main factors are excess vacancy annihilation, and/or pre-mature precipitation during cooling. Differences in quenched-in vacancy concentration may explain reduced AA kinetics, however cannot provide an explanation for the observed Mg/Si dependence, so high-temperature precipitation must be considered.
Precipitation at elevated temperature is strongly increased by the existence of energetically favorable surfaces for nucleation (e.g., dispersoids, grain boundaries, etc.); however due to the relatively long and identical homogenization and solution treatments used here, this is expected to have a uniform impact on all alloys. We use simulated (Thermo-Calc/Prisma [56]) time-temperature-transformation (TTT) curves, although not strictly applicable to the continuous cooling case, to evaluate the relative instability of solid solutions as a function of Mg/Si. Figure 19 plots the time/temperature pairs corresponding to the nose of the TTT curves associated with the depletion of 10% of equilibrium precipitate volume fraction, for various Mg/Si ratios. As seen by the Mg/Si dependence of the trend lines, the Mg-rich and Si-rich solutions are less stable relative to the balanced composition, due to higher temperatures/shorter times associated with the precipitation of β and Si phases. This relative instability helps to explain the (minimal prior NA) quench sensitivity of the Mg- and Si-rich alloys seen in Figure 6a,c.
4.1.5. Quench Sensitivity—AA after Prolonged NA
Quench insensitivity after prolonged NA (as seen for the high strength balanced and Mg-rich alloys in Figure 6) has been identified before, and proposed to primarily be due to the annihilation of vacancies during cooling (for AC samples) and during natural aging (for WQ samples) [51]. We however, also find that the Si-rich composition retains its quench sensitivity after prolonged NA, suggesting additional contributions. Owing to the ~100 fold reduction in bulk vacancy fraction immediately after AC, it is highly likely that subsequent NA clustering also results in a reduction in ’trapped’ vacancy concentration. Now consider the differences in cluster thermal stability discussed earlier. Thermally unstable NA clusters in the Si-rich alloy are still likely to dissipate during AA, however the associated release of trapped vacancies (and aid to solute mobility) is reduced compared to WQ, leading to a quench sensitivity of AA hardening response. For thermally stable clusters (e.g., the Mg-rich alloy), the lack of a cluster dissipation process would effectively normalize ‘free’ vacancy concentration during AA in AC and WQ conditions, leading to the relative quench insensitivity that is seen.
4.1.6. Effect of Direct Quench (into AA)
The influence of all time below 175 °C (i.e., full quench, short NA, and AA heating ramp) can be assessed by comparing the AA behavior of WQ + 0.5 h NA and DQ conditions. AA hardening behavior (Figure 8) shows that for both unbalanced compositions (Si-rich and Mg-rich), DQ results in slightly reduced AA hardening response. For the balanced composition, however an improvement in hardening is seen. Immediately after quenching (to ~21 °C and ~175 °C for WQ and DQ, respectively), the quenched-in vacancy concentration is theoretically higher for WQ, while solute supersaturation (with respect to AA) is unchanged. After minimal NA (and minimal NA clustering), this difference in vacancy concentration could be responsible for the reduced hardening kinetics in the Si-rich and Mg-rich compositions after DQ (Figure 8a,c). Figure 20 plots the driving force for β″-Mg5Si6 precipitation as a function of bulk Mg/Si for the Mg + Si = 1.4 and 0.7 wt% systems used in this work (calculated with Thermo-Calc [56]); the driving force is expectedly higher for the compositionally balanced alloys with Mg/Si = 0.7, which therefore have a nucleation advantage over their unbalanced (Si-rich and Mg-rich) counterparts. We propose that it is this compositional nucleation advantage that is responsible for the improved hardening kinetics seen for the balanced alloy and DQ treatment (Figure 8b), which is capable of overcoming the reduced solute mobility in the early stages of AA.
It should also be noted that the clustering process starts exceptionally quickly, and the formation of solute-vacancy complexes has been suggested to occur during the quench itself [15,24,65,66]; in other words some degree of low temperature clustering almost certainly occurs in the WQ + 0.5 h NA condition. This process, and the associated vacancy stabilization during aging [37], may be responsible for the increased resistance to DQ over-aging. DQ vs. AA precipitate stability is most obvious in the balanced alloy (Figure 8b), however a slight coarsening resistance is also seen in the Si- and Mg-rich compositions (Figure 8a,c). For DQ samples, no vacancy stabilization likely leads to faster annihilation during AA, and relatively slower diffusion at long AA times (i.e., precipitate thermal stability). For WQ + 0.5 h NA samples, the associated vacancy stabilization, and eventual release of trapped vacancies (either by cluster dissipation or slow thermally activated release) may essentially enhance solute diffusion at later AA times, leading to the faster over-aging that is seen.
Finally, DQ conductivity will be mentioned. Figure 9a–c shows that in all cases, initial AA conductivity is highest in the DQ condition. This meets expectations and is due to the presence of NA clusters formed immediately after/during WQ, as well as the increased precipitation kinetics for the balanced composition (Figure 8b). Figure 21 represents an effort to reduce the impact of changes in precipitation kinetics (relative to the presence of NA clusters) on AA conductivity comparisons: in the under-aged state, the contribution of precipitates (mainly β″) to 6000 series alloy strength can be modelled as a function of precipitate volume fraction [80]. However, the presence of clusters contributes additional strengthening [81], but conversely lowers electrical conductivity. As such, Figure 21 plots the difference between [DQ] − [WQ + 0.5 h NA] conductivity at the point of nearly equivalent under-aged hardness. The difference increases with Mg/Si ratio, which is associated with an increase in the contribution of clusters to AA strength (in the WQ + 0.5 h NA condition). Additionally, only the Mg-rich alloy displays higher conductivity in the DQ condition throughout the AA process (Figure 9c), again signifying the thermal stability of NA clusters (formed in WQ + 0.5 h NA) as suggested previously [40,45].
4.2. Low Strength (Mg + Si ≈ 0.7 wt %) Alloys
In the interest of brevity, the discussion of the low strength alloy results will be limited to key findings only. In general, the Mg/Si dependence seen for high-solute alloys is not present in the low-solute counterparts. This is likely due to several factors: severely reduced magnitude of driving force for strengthening precipitation (seen in Figure 20), reduced NA clustering (seen in Figure 11 and Figure 13), and thermal stability considerations for any NA clusters that do form. Assuming that cluster stability follows traditional solid solution thermodynamics as proposed by [82,83], it is likely that the (~50%) reduction in solution composition would sufficiently reduce cluster solvus temperature, resulting in thermal instability (at 175 °C) regardless of the Mg/Si ratio. This idea is exemplified with the simple schematic seen in Figure 22, which conceptually shows cluster solvus lines for different Mg/Si and Mg + Si compositions. The low strength alloy results are analyzed with this in mind, and the implications are discussed below.
4.2.1. NA Effect on AA—Water Quench
In the WQ condition, the low-solute alloys display a relatively small influence of prolonged NA on hardenability (Figure 10) compared to the high-solute alloys (Figure 3). This may be due to minimal natural aging itself in the conditions investigated (shown with NA conductivity evolution in Figure 11). However, based on the results of previous low-solute NA investigations [24,29,62], it is believed that at least some of the NA processes are still active. Regardless, the current analysis mindset indicates that NA clusters in low-solute alloys are likely to dissolve at AA temperatures. As discussed previously, in high-strength alloys (e.g., the high strength, Si-rich composition) even unstable NA clusters induce a negative hardenability effect as a result of concurrent cluster dissolution and precipitation. However, in the case of the low-solute alloys investigated, the precipitation incubation periods are quite long (i.e., >~3 h, Figure 10); as such, it is likely that cluster dissolution may precede precipitation (as opposed to occurring concurrently), leading to the recovery of AA hardenability (and minimal NA effect).
4.2.2. NA Effect on AA—Air Cooled
Low-solute alloys after air cooling, however, show an even more interesting influence of NA on AA hardenability. In all cases, prolonged NA after AC induces improved AA response (Figure 12). These results are difficult to rectify with the current analysis paradigm (i.e., low-solute cluster dissolution), however several additional factors/interactions need to be taken into account. Compared to the high-solute alloys, driving force in the low-solute compositions is drastically reduced (Figure 20) and significant depletion of solute due to precipitation during cooling is unlikely. This may lead to a competitive advantage of intermediate temperature clusters during cooling. The NA growth of (larger) as-cooled clusters would theoretically have an increased attractive cluster-vacancy trapping force, which relates to the number of solutes contained in the growing cluster according to the model suggested by [38]. During AA, when long precipitation incubation periods are required (also due to low driving force for low-solute alloys), excess vacancy stabilization (i.e., longer times before annihilation) and eventual release (due to cluster dissolution) may actually provide a boost to solute mobility when it is needed most (i.e., during the initial stages of precipitation). As a result, an improvement in AA hardening response (as seen in Figure 12 and Figure 13) could be expected.
The importance of the AA time dependence of cluster dissolution and strengthening precipitation has been previously suggested to describe similar results [46]. It should be noted, however, that this description is controversial. The positive NA effect in low-strength alloys has also been explained with an alternative viewpoint, i.e., that NA clusters in low-strength alloys are uniquely capable of aiding in nucleation of strengthening precipitates [47]. This explanation could also be applied to the results here, however the current authors are hesitant to do so based on the NA cluster stability considerations presented in [40], and discussed throughout this text.
4.2.3. Effect of Direct Quench (into AA)
The direct quench was shown to be a highly ineffective hardening treatment for low-solute alloys, independent of composition. As already proposed in relation to the high-strength alloys, a high precipitation driving force is required to overcome the fewer quenched-in vacancies of the DQ treatment. As seen in Figure 20, low-solute alloys are at a distinct energetic disadvantage with respect to driving force (and nucleation), leading to their poor DQ hardening performance in relation to ‘traditional’ quench and re-heat (Figure 14).
5. Conclusions
- This work investigated the hardening response (isothermal aging at 175 °C) of a wide range of model alloys (variable Mg/Si and Mg + Si) under various two-step aging conditions (variable solutionization quench rate and duration of prior natural aging).
- For high strength alloys (Mg+Si ≈ 1.4 wt %), the negative effect of prolonged prior NA on peak AA strength is dependent on bulk Mg/Si ratio.
- For most AA times, the negative effect in high strength alloys is reduced or unchanged after air cooling (in comparison to water quench).
- For low strength alloys (Mg + Si ≈ 0.7 wt %), the influence of NA does not show the same dependence of Mg:Si ratio as high strength alloys.
- Air cooling of low-strength alloys induces a positive NA effect on hardenability.
- The direct quench (and artificially age) treatment was found to only be effective in combination with high precipitation driving force.
- In general and in accordance with recent research, results are discussed based on the actions of (NA) solute/vacancy clusters during artificial aging. In particular, a complex interaction between vacancy concentration, NA cluster stability, and precipitation driving force is suggested. It is furthermore suggested that the thermal stability of NA clusters increases with bulk Mg:Si ratio and increased solute content.
Author Contributions
This article was written by A.P. and V.T. Experiments were performed by A.P. and V.T.. Results were analyzed by A.P. and P.S.
Acknowledgments
This work was supported and funded by Hydro AS, Norway.
Conflicts of Interest
The authors declare no conflict of interest.
References
- Hirsch, J. Aluminium in Innovative Light-Weight Car Design. Mater. Trans. 2011, 52, 818–824. [Google Scholar] [CrossRef]
- Miller, W.S.; Zhuang, L.; Bottema, J.; Wittebrood, A.J.; de Smet, P.; Haszler, A.; Vieregge, A. Recent development in aluminium alloys for the automotive industry. Mater. Sci. Eng. A 2000, 280, 37–49. [Google Scholar] [CrossRef]
- Pashley, D.W.; Rhodes, J.W.; Sendorek, A. Delayed Ageing in Aluminium-Magnesium-silicon alloys—Effect on structure and mechanical properties. INST Met. J. 1966, 94, 41–49. [Google Scholar]
- Pashley, D.W.; Jacobs, M.H.; Vietz, J.T. The basic processes affecting two-step ageing in an Al-Mg-Si alloy. Philos. Mag. 1967, 16, 51–76. [Google Scholar] [CrossRef]
- Hirata, T.; Matsuo, S. Two-Step Ageing Behaviours in an Al-1.2 wt % Mg2Si Alloy. Trans. Jpn. Inst. Met. 1972, 13, 231–237. [Google Scholar] [CrossRef]
- Cuniberti, A.; Tolley, A.; Riglos, M.V.C.; Giovachini, R. Influence of natural aging on the precipitation hardening of an Al-Mg-Si alloy. Mater. Sci. Eng. A 2010, 527, 5307–5311. [Google Scholar] [CrossRef]
- Esmaeili, S.; Wang, X.; Lloyd, D.J.; Poole, W.J. On the precipitation-hardening behavior of the Al-Mg-Si-Cu alloy AA6111. Metall. Mater. Trans. A 2003, 34, 751–763. [Google Scholar]
- Jia, Z.; Ding, L.; Cao, L.; Sanders, R.; Li, S.; Liu, Q. The Influence of Composition on the Clustering and Precipitation Behavior of Al-Mg-Si-Cu Alloys. Metall. Mater. Trans. A 2017, 48, 459–473. [Google Scholar] [CrossRef]
- Kim, J.; Marioara, C.D.; Holmestad, R.; Kobayashi, E.; Sato, T. Effects of Cu and Ag additions on age-hardening behavior during multi-step aging in Al-Mg-Si alloys. Mater. Sci. Eng. A 2013, 560, 154–162. [Google Scholar] [CrossRef]
- Marioara, C.D.; Andersen, S.J.; Jansen, J.; Zandbergen, H.W. The influence of temperature and storage time at RT on nucleation of the β″ phase in a 6082 Al-Mg-Si alloy. Acta Mater. 2003, 51, 789–796. [Google Scholar] [CrossRef]
- Pogatscher, S.; Antrekowitsch, H.; Leitner, H.; Sologubenko, A.S.; Uggowitzer, P.J. Influence of the thermal route on the peak-aged microstructures in an Al-Mg-Si aluminum alloy. Scr. Mater. 2013, 68, 158–161. [Google Scholar] [CrossRef]
- Tao, G.H.; Liu, C.H.; Chen, J.H.; Lai, Y.X.; Ma, P.P.; Liu, L.M. The influence of Mg/Si ratio on the negative natural aging effect in Al-Mg-Si-Cu alloys. Mater. Sci. Eng. A 2015, 642, 241–248. [Google Scholar] [CrossRef]
- Weng, Y.; Jia, Z.; Ding, L.; Pan, Y.; Liu, Y.; Liu, Q. Effect of Ag and Cu additions on natural aging and precipitation hardening behavior in Al-Mg-Si alloys. J. Alloys Compd. 2017, 695, 2444–2452. [Google Scholar] [CrossRef]
- Zandbergen, M.W.; Xu, Q.; Cerezo, A.; Smith, G.D.W. Study of precipitation in Al-Mg-Si alloys by Atom Probe Tomography I. Microstructural changes as a function of ageing temperature. Acta Mater. 2015, 101, 136–148. [Google Scholar] [CrossRef]
- Murayama, M.; Hono, K. Pre-precipitate clusters and precipitation processes in Al-Mg-Si alloys. Acta Mater. 1999, 47, 1537–1548. [Google Scholar] [CrossRef]
- Serizawa, A.; Hirosawa, S.; Sato, T. 3DAP Characterization and Thermal Stability of Nano-Scale Clusters in Al-Mg-Si Alloys. Mater. Sci. Forum 2006, 519–521, 245–250. [Google Scholar] [CrossRef]
- Serizawa, A.; Hirosawa, S.; Sato, T. Three-Dimensional Atom Probe Characterization of Nanoclusters Responsible for Multistep Aging Behavior of an Al-Mg-Si Alloy. Metall. Mater. Trans. A 2008, 39, 243–251. [Google Scholar] [CrossRef]
- Aruga, Y.; Kozuka, M.; Takaki, Y.; Sato, T. Formation and reversion of clusters during natural aging and subsequent artificial aging in an Al-Mg-Si alloy. Mater. Sci. Eng. A 2015, 631, 86–96. [Google Scholar] [CrossRef]
- Pogatscher, S.; Antrekowitsch, H.; Leitner, H.; Ebner, T.; Uggowitzer, P.J. Mechanisms controlling the artificial aging of Al-Mg-Si Alloys. Acta Mater. 2011, 59, 3352–3363. [Google Scholar] [CrossRef]
- Liu, C.H.; Lai, Y.X.; Chen, J.H.; Tao, G.H.; Liu, L.M.; Ma, P.P.; Wu, C.L. Natural-aging-induced reversal of the precipitation pathways in an Al–Mg–Si alloy. Scr. Mater. 2016, 115, 150–154. [Google Scholar] [CrossRef]
- Yamada, K.; Sato, T.; Kamio, A. Effects of Quenching Conditions on Two-Step Aging Behavior of Al-Mg-Si Alloys. Mater. Sci. Forum 2000, 331–337, 669–674. [Google Scholar] [CrossRef]
- Grau, V.N.; Cuniberti, A.; Tolley, A.; Riglos, V.C.; Stipcich, M. Solute clustering behavior between 293K and 373K in a 6082 Aluminum alloy. J. Alloys Compd. 2016, 684, 481–487. [Google Scholar] [CrossRef]
- Seyedrezai, H.; Grebennikov, D.; Mascher, P.; Zurob, H.S. Study of the early stages of clustering in Al-Mg-Si alloys using the electrical resistivity measurements. Mater. Sci. Eng. A 2009, 525, 186–191. [Google Scholar] [CrossRef]
- Banhart, C.S.T.C.J. Natural Aging in Al-Mg-Si Alloys—A Process of Unexpected Complexity. Adv. Eng. Mater. 2010, 12, 559–571. [Google Scholar] [CrossRef]
- Chang, C.S.T.; Banhart, J. Low-Temperature Differential Scanning Calorimetry of an Al-Mg-Si Alloy. Metall. Mater. Trans. A 2011, 42, 1960–1964. [Google Scholar] [CrossRef]
- Gupta, A.K.; Lloyd, D.J. Study of precipitation kinetics in a super purity Al-0.8 Pct Mg-0.9 Pct Si alloy using differential scanning calorimetry. Metall. Mater. Trans. A 1999, 30, 879–890. [Google Scholar] [CrossRef]
- Chang, C.S.T.; Liang, Z.; Schmidt, E.; Banhart, J. Influence of Mg/Si ratio on the clustering kinetics in Al-Mg-Si alloys. Int. J. Mater. Res. 2012, 103, 955–961. [Google Scholar] [CrossRef]
- Dutta, I.; Allen, S.M. A calorimetric study of precipitation in commercial aluminium alloy 6061. J. Mater. Sci. Lett. 1991, 10, 323–326. [Google Scholar] [CrossRef]
- Banhart, J.; Lay, M.D.H.; Chang, C.S.T.; Hill, A.J. Kinetics of natural aging in Al-Mg-Si alloys studied by positron annihilation lifetime spectroscopy. Phys. Rev. B 2011, 83. [Google Scholar] [CrossRef]
- Buha, J.; Munroe, P.R.; Lumley, R.N.; Crosky, A.G.; Hill, A.J. Positron studies of precipitation in 6061 aluminium alloy. Mater. Forum 2004, 28, 1028–1033. [Google Scholar]
- Klobes, B.; Staab, T.E.M.; Haaks, M.; Maier, K.; Wieler, I. The role of quenched-in vacancies for the decomposition of aluminium alloys. Phys. Status Solidi RRL Rapid Res. Lett. 2008, 2, 224–226. [Google Scholar] [CrossRef]
- Lay, M.D.H.; Zurob, H.S.; Hutchinson, C.R.; Bastow, T.J.; Hill, A.J. Vacancy Behavior and Solute Cluster Growth during Natural Aging of an Al-Mg-Si Alloy. Metall. Mater. Trans. A 2012, 43, 4507–4513. [Google Scholar] [CrossRef]
- Girifalco, L.A.; Herman, H. A model for the growth of Guinier-Preston zones-the vacancy pump. Acta Metall. 1965, 13, 583–590. [Google Scholar] [CrossRef]
- Panseri, C.; Gatto, F.; Federighi, T. Interaction between solute magnesium atoms and vacancies in aluminium. Acta Metall. 1958, 6, 198–204. [Google Scholar] [CrossRef]
- Wolverton, C. Solute-vacancy binding in aluminum. Acta Mater. 2007, 55, 5867–5872. [Google Scholar] [CrossRef]
- Hirosawa, F.N.S. First-Principles Calculation of Interaction Energies between Solutes and/or Vacancies for Predicting Atomistic Behaviors of Microalloying Elements in Aluminum Alloys. Mater. Sci. Forum 2007, 561–565, 283–286. [Google Scholar] [CrossRef]
- Wenner, S.; Nishimura, K.; Matsuda, K.; Matsuzaki, T.; Tomono, D.; Pratt, F.L.; Marioara, C.D.; Holmestad, R. Clustering and Vacancy Behavior in High- and Low-Solute Al-Mg-Si Alloys. Metall. Mater. Trans. 2014, 45, 5777–5781. [Google Scholar] [CrossRef]
- Zurob, H.S.; Seyedrezai, H. A model for the growth of solute clusters based on vacancy trapping. Scr. Mater. 2009, 61, 141–144. [Google Scholar] [CrossRef]
- Porter, D.A.; Easterling, K.E.; Sherif, M. Phase Transformations in Metals and Alloys, 3rd ed.; CRC Press: Boca Raton, FL, USA, 2009. [Google Scholar]
- Poznak, A.; Marceau, R.K.W.; Sanders, P.G. Composition dependent thermal stability and evolution of solute clusters in Al-Mg-Si analyzed using atom probe tomography. Mater. Sci. Eng. A 2018, 721, 47–60. [Google Scholar] [CrossRef]
- Bryant, J.D. The effects of preaging treatments on aging kinetics and mechanical properties in AA6111 aluminum autobody sheet. Metall. Mater. Trans. A 1999, 30, 1999–2006. [Google Scholar] [CrossRef]
- Bryant, J.D.; Yoshida, H.; Uchida, H. Process and Apparatus to Enhance the Paintbake Response and Aging Stability of Aluminum Sheet Materials and Product Therefrom. U.S. Patent 5718780 A, 17 February 1998. [Google Scholar]
- Birol, Y. Effect of natural ageing on the performance of pre-ageing to improve bake-hardening response of a twin-roll cast Al–Mg–Si alloy. Z. Für Met. 2005, 96, 380–384. [Google Scholar] [CrossRef]
- Abid, T.; Boubertakh, A.; Hamamda, S. Effect of pre-aging and maturing on the precipitation hardening of an Al–Mg–Si alloy. J. Alloys Compd. 2010, 490, 166–169. [Google Scholar] [CrossRef]
- Poznak, A.; Sanders, P. The Influence of Low Temperature Clustering on Strengthening Precipitation in Al-Mg-Si Alloys. In Light Metals 2016; Springer International Publishing: Cham, Switzerland, 2016. [Google Scholar]
- Pogatscher, S.; Antrekowitsch, H.; Ebner, T.; Uggowitzer, P.J. The Role of Co-Clusters in the Artificial Aging of AA6061 and AA6060. In Light Metals 2012; Suarez, C.E., Ed.; Springer International Publishing: Cham, Switzerland, 2012; pp. 415–420. [Google Scholar]
- Chang, C.S.T.; Wieler, I.; Wanderka, N.; Banhart, J. Positive effect of natural pre-ageing on precipitation hardening in Al–0.44 at% Mg–0.38 at% Si alloy. Ultramicroscopy 2009, 109, 585–592. [Google Scholar] [CrossRef] [PubMed]
- Zoller, H.; Ried, A. Metallkundliche Gesichtspunkte bei der Entwicklung wenig abschreckempfindlicher AlMgSi-Legierungen. Z. Für Met. 1971, 62, 351–385. [Google Scholar]
- Benjamin Milkereit, N.W. Continuous cooling precipitation diagrams of Al-Mg-Si alloys. Mater. Sci. Eng. A 2012, 550, 87–96. [Google Scholar] [CrossRef]
- Milkereit, B.; Starink, M.J. Quench sensitivity of Al-Mg-Si alloys: A model for linear cooling and strengthening. Mater. Des. 2015, 76, 117–129. [Google Scholar] [CrossRef]
- Strobel, K. Quench Sensitivity in 6xxx Series Aluminium Alloys. Ph.D Thesis, Department of Materials Engineering, Monash University, Melbourne, VIC, Australia, 2013. [Google Scholar]
- Zandbergen, H.W.; Andersen, S.J.; Jansen, J. Structure Determination of Mg5Si6 Particles in Al by Dynamic Electron Diffraction Studies. Science 1997, 277, 1221–1225. [Google Scholar] [CrossRef]
- Hasting, H.K.S.; Frøseth, A.G.; Andersen, S.J.; Vissers, R.; Walmsley, J.C.; Marioara, C.D. Composition of β″ precipitates in Al-Mg-Si alloys by atom probe tomography and first principles calculations. J. Appl. Phys. 2009, 106, 123527. [Google Scholar] [CrossRef]
- Zajac, S.; Hutchinson, B.; Johansson, A.; Gullman, L.-O. Microstructure control and extrudability of Al–Mg–Si alloys microalloyed with manganese. Mater. Sci. Technol. 1994, 10, 323–333. [Google Scholar] [CrossRef]
- Donnadieu, P.; Lapasset, G.; Sanders, T.H. Manganese-induced ordering in the α-(Al-Mn-Fe-Si) approximant phase. Philos. Mag. Lett. 1994, 70, 319–326. [Google Scholar] [CrossRef]
- Andersson, J.O.; Helander, T.; Höglund, L.; Shi, P.F.; Sundman, B. Thermo-Calc and DICTRA. Calphad 2002, 26, 273–312. [Google Scholar] [CrossRef]
- Geuser, F.D.; Lefebvre, W.; Blavette, D. 3D atom probe study of solute atoms clustering during natural ageing and pre-ageing of an Al-Mg-Si alloy. Philos. Mag. Lett. 2006, 86, 227–234. [Google Scholar] [CrossRef]
- CMarioara, D.; Andersen, S.J.; Zandbergen, H.W.; Holmestad, R. The influence of alloy composition on precipitates of the Al−Mg−Si system. Metall. Mater. Trans. A 2005, 36, 691–702. [Google Scholar]
- Hillel, A.J.; Edwards, J.T.; Wilkes, P. Theory of the resistivity and Hall effect in alloys during Guinier-Preston zone formation. Philos. Mag. 1975, 32, 189–209. [Google Scholar] [CrossRef]
- Esmaeili, S.; Vaumousse, D.; Zandbergen, M.W.; Poole, W.J.; Cerezo, A.; Lloyd, D.J. A study on the early-stage decomposition in the Al-Mg-Si-Cu alloy AA6111 by electrical resistivity and three-dimensional atom probe. Philos. Mag. 2007, 87, 3797–3816. [Google Scholar] [CrossRef]
- Kovaćs, I.; Lendvai, J.; Nagy, E. The mechanism of clustering in supersaturated solid solutions of A1-Mg2Si alloys. Acta Metall. 1972, 20, 975–983. [Google Scholar] [CrossRef]
- Banhart, J.; Liu, M.; Yong, Y.; Liang, Z.; Chang, C.S.T.; Elsayed, M.; Lay, M.D.H. Study of ageing in Al-Mg-Si alloys by positron annihilation spectroscopy. Phys. B Condens. Matter 2012, 407, 2689–2696. [Google Scholar] [CrossRef]
- Fischer, F.D.; Svoboda, J.; Appel, F.; Kozeschnik, E. Modeling of excess vacancy annihilation at different types of sinks. Acta Mater. 2011, 59, 3463–3472. [Google Scholar] [CrossRef]
- Falahati, A.; Lang, P.; Kozeschnik, E. Precipitation in Al-Alloy 6016—The Role of Excess Vacancies. Mater. Sci. Forum 2012, 706–709, 317–322. [Google Scholar] [CrossRef]
- Martinsen, F.A.; Ehlers, F.J.H.; Torsæter, M.; Holmestad, R. Reversal of the negative natural aging effect in Al–Mg–Si alloys. Acta Mater. 2012, 60, 6091–6101. [Google Scholar] [CrossRef]
- Esmaeili, S.; Lloyd, D.J. Effect of composition on clustering reactions in AlMgSi(Cu) alloys. Scr. Mater. 2004, 50, 155–158. [Google Scholar] [CrossRef]
- Marceau, R.K.W.; de Vaucorbeil, A.; Sha, G.; Ringer, S.P.; Poole, W.J. Analysis of strengthening in AA6111 during the early stages of aging: Atom probe tomography and yield stress modelling. Acta Mater. 2013, 61, 7285–7303. [Google Scholar] [CrossRef]
- Fallah, V.; Langelier, B.; Ofori-Opoku, N.; Raeisinia, B.; Provatas, N.; Esmaeili, S. Cluster evolution mechanisms during aging in Al-Mg-Si alloys. Acta Mater. 2016, 103, 290–300. [Google Scholar] [CrossRef]
- Torsæter, M.; Hasting, H.S.; Lefebvre, W.; Marioara, C.D.; Walmsley, J.C.; Andersen, S.J.; Holmestad, R. The influence of composition and natural aging on clustering during preaging in Al-Mg-Si alloys. J. Appl. Phys. 2010, 108, 073527. [Google Scholar] [CrossRef]
- Zajac, S.; Bengtsson, B.; Johansson, A.; Gullman, L.-O. Optimisation of Mg2Si Phase for Extrudability of AA 6063 and AA 6005 Alloys. Mater. Sci. Forum 1996, 217–222, 397–402. [Google Scholar] [CrossRef]
- Aruga, Y.; Kozuka, M.; Takaki, Y.; Sato, T. Evaluation of Solute Clusters Associated with Bake-Hardening Response in Isothermal Aged Al-Mg-Si Alloys Using a Three-Dimensional Atom Probe. Metall. Mater. Trans. A 2014, 45, 5906–5913. [Google Scholar] [CrossRef]
- Pogatscher, S.; Antrekowitsch, H.; Leitner, H.; Pöschmann, D.; Zhang, Z.L.; Uggowitzer, P.J. Influence of interrupted quenching on artificial aging of Al–Mg–Si alloys. Acta Mater. 2012, 60, 4496–4505. [Google Scholar] [CrossRef]
- Ding, L.; Weng, Y.; Wu, S.; Sanders, R.E.; Jia, Z.; Liu, Q. Influence of interrupted quenching and pre-aging on the bake hardening of Al–Mg–Si Alloy. Mater. Sci. Eng. A 2016, 651, 991–998. [Google Scholar] [CrossRef]
- Esmaeili, S. Precipitation Hardening Behavior of AA6111, Ph.D Thesis, The University of British Columbia, Vancouver, BC, Canada, 2002. [Google Scholar]
- Pogatscher, H.A.S. Diffusion on Demand to Control Precipitation Aging: Application to Al-Mg-Si Alloys. Phys. Rev. Lett. 2014, 112, 225701. [Google Scholar] [CrossRef] [PubMed]
- Werinos, M. Antrekowitsch, H.; Ebner, T.; Prillhofer, R.; Curtin, W.A.; Uggowitzer, P.J.; Pogatscher, S. Design strategy for controlled natural aging in Al–Mg–Si alloys. Acta Mater. 2016, 118, 296–305. [Google Scholar] [CrossRef]
- SeongNyeong, K.I.M. Composition Dependence of Nanocluster Characteristics in Natural- and Pre-aged Al-Mg-Si alloys Responsible for Two-step Aging Behavior. Doctoral Thesis, Tokyo Institute of Technology, Tokyo, Japan, 2016. [Google Scholar]
- Deschamps, A.; Texier, G.; Ringeval, S.; Delfaut-Durut, L. Influence of cooling rate on the precipitation microstructure in a medium strength Al-Zn-Mg alloy. Mater. Sci. Eng. A 2009, 501, 133–139. [Google Scholar] [CrossRef]
- Mantina, M.; Wang, Y.; Chen, L.Q.; Liu, Z.K.; Wolverton, C. First principles impurity diffusion coefficients. Acta Mater. 2009, 57, 4102–4108. [Google Scholar] [CrossRef]
- Esmaeili, S.; Lloyd, D.J.; Poole, W.J. A yield strength model for the Al-Mg-Si-Cu alloy AA6111. Acta Mater. 2003, 51, 2243–2257. [Google Scholar] [CrossRef]
- Myhr, O.R.; Grong, Ø.; Schäfer, C. An Extended Age-Hardening Model for Al-Mg-Si Alloys Incorporating the Room-Temperature Storage and Cold Deformation Process Stages. Metall. Mater. Trans. A 2015, 46, 6018–6039. [Google Scholar] [CrossRef]
- Starink, M.J.; Wang, S.C. The thermodynamics of and strengthening due to co-clusters: General theory and application to the case of Al-Cu-Mg alloys. Acta Mater. 2009, 57, 2376–2389. [Google Scholar] [CrossRef]
- Starink, M.J.; Cao, L.F.; Rometsch, P.A. A model for the thermodynamics of and strengthening due to co-clusters in Al–Mg–Si-based alloys. Acta Mater. 2012, 60, 4194–4207. [Google Scholar] [CrossRef]
Figure 1.
Experimental alloy Mg and Si contents in relation to common 6000 series alloys.

Figure 2.
In-situ, time-temperature profiles corresponding to the five different heat treatments applied to all alloys, organized by solutionization cooling rate; water quench (WQ) (a); direct quench (DQ) (b); and ambient air cooling (AC) (c).
Figure 2.
In-situ, time-temperature profiles corresponding to the five different heat treatments applied to all alloys, organized by solutionization cooling rate; water quench (WQ) (a); direct quench (DQ) (b); and ambient air cooling (AC) (c).

Figure 3.
Hardness evolutions during artificial aging (AA) in high strength alloys of Si-rich (a); balanced (b); and Mg-rich (c) compositions. Prior to AA, samples were water quenched from ST (solution treatment) and naturally aged for either 0.5 or 4 h. Error bars represent 95% confidence intervals.

Figure 4.
Conductivity evolutions during aging in the high strength Si-rich (a); balanced (b); and Mg-rich (c) alloys after a WQ from ST. The primary axes correspond to AA (175 °C with 0.5 or 4 h prior NA), and the secondary axes correspond to natural aging (NA) itself (~21 °C). Error bars represent 95% confidence. The variation in error is due to the technique in which the measurements were made: Artificially aged samples were all tested in the same sitting, so measurements were not subject to day to day perturbations (e.g., temperature) and uncertainty is simply based off standard error. Naturally aged samples were tested over multiple sittings (i.e., same specimen tested) and uncontrolled variables significantly affected the data. To account for this, each measurement was normalized to that of a pure Al standard; this smoothed the curves but increased the uncertainty (due to the error propagation).

Figure 5.
Transmission electron microscopy (TEM) images showing roughly peak-aged (10.8 h at 175 °C) nanostructures in the high strength Si-rich (a,b) and Mg-rich (c,d) alloys with 0.5 h prior NA (a,c) and 4 h prior NA (b,d).
Figure 5.
Transmission electron microscopy (TEM) images showing roughly peak-aged (10.8 h at 175 °C) nanostructures in the high strength Si-rich (a,b) and Mg-rich (c,d) alloys with 0.5 h prior NA (a,c) and 4 h prior NA (b,d).

Figure 6.
High strength alloy AA hardness evolution after AC and WQ, for both prior NA conditions (labelled accordingly). WQ results are included, and plotted semi-transparently, for comparative purposes. Error bars represent 95% confidence.
Figure 6.
High strength alloy AA hardness evolution after AC and WQ, for both prior NA conditions (labelled accordingly). WQ results are included, and plotted semi-transparently, for comparative purposes. Error bars represent 95% confidence.

Figure 7.
Conductivity evolutions during aging in the high strength Si-rich (a); balanced (b); and Mg-rich (c) alloys after AC from ST. The primary axes correspond to AA (175 °C with 0.5 or 4 h prior NA), and the secondary axes correspond to NA itself (~21 °C). Error bars represent 95% confidence, and the discrepancy is for the same reason as Figure 4.

Figure 8.
AA hardness evolutions of the high strength alloys in the DQ condition, compared to traditional WQ followed by short (0.5 h) NA, labelled accordingly. Error bars represent 95% confidence.
Figure 8.
AA hardness evolutions of the high strength alloys in the DQ condition, compared to traditional WQ followed by short (0.5 h) NA, labelled accordingly. Error bars represent 95% confidence.

Figure 9.
AA conductivity evolutions of the high strength alloys in the DQ condition, compared to traditional WQ followed by short (0.5 h) NA, labelled accordingly. Error bars are not visible at 95% confidence.
Figure 9.
AA conductivity evolutions of the high strength alloys in the DQ condition, compared to traditional WQ followed by short (0.5 h) NA, labelled accordingly. Error bars are not visible at 95% confidence.

Figure 10.
Hardness evolutions during AA in low strength alloys after WQ and variable prior NA, labelled accordingly. Error bars represent 95% confidence.
Figure 10.
Hardness evolutions during AA in low strength alloys after WQ and variable prior NA, labelled accordingly. Error bars represent 95% confidence.

Figure 11.
Conductivity evolutions during aging in the low strength alloys after WQ from ST, labelled accordingly. The primary axes correspond to AA (175 °C with 0.5 or 4 h prior NA), and the secondary axes correspond to NA itself (~21 °C). Error bars represent 95% confidence, and the discrepancy is due to the same reason as Figure 4.

Figure 12.
Low strength alloy AA hardness evolution after AC and WQ, for both prior NA conditions (labelled accordingly). WQ results are included, and plotted semi-transparently, for comparative purposes. Error bars represent 95% confidence.
Figure 12.
Low strength alloy AA hardness evolution after AC and WQ, for both prior NA conditions (labelled accordingly). WQ results are included, and plotted semi-transparently, for comparative purposes. Error bars represent 95% confidence.

Figure 13.
Conductivity evolutions during aging in the low strength alloys after AC from ST, labelled accordingly. The primary axes correspond to AA (with 0.5 or 4 h prior NA), and the secondary axes correspond to NA itself. Error bars represent 95% confidence, and the discrepancy is for the same reason as Figure 4.

Figure 14.
AA hardness evolutions of the low strength alloys in the DQ condition, compared to traditional WQ followed by short (0.5 h) NA, labelled accordingly. Error bars represent 95% confidence.
Figure 14.
AA hardness evolutions of the low strength alloys in the DQ condition, compared to traditional WQ followed by short (0.5 h) NA, labelled accordingly. Error bars represent 95% confidence.

Figure 15.
AA conductivity evolutions of the low strength alloys in the DQ condition, compared to traditional WQ followed by short (0.5 h) NA, labelled accordingly. Error bars are not visible at 95% confidence.
Figure 15.
AA conductivity evolutions of the low strength alloys in the DQ condition, compared to traditional WQ followed by short (0.5 h) NA, labelled accordingly. Error bars are not visible at 95% confidence.

Figure 16.
Comparison of AA times associated with peak hardness and conductivity recovery (of 4 h compared to 0.5 h prior NA conditions) for all of the water quenched, high strength alloys. Note that the peak Hv time does not necessarily indicate a hardness recovery (i.e., Mg-rich alloy). Error bars are not included because AA times were visually estimated based on aging curves.

Figure 17.
Difference in high strength alloy hardness due to prior NA (0.5 h NA–4 h NA) as a function of AA time, for both WQ and AC conditions. Positive values correspond to a ‘negative NA effect’. WQ and AC conditions are plotted on separate time axes, which are normalized to their respective peak AA times to allow for comparison. Error bars are omitted for clarity, but can be judged by the error in the individual measurements seen in Figure 3 and Figure 6.

Figure 18.
Comparison of AA times associated with peak hardness and conductivity recovery (of 4 h compared to 0.5 h prior NA conditions) for all high strength compositions in the AC condition (comparable to Figure 16, in the WQ condition). Note that the peak Hv time does not necessarily indicate a hardness recovery (i.e., Mg-rich alloy). AA times are judged by eye, so error bars are not included.

Figure 19.
Data points corresponding to the nose of simulated (Thermo-Calc/Prisma [56]) time– temperature–transformation (TTT) curves (for the depletion of 10% of equilibrium volume fraction), for various compositions in the Al-(Mg + Si = 1.4) − 0.2Fe − 0.05Mn (wt %) system. Data point labels correspond to Mg/Si (by wt %), and Mg/Si trend arrows are included. Simulated precipitates are separated by composition trend, pure Si precipitate in (a), and β and β’ in (b).

Figure 20.
Driving force for β″ precipitation at 175 °C out of ternary Al-Mg-Si solid solutions as a function of Mg/Si, for Mg + Si = 0.7 and 1.4 wt %; Calculated with Thermo-Calc [56].
Figure 20.
Driving force for β″ precipitation at 175 °C out of ternary Al-Mg-Si solid solutions as a function of Mg/Si, for Mg + Si = 0.7 and 1.4 wt %; Calculated with Thermo-Calc [56].

Figure 21.
Conductivity difference between [DQ] − [WQ + 0.5 h NA] conditions at the point of nearly equivalent under-aged hardness, shown as a function of Mg/Si. Due to the different dependencies of precipitates and clusters on hardness and conductivity, the larger (positive) values indicates a larger proportion of clusters compared to precipitates. Equivalent values were selected by eye, so error bars are omitted.

Figure 22.
Illustration of proposed compositional dependence of NA cluster stability for varying Mg + Si and Mg/Si contents.
Figure 22.
Illustration of proposed compositional dependence of NA cluster stability for varying Mg + Si and Mg/Si contents.


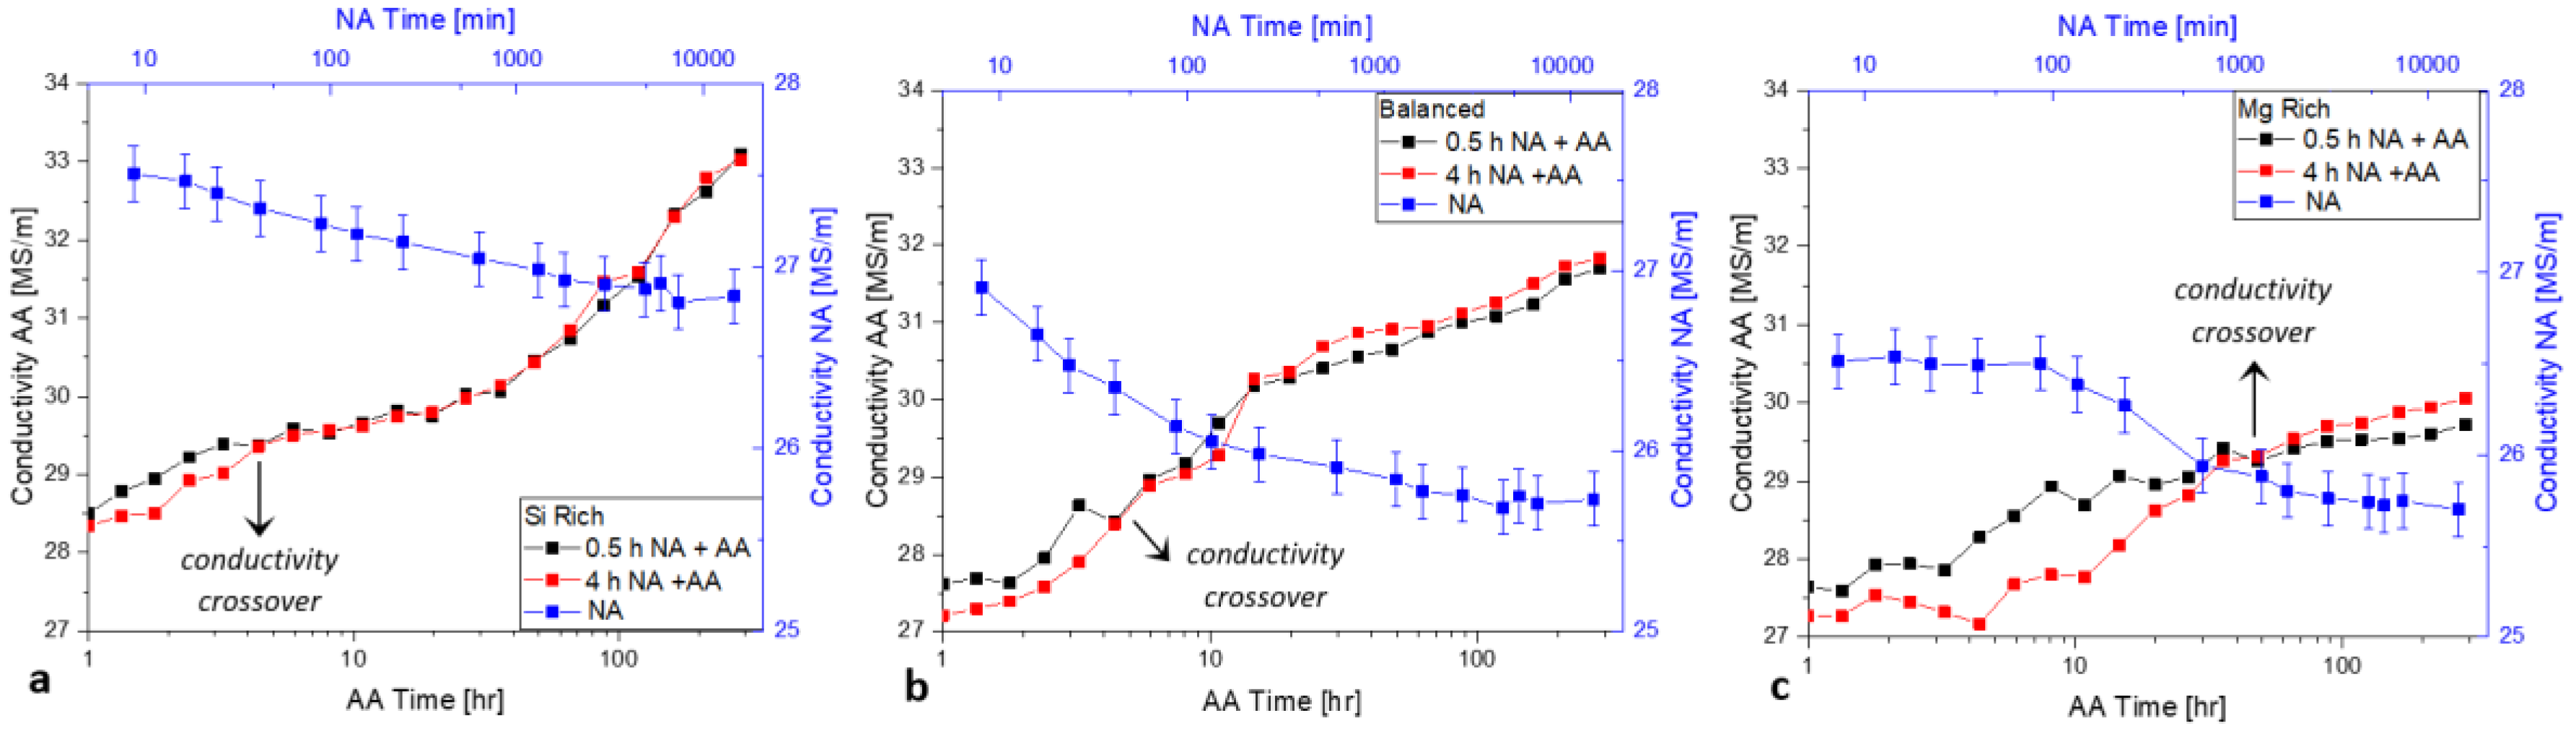
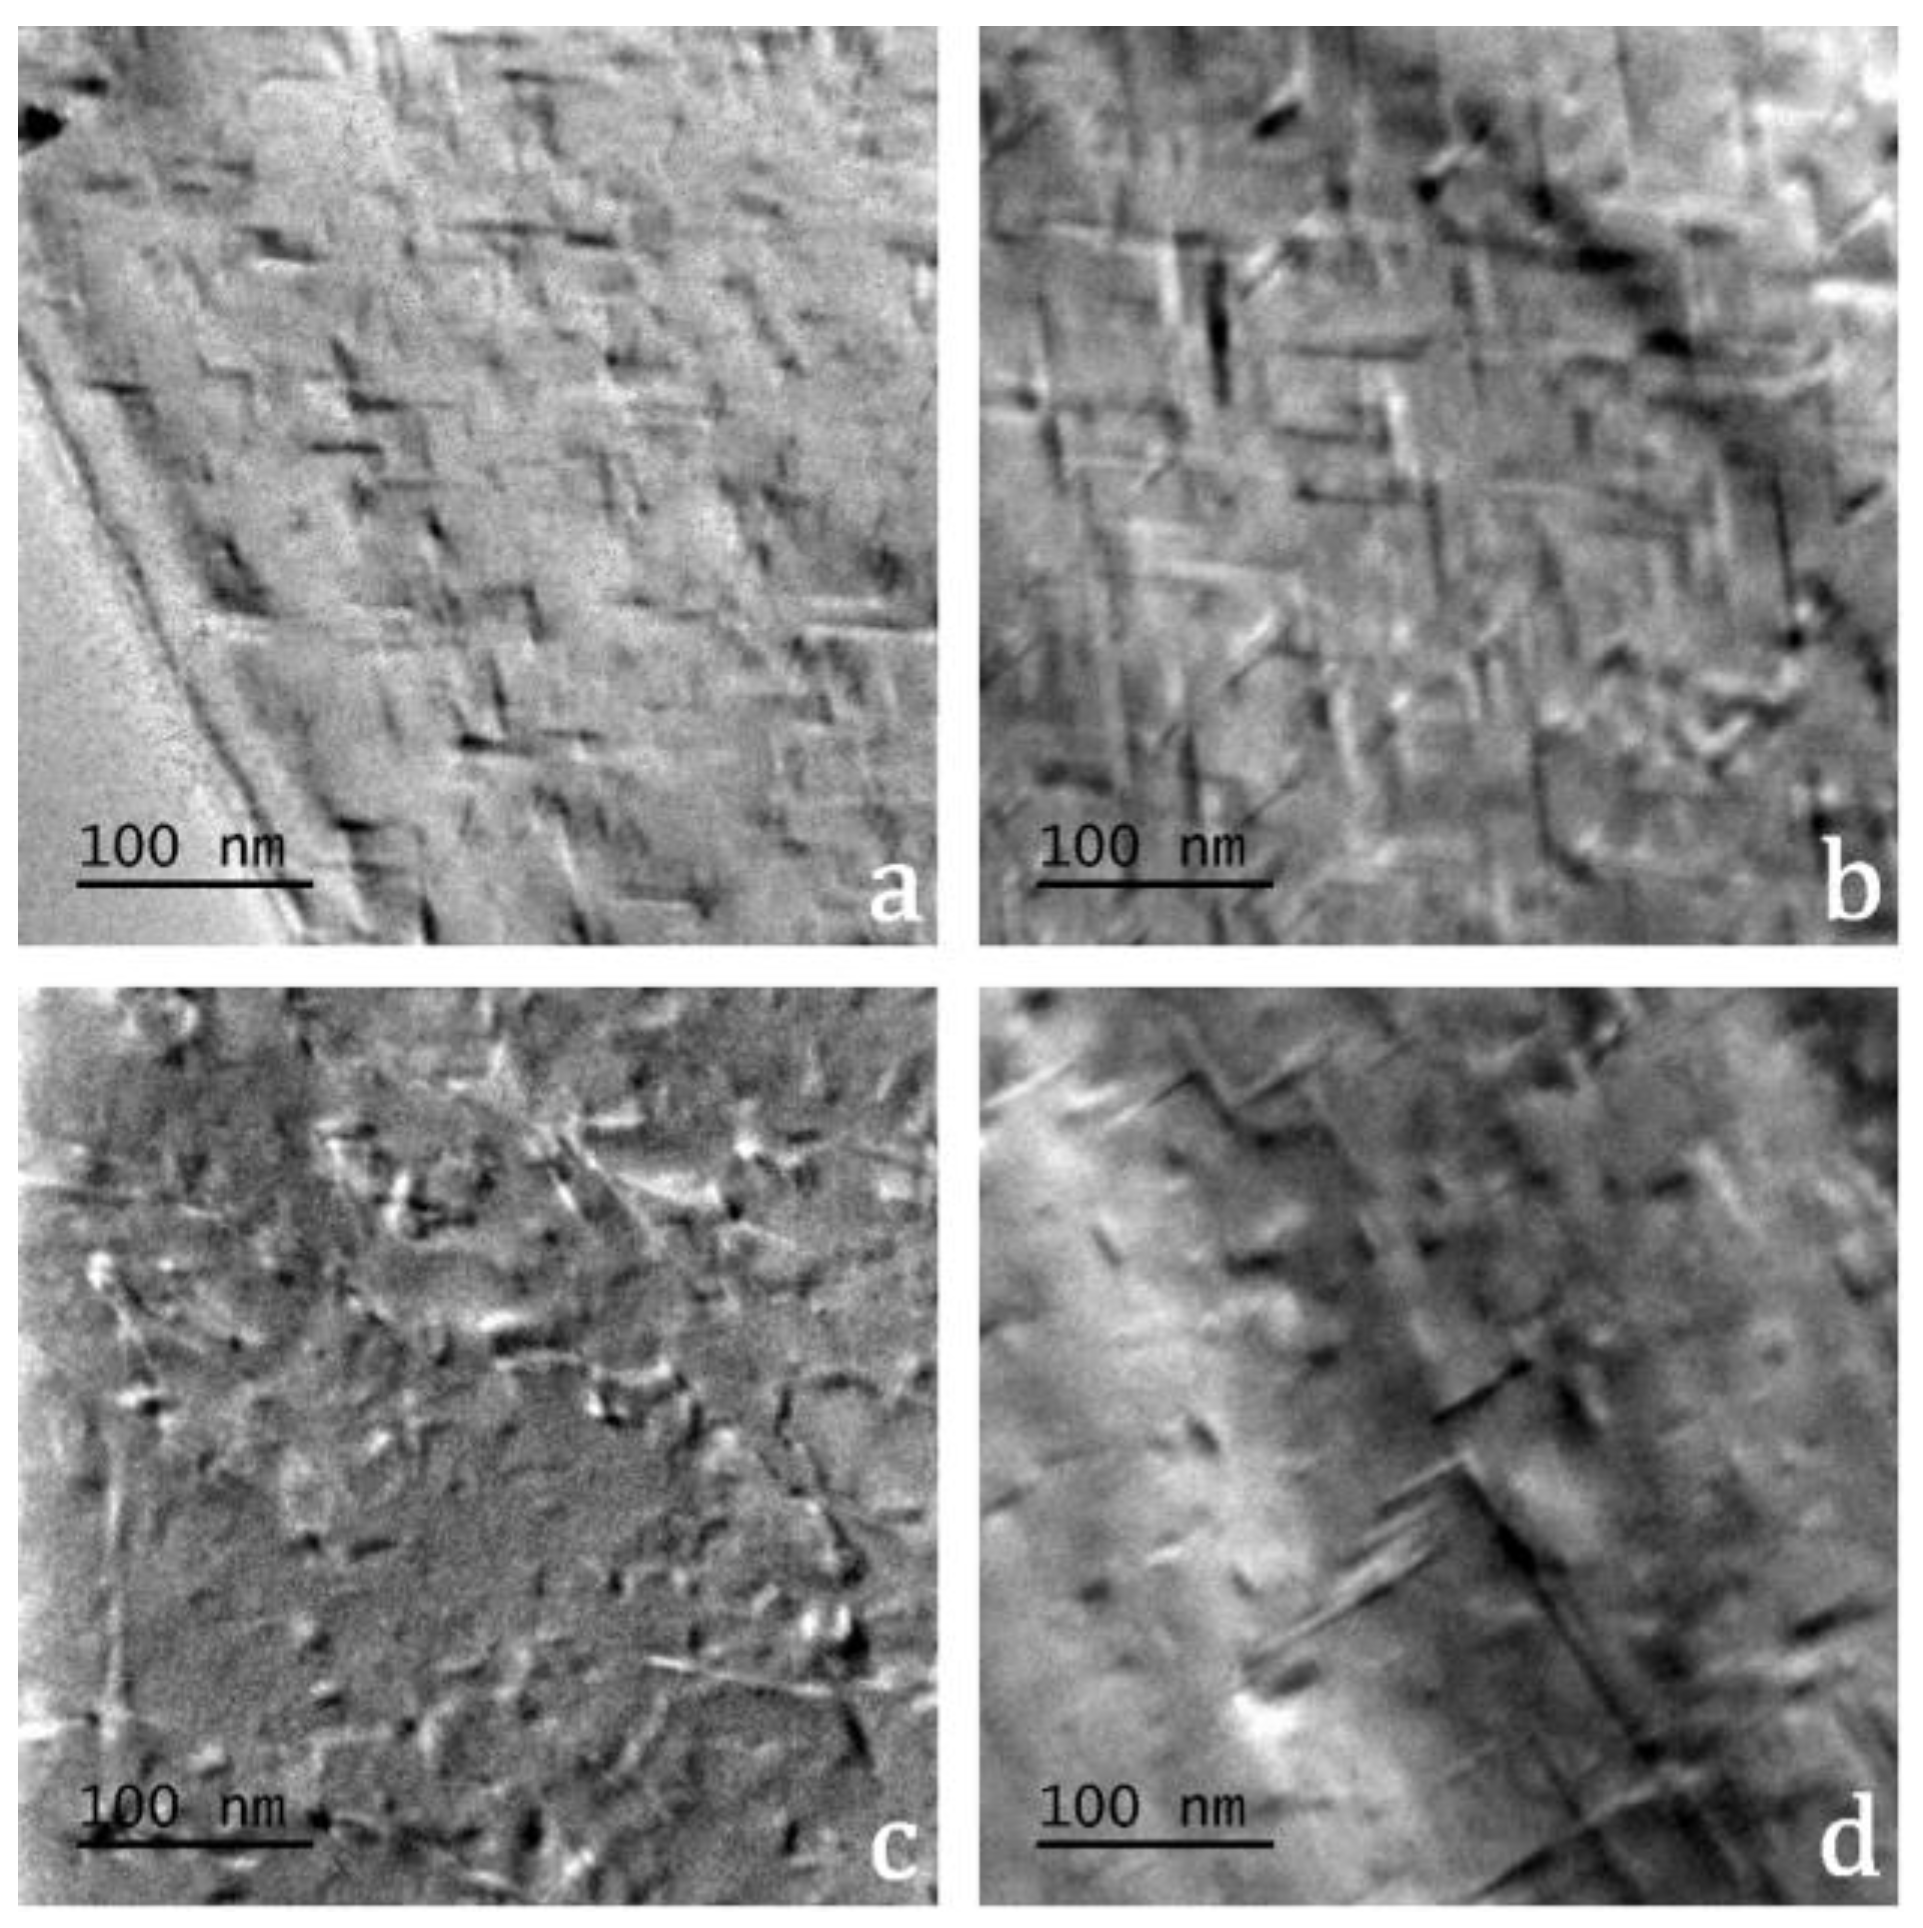
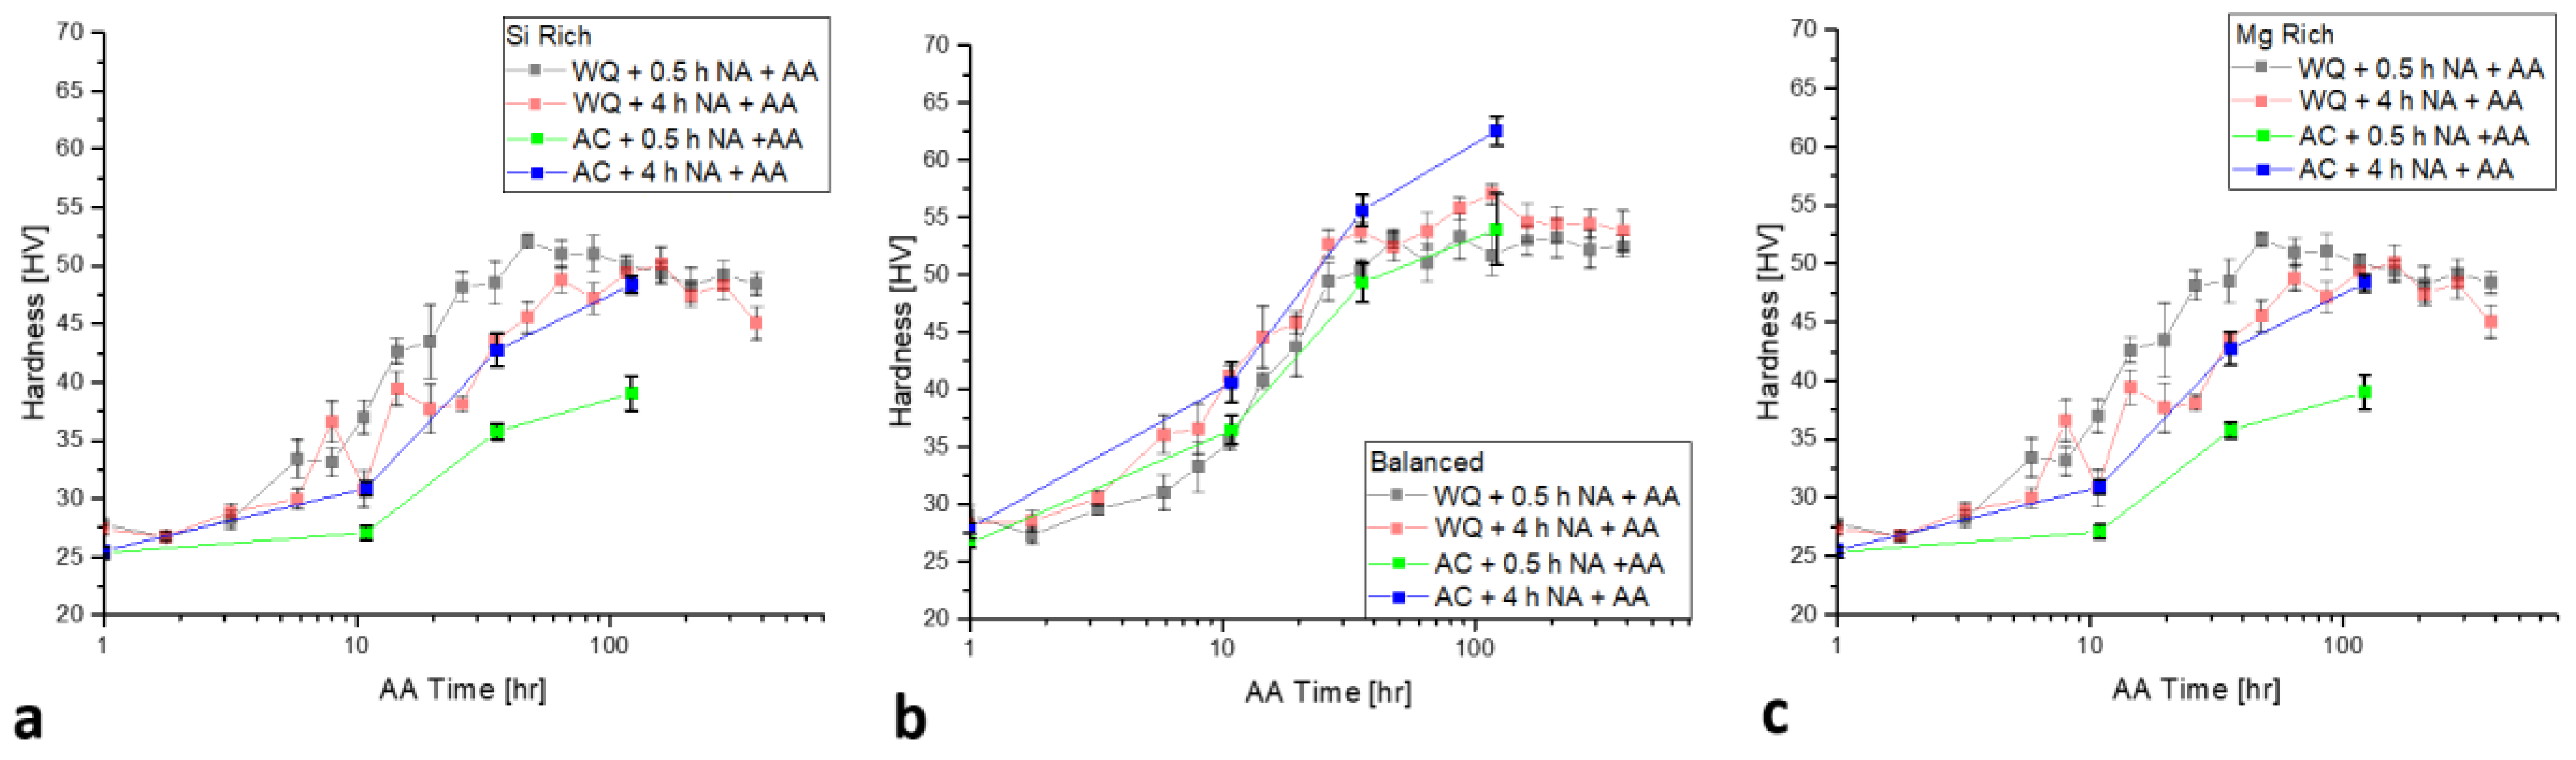
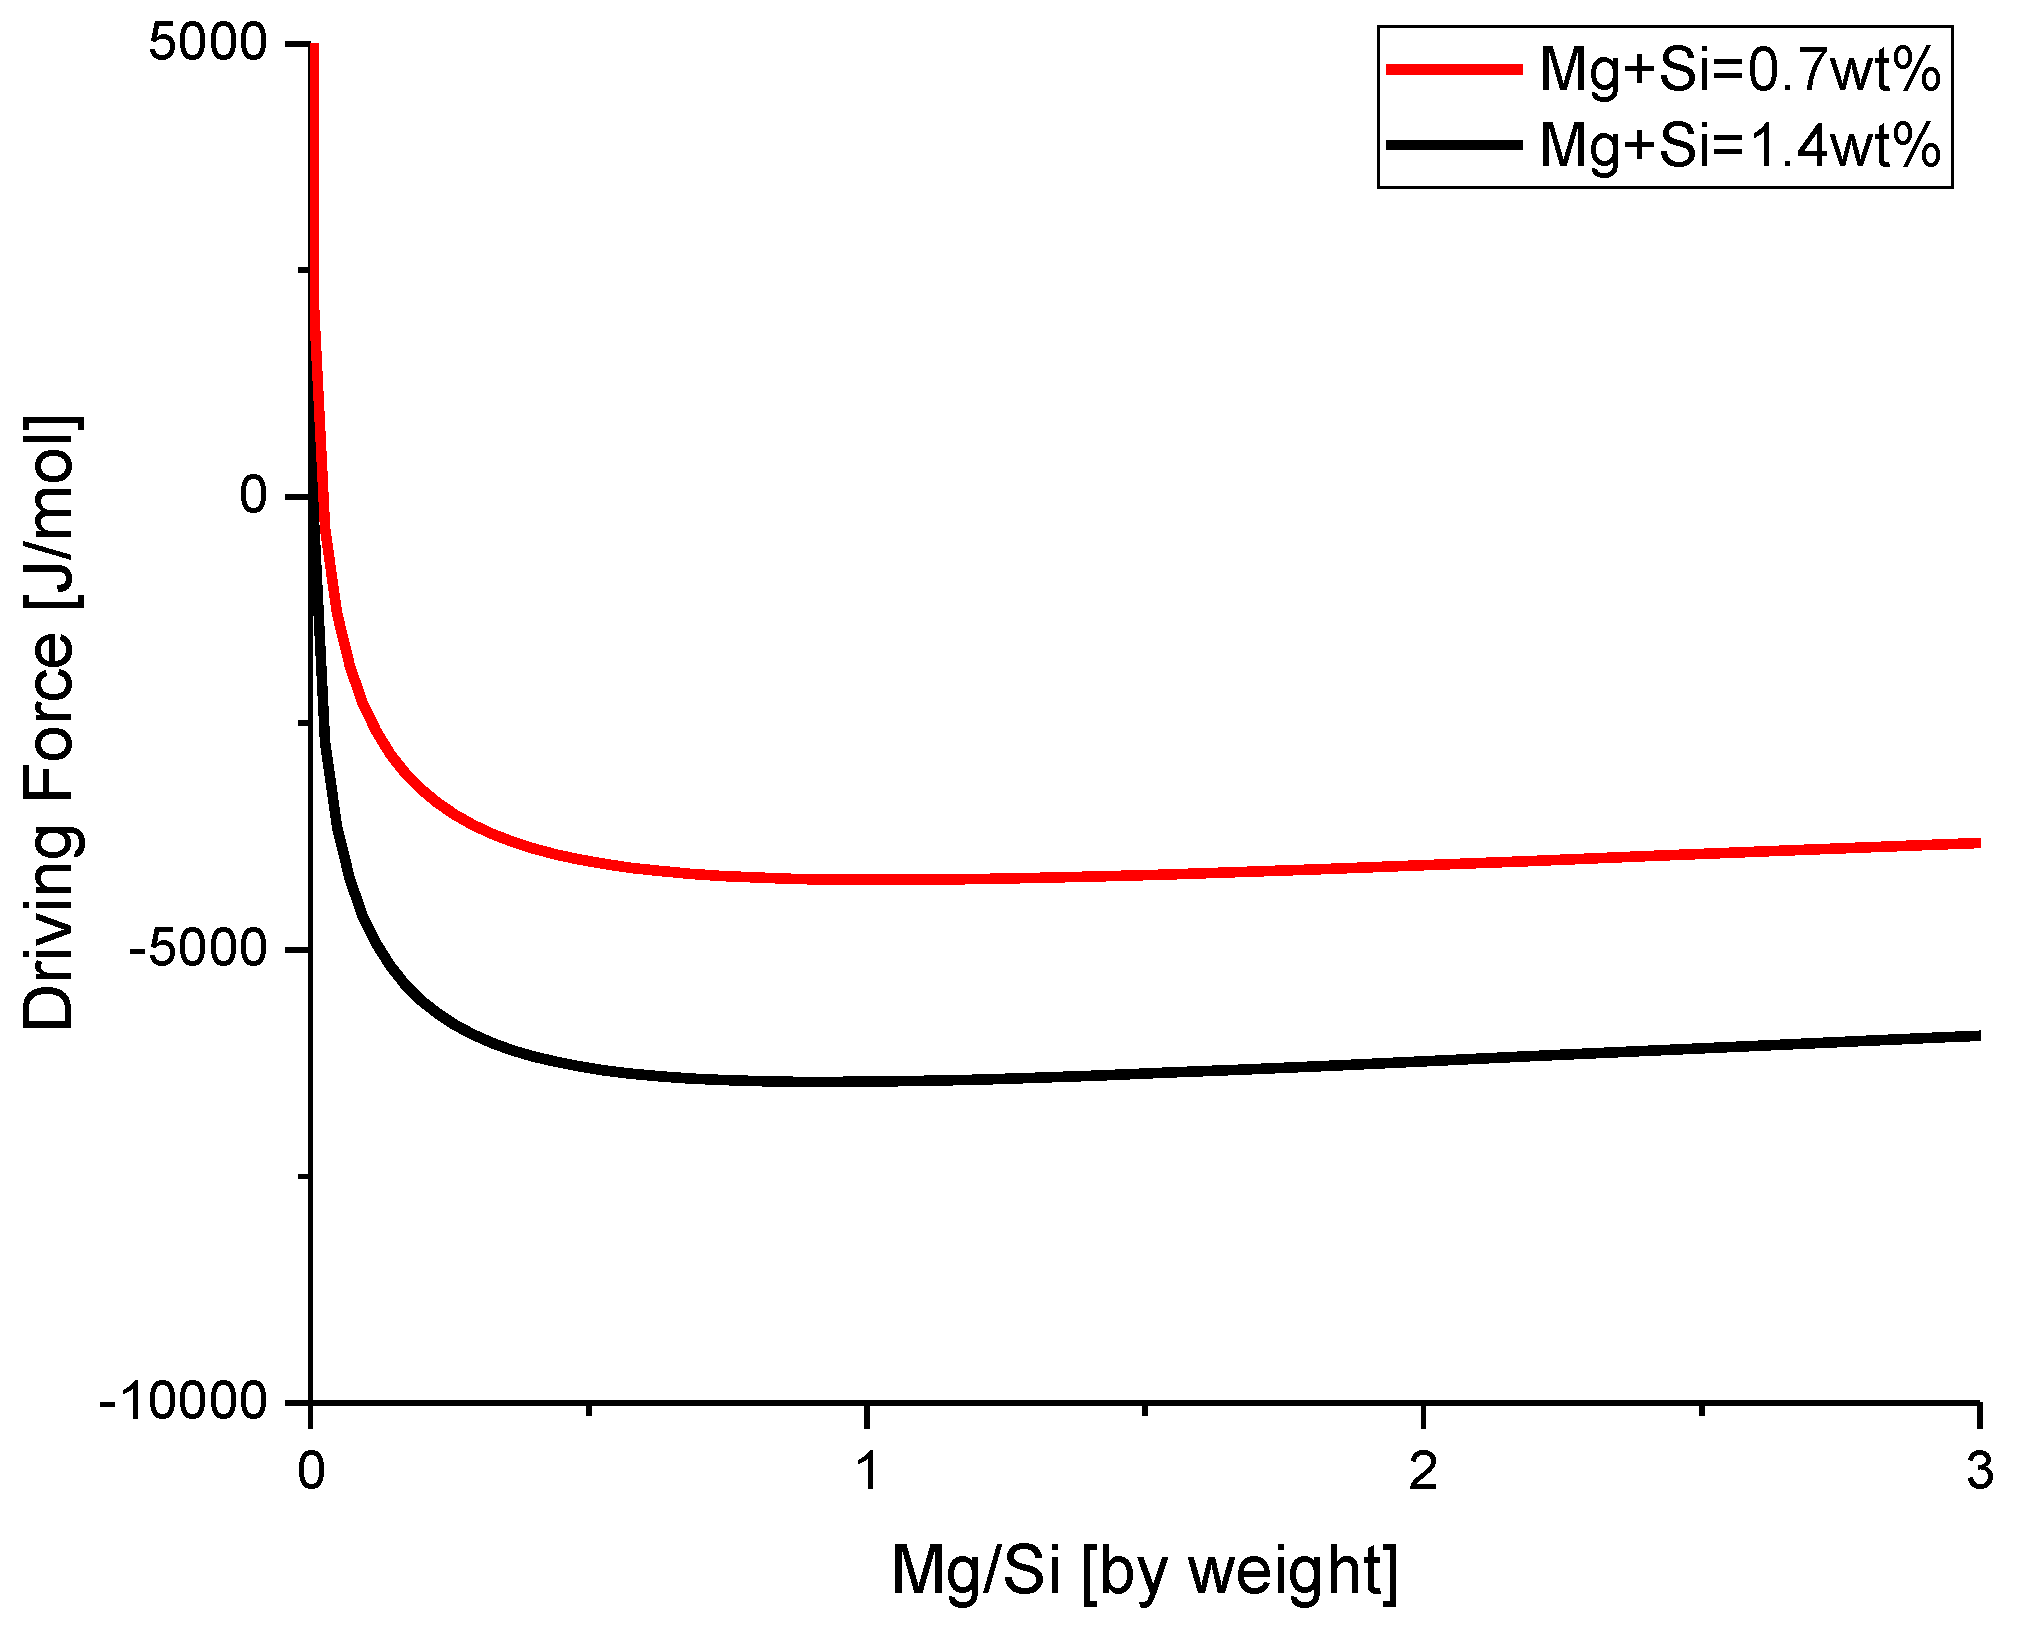
Table 1.
Experimental alloy compositions.
| Alloy Description | Mg | Si | Fe | Mn | Mg/Si | Mg + Si |
|---|---|---|---|---|---|---|
| low strength, Mg-rich | 0.47 | 0.20 | 0.20 | 0.05 | 2.32 | 0.68 |
| high strength, Mg-rich | 1.01 | 0.41 | 0.21 | 0.05 | 2.45 | 1.43 |
| low strength, balanced | 0.31 | 0.39 | 0.21 | 0.05 | 0.79 | 0.70 |
| high strength, balanced | 0.57 | 0.84 | 0.28 | 0.07 | 0.67 | 1.41 |
| low strength, Si-rich | 0.15 | 0.58 | 0.19 | 0.05 | 0.26 | 0.72 |
| high strength, Si-rich | 0.30 | 1.18 | 0.23 | 0.05 | 0.25 | 1.47 |
| All data in wt %, tested during casting with an Optical Emission Spectrometer | ||||||
Table 2.
General structural evolution during aging in Al-Mg-Si alloys, and the resulting impact on hardness and conductivity.
Table 2.
General structural evolution during aging in Al-Mg-Si alloys, and the resulting impact on hardness and conductivity.
| Thermal Treatment | Microstructural Mechanism | Impact on Hardness | Impact on Conductivity |
|---|---|---|---|
| natural aging | solute/vacancy clustering | ↑ | ↓ |
| artificial aging | potential cluster dissolution | ↓ | ↑ |
| strengthening precipitation | ↑ | ↑ |
© 2018 by the authors. Licensee MDPI, Basel, Switzerland. This article is an open access article distributed under the terms and conditions of the Creative Commons Attribution (CC BY) license (http://creativecommons.org/licenses/by/4.0/).
Share and Cite
MDPI and ACS Style
Poznak, A.; Thole, V.; Sanders, P. The Natural Aging Effect on Hardenability in Al-Mg-Si: A Complex Interaction between Composition and Heat Treatment Parameters. Metals 2018, 8, 309. https://doi.org/10.3390/met8050309
AMA Style
Poznak A, Thole V, Sanders P. The Natural Aging Effect on Hardenability in Al-Mg-Si: A Complex Interaction between Composition and Heat Treatment Parameters. Metals. 2018; 8(5):309. https://doi.org/10.3390/met8050309
Chicago/Turabian StylePoznak, Alex, Violet Thole, and Paul Sanders. 2018. "The Natural Aging Effect on Hardenability in Al-Mg-Si: A Complex Interaction between Composition and Heat Treatment Parameters" Metals 8, no. 5: 309. https://doi.org/10.3390/met8050309
Note that from the first issue of 2016, this journal uses article numbers instead of page numbers. See further details here.