Article

Study of Localized Corrosion of AISI 430 and AISI 304 Batches Having Different Roughness

by
Tiziano Bellezze
1,*,
Annamaria Viceré
1,
Giampaolo Giuliani
1,
Emanuele Sorrentino
2 and
Gabriella Roventi
1
1
Department of Materials, Environmental Sciences and Urban Planning, Polytechnic University of Marche, Via Brecce Bianche, 60131 Ancona, Italy
2
Electrolux Italia S.p.A., Via Bologna 298, 47100 Forlì, Italy
*
Author to whom correspondence should be addressed.
Metals 2018, 8(4), 244; https://doi.org/10.3390/met8040244
Submission received: 25 February 2018 / Revised: 30 March 2018 / Accepted: 4 April 2018 / Published: 6 April 2018

Abstract

:
In this work, the localized corrosion resistance of different batches of AISI 430 and AISI 304 stainless steels, having Scotch-Brite surface finishing, was investigated as a function of their roughness (in terms of Rz) and chemical composition. The study was performed by recording anodic cyclic potentiodynamic polarization curves at room temperature in two NaCl solutions (0.35 and 1.75 wt %). From the anodic curves, corrosion potential (Ecorr), protection potential (Eprot), and pitting potential (Epit) were obtained. In general, the results indicate that AISI 304 has better localized corrosion resistance than AISI 430, both in terms of pitting initiation and repassivation ability, independently from roughness. In particular, an increase of roughness determined a decrease of Epit only in the case of AISI 304 in the less concentrated NaCl solution. This result was related to the higher variability of the corresponding Rz values compared to those of AISI 430. Finally, from the analysis of the loop hysteresis of the anodic curves, in relation to Epit−Eprot values, durability information on the tested stainless steels were obtained: AISI 304 shows higher corrosion performances with respect to AISI 430, thanks to the higher chromium content of the former compared to the latter.

1. Introduction

Stainless steels (SSs) are largely used in a wide range of applications thanks to their good aesthetic aspect, good formability and, in particular, elevated corrosion resistance in different aggressive environments. The main factor that determines such high corrosion performances is the chromium content in these alloys: it is sufficient a minimum amount of 10.5 wt % to form a thin oxide protective film (1–3 nm thick) [1,2,3] with self-healing properties. Increasing the chromium content up to 30 wt % [1], the stability of the passive film greatly increases, although, in the European Community, the tendency should be to save this element because it is considered a critical raw material [4].
Dealing with the numerous architectural and domestic applications of SSs, their surface finishing becomes a factor of primary importance from an aesthetic and a commercial point of view. At the same time, it is necessary to consider that surface finishing significantly influences the localized corrosion resistance of these metallic materials in chloride environments, as reported by the present authors [5,6] and by many other authors [7,8,9,10,11,12,13,14,15,16,17,18,19,20]. In particular, there is a certain agreement among them on the relationship between pitting potential and surface roughness, expressed in terms of Ra and Rz parameters, when the surface of the samples is treated by different technological processes or when samples are submitted to a grinding operation producing the same surface finishing but different roughness [5,6,13,14,15,16]. In details, Rz is the sum of the height of the highest peak and the absolute depth of the deepest valley of the roughness profile, whereas Ra is the average of the ordinates of this profile (UNI EN ISO 4287:2002 standard). Other authors have found a poor correlation between localized corrosion resistance and Ra [8,9,10,11,12] because this parameter does not characterize the features and topography of the surface, which are determined by technical manufacturing processes: presence of microdefects, microsites, where crevice can take place, inclusions, etc.
In general, it is well-known that, on increasing the surface roughness, the pitting potential of SSs in chlorides containing solutions decreases [17,18]. The openness of the sites on the metal surface governs the transformation of the metastable pits to the stable ones and thereby governs the localized corrosion resistance. Significant depressions (more occluded sites) on the metal surface limit the diffusion of the corrosion products, H+ and Cl ions, which contribute to sustain and to stabilize the pit growth. Therefore, less current is necessary to achieve this condition, which means low pitting potentials. On the contrary, for more open sites, a higher current is required to form the necessary diffusion barrier for the pit growth, which is achieved at higher pitting potentials [9].
Some authors expressed the openness of the surface grooves on SSs in terms of the aspect ratio w/d, where w and d are their width and depth, respectively [19]. A high aspect ratio corresponds to a smooth surface where the pit nucleation is more difficult, producing in this way an increase in the localized corrosion resistance, as experimentally confirmed by other authors in terms of increasing potentials for the initiation of metastable pits [20]. The influence of these geometrical parameters on determining the localized corrosion resistance of SSs were studied more in details by other authors [21], who developed a model to compare the numerical results with the experimental data obtained from potentiodynamic tests, conducted on AISI 304 and AISI 316 SSs having different roughness.
In this work, the localized corrosion resistance of different batches of AISI 430 and AISI 304 SSs with Scotch-Bright (SB) surface finishing, destined to produce appliances with an attractive aesthetical aspect, was studied by means of anodic cyclic potendiodynamic polarization (CPP) curves. The relationship between localized corrosion resistance and the Rz roughness parameter was analyzed because, in particular, the tested SSs had same surface finishing, obtained by the same working process, which in principle guarantees similar surface features. As stated by other authors [9], such an investigation is a valid approach in a given corrosive media, if numerous anodic CCP curves are recorded, as in this work has been done. The measurements were carried out at room temperature in two differently concentrated NaCl solutions. Through the parameters obtained from the analysis of the anodic curves, the influence of the roughness and the chemical composition on the corrosion performances of both SSs was investigated, supplying also information on their durability in service applications.

2. Materials and Methods

Several sheets of AISI 430 and AISI 304 SSs, having an initial BA and 2B surface finishing, respectively, were submitted to an industrial brushing operation towards the rolling direction, in order to produce different batches of both materials with the same final SB finishing, but different roughness. Usually, after this operation a polyethylene adhesive film is industrially applied on the SB finishing side of the SS sheets.
The different roughness of these batches was measured in terms of Rz parameter on the basis of UNI EN ISO 4287:2002 and UNI EN ISO 4288:2000 standards by means of a Mitutoyo SJ-210 equipment (Mitutoyo Italiana srl, Milano, Italy). The measurements were done three times on different areas of the sheets of each batch, in the orthogonal direction with respect to the almost linear scratches determined by the brushing process and for an evaluation length of 4 mm. Table 1 reports the average values of Rz. This parameter was taken into account in this study in place of Ra because it is considered more related to the presence of more or less occluded sites, in correspondence of high peaks and deep valleys in the roughness profile.
The average chemical compositions of the studied SSs are reported in Table 2; the analysis was performed by means of a Spark Analyser SPECTROLAB Mod. LAVFA A18A (SPECTRO Analytical Instruments GmbH, Kleve, Germany).
From the sheets of each batch, several samples 10 × 10 cm2 in size (thickness 0.7 mm) were obtained and used to characterize their localized corrosion resistance by means of anodic CPP curves at room temperature. Before each test, the polyethylene adhesive film was removed from the sample surfaces, which were gently degreased by using a paper soaked in n-hexane.
The electrochemical cell was obtained by gluing with an epoxy resin a plexiglass tube on the SB surface of the samples, which were used as working electrodes having an exposed area of 38.5 cm2. A three-electrode configuration cell was obtained using a saturated calomel electrode (SCE, 0.241 V vs. SHE) and a spiral of activated titanium as the reference electrode and counter electrode, respectively.
The anodic CPP tests were performed by means of an AMEL 5000 (AMEL srl, Milano, Italy) electrochemical workstation in two different solutions at different chloride concentrations (pH = 6.5): NaCl 0.35 wt % and 1.75 wt %. Before each test, 250 mL of the solution was poured into the plexiglass tube after being aerated by a magnetic stirrer for at least 30 min. The anodic CPP curves were all recorded following the approach used previously [5,22,23,24,25]: the corrosion potential (Ecorr) was monitored up to the achievement of stationary value (usually, within 30 min). Subsequently, the potential was increased at a scan rate of 0.166 mV/s toward the anodic direction, starting from the value Ecorr−0.030 V until a current density threshold of 0.01 mA/cm2 was achieved. The scan was then reversed and continued until the obtainment of the repassivation condition, where the protection or repassivation potential (Eprot) is determined [25]. In those cases where the samples did not repassivate, the test was stopped in correspondence to the initial Ecorr potential, and, in the data elaboration, Eprot was set equal to this last value. Some samples showed a close-loop hysteresis (Eprot > Ecorr) of the anodic curve, whereas other ones showed an open-loop hysteresis (Eprot set equal to Ecorr). During the forward scan, the pitting potential (Epit) was determined in correspondence of a significant increase in current density and it was considered valid if the pits were visually observed on the sample surface. On the contrary, if the increase of the current density was determined by the crevice corrosion in correspondence of the internal borders of the plexiglass cell, the test was discarded.
For each examined SS batch, at least three samples were tested in both solutions. The average values of the potential parameters obtained from the anodic CPP curves (Ecorr, Eprot, Epit) were calculated and related to Rz.
Scanning electron microscopy (SEM) and optical microscopy (OM) observations were done in order to characterize the surface features of the different SS samples and for characterizing the pits formed at the end of CPP tests. Energy Dispersive X-ray analysis (EDX) was also performed to investigate the chemical composition in the areas outside and inside the pits. SEM and EDX observations were performed by means of Zeiss Supra 40 microscope (Carl Zeiss Microscopy GmbH, Jena, Germany) coupled with a Bruker Quantax serie 5000L N2-free XFlash (Bruker Nano GmbH, Berlin, Germany).

3. Results and Discussion

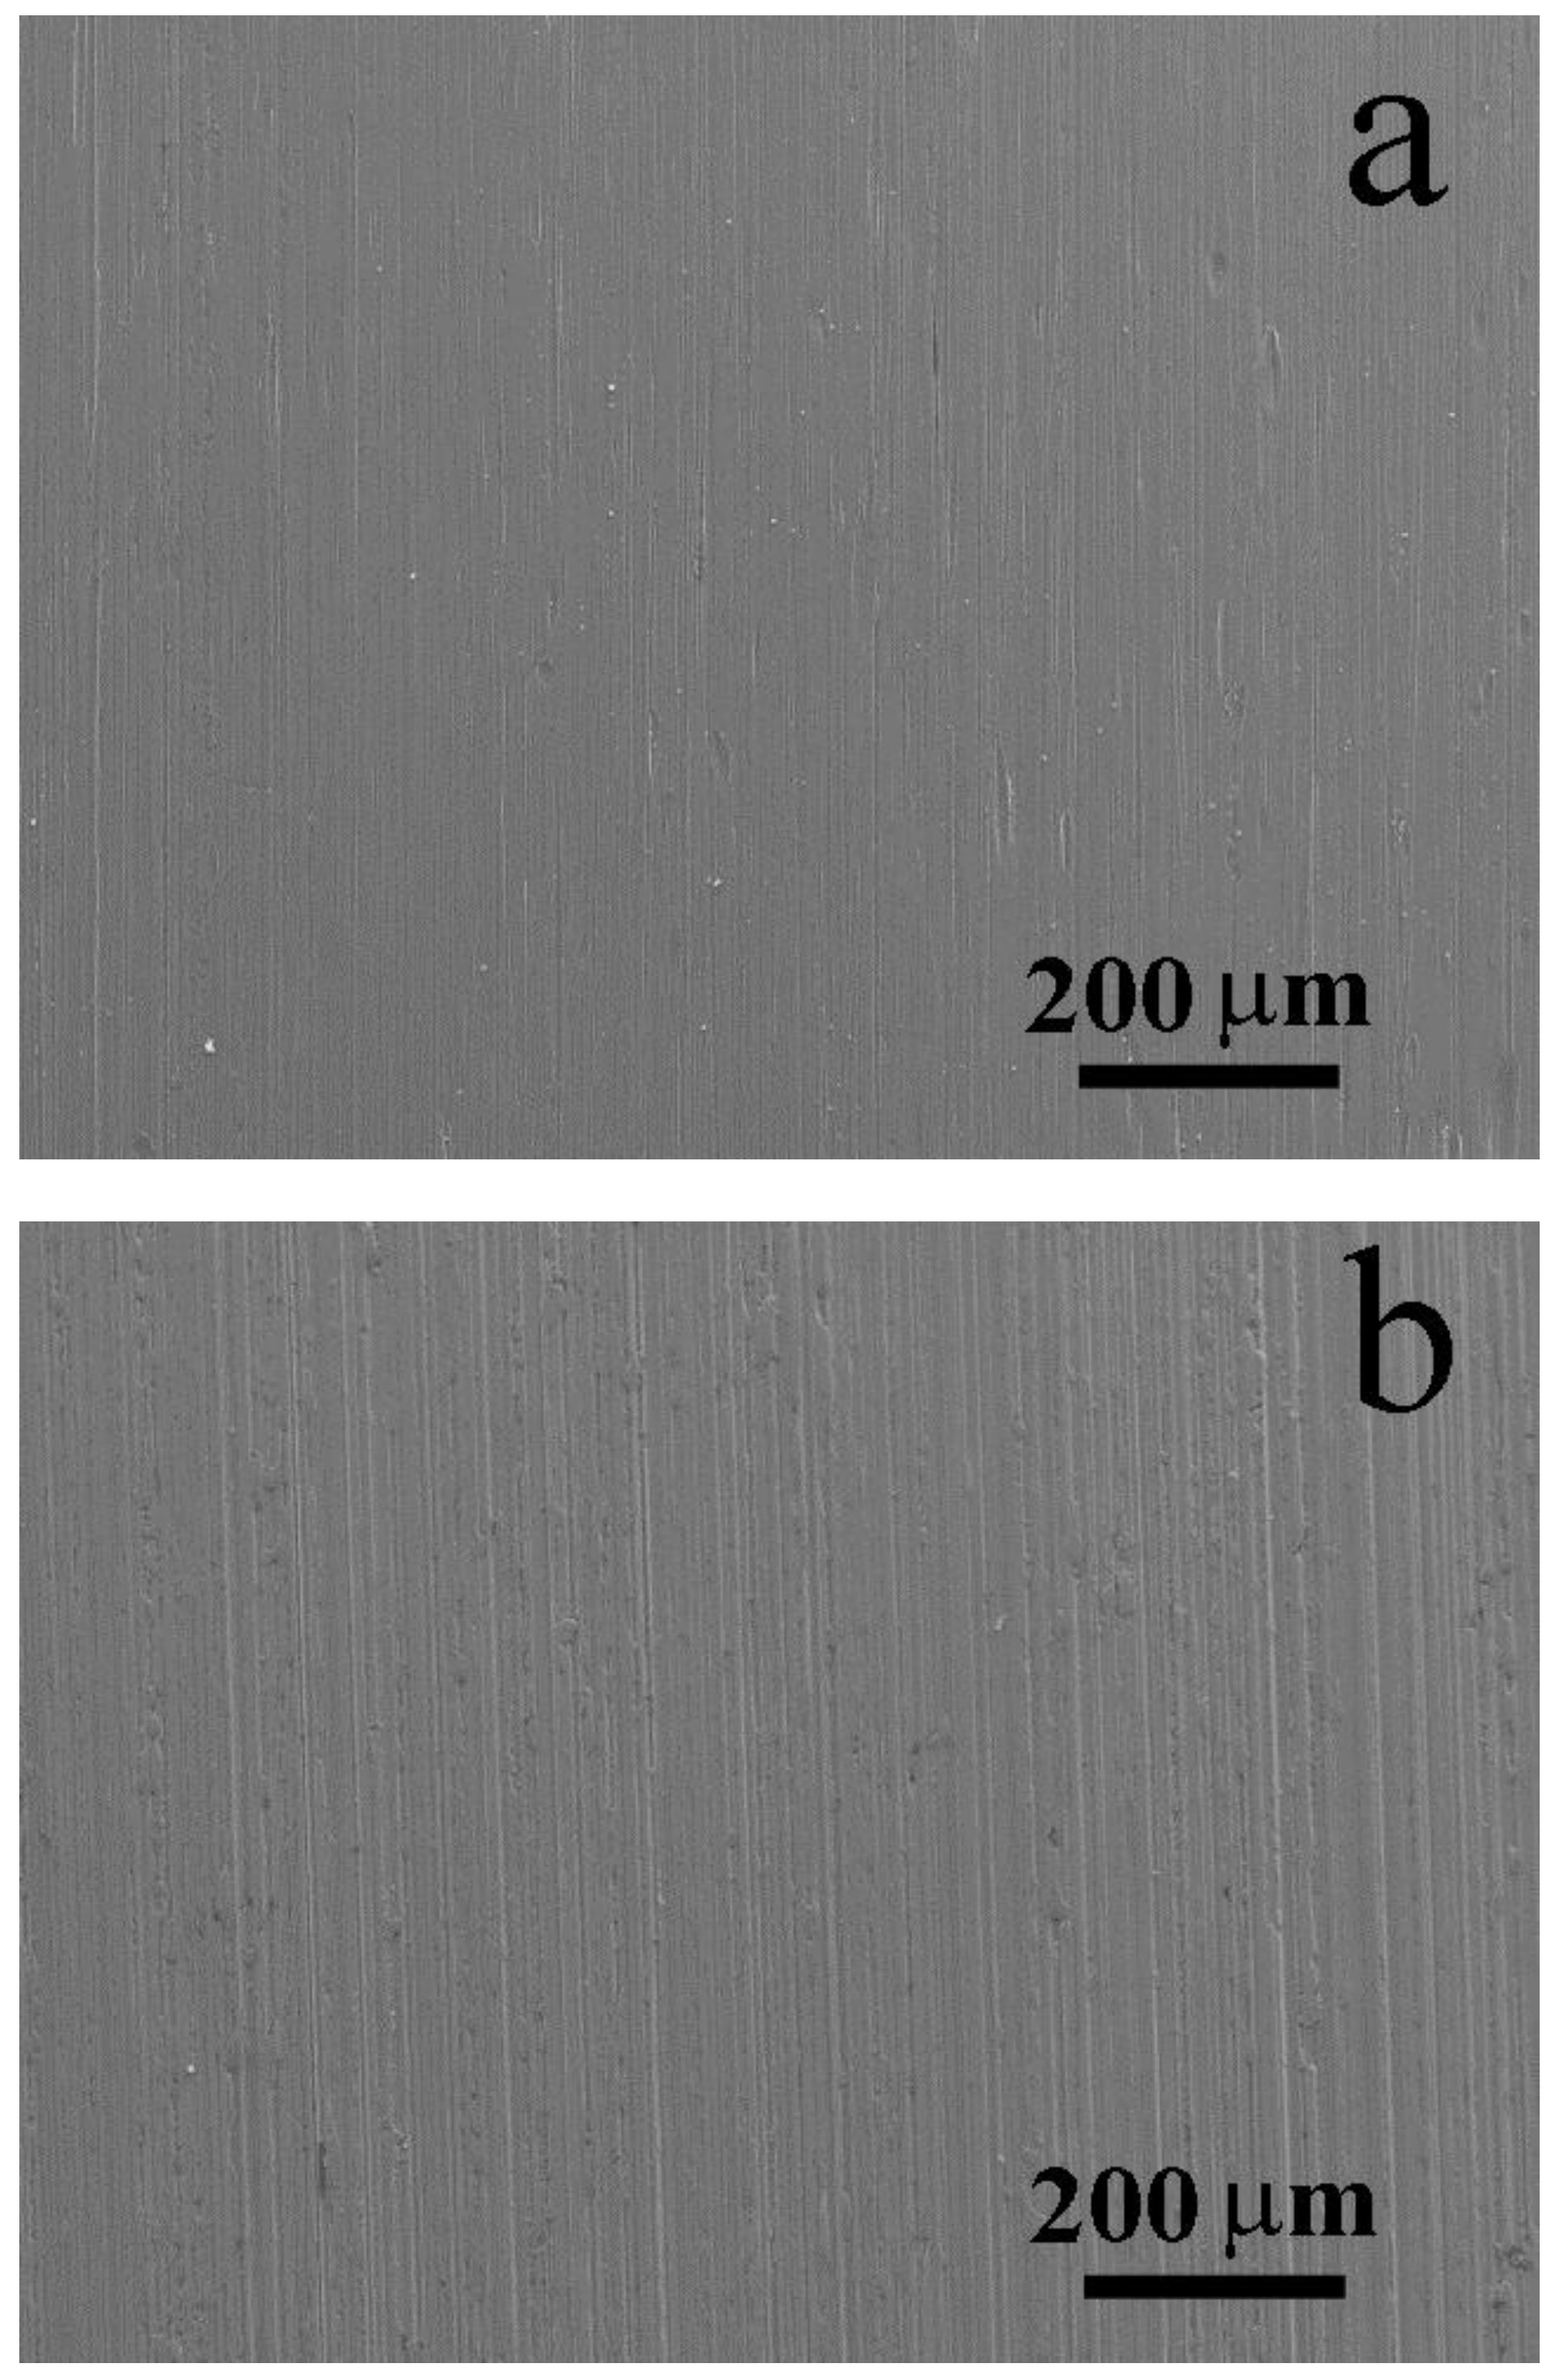
Figure 1 shows the SEM images of a sample surface for each of the two tested SSs, having the highest Rz value within the same material type (Series 3 and Series 6, respectively, Table 1). The higher roughness of AISI 304 sample compared to AISI 430 sample is clear. Both SS surfaces show similar features, without any particular defects to highlight.
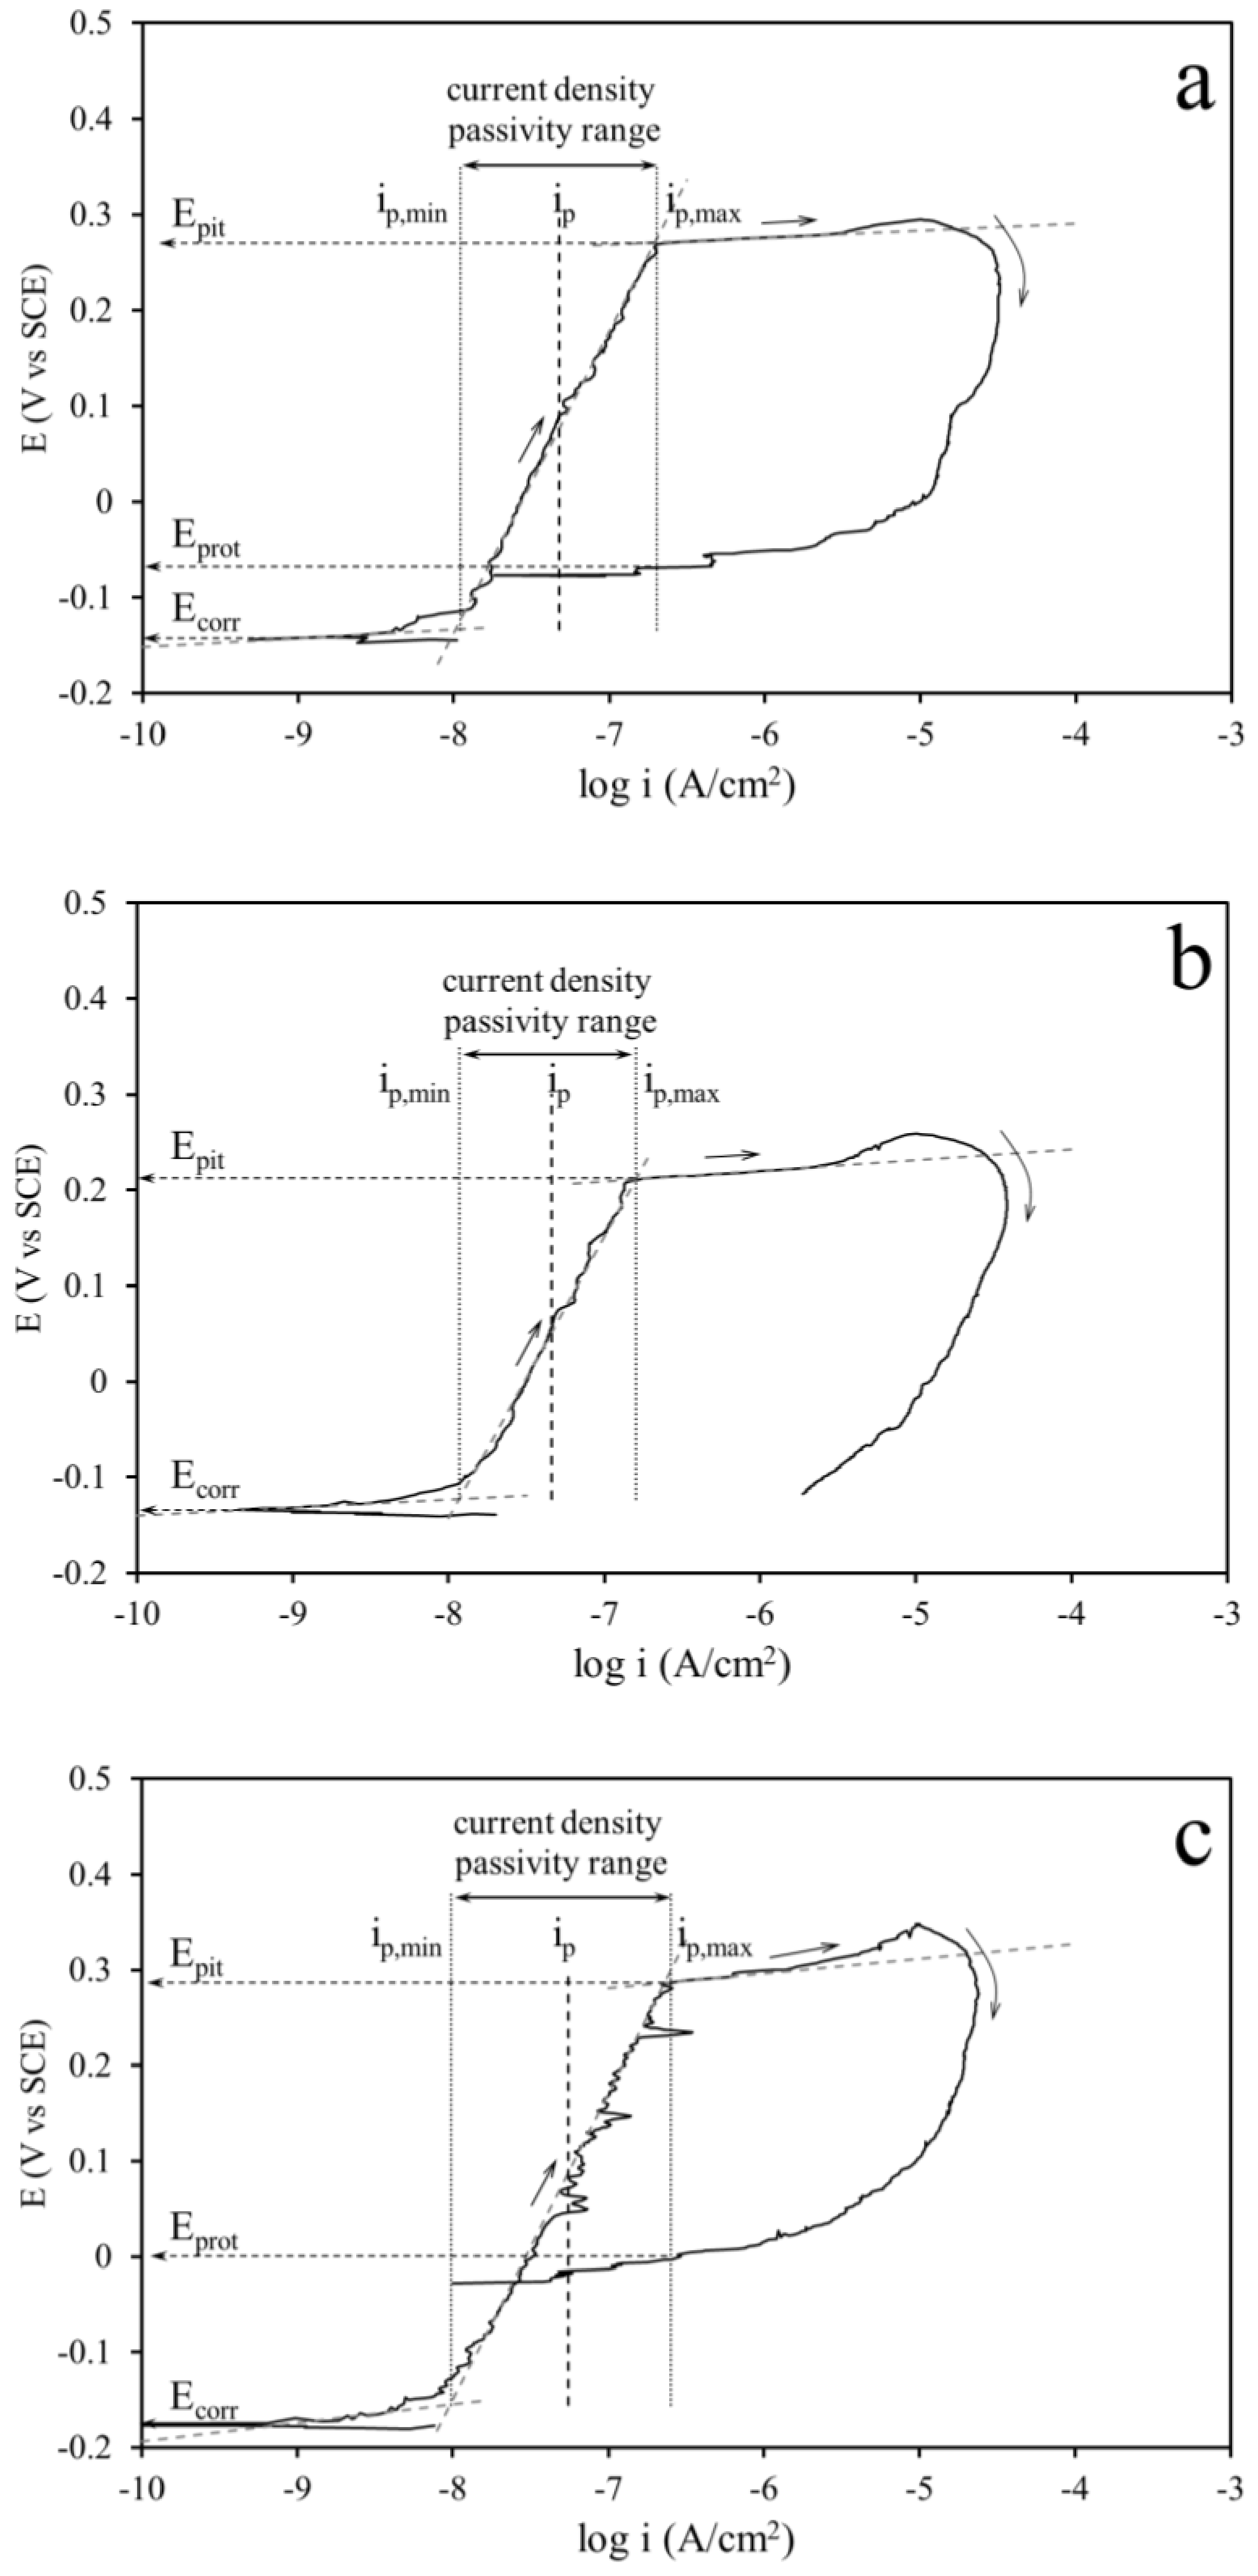
Figure 2 shows three examples of anodic CPP curves. A method for obtaining the characteristic Ecorr, Eprot, and Epit values has been reported in previous works [5,22,23], but recently [25], an analytical method has been specifically developed to obtain these parameters from anodic CPP curves.
The analytical method allows to trace the dotted grey oblique lines shown in Figure 2 along the anodic curve, one for each significant slope variation, and thus to identify the fundamental inflection points. In particular, the first one at low potentials, close to Ecorr, represents the starting point of the alloy passivity range, which ends to the second one at high potentials: this is the intersection point between the upward oblique straight line and the straight line in correspondence to a stable current density increase, which defines the pitting potential Epit. By means of this geometrical construction, it is also possible to define a unique average passivation current density ip within the current density passivity range (ip,min-ip,max) [25] between the two described inflection points, as Figure 2 shows. Finally, Eprot is determined in correspondence to the new achievement of passivity conditions, where the current density return into the passivity range (Figure 2a,c; closed-loop hysteresis). If this condition is not met (Figure 2b; open-loop hysteresis), Eprot has been set equal to the initial Ecorr value, which is easily obtained in all cases in the point where the curve passes from the cathodic branch to the anodic one.
From these characteristic potential values, it is possible to define both the perfect passivity region (ppr) between Ecorr and Eprot, where the pitting cannot initiate and the existing pits cannot propagate and the imperfect passivity region (ipr) between Epit and Eprot, where pits cannot initiate but the existing ones can propagate [22,23,24,25]. In the case of mechanical damage of the passivity film, localized corrosion does not propagate in service applications if the SS shows a closed-loop hysteresis (Figure 2a,c), with a more extended ppr as possible. On the contrary, for a SS that gives an anodic CPP curve similar to that of the AISI 430 sample Series 3, shown in Figure 2b, the risk of localized corrosion propagation is very high.
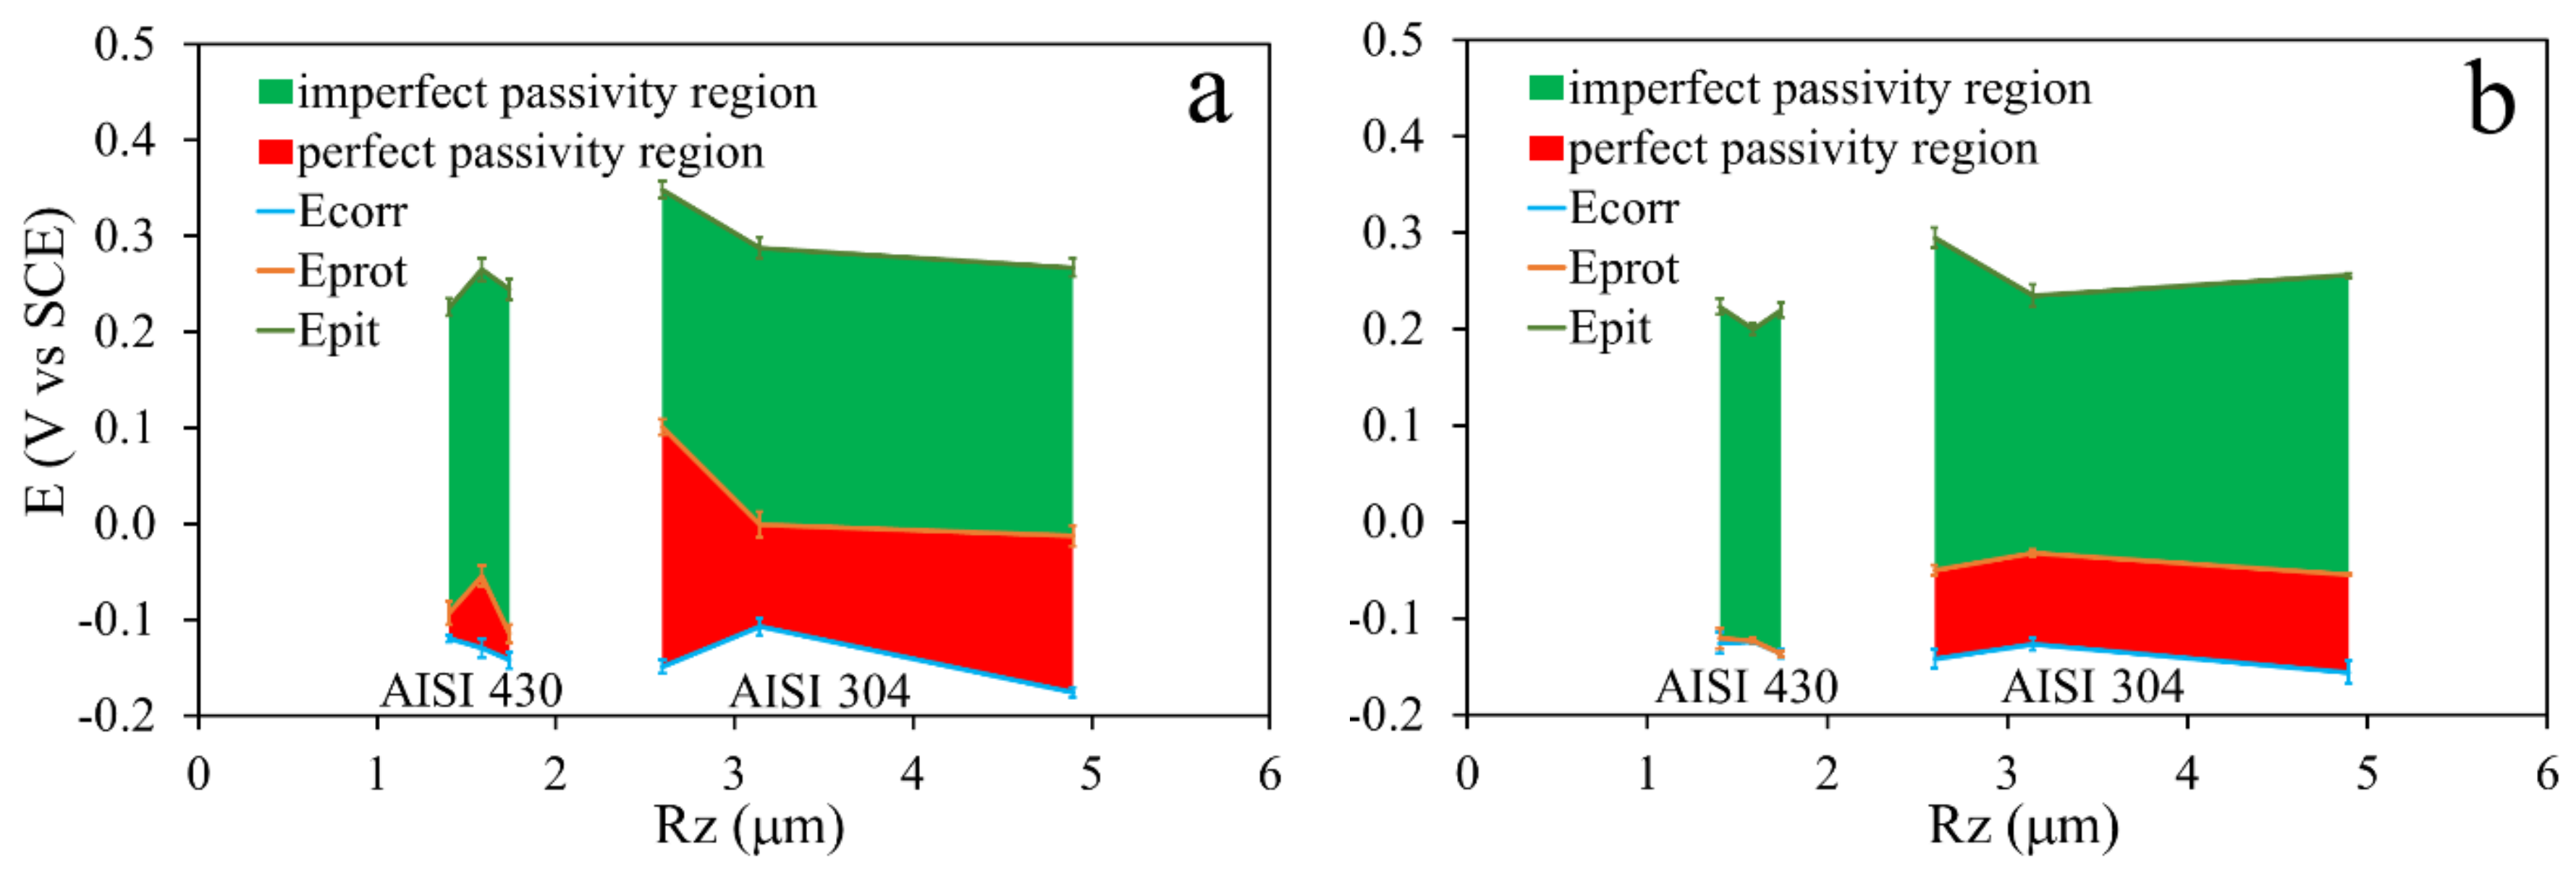
From the analysis of the AISI 430 and AISI 304 anodic curves in both NaCl solutions, the results shown in Figure 3 have been obtained, where the Ecorr, Eprot, and Epit trends, the corresponding error bars and the extensions of ppr and ipr are reported as a function of Rz (Table 1). The limited extension of the error bars shows the good reproducibility of the results obtained from the anodic CPP curves.
Considering Epit, AISI 304 shows higher values compared to those of AISI 430 in both solutions, although the former has in general a significantly higher roughness with respect to the latter (Table 1, Figure 3). Only the Epit of AISI 304 Series with the highest Rz gets closer to Epit of AISI 430 Series (Figure 3), showing a not negligible effect of the surface roughness. However, since on increasing the surface roughness, Epit of SSs in chloride solutions is normally expected to decrease [17,18], from these results, it can be concluded that the chemical composition of the tested SSs (Table 2) is a more important factor than the roughness on determining their localized corrosion resistance. Cr content of the examined SSs, sensibly higher in AISI 304 than in AISI 430 (Table 2), is the important factor that determines the higher values of Epit for the former compared to latter [10,26]. Ni, present only in AISI 304 SS, has been considered of scarce importance on influencing these potential values in the case of SS alloys [26].
The effect of roughness increase on the decrease of Epit is visible for AISI 304, in particular in NaCl 0.35 wt % (Figure 3a). This result can be related to the fact that AISI 304 has the highest values of Rz and the differences of this parameter among the Series are significantly higher than those among the AISI 430 Series (Table 1, Figure 3). These results do not agree with the results of other authors [12,15], which reported a poor correlation between corrosion resistance and the surface roughness parameters, when they move towards relatively high values. However, it is necessary to consider that these literature results are relative to only one SS, with different roughness, whereas in the present work two different SSs with two different Rz ranges are compared.
On increasing the NaCl concentration, the aggressiveness of the solution is probably so high that it is does not allow the observation of a clear Epit decrease as a function of Rz for AISI 304 (Figure 3b).
In the case of AISI 430 Series, Epit does not show a particular relationship with Rz in both NaCl solutions. This result can be related to the very low differences of Rz values among the AISI 430 Series (Table 1).
As expected, the effect of chloride concentration increase is to decrease Epit passing from NaCl 0.35 wt % (Figure 3a) to NaCl 1.75 wt % (Figure 3b): Epit ranges from 0.267–0.348 to 0.235–0.294 V for AISI 304 and ranges from 0.226–0.265 to 0.199–0.223 V for AISI 430, respectively.
A particular effect of the roughness increase on Eprot seems to be present only on AISI 304 samples in NaCl 0.35 wt % (Figure 3a) because this potential decreases and follows the same trend of Epit vs. Rz. However, as reported by other authors [8,9,10,15,16,17,18,19,20,21], while the surface roughness influences Epit values, it does not necessarily have the same influence on the repassivation characteristics (Eprot) of a given SS [9].
From the plots of Figure 3, it is visible the higher extension of ppr of AISI 304 Series with respect to that of AISI 430 Series in both solutions. At the same time, for both SSs, the ppr extension decreases on increasing NaCl concentration and it is practically absent for AISI 430 Series in NaCl 1.75 wt %.
These results indicate that the repassivation ability of both examined SSs decreases with the increase in the concentration of chlorides. Furthermore, the absence of ppr in the case of AISI 430 in the more concentrated NaCl solution means that the main part of the anodic CPP curves for this SS showed the same characteristics of that of Figure 2b, with an open-loop hysteresis. In such cases, Eprot was set equal to Ecorr to make possible data elaboration, but it cannot correspond to a real protection potential, which can be found only at more cathodic potentials [27]. Even for AISI 430 Series tested in the less concentrated NaCl solution, some anodic curves showed an open-loop hysteresis (Figure 2b), while other ones showed a closed-loop hysteresis (Figure 2a). However, a predominant number of anodic curves of this last type was obtained and therefore Figure 3a shows the presence of a visible ppr in NaCl 0.35 wt %, although of limited extension.
In order to quantify the repassivation ability of both SSs, in Table 3 the percentage of the experimental curves which showed a closed-loop hysteresis (Eprot > Ecorr) are reported as a function of NaCl concentration, independently from Rz. The results of Table 3 show the poor ability of AISI 430 to repassivate, which becomes lower with the increase of NaCl concentration, confirming the information given by Figure 3. Therefore, it can be considered that when the passivity film on AISI 430 is damaged, there is a very low possibility for this material to return passive and, at the same time, there is a high probability to show corrosion phenomena, independently from roughness.
In order to make an in depth study on the relationship between localized corrosion resistance of SSs and roughness parameters, some authors tried to correlate the Epit−Ecorr differences (as a measure of the “extension of passivity range”, in terms of potentials) with Ra and Rz, obtaining controversial results [8,10,14]. In the present work, a different approach has been used following literature findings [28], from which Epit−Eprot differences were considered for measuring the extension of the hysteresis loops of the anodic CPP curves. These differences were analyzed to make predictions on the durability of SSs in halide media: the higher the difference Epit−Eprot, the lower is the durability of SSs [28]. In the present work, a low durability of a given SS in service conditions, in contact with chloride environments, means that the macroscopic visualization of localized corrosion on its surface takes shorter times.
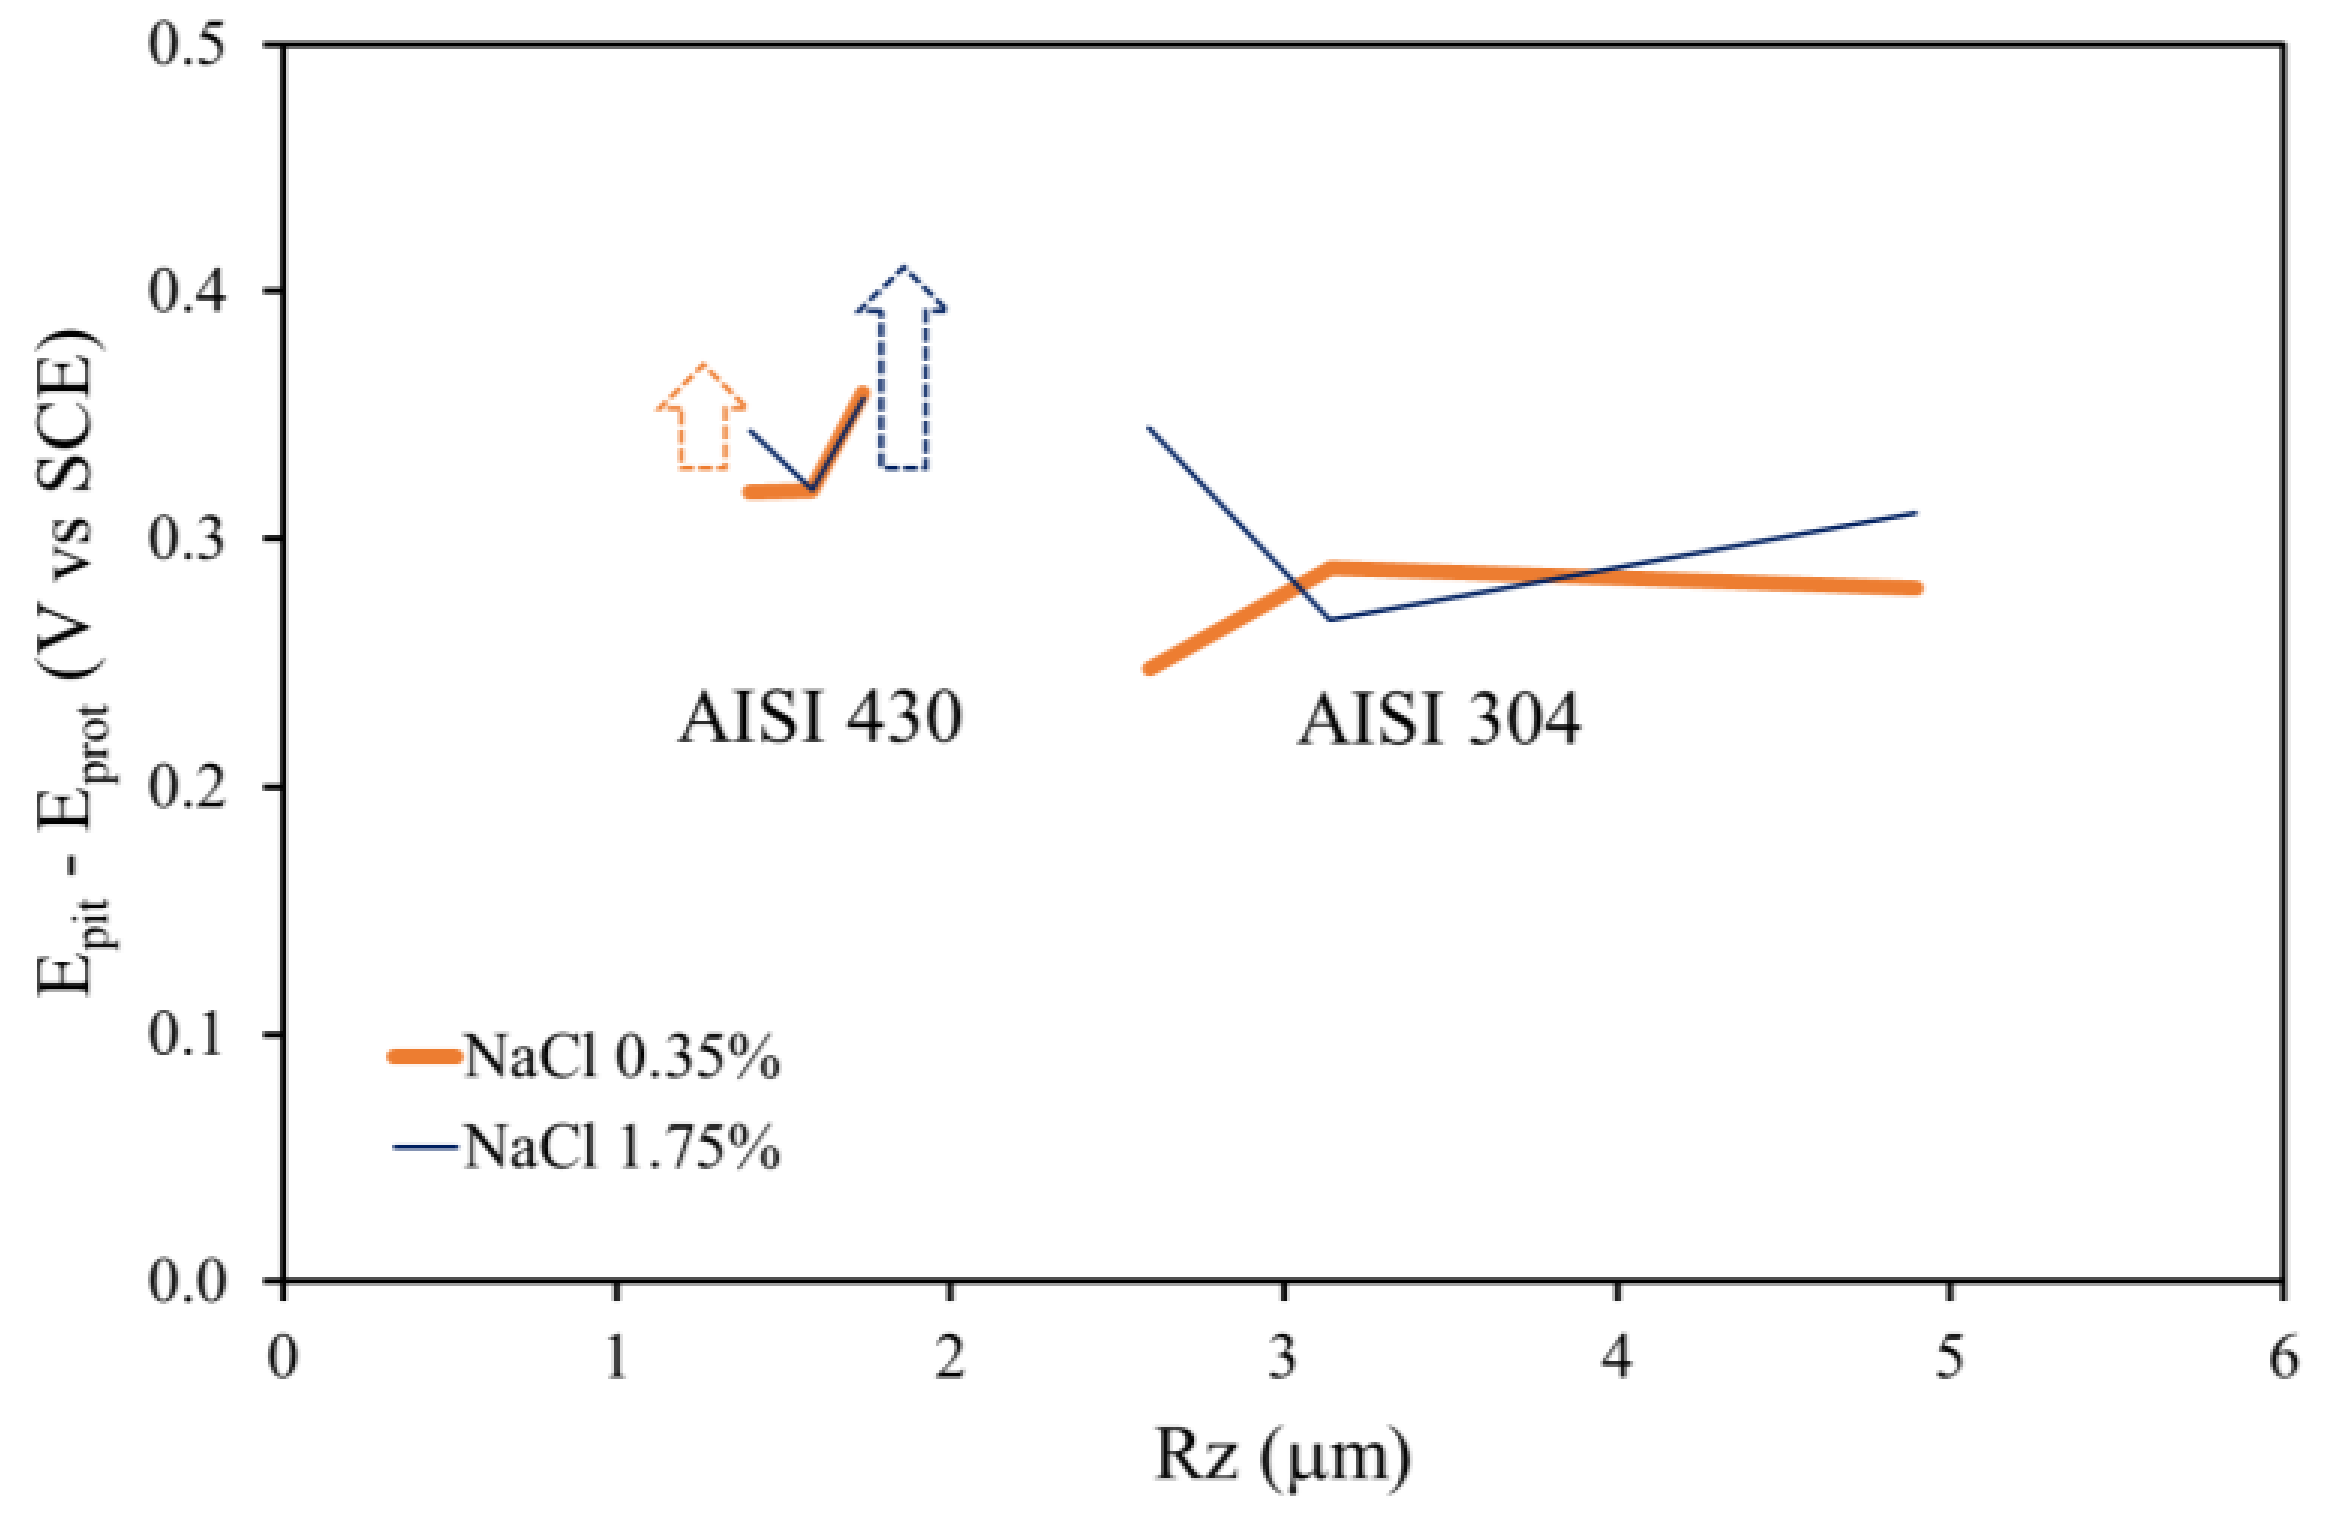
Figure 4 shows the Epit−Eprot values calculated from the potentials obtained in this work. In NaCl 0.35 wt %, an almost monotonic relationship between Epit−Eprot and Rz can be noticed. On increasing Rz, for AISI 430, Epit−Eprot remains stationary and subsequently increases, whereas for AISI 304, before Epit−Eprot increases and after remains almost stationary. Essentially, the durability either remains unchanged or decreases for both SSs, within the corresponding Rz ranges. In principle, in order to increase the SS durability, it can be suggested to not excessively increase the roughness of the material during the brushing operation, necessary to obtain the SB surface finishing.
The comparison of Epit−Eprot values between AISI 430 Series and AISI 304 Series in the less concentrated NaCl solution, independently from Rz, indicates a minor durability of the former with respect to the latter. In addition, for the particular case of AISI 430, it is necessary to consider that 62.5% of the anodic curves showed a closed-loop hysteresis (Table 3), while, for the remaining ones (37.5% with open-loop hysteresis), Eprot can be found to more cathodic values than Ecorr. The consequence is a general rise of Epit−Eprot vs. Rz curve for AISI 430, as qualitatively indicated by the dotted orange arrow in Figure 4. From these observations, it is clear that in NaCl 0.35 wt %, the durability of AISI 304 is considerably higher than that of AISI 430; this can be attributed to the significantly higher content of Cr of the former compared to the latter (Table 2).
In NaCl 1.75 wt % solution, the relationship between Epit−Eprot and Rz is less regular than that previously considered in the less concentrated solution. In particular, for AISI 304, at the lowest values of Rz, Epit−Eprot seems comparable to the values obtained for AISI 430 Series (dark blue curves in Figure 4). However, considering that for AISI 430, only 28.6% of the anodic CPP curves showed a closed-loop hysteresis (Table 3), the Eprot values for the majority of these curves (71.4% with open-loop hysteresis) can be found to lower values than Ecorr. The consequence is a more pronounced rise of the Epit−Eprot vs. Rz curve in Figure 4, as qualitatively indicated by the dark blue dotted arrow compared to the orange one. Therefore, even in concentrated NaCl solution, the durability of AISI 304 is considerably higher than that of AISI 430 and it can be concluded that the differences of composition between the two tested SSs is again the more important factor affecting their durability, favouring AISI 304 due to its high content of Cr (Table 2).
Finally, on considering only AISI 304 data in Figure 4, for which only closed-loop hystereses were found (Table 3), a significantly high difference Epit−Eprot can be observed only at the lowest value of Rz, where the durability of this SS in NaCl 1.75 wt % should be lower than that expected in NaCl 0.35 wt %. On increasing Rz, this difference becomes less important.
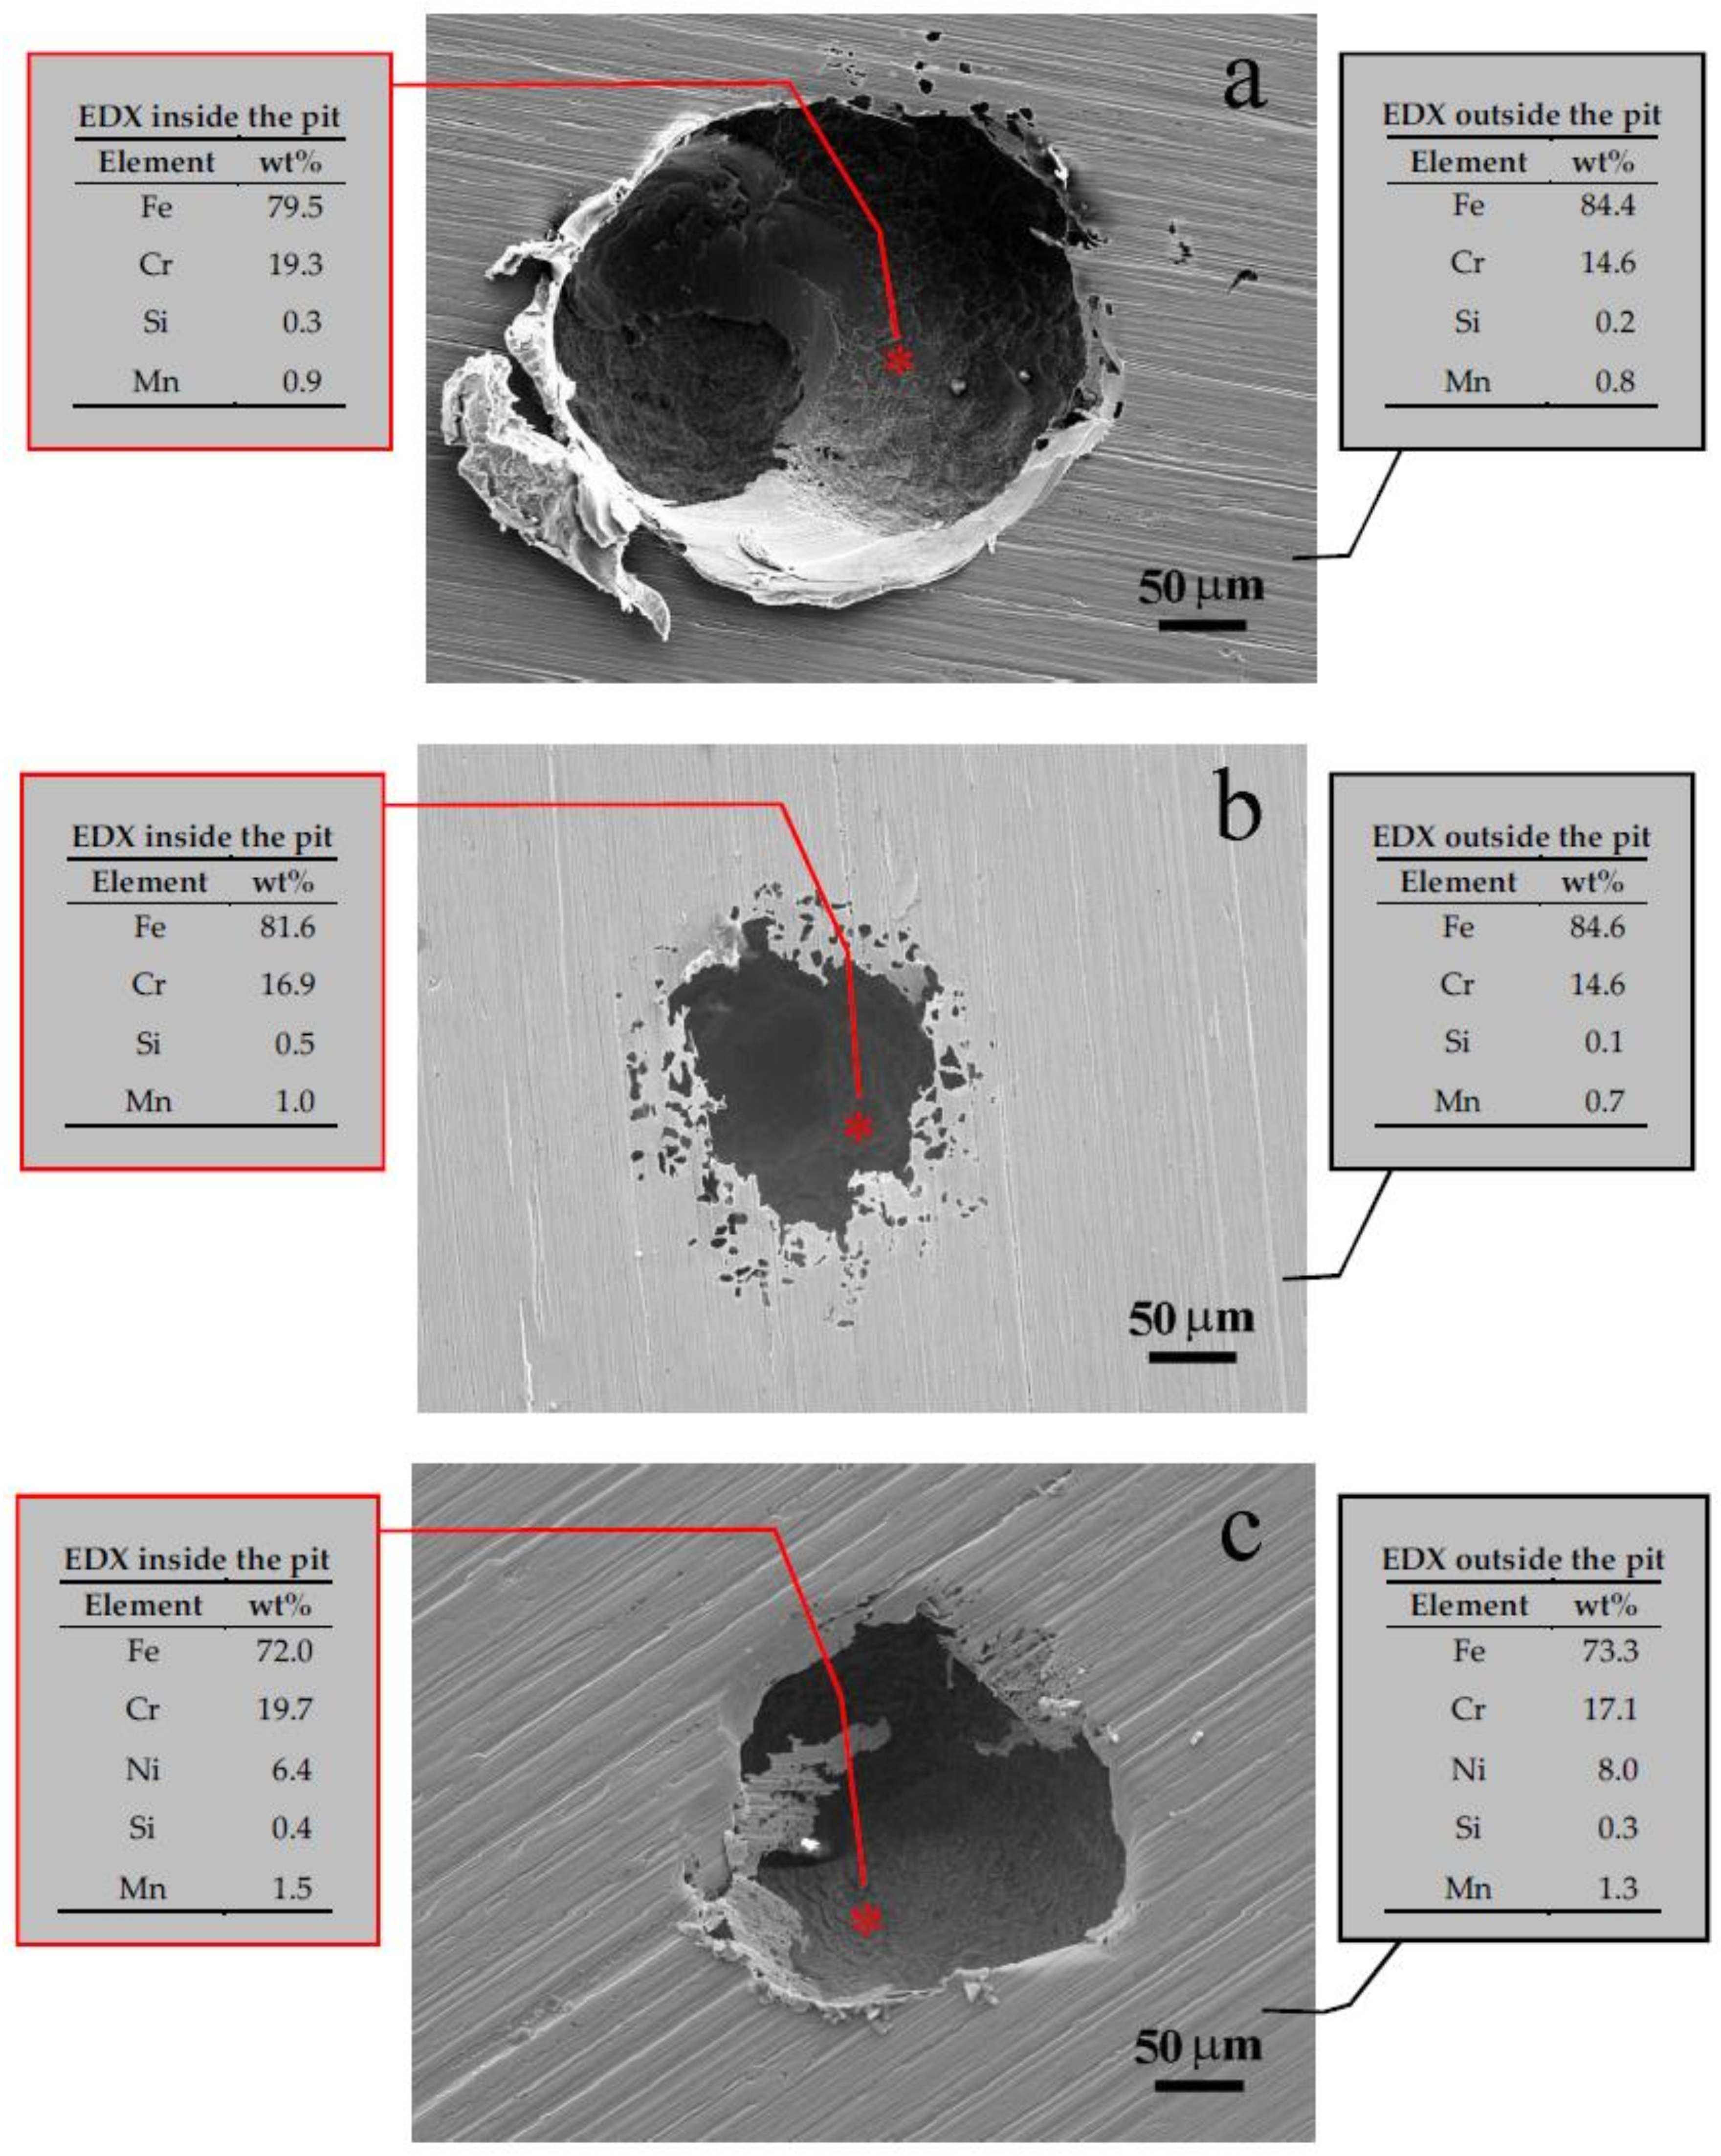
Figure 5 displays some SEM images of the pits observed on the studied SSs at the end of CPP tests: their width is in the range 100–300 µm and their depth, measured by OM, is in the range of 150–250 µm. These pits show a cavernous characteristic.
Table 4 reports the average results of EDX analyses, in terms of Cr and Ni percentages, as those shown on both sides of SEM images in Figure 5. The analyses were performed both inside the pits, in the points marked by red asterisks, and in points outside the pits, far from their mouth. For all samples, the EDX analyses performed outside the pits slightly underestimate the Cr and Ni contents in SSs with respect to those obtained by means of spectroscopic analyses (Table 2).
The analyses performed inside the pits (Table 4) indicate a significant increase in Cr content both for AISI 430 and for AISI 304 samples showing anodic CCP curves with a closed-loop hysteresis. On the contrary, for the samples of AISI 430 showing the anodic curve with the open-loop hysteresis, the Cr content resulted again higher than that found outside the pits (Table 4), but with a lower difference compared to the previously considered AISI 430 samples showing a closed-loop hysteresis. In the case of the austenitic AISI 304 SS, even a slight Ni content depletion was found inside the pits (Table 4).
It is noteworthy that the values reported in Table 4 can be considered only as a qualitative indication of the changes in SS composition induced by pitting corrosion and subsequent repassivation. This is due to the fact that in the particular case of EDX analysis inside the pits, the signals do not only involve the visible pit surface (Figure 5), but also the material underneath it, which is not yet affected by the corrosion phenomenon. However, the results of Table 4 indicate that the repassivation at an Eprot value higher than Ecorr (closed-loop hysteresis) can be associated with a significant Cr enrichment on the pit surface, where this element is able to form a new passive film and does not dissolve further.
From these observations, it can be concluded that chromium plays in any case a fundamental role on the delay of pitting initiation of the examined SSs and in the obtainment of new passivity conditions.

4. Conclusions

In this work, the localized corrosion resistance of different batches of AISI 430 and AISI 304 stainless steels, having the same Scotch-Brite surface finishing but different roughness in terms of Rz, was analyzed. The investigation was performed by means of anodic cyclic potentiodynamic polarization curves carried out at room temperature, in NaCl 0.35 wt % and NaCl 1.75 wt %. From the anodic curves, the characteristic Ecorr, Eprot, and Epit potentials were obtained and analyzed as a function of Rz and chemical composition of the tested stainless steels.
From the experimental results, it has been found that AISI 430 shows a lower localized corrosion resistance than AISI 304, although the former has a considerably lower roughness with respect to the latter. Therefore, the lower chromium content of AISI 430 compared to that of AISI 304 is a more important factor than their roughness. This consideration is not only determined by pitting corrosion resistance results obtained for both stainless steels, but also by their repassivation ability, which are favored by a high chromium content in the SS alloys.
The surface roughness increase slightly influences the localized corrosion resistance of the studied stainless steels, in particular on determining the decrease of the pitting potential of AISI 304 batches in NaCl 0.35 wt %. This is due to the highest values of Rz and higher differences of this parameter among the Series of AISI 304 with respect to the Series of AISI 430.
The analysis of the difference Epit−Eprot, which is related to the nature of the hysteresis loops of the cyclic anodic curves (closed or open loops), as a function of Rz, and the chemical composition of both examined stainless steels allow to obtain information on the durability of these alloys in service conditions. The results showed that AISI 430 has a lower repassivation ability with respect to AISI 304, independently from the roughness, thus offering a less guaranty of durability in service applications in chloride environments. In particular, the higher the concentration of chlorides the higher are the differences of corrosion performances between the two stainless steels.
The durability information obtained from this work was confirmed from the market issues met for the examined stainless steels with Scotch-Bright surface finishing, which are of higher entity in the case of AISI 430 than for AISI 304.

Acknowledgments

The authors thank Electrolux Italia S.p.A. for founding this research work.

Author Contributions

Tiziano Bellezze conceived and designed the experiments; Annamaria Viceré and Giampaolo Giuliani prepared the samples for the tests and performed the electrochemical characterization experiments and OM observations; Gabriella Roventi performed SEM-EDX observations; Tiziano Bellezze and Annamaria Viceré performed all the data elaborations; Emanuele Sorrentino managed the funds for research activation, the contacts with stainless steel suppliers and performed the roughness measurements; Tiziano Bellezze, Annamaria Viceré and Gabriella Roventi wrote, revised and edited the manuscript.

Conflicts of Interest

The authors declare no conflict of interest.

References

  1. Stainless Steel—ASM Specialty Handbook; ASM International: Materials Park, OH, USA, 1994; ISBN 0-87170-503-6.
  2. Olsson, C.-O.A.; Landolt, D. Passive films on stainless steels—Chemistry, structure and growth. Electrochim. Acta 2003, 48, 1093–1104. [Google Scholar] [CrossRef]
  3. Metals Handobook—Corrosion, 9th ed.; ASM International: Materials Park, OH, USA, 1987; Volume 13, ISBN 0-87170-019-0.
  4. Grilli, M.L.; Bellezze, T.; Gamsjäger, E.; Rinaldi, A.; Novak, P.; Balos, S.; Piticescu, R.R.; Ruello, M.L. Solutions for Critical Raw Materials under Extreme Conditions: A Review. Materials 2017, 10, 285. [Google Scholar] [CrossRef] [PubMed]
  5. Bellezze, T.; Quaranta, A.M.; Roventi, G.; Fratesi, R. Atmospheric corrosion resistance of stainless steels with different surface finishing. Metall. Ital. 2009, 101, 59–64. [Google Scholar]
  6. Bellezze, T.; Roventi, G.; Fratesi, R. Atmospheric corrosion resistance of stainless steels suitable for many applications. Metall. Ital. 2005, 97, 25–32. [Google Scholar]
  7. Liptáková, T.; Bolzoni, F.; Trško, L. Specification of surface parameters effects on corrosion behavior of the AISI 316Ti in dependence on experimental methods. J. Adhes. Sci. Technol. 2016, 30, 2329–2344. [Google Scholar] [CrossRef]
  8. De Oliveira, A.C.; de Oliveira, M.L.; Ríos, C.T.; Antunes, R.A. The effect of mechanical polishing and finishing on the corrosion resistance of AISI 304 stainless steel. Corros. Eng. Sci. Technol. 2016, 51, 416–428. [Google Scholar] [CrossRef]
  9. Lage, R.; Møller, P.; Fallesen, H.E. The effect of surface treatment and topography on corrosion behavior of EN 1.4404 stainless steel. Mater. Corros. 2015, 66, 1060–1067. [Google Scholar] [CrossRef]
  10. Leban, M.B.; Mikyška, Č.; Kosec, T.; Markoli, B.; Kovač, J. The Effect of Surface Roughness on the Corrosion Properties of Type AISI 304 Stainless Steel in Diluted NaCl and Urban Rain Solution. J. Mater. Eng. Perform. 2014, 23, 1695–1702. [Google Scholar] [CrossRef]
  11. Burkert, A.; Klapper, H.S.; Lehmann, J. Novel strategies for assessing the Pitting Corrosion Resistance of Stainless Steel Surfaces. Mater. Corros. 2013, 64, 675–682. [Google Scholar] [CrossRef]
  12. Lee, S.M.; Lee, W.G.; Kim, Y.H.; Jang, H. Surface Roughness and the Corrosion Resistance of 21Cr ferritic Stainless Steel. Corros. Sci. 2012, 63, 404–409. [Google Scholar] [CrossRef]
  13. Alar, V.; Runje, B.; Baršić, G. Influence of surface texture on electrochemical potential. Der Einfluss vom Zustand der Oberflächenbeschaffenheit auf das elektrochemische Potenzial. Materialwiss. Werkst. 2010, 41, 875–878. [Google Scholar] [CrossRef]
  14. Abosrra, L.; Ashour, A.F.; Mitchell, S.C.; Youseffi, M. Corrosion of mild steel and 316L austenitic stainless steel with different surface roughness in sodium chloride saline solutions. WIT Trans. Eng. Sci. 2009, 65, 161–172. [Google Scholar] [CrossRef]
  15. Shahryari, A.; Kamal, W.; Omanovic, S. The effect of surface roughness on the efficiency of the cyclic potentiodynamic passivation (CPP) method in the improvement of general and pitting corrosion resistance of 316LVM stainless steel. Mater. Lett. 2008, 62, 3906–3909. [Google Scholar] [CrossRef]
  16. Hilbert, L.R.; Bagge-Ravn, D.; Kold, J.; Gram, L. Influence of surface roughness of stainless steel on microbial adhesion and corrosion resistance. Int. Biodeterior. Biodegrad. 2003, 52, 175–185. [Google Scholar] [CrossRef]
  17. Sasaki, K.; Burstein, G.T. The generation of surface roughness during slurry erosion-corrosion and its effect on the pitting potential. Corros. Sci. 1996, 38, 2111–2120. [Google Scholar] [CrossRef]
  18. Burstein, G.T.; Pistorius, P.C. Surface roughness and the metastable pitting of stainless steel in chloride solutions. Corrosion 1995, 51, 380–385. [Google Scholar] [CrossRef]
  19. Zuo, Y.; Wang, H.; Xiong, J. The aspect ratio of surface grooves and metastable pitting of stainless steel. Corros. Sci. 2002, 44, 25–35. [Google Scholar] [CrossRef]
  20. Hong, T.; Nagumo, M. Effect of surface roughness on early stages of pitting corrosion of type 301 stainless steel. Corros. Sci. 1997, 39, 1665–1672. [Google Scholar] [CrossRef]
  21. Laycock, N.J.; Noh, J.S.; White, S.P.; Krouse, D.P. Computer simulation of pitting potential measurements. Corros. Sci. 2005, 47, 3140–3177. [Google Scholar] [CrossRef]
  22. Bellezze, T.; Roventi, G.; Quaranta, A.; Fratesi, R. Improvement of pitting corrosion resistance of AISI 444 stainless steel to make it a possible substitute for AISI 304L and 316L in hot natural waters. Mater. Corros. 2008, 59, 727–731. [Google Scholar] [CrossRef]
  23. Bellezze, T.; Roventi, G.; Fratesi, R. Localised corrosion and cathodic protection of 17 4PH propeller shafts. Corros. Eng. Sci. Technol. 2013, 48, 340–345. [Google Scholar] [CrossRef]
  24. Bellezze, T.; Giuliani, G.; Roventi, G.; Fratesi, R.; Andreatta, F.; Fedrizzi, L. Corrosion behaviour of austenitic and duplex stainless steels in an industrial strongly acidic solution. Mater. Corros. 2016, 67, 831–838. [Google Scholar] [CrossRef]
  25. Bellezze, T.; Giuliani, G.; Roventi, G. Study of Stainless Steels Corrosion in a strong acid mixture. Part 1: Cyclic Potentiodynamic Polarization curves examined by means of an analytical method. Corros. Sci. 2018, 130, 113–125. [Google Scholar] [CrossRef]
  26. Sedriks, A.J. Plenary Lecture—1986: Effects of Alloy Composition and Microstructure on the Passivity of Stainless Steels. Corrosion 1986, 42, 376–389. [Google Scholar] [CrossRef]
  27. Atrens, A. Environmental conditions leading to pitting/crevice corrosion of a typical 12% chromium stainless steel at 80 °C. Corrosion 1983, 39, 483–487. [Google Scholar] [CrossRef]
  28. Wilde, B.E. On pitting and protection potentials: Their use and possible misuses for predicting localized corrosion resistance of stainless alloys in halide media. In Localized Corrosion; Part IV; Staehle, R.W., Brown, B.F., Kruger, J., Agarwal, A., Eds.; National Association of Corrosion Engineers: Houston, TX, USA, 1974; Volume NACE-3, p. 342. ISBN 0915567830. [Google Scholar]
Figure 1. SEM surface images of a sample of AISI 430 Series 3 (a) and a sample of AISI 304 Series 6 (b).
Metals 08 00244 g001
Figure 2. Three examples of anodic CPP curves: (a) a sample of AISI 430 Series 2, showing a closed-loop hysteresis; (b) a sample of AISI 430 Series 3, showing an open-loop hysteresis; (c) a sample of AISI 304 Series 6, showing a closed-loop hysteresis. All these samples were tested in NaCl 0.35 wt %. The three plots show the characteristic parameters obtained from the analysis of the curves.
Metals 08 00244 g002
Figure 3. Average value trends of Ecorr, Eprot, and Epit and relative error bars for AISI 430 and AISI 304 Series, obtained at room temperature in NaCl 0.35 wt % (a) and in NaCl 1.75 wt % (b). Among these trends, the ppr and ipr are shown.
Metals 08 00244 g003
Figure 4. Epit−Eprot trends as a function of Rz for AISI 430 and AISI 304, obtained in both NaCl solutions. The dotted arrows qualitatively indicate the hypothetical rise of the corresponding colored curves of AISI 430, as discussed in the article.
Metals 08 00244 g004
Figure 5. SEM images of some pits observed at the end of CPP tests performed in NaCl 0.35 wt %, corresponding to anodic curves shown in Figure 2: (a) a sample of AISI 430 Series 2, showing a closed-loop hysteresis; (b) a sample of AISI 430 Series 3, showing an open-loop hysteresis; (c) a sample of AISI 304 Series 6, showing a closed-loop hysteresis. On the sides of these images, the results of EDX analyses are reported: on the left, those performed inside the pits in correspondence to the red asterisks; on the right, those performed outside the pits, far from their mouth.
Metals 08 00244 g005
Table 1. Roughness of the tested AISI 430 and AISI 304 batches in terms of Rz (µm).
Series 1 AISI 430Series 2 AISI 430Series 3 AISI 430Series 4 AISI 304Series 5 AISI 304Series 6 AISI 304
1.4021.5861.7412.5963.1414.895
Table 2. Average chemical composition of the examined SSs (wt %).
SSCMnPSSiCuNiCrMo
AISI 4300.060.360.030.010.30<0.010.1516.570.03
AISI 3040.041.490.040.010.420.278.7718.310.19
Table 3. Percentage of the anodic curves showing a closed-loop hysteresis for AISI 430 and AISI 304 in the two NaCl solutions, independently from Rz.
AISI 430 NaCl 0.35 wt %AISI 304 NaCl 0.35 wt %AISI 430 NaCl 1.75 wt %AISI 304 NaCl 1.75 wt %
62.5100.028.6100.0
Table 4. Average percentage values of Cr and Ni (wt %) obtained by means of EDX analyses performed outside and inside the pits on different AISI 430 and AISI 304 samples.
EDX AnalysisAISI 430 Closed-Loop Hysteresis CurvesAISI 430 Open-Loop Hysteresis CurvesAISI 304 Closed-Loop Hysteresis Curves
CrCrCrNi
Outside the pit14.714.617.47.9
Inside the pit (*)20.917.121.46.3
* The EDX analyses were performed in areas like those in correspondence to the red asterisks in Figure 5.

