Study on the Effect of Energy-Input on the Joint Mechanical Properties of Rotary Friction-Welding


1
Shaanxi Key Laboratory of Friction Welding Technologies, Northwestern Polytechnical University, Xi’an 710072, China
2
State Key Laboratory of Solidification Processing, Northwestern Polytechnical University, Xi’an 710072, China
*
Author to whom correspondence should be addressed.
Metals 2018, 8(11), 908; https://doi.org/10.3390/met8110908
Submission received: 17 October 2018
/
Revised: 2 November 2018
/
Accepted: 3 November 2018
/
Published: 6 November 2018
(This article belongs to the Special Issue Science, Characterization and Technology of Joining and Welding)
Abstract
:The objective of the present study is to investigate the effect of energy-input on the mechanical properties of a 304 stainless-steel joint welded by continuous-drive rotary friction-welding (RFW). RFW experiments were conducted over a wide range of welding parameters (welding pressure: 25–200 MPa, rotation speed: 500–2300 rpm, welding time: 4–20 s, and forging pressure: 100–200 MPa). The results show that the energy-input has a significant effect on the tensile strength of RFW joints. With the increase of energy-input, the tensile strength rapidly increases until reaching the maximum value and then slightly decreases. An empirical model for energy-input was established based on RFW experiments that cover a wide range of welding parameters. The accuracy of the model was verified by extra RFW experiments. In addition, the model for optimal energy-input of different forging pressures was obtained. To verify the accuracy of the model, the optimal energy-input of a 170 MPa forging pressure was calculated. Three RFW experiments in which energy-input was equal to the calculated value were made. The joints’ tensile strength coefficients were 90%, 93%, and 96% respectively, which proved that the model is accurate.
1. Introduction
Rotary friction-welding (RFW) is a method of manufacturing that has been used extensively in recent times due to its advantages such as low heat input, production time, ease of manufacture, and environment friendliness [1,2]. The main parameters of rotary friction-welding are welding pressure, welding rotational speed, welding time, and forging pressure [3,4]. The influence of welding parameters on joint performance has always been a research focus of rotary friction-welding, whether in terms of numerical models or experiments. According to previous literature, it has been found that the RFW joints’ tensile strength increases with the increase of friction time until it reaches a maximum point, after which the tensile strength decreases [5]. The welding time determines the amount of heat flux in the joint and the width of the heat-affect zone (HAZ), which increases as the welding time increases [6]. Regarding welding pressure, it was found that friction pressure has a significant effect on tensile strength and the width of HAZ, both of which increased along with the increase in friction pressure until reaching a certain value [7]. In addition, friction pressure also affects the temperature gradient, the required weld power, and the burn-off rate during the RFW process [2]. For the rotational speed, numerical analyses found that an increase in rotational speed causes the weld interface to reach a quasi-stable temperature quicker, which starts material extrusion earlier and increases the upsetting rate remarkably [8]. The rotational speed also affects the heat input of the joint; thus, it has a significant effect on the notch tensile strength and impact toughness [9]. Moreover, the overall width of the weld zone reduces with the increase of rotational speed [10].
As discussed above, the parameters of welding time, welding pressure, and rotational speed all have a significant effect on joint performance when considered separately. However, in practical applications of RFW, it is often necessary to adjust several welding parameters simultaneously according to the actual condition, such as the welding material characteristics and the welding machine’s condition. Therefore, it is necessary to evaluate the significance of each parameter on joint performance when considering all parameters synthetically. Such an understanding will help to improve the weld quality, to eliminate weld defects and transfer knowledge of welding procedures to new conditions (e.g., for new geometry or new materials). It is generally known that welding pressure and rotation speed determine the characteristics of the power input during the RFW process, and the integral of power for welding time is the energy-input. For the RFW method, heat flux is generated by the conversion of mechanical energy into thermal energy at the interface of the work pieces [11]. In addition, the amount of energy-input dictates a successful welding process, the quality of joint, the shape of flash, the micro-structure, as well as the residual stress [12,13]. Therefore, it is reasonable to use the energy-input as an index to characterize the joint performance comprehensively. In this work, the effect of the energy-input on the joint’s mechanical property was investigated; an energy-input model as a function of welding pressure, rotational speed, and welding time was obtained, and the accuracy of the model was verified by experimental data. The model that describes the variation of optimal energy-input with forging pressure also was established, and an excellent performance joint was obtained based on the calculated optimal energy-input value.
2. Experimental Procedures
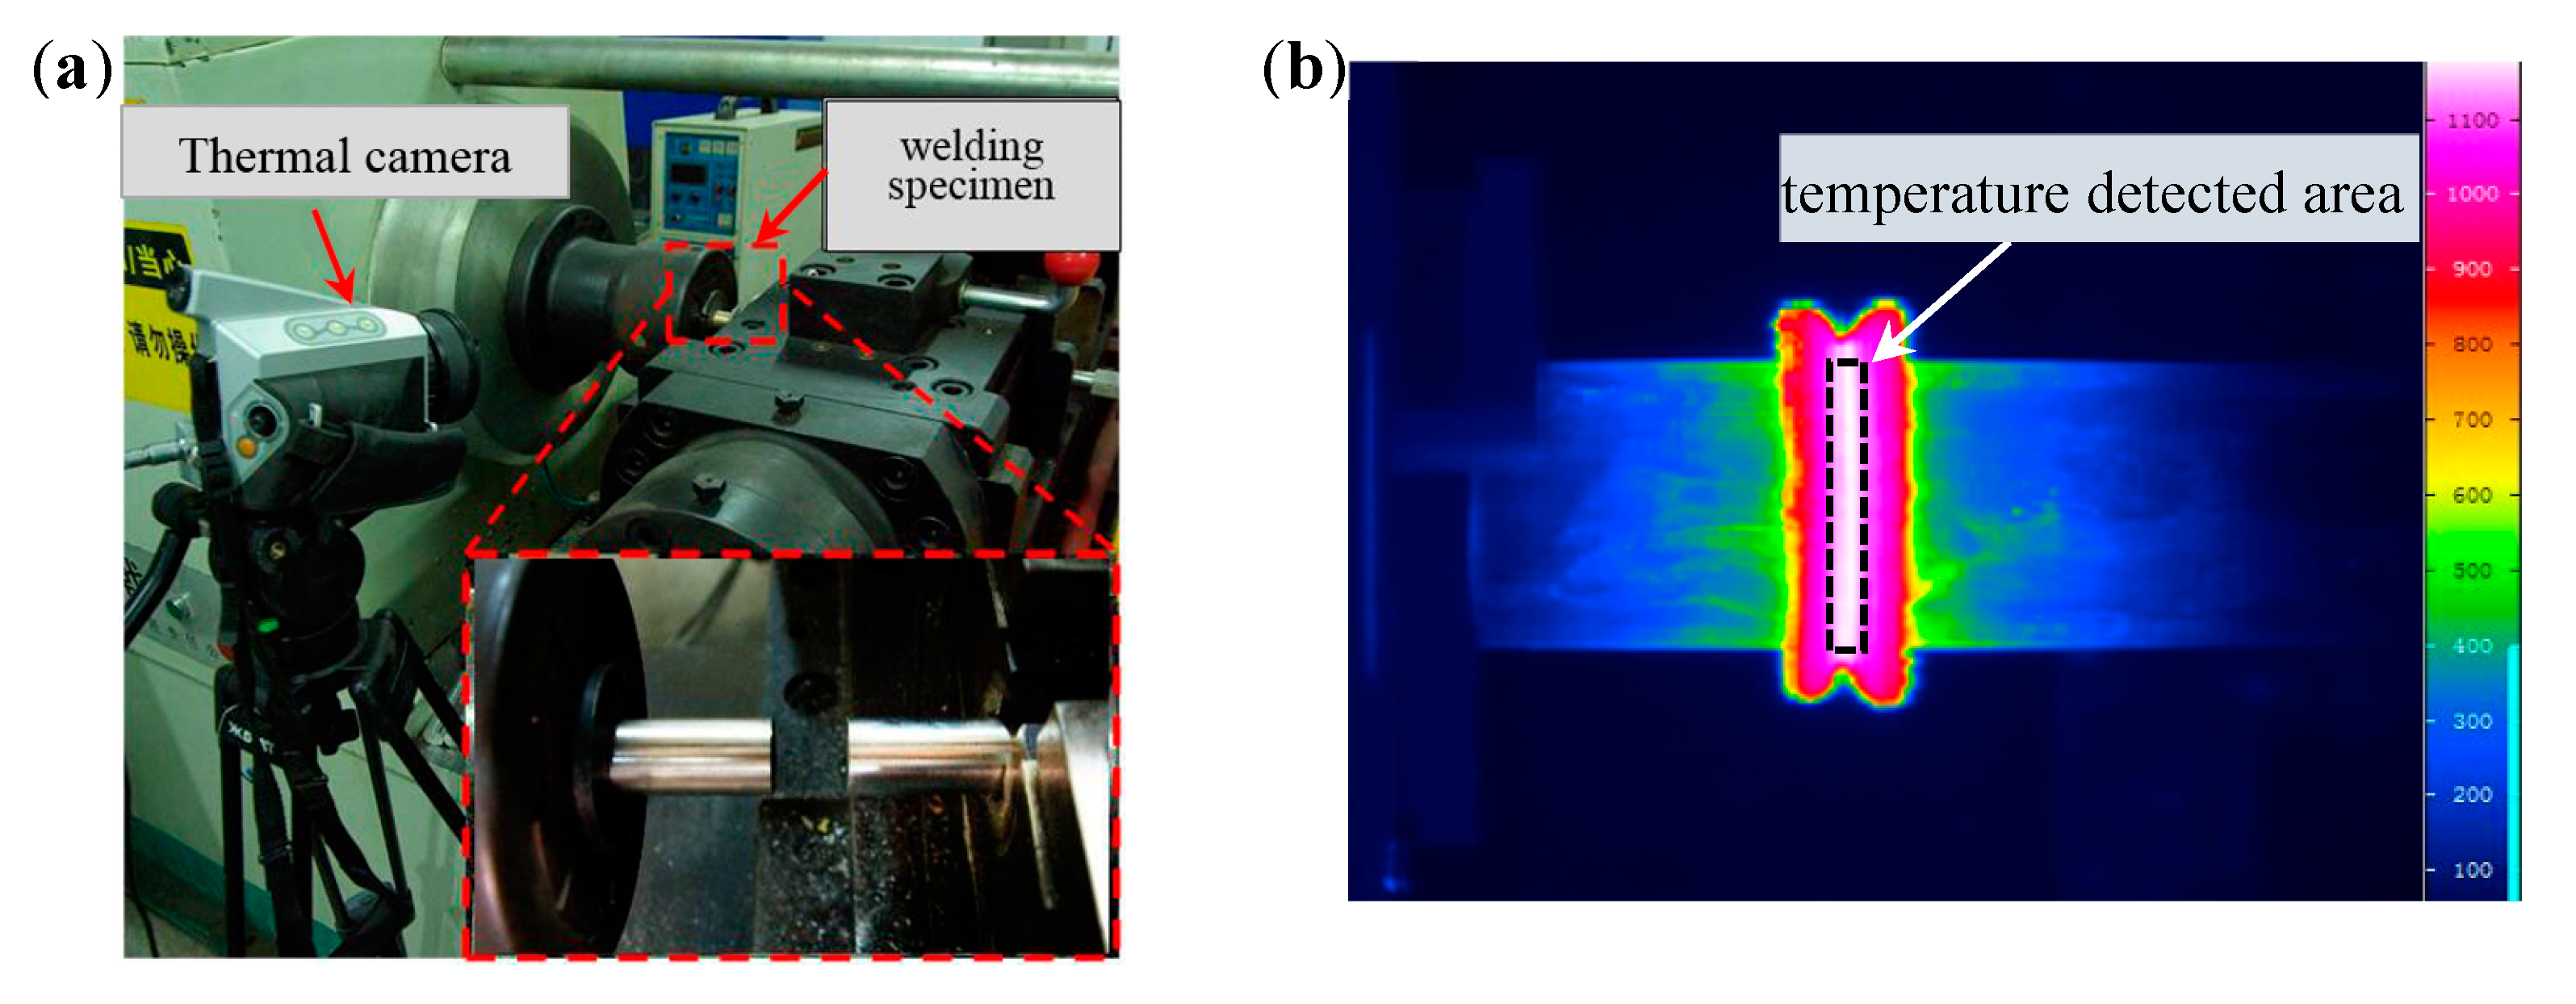
The specimen used in the present investigation was 304 stainless steel (304SS) rods with diameters of 25 mm. The specimens were welded by the C320 (Friction Welding Eng. & Tech. Co. Ltd., Hanzhong, Shaanxi, China) continuous-drive rotary friction-welding machine (maximum of 45 kW and 320 kN forging load). According to our preliminary experiments and the literature on 304SS RFW [5,6,9,14], the welding experiments were conducted using welding parameters in which the welding pressure varied from 40 MPa to 200 MPa, rotational speed varied from 500 rpm to 2300 rpm, and welding time varied from 4 s to 20 s, all while under forging pressures of 100 MPa, 120 MPa, 140 MPa, 160 MPa, 180 MPa, and 200 MPa, respectively. During the RFW process, the welding power was recorded by a computer through an A/D converter with a sampling time of 0.01 s, and the surface temperature of the joint was measured by an infrared thermal imaging instrument (Tec VarioCAM@hr, head-HS Infra, Dresden, Germany) with a sampling time of 0.02 s. The data collected by the infrared thermography instrument had been calibrated using the data that thermocouple collected, and the emissivity of 304SS was determined to 0.8. Figure 1 shows the location of the experimental equipment and the diagram of the temperature-detected area.
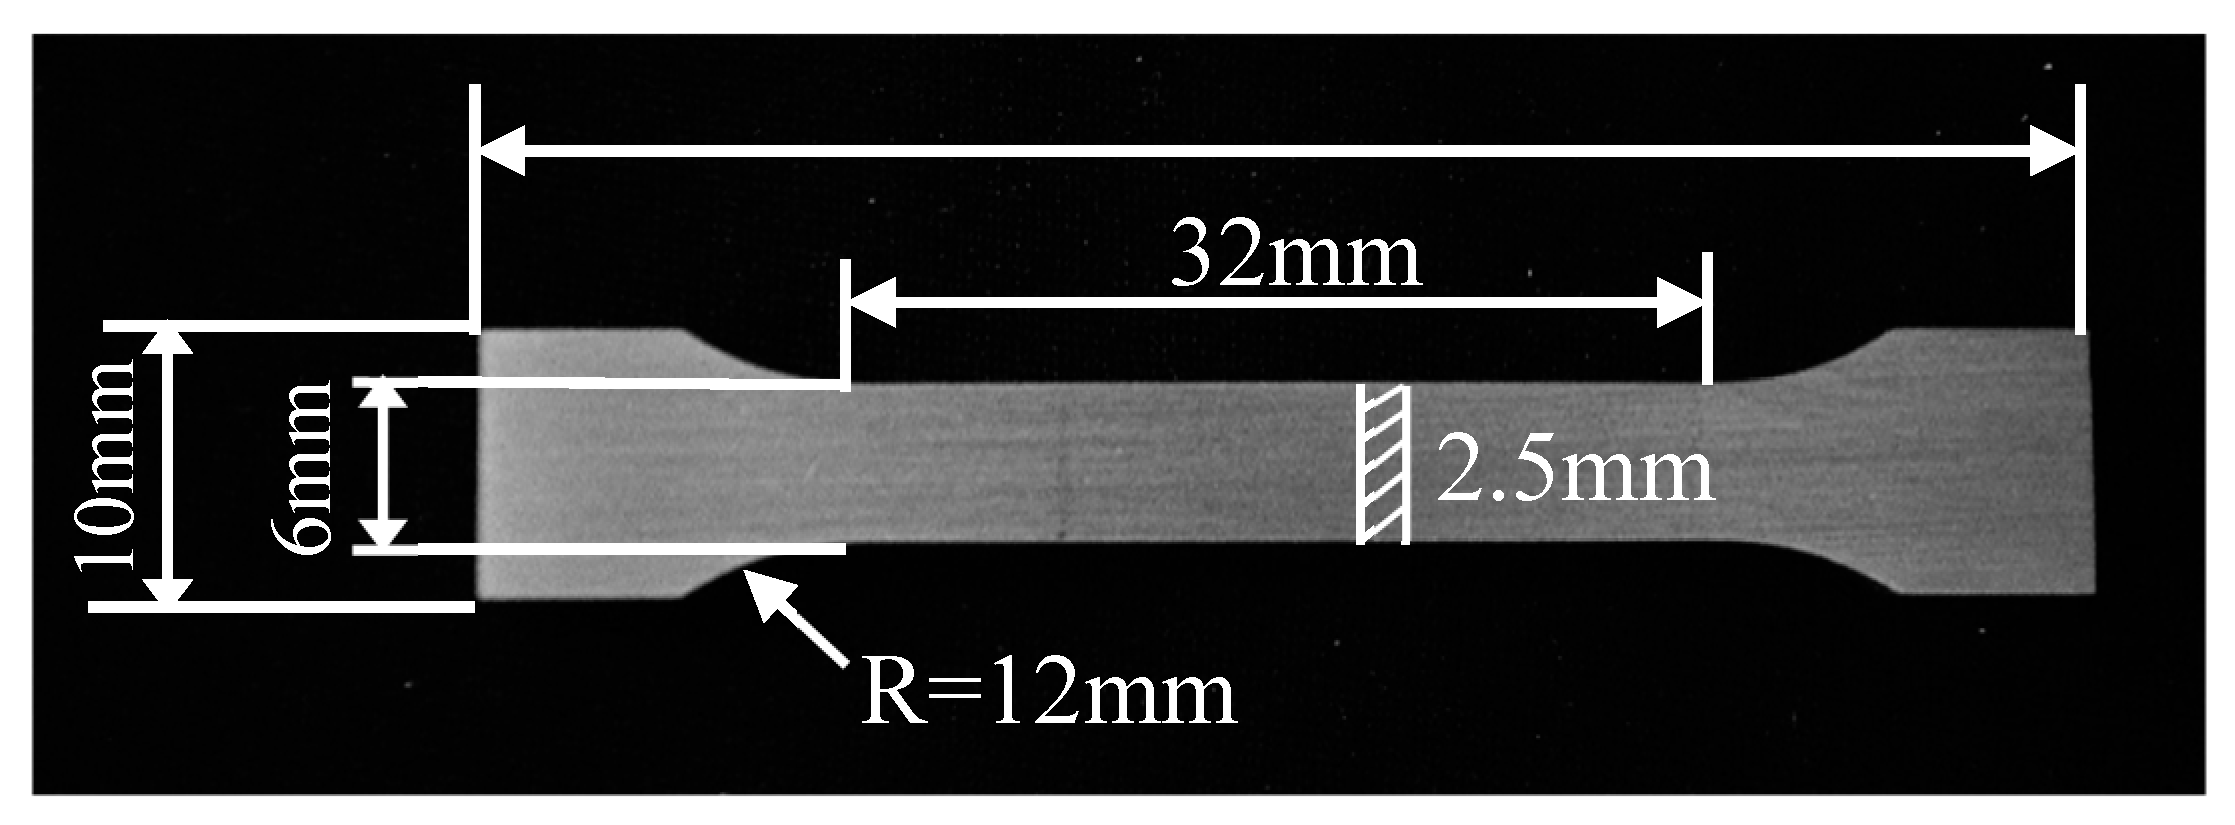
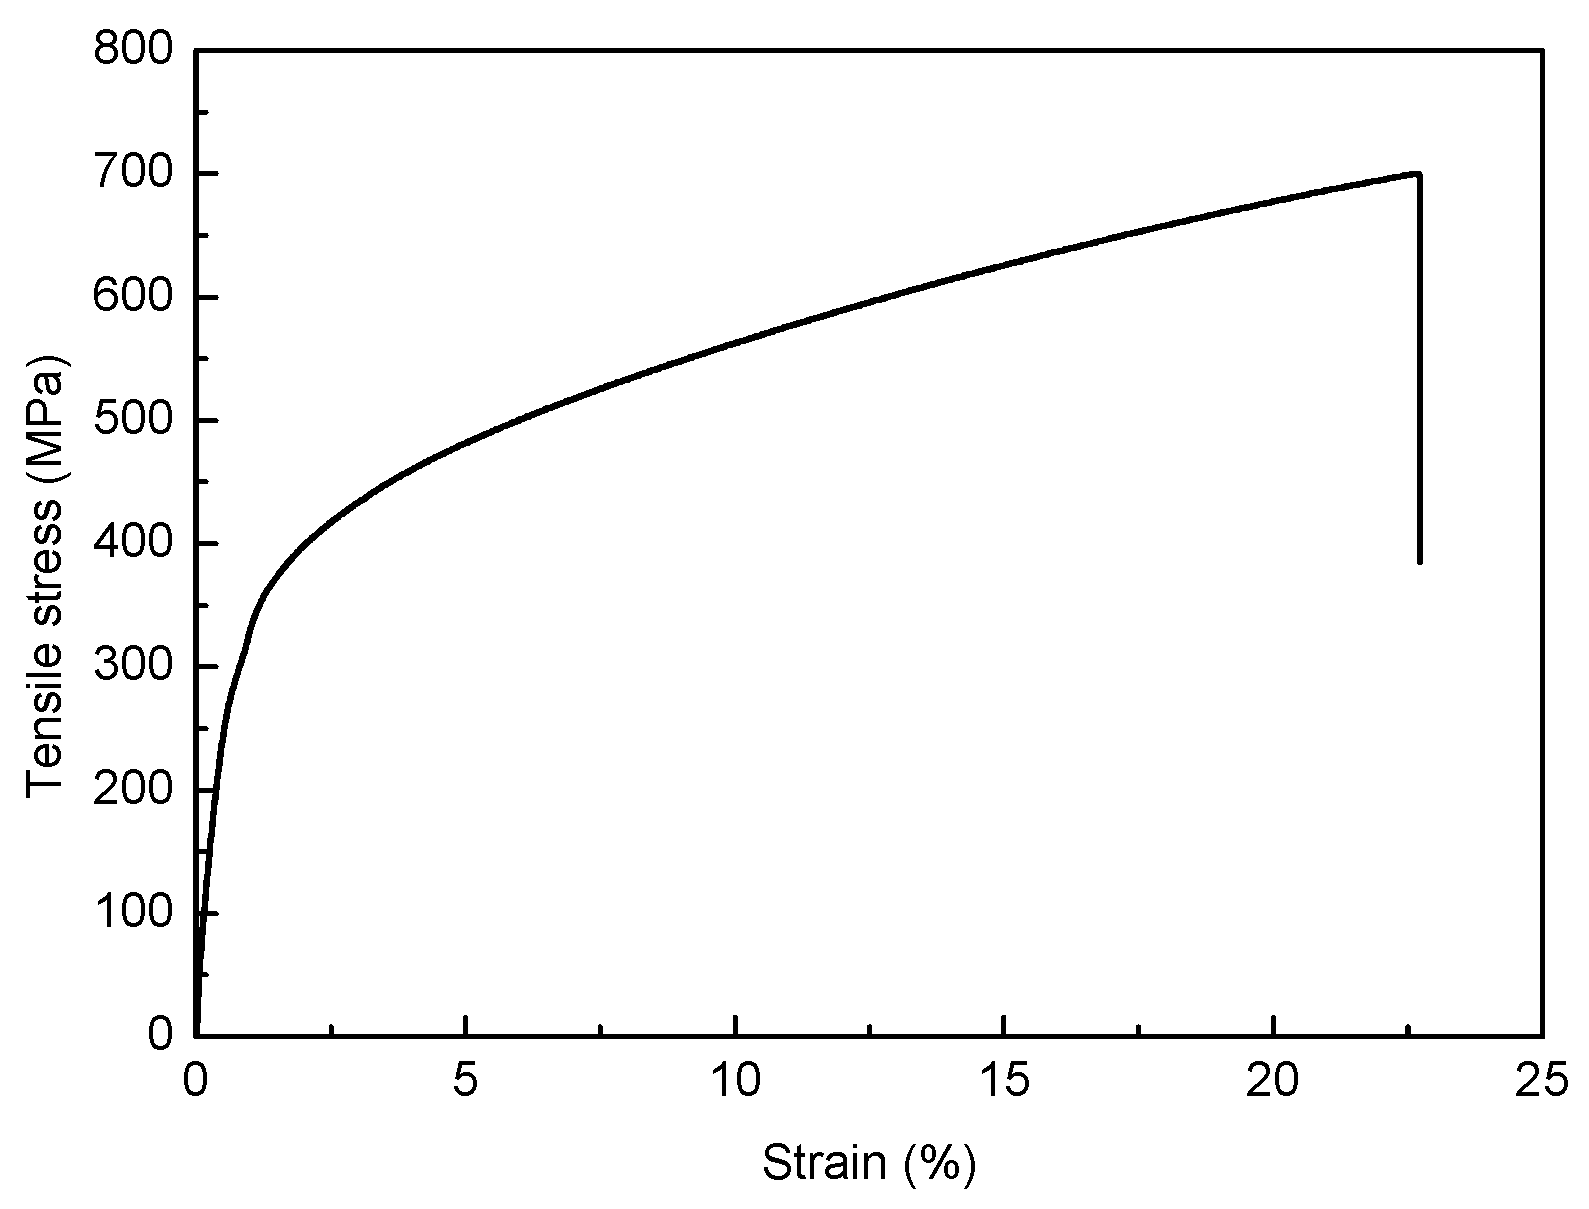
After welding, the axial cross-section of the joint was obtained for microstructural examination. The test specimens for Optical Microscope examination were mounted for polishing, then etched by a reagent of 5 g of FeCl3 dissolved in dilute hydrochloric acid (15 mL HCl + 60 mL H2O). The microstructure of the specimens was observed using a polarizing microscope (Olympus PMG3, Missouri, TX, USA), and the microhardness was measured on the cross-section perpendicular to the friction interface using a microhardness tester (Shimadzu HMV-2T, Dallas, TX, USA) under a load of 2 N. The microhardness test area includes all of the welding zone. Tensile test specimens were prepared according to GB/T228.1-2010. Figure 2 shows the geometry of the tensile test specimen. Three sets of tensile testing were conducted on a tensile-testing machine (Instron 3382, loading range 0~100 kN) using a crosshead speed of 1mm/min at room temperature, and its mean value was taken. Figure 3 displays a typical engineering stress-strain curve of the 304SS RFW joint. After tensile testing, the fracture specimens were etched by the same reagent as described above, and the macro-morphology of fracture surface were observed by SEM (JSM–6390A, JEOL, Tokyo, Japan).
3. Results and Discussion
3.1. The Relationship between Energy-Input and Tensile Strength
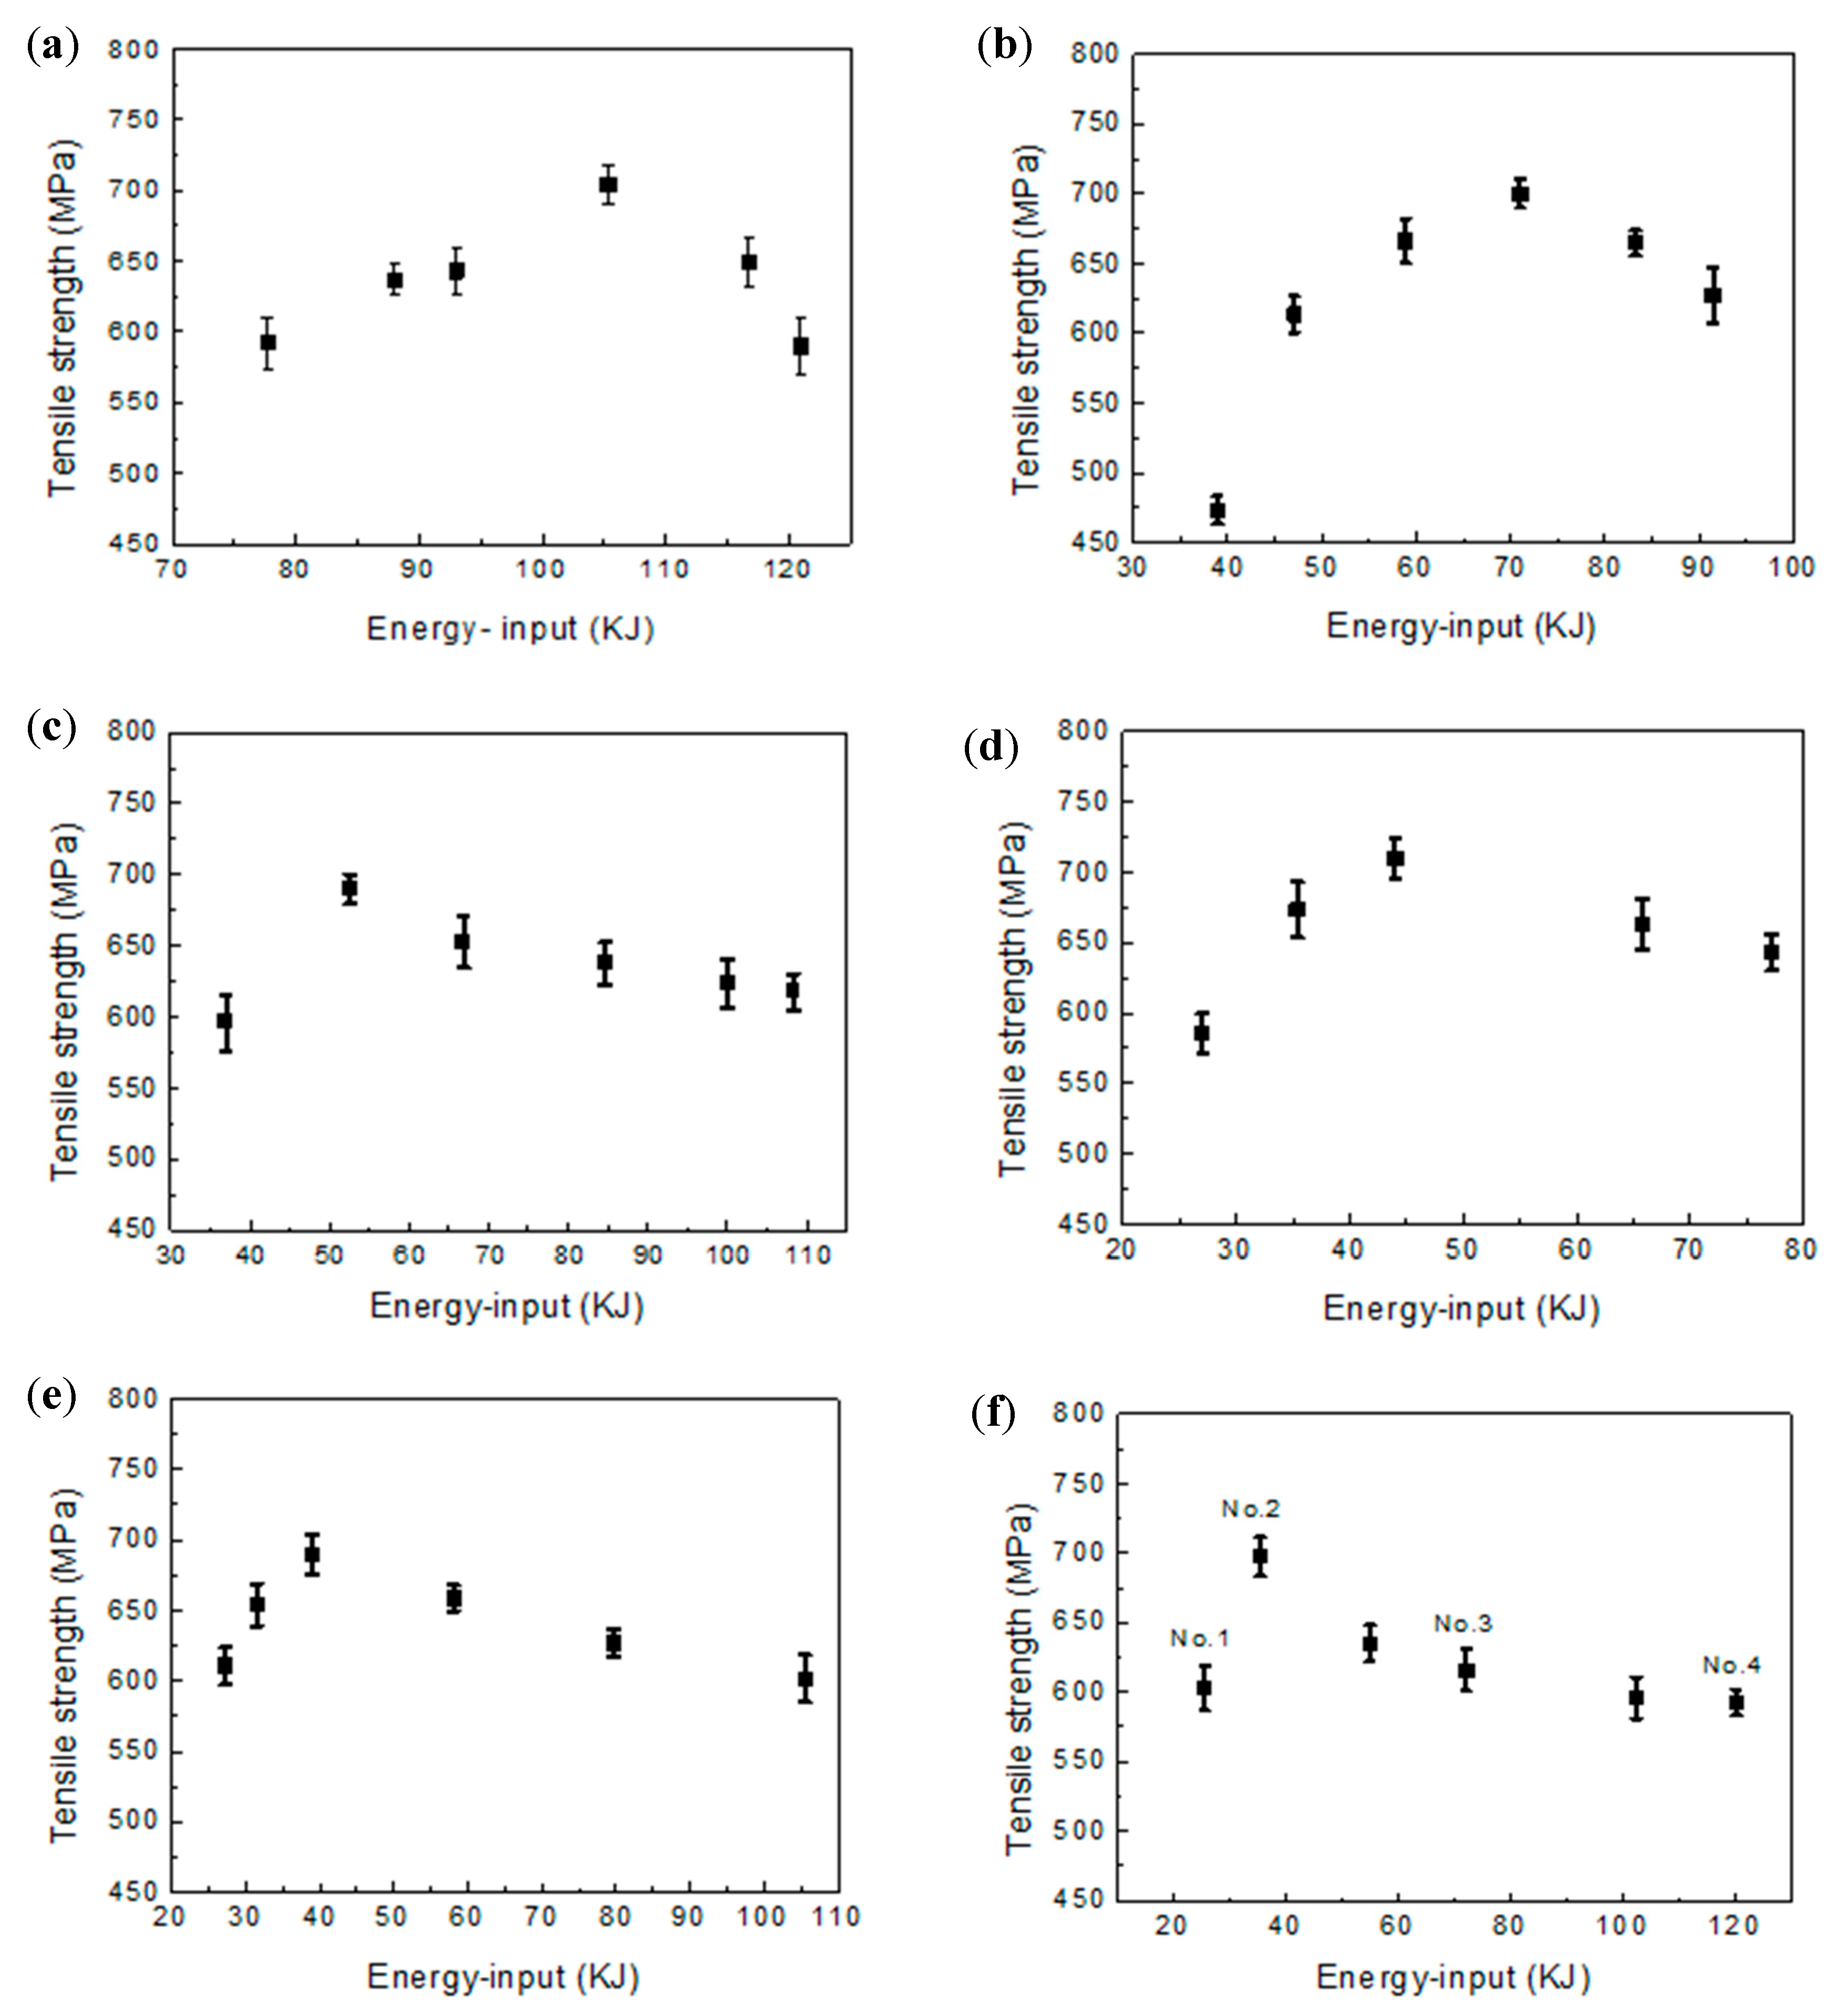
Figure 4 shows the variation trend of the joint’s tensile strength with energy-input under different forging pressures. It can be seen that the tensile strength has the same variation trend with the change of the energy-input, i.e., with an energy-input increase, the tensile strength increases until it reaches a maximum and then decreases. In addition, an optimum energy-input exists for different forging pressures that makes the joint have the highest tensile strength. (The variation characteristics of optimum energy-input corresponding to forging pressure will be discussed in Section 4). Four group experiments under a forging pressure of 200 MPa were selected to study the influence mechanism of energy-input on the joint strength. They are numbered from No.1 to No.4, as indicated in Figure 4. Table 1 lists the welding parameters, energy-input value, and tensile strength of these four experiments.
3.2. The Thermal Cycle of Different Joints
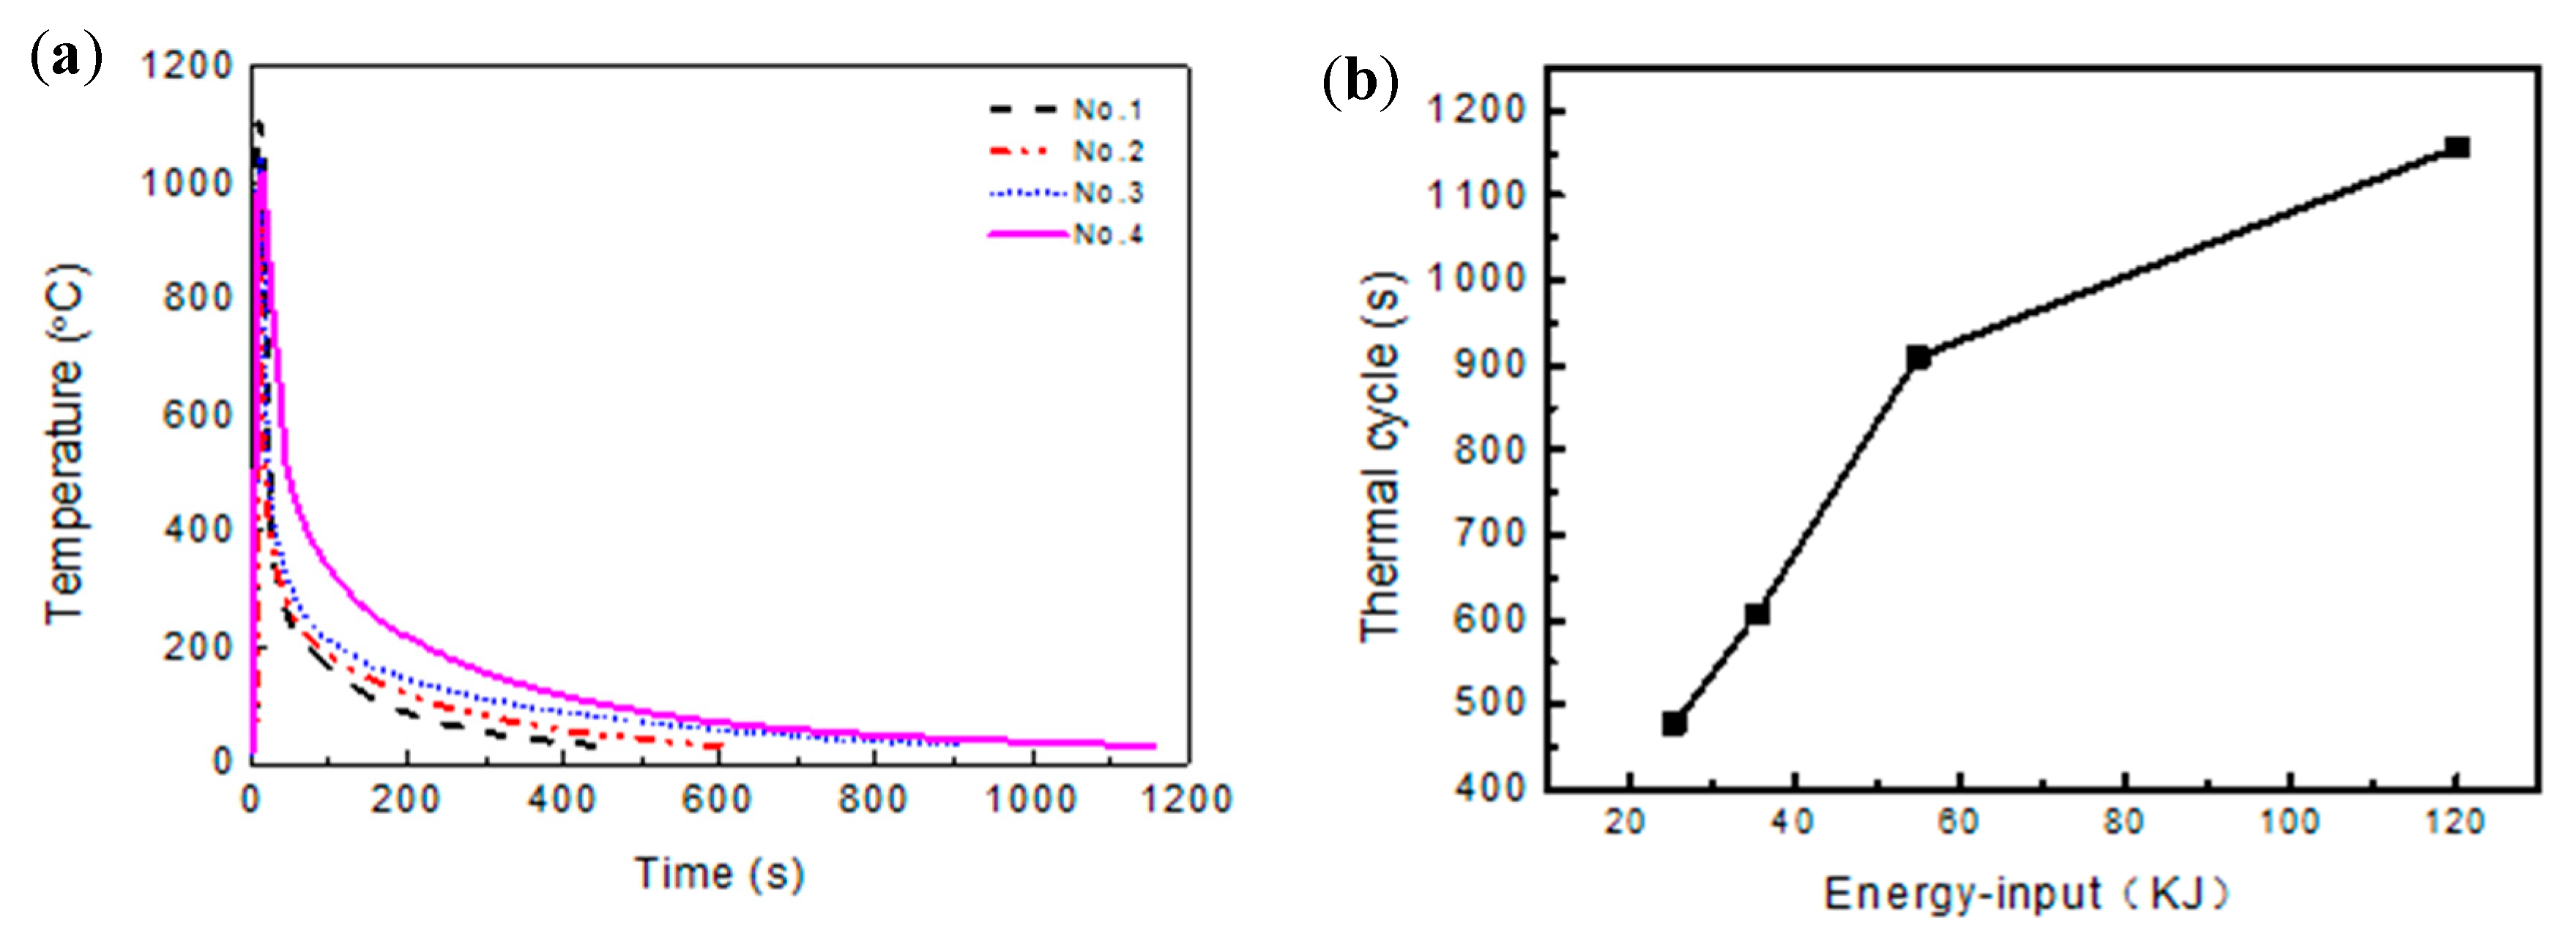
Figure 5 shows the evolution curves of the joint’s temperature of No.1 to No.4 specimens. As shown in Figure 5a, the highest temperature of No.1 to No.4 specimens during the RFW process are 1100 °C, 939 °C, 1046 °C, and 1017 °C, respectively. On the other hand, the energy-input of No.1 to No.4 is 25 kJ, 35 kJ, 55 kJ, and 120 kJ, respectively. We can see that the maximum temperature has no obvious variation regularity with the change of energy input, i.e., with the increase of energy-input, the maximum temperature has no obvious increase or decrease trend. In fact, the joint’s temperature is mainly influenced by the rotational speed and welding pressure [11,15]. However, the energy-input determines the thermal cycle time of joint, i.e., the time from the weld beginning to the joint cooling to room temperature. As seen in Figure 5b, when the energy-input increases from 25 kJ to 120 kJ, the thermal cycle time increases from 478 s to 1157 s. The reason for this is that the more the energy-input, the wider the area of joint that is heated during the welding process, which results in a longer cooling time after welding.
3.3. Variation of Microstructure with Energy-Input
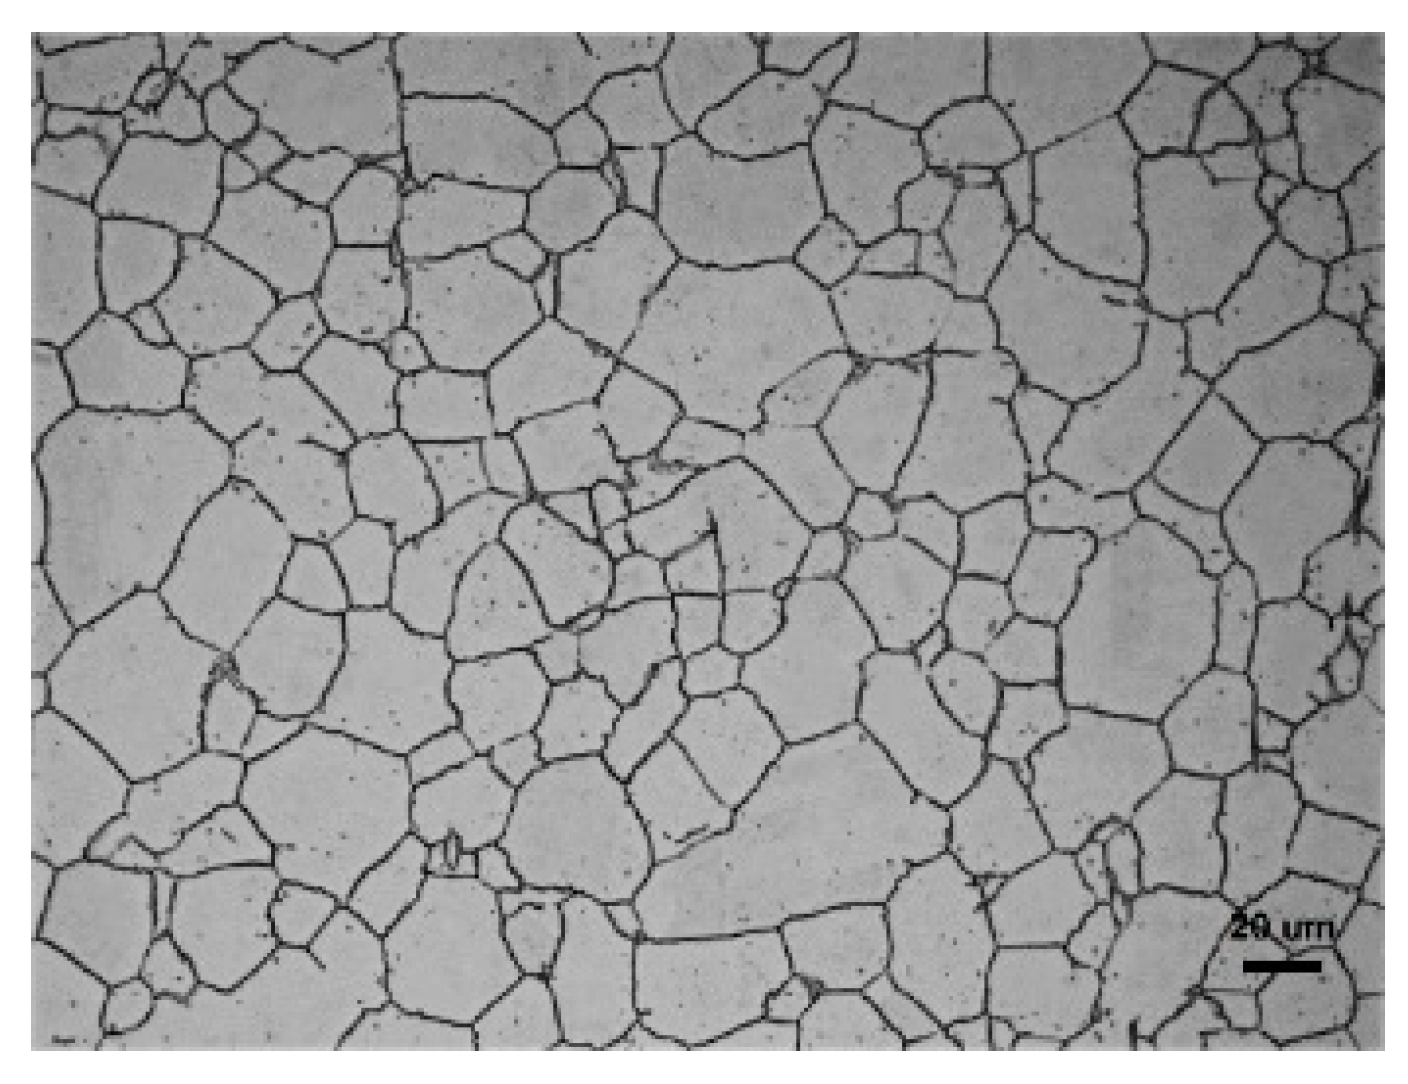
Figure 6 shows the microstructure of base metal (BM). The BM employed in this study is 304SS rods, of which the supply state is annealing treatment after rolling; thus, the initial microstructure consists of uniform equiaxed grains with an average size of 26 μm.
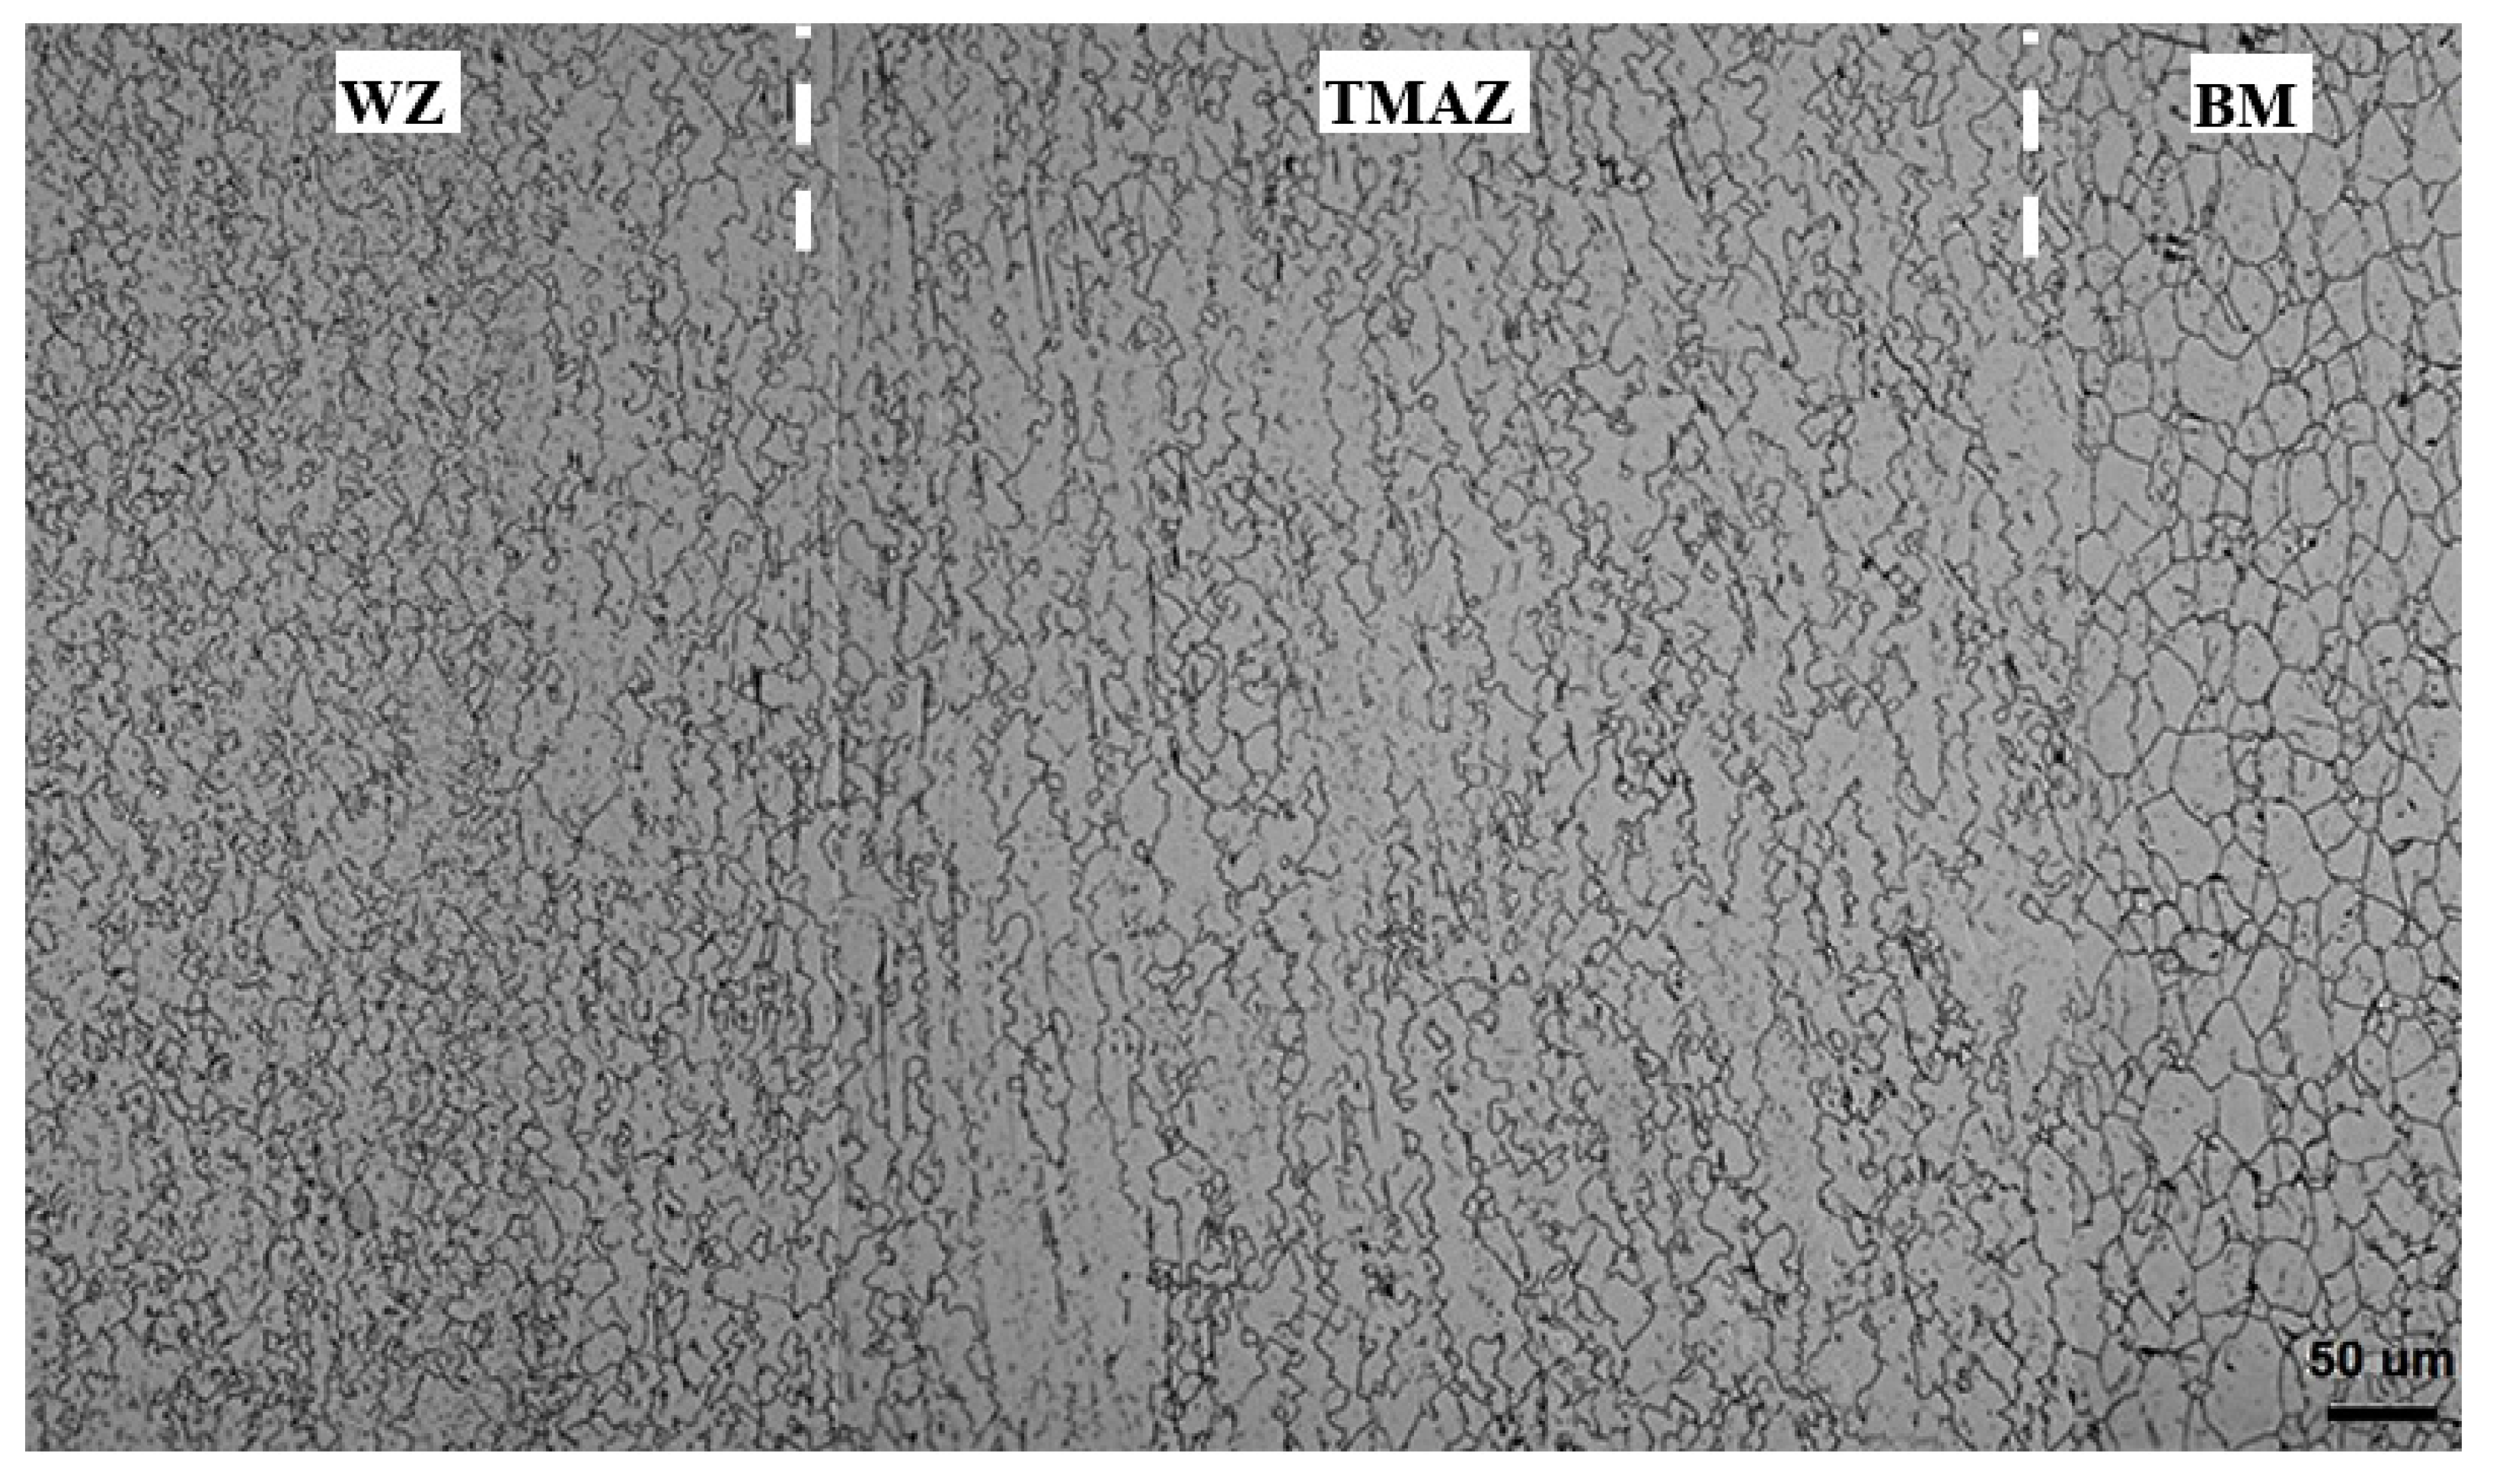
Figure 7 shows the typical microstructure morphology of a welded joint. Three zones consisting of weld zone (WZ), thermo-mechanically affected zone (TMAZ), and base metal (BZ) can be observed.
The WZ consists of equiaxed grains. The reason is that the WZ undergoes the most severe plastic deformation and the highest temperature thermal cycle compared to other zones, which results in sufficient dynamic recrystallization (DRX) occurring in the WZ. On other hand, partial DRX or no DRX occurs in the TMAZ, and a large degree of bending deformation occurs in the TMAZ that results in a clear radial flow direction existing in the microstructure.
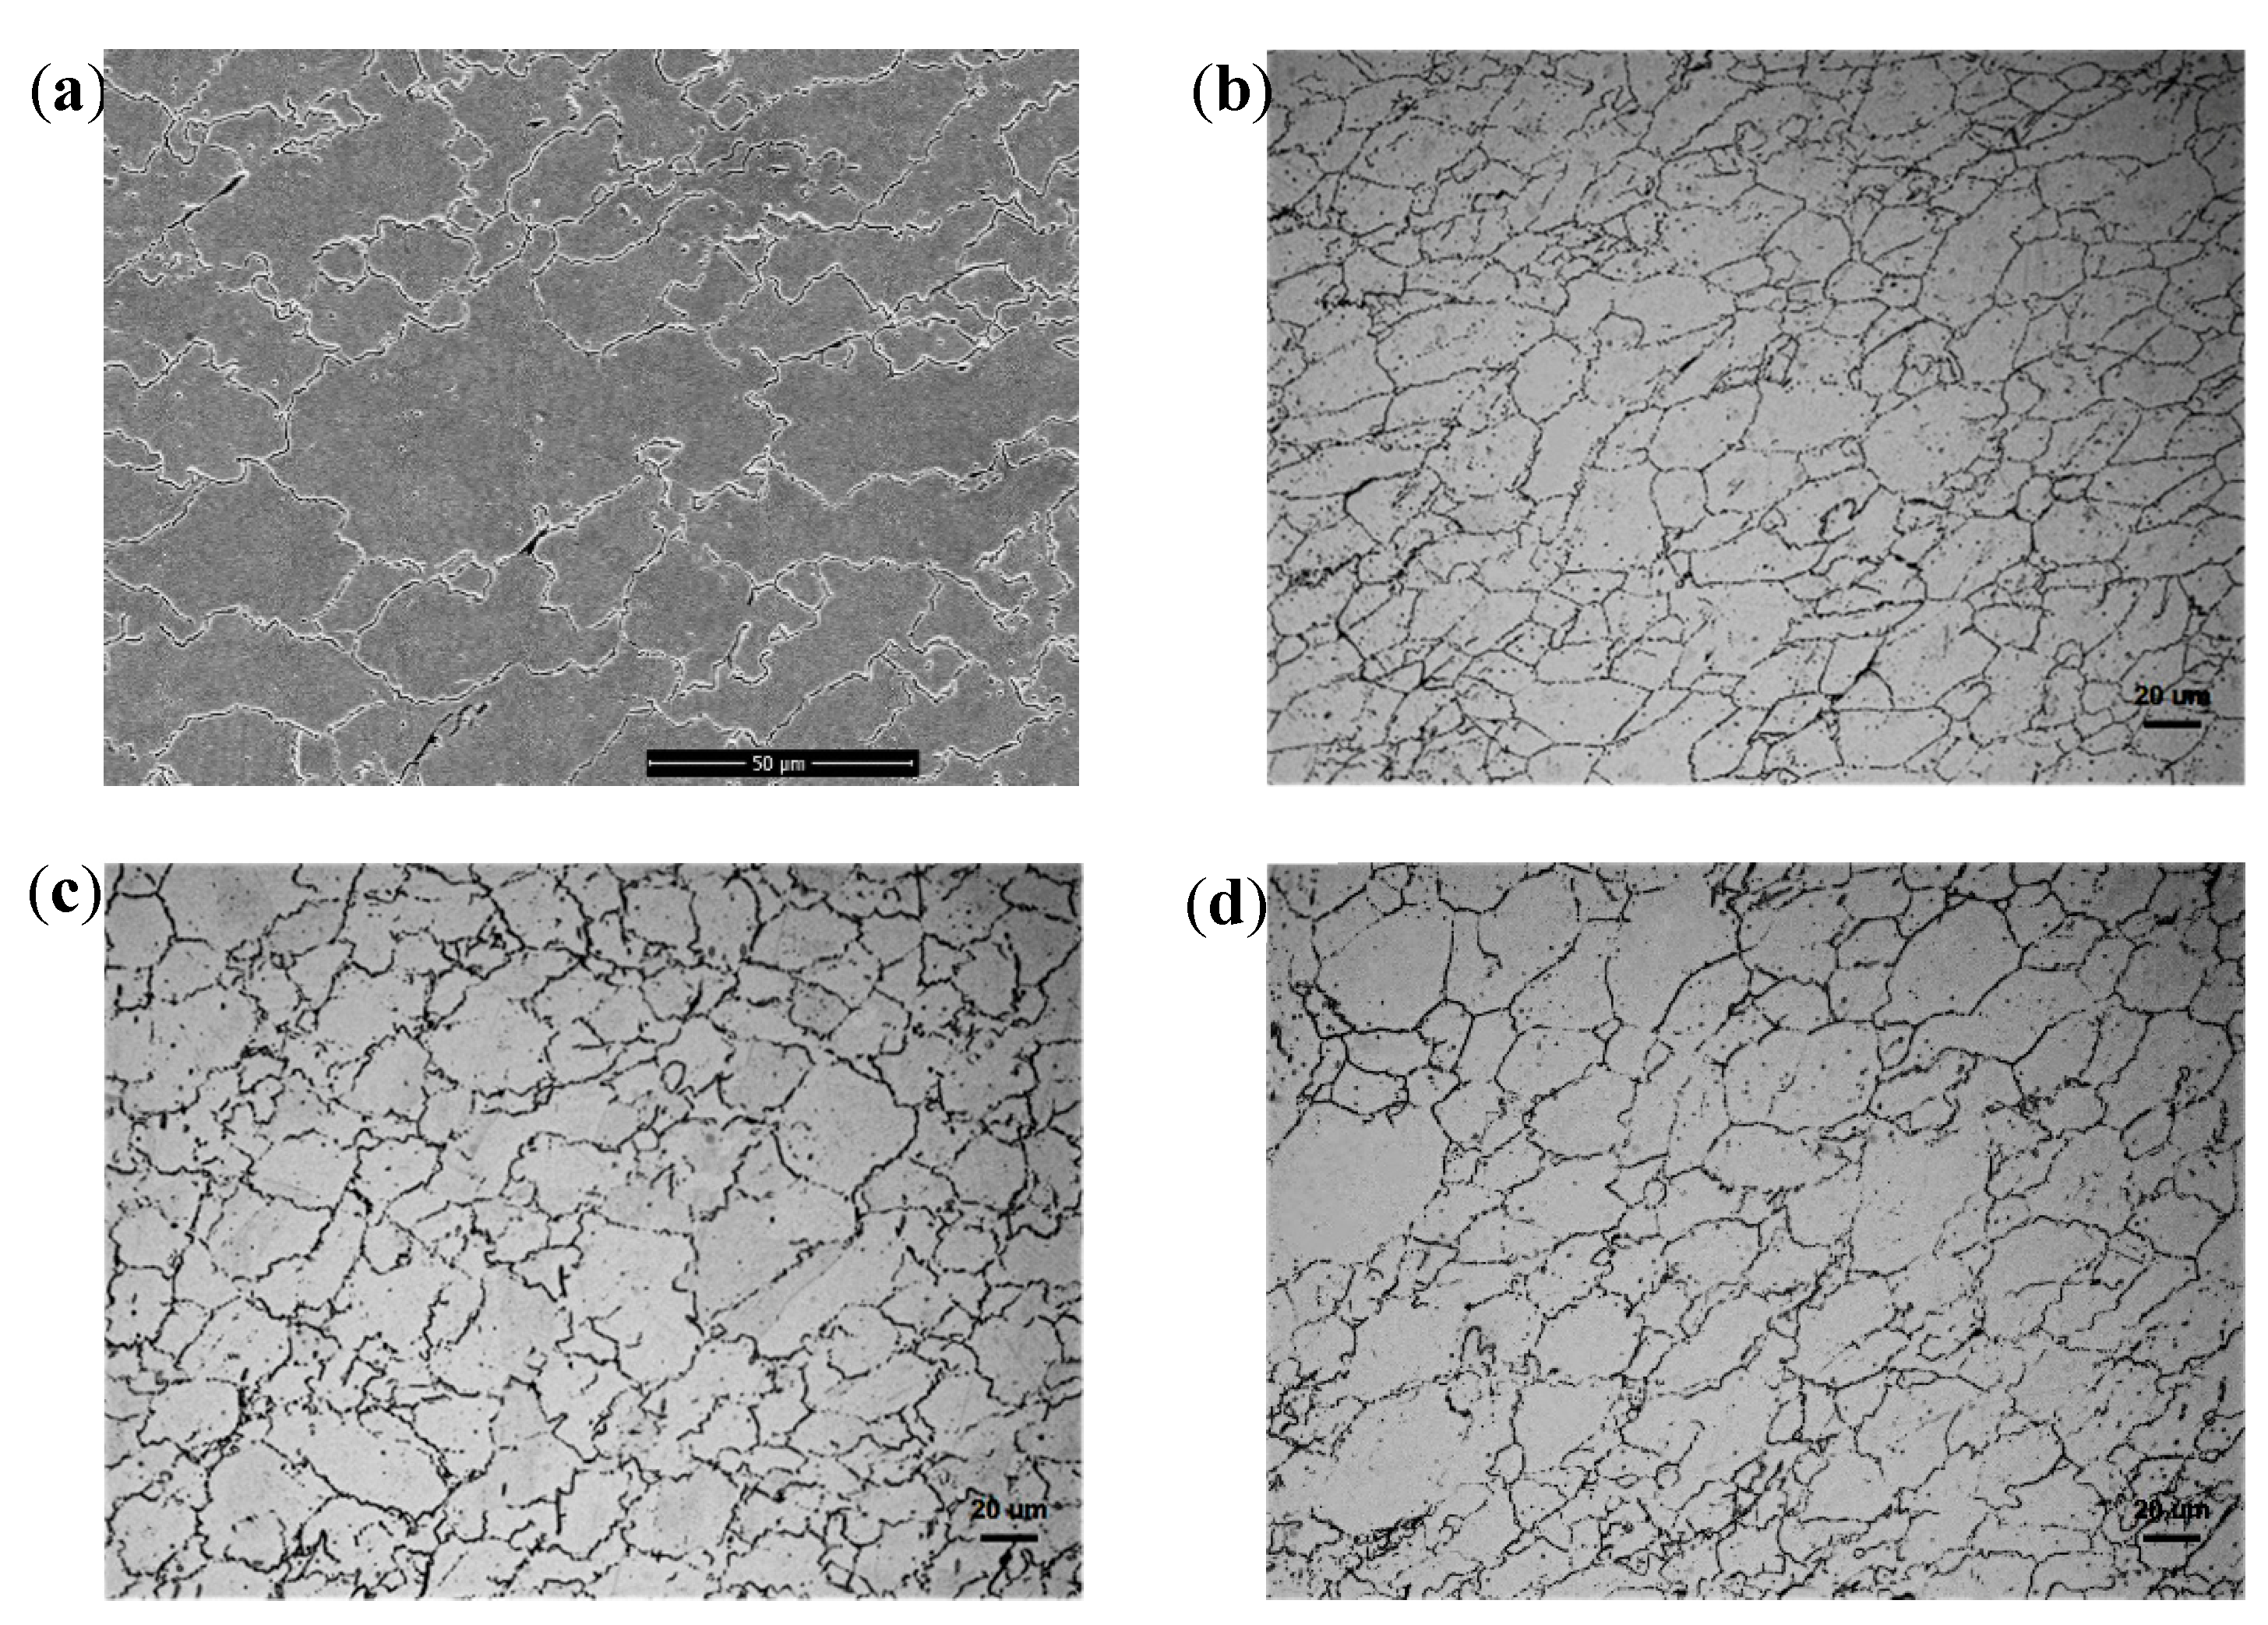
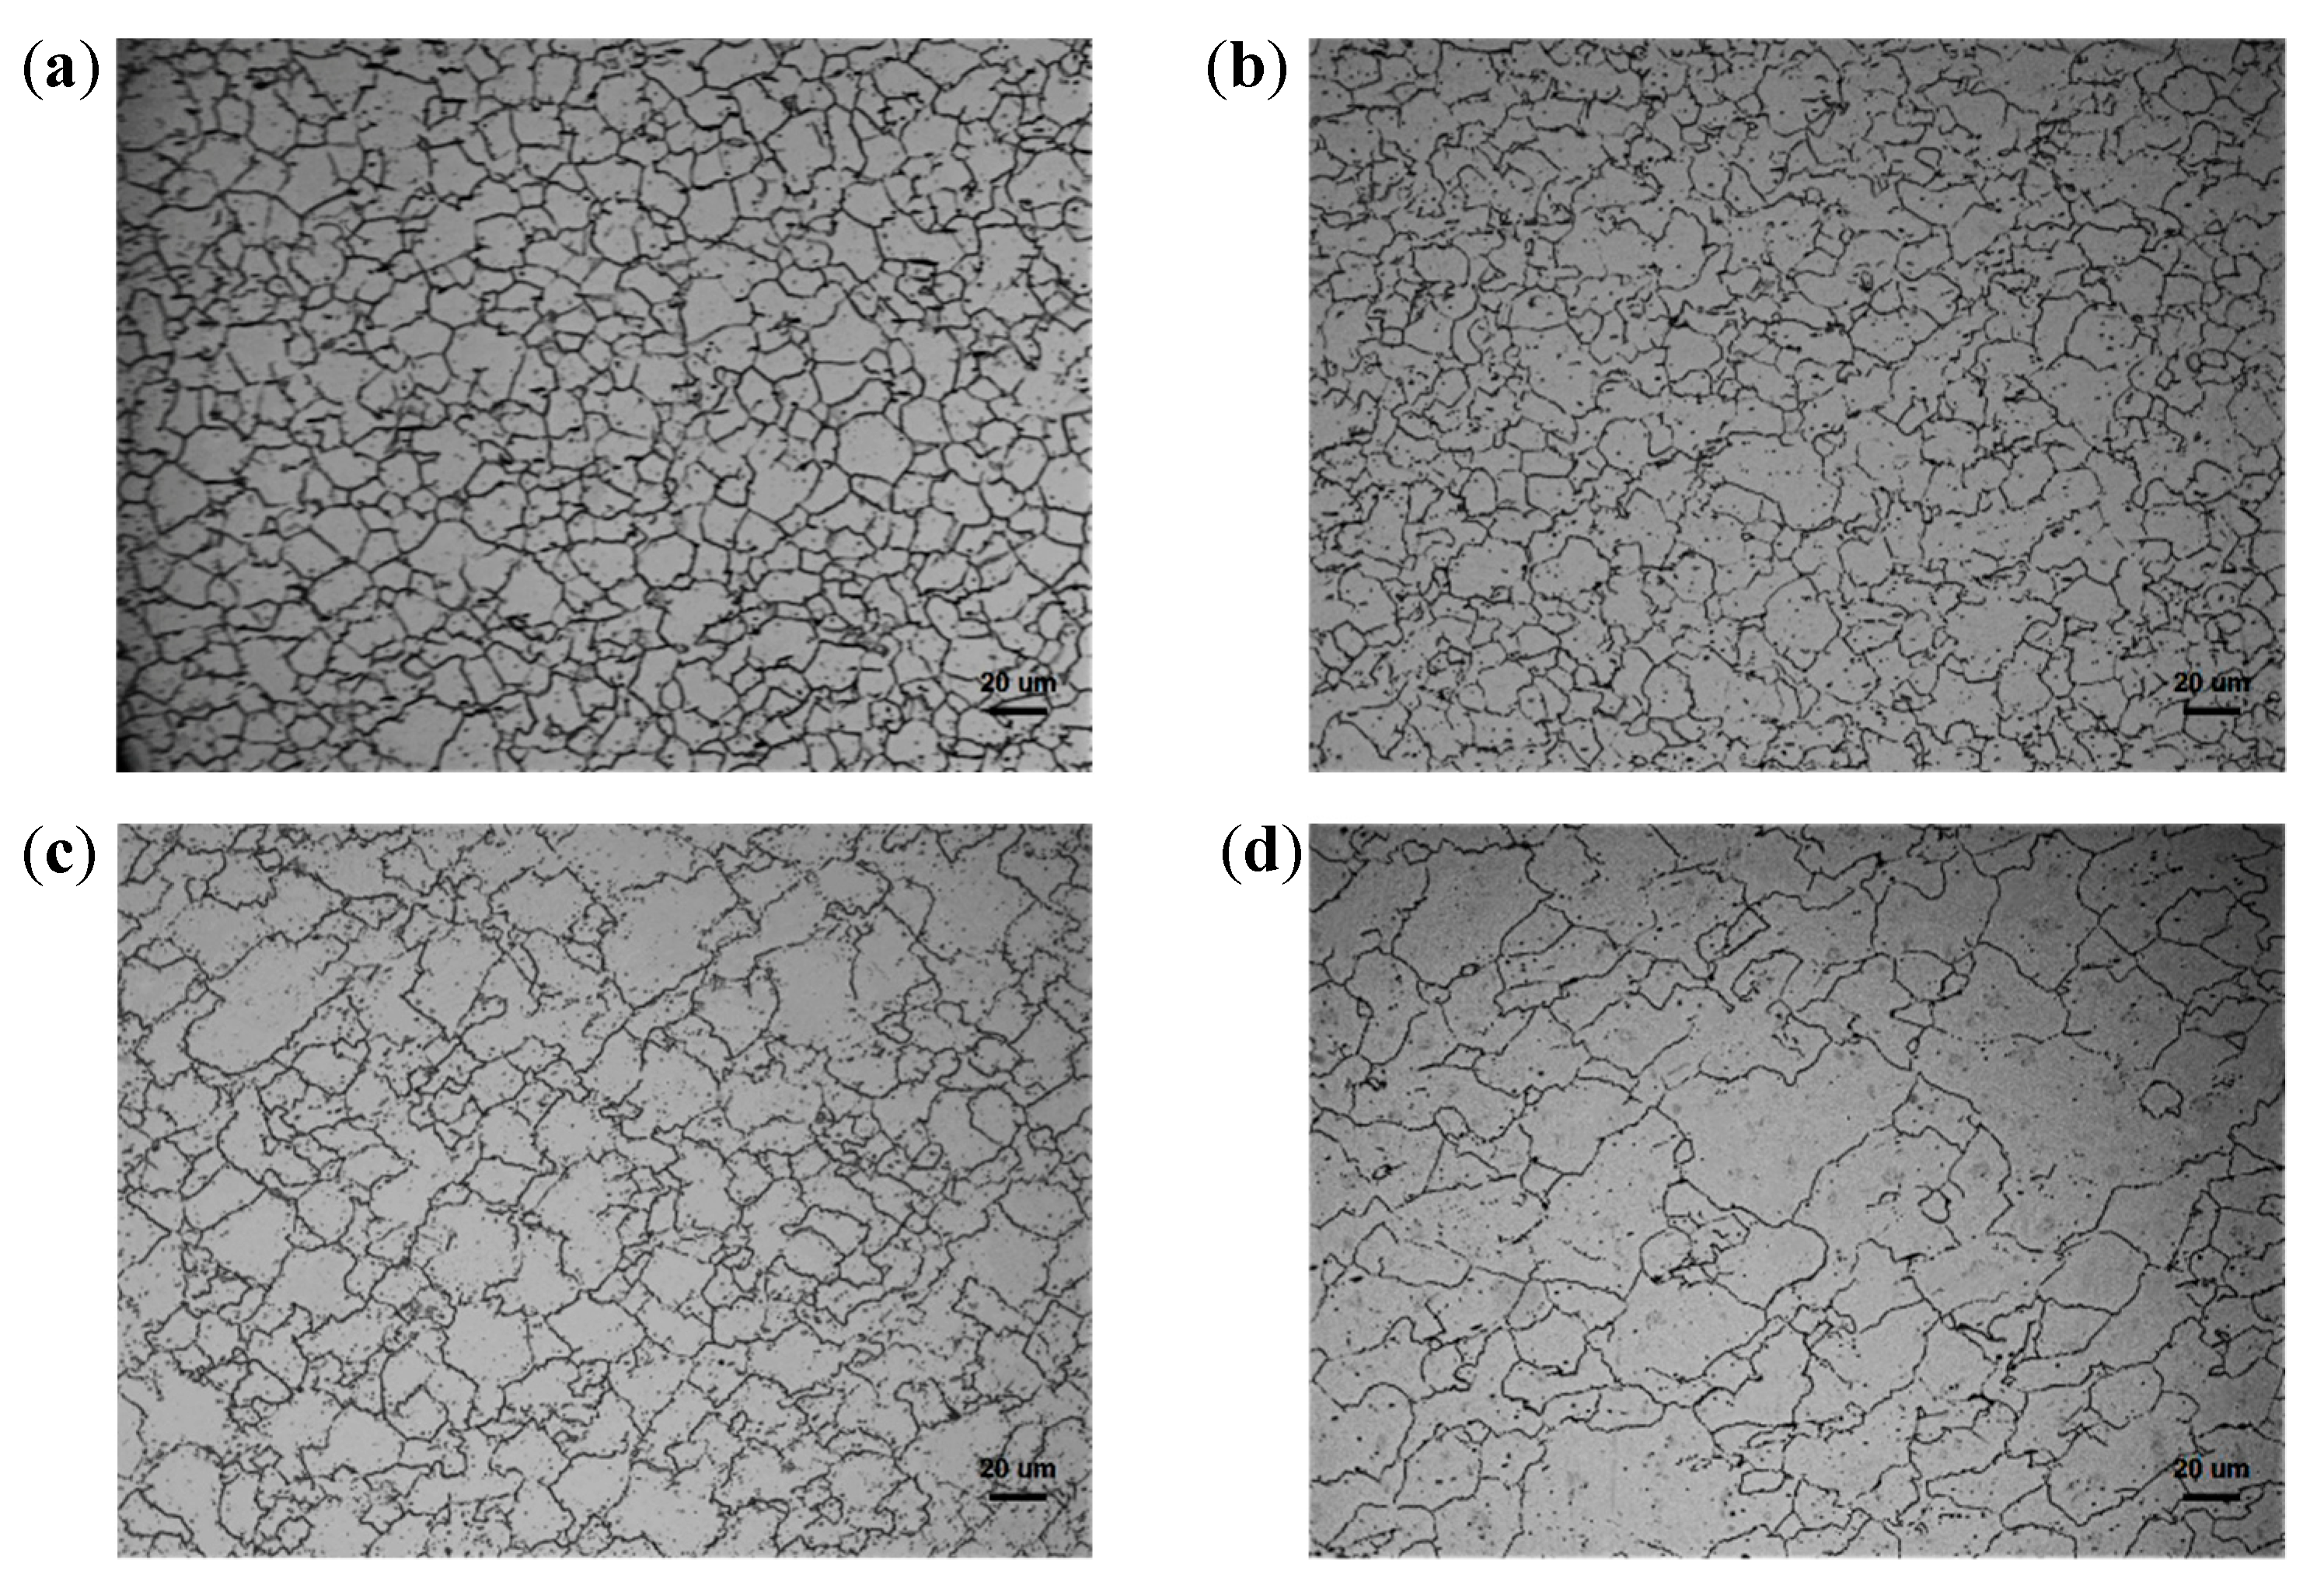
Figure 8 shows the TMAZ microstructure of specimens No.1–No.4. The TMAZ grain sizes of specimens No.1–No.4 are 50 μm, 30 μm, 32 μm and 40 μm, respectively. It should be noted that the TMAZ grain size of specimen No.1 shows obvious coarsening (nearly two times that of the BM). This is due to the energy-input of No.1, which is insufficient to induce partial DRX in the TMAZ. As Figure 5 shows, specimen No.1 experiences the shortest thermal cycle. Thus, the TMAZ grains of specimen No.1 mainly undergo torsion and elongation, which cause grain coarsening, as Figure 8a shows. However, as Figure 8b shows, with the energy-input increasing, the average TMAZ grain size of specimen No.2 decreases to 30 μm. The main reason for the grain size reduction is that partial DRX occurs in the TMAZ under the effect of welding thermal and plastic deformation. As the energy-input further increases, the thermal cycle grows longer, and the grains of the TMAZ grow under the thermal effect.
Figure 9 presents the WZ microstructure of different specimens. The average WZ grain size of specimens No.1–No.4 is 19 μm, 17 μm, 25 μm, and 40 μm, respectively. The WZ undergoes the most severe plastic deformation and the highest temperature thermal cycle compared to other zones, which results in adequate DRX occurring in this zone [16]. For specimens No.1 and No.2, the DRX results in the fine grain in the WZ. However, when the energy-input increases, the size of WZ grains increase due to the longer thermal cycle, which eventually results in the larger grains being generated in the WZ of specimen No.4.
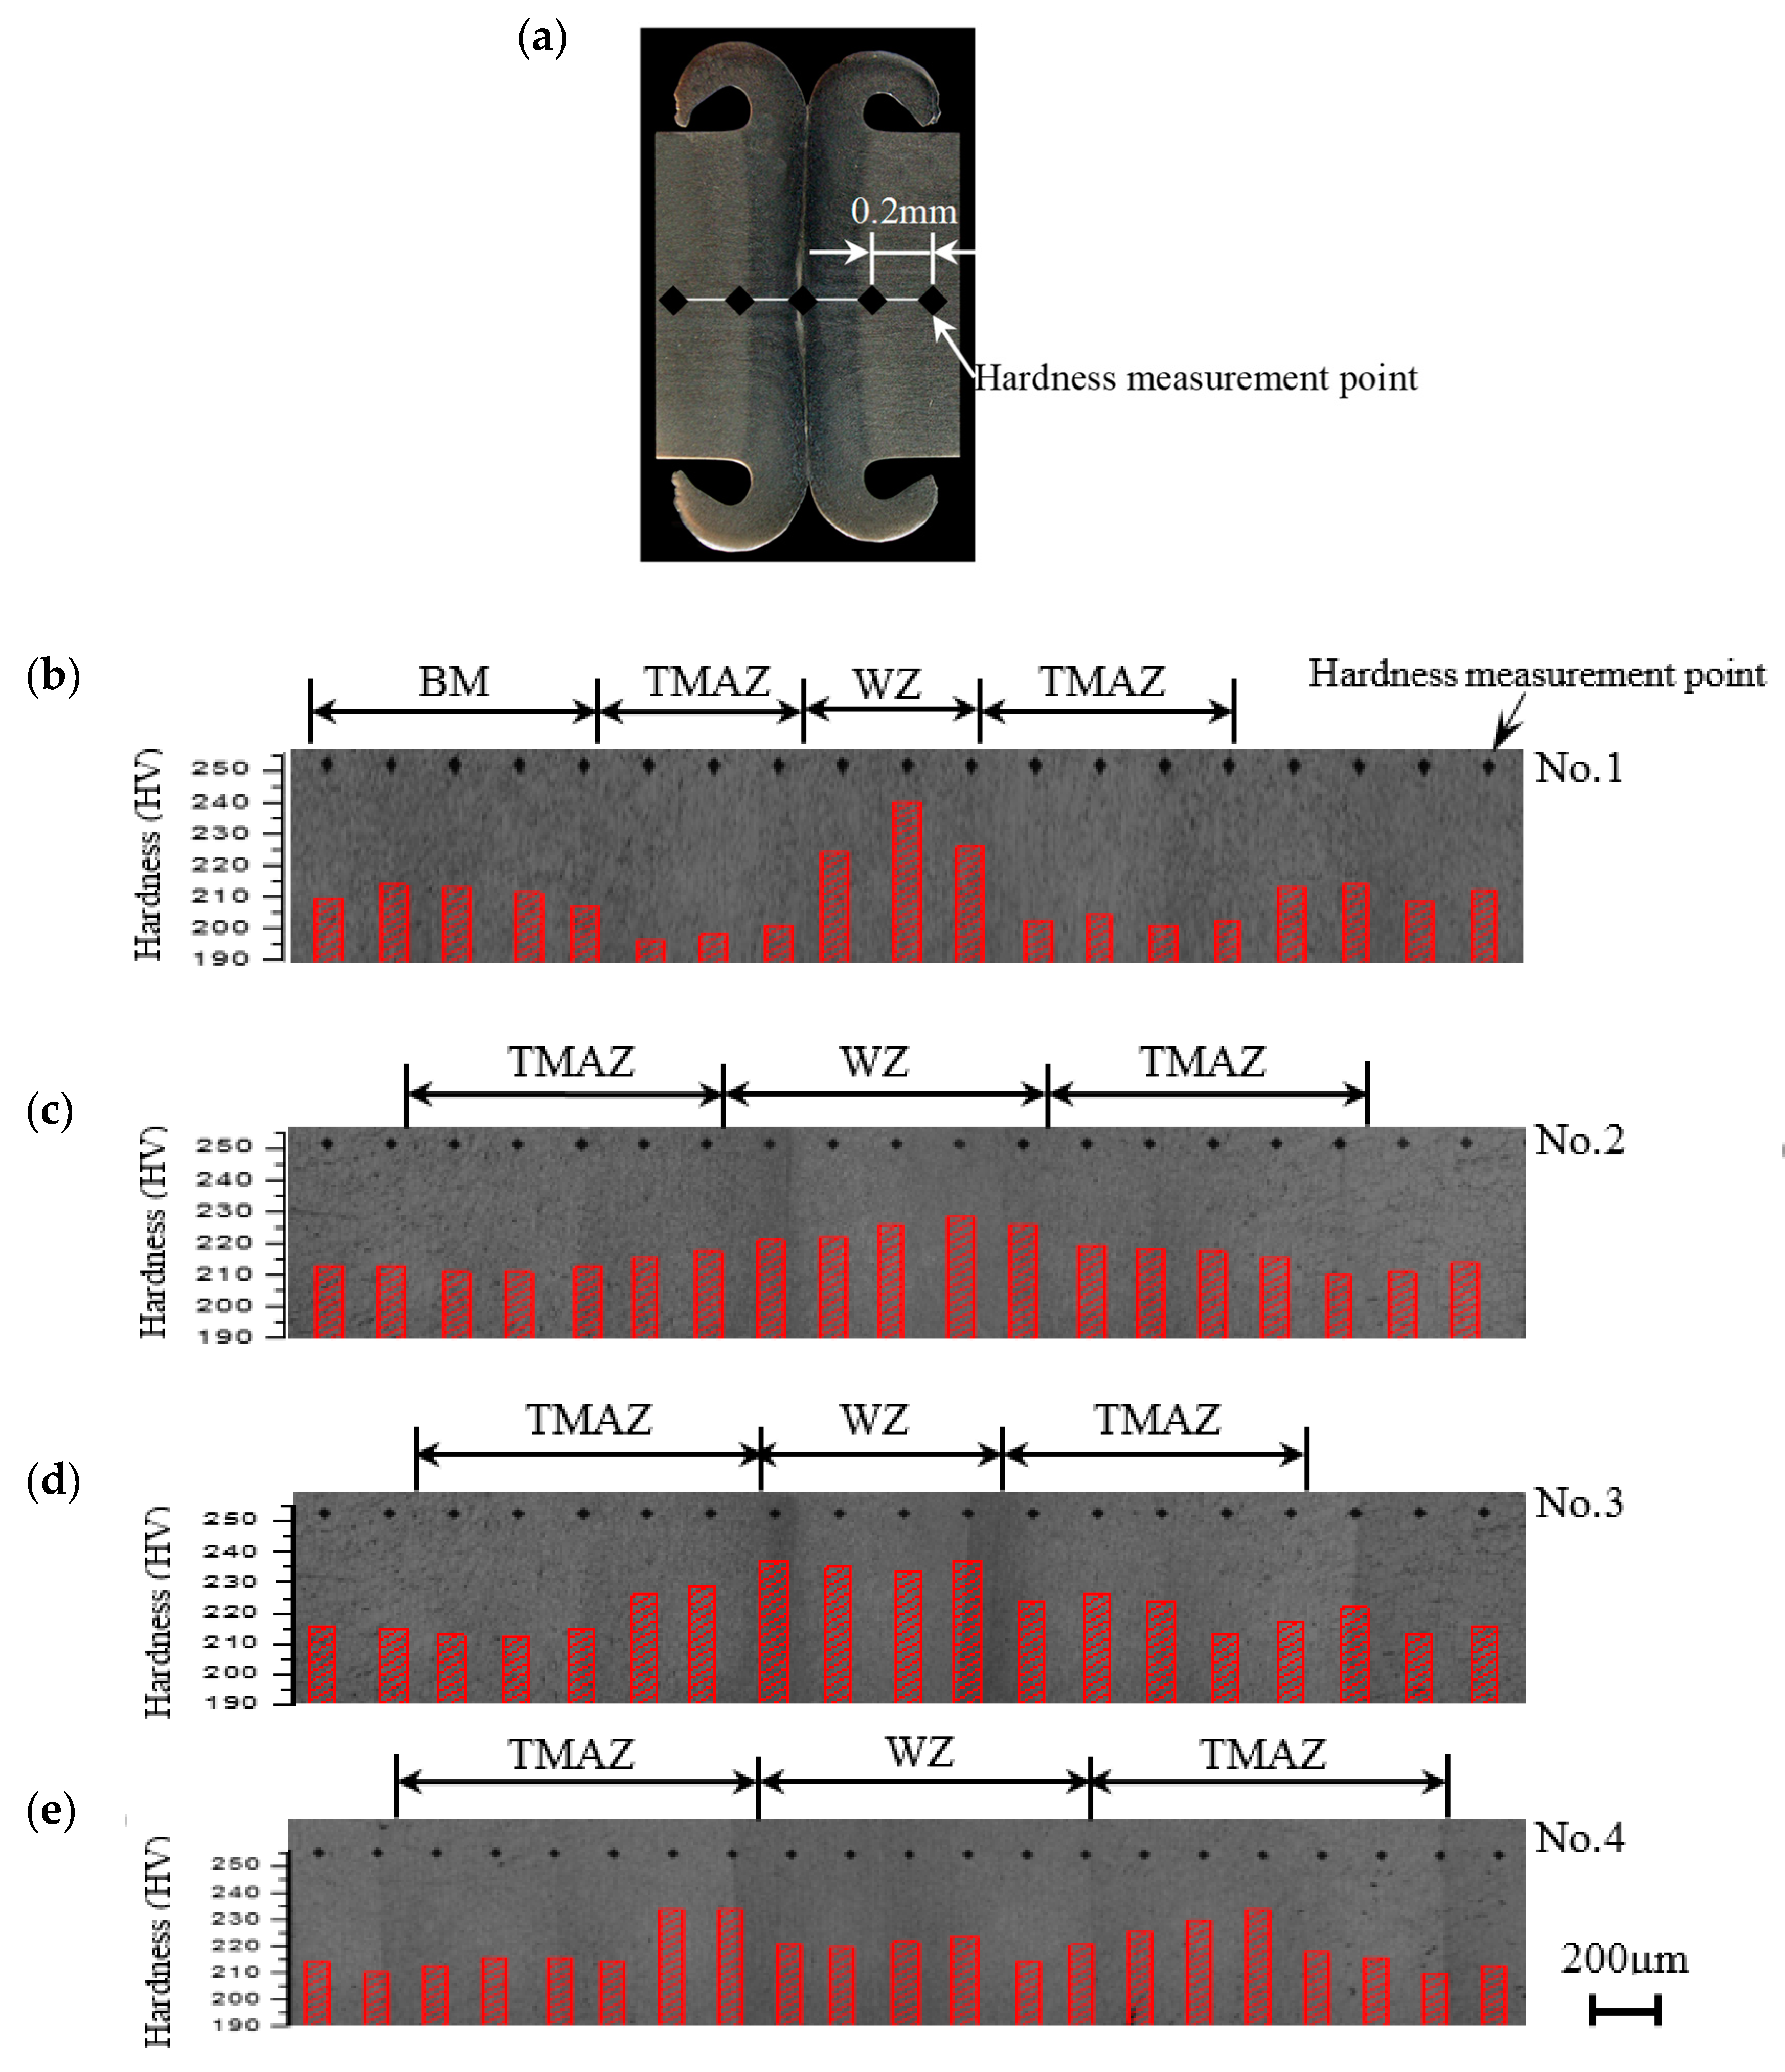
3.4. Hardness Distribution
The microhardness distribution throughout the welding surface from weld zone to base material was measured. Figure 10a illustrates the direction of microhardness measurement, the hardness of the WZ, TMAZ, HAZ, and BM, which were measured, respectively, for each joint. Figure 7b–e shows the microhardness distribution of different joints. The results show that the average hardness value of the BM is 213 Hv, and the average WZ hardness value of specimens No.1–No.4 were 252, 242, 230, and 218 Hv, respectively. It can be observed that the WZ hardness of all four specimens was higher than that of the BM. This is due to the strain hardening effect during the welding process [17]. In addition, the WZ of sample No.1 is the area with the highest hardness of the whole joint; the same result also exists in sample No.2. However, with the energy-input increasing, the highest hardness value of specimens No.3 and No.4 occurs in the TMAZ. This is due to the grain size of the WZ becoming large as the energy-input increases, as Figure 9 shows; moreover, the coarsening grains results in the decrease in hardness [18,19]. When the energy-input increases to 120 kJ, i.e., specimen No.4, the hardening of the WZ caused by strain is almost offset by the softening caused by grain growth [20]. Moreover, the plastic deformation in the TMAZ turns severely as the energy-input increases, which results in a more severe deformable hardening. It should be noted that an obvious softening phenomenon appeared in the TMAZ of specimen No.1. The lowest TMAZ hardness of specimen No.1 is 198 Hv, which decreases 7% compared with that of the BM. As discussed above, the average TMAZ grain size of specimen No.1 is nearly two times of that of the BM, which leads to a decrease in hardness. The low TMAZ hardness will make this zone a weak area of the joint, which we will discuss in next section. In addition, the TMAZ hardness of specimen No.2 is slightly higher than that of the BM. It also can be observed from Figure 10c that the hardness distribution of specimen No.2 is smooth and has no catastrophe point, which corresponds to the uniformity of the microstructure, as discussed in Section 3.2.
3.5. The Relationship of Tensile Specimen Fracture Zone and Energy-Input
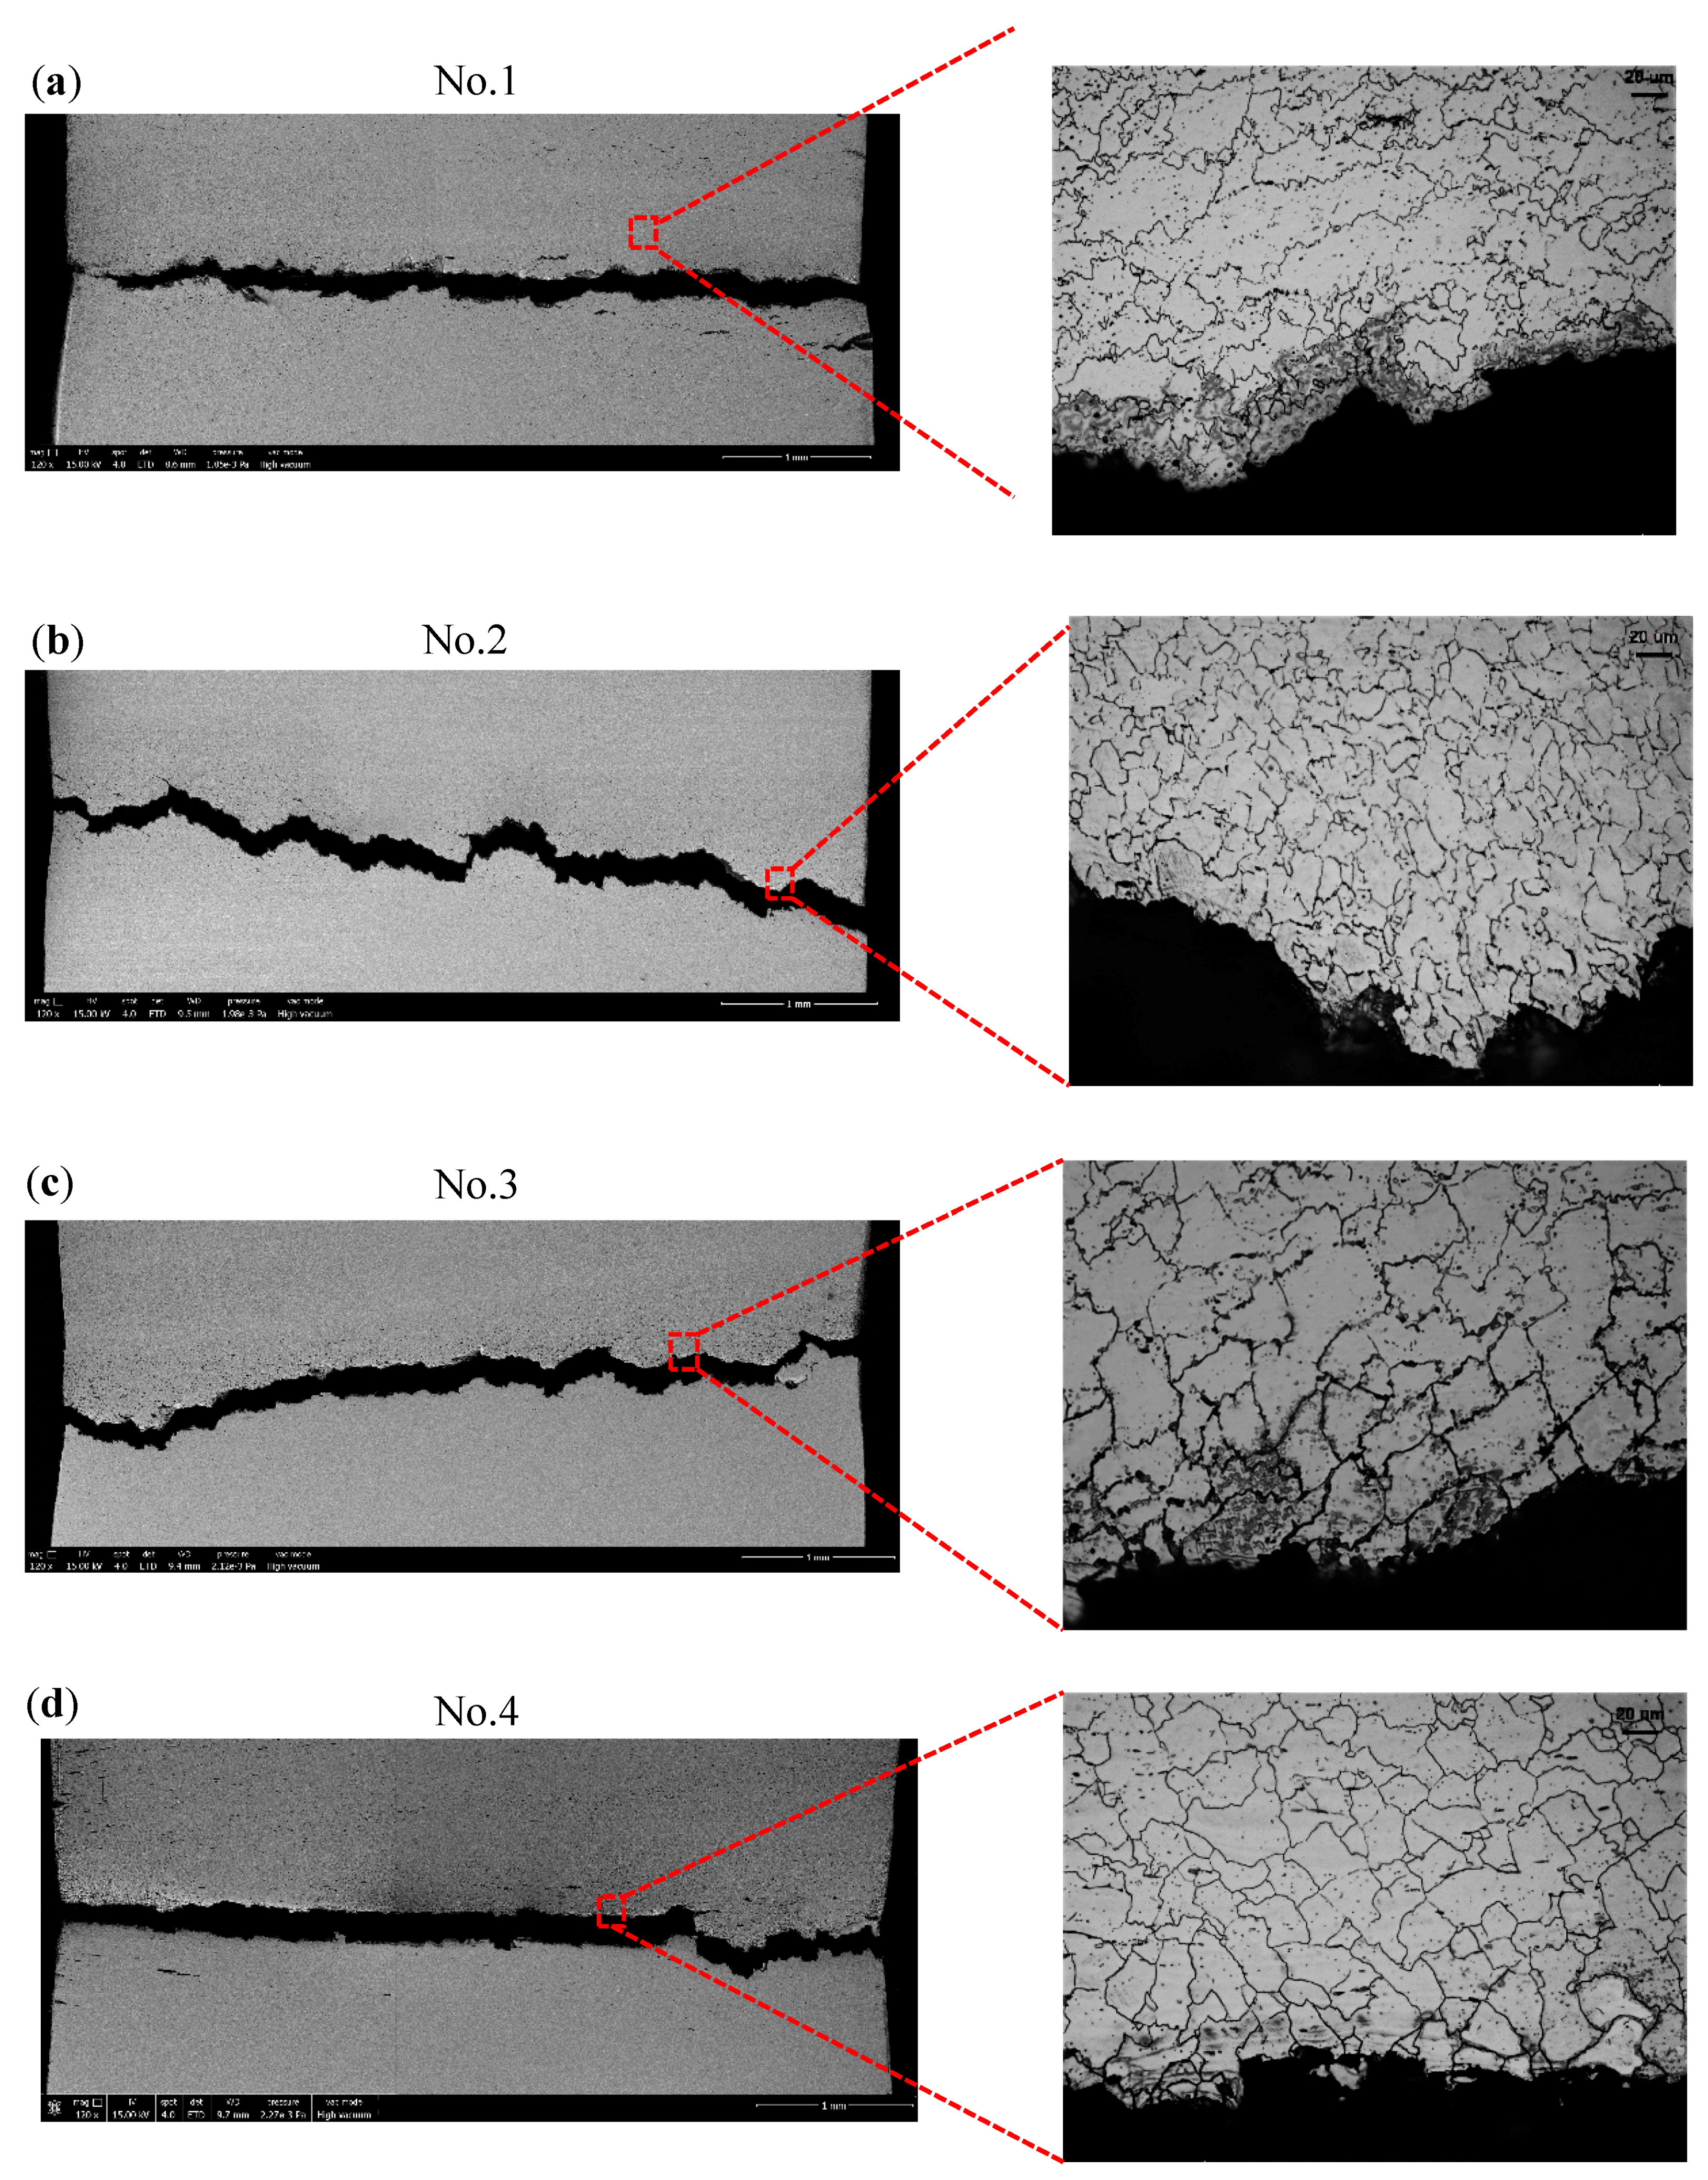
Figure 11 represents the morphology of the fracture tensile specimen and the microstructure near the fracture zone. From Figure 11a, it can be observed that the microstructure near the fracture zone of specimen No.1 is the elongated coarse grain. By comparing this microstructure to the TMAZ microstructure of specimen No.1, shown by Figure 8a, it is clear that the No.1 tensile specimen fractured at the TMAZ. As discussed above, the TMAZ average grain size of specimen No.1 is 50 μm, and the hardness of the TMAZ is 29% lower than that of BM. The coarse grain and low hardness lead to the TMAZ becoming the weak zone of joint No.1. When the energy-input increases, no obvious grain coarsening area and softening zone occurs in joint No.2, which gives the joint its excellent mechanical properties. Though the tensile specimen of No.2 also fractured at the TMAZ, the fracture surface of No.2 is a curvilinear form, and the tensile strength of joint No.2 is 698 MPa, which is 94% of that of the BM. As Figure 9c,d shows, the WZ grain size of joints No.3 and No.4 is obviously coarser than that of the BM, which results in the No.3 and No.4 tensile specimens fracturing at the WZ, as Figure 11c,d shows.
4. Modeling of the Energy-Input
To establish a model for energy-input with welding parameters as variables, we must first fit the energy-input curve as a quadratic function, i.e.,
in which Q is energy-input, t is welding time, and C0, C1, and C2 are fitting coefficients.
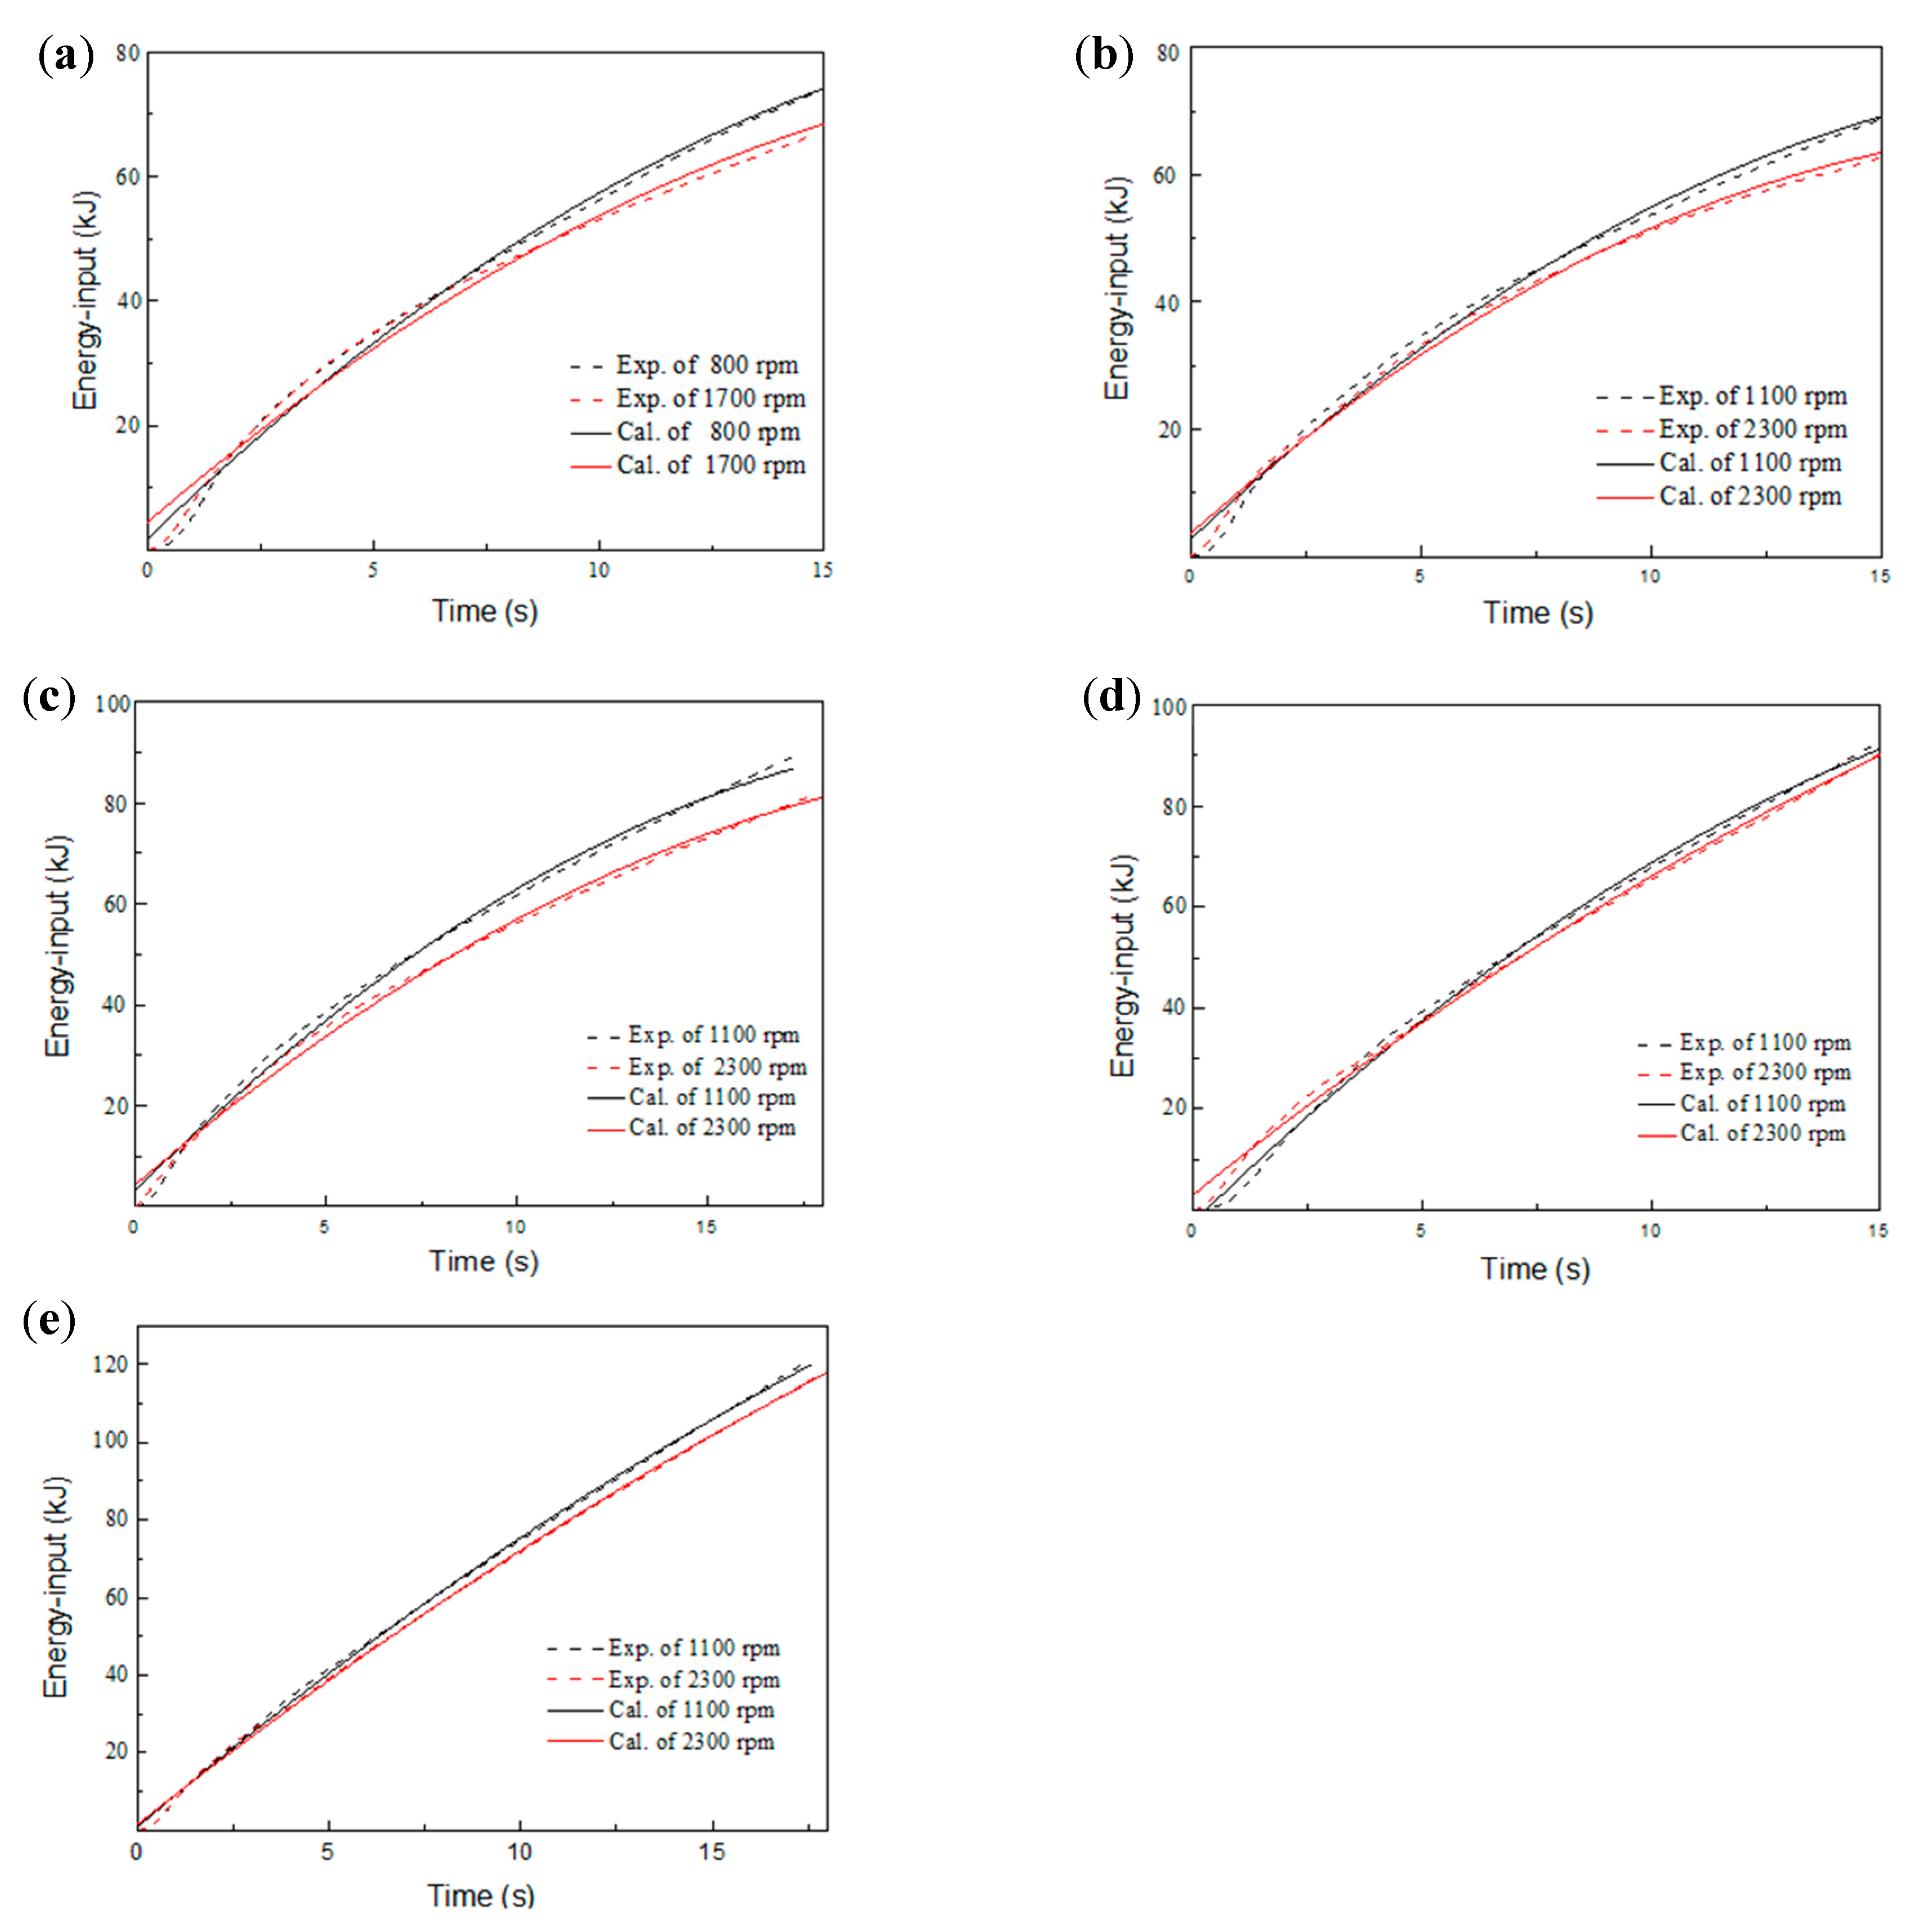
Figure 12 shows the comparison of the calculated curves and experimentally measured curves of energy-input. The fitting equation described by Equation (1) can be seen to fit very well with the experimental data of energy-input. Table 2 lists the values of fitting coefficients C0, C1, and C2 for different welding parameters.
The equation of C0, C1, and C2, in which the variables are welding pressure and rotation speed, can be obtained by regression analysis of the data in Table 2, i.e.,
Taking Equations (2)–(4) into account in Equation (1), the energy-input can be expressed as a formula of welding pressure, welding rotational speed, and welding time, i.e.,
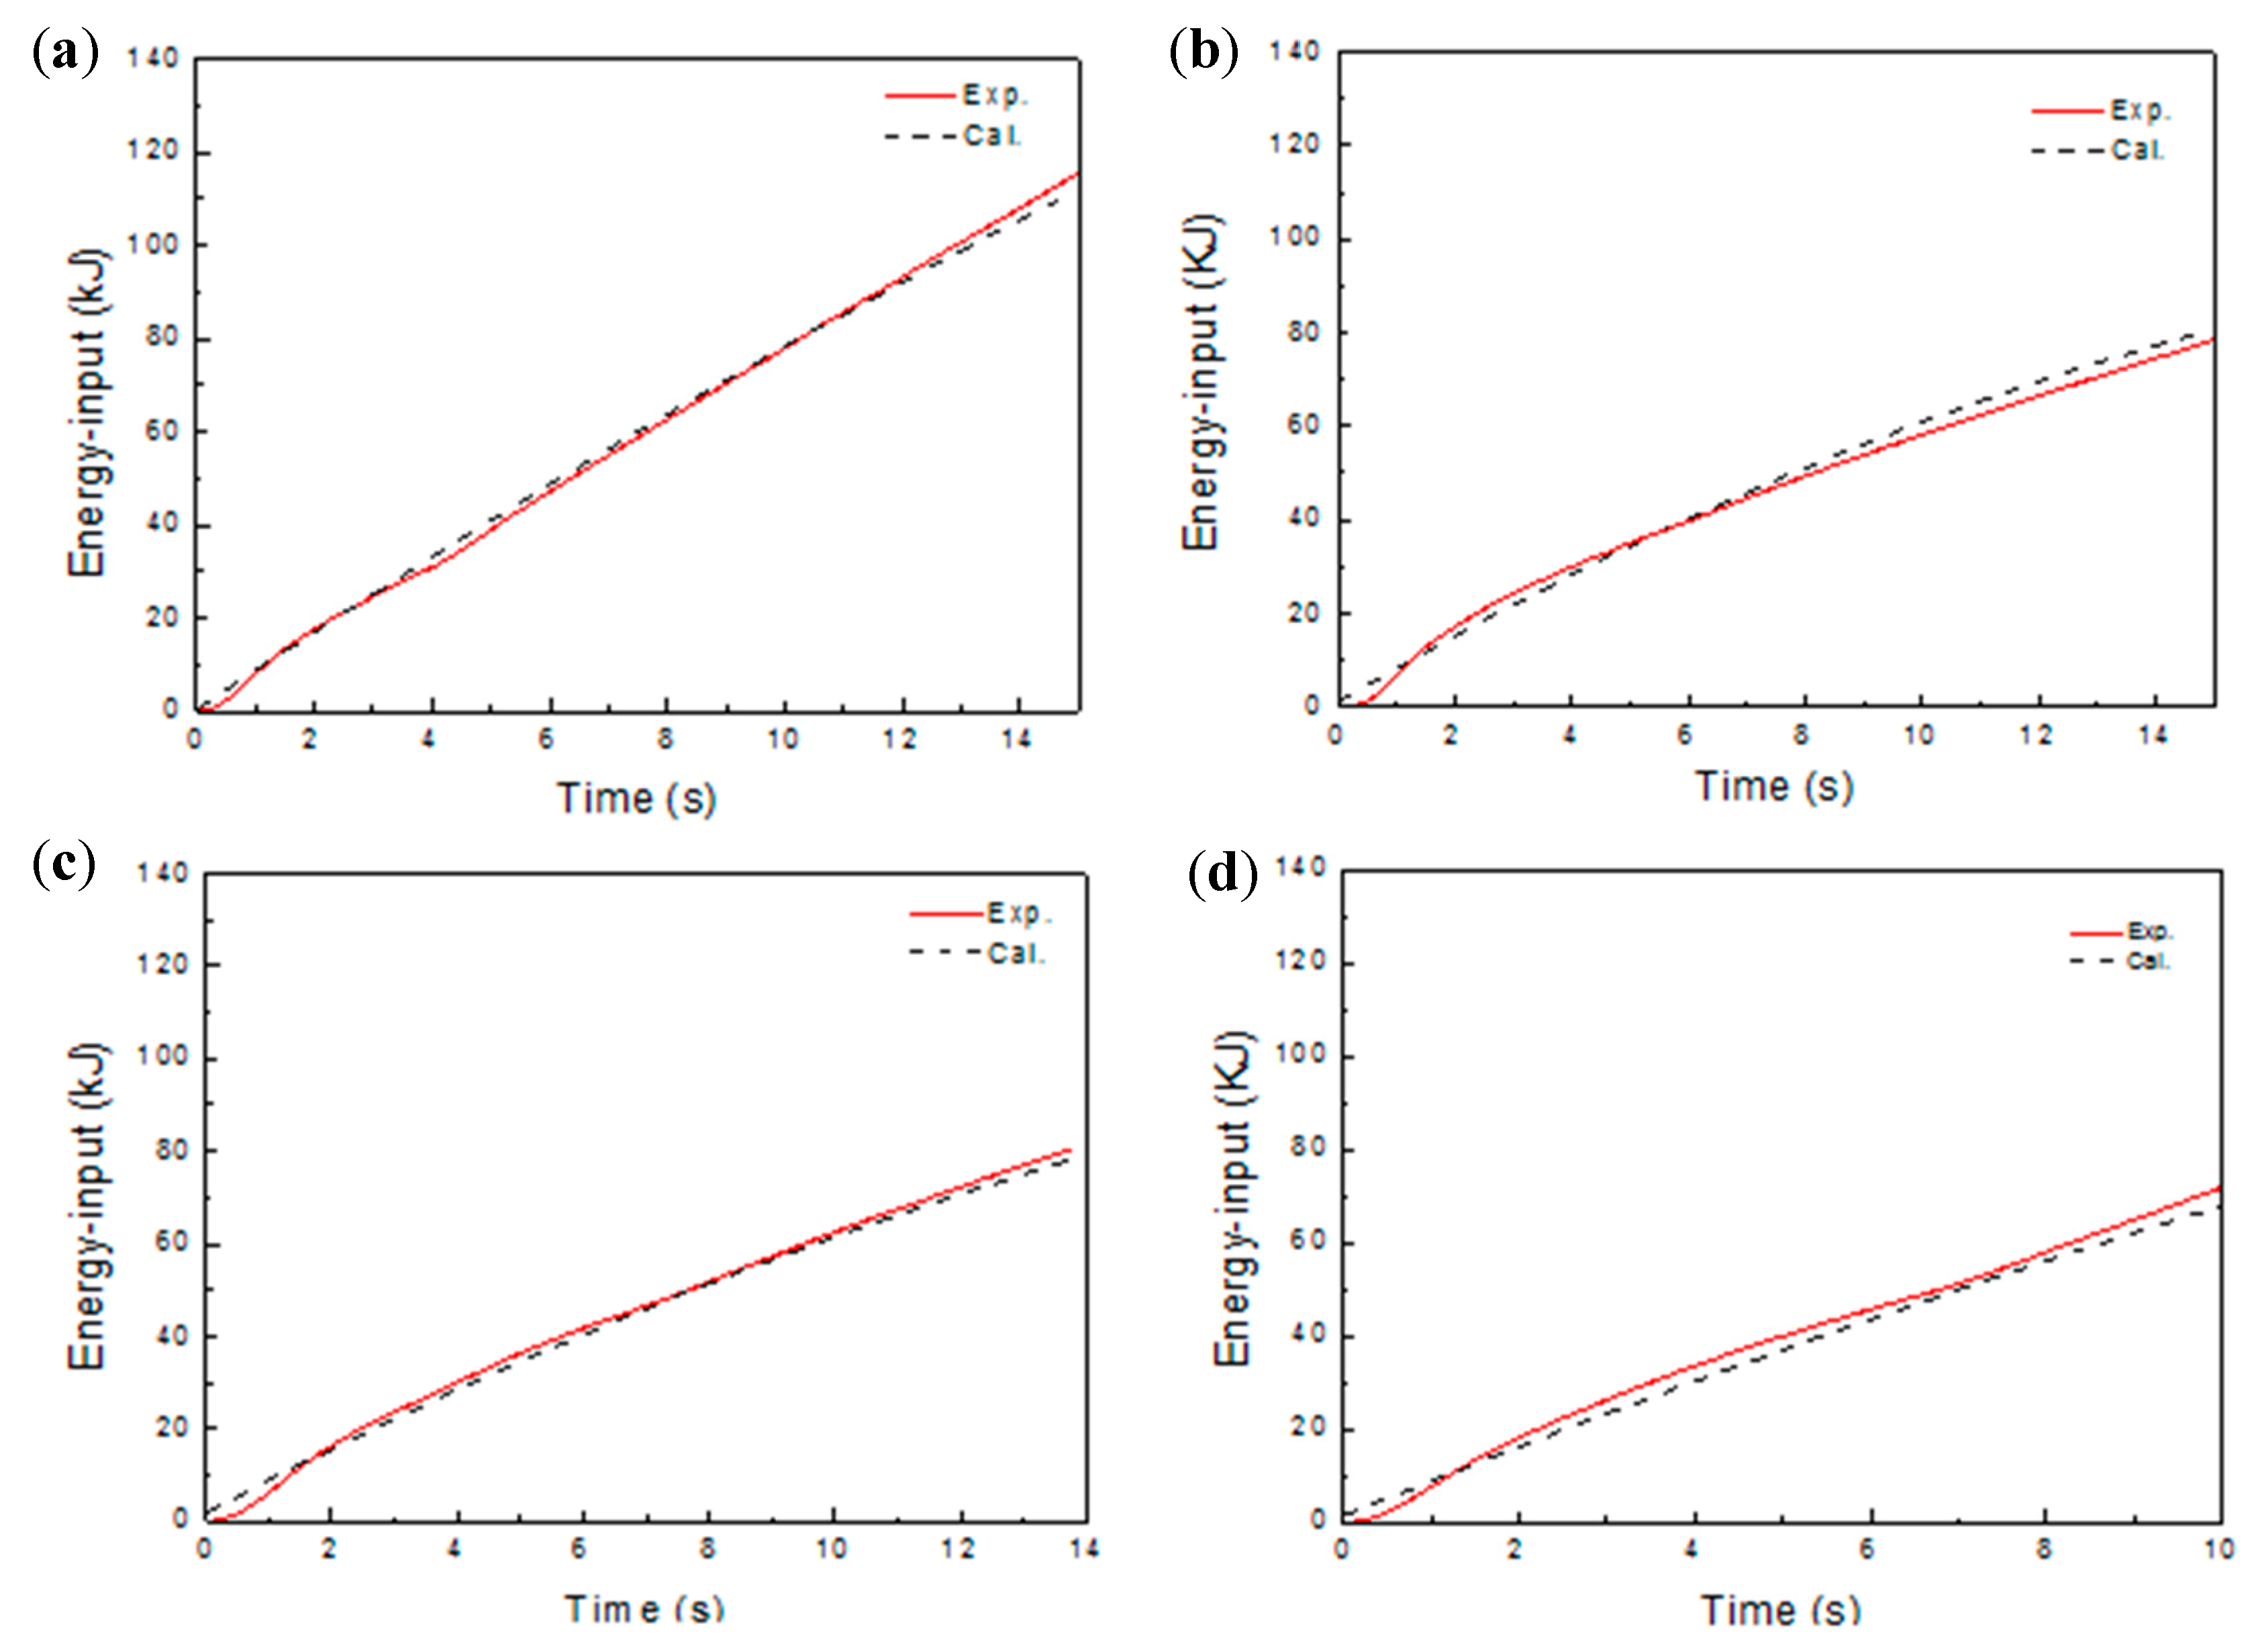
To verify the accuracy of the model, extra welds were made with new parameters. Figure 13 shows the comparison of the calculated and experimental curves. As the results show, the model closely predicts the actual energy-input data. As the weld experiments of Figure 13 were made with parameters that are outside of those used in creating the model, they demonstrate that the model accurately predicts the energy-input beyond the initially investigated parameters.
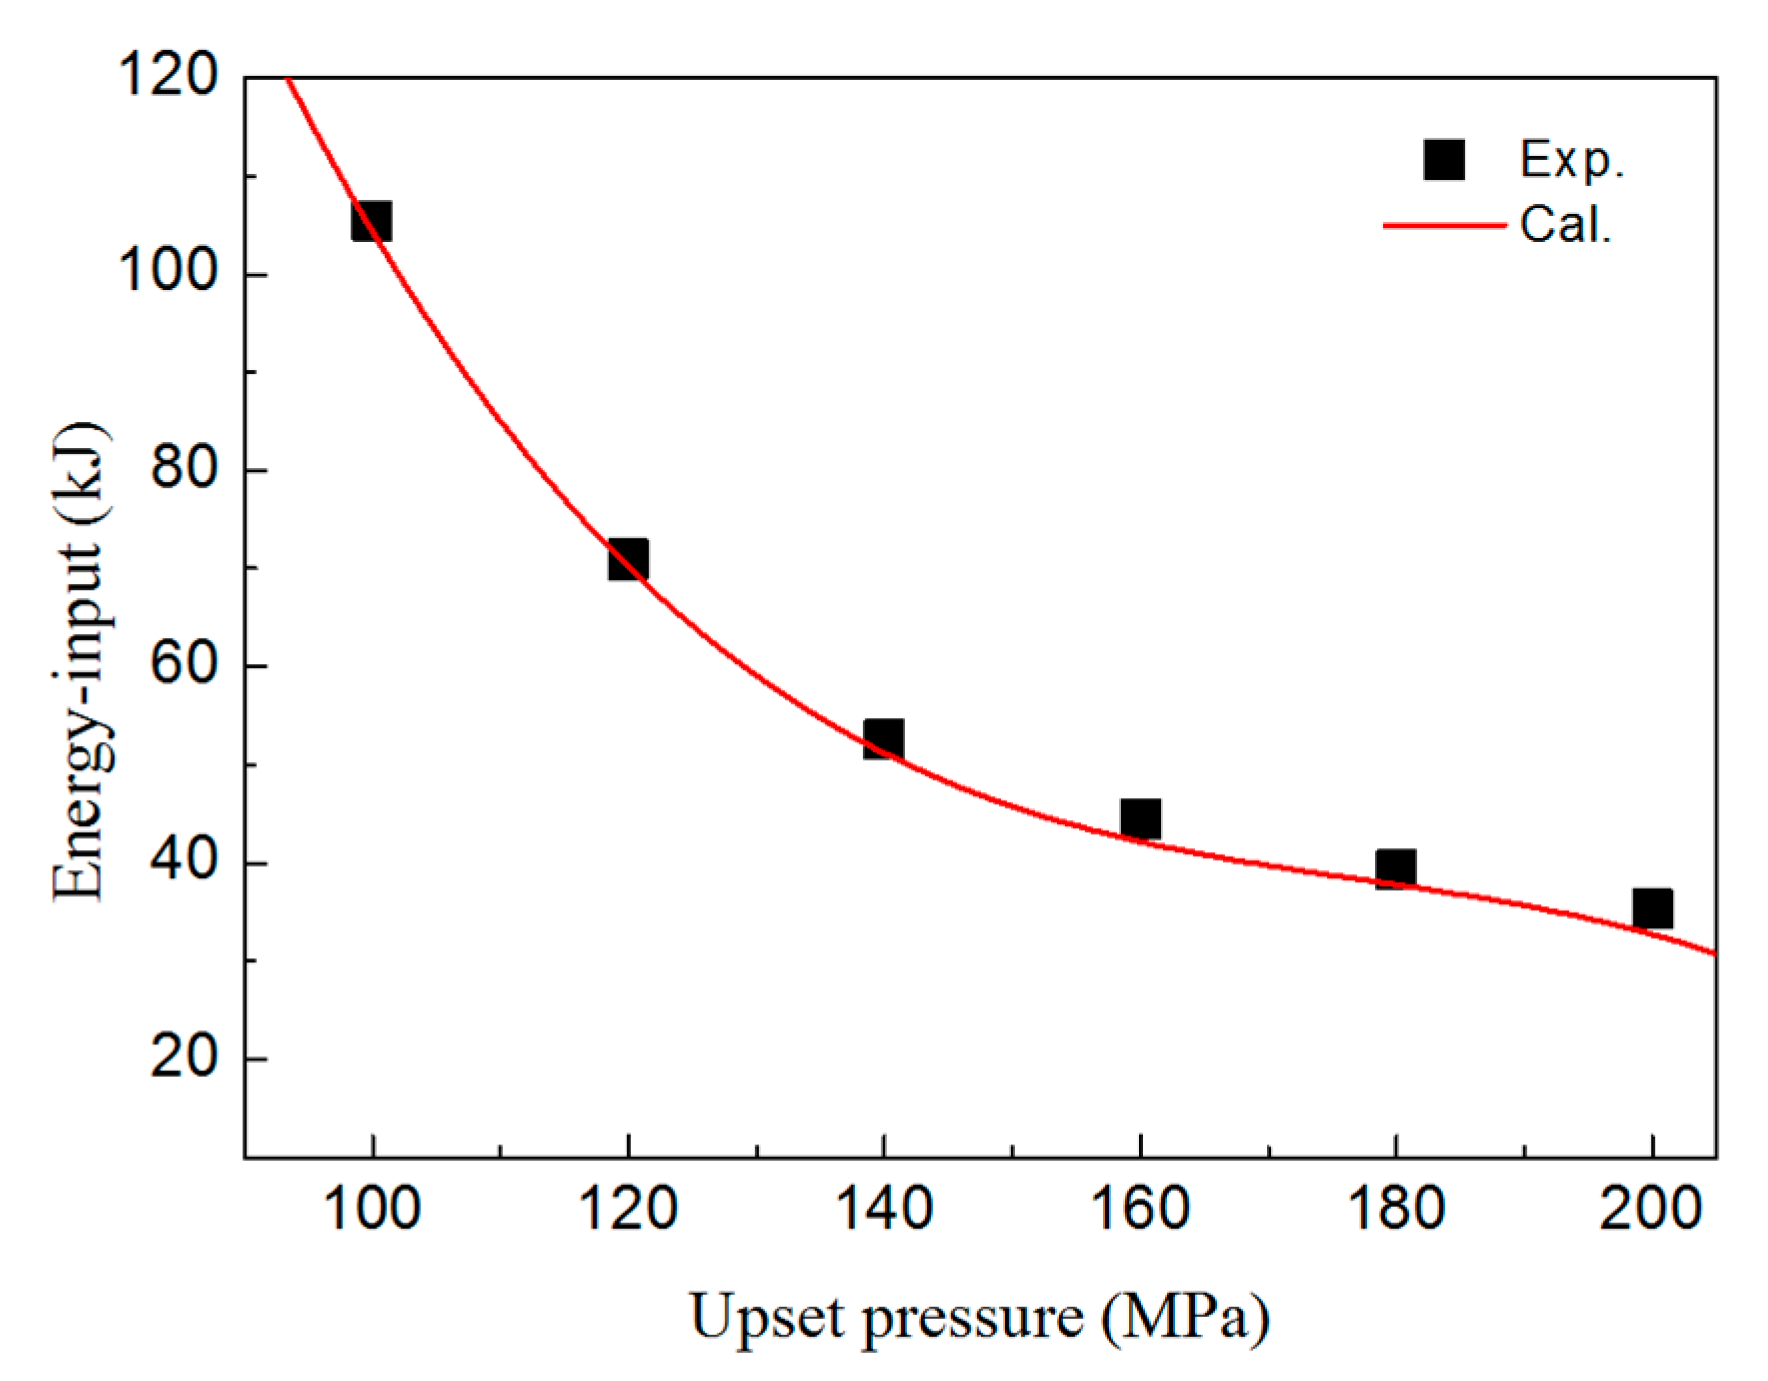
As discussed in Section 3.1, there is an optimal energy-input value that causes the joints to have the maximum tensile strength under different forging pressures. Figure 14 shows the variation trend of optimal energy-input for different forging pressures. The results indicate that the larger the forging pressure, the less the optimal energy-input. The optimal energy-input decreases from 105 kJ to 35 kJ when the forging pressure rises from 100 MPa to 200 MPa. The deformation is a necessary factor for forming a RFW joint [21]. When the forging pressure is large, the joint is easily deformed, which means a small amount of energy-input could obtain a stable joint [14,22]. As seen in Figure 14, a three-order function fits the experimental data very well, which is in the following form:
in which pf is the forging pressure.
Extra experiments under a forging pressure of 170 MPa, which are not included in those used in establishing the model, were made to verify the accuracy of Equation (6). Firstly, the optimal energy-input for a forging pressure of 170 MPa was calculated based on Equation (6), which was 41 kJ. Subsequently, two welding parameters (welding pressure, and speed and time) were randomly set, and the other parameter can be calculated according to Equation (5). In this study, three group experiments were made to verify the calculated optimal energy-input accuracy or otherwise disprove it. The welding pressure and rotational speed of first group was 100 MPa and 1300 rpm, respectively, and the calculated welding time was 6.1 s. The welding pressure and welding time of the second group was 40 MPa and 8 s, respectively, and the calculated rotational speed was 2000 rpm. The rotational speed and welding time of third group was 800 rpm and 5 s, respectively, and the calculated welding pressure was 160 MPa. Table 3 shows the welding parameters and tensile strength of these three verified experiments. As shown in Table 3, the strength of all the three joints was over 90% that of the BM. It is proven that the optimal energy-input model (Equation (6)) is accurate.
5. Conclusions
In this study, the effect of energy-input on the mechanical properties of RFW 304SS joints was investigated. RFW experiments were conducted over a wide range of welding parameters. Based on the results and discussion above, the conclusions are as follows:
- (1)
- When forging pressure is kept constant, the tensile strength increases with the increase of energy-input until reaching a maximum and then decreases.
- (2)
- Though the maximum temperature has no obvious variation regularity with the change of energy-input, the thermal cycle has a positive correlation with the increase of energy-input, i.e., as energy-input increases, the duration time from the commencement of welding to joint cooling to room temperature increases.
- (3)
- An empirical model was established that describes energy-input as a function of the welding parameters. The accuracy of the model was verified by extra RFW experiments.
- (4)
- An empirical model for the optimal energy-input of different forging pressures was obtained. Then, the optimal energy-input for 170 MPa forging pressure was calculated. Three group experiments were made based on the calculated energy-input value. The joints’ tensile strength coefficients of these three experiments were 93%, 90%, and 96%, respectively. The results proved the accuracy of the model for optimal energy-input.
Author Contributions
J.L., F.Z. and G.W. conceived and designed the experiments. G.W. and W.W. carried out the experiments. J.X. and G.W. analyzed the experimental data. G.W. wrote the manuscript. J.L., F.Z. and J.X. reviewed the manuscript.
Funding
This work is supported by the National Natural Science Foundation of China (Grand No: 51475376 and 51575451).
Conflicts of Interest
The authors declare no conflict of interest.
References
- Bouarroudj, E.; Chikh, S.; Abdi, S.; Miroud, D. Thermal analysis during a rotational friction welding. Appl. Therm. Eng. 2017, 110, 1543–1553. [Google Scholar] [CrossRef]
- Li, W.Y.; Vairis, A.; Preuss, M.; Ma, T.J. Linear and rotary friction welding review. Int. Mater. Rev. 2016, 61, 71–100. [Google Scholar] [CrossRef]
- Maalekian, M. Friction welding–critical assessment of literature. Sci. Technol. Weld Join. 2007, 12, 738–759. [Google Scholar] [CrossRef]
- Li, P.; Li, J.L.; Li, X.; Xiong, J.T.; Zhang, F.S.; Liang, L. A study of the mechanisms involved in initial friction process of continuous drive friction welding. J. Adhes. Sci. Technol. 2015, 29, 1246–1257. [Google Scholar] [CrossRef]
- Sahin, M. Evaluation of the joint-interface properties of austenitic-stainless steels (AISI 304) joined by friction welding. Mater. Des. 2007, 28, 2244–2250. [Google Scholar] [CrossRef]
- Sathiya, P.; Aravindan, S.; Haq, A.N. Some experimental investigations on friction welded stainless steel joints. Mater. Des. 2008, 29, 1099–1109. [Google Scholar] [CrossRef]
- Ates, H.; Turker, M.; Kurt, A. Effect of friction pressure on the properties of friction welded MA956 iron-based superalloy. Mater. Des. 2007, 28, 948–953. [Google Scholar] [CrossRef]
- Li, W.Y.; Wang, F.F. Modeling of continuous drive friction welding of mild steel. Sci. Eng. A-Struct. 2011, 528, 5921–5926. [Google Scholar] [CrossRef]
- Chander, G.S.; Reddy, G.M.; Rao, A.V. Influence of Rotational Speed on Microstructure and Mechanical Properties of Dissimilar Metal AISI 304-AISI 4140 Continuous Drive Friction Welds. J. Iron Steel Res. Int. 2012, 19, 64–73. [Google Scholar] [CrossRef]
- Palanivel, R.; Laubscher, R.F.; Dinaharan, I. An investigation into the effect of friction welding parameters on tensile strength of titanium tubes by utilizing an empirical relationship. Measurement 2017, 98, 77–91. [Google Scholar] [CrossRef]
- Maalekian, M.; Kozeschnik, E.; Brantner, H.P.; Ceriak, H. Comparative analysis of heat generation in friction welding of steel bars. Acta Mater. 2008, 56, 2843–2855. [Google Scholar] [CrossRef]
- Guo, W.; You, G.Q.; Yuan, G.Y.; Zhang, X.L. Microstructure and mechanical properties of dissimilar inertia friction welding of 7A04 aluminum alloy to AZ31 magnesium alloy. J. Alloy Compd. 2017, 695, 3267–3277. [Google Scholar] [CrossRef]
- Xiong, J.T.; Zhou, W.; Li, J.L.; Zhang, F.S.; Huang, W.D. The thermodynamic analytical models for steady-state of linear friction welding based on the maximum entropy production principle. Mater. Des. 2017, 129, 53–62. [Google Scholar] [CrossRef]
- Sahin, M. Characterization of properties in plastically deformed austenitic-stainless steels joined by friction welding. Mater. Des. 2009, 30, 135–144. [Google Scholar] [CrossRef]
- Xiong, J.T.; Li, J.L.; Wei, Y.N.; Zhang, F.S.; Huang, W.D. An analytical model of steady-state continuous drive friction welding. Acta Mater. 2013, 61, 1662–1675. [Google Scholar] [CrossRef]
- Hazra, M.; Rao, K.S.; Reddy, G.M. Friction welding of a nickel free high nitrogen steel: Influence of forge force on microstructure, mechanical properties and pitting corrosion resistance. J. Mater. Res. Technol. 2014, 3, 90–100. [Google Scholar] [CrossRef]
- Li, P.; Li, J.L.; Salman, M.; Liang, L.; Xiong, J.T.; Zhang, F.S. Effect of friction time on mechanical and metallurgical properties of continuous drive friction welded Ti6Al4V/SUS321 joints. Mater. Des. 2014, 56, 649–656. [Google Scholar] [CrossRef]
- Rajasekhara, S.; Ferreira, P.J.; Karjalainen, L.P.; Kyrolkainen, A. Hall–Petch behavior in ultra-fine-grained AISI 301LN stainless steel. Metall. Mater. Trans. A 2007, 38, 1202–1210. [Google Scholar] [CrossRef]
- Di Schino, A.; Kenny, J.M. Grain refinement strengthening of a micro-crystalline high nitrogen austenitic stainless steel. Mate. Lett. 2003, 57, 1830–1834. [Google Scholar] [CrossRef]
- Fu, H.H.; Benson, D.J.; Meyers, M.A. Analytical and computational description of effect of grain size on yield stress of metals. Acta Mater. 2001, 49, 2567–2582. [Google Scholar] [CrossRef]
- Mori, K.I.; Bay, N.; Fratini, L.; Micari, F.; Tekkaya, A.E. Joining by plastic deformation. CIRP Ann-Manuf. Technol. 2013, 62, 673–694. [Google Scholar] [CrossRef]
- Uday, M.B.; Ahmad Fauzi, M.N.; Zuhailawati, H.; Ismail, A.B. Advances in friction welding process: A review. Sci. Technol. Weld. Join. 2010, 15, 534–558. [Google Scholar] [CrossRef]
Figure 1.
The (a) image of experimental equipment and (b) diagram of temperature detected area.

Figure 2.
The schematic diagram of tensile specimen.

Figure 3.
Typical engineering stress-strain curve of 304 stainless steel (SS) rotary friction-welding (RFW) joint (welding pressure is 40 MPa, rotation speed is 500 rpm, welding time is 9 s, and forging pressure is 200 MPa).
Figure 3.
Typical engineering stress-strain curve of 304 stainless steel (SS) rotary friction-welding (RFW) joint (welding pressure is 40 MPa, rotation speed is 500 rpm, welding time is 9 s, and forging pressure is 200 MPa).

Figure 4.
The variation trend of the 304SS RFW joint’s tensile strength with energy-input under forging pressures of (a) 100 MPa, (b) 120 MPa, (c)140 MPa, (d) 160 MPa, (e) 180 MPa, and (f) 200 MPa. The bars associated with the tensile strength (the mean value of three tensile strength measurements) correspond to standard deviations.

Figure 5.
The evolution of (a) temperature during RFW process and (b) cycle time with energy-input.

Figure 6.
Microstructure of the 304SS base metal.

Figure 7.
Typical microstructure cataloguing of 304SS joint welded by RFW.

Figure 8.
The thermo-mechanically affected zone (TMAZ) microstructure of specimens (a) No.1, (b) No.2, (c) No.3, and (d) No.4.
Figure 8.
The thermo-mechanically affected zone (TMAZ) microstructure of specimens (a) No.1, (b) No.2, (c) No.3, and (d) No.4.

Figure 9.
The weld zone (WZ) microstructure of specimens (a) No.1, (b) No.2, (c) No.3, and (d) No.4.
Figure 9.
The weld zone (WZ) microstructure of specimens (a) No.1, (b) No.2, (c) No.3, and (d) No.4.

Figure 10.
A diagram of the (a) microhardness test point and (b–e) microhardness distribution of specimens No.1–No.4.
Figure 10.
A diagram of the (a) microhardness test point and (b–e) microhardness distribution of specimens No.1–No.4.

Figure 11.
Photograph of macroscopic and microstructure of fracture tensile specimen.

Figure 12.
Comparison between calculated and experimental values of energy-input under different rotational speeds when welding pressure was constant at (a) 25 MPa, (b) 40 MPa, (c) 80 MPa, (d) 120 MPa, and (e) 160 MPa.
Figure 12.
Comparison between calculated and experimental values of energy-input under different rotational speeds when welding pressure was constant at (a) 25 MPa, (b) 40 MPa, (c) 80 MPa, (d) 120 MPa, and (e) 160 MPa.

Figure 13.
Comparison between calculated and experimental values of energy-input under welding parameters of (a) p = 200 MPa, N = 1400 rpm; (b) p = 80 MPa, N = 1200 rpm; (c) p = 100 MPa, N = 1500 rpm; and (d) p = 140 MPa, N = 1500 rpm.
Figure 13.
Comparison between calculated and experimental values of energy-input under welding parameters of (a) p = 200 MPa, N = 1400 rpm; (b) p = 80 MPa, N = 1200 rpm; (c) p = 100 MPa, N = 1500 rpm; and (d) p = 140 MPa, N = 1500 rpm.

Figure 14.
Variation trend of optimum energy-input with forging pressure.


Table 1.
Experiment parameters and the joint’s tensile strength under a forging pressure of 200 MPa.
Table 1.
Experiment parameters and the joint’s tensile strength under a forging pressure of 200 MPa.
| No. | Friction Pressure (MPa) | Rotation Speed (rpm) | Friction Time (s) | Energy-Input (kJ) | Average Tensile Strength (MPa) |
|---|---|---|---|---|---|
| No.1 | 40 | 1200 | 4 | 25 | 603 |
| No.2 | 40 | 500 | 9 | 35 | 698 |
| No.3 | 120 | 800 | 7 | 55 | 635 |
| No.4 | 160 | 1400 | 19 | 120 | 592 |
Table 2.
The coefficient of different welding experiments.
| P (MPa) | N (rpm) | C0 | C1 | C2 |
|---|---|---|---|---|
| 25 | 500 | −3969.91 | 7720.94 | −160.97 |
| 800 | 1792.98 | 6995.59 | −144.81 | |
| 1100 | 1594.45 | 6956.77 | −160.58 | |
| 1400 | 4350.03 | 6335.06 | −137.91 | |
| 1700 | 4423.71 | 6233.98 | −131.23 | |
| 2000 | 4319.92 | 5931.05 | −121.72 | |
| 40 | 500 | −4249.60 | 7053.29 | −128.14 |
| 1100 | 2637.38 | 6802.22 | −157.76 | |
| 1700 | 4130.76 | 6353.79 | −149.41 | |
| 2300 | 3590.85 | 6437.81 | −163.03 | |
| 80 | 500 | −3599.73 | 8111.83 | −121.67 |
| 800 | 2395.92 | 7738.01 | −158.53 | |
| 1100 | 3134.80 | 7545.50 | −156.31 | |
| 1400 | 3832.45 | 6973.78 | −158.59 | |
| 1700 | 4268.07 | 6899.27 | −131.95 | |
| 2300 | 4324.83 | 6509.14 | −124.84 | |
| 120 | 500 | −4163.32 | 9006.37 | −131.23 |
| 800 | −2473.33 | 8864.62 | −174.24 | |
| 1100 | 1636.11 | 8242.70 | −147.53 | |
| 1400 | 1745.32 | 7831.08 | −133.24 | |
| 1700 | 3049.07 | 7313.38 | −100.93 | |
| 2300 | 3238.76 | 3238.76 | −73.20 | |
| 160 | 1100 | 825.70 | 8365.38 | −90.80 |
| 1400 | 897.32 | 8165.46 | −80.14 | |
| 1700 | 1452.71 | 7813.79 | −74.77 | |
| 2300 | 1436.52 | 6701.22 | −15.79 | |
| 200 | 1100 | 359.98 | 9759.89 | −94.88 |
| 1400 | 140.55 | 7950.32 | −16.90 |
Table 3.
Welding parameters and tensile strength of verification experiments.
| No. | Friction Pressure (MPa) | Rotation Speed (rpm) | Friction Time (s) | Tensile Strength (MPa) |
|---|---|---|---|---|
| No.5 | 100 | 1300 | 6 | 93% |
| No.6 | 40 | 2000 | 8 | 90% |
| No.7 | 160 | 800 | 5 | 96% |
© 2018 by the authors. Licensee MDPI, Basel, Switzerland. This article is an open access article distributed under the terms and conditions of the Creative Commons Attribution (CC BY) license (http://creativecommons.org/licenses/by/4.0/).
Share and Cite
MDPI and ACS Style
Wang, G.; Li, J.; Wang, W.; Xiong, J.; Zhang, F. Study on the Effect of Energy-Input on the Joint Mechanical Properties of Rotary Friction-Welding. Metals 2018, 8, 908. https://doi.org/10.3390/met8110908
AMA Style
Wang G, Li J, Wang W, Xiong J, Zhang F. Study on the Effect of Energy-Input on the Joint Mechanical Properties of Rotary Friction-Welding. Metals. 2018; 8(11):908. https://doi.org/10.3390/met8110908
Chicago/Turabian StyleWang, Guilong, Jinglong Li, Weilong Wang, Jiangtao Xiong, and Fusheng Zhang. 2018. "Study on the Effect of Energy-Input on the Joint Mechanical Properties of Rotary Friction-Welding" Metals 8, no. 11: 908. https://doi.org/10.3390/met8110908
Note that from the first issue of 2016, this journal uses article numbers instead of page numbers. See further details here.