Article

Critical Distance Default Values for Structural Steels and a Simple Formulation to Estimate the Apparent Fracture Toughness in U-Notched Conditions

1
LADICIM (Laboratory of Materials Science and Engineering), University of Cantabria, E.T.S. de Ingenieros de Caminos, Canales y Puertos, Av/Los Castros 44, 39005 Santander, Spain
2
Centro Tecnológico de Componentes-CTC, C/Isabel Torres no. 1, 39011 Santander, Spain
*
Author to whom correspondence should be addressed.
Metals 2018, 8(11), 871; https://doi.org/10.3390/met8110871
Submission received: 11 October 2018 / Revised: 18 October 2018 / Accepted: 22 October 2018 / Published: 24 October 2018
(This article belongs to the Special Issue Fracture, Fatigue and Structural Integrity of Metallic Materials)

Abstract

:
The structural integrity assessment of components containing notch-type defects has been the subject of extensive research in the last few decades. The assumption that notches behave as cracks is generally too conservative, making it necessary to develop assessment methodologies that consider the specific nature of notches, providing accurate safe predictions of failure loads or defect sizes. Among the different theories or models that have been developed to address this issue the Theory of Critical Distances (TCD) is one of the most widely applied and extended. This theory is actually a group of methodologies that have in common the use of the material toughness and a length parameter that depends on the material (the critical distance; L). This length parameter requires calibration in those situations where there is a certain non-linear behavior on the micro or the macro scale. This calibration process constitutes the main practical barrier for an extensive use of the TCD in structural steels. The main purpose of this paper is to provide, through a set of proposed default values, a simple methodology to accurately estimate both the critical distance of structural steels and the corresponding apparent fracture toughness predictions derived from the TCD.

1. Introduction

There are numerous situations where the defects responsible for structural failure are not cracks (i.e., sharp defects whose tip radius tends to zero). If defects are blunt (e.g., notches), it may be overly conservative to assume that they behave like sharp cracks and, thus, to apply sharp crack analysis methodologies generally based on Fracture Mechanics. The reason is that notched components develop a load-bearing capacity that is greater than that developed by cracked components.
For brittle failure situations in cracked components, in which linear-elastic behavior is dominant, fracture mechanics establishes that fracture occurs when the applied stress intensity factor (K) is equal to the material fracture toughness (Kmat):
  K = K mat  
Nevertheless, notches subject components to less severe stress fields at the defect tip, resulting in an apparent higher material fracture resistance (often referred to as apparent fracture toughness). If this is not taken into account in the analysis, Equation (1) often proves to be overly conservative.
Consequently, the specific nature of notches, and their consequences on the material behavior, has required the development of specific approaches for the fracture analysis of materials containing this type of defect. In this sense, the analysis of the fracture behavior of notches can already be performed using different criteria: The Theory of Critical Distances (TCD) [1,2,3], the Global Criterion [4,5], Process Zone models (e.g., [6,7]), statistical models (e.g., [8,9]), mechanistic models (e.g., [10]), the Strain Energy Density (SED) criterion (e.g., [11,12]), etc. Some of them are related to each other, so it is not straightforward to establish the boundaries between them. In any case, the TCD has been successfully applied to different failure mechanisms (e.g., fracture, fatigue) and materials, and is particularly simple to implement in structural integrity assessments (e.g., [1,2,3]). For these reasons, this work focuses on this particular approach.

2. The Theory of Critical Distances

The Theory of Critical Distances (TCD) comprises a set of methodologies with the common characteristic that they all use a characteristic material length parameter (the critical distance) when performing fracture assessments [1]. The origins of the TCD date back to the middle of the twentieth century [13,14], but it has been in the last two decades that this theory has seen an extensive development, providing answers to different scientific and engineering problems (e.g., [1,2,3,15,16,17]).
The above-mentioned length parameter is generally referred to as the critical distance, L, and in fracture analyses it follows Equation (2) [1]:
  L = 1 π ( K mat σ 0 ) 2  
where Kmat is the material fracture toughness (derived in cracked conditions) and σ0 is a characteristic strength parameter, known as the inherent strength, which is generally higher than the ultimate tensile strength (σu) and requires calibration. When the material behavior is fully linear-elastic, σ0 is equal to σu, and obtaining L is straightforward once the material fracture toughness and ultimate tensile strength are known.
Among the methodologies that comprise the TCD, the Point Method (PM) and the Line Method (LM) stand out both for their simplicity and their applicability.
Of these, the Point Method is the simplest methodology, and it affirms that fracture takes place when the stress at a distance of L/2 from the notch tip is equal to the inherent strength [1]. The resultant fracture criterion is, therefore:
  σ ( L 2 ) = σ 0  
The Line Method, meanwhile, assumes that fracture occurs when the average stress along a certain distance, 2L, reaches the inherent strength [1]. Consequently, the LM follows:
  1 2 L 0 2 L σ ( r ) d r = σ 0  
Furthermore, both the PM and the LM provide expressions for the apparent fracture toughness ( K mat N ) exhibited by materials containing U-notches when combined with the linear-elastic stress distribution at the notch tip provided by Creager and Paris [18]. The latter is equal to that ahead of the crack tip, but displaced a distance equal to ρ/2 along the x-axis (which is located in the notch midplane and has its origin at the crack tip [18]):
  σ ( r ) = K π 2 ( r + ρ ) ( 2 r + ρ ) 3 2  
where K is the stress intensity factor for a crack with the same size as the notch, ρ is the notch radius, and r is the distance from the notch tip to the point being assessed. In order to keep in mind the validity range of the equations derived below, it should be noted that Equation (5) was derived for long thin notches (i.e., notch depth >> notch radius) and is only valid for small distances from the notch tip (r << notch depth).
If the PM is applied, Equation (3) can be combined with Equation (5), providing [1]:
  K mat N = K mat ( 1 + ρ L ) 3 2 ( 1 + 2 ρ L )  
This equation allows the apparent fracture toughness ( K mat N ) of a given material containing a U-shaped notch to be estimated from the material fracture toughness (Kmat, derived in cracked conditions), the notch radius (ρ), and the material critical distance (L). Analogously, when considering the LM (Equation (4)), together with Creager-Paris stress distribution (Equation (5)), the result is an even simpler equation [1]:
  K mat N = K mat 1 + ρ 4 L  
These equations have implications from a practical point of view, given that with any of them the fracture analysis of a notched component is reduced to an equivalent situation of a cracked component, with only the particularity of considering K mat N instead of Kmat. Accordingly, fracture takes place when:
  K I = K mat N  
Moreover, Equations (6) and (7) provide similar K mat N predictions. For this reason, the analysis shown below is focused on the LM predictions of K mat N (Equation (7)), although similar results would be derived from the PM (Equation (6)).
In addition, it should be noted that the authors have demonstrated [2,19] that notches may be analyzed by using Failure Assessment Diagrams (FADs) [20] and substituting Kmat with K mat N in the definition of the Kr coordinate of the assessment point. This coordinate is defined as the ratio between the applied stress intensity factor (KI) and the material fracture resistance (Kmat for cracks and K mat N for notches) [20,21,22]. This work is not focused on the FAD approach, but the application of the K mat N values generated here to FAD analyses would be straightforward.

3. Materials and Methods

The authors have published a number of papers showing the application of the TCD to a wide range of structural steels: S275JR, S355J2, S460M and S690Q (e.g., [22,23]). These steels were tested at 3 different temperatures of their corresponding Ductile-to-Brittle Transition Zone (DBTZ) and, in the case of steels S275JR and S355J2, at temperatures equal to their Lower Shelf (LS). Hence, the resultant experimental program collected here includes 15 different mechanical behaviors, which are summarized in Table 1 [23,24]. Notch radii varied between 0 mm (crack-like defects) up to 2.0 mm in all cases.
The fracture toughness tests (in cracked specimens) and the apparent fracture toughness tests (in notched specimens) were performed following ASTM1820 standard [25]; alternative experimental approaches can be found in literature (e.g., [26,27,28,29,30]), whereas the L values of the four steels at the different temperatures (see Table 1) were calibrated by a least squares fitting of the experimental results. Figure 1 [23,24] shows an example corresponding to steel S275JR tested at −120 °C. σ0 values were directly obtained from Equation (2) once Kmat and L were known. The total number of tests is 394, with L values varying from 0.0028 mm up to 0.0198 mm. Thus, the experimental results collected here represent a wide range of situations.

4. Derivation of Default Values of L and Apparent Fracture Toughness Estimations

Once the experimental (best fit calibrated) values of L have been defined, and the corresponding values of σ0 have been derived (through Equation (2)), and provided that σu values are known for each material condition, it is proposed to establish the (non-dimensional) relation between the inherent strength (σ0) and the ultimate tensile strength (σu):
  m = σ 0 σ u  
For each structural steel and testing temperature a conservative value of m may be obtained. This value of m, combined with the ultimate tensile strength of the material (σu), may substitute the inherent strength (σ0) in Equation (2), resulting in a default (conservative) critical distance (Ld) that does not need to be calibrated and allows the TCD to be applied safely:
  L d = 1 π ( K mat m · σ u ) 2  
This methodology was presented by the authors [31], providing default conservative values for different types of materials: steels, aluminum alloys, polymers, ceramic and rocks, and composites. This work was based on a vast database of experimental results obtained on notched fracture specimens. The present work, however, particularizes the analysis to structural steels, providing more accurate (yet conservative) default values of L for structural steels.
Figure 2 and Figure 3 show the experimental value of m for each material analyzed. It can be observed that Figure 2 includes additional data taken from the literature [32,33]. The values have to be analyzed separately in two different groups, attending to their different fracture behavior and mechanical properties: structural steels operating in LS conditions, and structural steels operating in the DBTZ.
In the LS regime, with the structural steels having brittle behavior, the resulting lower bound value of m gathered in [31] is 1.6, as can be seen in Figure 2. However, some of the values may be much higher, close to 25, although most of them are below 5.0. For this reason, a fitting curve has been developed with the aim of improving the accuracy of the results (when compared to those provided by a single value of m), yet providing conservative values (σu in MPa):
  m = 1.3 · σ u σ u 490  
Figure 2 reveals the limitations of the lower bound value proposed in [31]. Although it provides a safe estimate of m (and then, also of L and K mat N ), it is still clearly over-conservative for structural steels with relatively low ultimate tensile strengths (e.g., 500–800 MPa), which is a very typical situation in practice. The benefits of using Equation (11) instead of the lower bound value proposed in [31] are, thus, evident.
For structural steels operating in the DBTZ the lower bound value of m proposed in Reference [31] was 13, as shown in Figure 3. This much higher correction is associated with a more non-linear behavior of the structural steels within the DBTZ when compared to the behavior of the same steels within the LS. Again, a fitting curve is provided with the aim of improving the accuracy of the predictions (σu in MPa):
  m = 8 · σ u σ u 380  
When comparing the lower bound value proposed in [31] (m = 13) with Equation (12), the conclusions are analogous to those derived in LS situations. The lower bound value looks accurate for high ultimate tensile strengths (e.g., higher than 1000 MPa), but it is clearly over-conservative for steels with ultimate tensile strength ranges between approximately 500 MPa and 800 MPa.
Here, it should be noted that the validity range of all these proposed m values is limited to the steel grades covered by this work. With all this, the LM K mat N estimations can be easily derived through the following equation:
  K mat N = K mat 1 + ρ 4 L d  
Figure 4, Figure 5, Figure 6 and Figure 7 show the predictions for the 394 tests. It can be observed that, in order to perform a homogeneous analysis, both the apparent fracture toughness values and the notch radii values have been normalized by the fracture toughness obtained in cracked conditions and by the corresponding critical distance, in a ( K mat N /Kmat) against (ρ/Ld)1/2 plot.
The two lines on each figure correspond to two different values of Kmat considered in the analysis to be introduced in Equation (13): the average value of the experimental results (Kmat) for each particular steel and testing temperature, and Kmat,0.95, which is associated to a 95% confidence level. The latter has been derived assuming a normal distribution of the experimental results obtained in cracked conditions (Kmat), and would be the prediction required for structural integrity assessment purposes, whereas the former is the prediction that should better capture the physics of the phenomenon being analyzed. The above referred confidence level is, therefore, limited for the fracture results obtained in cracked conditions (ρ = 0 mm). For notched conditions (i.e., for the rest of the curve), using Kmat,0.95 provides a more conservative estimation of the apparent fracture toughness than that obtained with the average value of the fracture toughness (Kmat), but the corresponding predictions are not necessarily associated to a 95% confidence level.
From the results shown in Figure 4, Figure 5, Figure 6 and Figure 7, the following observations can be made:
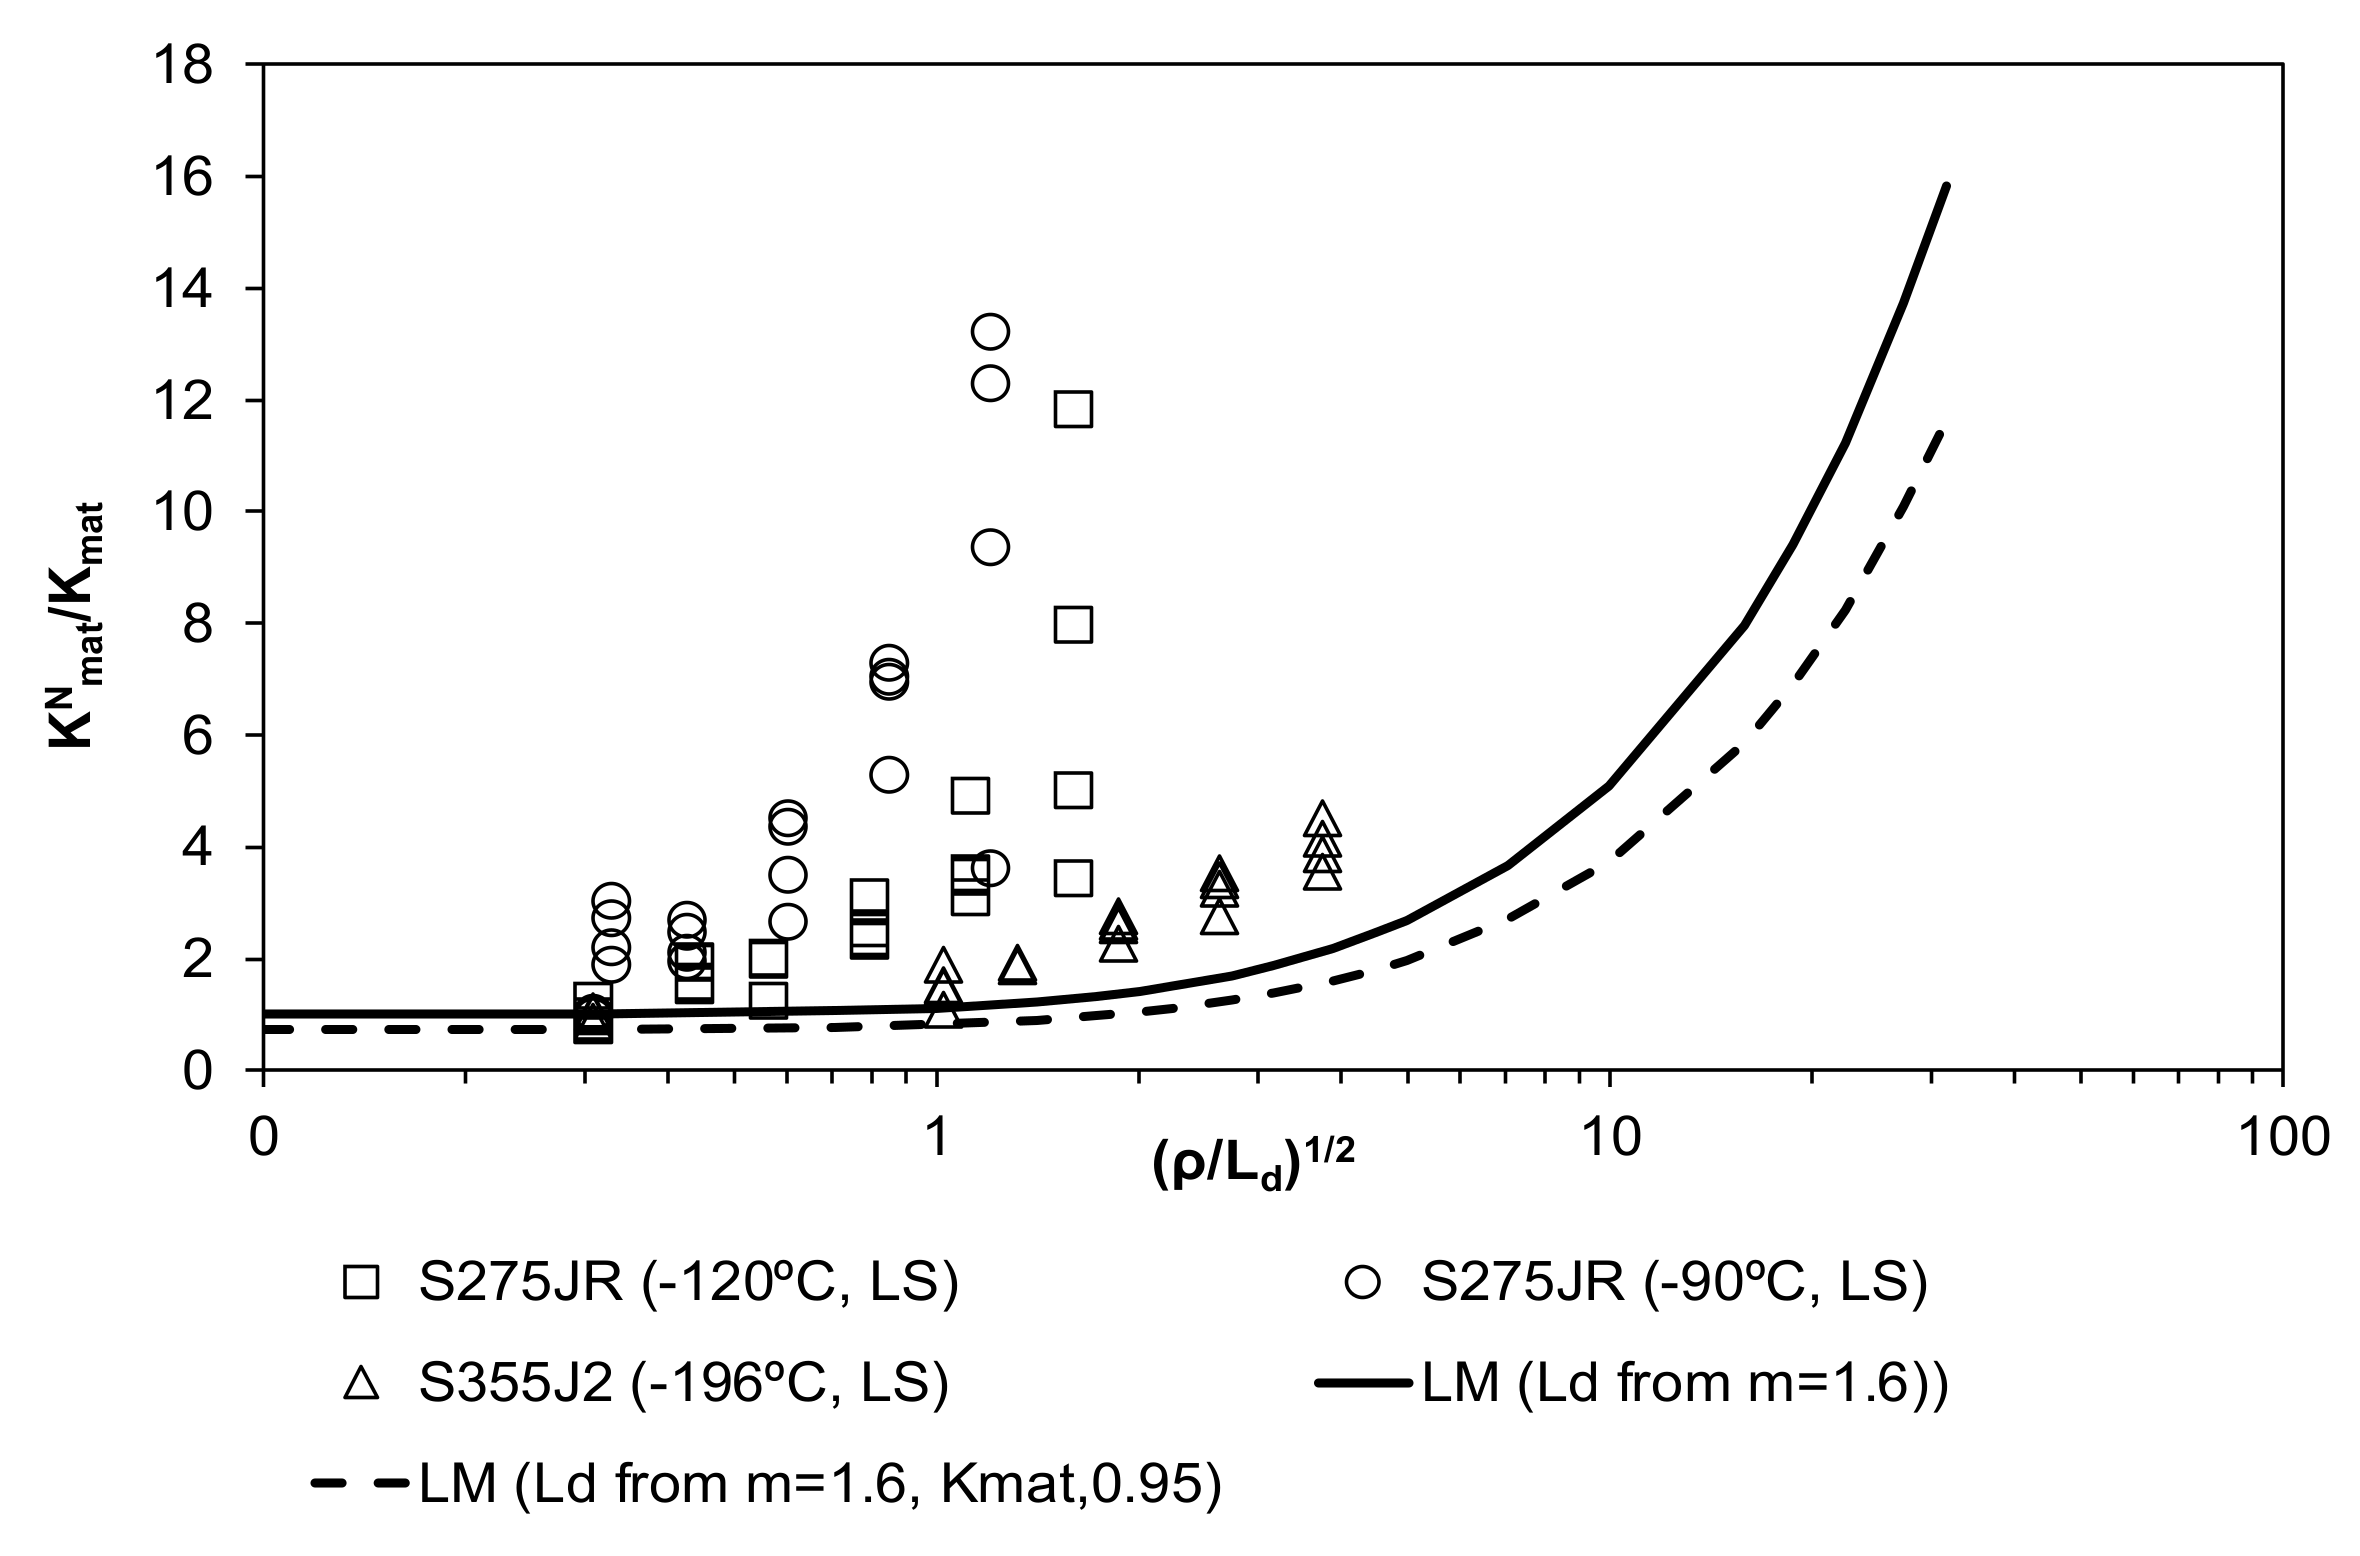
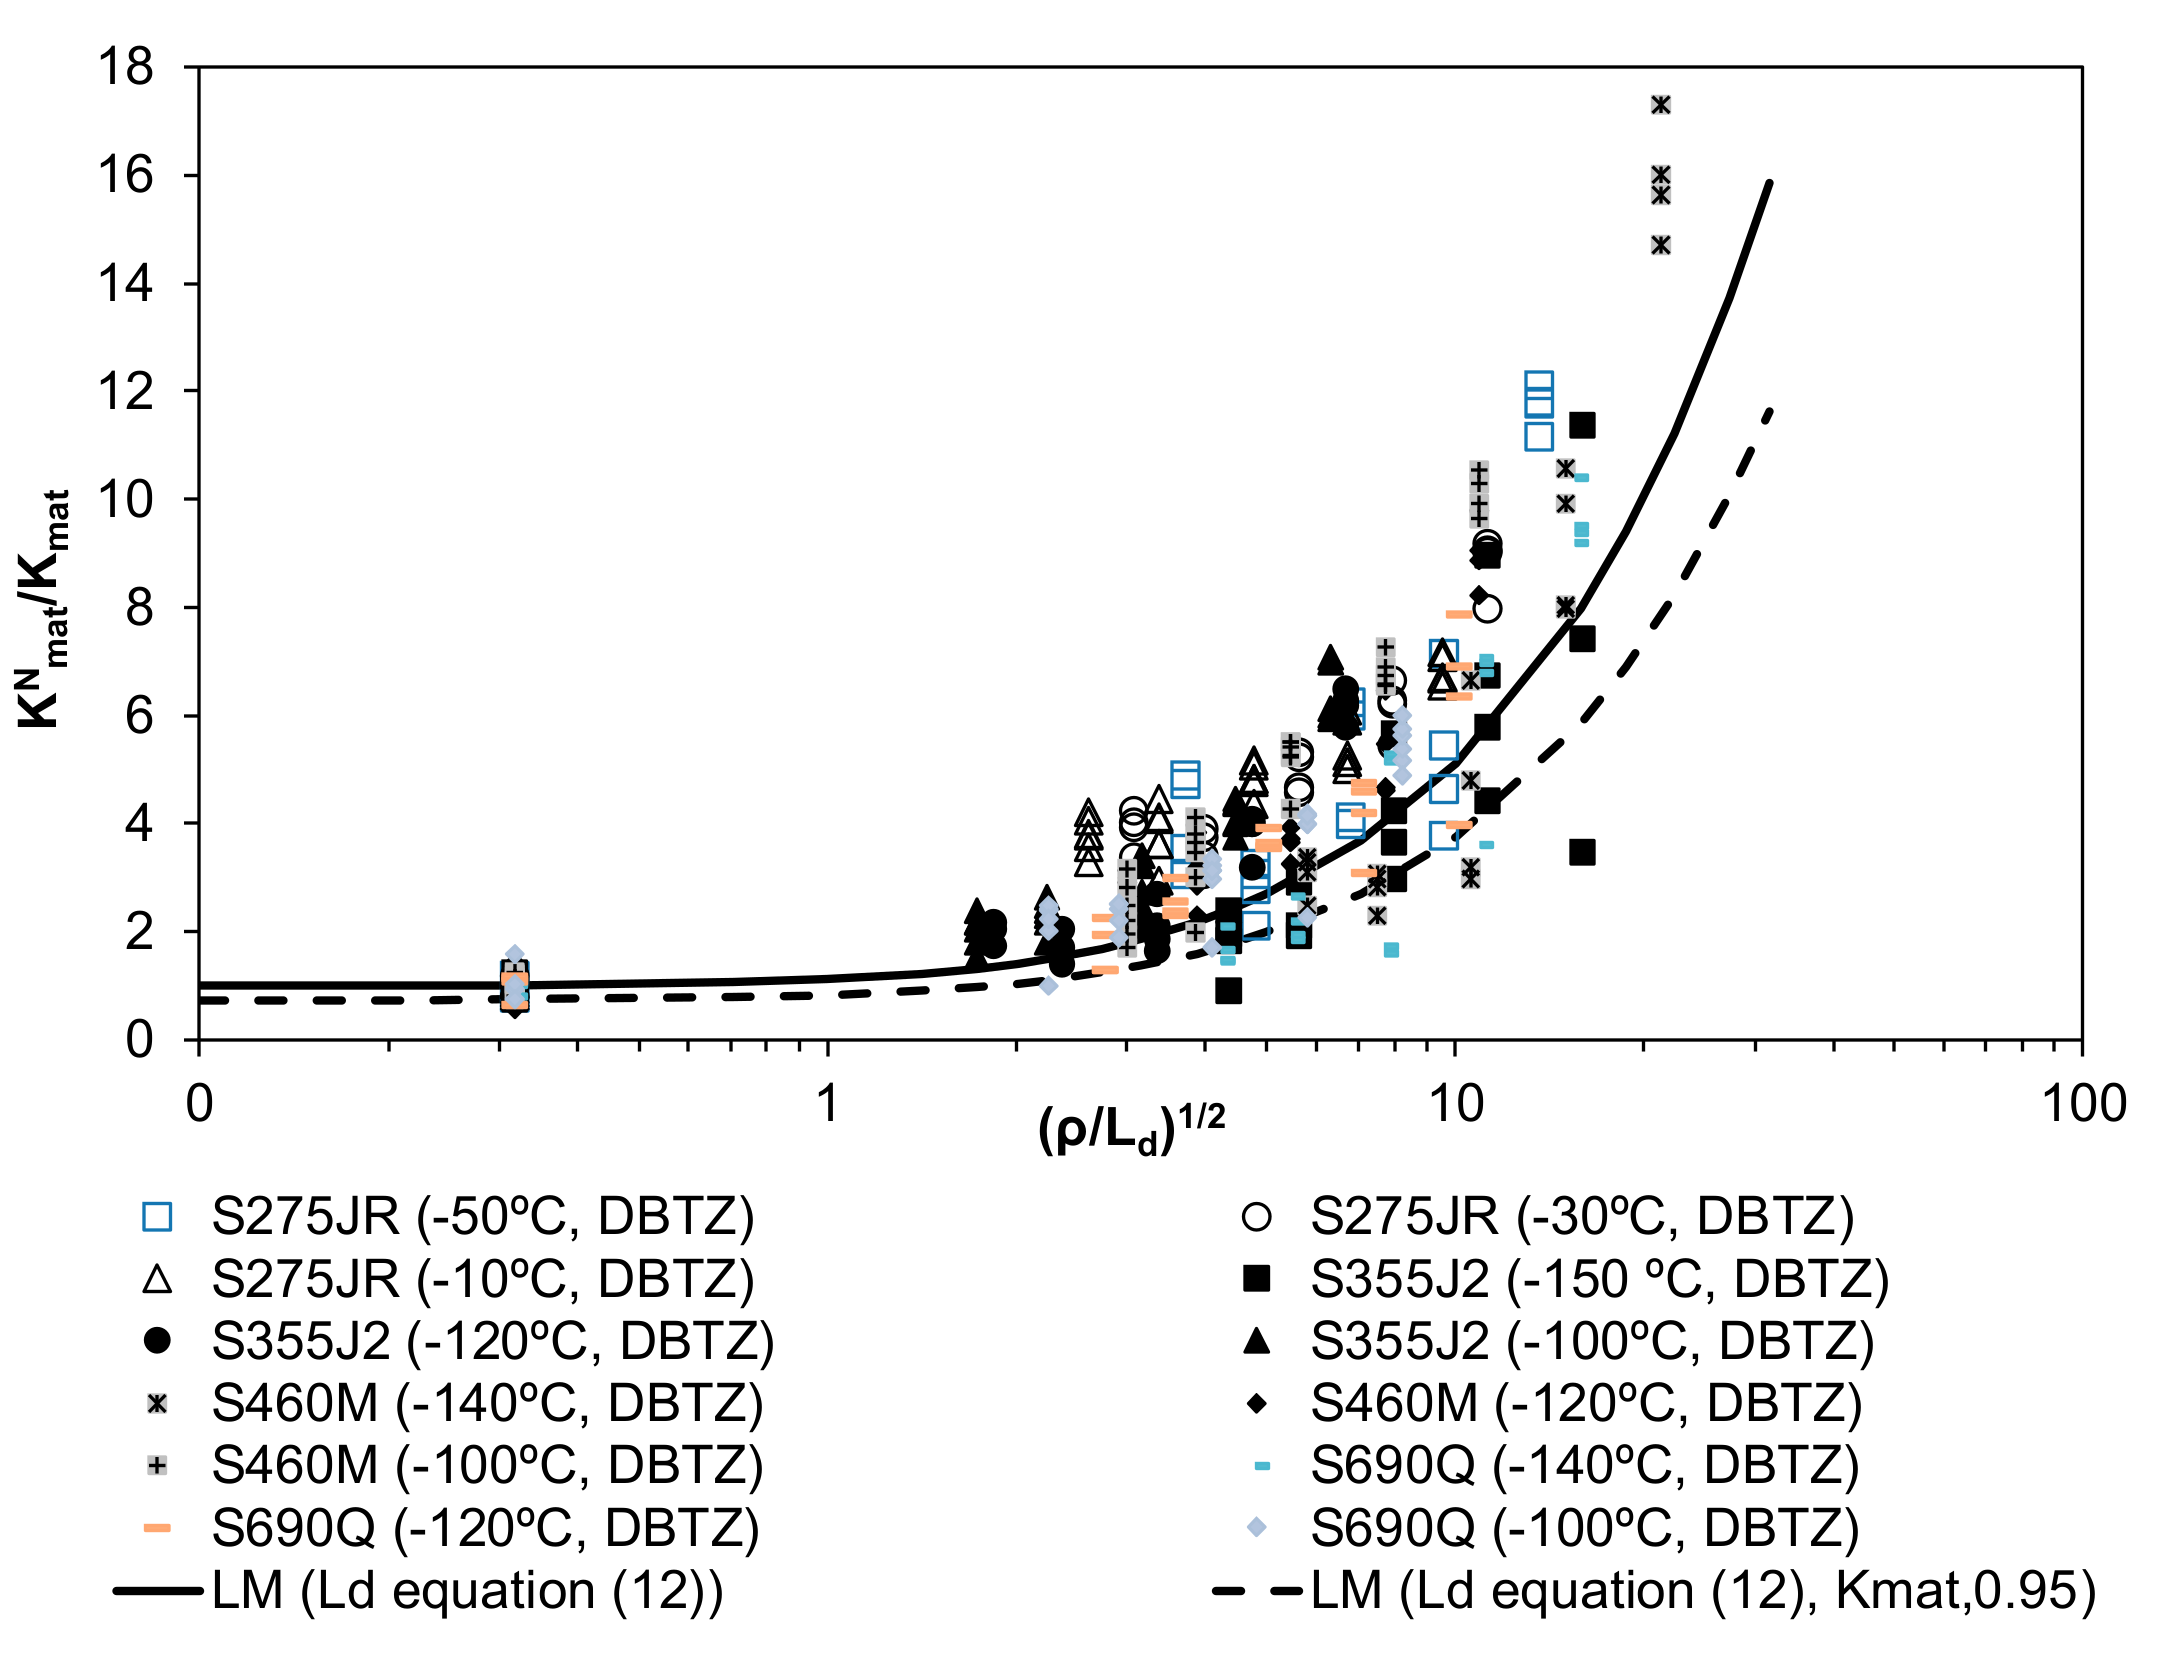
  • The LM predictions derived from the proposed default values of the material critical distance (Ld) capture a significant part of the physics of the notch effect, given that the LM prediction adequately follows the tendency of the experimental results, which have been obtained for a wide variety of structural steels and conditions. The results are particularly accurate considering fitting Equations (11) and (12) and the average value of the material fracture toughness (Kmat) for each particular steel and working temperature. These fitting equations significantly reduce the conservatism obtained from the lower bound values proposed in [31].
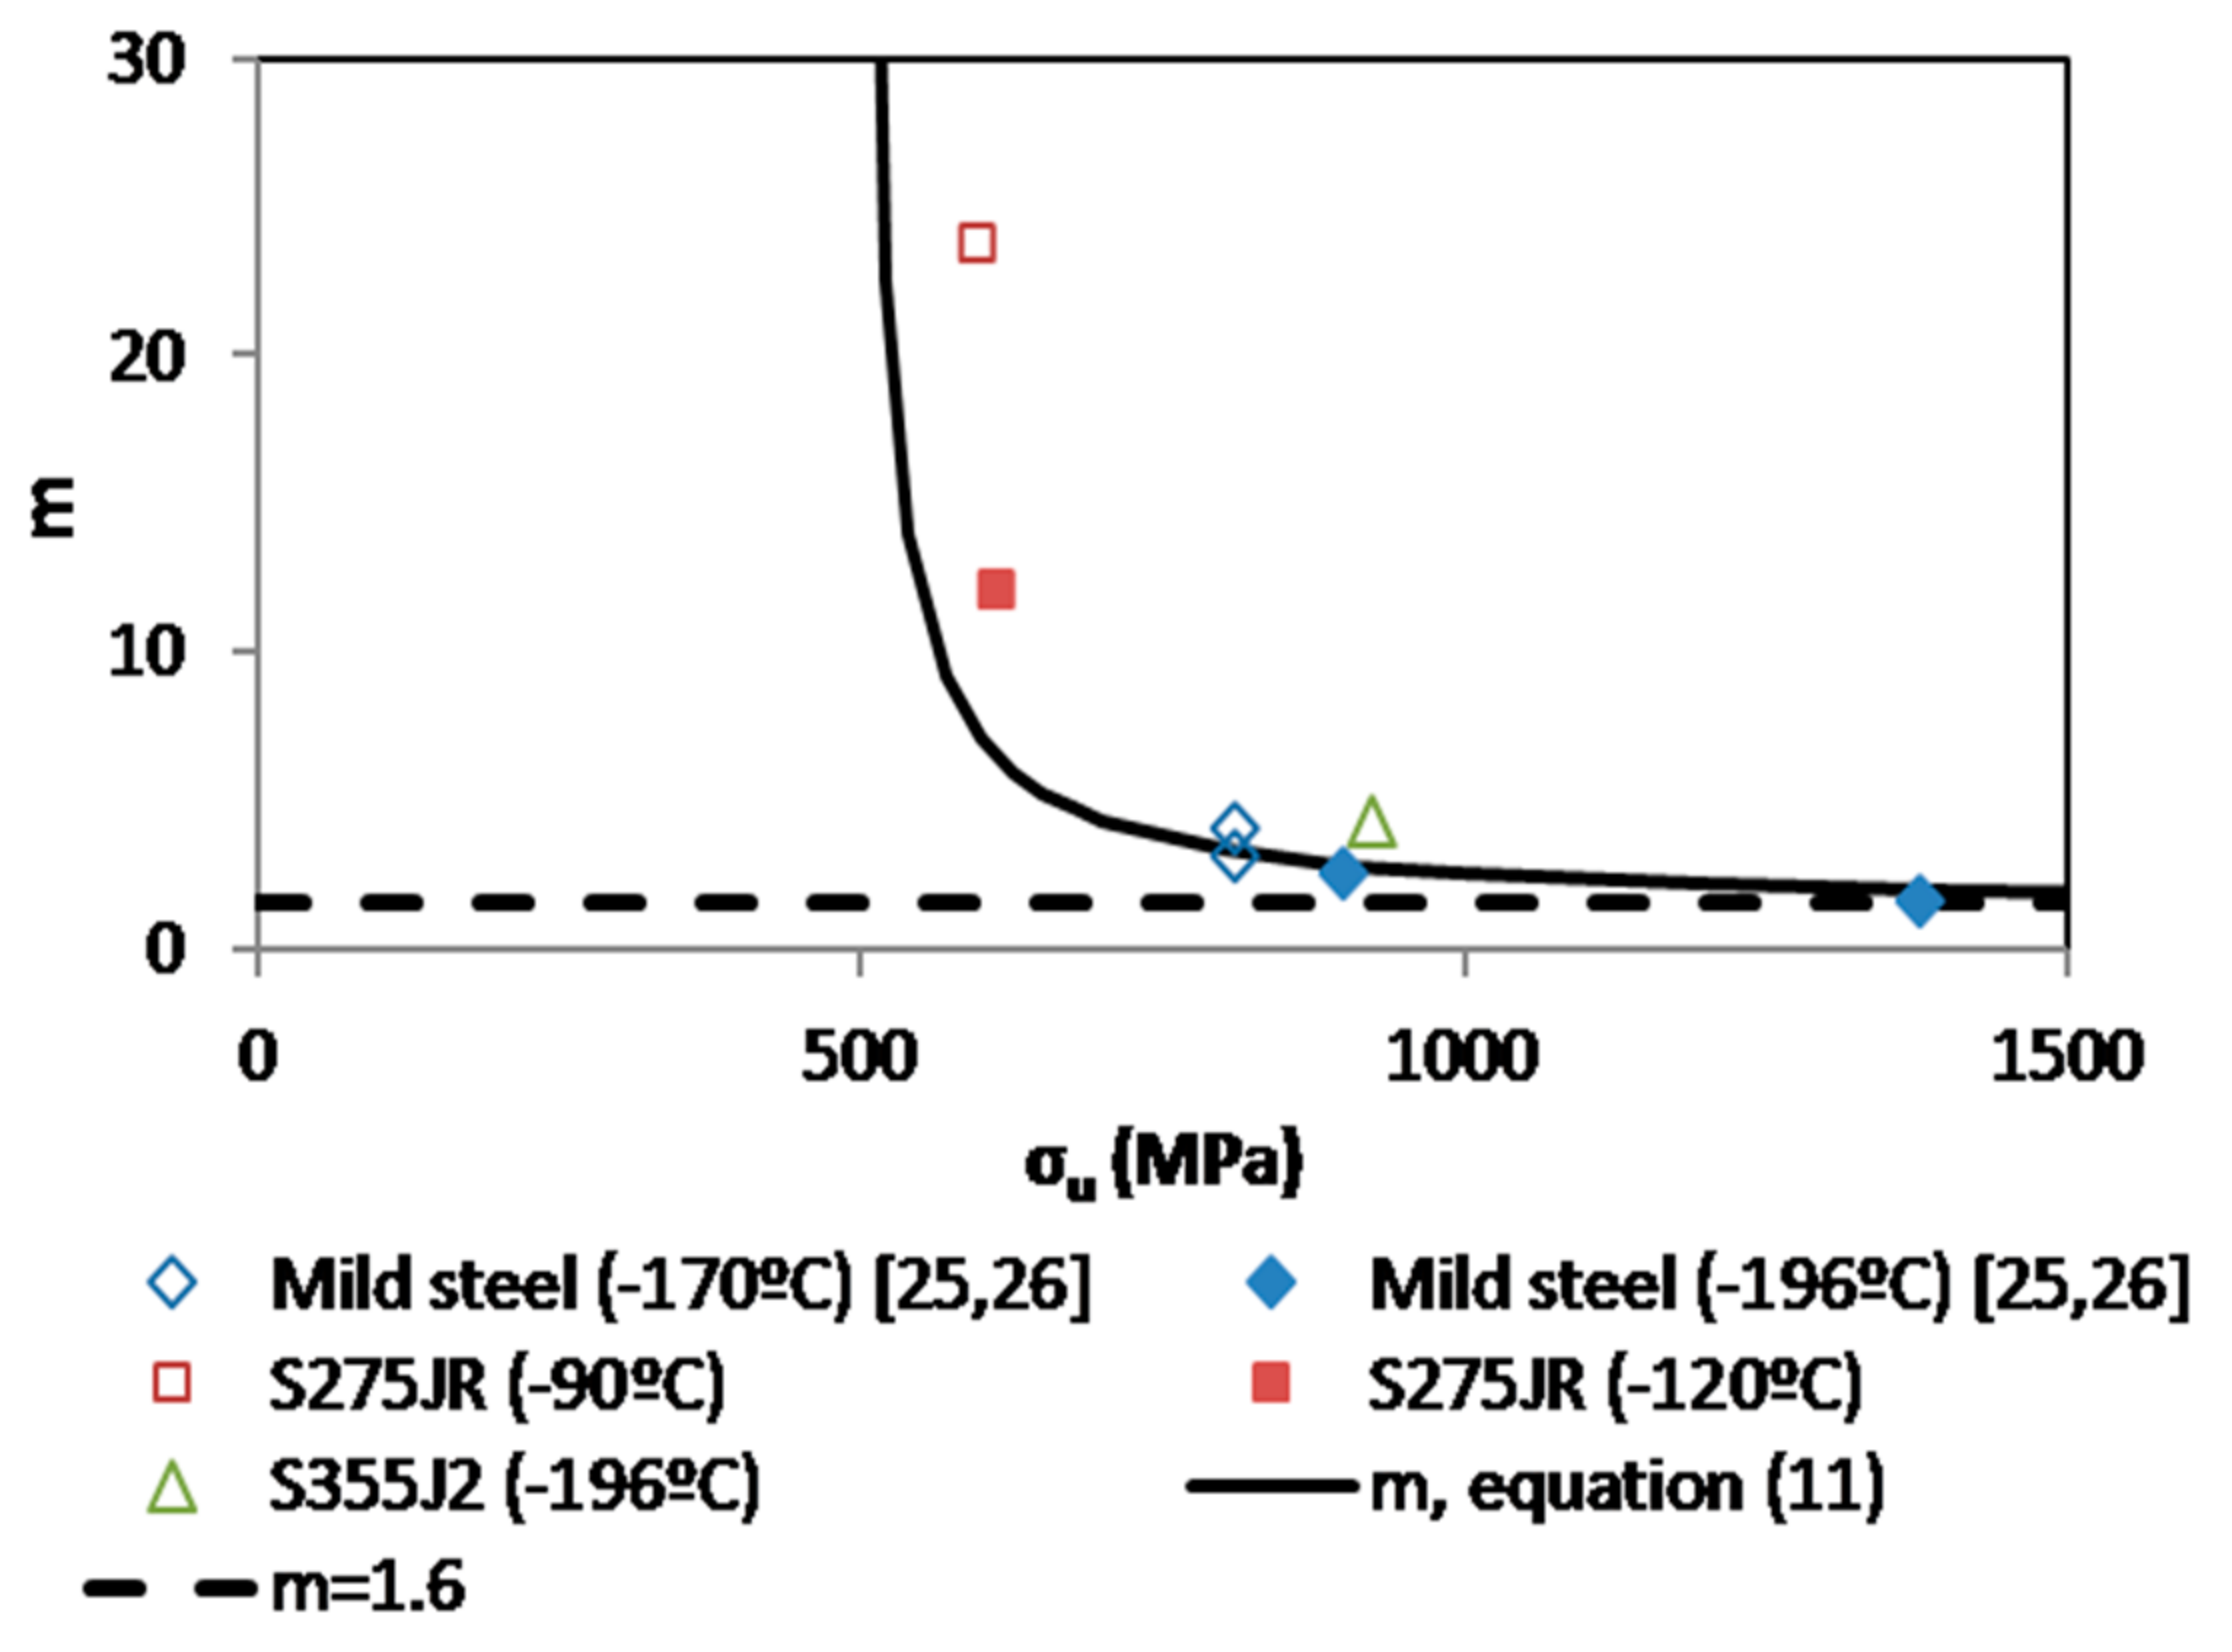
  • The most conservative results have been obtained in Lower Shelf conditions when using the lower bound value of m (m = 1.6). Even under such circumstances, the resulting apparent fracture toughness estimations may be significantly higher than the corresponding fracture toughness obtained in cracked conditions, so the potential reduction of conservatism is still important.
  • If the LM evaluations are to be used in structural integrity assessments, although the use of Kmat (average value of the material fracture toughness obtained in cracked conditions) captures most of the notch effect adequately, it may be unsafe on many occasions due to the high scatter of the fracture processes. This means that it sometimes provides apparent fracture toughness values higher than those measured experimentally (see Figure 4 and Figure 6). In order to provide a fracture analysis tool to be used in structural integrity assessments, it is necessary to propose a methodology that is capable of providing safe predictions of the apparent fracture toughness. With this purpose, it is proposed to use a 95% confidence level value of the fracture toughness (Kmat,0.95).
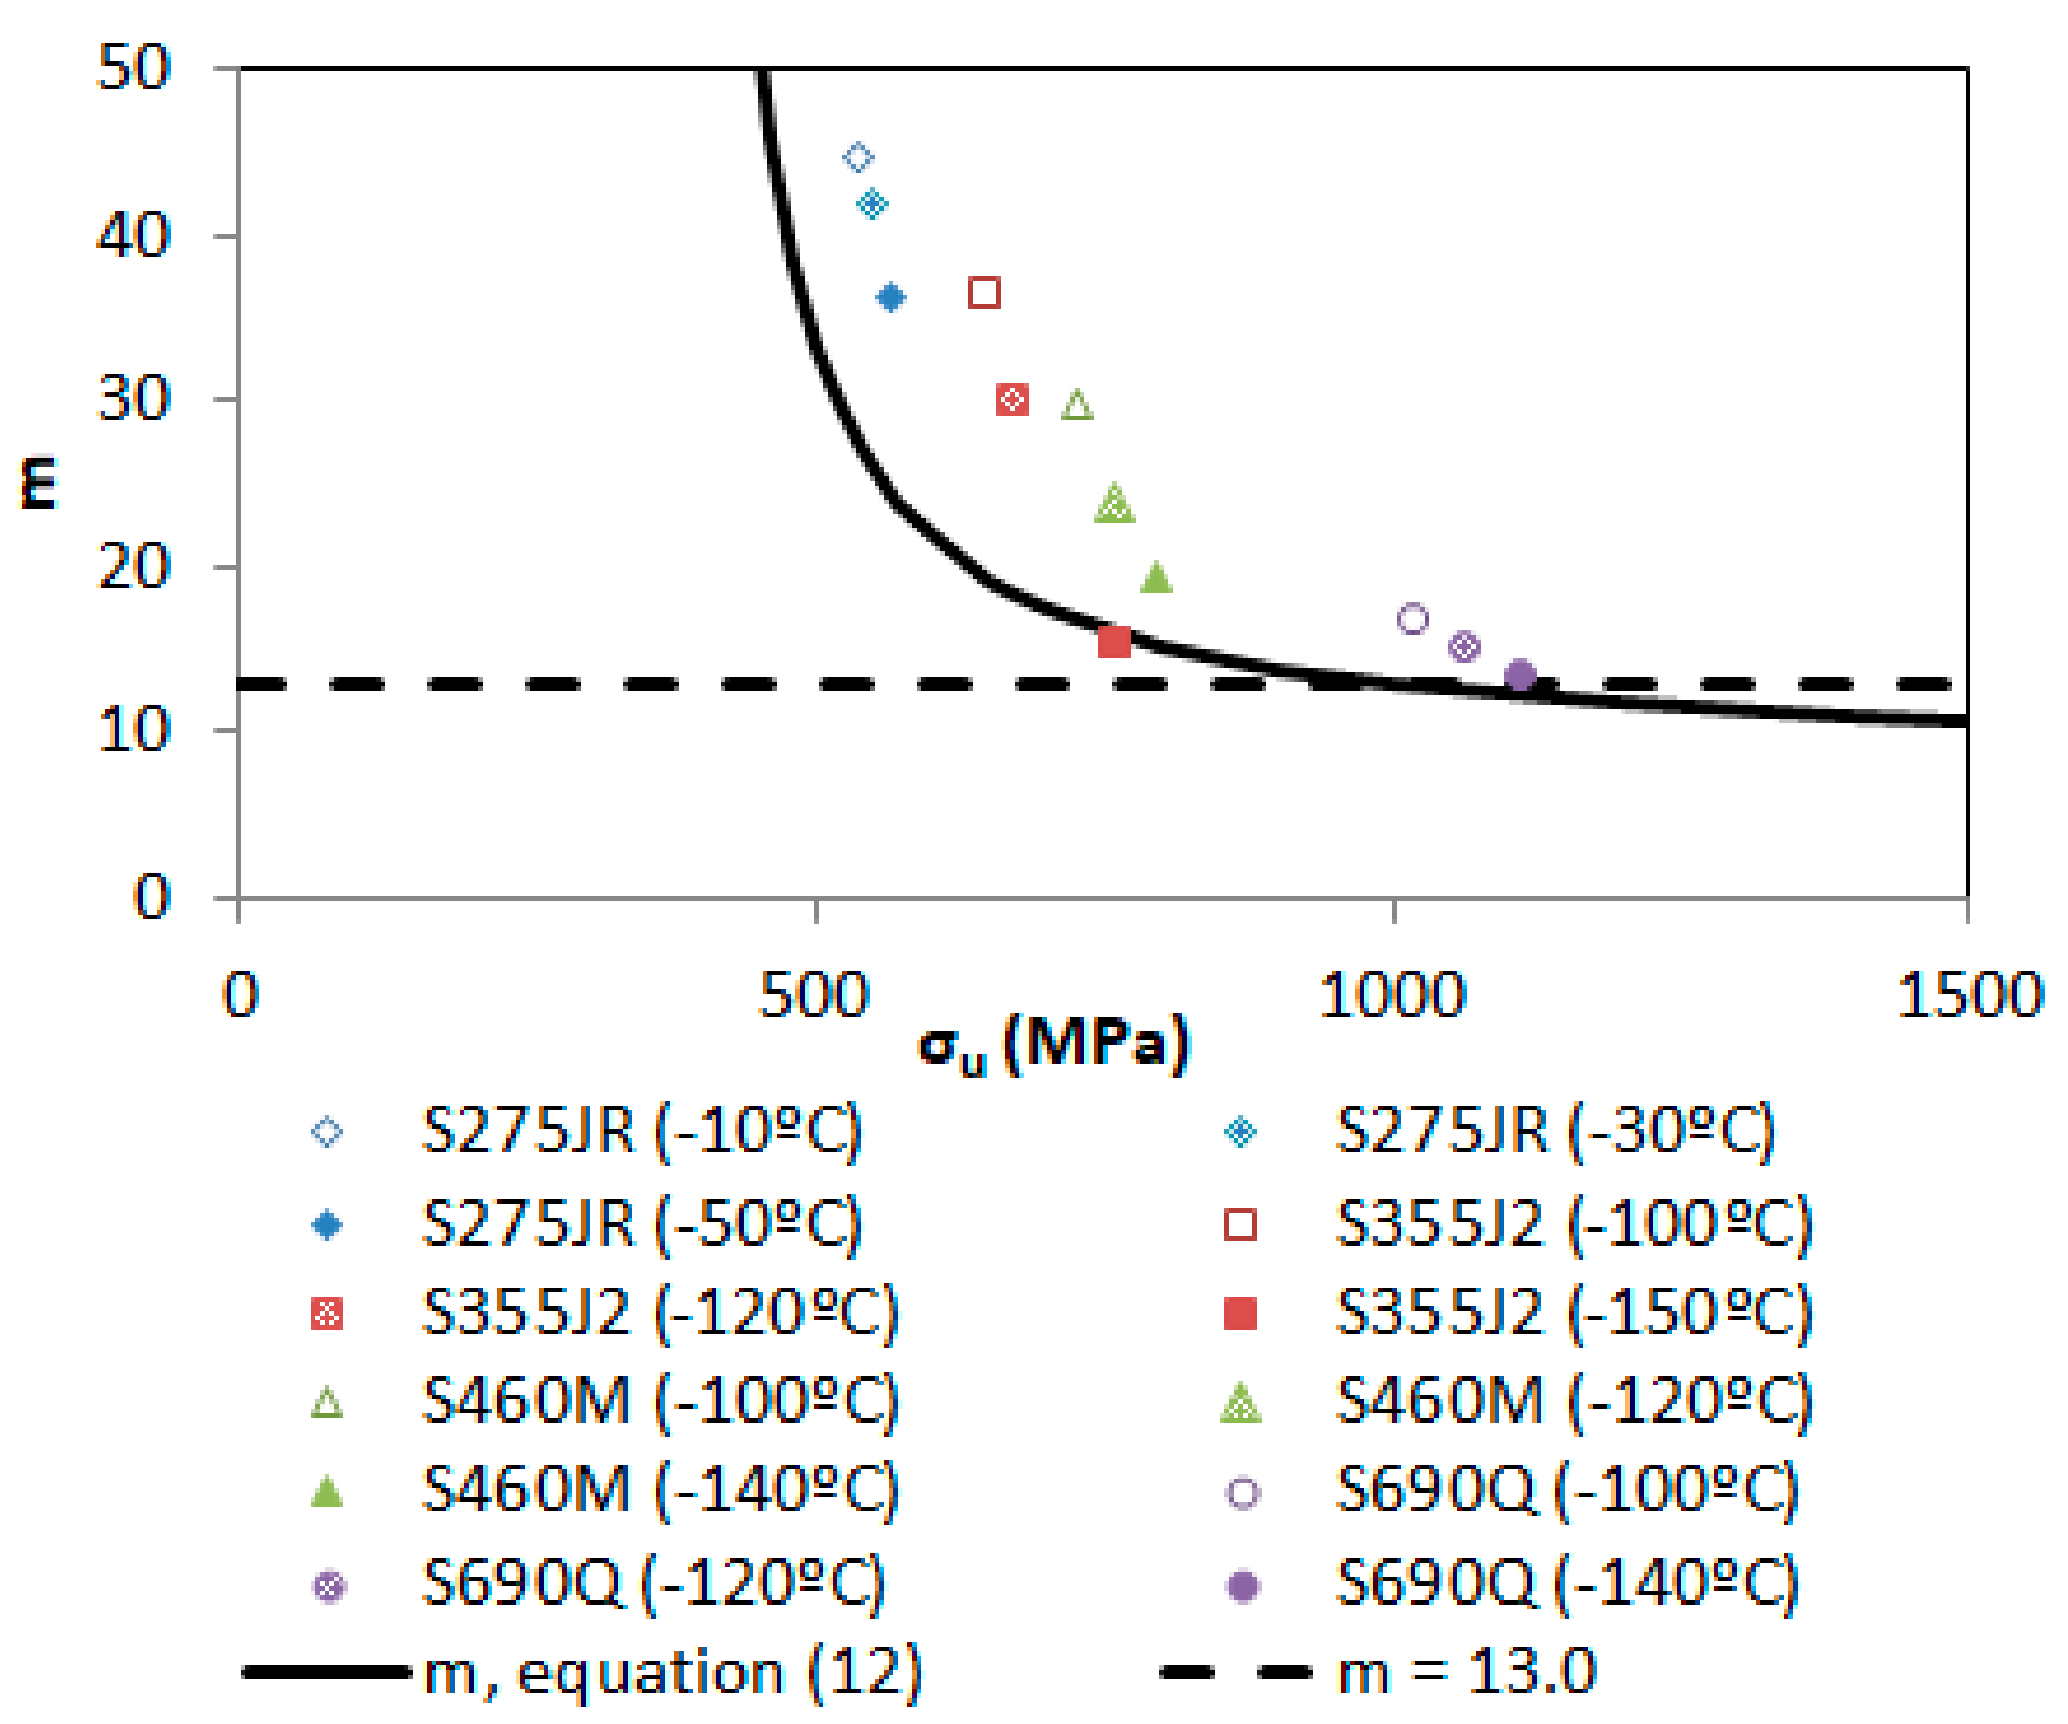
  • Thus, the most accurate, yet conservative, methodology for the apparent fracture toughness estimation arises from the combination of Kmat,0.95 (as the material fracture toughness) and the m values derived from Equations (11) and (12), for LS and DBTZ conditions respectively.

5. Summary

The aim of this paper has been to provide a simple accurate methodology to estimate both the critical distance of structural steels and the corresponding apparent fracture toughness predictions derived from the Theory of Critical Distances, and, particularly, from the Line Method. This has been done through a set of proposed factors (m values) that multiply the material ultimate tensile strength, avoid any need for previous calibration, and allow default values of the critical distance (Ld) to be obtained. The m factors have been provided as fitting curves depending exclusively on the material ultimate tensile strength. Results are also shown when using previously proposed m lower bound values, which provide more conservative estimations of the material apparent fracture toughness. The methodology has been applied to four structural steels (S275JR, S355J2, S460M, and S690Q) tested on notched conditions (U-shaped notches) and operating at both the Lower Shelf and the Ductile-to-Brittle Transition Zone. The experimental values of the apparent fracture toughness ( K mat N ) and the notch radii values have been normalized by the corresponding fracture toughness (Kmat or Kmat,0.95) obtained in cracked conditions and by the default values derived for the critical distance (Ld) respectively, representing the 394 tests in ( K mat N /Kmat) − (ρ/Ld)1/2 plots.
The results demonstrate the capacity of the proposed methodology to provide safe estimations of the apparent fracture toughness whilst capturing a significant part of the notch effect and, thus, reducing the conservatism associated with the assumption that notches behave as cracks.

Author Contributions

S.C. and V.M. conceived and designed the experiments; V.M., J.D.F. and I.P. performed the experiments; all the authors analyzed the data; S.C. wrote the paper.

Funding

This research received no external funding.

Acknowledgments

The authors of this work would like to express their gratitude to the Spanish Ministry of Science and Innovation for the financial support of the Project MAT2014-58443-P: “Análisis del comportamiento en fractura de componentes estructurales con defectos en condiciones de bajo confinamiento tensional”, on the results of which this paper is based.

Conflicts of Interest

The authors declare no conflict of interest. The funders had no role in the design of the study; in the collection, analyses, or interpretation of data; in the writing of the manuscript, or in the decision to publish the results.

References

  1. Taylor, D. The Theory of Critical Distances: A New Perspective in Fracture Mechanics; Elsevier: Oxford, UK, 2007; ISBN 978-008044478-9. [Google Scholar]
  2. Cicero, S.; Madrazo, V.; Carrascal, I.A.; Cicero, R. Assessment of notched structural components using failure assessment diagrams and the theory of critical distances. Eng. Fract. Mech. 2011, 78, 2809–2825. [Google Scholar] [CrossRef]
  3. Cicero, S.; Madrazo, V.; Carrascal, I.A. Analysis of notch effect in PMMA using the theory of critical distances. Eng. Fract. Mech. 2012, 86, 56–72. [Google Scholar] [CrossRef]
  4. Niu, L.S.; Chehimi, C.; Pluvinage, G. Stress field near a large blunted V notch and application of the concept of notch stress intensity factor to the fracture of very brittle materials. Eng. Fract. Mech. 1994, 49, 325–335. [Google Scholar]
  5. Pluvinage, G. Fatigue and fracture emanating from notch; the use of the notch stress intensity factor. Nucl. Eng. Des. 1998, 185, 173–184. [Google Scholar] [CrossRef]
  6. Dugdale, D.S. Yielding of steel sheets containing slits. J. Mech. Phys. Solids 1960, 8, 100–108. [Google Scholar] [CrossRef]
  7. Gómez, F.J.; Elices, M.; Valiente, A. Cracking in PMMA containing U-shaped notches. Fat. Frac. Eng. Mat. Struct. 2000, 23, 795–803. [Google Scholar] [CrossRef]
  8. Weibull, W. The phenomenon of rupture in solids. Proc. R. Swed. Inst. Eng. Res. 1939, 153, 1–55. [Google Scholar]
  9. Beremin, F.M.; Pineau, A.; Mudry, F.; Devaux, J.C.; D’Escatha, Y.; Ledermann, P. A local criterion for cleavage fracture of a nuclear pressure vessel steel. Metall. Trans. A 1983, 14A, 2277–2287. [Google Scholar] [CrossRef]
  10. Ritchie, R.O.; Knott, J.F.; Rice, J.R. On the relationship between critical tensile stress and fracture toughness in mild steel. J. Mech. Phys. Solids 1973, 21, 395–410. [Google Scholar] [CrossRef]
  11. Sih, G.C. Strain-energy-density factor applied to mixed mode crack problems. Int. J. Fract. 1974, 10, 305–321. [Google Scholar] [CrossRef]
  12. Berto, F.; Lazzarin, P. Recent developments in brittle and quasi-brittle failure assessment of engineering materials by means of local approaches. Mater. Sci. Eng. R 2014, 75, 1–48. [Google Scholar] [CrossRef]
  13. Neuber, H. Theory of Notch Stresses: Principles for Exact Calculation of Strength with Reference to Structural form and Material; Springer: Berlin, Germany, 1958. [Google Scholar]
  14. Peterson, R.E. Notch sensitivity. In Metal Fatigue; McGraw Hill: New York, NY, USA, 1959; pp. 293–306. [Google Scholar]
  15. Susmel, L.; Taylor, D. On the use of the Theory of Critical Distances to predict failures in ductile metallic materials containing different geometrical features. Eng. Fract. Mech. 2008, 75, 4410–4421. [Google Scholar] [CrossRef]
  16. Susmel, L.; Taylor, D. An elasto-plastic reformulation of the Theory of Critical Distances to estimate lifetime of notched components failing in the low/medium-cycle fatigue regime. J. Eng. Mater. Technol. 2010, 132, 0210021–0210028. [Google Scholar] [CrossRef]
  17. Taylor, D. A mechanistic approach to critical-distance methods in notch fatigue. Fatig. Fract. Eng. Mater. Struct. 2001, 24, 215–224. [Google Scholar] [CrossRef]
  18. Creager, M.; Paris, P.C. Elastic field equations for blunt cracks with reference to stress corrosion cracking. Int. J. Fract. 1967, 3, 247–252. [Google Scholar] [CrossRef]
  19. Madrazo, V.; Cicero, S.; García, T. Assessment of notched structural steel components using failure assessment diagrams and the theory of critical distances. Eng. Fail. Anal. 2014, 36, 104–120. [Google Scholar] [CrossRef] [Green Version]
  20. Anderson, T.L. Fracture Mechanics: Fundamentals and Applications, 3rd ed.; CRC Press: Boca Raton, FL, USA, 2005. [Google Scholar]
  21. BS 7910. Guide to Methods for Assessing the Acceptability of Flaws in Metallic Structures; British Standards Institution: London, UK, 2013. [Google Scholar]
  22. Kocak, M.; Webster, S.; Janosch, J.J.; Ainsworth, R.A.; Koers, R. (Eds.) FITNET Fitness-for-Service (FFS) Procedure—Volume 1; GKSS Forschungzscentrum: Geesthacht, Germany, 2008. [Google Scholar]
  23. Cicero, S.; Madrazo, V.; García, T. Analysis of notch effect in the apparent fracture toughness and the fracture micromechanisms of ferritic–pearlitic steels operating within their lower shelf. Eng. Fail. Anal. 2014, 36, 322–342. [Google Scholar] [CrossRef] [Green Version]
  24. Cicero, S.; García, T.; Madrazo, V. Application and validation of the Notch Master Curve in medium and high strength structural steels. J. Mech. Sci. Tech. 2015, 29, 4129–4142. [Google Scholar] [CrossRef]
  25. ASTM E1820-09e1. Standard Test Method for Measurement of Fracture Toughness; American Society for Testing and Materials: Philadelphia, PA, USA, 2009. [Google Scholar]
  26. Quinn, G.D.; Bradt, R.C. On the Vickers Indentation Fracture Test. J. Am. Ceram. Soc. 2007, 90, 673–680. [Google Scholar] [CrossRef]
  27. Akono, A.T.; Randall, N.X.; Ulm, F.J. Experimental determination of the fracture toughness via microscratch tests: Application to polymers, ceramics, and metals. J. Mater. Res. 2012, 27, 485–493. [Google Scholar] [CrossRef]
  28. Akono, A.T.; Alm, F.J. An improved technique for characterizing the fracture toughness via scratch test experiments. Wear 2014, 313, 117–124. [Google Scholar] [CrossRef]
  29. Sola, R.; Giovanardi, R.; Parigi, G.; Varonesi, P. A Novel Method for Fracture Toughness Evaluation of Tool Steels with Post-Tempering Cryogenic Treatment. Metals 2017, 7, 75. [Google Scholar] [CrossRef]
  30. Lacalle, R.; Álvarez, J.A.; Gutiérrez-Solana, F. Use of Small Punch Notched Specimens in the Determination of Fracture Toughness. ASME Press. Vessels Pip. Conf. 2008, 6, 1363–1369. [Google Scholar] [CrossRef]
  31. Fuentes, J.D.; Cicero, S.; Procopio, I. Some default values to estimate the critical distance and their effect on structural integrity assessments. Theor. Appl. Fract. Mech. 2017, 90, 204–212. [Google Scholar] [CrossRef]
  32. Taylor, D.; Cornetti, P.; Pugno, N. The fracture mechanics of finite crack extension. Eng. Fract. Mech. 2005, 72, 1021–1038. [Google Scholar] [CrossRef]
  33. Susmel, L.; Taylor, D. The Theory of Critical Distances as an alternative experimental strategy for the determination of KIC and ΔKth. Eng. Fract. Mech. 2010, 77, 1492–1501. [Google Scholar] [CrossRef]
Figure 1. Experimental notch fracture toughness results, Line Method (LM) fitting and derivation of the corresponding critical distance. Steel S275JR at −120 °C.
Metals 08 00871 g001
Figure 2. m values versus tensile strength for structural steels operating at the Lower Shelf.
Metals 08 00871 g002
Figure 3. m values versus tensile strength for structural steels operating at the Ductile-to-Brittle Transition Zone. Derivation of a safe estimation (m = 13.0).
Metals 08 00871 g003
Figure 4. Apparent fracture toughness predictions (m derived from Equation (11)) and comparison with the experimental results. Structural steels operating at Lower Shelf temperatures.
Metals 08 00871 g004
Figure 5. Apparent fracture toughness predictions (m = 1.6) and comparison with the experimental results. Structural steels operating at Lower Shelf temperatures.
Metals 08 00871 g005
Figure 6. Apparent fracture toughness predictions (m derived from Equation (12)) and comparison with the experimental results. Structural steels operating at the DBTZ.
Metals 08 00871 g006
Figure 7. Apparent fracture toughness predictions (m = 13.0) and comparison with the experimental results. Structural steels operating at the DBTZ.
Metals 08 00871 g007
Table 1. Summary of the experimental results analyzed in this paper. LS: Lower Shelf; DBTZ: Ductile-to-Brittle Transition Zone [23,24].
SteelNumber of TestsKmat (MPa·m1/2)L (mm)σu (MPa)σ0 (MPa)
S275JR (−120 °C, LS)2348.800.01376147438
S275JR (−90 °C, LS)2462.720.006259714,211
S275JR (−50 °C, DBTZ)2480.600.004956520,543
S275JR (−30 °C, DBTZ)24100.700.006154923,003
S275JR (−10 °C, DBTZ)34122.800.008353624,048
S355J2 (−196 °C, LS)2431.270.01989233965
S355J2 (−150 °C, DBTZ)2160.560.008475811,789
S355J2 (−120 °C, DBTZ)22146.600.016867220,179
S355J2 (−100 °C, DBTZ)35157.400.014064723,734
S460M (−140 °C, DBTZ)2445.600.002879515,375
S460M (−120 °C, DBTZ)2488.290.007575918,189
S460M (−100 °C, DBTZ)3388.580.005372721,708
S690Q (−140 °C, DBTZ)2469.110.0069111214,844
S690Q (−120 °C, DBTZ)24103.800.0131106116,180
S690Q (−100 °C, DBTZ)34125.400.0170101617,159

