Fatigue Limit Improvement and Rendering Defects Harmless by Needle Peening for High Tensile Steel Welded Joint


1
Graduate School of Engineering, Yokohama National University, 79-5, Tokiwadai, Hodogaya-ku, Yokohama-city, Kanagawa 240-8501, Japan
2
Faculty of Engineering, Yokohama National University, Yokohama-city, Kanagawa 240-8501, Japan
3
Technology Development Group, Toyo Seiko Co., Ltd., Yatomi-city, Aichi 490-1412, Japan
*
Author to whom correspondence should be addressed.
Metals 2019, 9(2), 143; https://doi.org/10.3390/met9020143
Submission received: 11 January 2019
/
Revised: 25 January 2019
/
Accepted: 26 January 2019
/
Published: 28 January 2019
(This article belongs to the Special Issue Fracture, Fatigue and Structural Integrity of Metallic Materials)
Abstract
:The effects of needle peening (NP) on the bending fatigue limit of a high tensile steel (HTS) HT780 (JIS-SHY685)-welded joint containing an artificial semicircular slit on the weld toe were investigated. Three-point bending fatigue tests were conducted at a stress ratio of R = 0.05 for NP-treated welded specimens with and without a slit. The fatigue limits of all specimens increased by 9–200% due to the NP treatment. Furthermore, NP-treated specimens with slit depths of a = 1.0 mm exhibited high fatigue limits that were equal to those of NP-treated specimens without a slit. Therefore, a semicircular slit of less than a = 1.0 mm could be rendered harmless through NP treatment. This result indicates that the reliability of HTS-welded joints can be significantly improved via NP for surface defects with depths that are less than 1 mm, which are not detected through non-destructive inspection (NDI). Therefore, the problem regarding the reliability of HTS-welded joints that restricts the industrial utilization of HTS can be solved by performing both NDI and NP. The dominant factor that contributed to the improvement of the fatigue limit and increase in the acceptable defect size was the introduction of large and deep compressive residual stress with non-propagating cracks.

1. Introduction
Recently, the requirements of high tensile steel (HTS) have increased due to the growing demand to construct larger steel structures and reduce weight during steel transportation. However, utilizing welded HTS structures is difficult because the fatigue strength of the welded joints of HTS is at the same level of that of mild steel due to tensile residual stresses and stress concentration.
Recent studies showed that the fatigue strength of welded joints could be improved via weld toe treatments, such as needle peening (NP) [1,2] and high-frequency mechanical impact (HFMI) [3,4,5,6,7,8]. NP and HFMI introduce beneficial compressive residual stresses in the surface layer around the weld toe by repeatedly striking the surface with a needle pin, as shown in Figure 1. In addition, applying these methods results in work hardening and reduces the stress concentration at the weld toe.
Another problem of HTS is its low defect tolerance as the fatigue strength of HTS significantly decreases even if the defect size is small. Therefore, it is difficult to ensure the reliability of a HTS-welded joint even if non-destructive inspection (NDI) is conducted as small defects below the detection limit of NDI cannot be identified.
Research on the effectiveness of the peening treatment in improving the reliability of metal materials has been conducted based on the idea that compressive residual stress introduced by peening could restrain crack opening and render the crack harmless [9,10,11,12,13,14,15,16]. For example, Takahashi et al. [9] reported that the fatigue limit of a spring steel JIS-SUP9A specimen, which contained crack-like semicircular slits with a depth of 0.2 mm that decreased the fatigue limit by 50%, could be rendered harmless through shot peening. Furthermore, Houjou et al. [13] reported that the acceptable semicircular slit depths that could be rendered harmless after NP were 1.0 and 1.2 mm for stainless steel JIS-SUS316 and low-carbon steel JIS-SM490A welded joints, respectively. These results indicate that surface defects that are smaller than the detection limit of NDI, which was reported to be approximately 1-mm deep using a typical eddy current flaw detection method [17], can be rendered harmless by NP.
If the surface defects below the detection limit of NDI in a HTS-welded joint could be rendered harmless by NP, the reliability of the welded joint could be significantly improved and the industrial use of HTS would be expanded. Therefore, the present study involved clarifying the surface defect size in a HTS-welded joint that can be rendered harmless by NP.
Specifically, fatigue tests were conducted for both NP-treated and untreated HTS-welded specimens that contained crack-like semicircular slits at the weld toe. The fatigue limit of metals changes depending on residual stress, hardness, metal microstructure and stress concentrations. Therefore, the changes of these factors after NP were investigated to better understand the fatigue test results. Furthermore, the presence of non-propagating cracks was investigated on NP-treated welded specimens with a semicircular slit tested under the fatigue limit to ascertain whether an acceptable defect size could be determined through a crack initiation condition from the slit or a threshold condition for the crack propagation.
2. Materials and Methods
2.1. Test Material and Specimens
The test material was heat-treated HTS HT780 (JIS-SHY685). Table 1 and Table 2 show its chemical composition and mechanical properties, respectively.
The test material was supplied in the form of 7-mm-thick plates, as shown in Figure 2a. Tungsten inert gas welding was performed using a welding rod on the center of the narrow side of the plate. An automatic welding machine (Kobe Steel, Ltd., Kobe, Japan) was used to make the shape and dimensions of the weld bead as constant as possible. Table 3 presents the details of the welding conditions. The welded plate was cut to prepare the test specimens such that the longitudinal direction of the specimen corresponded to the rolling direction of the plate. Thirteen welded specimens were obtained from a welded plate. The shape and dimensions of the test specimen are shown in Figure 2b.
2.2. Needle Peening and the Introduction of the Surface Defect
Figure 3 shows the flow chart of the specimen preparation procedure and the types of specimens used for the fatigue test. Four groups of specimens were prepared, which were namely the welded specimen (W), NP-treated welded specimen (WN), welded specimen with a semicircular slit at the weld toe (WS) and NP-treated welded specimen with a semicircular slit at the weld toe (WNS).
NP was performed on both sides of the weld toe of welded specimens using a portable pneumatic needle-peening (PPP) unit. The PPP system manufactured by Toyo Seiko Co., Ltd., Yatomi, Japan, is a lightweight and hand-portable piece of equipment, which simplifies the application of this technique to various welded structures [2]. The peening conditions are shown in Table 4.
A semicircular slit similar to a surface crack was introduced after NP treatment on WNS to avoid the deformation of the slit by NP. Electronic discharge machining (Sodick Co.,Ltd., Yokohama, Japan) was used to introduce the semicircular slit. Figure 4 shows the slit introduction position, slit shape and dimensions. The slit was introduced within 0.1 mm of the weld toe of WS (Figure 4a). The machining position of the slit of WNS was at the bottom of the dent created by NP, as shown in Figure 4b. The dimensions of the slits were divided into two groups. As shown in Figure 4c, the diameter (2a) to depth (a) ratios in mm were 2.0/1.0 and 3.0/1.5. The slit size was determined based on the results of previous studies [13,15], which found the acceptable defect size after NP. The aperture width of the slit was approximately 0.1 mm. The depth of the slit is appended to the abbreviation for WS and WNS. For example, WNS1.0 denotes the NP-treated welded specimen with a 1.0-mm-deep semicircular slit at the weld toe.
2.3. Fatigue Test Method
Three-point bending fatigue tests were performed with load control using a hydraulic servo testing machine (Shimadzu Corp., Kyoto, Japan). The span length of the three-point bending was 80 mm and the position at which the maximum stress was applied was the same as that of the slit, as depicted in Figure 4d. All tests were performed at a stress of R = 0.05 and a frequency of f = 20 Hz. The fatigue limit was defined as the maximum stress amplitude at which the specimen could endure 1 × 10⁷ cycles.
2.4. Residual Stress Measurement
The residual stress was measured via the cosα method using X-ray diffraction from the {211} crystal plane with Cr-Kα radiation. The X-ray residual stress analyzer used was manufactured by Pulstec Industrial Co., Ltd., Hamamatsu, Japan. The diameter of the injected X-ray beam was 0.3 mm and the irradiation range of the X-ray beam was 0.8 mm. In-depth residual stress distributions were obtained by alternately measuring the residual stress on the surface and applying chemical etching to remove the surface layer. Stress correction calculation [18] was performed for each measurement result because stress redistribution occurred during the surface removal.
2.5. Hardness Measurement
In-depth hardness profiles of the weld toe at the surface layer of W and WN were measured using micro Vickers hardness tester manufactured by Shimadzu Corp., Kyoto, Japan. Vickers hardness was measured with an indentation load of 1.961 N and a holding time of 20 s.
2.6. Metal Microstructure Observation
The metal microstructure at the cross-section of W and WN prior to the fatigue test was observed after etching with 3% Nital to clarify the difference between the hardness profile of WN and that of W.
2.7. Finite Element Analysis of the Stress Concentration of the Weld Toe
Finite element (FE) models of W and WN were created based on the shape measurements of the specimens under the fatigue limit using a laser displacement gauge (Panasonic Corp., Kadoma, Japan). Young’s modulus and Poisson’s ratio were 203 GPa and 0.3, respectively. Elasticity analysis was conducted using universal analysis software (ANSYS ver. 19.0, ANSYS, Inc., Canonsburg, PA, USA).
2.8. Non-propagating Crack Observation
Non-propagating cracks were marked with a heat tint color via heat treatment at 573 K in air. The specimen was compulsorily fractured in a brittle manner using liquid nitrogen after a fatigue crack propagated under excessive cyclic loading.
3. Results and Discussion
3.1. Fatigue Test Results
The fatigue test results (S-N diagrams) are presented in Figure 5. The S-N diagram plots the nominal stress amplitude (σa) against cycles to fracture (Nf). Figure 6 summarizes all fatigue test results as the relationship between the fatigue limit (σw) and the depth of the semicircular slit (a). All fatigue test results were shown in Table A1, Table A2, Table A3, Table A4, Table A5 and Table A6 in appendix section.
In terms of the effect that the semicircular slit had on the fatigue limit, the fatigue limits of WS1.0 and WS1.5 were reduced by 64% compared to that of W. Furthermore, the fatigue limit was significantly lower due to the introduction of a slit, which resulted in a fatigue limit that was less than half that of W. However, the fatigue limit of the specimen treated with NP and WN was 9% higher than that of W. Moreover, the fatigue limits of WNS1.0 and WNS1.5 (i.e., the specimen with a slit treated by NP) were 100% and 200% higher than those of the specimen with a slit but without NP treatment, WS1.0 and WS1.5. The increased fatigue limit of the NP-treated sample with a slit (WNS1.0) was the same as that of the NP-treated sample without the slit (WN). NP remarkably affected the improvement of the fatigue limit for the welded specimen that contained a 1.0-mm-deep slit.
In the present study, a slit is deemed to be harmless if the fatigue test results satisfy either of the following two conditions, which were determined based on a previous study [9,13]:
- (a)
- The fatigue limit of WNS increased to the same level as that of WN.
- (b)
- WNS fractured at a location other than the slit.
The fatigue limit of WNS1.0 was equivalent to that of WN as described above. Therefore, a semicircular slit that is less than a = 1.0 mm can be rendered harmless following NP treatment because this situation satisfies condition (a). In addition, a fatigue crack occurred at a different location compared to the slit for all WNS1.0 samples that fractured during the fatigue test, which is indicated by the asterisks (*) in Figure 5b. The fracture surfaces of WNS1.0 and WNS1.5 that were observed using a digital optical microscope are shown in Figure 7. The fracture surface of WNS1.0 is completely different from that of WNS1.5 that fractured from the slit (Figure 7b). Therefore, a semicircular slit of a = 1.0 mm was rendered harmless in terms of the crack initiation location.
These results indicate that the fatigue limits containing surface defects with depths less than 1 mm, which are not detected through NDI (as mentioned in Section 1), are considered to be equal to that of WN. Therefore, the reliability of HTS-welded joints can be significantly improved via NP and the problem regarding the reliability of HTS-welded joints that restricts the industrial utilization of HTS can be solved by performing NP.
3.2. Residual Stress Measurement
The longitudinal residual stress measurement of the weld toe for W and WN was conducted prior to the fatigue test. The residual stress for WN after the fatigue test at a fatigue limit of σw = 240 MPa was also measured to investigate whether the compressive residual stress changed due to cyclic loading.
The residual stress distributions of W and WN are shown in Figure 8. The tensile residual stress was induced at the surface of the weld toe of W due to welding. However, this changed to a large compressive residual stress after NP treatment. The surface compressive residual stress prior to the fatigue test corresponded to approximately 820 MPa. The maximum compressive residual stress corresponded to 850 MPa and was measured at a depth of 0.4 mm. The distance from the surface to the zero residual stress point was approximately 1.3 mm. The residual stress of WN was redistributed due to cyclic loading and the compressive residual stress at the surface was reduced to 520 MPa. Moreover, it was slightly increased at a depth of 0.7–0.9 mm to maintain the equilibrium of the elastic stress field. The maximum compressive residual stress and the zero residual stress point were nearly the same before and after the fatigue test. Section 3.3 explains the reduction of surface compressive residual stress. However, the large and deep compressive residual stress remained high at positions of 1 mm and deeper even after the fatigue test, which greatly contributed to the improvement in the fatigue limit and extension of the acceptable slit size to a depth of 1.0 mm.
3.3. Hardness Measurement
In the in-depth hardness profiles of the weld toe at the surface layer of W and WN were measured prior to the fatigue test. The hardness profile of WN after the fatigue test at a fatigue limit of σw = 240 MPa was also measured to investigate the effect of cyclic loading on the hardness.
Figure 9 shows the in-depth hardness profiles. The hardness of W slightly changed (mean value of 360 HV), but this change was not significant. In contrast, the hardness near the surface of WN prior to the fatigue test corresponded to 510 HV, which was 1.5 times higher than that of W. The hardness of WN gradually decreased with increasing depth until it reached the same hardness of W at that depth, which was approximately 360 HV. Following the fatigue test, the hardness of WN at the surface reduced to 420 HV. At the points that are deeper than 0.15 mm from the surface, the hardness of WN decreased to nearly the same hardness it had prior to the fatigue test. The decrease in the hardness after the fatigue test indicates that the surface layer of WN became easy to yield after the fatigue test because of cyclic softening [19,20,21] caused by the specimen under a cyclic load. Therefore, the reduction in the surface compressive residual stress mentioned in Section 3.2 was caused by local yielding created by a large compressive residual stress.
3.4. Metal Microstructure Observation
Figure 10a,b shows the microstructure around the weld toe of W and WN, respectively. The plastic flow was observed at the location of the NP treatment, as shown in Figure 10b. Moreover, the crystal grains of WN (post NP) were micronized compared with the grains of W (without NP). Therefore, the increase in hardness was caused by grain refining and work hardening.
3.5. Finite Element Analysis of the Stress Concentration of the Weld Toe
Figure 11 shows the FE model of W. The model corresponded to symmetric half models of the welded specimen, which was comprised of a 20-node hexahedral element with a minimum element size of 0.05 mm. Figure 12 shows the elasticity analysis results at a normal bending stress of 200 MPa as the contour of the longitudinal stress around the weld toe. Figure 13 shows the distribution of the longitudinal stress at the weld toe, which was obtained from Figure 12. As shown in Figure 12 and Figure 13, the maximum stress appears to be generated at the bottom of the NP-generated dent of WN and is higher than that of W at the weld toe. The stress concentration factor Kt of the weld toe was calculated to compare the stress with nominal stress. We found that the Kt of W was 1.6 and Kt of WN was 1.8. The reason that the stress concentration increased after NP can be explained by the effect of the dent generated via NP, which is shown in Figure 12b.
Previous studies [14,15] reported that the stress concentration of the weld toe was reduced after NP for welded joints and indicated a high stress concentration factor of Kt of W, which was more than 2.0. However, notably, the stress concentration of the welded joint can increase after NP if a small NP is applied for the welded joint stress concentration at the weld toe.
3.6. Dominant Contributing Factor in Fatigue Limit Improvement due to NP
Considering the measurement and analysis results presented in Section 3.2, Section 3.3, Section 3.4 and Section 3.5, the dominant factor that contributed to the improvement in the fatigue limit and the increase in the acceptable defect depth to less than 1 mm was the introduction of large and deep compressive residual stress during NP. In addition, the increase in hardness at the surface due to work hardening and grain refining caused by NP also contributed to the improvement of the fatigue limit. The negative increase in stress concentration was canceled out by the improvement of residual stress and the increase in hardness.
3.7. Non-propagating Crack Observation
Figure 14 shows the fracture surface around the slit for WNS1.0 that was tested under the fatigue limit. Non-propagating cracks were observed along the slit front, which indicates that the propagation of the fatigue crack initiated from the slit stopped because of large and deep compressive residual stress, as described in Section 3.2.
Therefore, it was clarified that whether the slit affecting the fatigue limit of NP-treated welded joint was determined by the threshold condition for the crack propagation. Additionally, it was found that an acceptable fatigue crack size for the NP-treated welded joint was close to the slit size introduced in the present study, but it was slightly larger than the slit.
4. Conclusions
The present study involved clarifying both the improvement in the fatigue limit and the defect size that can be rendered harmless after NP on a HTS-welded joint containing an artificial semicircular slit on the weld toe. The important knowledge gained through our present study is presented as follows:
- (1)
- The fatigue limit of the defect-free welded specimen increased by 9% after NP at a stress ratio of R = 0.05. The fatigue limit of the welded specimen containing a 1.0-mm-deep semicircular slit was significantly increased (200%) by NP as the slit-containing specimen reached the same fatigue limit as that of the defect-free NP-treated welded specimen. This result indicates that the fatigue limits containing surface defects with depths less than 1 mm, which are not detected through NDI, are considered to be equal to that of the NP-treated welded specimen without a defect. Therefore, the reliability of HTS-welded joints can be significantly improved by NP and the problem regarding the reliability of HTS-welded joints that restricts the industrial utilization of HTS can be solved by performing NP.
- (2)
- The dominant factor that contributed to the improvement in the fatigue limit and increase in the acceptable defect size was the introduction of large and deep compressive residual stress during NP. Furthermore, the increase in hardness at the surface due to work hardening and grain refining caused by NP also contributed to the improvement in the fatigue limit.
- (3)
- It was clarified that whether the slit affecting the fatigue limit of NP-treated welded joint was determined by the threshold condition for the crack propagation. Additionally, it was found that an acceptable fatigue crack size for the NP-treated welded joint was close to the slit size introduced in the present study, but it was slightly larger than the slit.
Author Contributions
Conceptualization, R.F. and K.T.; methodology, R.F. and K.T.; peening treatment, M.H.; investigation, R.F.; finite element analysis, R.F.; data curation, R.F.; writing—original draft preparation, R.F.; writing—review and editing, K.T. and M.H.; visualization, R.F.; supervision, K.T.
Funding
This research was funded by the Grant-in-Aid for JSPS Research Fellow (grant number 17J00191).
Acknowledgments
The authors would like to acknowledge Kotoji Ando from the Yokohama National University, Japan, for his valuable comments.
Conflicts of Interest
The authors declare no conflict of interest.
Appendix A
Table A1, Table A2, Table A3, Table A4, Table A5 and Table A6 summarizes all fatigue test results. Three-point bending fatigue tests were performed with load control using a hydraulic servo testing machine. The span length of the three-point bending was 80 mm. All tests were performed at a stress of R = 0.05 and a frequency of f = 20 Hz. The fatigue test was terminated after 1 × 10⁷ cycles.

Table A1.
Fatigue test results for W.
| Specimen ID | Stress Amplitude σa | Cycles to Failure Nf | Fracture Origin |
|---|---|---|---|
| 7 | 280 | 353,975 | Weld toe |
| 4 | 260 | 4,163,922 | Weld toe |
| 5 | 240 | 7,816,232 | Weld toe |
| 3 | 220 | >10,000,000 | Run-out |
| 6 | 200 | >10,000,000 | Run-out |
Table A2.
Fatigue test results for WS1.0.
| Specimen ID | Stress Amplitude σa | Cycles to Failure Nf | Fracture Origin |
|---|---|---|---|
| 21 | 100 | 2,103,232 | Slit |
| 23 | 90 | 2,963,700 | Slit |
| 16 | 80 | >10,000,000 | Run-out |
Table A3.
Fatigue test results for WS1.5.
| Specimen ID | Stress Amplitude σa | Cycles to Failure Nf | Fracture Origin |
|---|---|---|---|
| 97 | 120 | 1,820,548 | Slit |
| 99 | 100 | 4,228,474 | Slit |
| 96 | 80 | >10,000,000 | Run-out |
Table A4.
Fatigue test results for WN.
| Specimen ID | Stress Amplitude σa | Cycles to Failure Nf | Fracture Origin |
|---|---|---|---|
| 36 | 340 | 214,915 | Bottom of dent |
| 27 | 280 | 530,242 | Bottom of dent |
| 110 | 280 | 557,058 | Bottom of dent |
| 37 | 260 | >10,000,000 | Run-out |
| 113 | 260 | 1,323,142 | Bottom of dent |
| 35 | 240 | >10,000,000 | Run-out |
| 116 | 240 | >10,000,000 | Run-out |
Table A5.
Fatigue test results for WNS1.0.
| Specimen ID | Stress Amplitude σa | Cycles to Failure Nf | Fracture Origin |
|---|---|---|---|
| 100 | 280 | 500,542 | Outside of the slit |
| 117 | 260 | 756,941 | Outside of the slit |
| 114 | 240 | >10,000,000 | Run-out |
Table A6.
Fatigue test results for WNS1.5.
| Specimen ID | Stress Amplitude σa | Cycles to Failure Nf | Fracture Origin |
|---|---|---|---|
| 106 | 220 | 1,081,373 | Slit |
| 108 | 200 | 1,473,980 | Slit |
| 112 | 180 | 1,566,177 | Slit |
| 107 | 160 | >10,000,000 | Run-out |
References
- Haagensen, P.J.; Maddox, S.J. IIW Recommendations on Post Weld Improvement of Steel and Aluminium Structures. IIW Comm. XIII 2001, XIII–1815–00, 29. [Google Scholar]
- NETIS New Technology Information System No.CB-120011-A. Available online: http://www.netis.mlit.go.jp (accessed on 27 January 2019).
- Marquis, G.B.; Mikkola, E.; Yildirim, H.C.; Barsoum, Z. Fatigue strength improvement of steel structures by high-frequency mechanical impact: Proposed fatigue assessment guidelines. Weld. World 2013, 57, 803–822. [Google Scholar] [CrossRef]
- Berg, J.; Stranghoener, N. Fatigue Strength of Welded Ultra High Strength Steels Improved by High Frequency Hammer Peening. Procedia Mater. Sci. 2014, 3, 71–76. [Google Scholar] [CrossRef] [Green Version]
- Wang, T.; Wang, D.; Huo, L.; Zhang, Y. Discussion on fatigue design of welded joints enhanced by ultrasonic peening treatment (UPT). Int. J. Fatigue 2009, 31, 644–650. [Google Scholar] [CrossRef]
- Zhao, X.; Wang, D.; Huo, L. Analysis of the S-N curves of welded joints enhanced by ultrasonic peening treatment. Mater. Des. 2011, 32, 88–96. [Google Scholar] [CrossRef]
- Nose, T. Ultrasonic Peening Method for Fatigue Strength Improvement. J. JAPAN Weld. Soc. 2008, 77, 210–213. [Google Scholar] [CrossRef]
- Yildirim, H.C.; Marquis, G.B. Fatigue strength improvement factors for high strength steel welded joints treated by high frequency mechanical impact. Int. J. Fatigue 2012, 44, 168–176. [Google Scholar] [CrossRef]
- Takahashi, K.; Amano, T.; Hanaori, K.; Ando, K.; Takahashi, F. Improvement of Fatigue Limit by Shot Peening for High Strength Steel Specimens Containing a Crack-like Surface Defect. J. Soc. Mater. Sci. Japan 2009, 58, 1030–1036. [Google Scholar] [CrossRef]
- Takahashi, K.; Amano, T.; Ando, K.; Takahashi, F. Improvement of fatigue limit by shot peening for high-strength steel containing a crack-like surface defect. Int. J. Struct. Integr. 2011, 2, 281–292. [Google Scholar] [CrossRef]
- Houjou, K.; Takahashi, K.; Ando, K. Improvement of fatigue limit by shot peening for high-tensile strength steel containing a crack in the stress concentration zone. Int. J. Struct. Integr. 2013, 4, 258–266. [Google Scholar] [CrossRef]
- Yasuda, J.; Takahashi, K.; Okada, H. Improvement of fatigue limit by shot peening for high-strength steel containing a crack-like surface defect: Influence of stress ratio. Int. J. Struct. Integr. 2014, 5, 45–59. [Google Scholar] [CrossRef]
- Houjou, K.; Takahashi, K.; Ando, K.; Abe, H. Effect of peening on the fatigue limit of welded structural steel with surface crack and rendering the crack harmless. Int. J. Struct. Integr. 2014, 5, 279–289. [Google Scholar] [CrossRef]
- Fueki, R.; Takahashi, K.; Houjou, K. Fatigue Limit Prediction and Estimation for the Crack Size Rendered Harmless by Peening for Welded Joint Containing a Surface Crack. Mater. Sci. Appl. 2015, 06, 500–510. [Google Scholar] [CrossRef]
- Fueki, R.; Takahashi, K. Prediction of fatigue limit improvement in needle peened welded joints containing crack-like defects. Int. J. Struct. Integr. 2018, 9, 50–64. [Google Scholar] [CrossRef]
- Takahashi, K.; Osedo, H.; Suzuki, T.; Fukuda, S. Fatigue strength improvement of an aluminum alloy with a crack-like surface defect using shot peening and cavitation peening. Eng. Fract. Mech. 2018, 193, 151–161. [Google Scholar] [CrossRef]
- Miki, C.; Fukazawa, M.; Katoh, M.; Ohune, H. Feasibility Study on Detection of Fatigue Crack in Fillet Welded Joint. J. Japan Soc. Civ. Eng. 1987, 1987, 329–337. [Google Scholar]
- Society of Automotive Engineers. Residual Stress Measurement by X-Ray Diffraction-SAE J784a; SAE International: Warrendale, PA, USA, 1971. [Google Scholar]
- Abel, A.; Muir, H. The effect of cyclic loading on subsequent yielding. Acta Metall. 1973, 21, 93–97. [Google Scholar] [CrossRef]
- Thielen, P.N.; Fine, M.E.; Fournelle, R.A. Cyclic stress strain relations and strain-controlled fatigue of 4140 steel. Acta Metall. 1976, 24, 1–10. [Google Scholar] [CrossRef]
- Yoshida, M.; Asano, T.; Fujishiro, Y.; Shirai, Y. Cyclic Softening of the High-strength Steel HT780 Studied by Positron Annihilation Spectroscopy. Tetsu-to-Hagane 2005, 91, 403–407. [Google Scholar] [CrossRef]
Figure 1.
Schematic view of needle peening (NP) at the weld toe. NP introduces beneficial compressive residual stresses in the surface layer around the weld toe by repeatedly striking the surface with a needle pin.
Figure 1.
Schematic view of needle peening (NP) at the weld toe. NP introduces beneficial compressive residual stresses in the surface layer around the weld toe by repeatedly striking the surface with a needle pin.
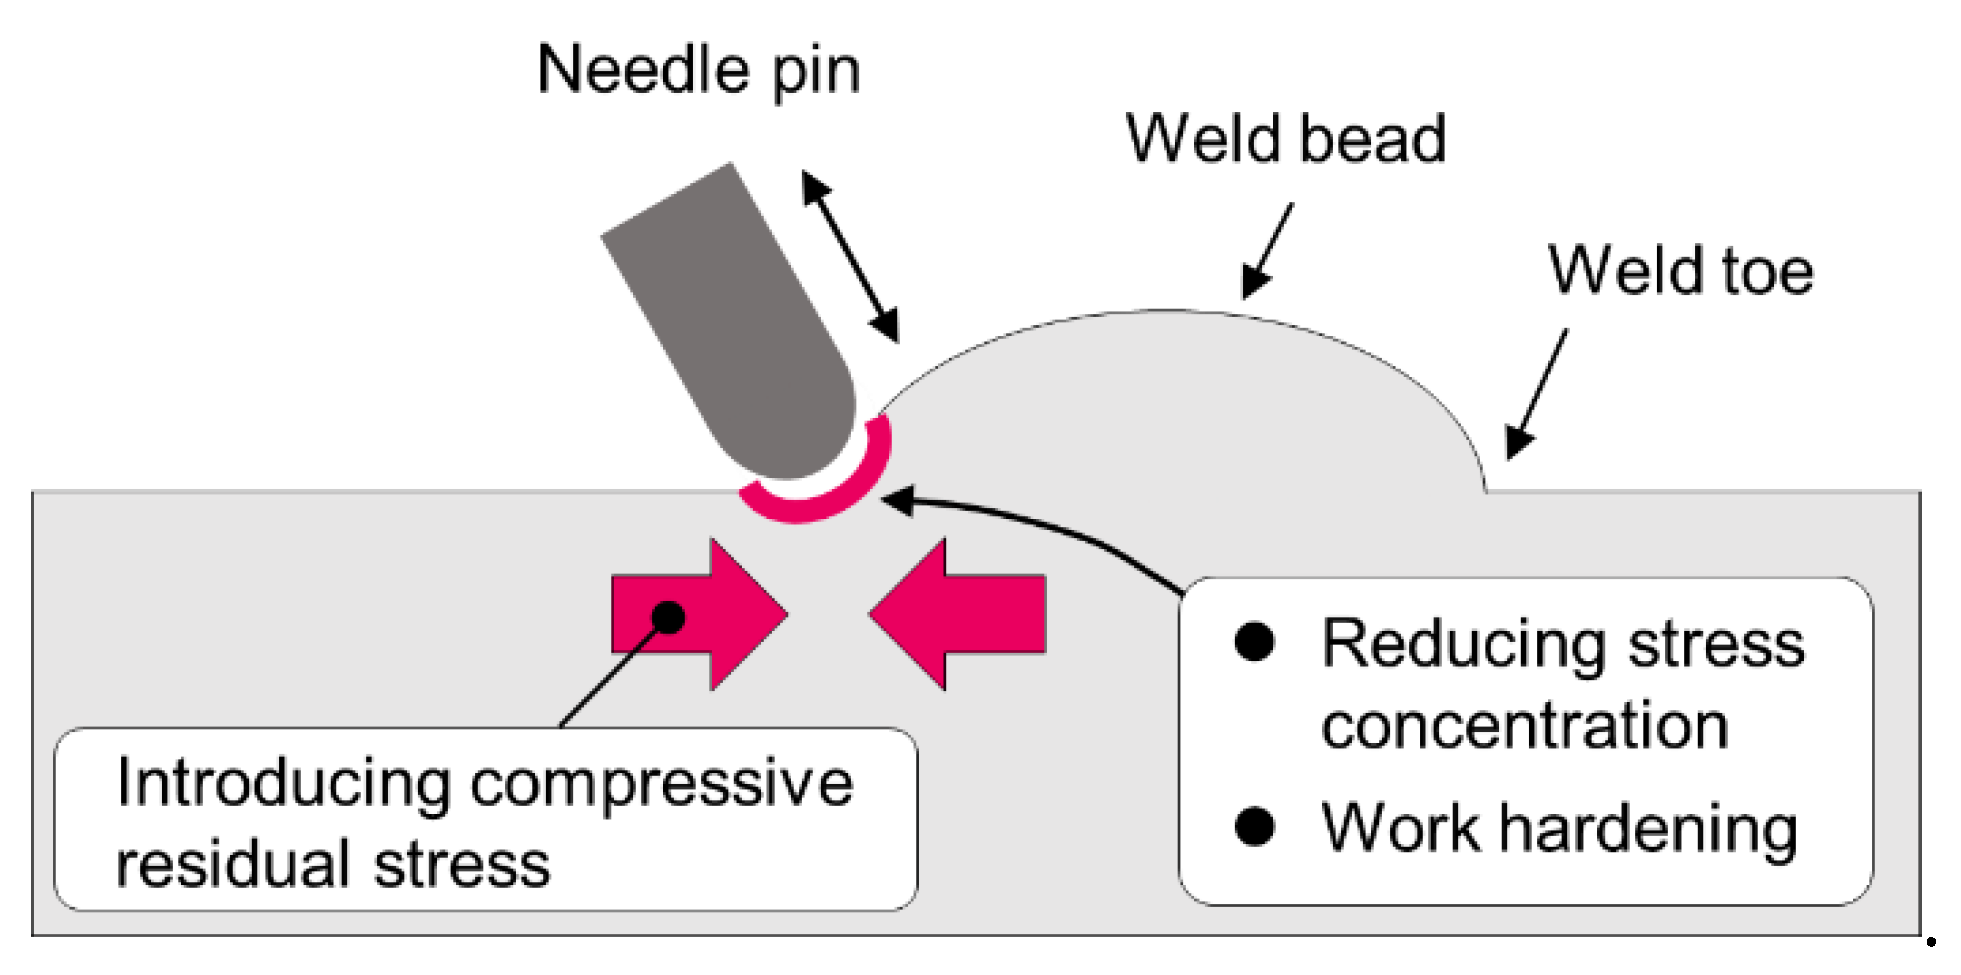
Figure 2.
Shape and dimensions of (a) the welded plate and (b) the test specimen. The test material was supplied in the form of 7-mm-thick plates. The welded plate was cut to prepare the test specimens such that the longitudinal direction of the specimen corresponded to the rolling direction of the plate.
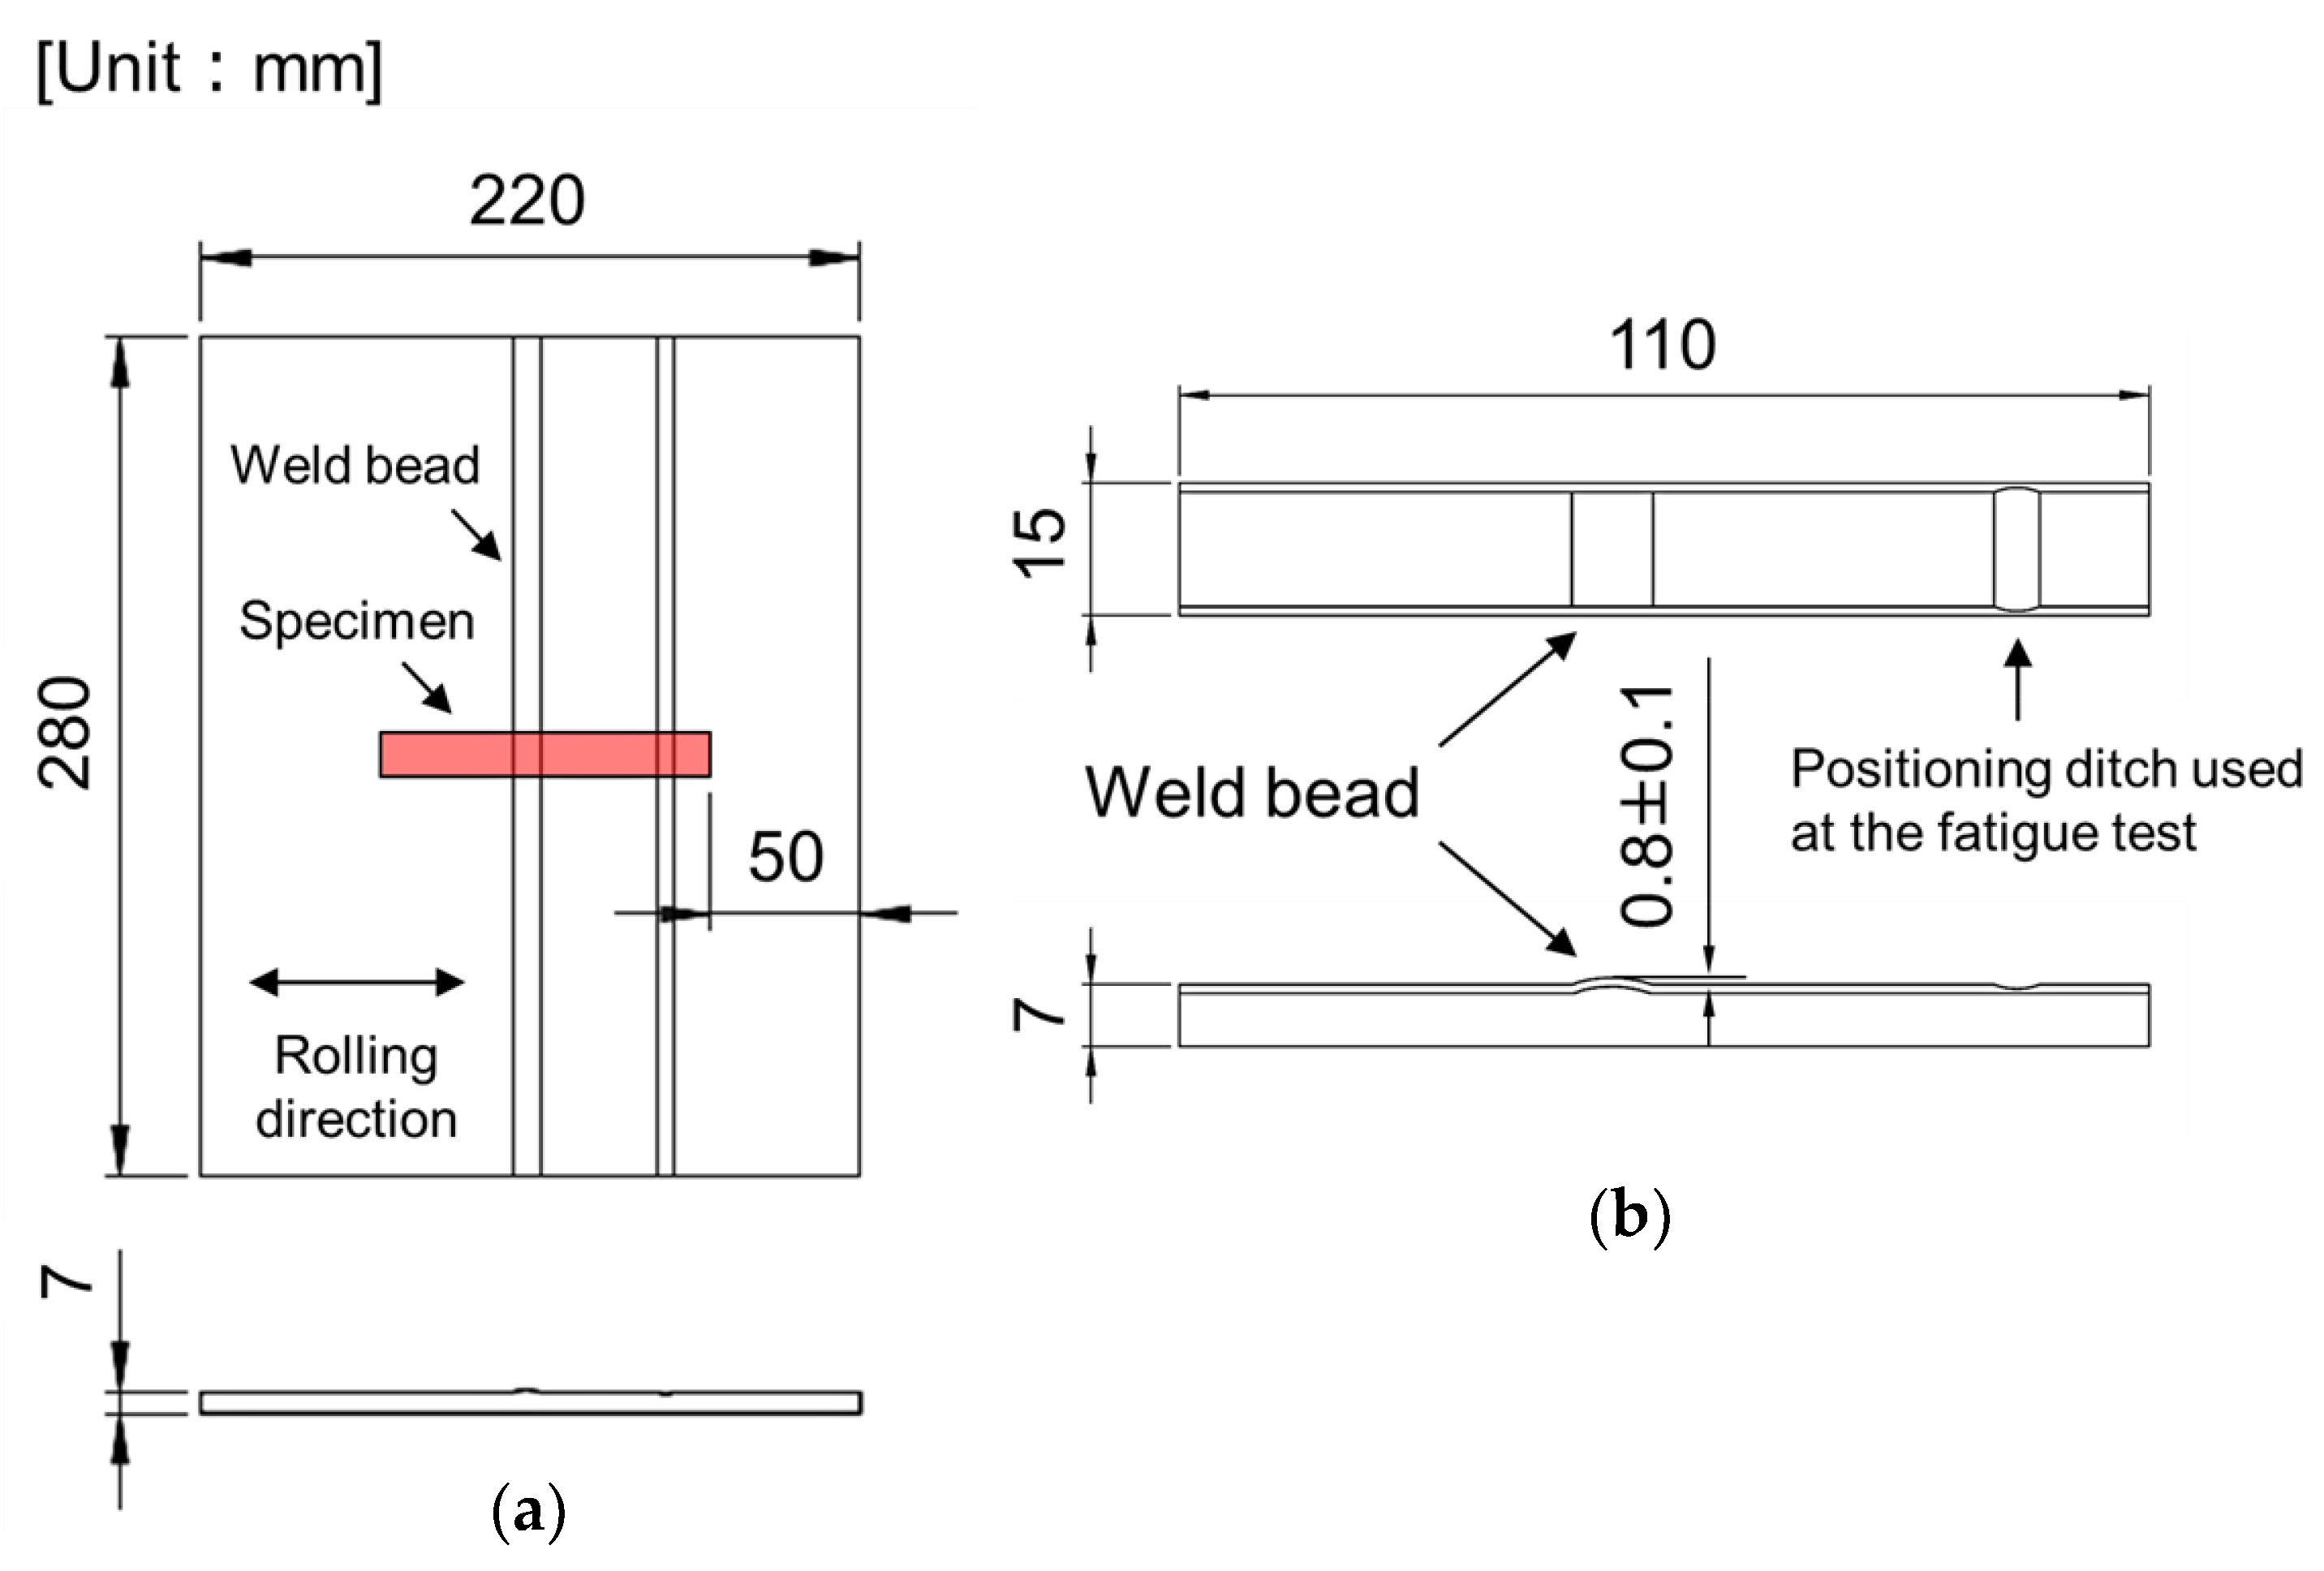
Figure 3.
Flow chart of specimen preparation and types of specimens. Four groups of specimens were prepared, which were namely the welded specimen (W), NP-treated welded specimen (WN), welded specimen with a semicircular slit at the weld toe (WS) and NP-treated welded specimen with a semicircular slit at the weld toe (WNS).
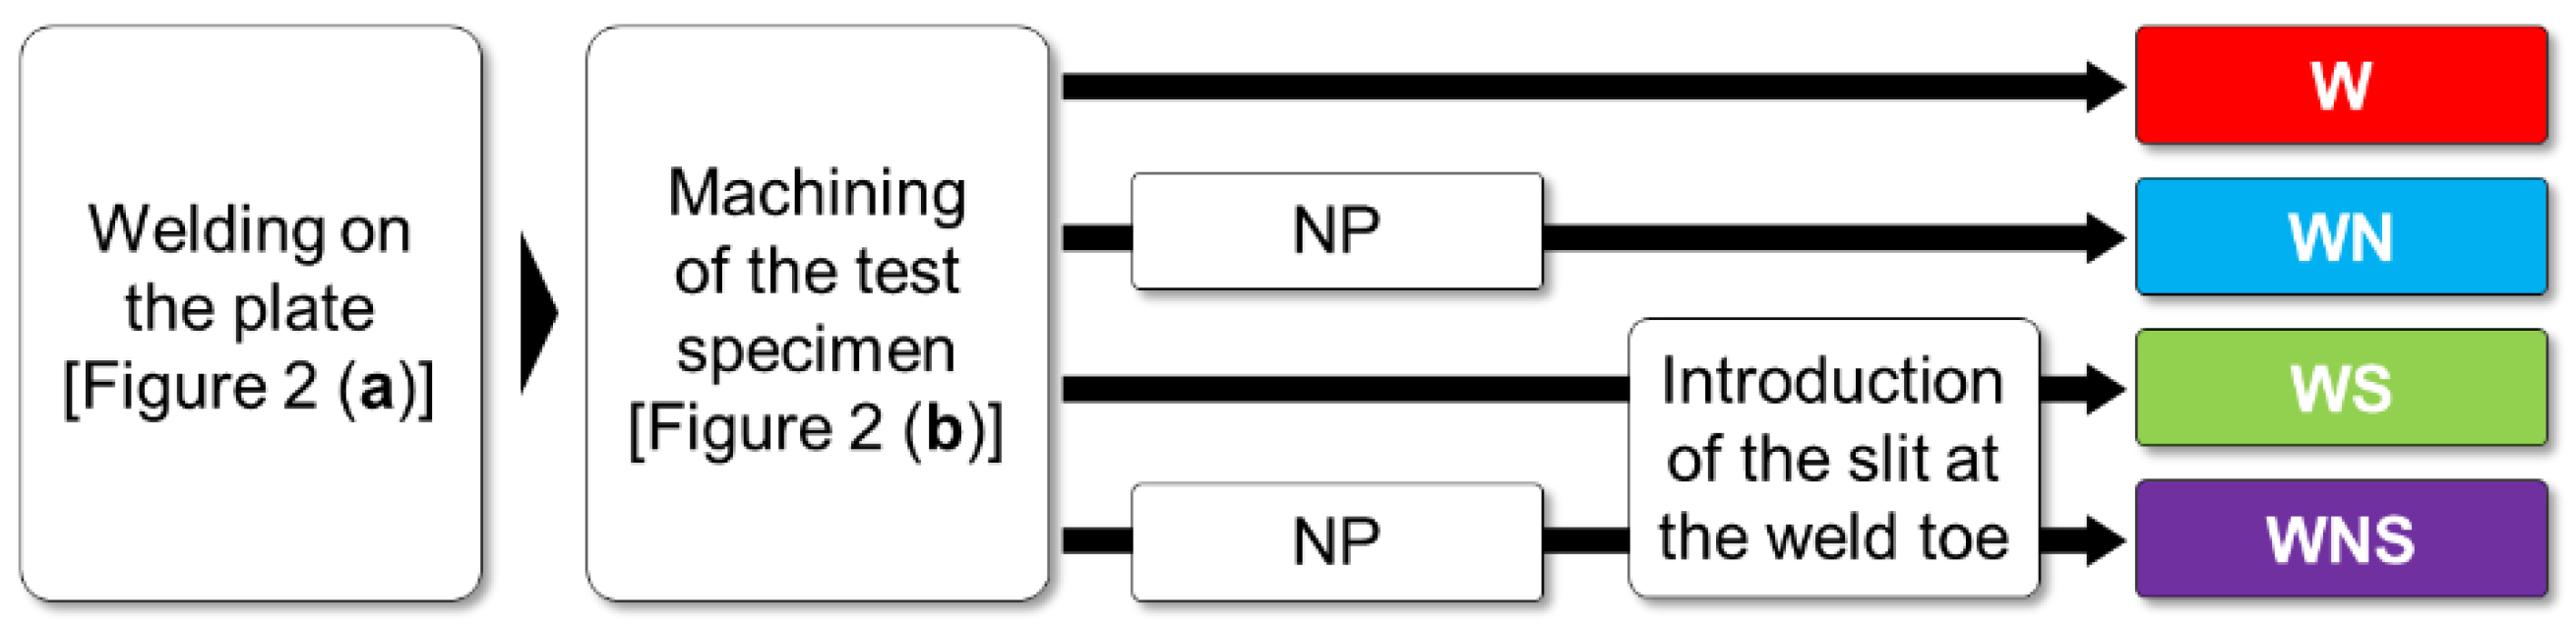
Figure 4.
Overview of the slit and loading point: (a) position of the slit with respect to the weld bead; (b) position of the slit with respect to the weld bead and the location of the NP treatment; (c) shape and dimensions of the semi-circular slit where a is the slit depth; and (d) relationship between the slit position and loading point.
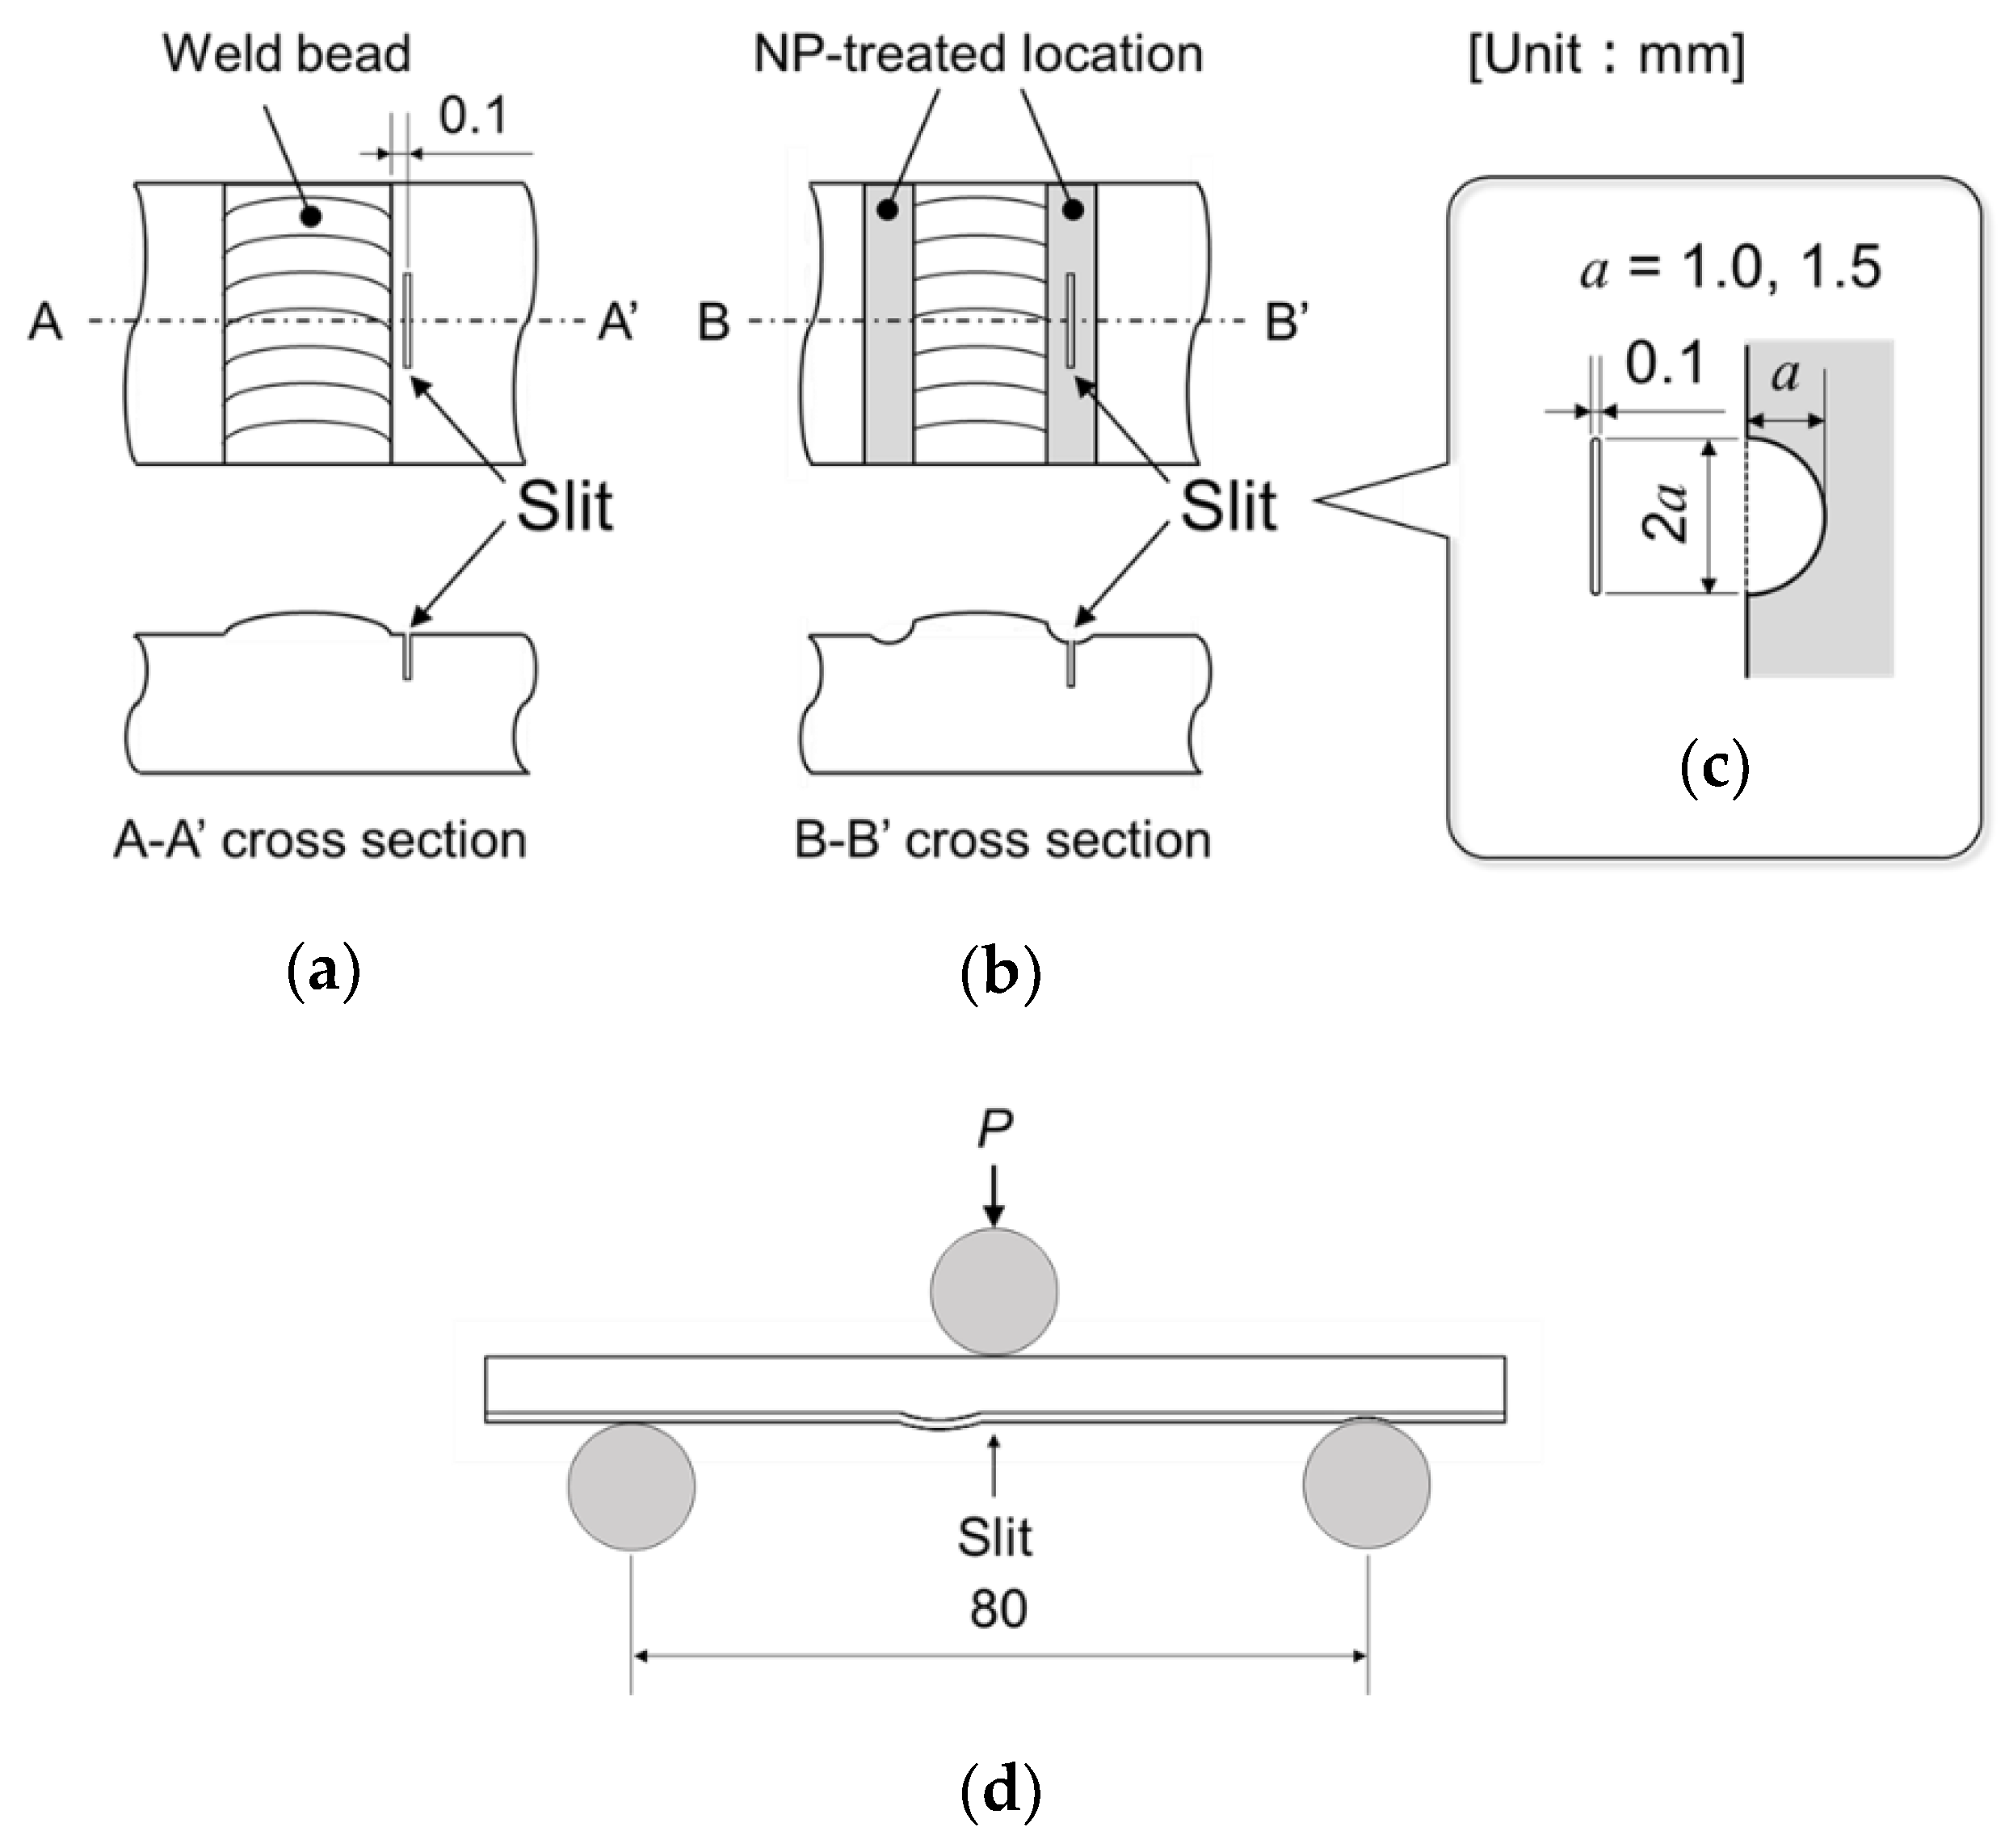
Figure 5.
S-N diagram of (a) W and WN, (b) WS1.0 and WNS1.0 and (c) WS1.5 and WNS 1.5. The S-N diagram plots nominal stress amplitude (σa) against cycles to fracture (Nf). Three-point bending fatigue tests were performed with load control. The span length of the three-point bending was 80 mm. All tests were performed at a stress of R = 0.05 and a frequency of f = 20 Hz. The fatigue test was terminated after 1 × 10⁷ cycles. The asterisks (*) indicate that a fatigue crack occurred at a different location compared to the slit. Fatigue limits σw for each type of the specimen were indicated outside the frame of the graph.
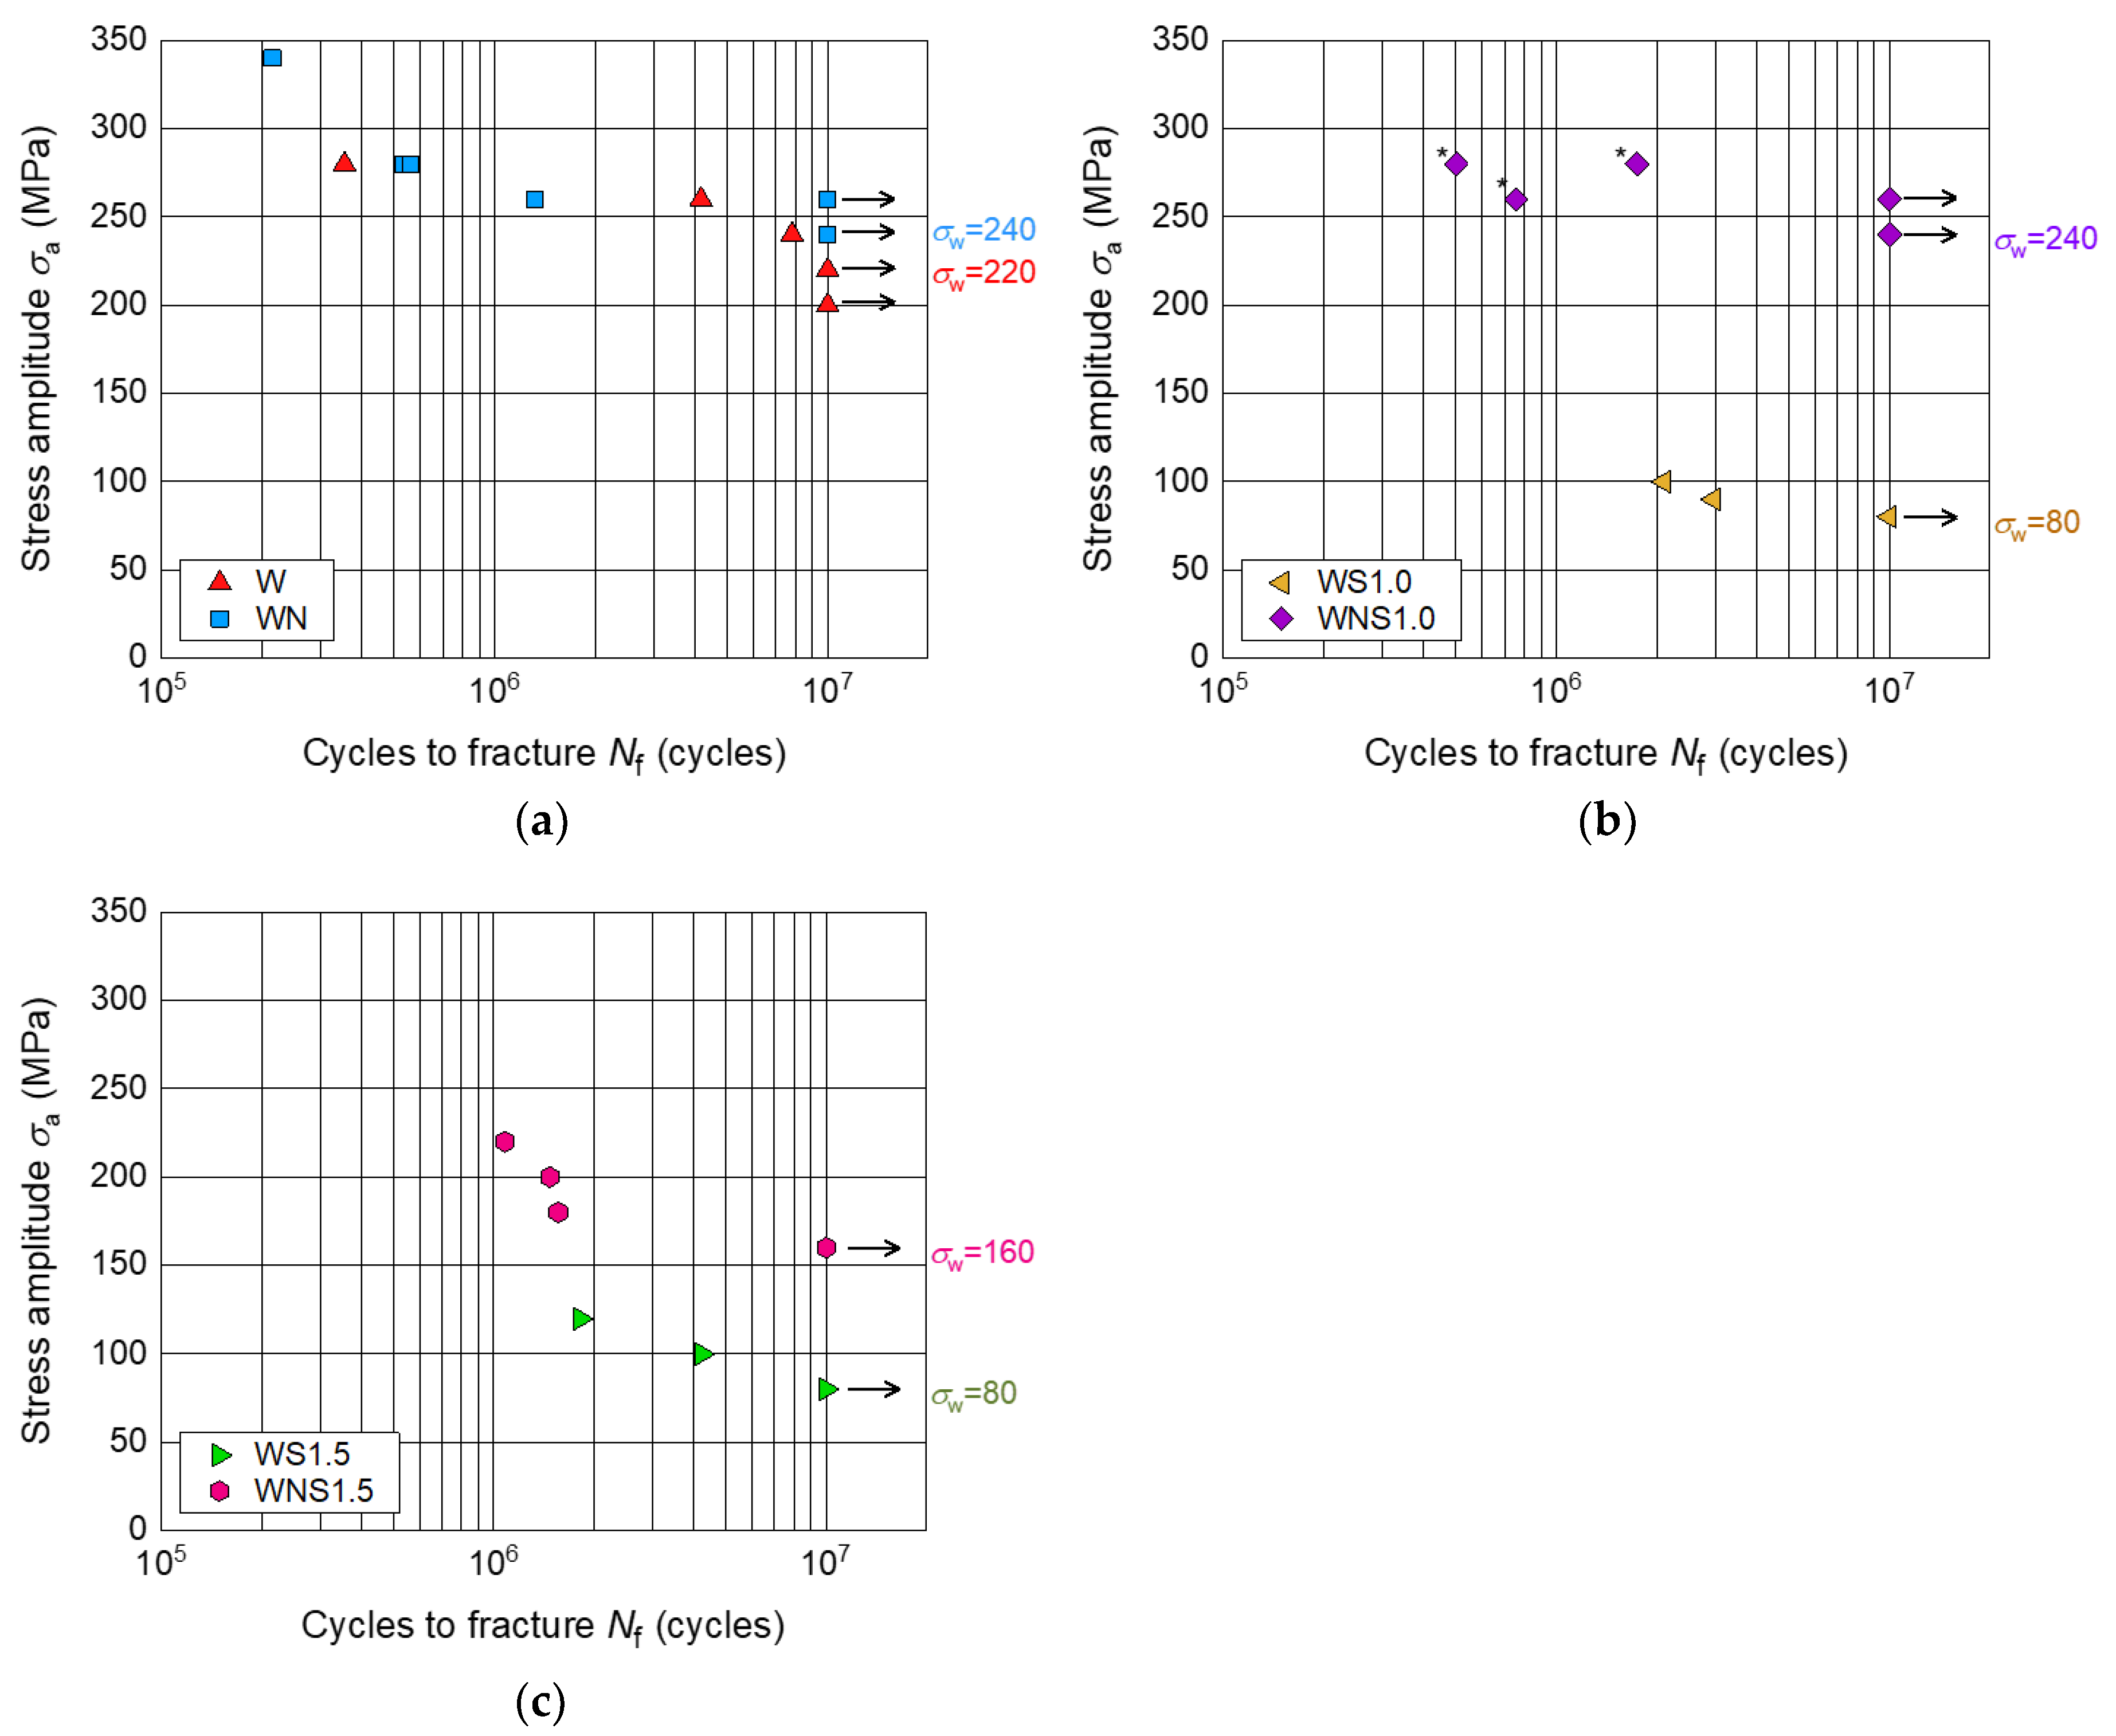
Figure 6.
Relationship between the fatigue limit and the semicircular slit depth. The fatigue limit was defined as the maximum stress amplitude at which the specimen could endure 1 × 10⁷ cycles.
Figure 6.
Relationship between the fatigue limit and the semicircular slit depth. The fatigue limit was defined as the maximum stress amplitude at which the specimen could endure 1 × 10⁷ cycles.
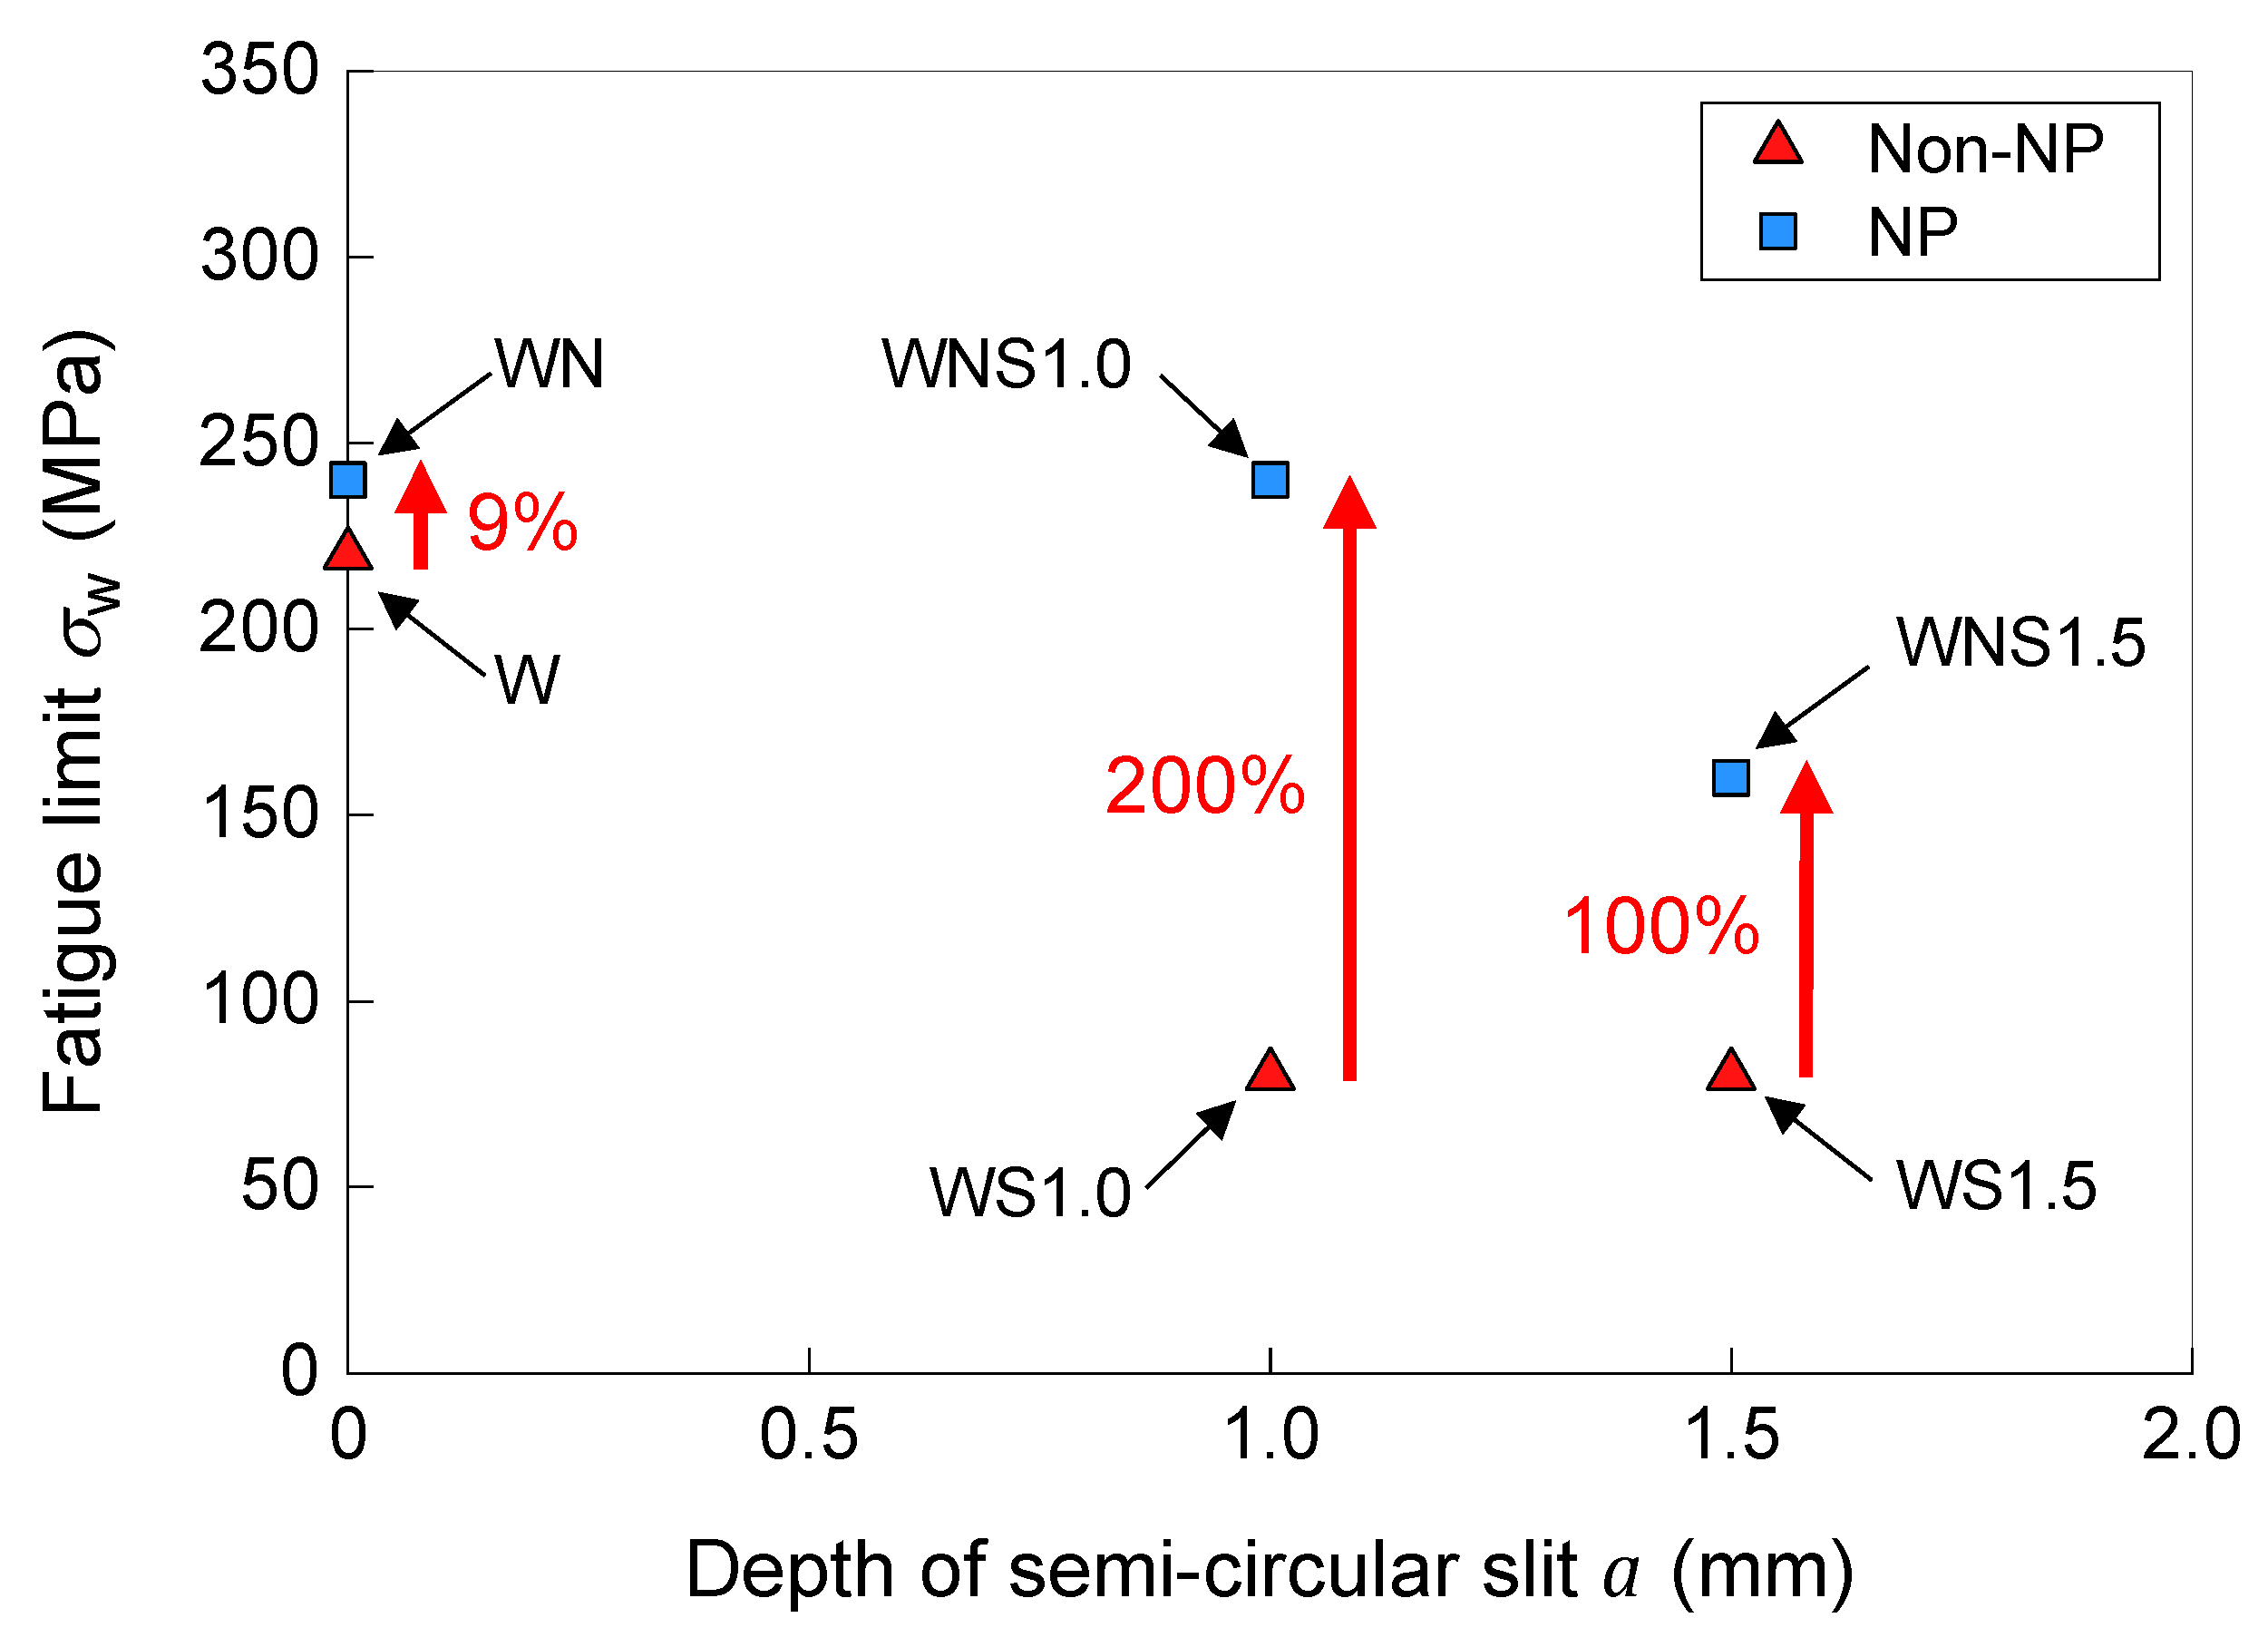
Figure 7.
Fracture surfaces of (a) WNS1.0 at σa = 260 MPa and (b) WNS1.5 at σa = 220 MPa observed using a digital optical microscope.
Figure 7.
Fracture surfaces of (a) WNS1.0 at σa = 260 MPa and (b) WNS1.5 at σa = 220 MPa observed using a digital optical microscope.
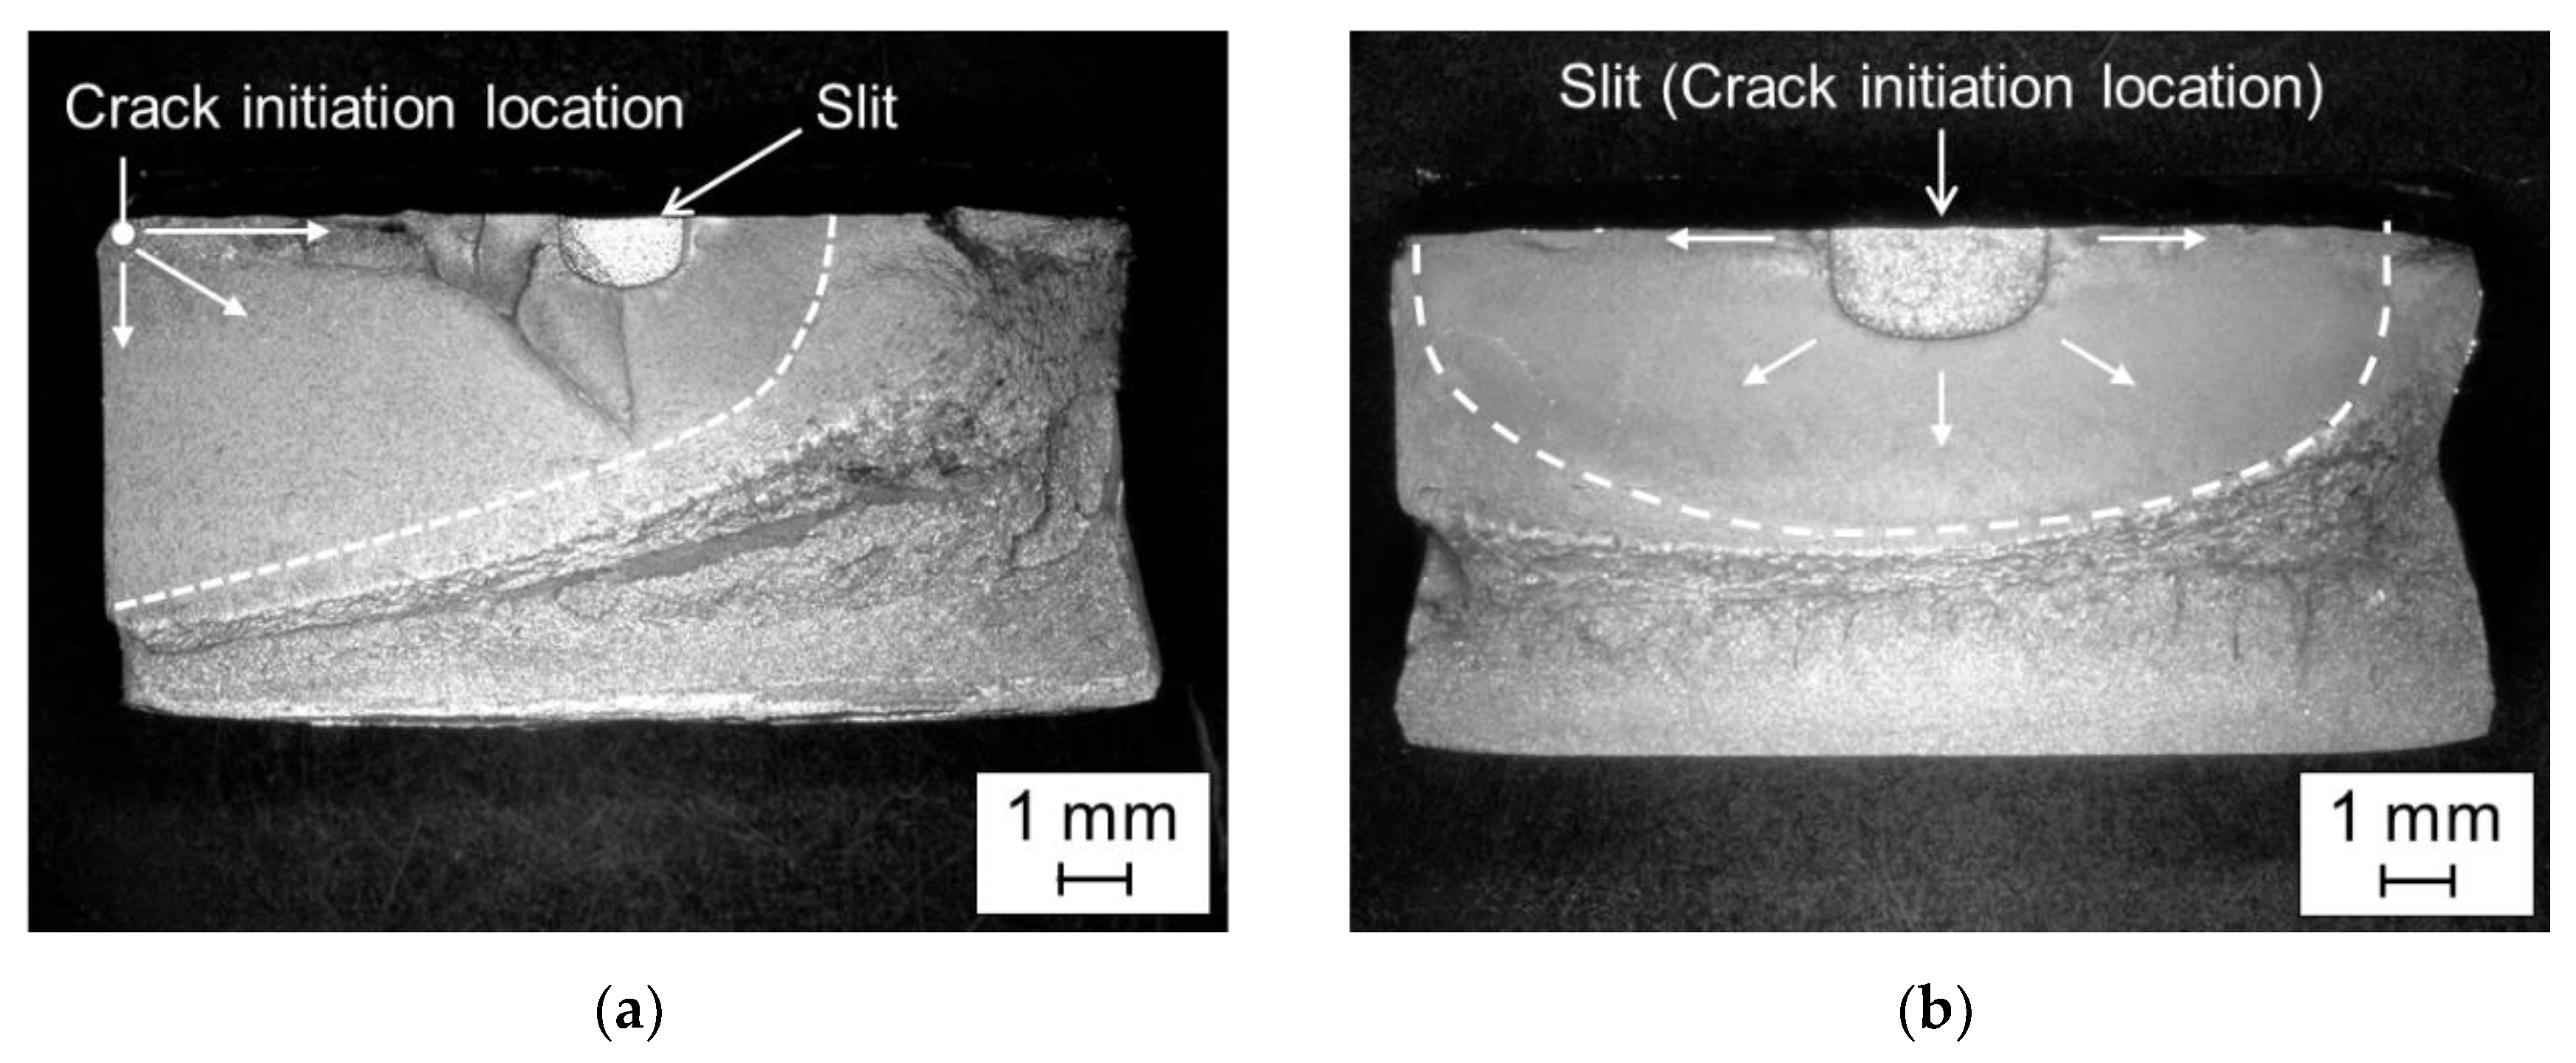
Figure 8.
Residual stress distribution at the weld toe. The longitudinal residual stress measurement of the weld toe for W and WN was obtained prior to the fatigue test. The residual stress for WN after the fatigue test at a fatigue limit of σw = 240 MPa was also measured.
Figure 8.
Residual stress distribution at the weld toe. The longitudinal residual stress measurement of the weld toe for W and WN was obtained prior to the fatigue test. The residual stress for WN after the fatigue test at a fatigue limit of σw = 240 MPa was also measured.
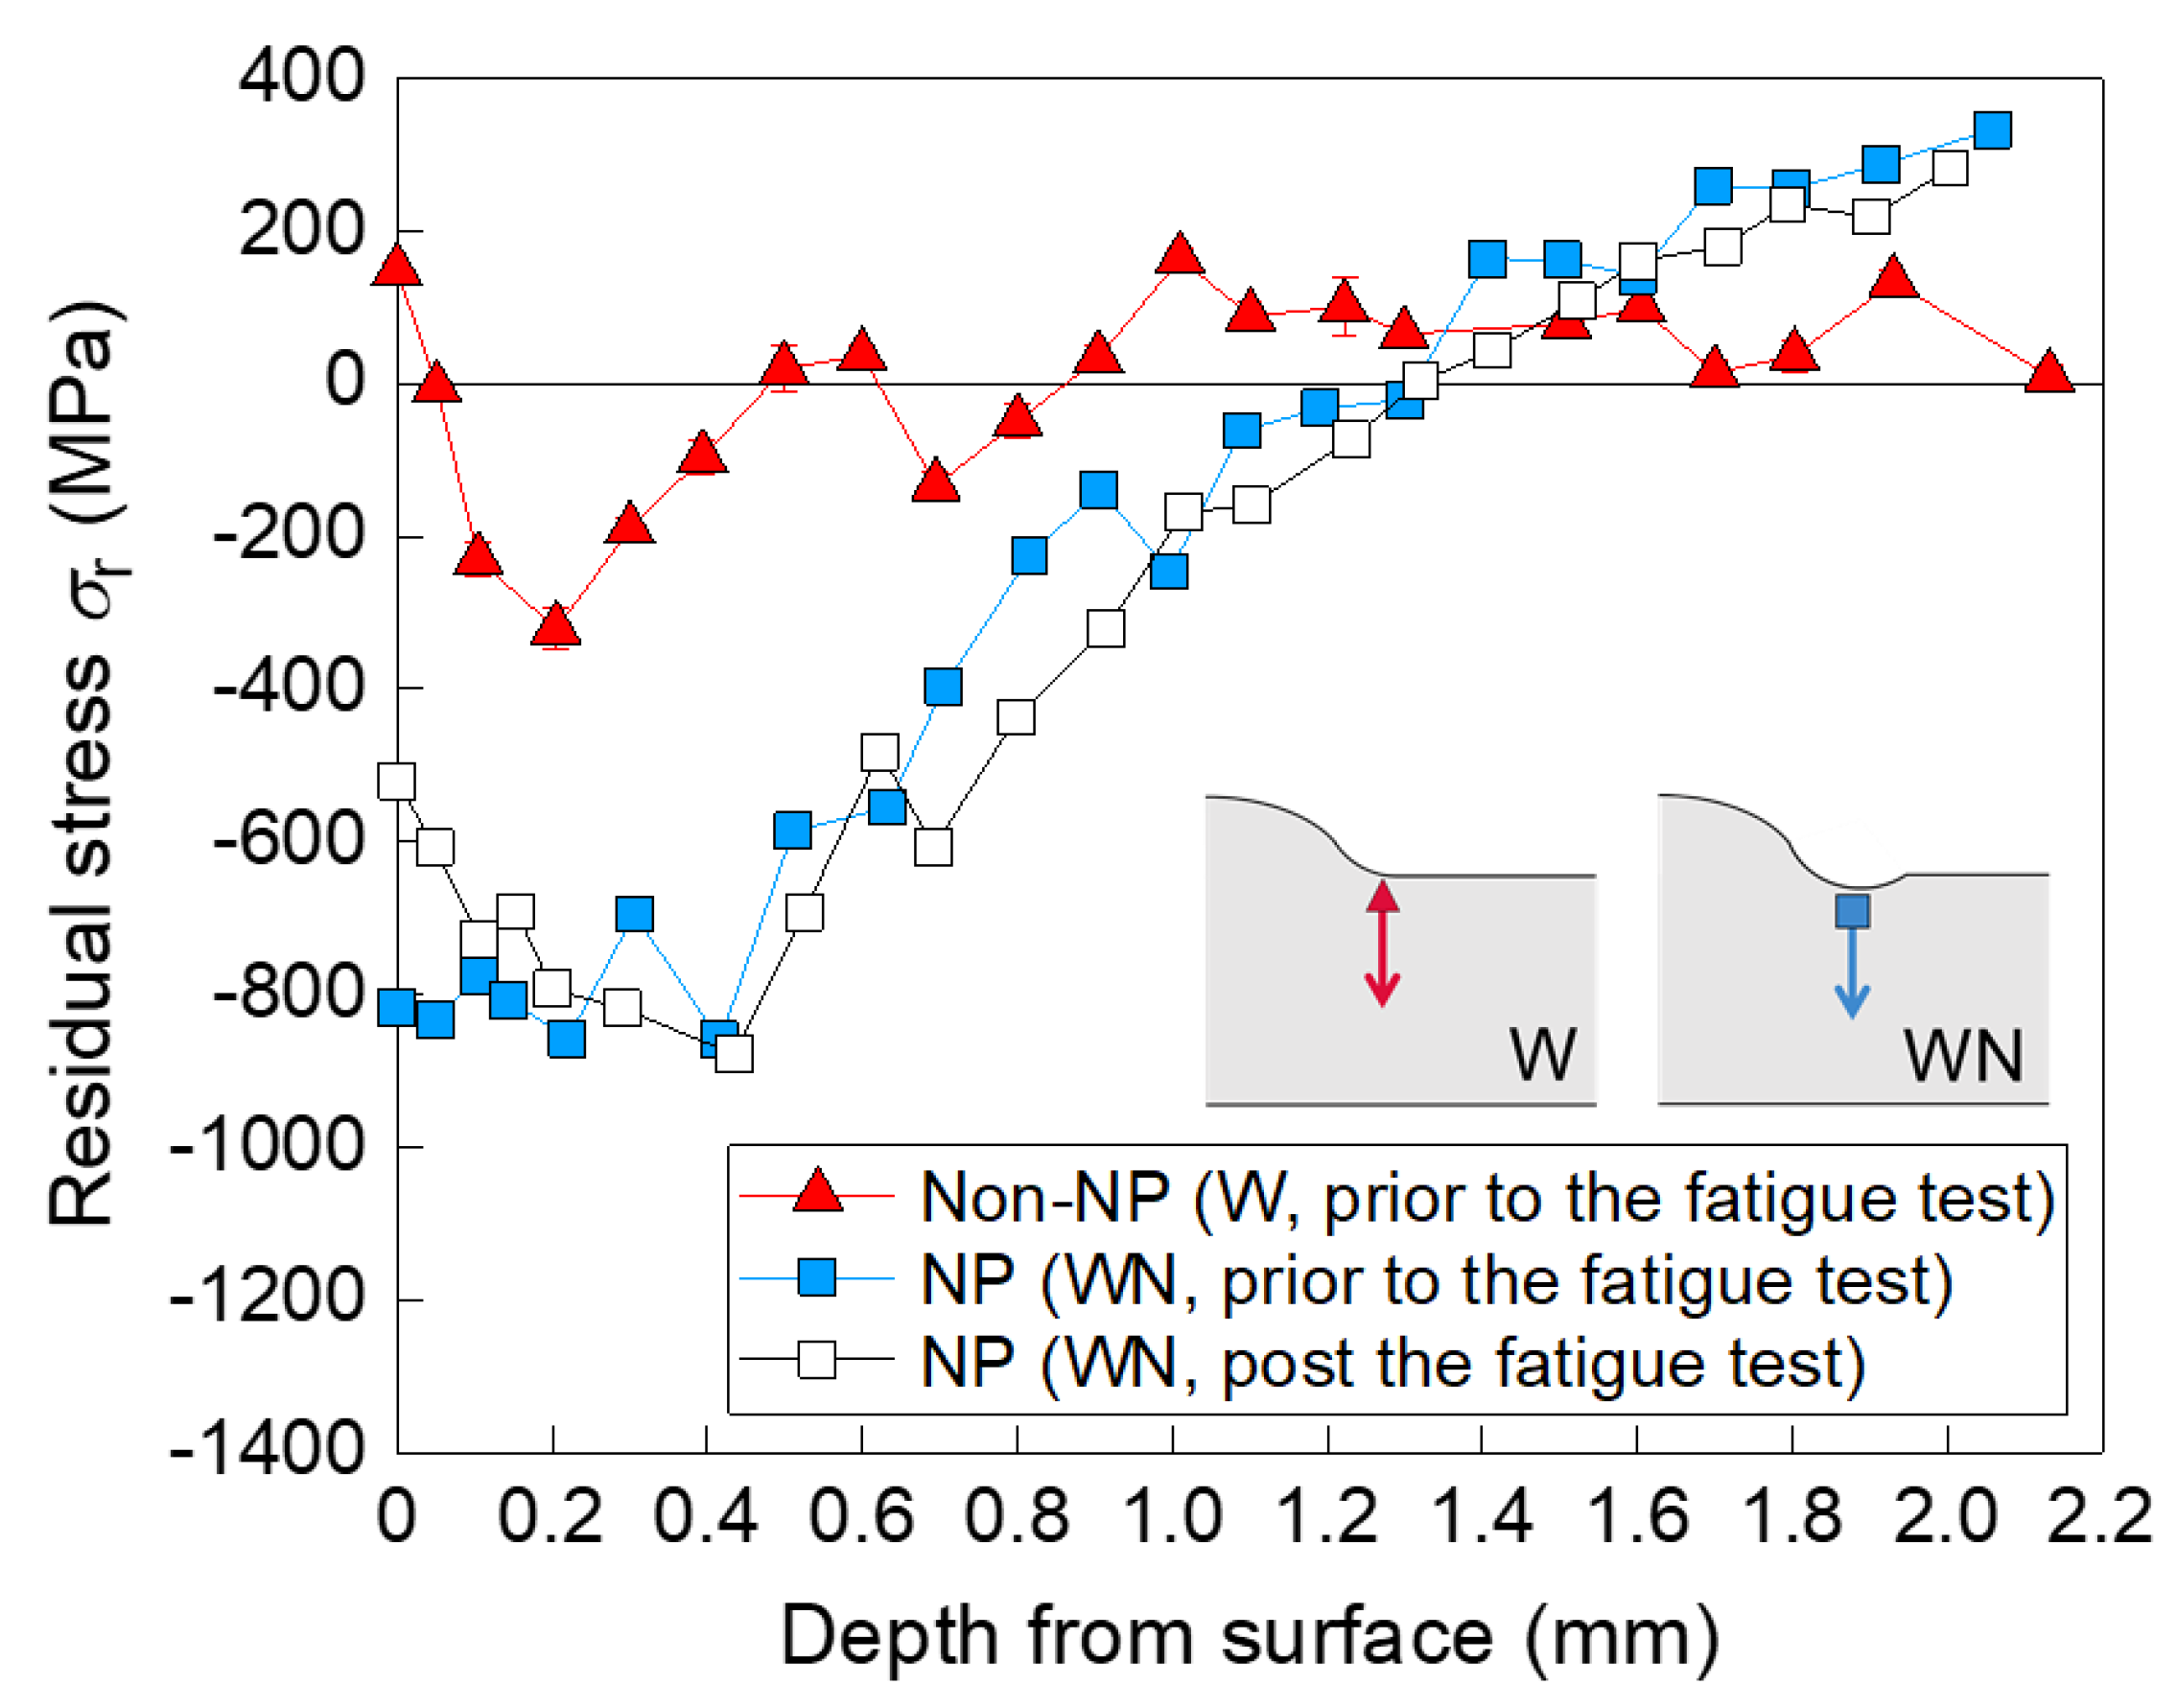
Figure 9.
Vickers hardness profiles. In-depth hardness profiles of the weld toe at the surface layer of W and WN prior to the fatigue test were measured. The hardness profile of WN after the fatigue test at a fatigue limit of σw = 240 MPa was also measured.
Figure 9.
Vickers hardness profiles. In-depth hardness profiles of the weld toe at the surface layer of W and WN prior to the fatigue test were measured. The hardness profile of WN after the fatigue test at a fatigue limit of σw = 240 MPa was also measured.
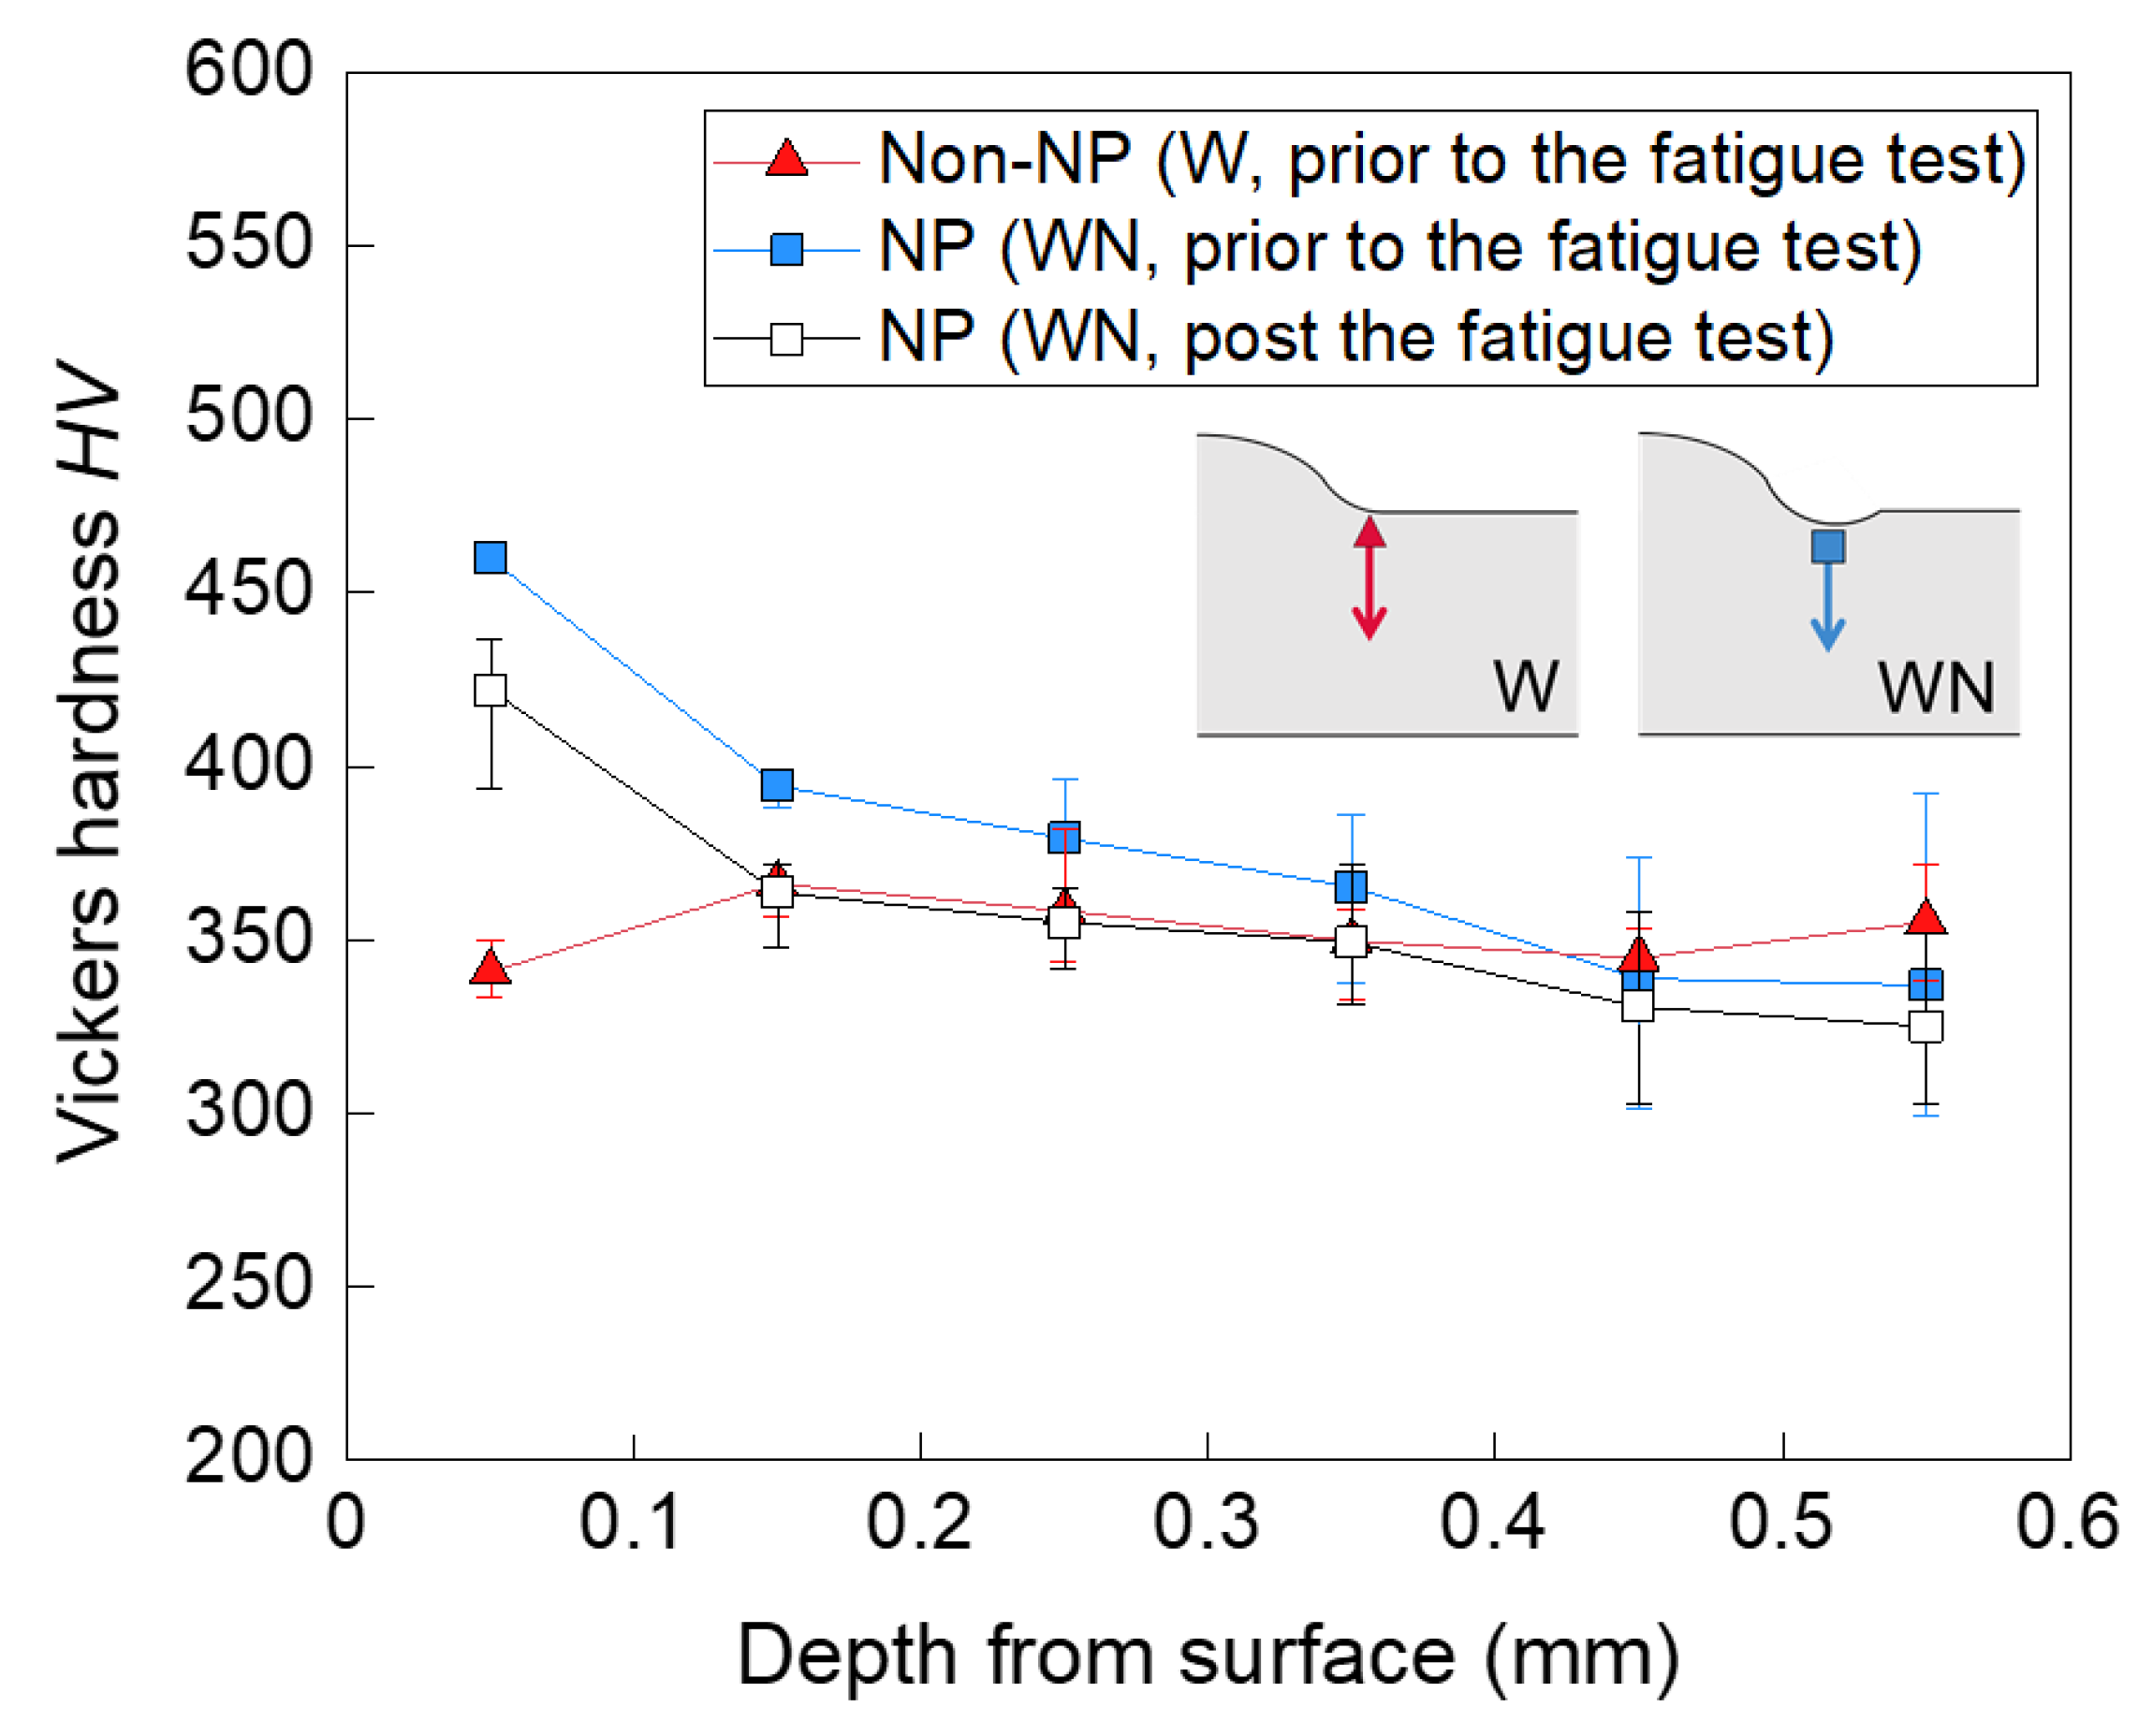
Figure 10.
Microscopic image near the weld toe of: (a) W; and (b) WN.
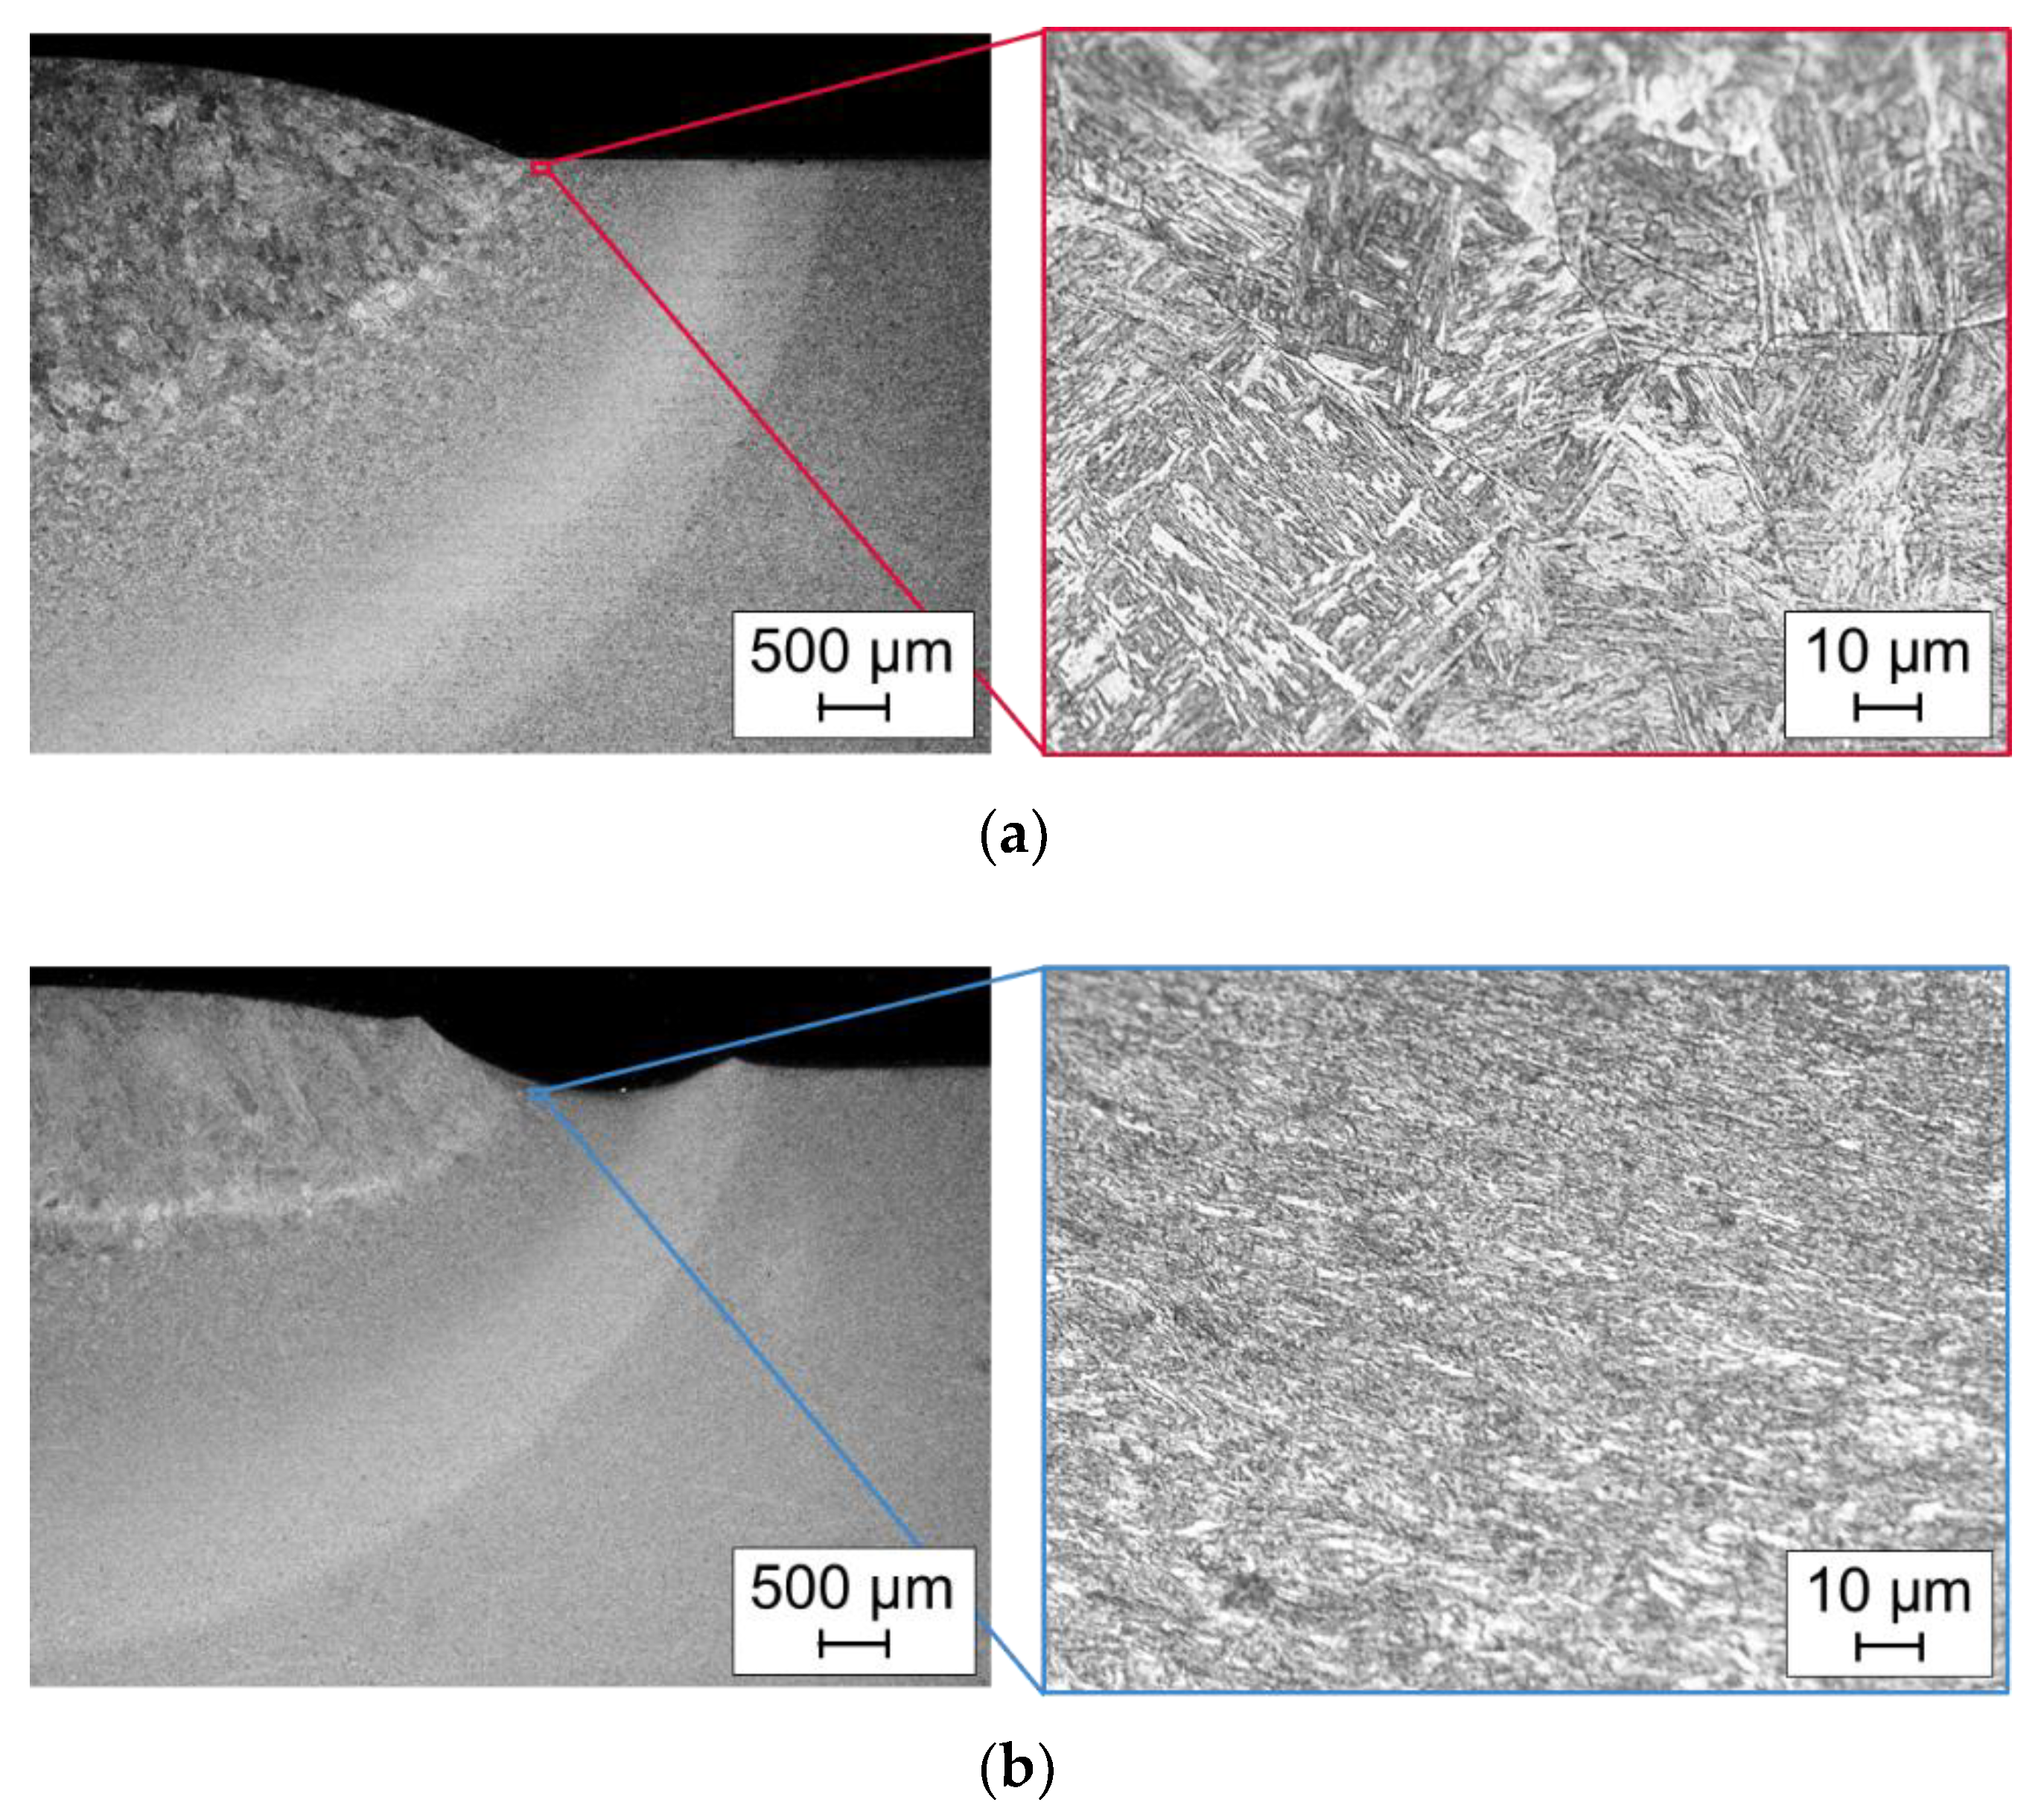
Figure 11.
Finite element models of W created based on the shape measurements of the specimens under the fatigue limit using a laser displacement gauge. The model corresponded to symmetric half models of the welded specimen that comprised a 20-node hexahedral element with a minimum element size of 0.05 mm.
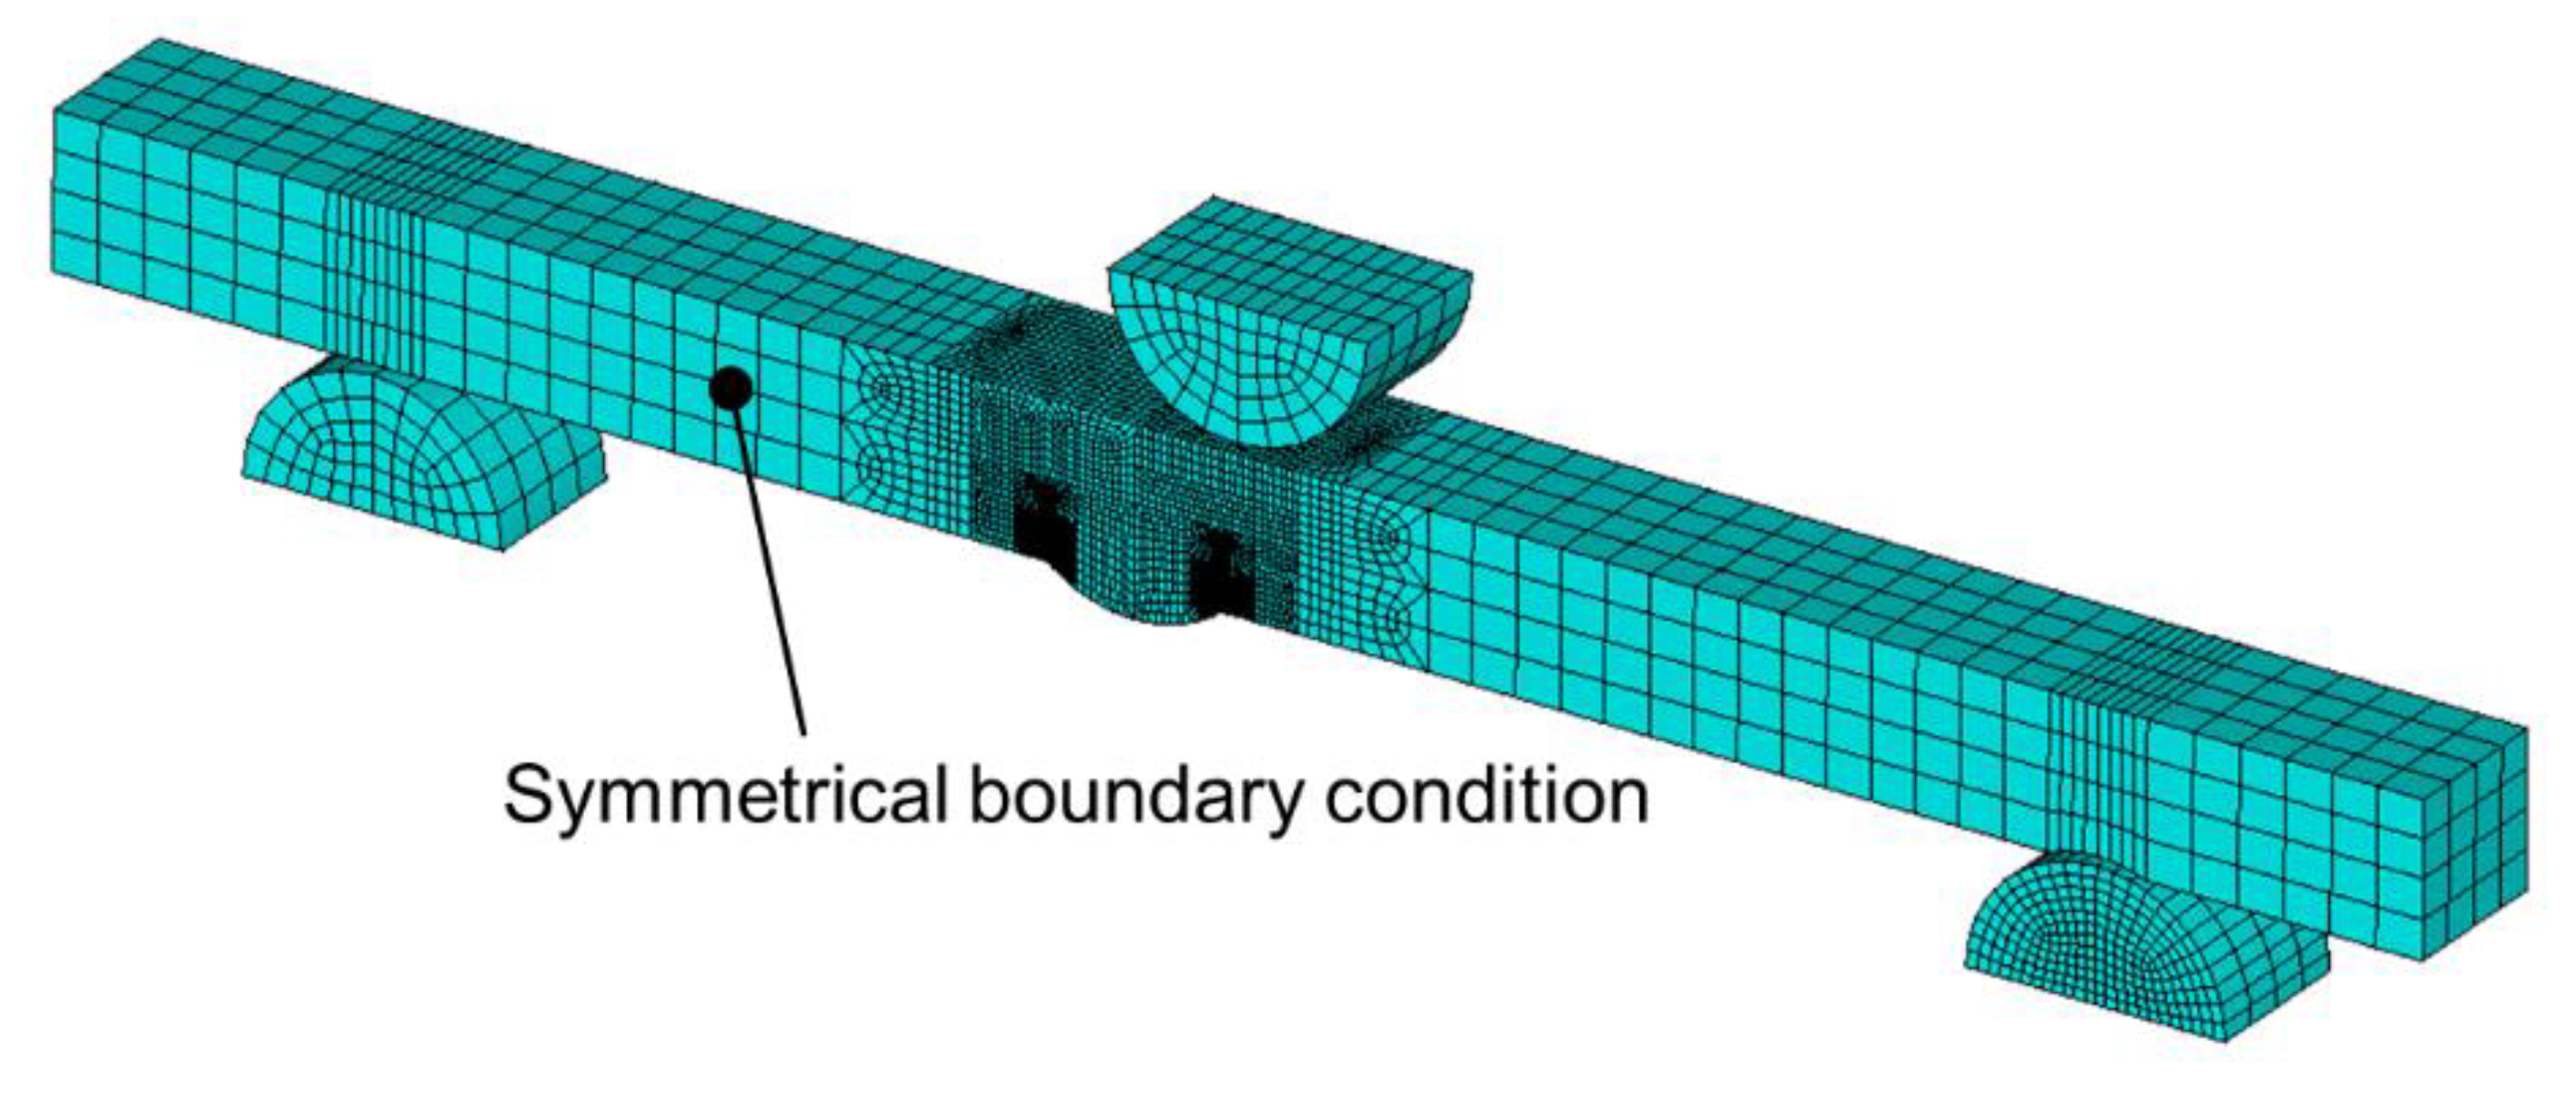
Figure 12.
Contour of the longitudinal stress at a normal bending stress of 200 MPa for: (a) W and (b) WN.
Figure 12.
Contour of the longitudinal stress at a normal bending stress of 200 MPa for: (a) W and (b) WN.
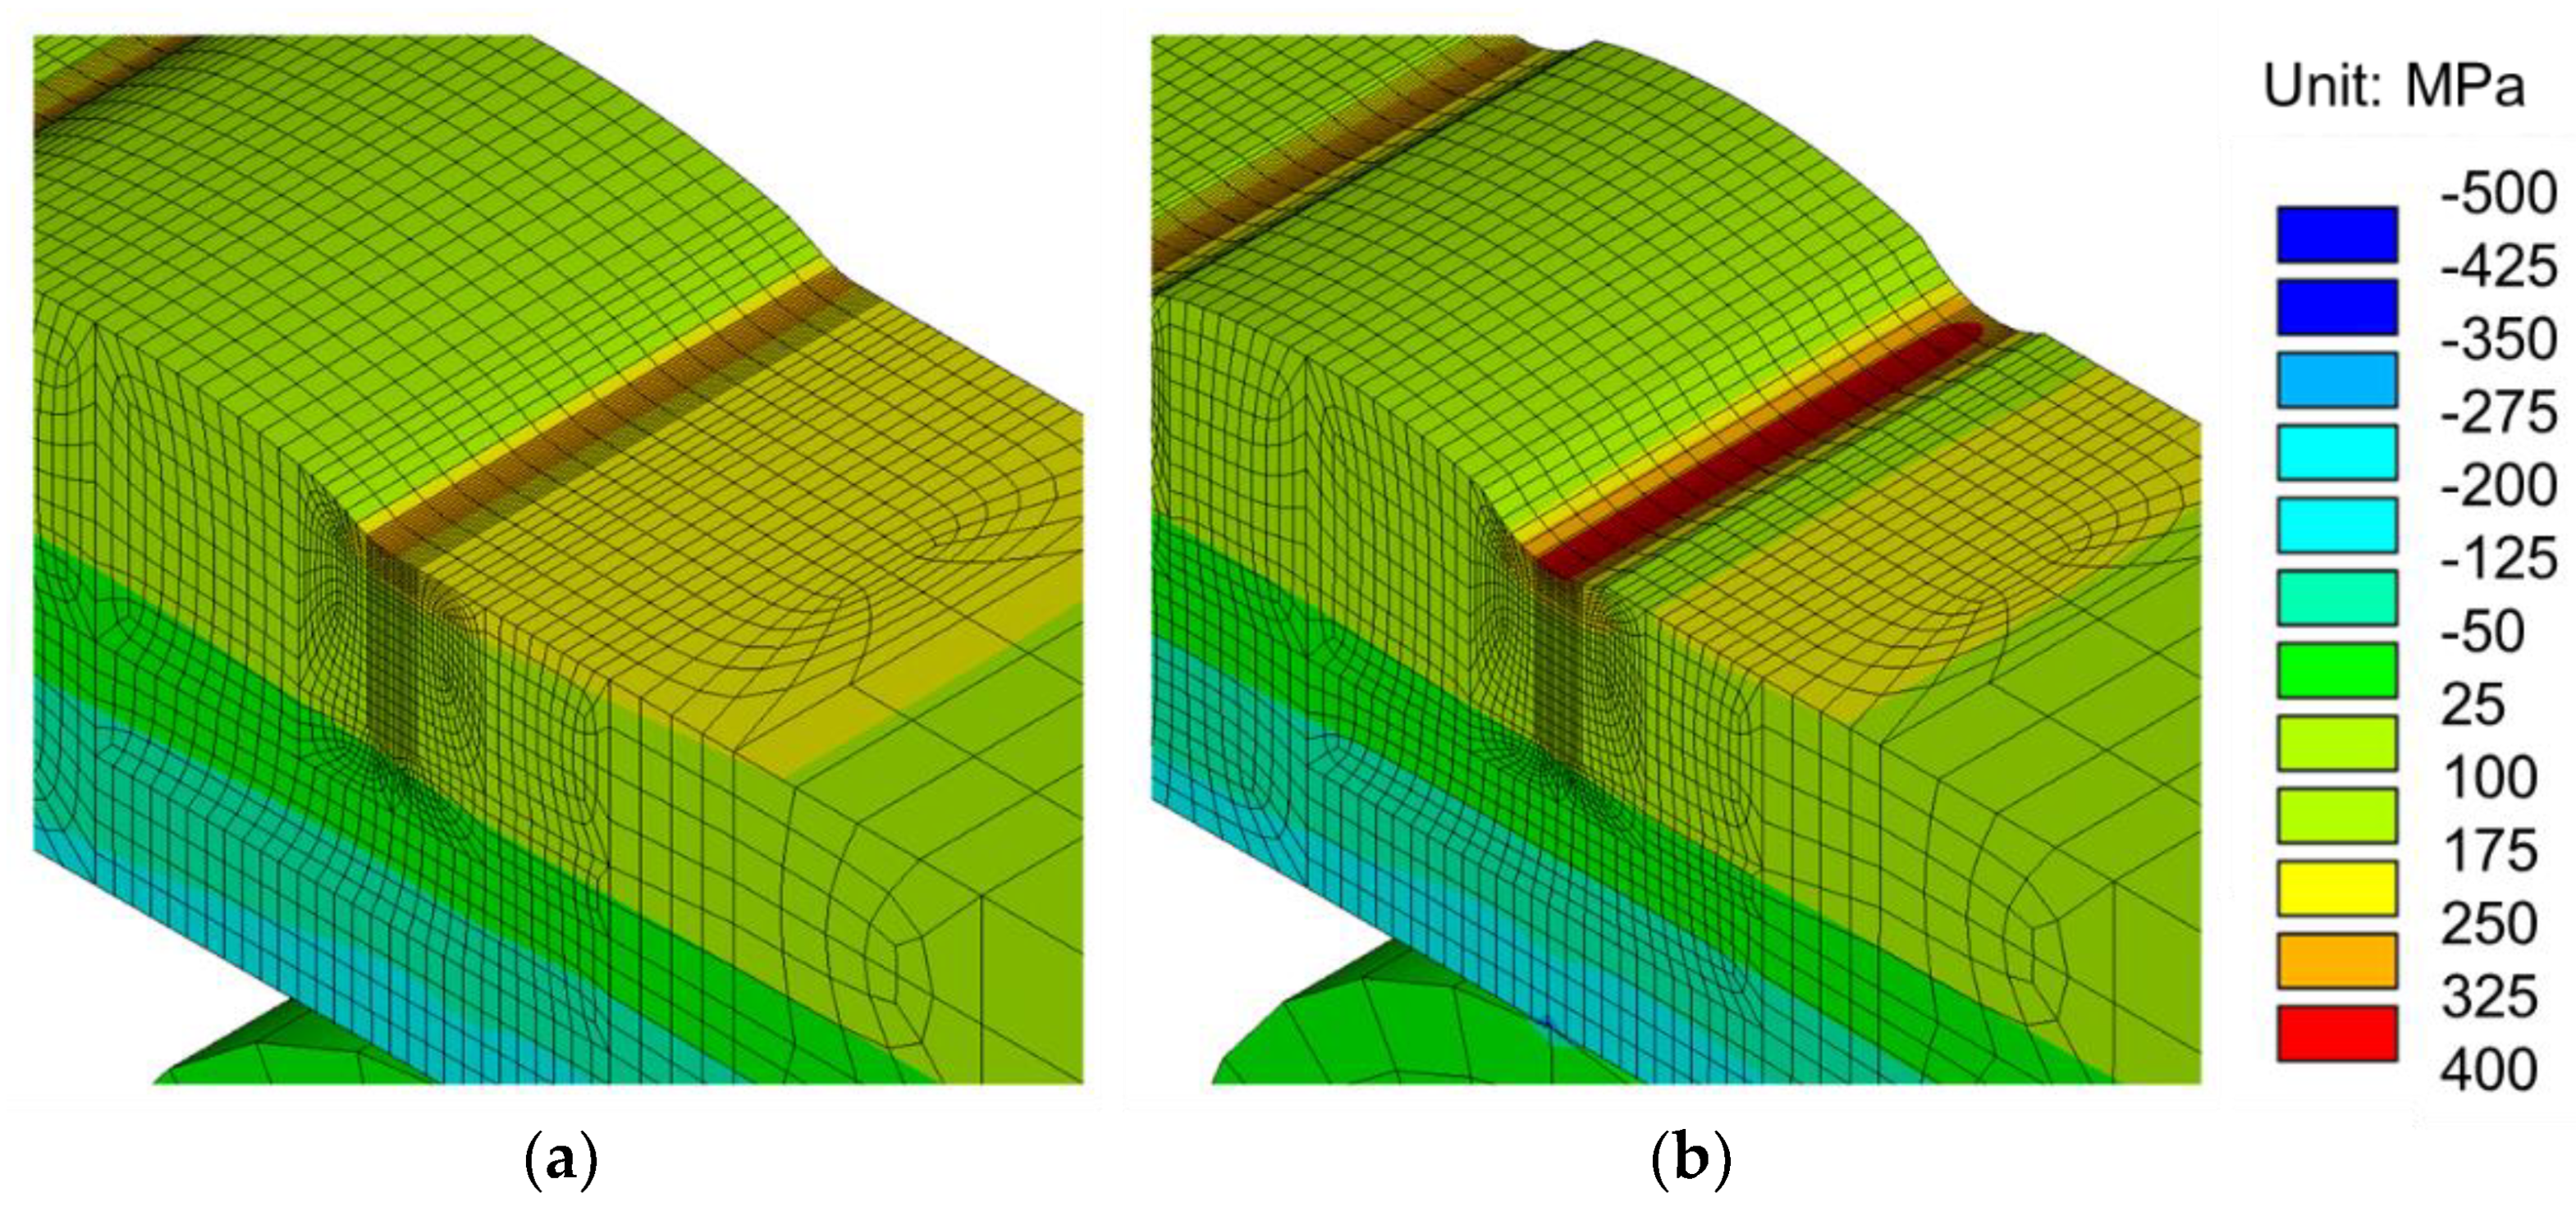
Figure 13.
Distribution of the longitudinal stress at the weld toe.
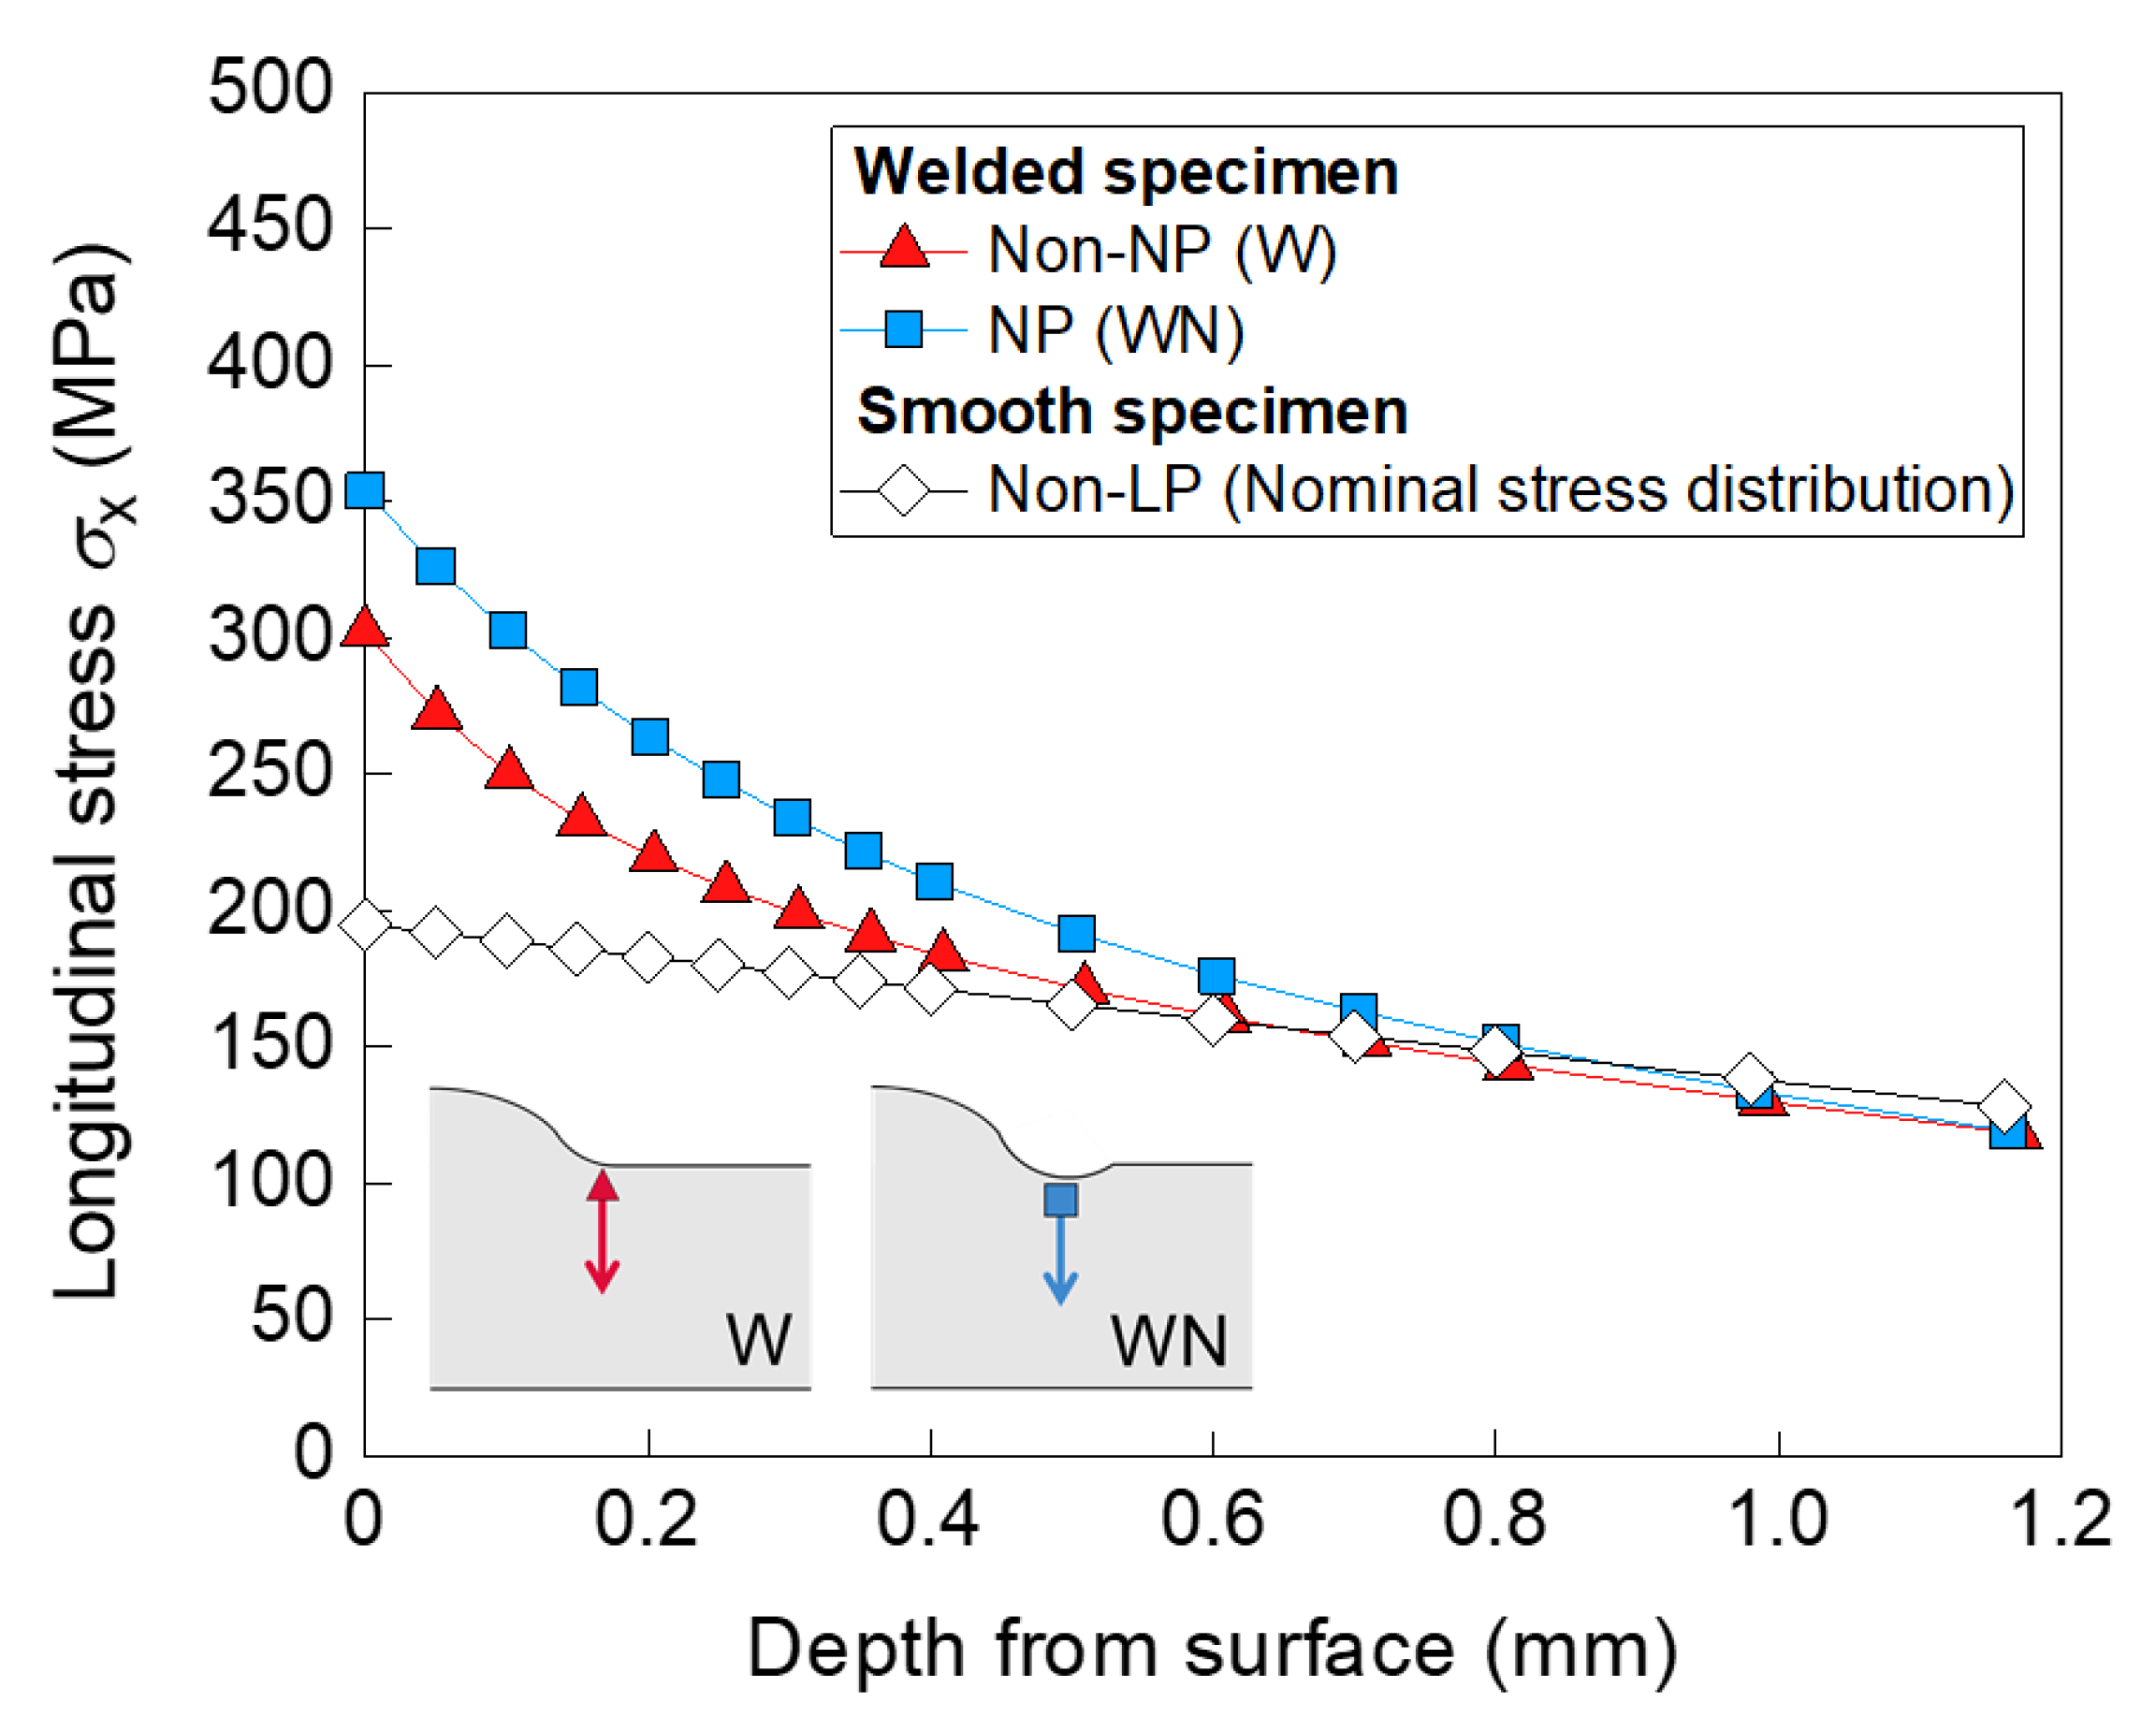
Figure 14.
Fracture surface around the slit for WNS1.0 tested under the fatigue limit of σw = 240 MPa. Non-propagating cracks were marked with a heat tint color via heat treatment at 573 K in air. The specimen was compulsorily fractured in a brittle manner using liquid nitrogen after a fatigue crack propagated under excessive cyclic loading.
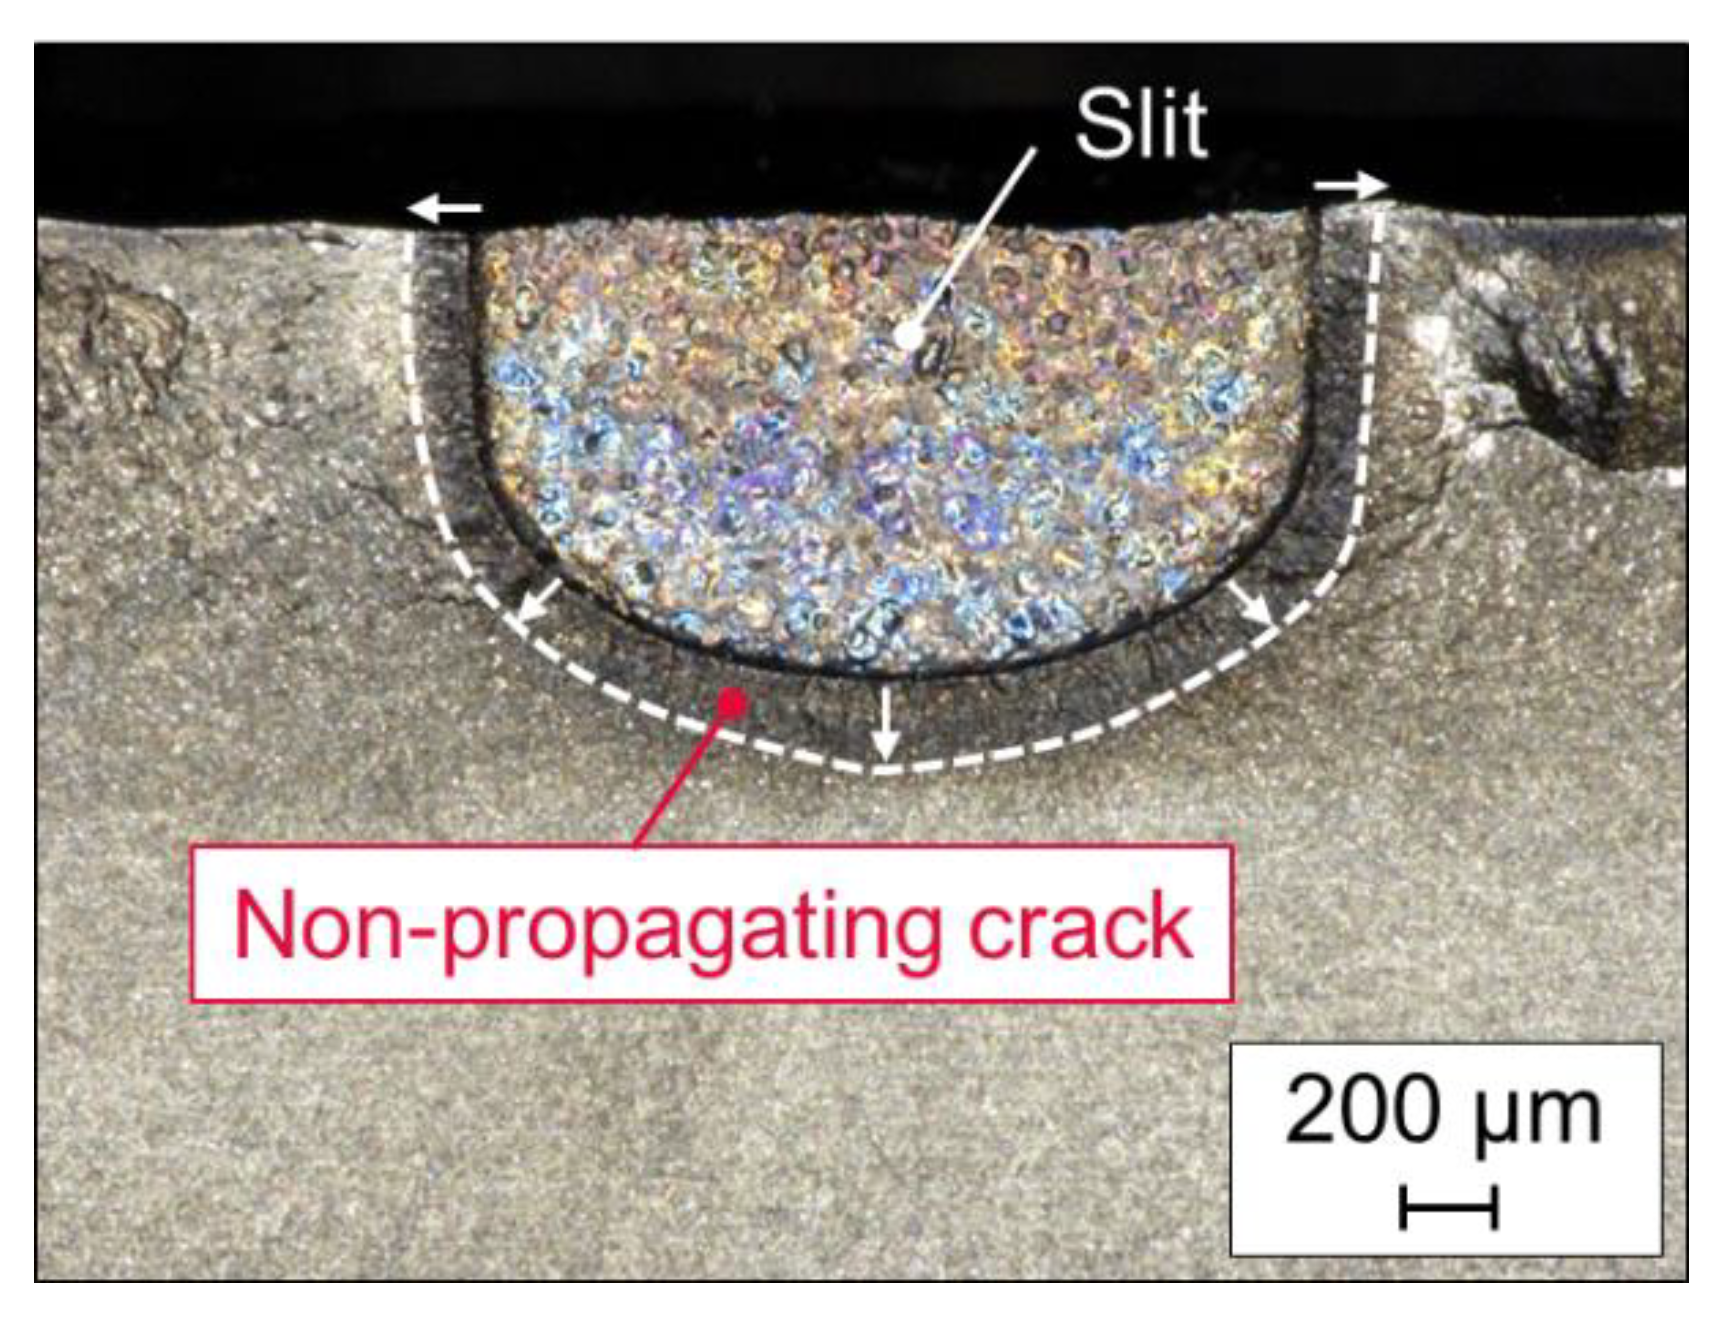
Table 1.
Chemical composition of HT780 (mass %).
| C | Si | Mn | P | S | Ni | Cr | Mo | Nb | B |
|---|---|---|---|---|---|---|---|---|---|
| 0.14 | 0.35 | 1.18 | 0.005 | 0.001 | 0.01 | 0.09 | 0.12 | 0.02 | 0.001 |
Table 2.
Mechanical proparties of HT780.
| Yield Stress (MPa) | Ultimate Tensile Stress (MPa) | Vickers Hardness HV |
|---|---|---|
| 822 | 839 | 267 |
Table 3.
Welding conditions.
| Parameters | Conditions |
|---|---|
| Number of layers | 1 |
| Number of passes | 1 |
| Welding position | Flat |
| Diameter of the welding rod (mm) | Φ 2.4 |
| Current (A) | 180 |
| Voltage (V) | 9.7 |
| Welding speed (cm/min) | 12 |
Table 4.
Peening conditions.
| Parameters | Conditions |
|---|---|
| Air pressure (MPa) | 0.5 |
| Radius of needle pin (mm) | 1.5 |
| Material of needle pin | High carbon chromium bearing steel (JIS-SUJ2) |
| Coverage (%) | 400 |
© 2019 by the authors. Licensee MDPI, Basel, Switzerland. This article is an open access article distributed under the terms and conditions of the Creative Commons Attribution (CC BY) license (http://creativecommons.org/licenses/by/4.0/).
Share and Cite
MDPI and ACS Style
Fueki, R.; Takahashi, K.; Handa, M. Fatigue Limit Improvement and Rendering Defects Harmless by Needle Peening for High Tensile Steel Welded Joint. Metals 2019, 9, 143. https://doi.org/10.3390/met9020143
AMA Style
Fueki R, Takahashi K, Handa M. Fatigue Limit Improvement and Rendering Defects Harmless by Needle Peening for High Tensile Steel Welded Joint. Metals. 2019; 9(2):143. https://doi.org/10.3390/met9020143
Chicago/Turabian StyleFueki, Ryutaro, Koji Takahashi, and Mitsuru Handa. 2019. "Fatigue Limit Improvement and Rendering Defects Harmless by Needle Peening for High Tensile Steel Welded Joint" Metals 9, no. 2: 143. https://doi.org/10.3390/met9020143
Note that from the first issue of 2016, this journal uses article numbers instead of page numbers. See further details here.