Article

Characterization of Precipitates in a Microalloyed Steel Using Quantitative X-ray Diffraction

1
Department of Chemical and Materials Engineering, University of Alberta, Edmonton, AB T6G 2V4, Canada
2
Enbridge Pipelines, 10201, Jasper Ave, Edmonton, AB T5J 3N7, Canada
3
Suncor Energy, Suncor Energy Centre, 111, 5 Ave SW, Calgary, AB T2P 3E3, Canada
*
Author to whom correspondence should be addressed.
Metals 2016, 6(4), 90; https://doi.org/10.3390/met6040090
Submission received: 29 February 2016 / Revised: 29 March 2016 / Accepted: 8 April 2016 / Published: 19 April 2016
(This article belongs to the Special Issue Microalloyed Steel)

Abstract

:
Quantitative X-ray diffraction (QXRD) (also known as the Rietveld method) was used to analyze the precipitates present in Grade 100 microalloyed steel. The precipitates were extracted from the steel using electrolytic dissolution and the residue from the dissolution was analyzed using XRD. The XRD pattern exhibited three (3) distinct diffraction peaks, and significant broadening of a fourth peak corresponding to the <10 nm size precipitates. QXRD analysis was applied to the XRD pattern to obtain precipitate size, composition, and weight fraction data for each of the four diffraction peaks observed. The predicted mean precipitate diameter and average atomic composition of the nano-size (<10 nm) precipitates was 4.7 nm and (Nb0.50Ti0.32Mo0.18)(C0.59N0.41), respectively. The predicted precipitate size correlates well with the average size of precipitates measured in previous work by the authors using both transmission electron microscopy (TEM) and small angle neutron scattering (SANS). The average atomic composition correlates well with the composition measured in this work using energy dispersive X-ray (EDX) analysis of individual nano-sized precipitates. The calculated weight fraction of the nano-size precipitates in the extracted residue was 42.2 wt. %. The calculated atomic compositions of the other three diffraction peaks were TiN, (Ti0.87Nb0.13)N, and (Nb0.82Ti0.18)(C0.87N0.13) with weight fraction values of 12.9 wt. %, 31.7 wt. %, and 13.1 wt. %, respectively. The sizes of both the (Ti0.87Nb0.13)N and the (Nb0.82Ti0.18)(C0.87N0.13) groups of precipitates were directly measured and were observed to range from 150 nm to 570 nm and from 90 nm to 475 nm, respectively. QXRD was unable to determine a reasonable mean precipitate size for either of these two groups of precipitates. The wide compositional range (i.e., varying levels of Nb and Ti) of these precipitates (as measured by EDX) resulted in XRD peak broadening that was erroneously interpreted as a size broadening effect.

1. Introduction

The characterization of precipitates in microalloyed steels can be undertaken using a number of analytical techniques, including optical microscopy [1,2], scanning electron microscopy (SEM) [3,4,5,6], transmission electron microscopy (TEM) [2,3,7,8], energy dispersive X-ray (EDX) analysis [2,3,8,9], and small angle neutron scattering (SANS) [10]. Each technique has its own advantages (and disadvantages) in terms of quantifying the number density, volume or weight fraction, composition and/or size of the precipitates. SANS is advantageous in that a larger number of precipitates are examined simultaneously compared with SEM and TEM, where a small number of individual precipitates are sequentially analyzed. Due to the wide range of precipitate sizes (from several microns down to the nanometer scale [2,11,12]) present in microalloyed steels that have undergone thermo-mechanical controlled processing (TMCP), and the relatively low volume fractions and diverse compositions of the precipitates (e.g., TiN, (Tix,Nb1−x)(CyN1−y), etc.), most, if not all, of the above mentioned characterization techniques are concurrently used.
This paper outlines the application of quantitative X-ray diffraction (QXRD) to characterize precipitates chemically extracted from Grade 100 microalloyed steel. The precipitate characteristics quantified by QXRD include precipitate size, weight fraction and average atomic composition. The extracted precipitate sample size of 100 mg represents a significant number of precipitates being simultaneously examined. The precipitate characteristics obtained from QXRD are compared with the composition and size of a select number of precipitates measured with EDX and TEM and from previous analysis on nano precipitate sizing conducted (on the same Grade 100 steel) by the authors using TEM and SANS.

2. Backgound

The Rietveld method, in conjunction with X-ray diffraction (XRD)—commonly referred to as quantitative XRD (QXRD) is a characterization methodology that has been applied to many metallurgical and materials systems to measure phase fractions [13], grain size in polycrystalline materials [14] and the average size of powder materials [15,16]. It is this latter application that has instigated the application of QXRD to the characterization of precipitates in microalloyed steel. This background section will review the general QXRD methodology with special emphasis on the quantification of precipitate size.

2.1. QXRD

QXRD [17] mathematically calculates an XRD pattern (i.e., intensity versus scattering angle 2θ) for a material and compares the calculated pattern with a measured diffraction pattern in a process known as the fundamental parameters approach (FPA). The calculated diffraction profile is obtained from parameters describing both the diffractometer (i.e., the instrument) and the material being analyzed [18]. The latter group of parameters includes the crystallographic structure of the phase(s) presents (i.e., crystal structure, atom type, and ordering) and specific phase characteristics such as the diffraction domain size (analogous to grain size or individual precipitate size for very fine precipitates) and internal microstrain. A refinement of these variables is performed until a “best fit” is achieved between the entire observed diffraction pattern and the predicted pattern [16] as per the following equation:
R = i w i ( I i o b s I i c a l ) 2
where R is the value to be minimized, Iiobs and Iical are the observed and calculated XRD intensities, respectively (at any angle θ) and wi is the statistical weight of each observation point, which takes into account the accuracy of the diffraction experiment.
The intensity of the calculated diffraction profile (Ical) for a single phase material can be determined using the following equation [18]:
I c a l = S K L K | F K | 2 ϕ ( 2 θ i 2 θ K ) P K A + I b
where S is a scale factor (used in the calculation of weight fraction of each phase in a multi-phase system), LK contains the Lorentz polarization and multiplicity factors, FK is the structure factor which accounts for the fractional atom locations, the Miller indices (hkl) of the plane and the atomic scattering factor of the atom type, PK is a preferred orientation function, A is an absorption factor specific to the atom type and the X-ray source, Ib is the background intensity and φ is a profile function used to incorporate the effect of both domain size and microstrain on diffraction intensity at different angles (θi) relative to the Bragg diffraction angle (θK). of importance to the work presented in this paper is the profile function φ [19,20] used to determine domain size (and microstrain), the scale factor for weight fraction and variations in both the absorption factor and atomic scattering factor for each atom (e.g., Nb, Ti, etc.) that allows for the determination of precipitate atomic composition.

2.2. Domain Size

In a physical sense, diffraction domain size is a measurement of the depth (perpendicular to the diffraction plane) of a continuous set of coherent planes that contribute to Bragg diffraction. In materials with relatively large domain sizes, the diffraction peak decays rapidly on either side of the Bragg angle due to destructive wave interference between X-rays scattering from the near surface plane of atoms and those scattering from a relatively distant plane in the material. The net result is a relatively narrow diffraction peak where any broadening in the diffraction peak is attributed to instrumental effects. However, as domain size falls below approximately 100 nm [21], the diffraction peak begins to noticeably broaden due to the incomplete annihilation of the diffracted X-rays on either side of the Bragg peak. This reduced wave annihilation results in a measureable broadening of the peak beyond any instrumental broadening present.
In an “idealized” single crystal precipitate, the domain size would represent a physical measurement of the precipitate size [15]. It should be noted that domain size does not necessarily translate into precipitate size but represents (for an integral breadth analysis) the volume average mean column height (Dv) in the direction normal to the reflecting planes [22]. In addition, broadening of the peak due to domain size depends not only on the dimension normal to the diffracting planes but also on the geometric shape [23] of the diffracting planes in three dimensions (e.g., cube vs. sphere) [24]. As a further complication, there is not a specific single domain size but typically a distribution of sizes which can complicate the broadening effect and, hence, render the value of Dv as an average value only.
For polycrystalline spherical precipitates, the presence of crystalline defects such as dislocation arrays (small angle boundaries), stacking faults, twins and/or high angle grain boundaries [23] would delineate the precipitate into multiple domains. The presence of these multiple domains precludes a direct measurement of the precipitate size from diffraction broadening.

2.3. Microstrain

Microstrain (or inhomogeneous strain) within the crystal lattice arises from local atomic positional distortions due to the presence of defects such as dislocations, solid solution elements, and vacancies [25]. The greater the number of defects/homogeneities in the material, the greater the microstrain within the domain and, hence, the greater the peak broadening. Microstrain should not be confused with macrostrain (or residual stress), which is a global material phenomenon, that translates into either an increase or decrease in the plane spacing depending upon the direction and magnitude of the residual stress. As both domain size and microstrain result in peak broadening their individual effects must be separated. This can be undertaken by observing the variation in peak broadening as a function of the diffracting angle (θ) (e.g., a Williamson-Hall Plot) or via the use of appropriate profile functions (Gaussian and/or Lorentzian functions), which delineate the individual effects.

2.4. Profile Functions

Gaussian (G) and Lorentzian (L) profile functions are typically used to describe diffraction peak broadening resulting from both a small domain size and microstrain and have the following respective forms [18]:
I G = I o exp { ln 2 ( 2 θ i 2 θ K Γ G K 2 ) 2 }
I L = I o { 1 + ( 2 θ i 2 θ K Γ L K 2 ) 2 }
where IG is the intensity for a Gaussian profile, IL is the intensity for a Lorentzian profile, Io is the initial intensity and ΓK represents the full width at half maximum (FWHM) of any diffraction peak. The value of ΓK is one of several independent variables used in the Rietveld minimization process for the calculation of both domain size and strain. The Gaussian profile is equivalent to a normal distribution [18] while the Lorentzian profile is equivalent to a Cauchy-Lorentz distribution [19]. A major difference between these two functions is that Lorentzian profile has flatter tails (extends for a greater deviation away from the Bragg peak) than a Gaussian distribution exhibiting an equal FWHM.
The application of both the Lorentzian and Gaussian diffraction profiles is based on the experimental usefulness [22,26,27] of both these functions in describing peak broadening and not a fundamental first principles relationship with either domain size or microstrain. To improve the fitting of either (or both) the Gaussian or Lorentzian profile to peak broadening, a combination of the two profiles can be used in a Voigt function [22,25,27] (i.e., broadening due to both domain size and microstrain strain contains both a Lorentzian and Gaussian component [16,25]. The profile function broadening can then be used to calculate the domain size and maximum microstrain using the following equations [16]:
β s i z e = λ L V o l cos θ
β s t r a i n = k ε o tan θ
where βsize is the integral breadth (a function of ΓK) of a Voigt function for broadening due to domain size, βsrain is the integral breadth of a Voigt function for broadening due to microstrain, Lvol is the volume average crystal size (domain size) and εo is the maximum lattice strain. The values of Lvol and εo will be presented in this work as an estimation of the size and microstrain for the precipitates present in Grade 100 microalloyed steel. Other important parameters obtained from QXRD include the weight fraction, composition, and the lattice parameter of a particular phase. All these will be used in characterizing the precipitates of the Grade 100 steel analyzed in this study.

2.5. QXRD Programs

There are a number of available programs for conducting Rietveld analysis on diffraction data; these include GSAS (General Structure Analysis System) and TOPAS [23]. For the purpose of the work presented in this paper, TOPAS Academic Software (4.1, Bruker AXS Inc. Madison, WI, USA, 2004) is used. Calculations of composition, domain size, and microstrain are based on the Double Voigt method [16,23]. To ensure that the Rietveld analysis results in a global minimization, different parameter inclusion schemes, and starting values of the parameters were undertaken.

3. Experimental Procedure and Results

The nominal composition of the Grade 100 TMCP microalloyed steel studied in this work is 0.080 wt. % C, 0.011 wt. % N, 0.30 wt. % Mo, 0.20 wt. % Cr, 0.094 wt. % Nb, 0.060 wt. % Ti, and 0.047 wt. % V. The steel was continuously cast and then rolled to its final thickness via TMCP. Following TMCP, a representative sample from the Grade 100 steel strip was extracted and an electrolytic dissolution technique [3] was used to separate the precipitates from the steel matrix. The residue remaining after dissolution (containing the precipitates) was then analyzed using XRD. QXRD was then applied to the experimental diffraction pattern. In addition, TEM and EDX analysis [3] were conducted on a limited number of precipitates in the residue to quantify both the composition (stoichiometry) and size for subsequent comparison with the QXRD results.

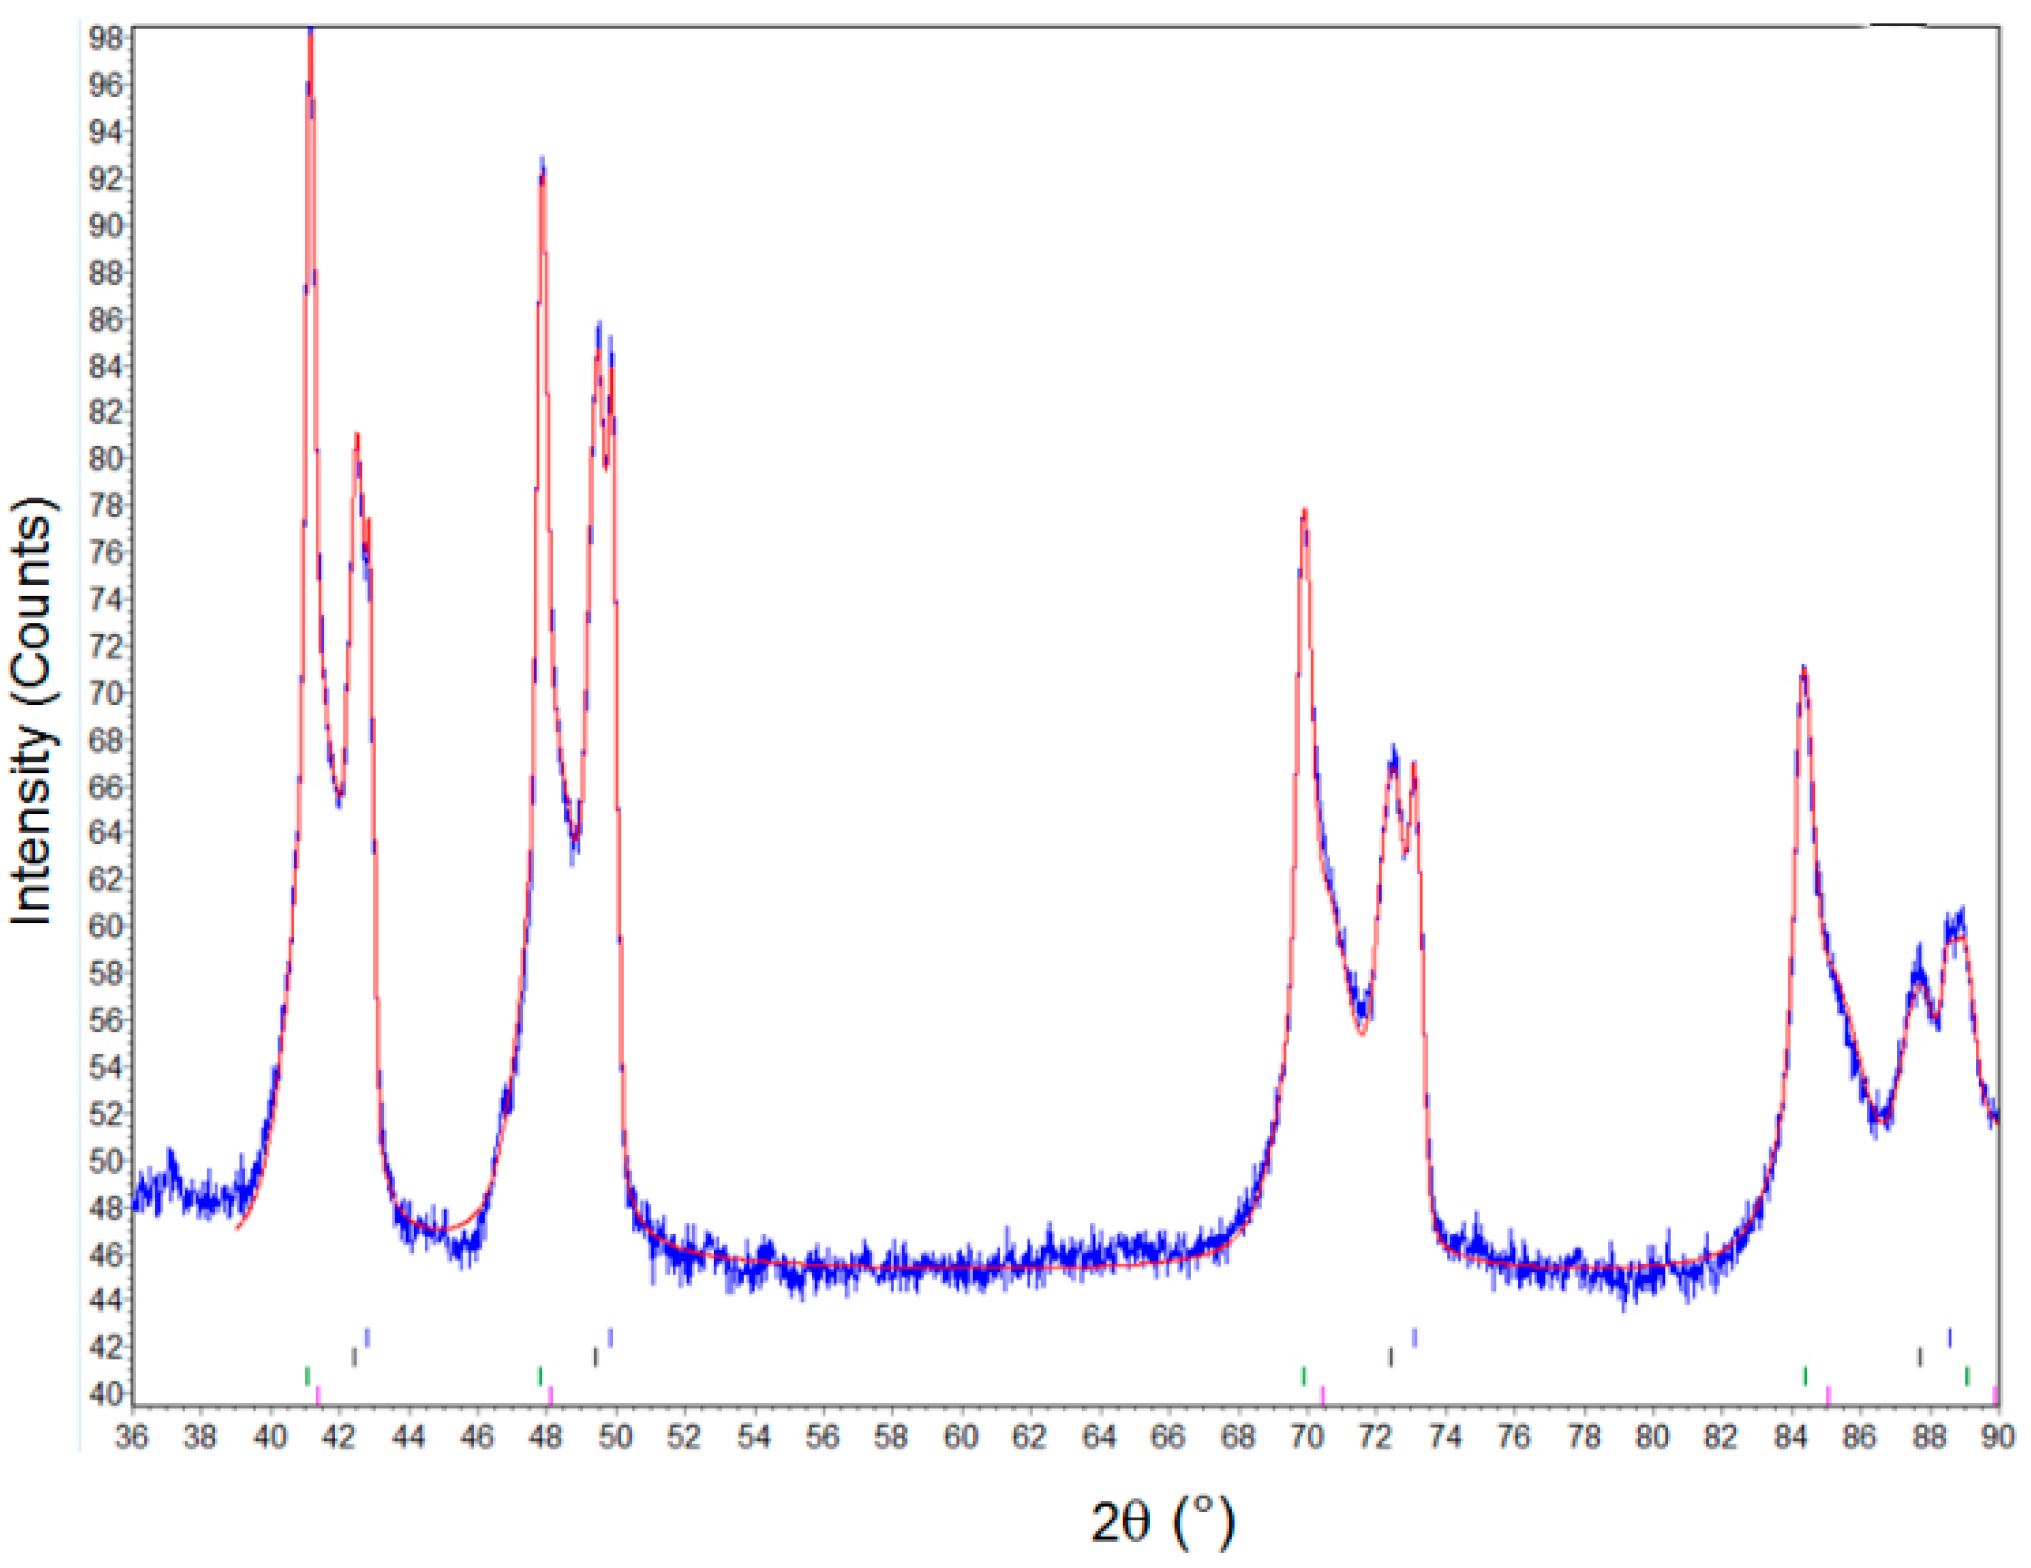
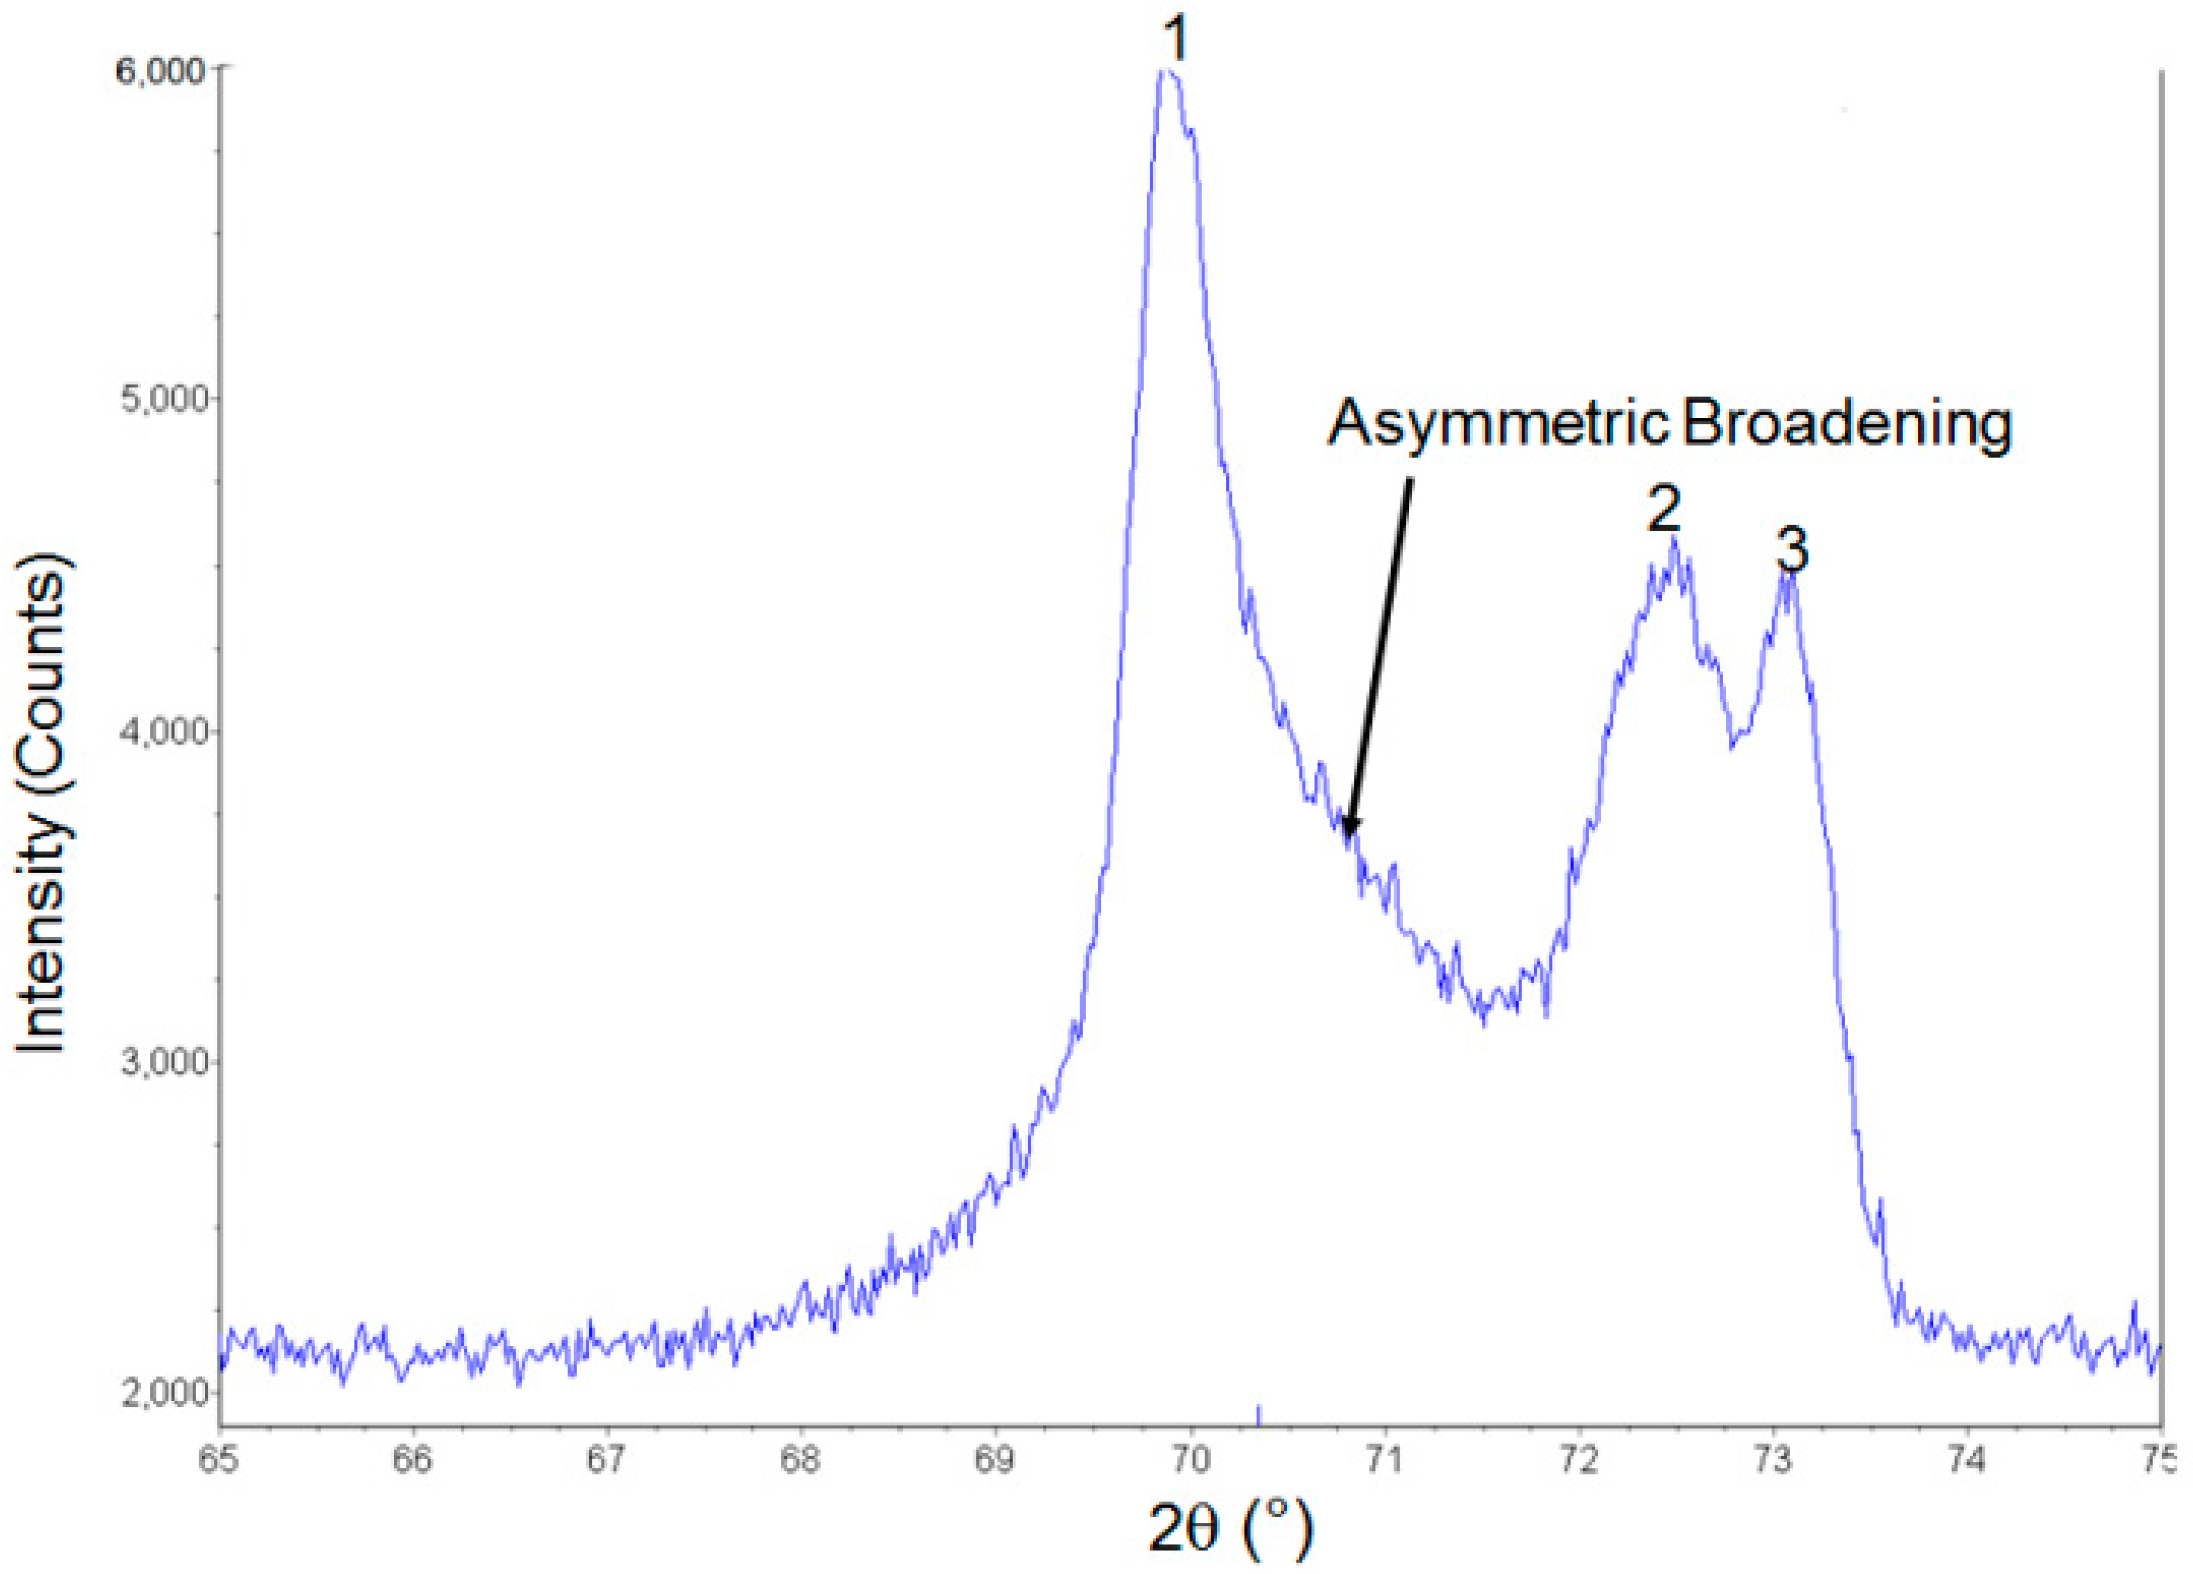
3.1. Diffraction Pattern of Grade 100 Residue

The XRD pattern of the Grade 100 precipitate residue was obtained using a Bruker D8 diffractometer(Bruker AXS Inc., Madison, WI, USA) with a Co X-ray source. A magnified portion of the XRD pattern, extending from 2θ = 65° to 75° (which corresponds to diffraction from the (220) plane in an Fm-3m crystal system), is shown in Figure 1. Three (3) distinct diffraction peaks are observed in Figure 1 and are labeled as 1, 2, and 3. In addition, asymmetric broadening of peak 1 was also observed (as indicated by an arrow). This asymmetric broadening is attributed to the presence of nano-size precipitates. The data indicates that there are four (4) measurable groups of precipitates present in the Grade 100 steel, Groups 1 to 3, shown in Figure 1, and Group 4 indicated by the asymmetric broadening.

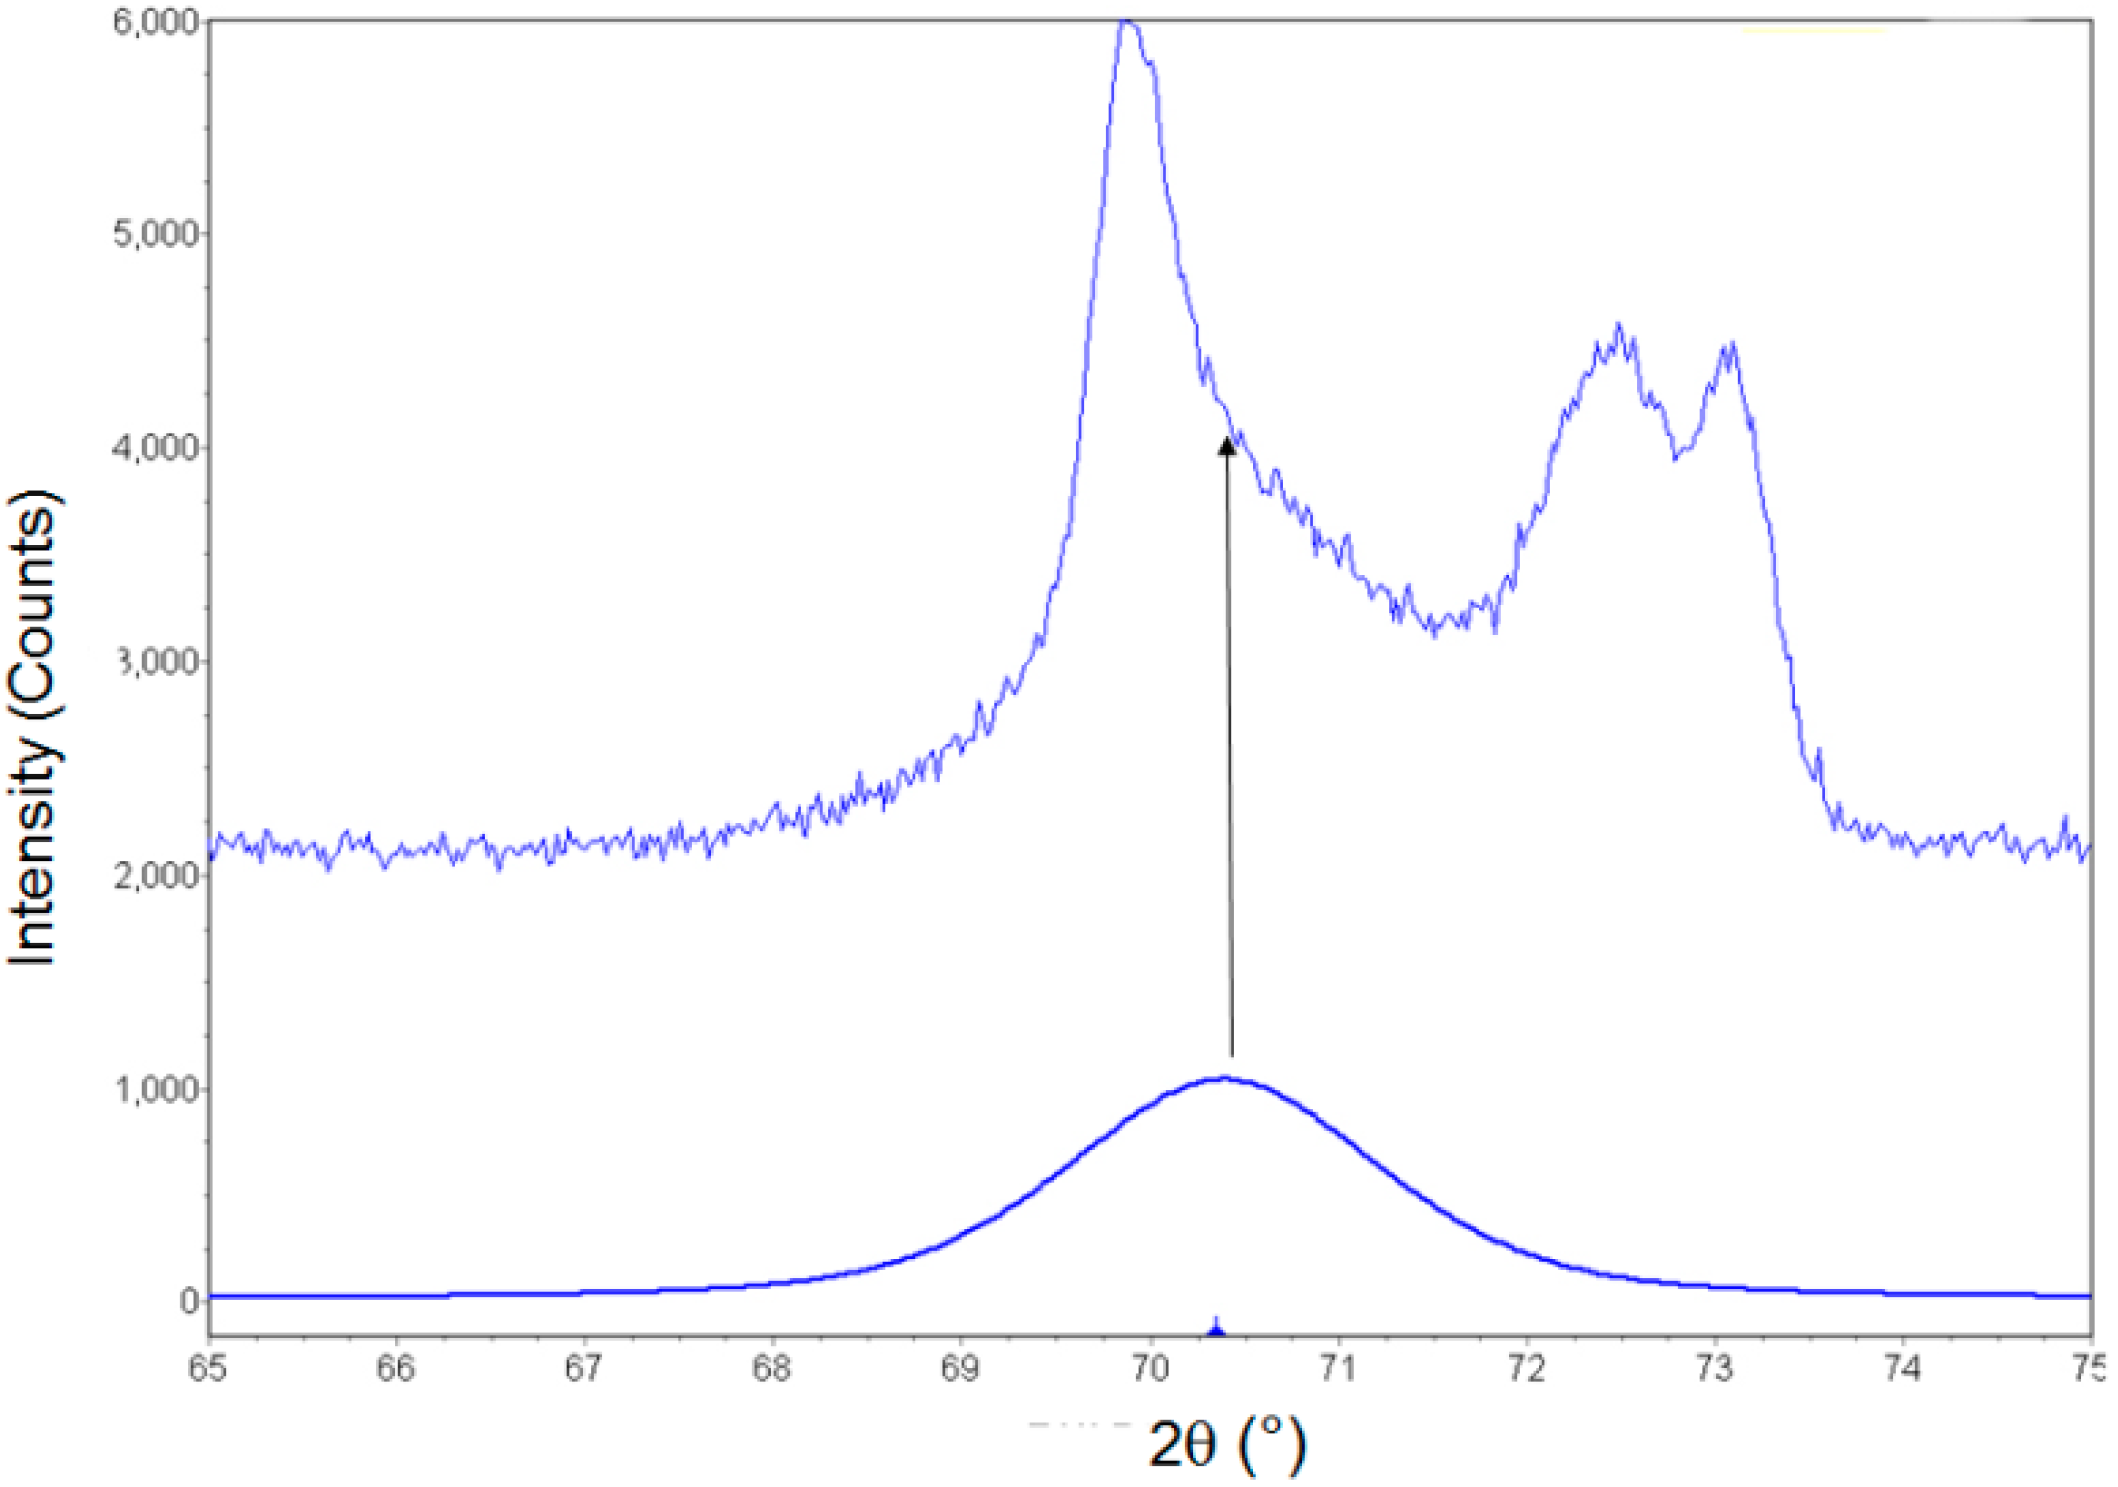
3.2. QXRD Refinement

QXRD refinement involves calculating a diffraction pattern based on both the XRD instrument parameters and the characteristic crystallographic variables of each precipitate group (described in the background). Table 1 details the specific XRD instrument parameters (and their values) that were directly inputted into the QXRD refinement. The crystallographic variables refined during QXRD for each precipitate group includes the unit cell lattice parameter (a), wt. % of each precipitate, the atomic fraction of each element, the domain size (Lvol), and the microstrain (εo). All the precipitates have a Na-Cl-type crystal structure.
A comparison between the measured (rough line) and calculated diffraction pattern (smooth line) is shown in Figure 2. A good fit (an Rwp (weighted profile R-factor) = 2.63%) is observed between the measured and predicted profiles and confirms the veracity of the Rietveld refinement in successfully predicting the measured diffraction pattern.
As discussed earlier, the nano-size precipitates do not exhibit a sharp peak similar to the other precipitates (see Figure 1); therefore, their presence must be inferred from shape of the overall diffraction pattern. Figure 3 compares the measured diffraction pattern with the calculated intensity contribution from the Group 4 precipitates for the (220) plane. The asymmetric broadening of the measured diffraction pattern (as indicated by the arrow) corresponds well with the profile calculated for the Group 4 precipitates.

3.3. Predicted Crystallographic and Microstructure Variables

The values of the predicted crystallographic and microstructure variables (i.e., atomic composition, lattice parameter, Lvol, and εo) for all the precipitate groups are summarized in Table 2. The predicted atomic composition of the Group 1 and 2 precipitates show them as primarily titanium nitrides. These nitrides account for 44.6 wt. % of the total number of precipitates collected. Interestingly, both nitride groups also exhibit a relatively low Lvol value (70 nm and 115 nm, respectively) and a relatively high internal microstrain (8.8% and 30.1%, respectively). The validity of these predicted values will be discussed later.
Alternatively, both Group 3 and 4 precipitates are predicted to be carbonitrides with Nb as the major alloying element in both. The Group 3 precipitates also exhibit a relatively low Lvol value (40.3 nm). The Group 4 precipitates were predicted to have a Lvol value of 4.7 nm. Given the observed broadening, the small predicted particle size was not unexpected for the latter group. In addition, the Group 4 precipitates were predicted to have Mo present. The small predicted precipitate size and the presence of Mo indicates that the Group 4 precipitates likely arose during the final stages (i.e., relatively low temperature rolling) of TMCP.

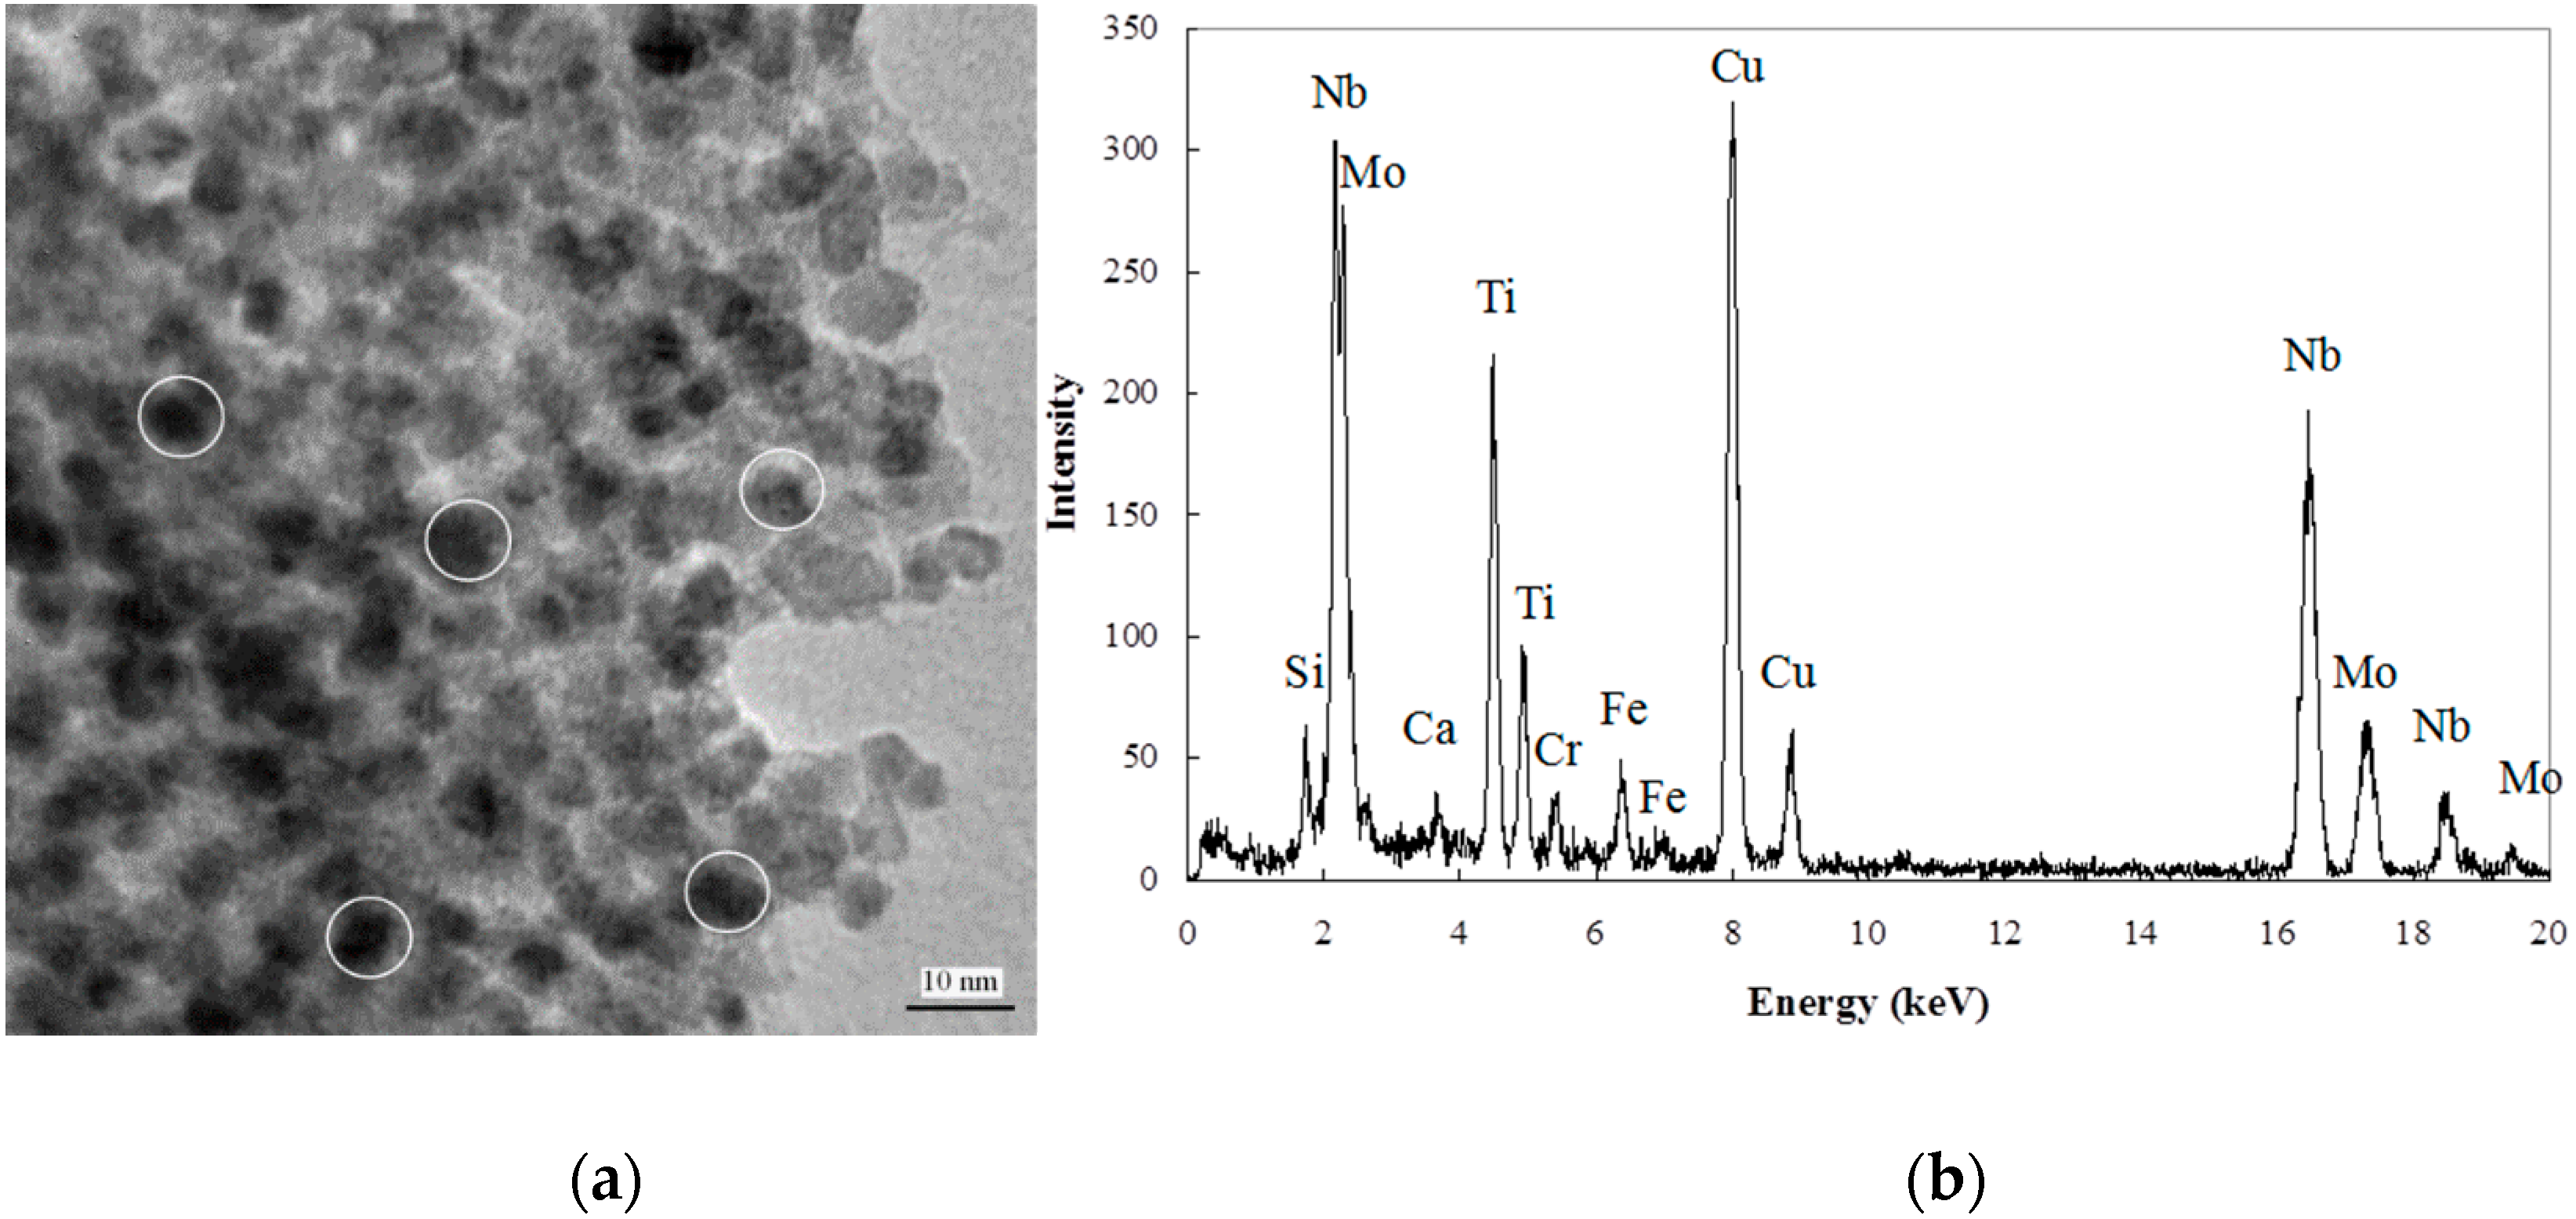
3.4. EDX/TEM Analysis

The atomic composition of sixty three (63) individual precipitates extracted from the Grade 100 steel residue were obtained through EDX analysis in the TEM [3]. Figure 4 [3] shows an example TEM image (a) and a selected EDX pattern (b) obtained from a nano-size precipitate. The amount of Ti and Nb present in all 63 precipitates analyzed is plotted in Figure 5. For this figure and all subsequent figures, only the metallic elements are considered and the composition does not include the amount of C and N in the precipitates. Included in this figure is a vertical dashed line which subdivides the nano-size precipitates (Group 4) from the Group 1 to 3 precipitates (>90 nm) examined. For the relatively large precipitates, the Ti and Nb compositions vary inversely with each other (i.e., as the amount of Ti decreases the amount of Nb increases). Mo and V were not detected in the Group 1–3 precipitates. The Group 4 precipitates show the amount of Ti to be primarily between 20 at. % and 25 at. %; however the Nb composition varies in a non-regular manner between approximately 38 at. % and 60 at. %. This variation is attributed to the presence of Mo replacing Nb within the carbonitride structure. The presence of Mo and V within the nano-size precipitates will be discussed more fully in subsequent sections.
Although the Nb and Ti compositions for the >90 nm precipitates vary significantly, a number of precipitates have relatively constant Ti compositions. One significant group occurs at ≈82 at. % Ti and to a lesser degree another group at ≈36 at. % Ti. Though a limited number of precipitates were analyzed, the data suggests that these compositions of precipitates are potentially more volumetrically dominant in the steel.
The amount of Ti in the precipitate groups 1–3 (Figure 5) is plotted as a function of measured particle size in Figure 6. Since an exact precipitate size was not determined for the Group 4 precipitates (<10 nm), they have been excluded from this graph. In addition, two very large precipitates, 1770 nm and 3750 nm with compositions of 93 at. % Ti and 89 at. % Ti, respectively, are shown by horizontal arrows as their size markedly exceeds the scale of the graph. In general, precipitates with a composition between 20 and 80 at. % Ti are typically less than 200 nm in size, although several precipitates in the 20–30 at. % Ti range were observed to be significantly larger. Conversely, the precipitates with >80% Ti show a wide range of sizes up to and including 3750 nm in diameter.
The number frequency of precipitates (Groups 2 and 3) as a function of Ti composition is shown in Figure 7. The largest number of the precipitates analyzed contained between 80–90 at. % Ti and 30–40 at. % Ti. The former range corresponds to the Group 2 precipitates, while the latter does not correspond to a specific group detected by QXRD.

4. Discussion

The precipitate information (composition and domain size) extracted from QXRD is compared with the composition and size data obtained from the TEM/EDX work undertaken in this paper and with previous work by the authors on precipitate size analysis using TEM and SANS.

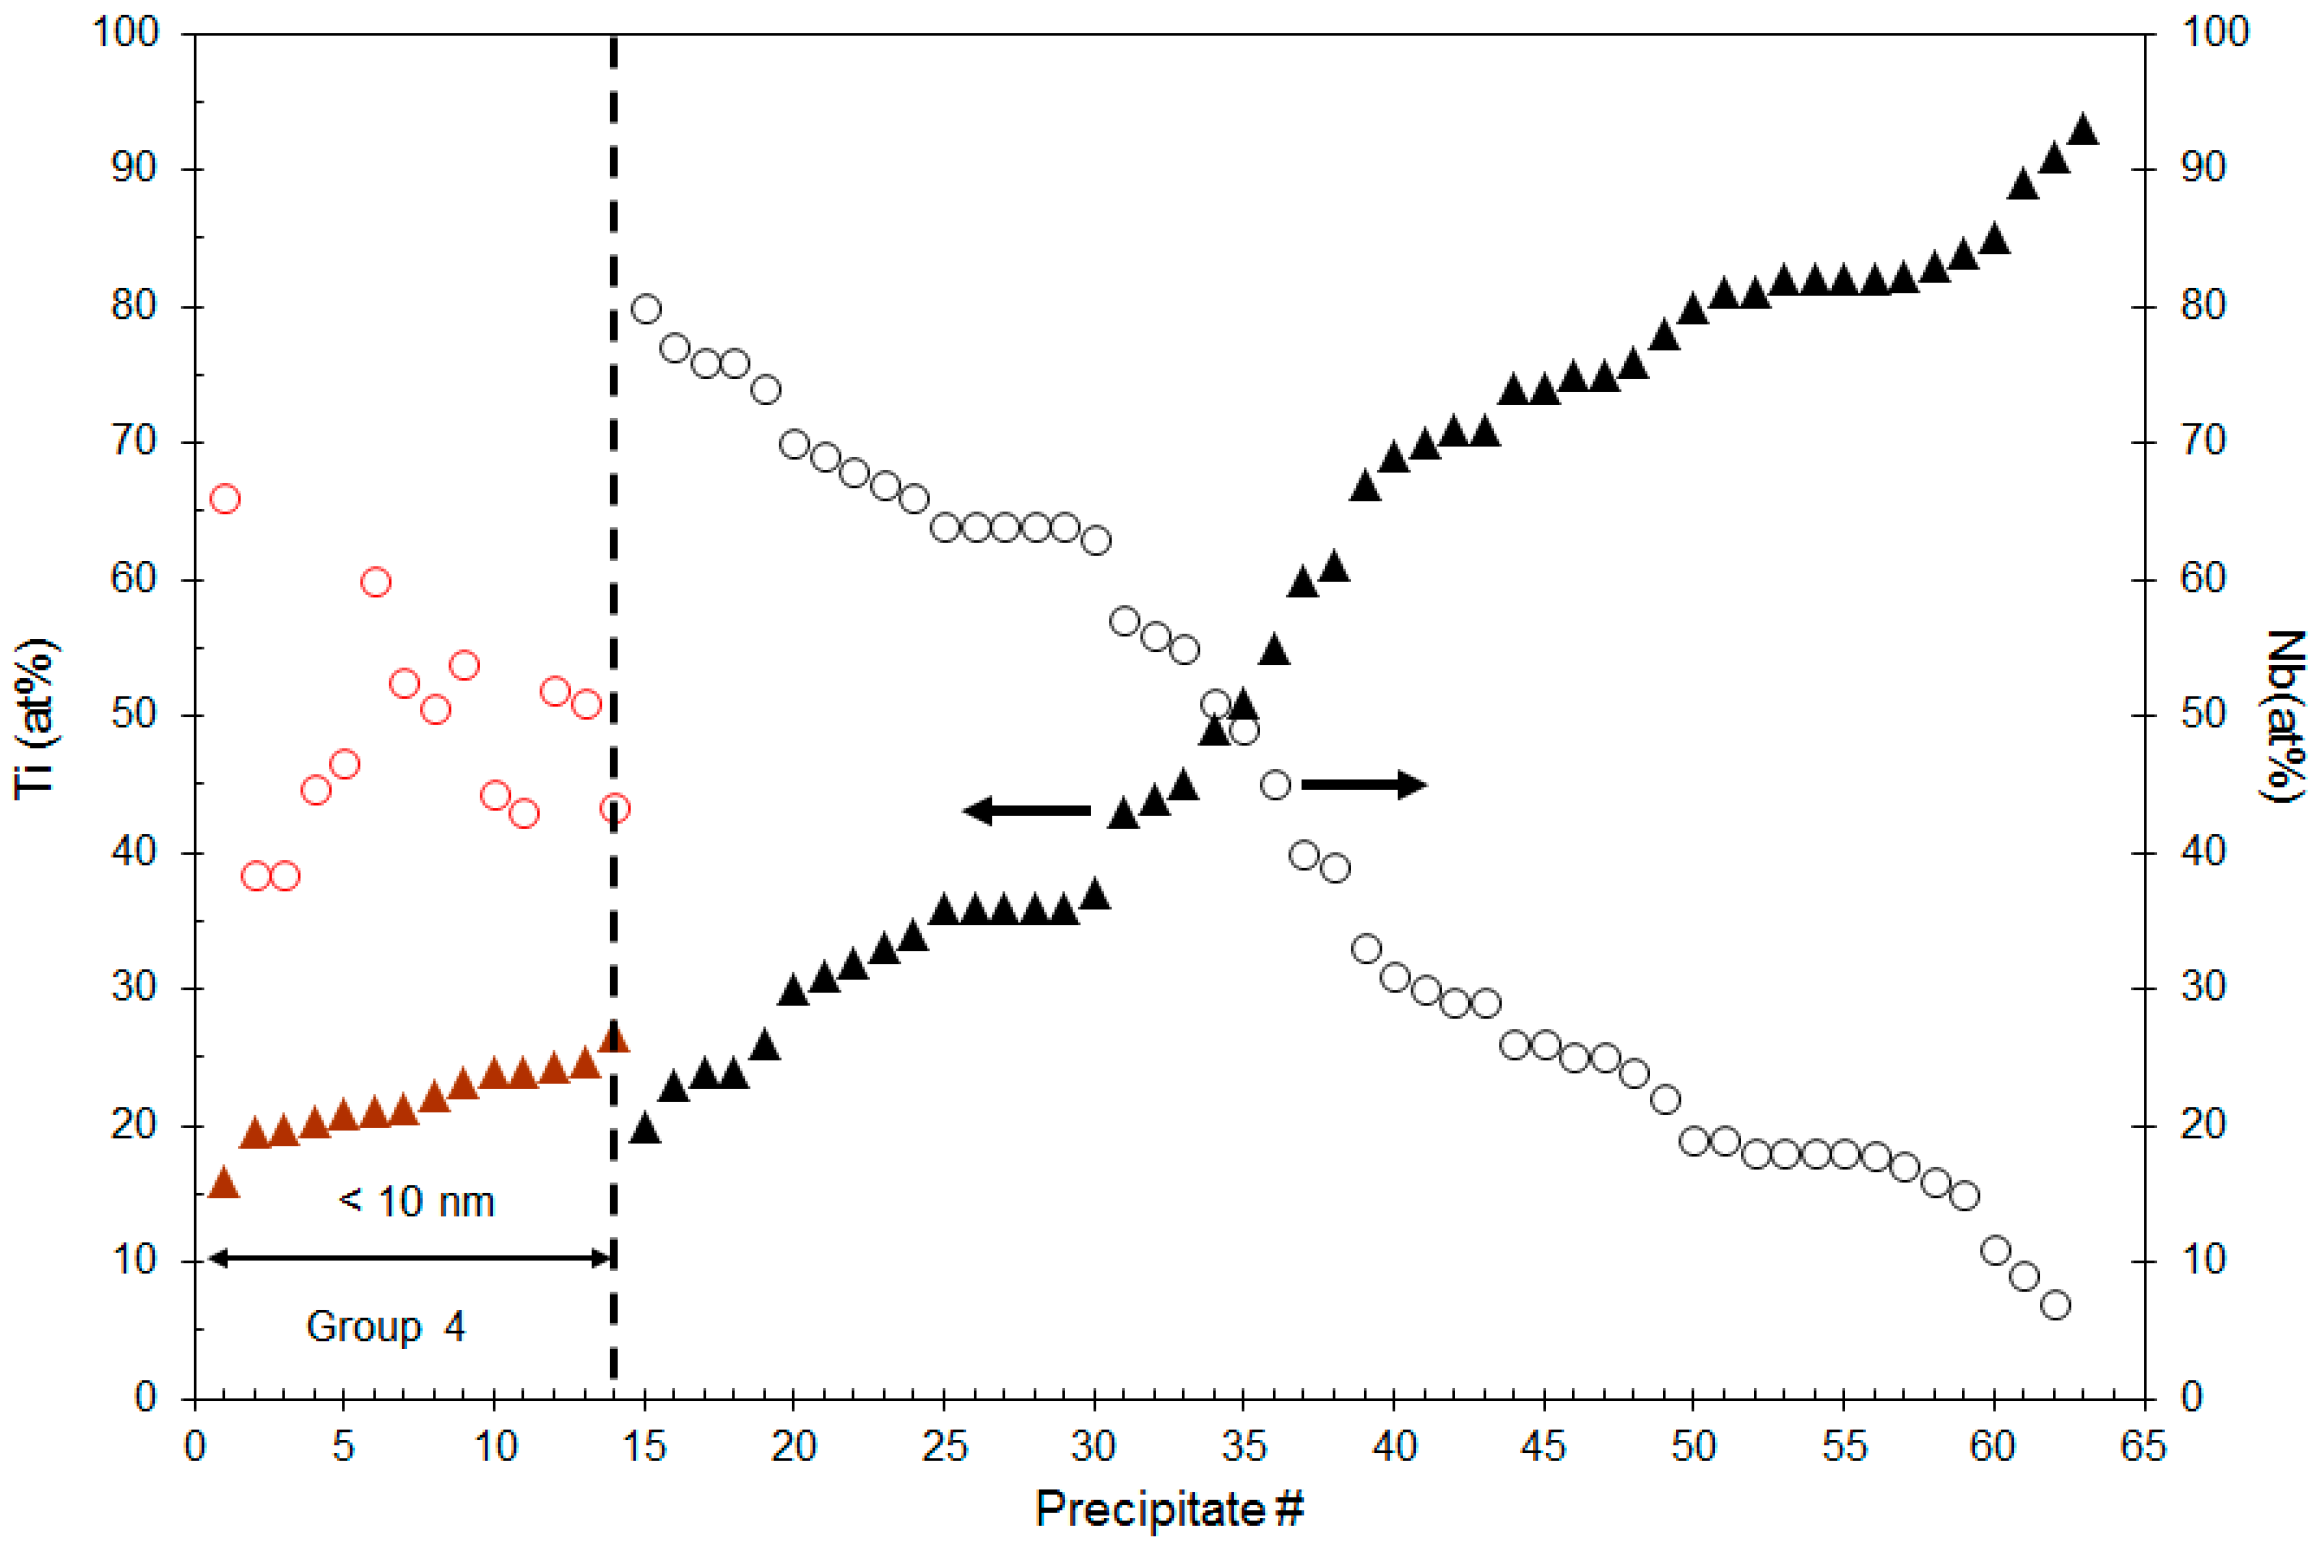
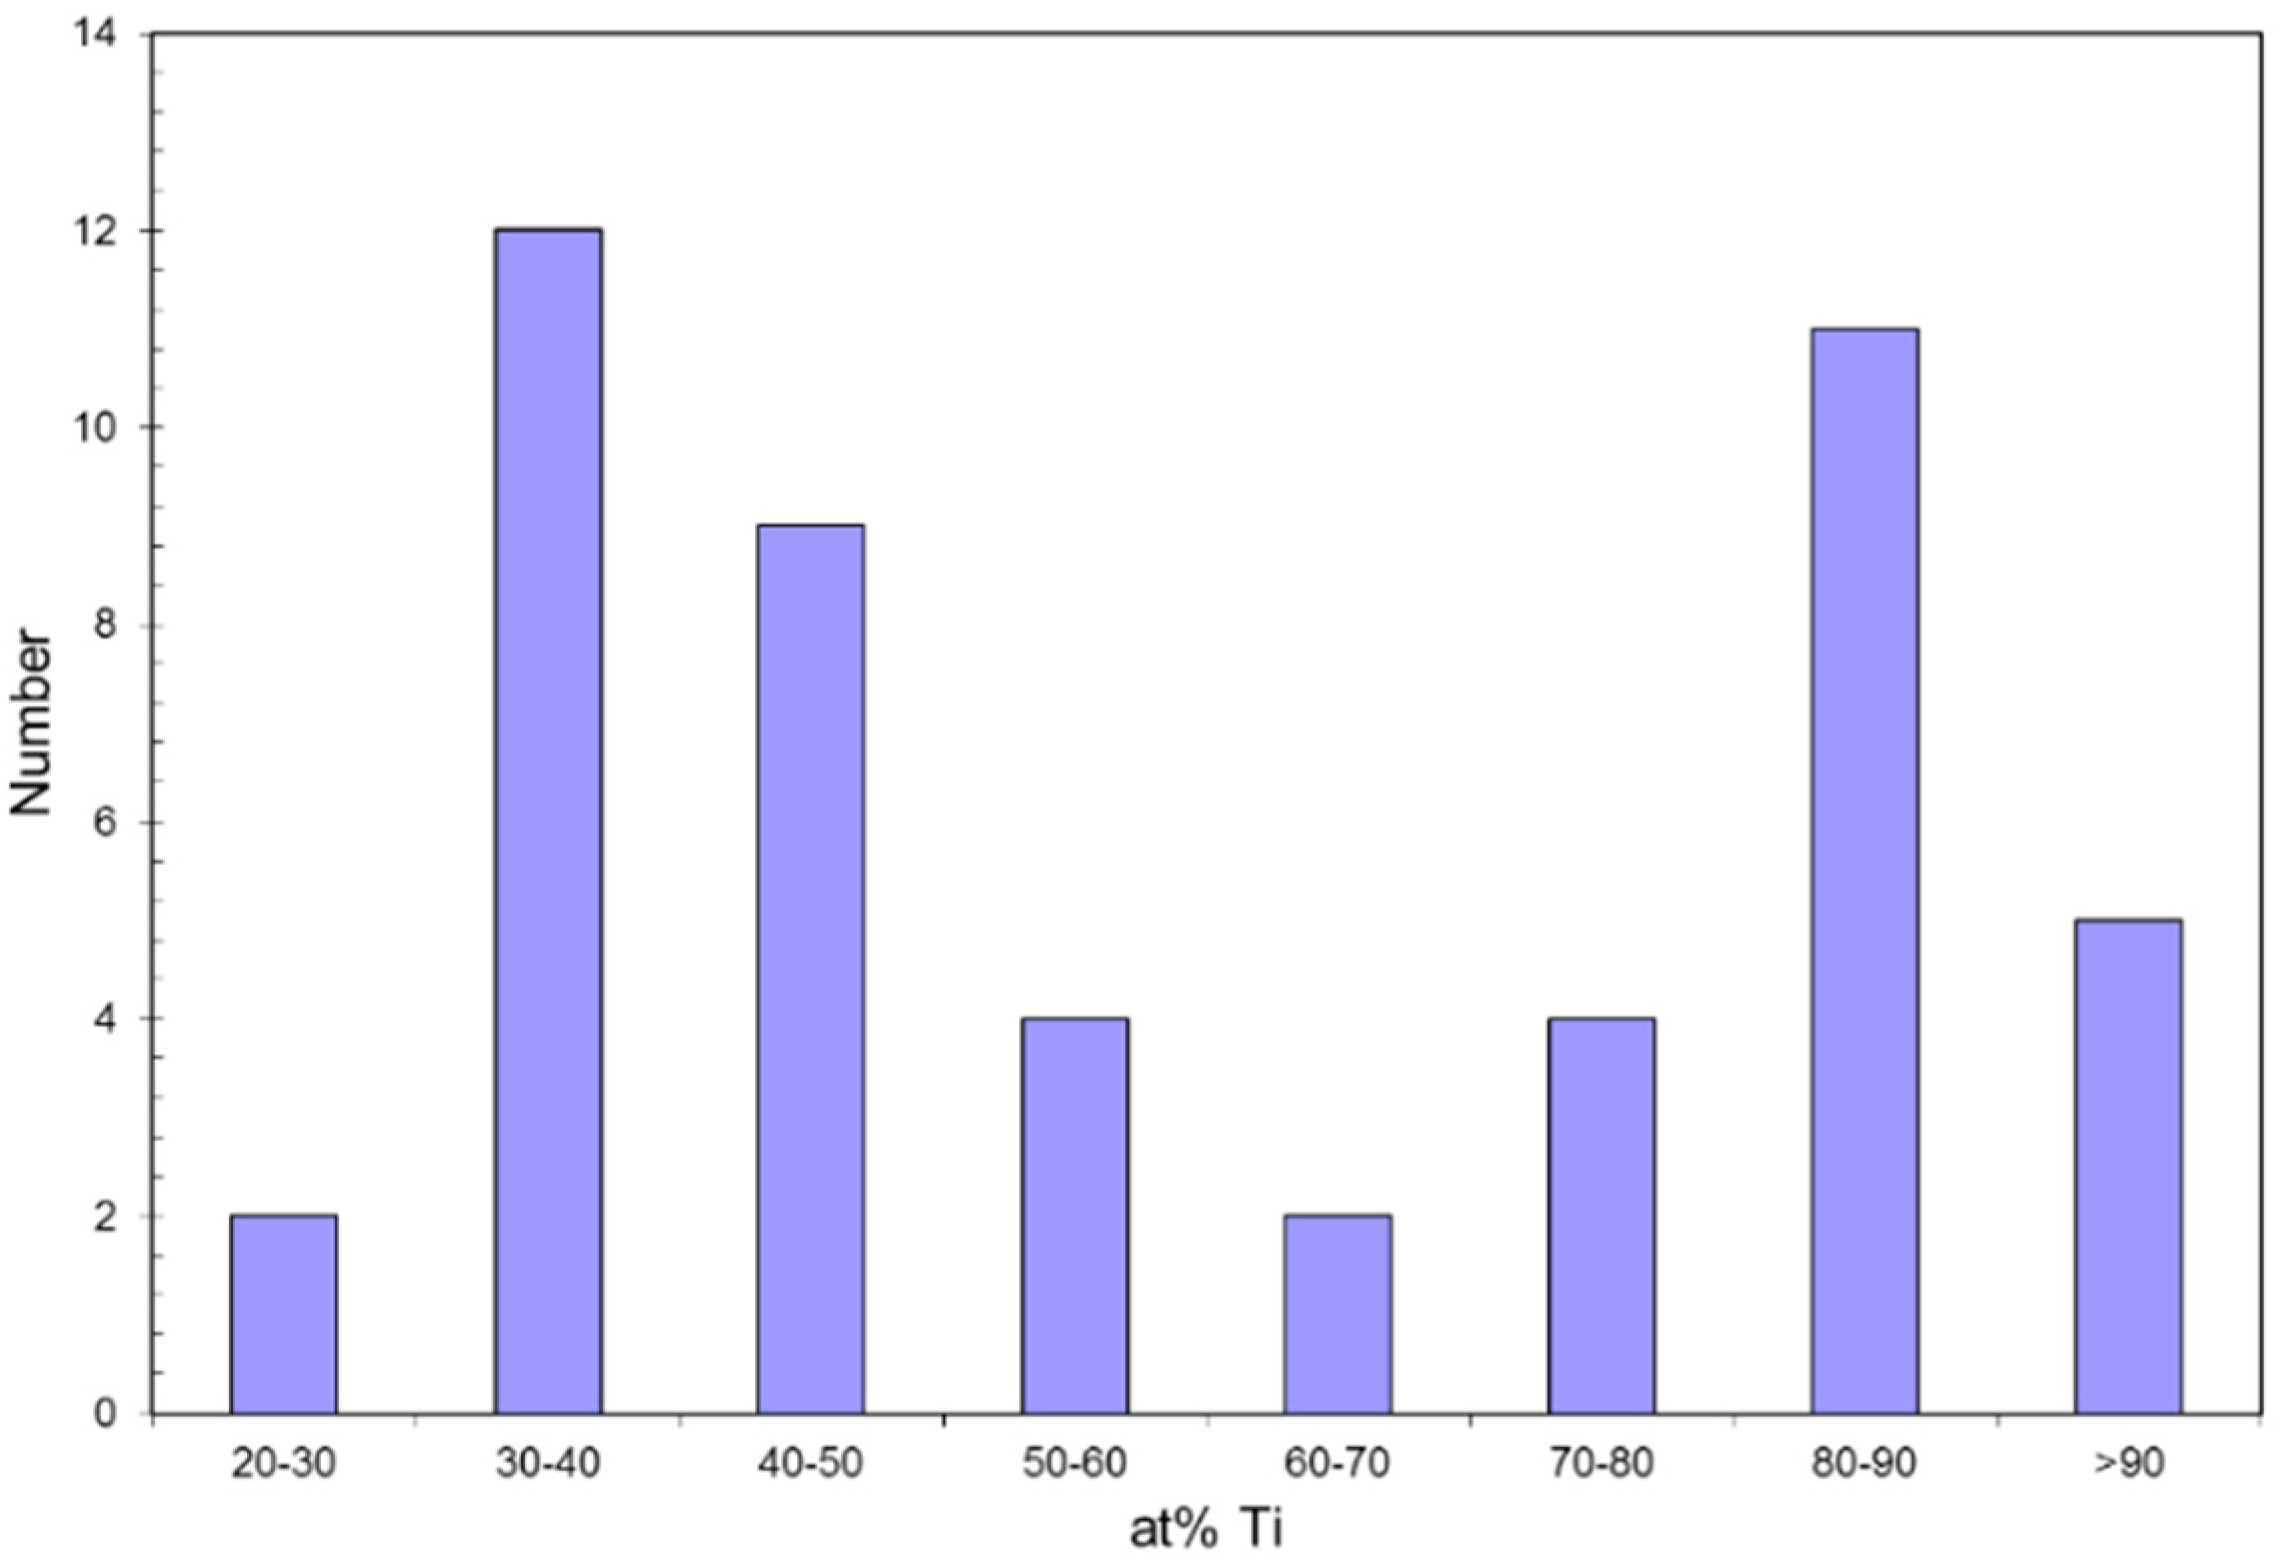
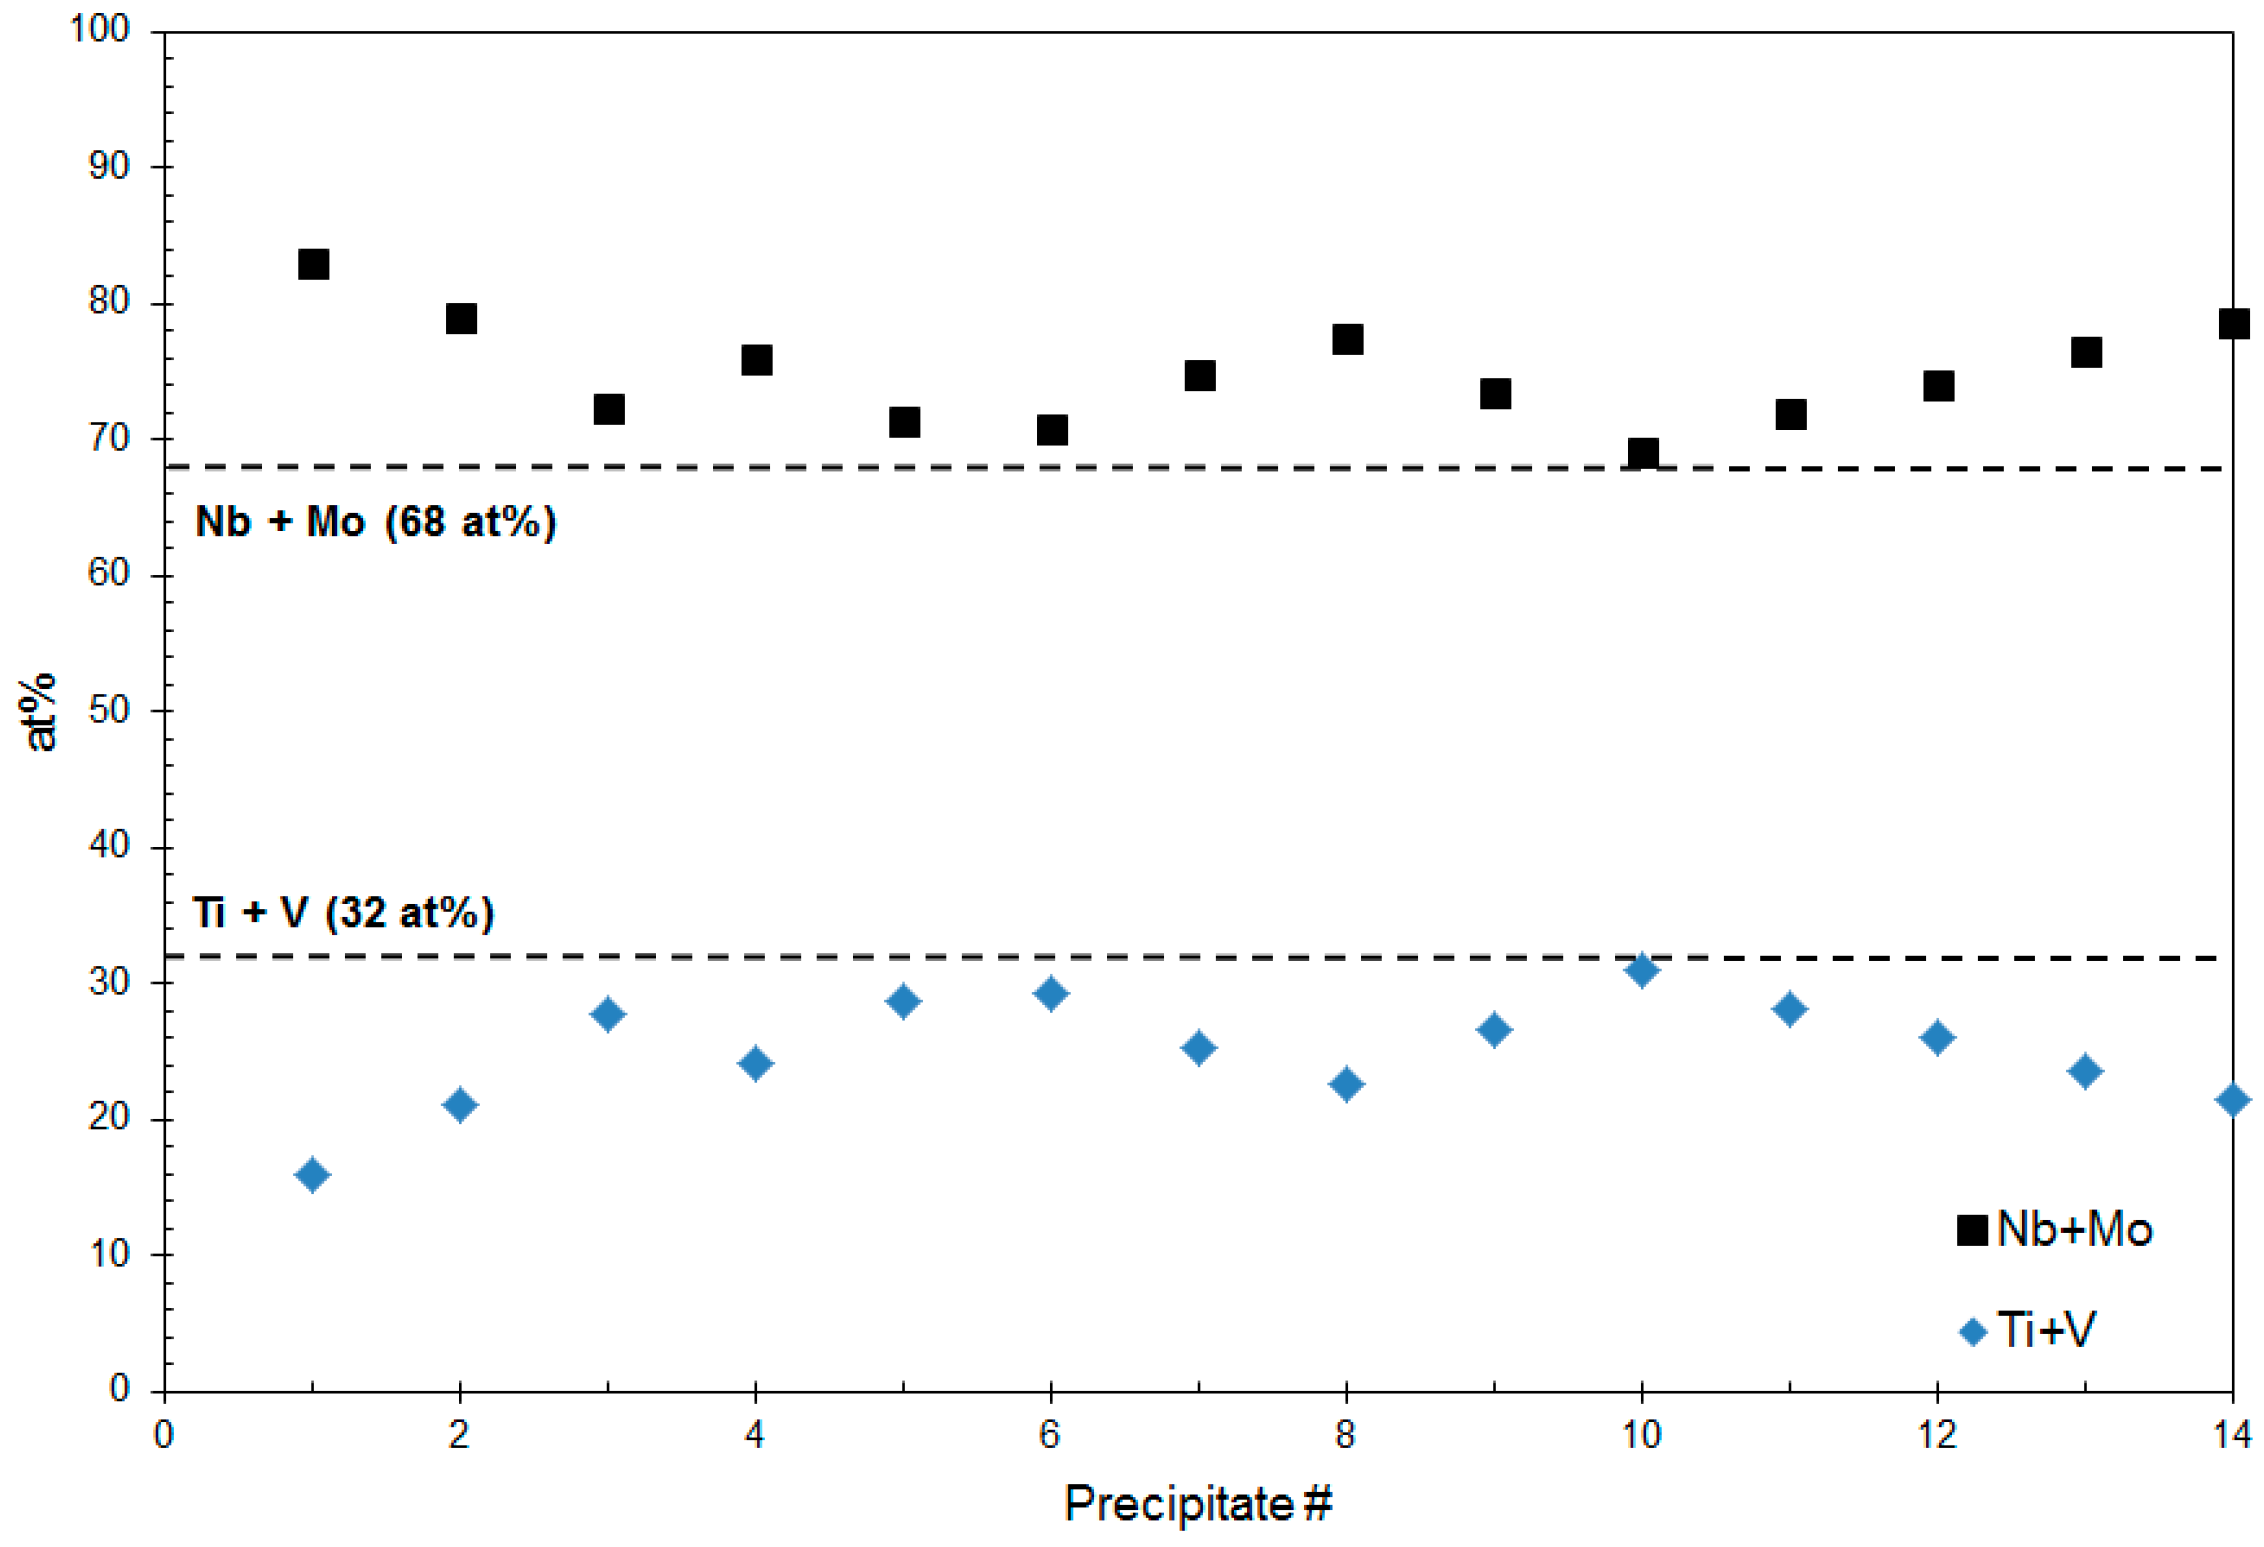
4.1. Composition Analysis

A comparison between the predicted and measured composition of the large (>90 nm) precipitates is undertaken. This is followed by an analysis of the more compositionally complex nano-size (<10 nm) precipitates.

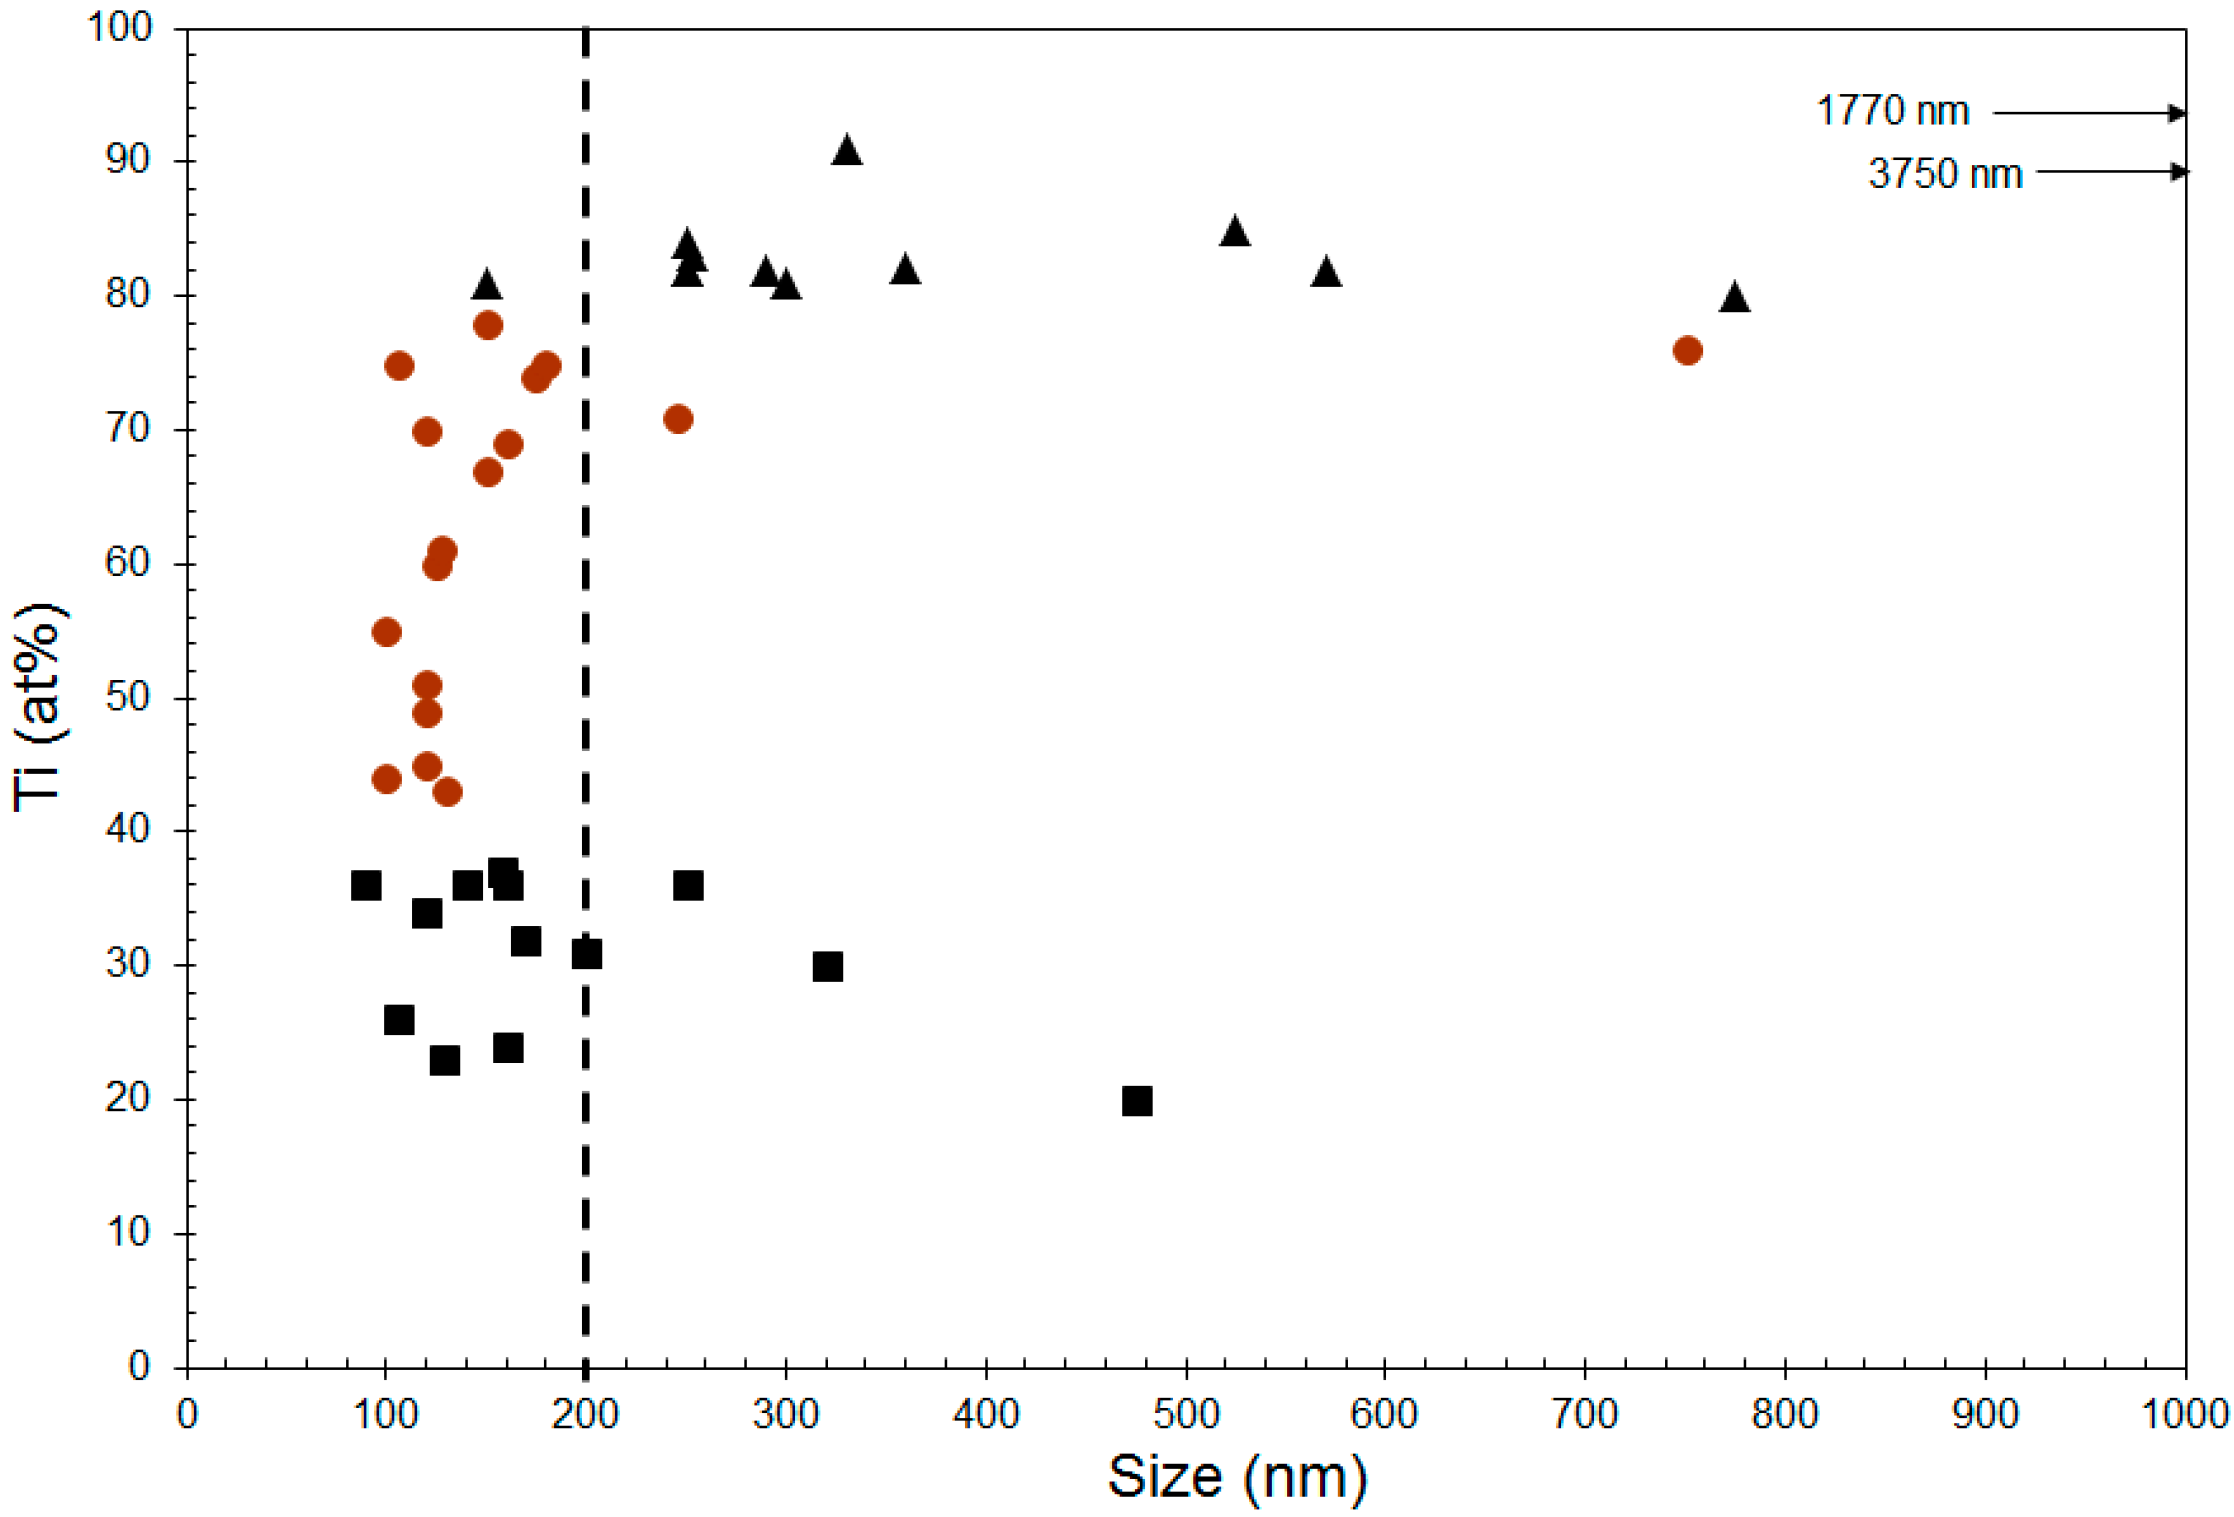
4.1.1. Composition of Precipitates >90 nm in Size

As shown previously (Figure 4), precipitates > 90 nm in size are composed of Ti and Nb. The number frequency plot (Figure 7) indicates that the majority of the precipitates have a Ti composition of either 80–90 at. % or 30–40 at. %. For the Group 2 precipitates, the predicted average Ti composition of 87 at. % (Table 2) agrees well with the EDX analysis, both in terms of the Ti composition and the relatively high weight fraction of this group (31.7 wt. %) in the extracted residue. In addition, the predicted lattice parameter (Table 2) for the Group 2 precipitates (Ti0.87Nb0.13N) was 4.28 Å. This value corresponds reasonably well with the lattice parameter for a TixNb1−xN (0 ≤ x ≤ 1) precipitate (4.26 Å) of this composition if a linear change in the lattice parameter, in going from TiN (4.24 Å) to NbN (4.40 Å), is assumed.
QXRD predicts TiN (Group 1) precipitates are present, however, a TiN precipitate was not observed in the EDX analysis. This may be attributed to the relatively small number of precipitates (63) sampled.

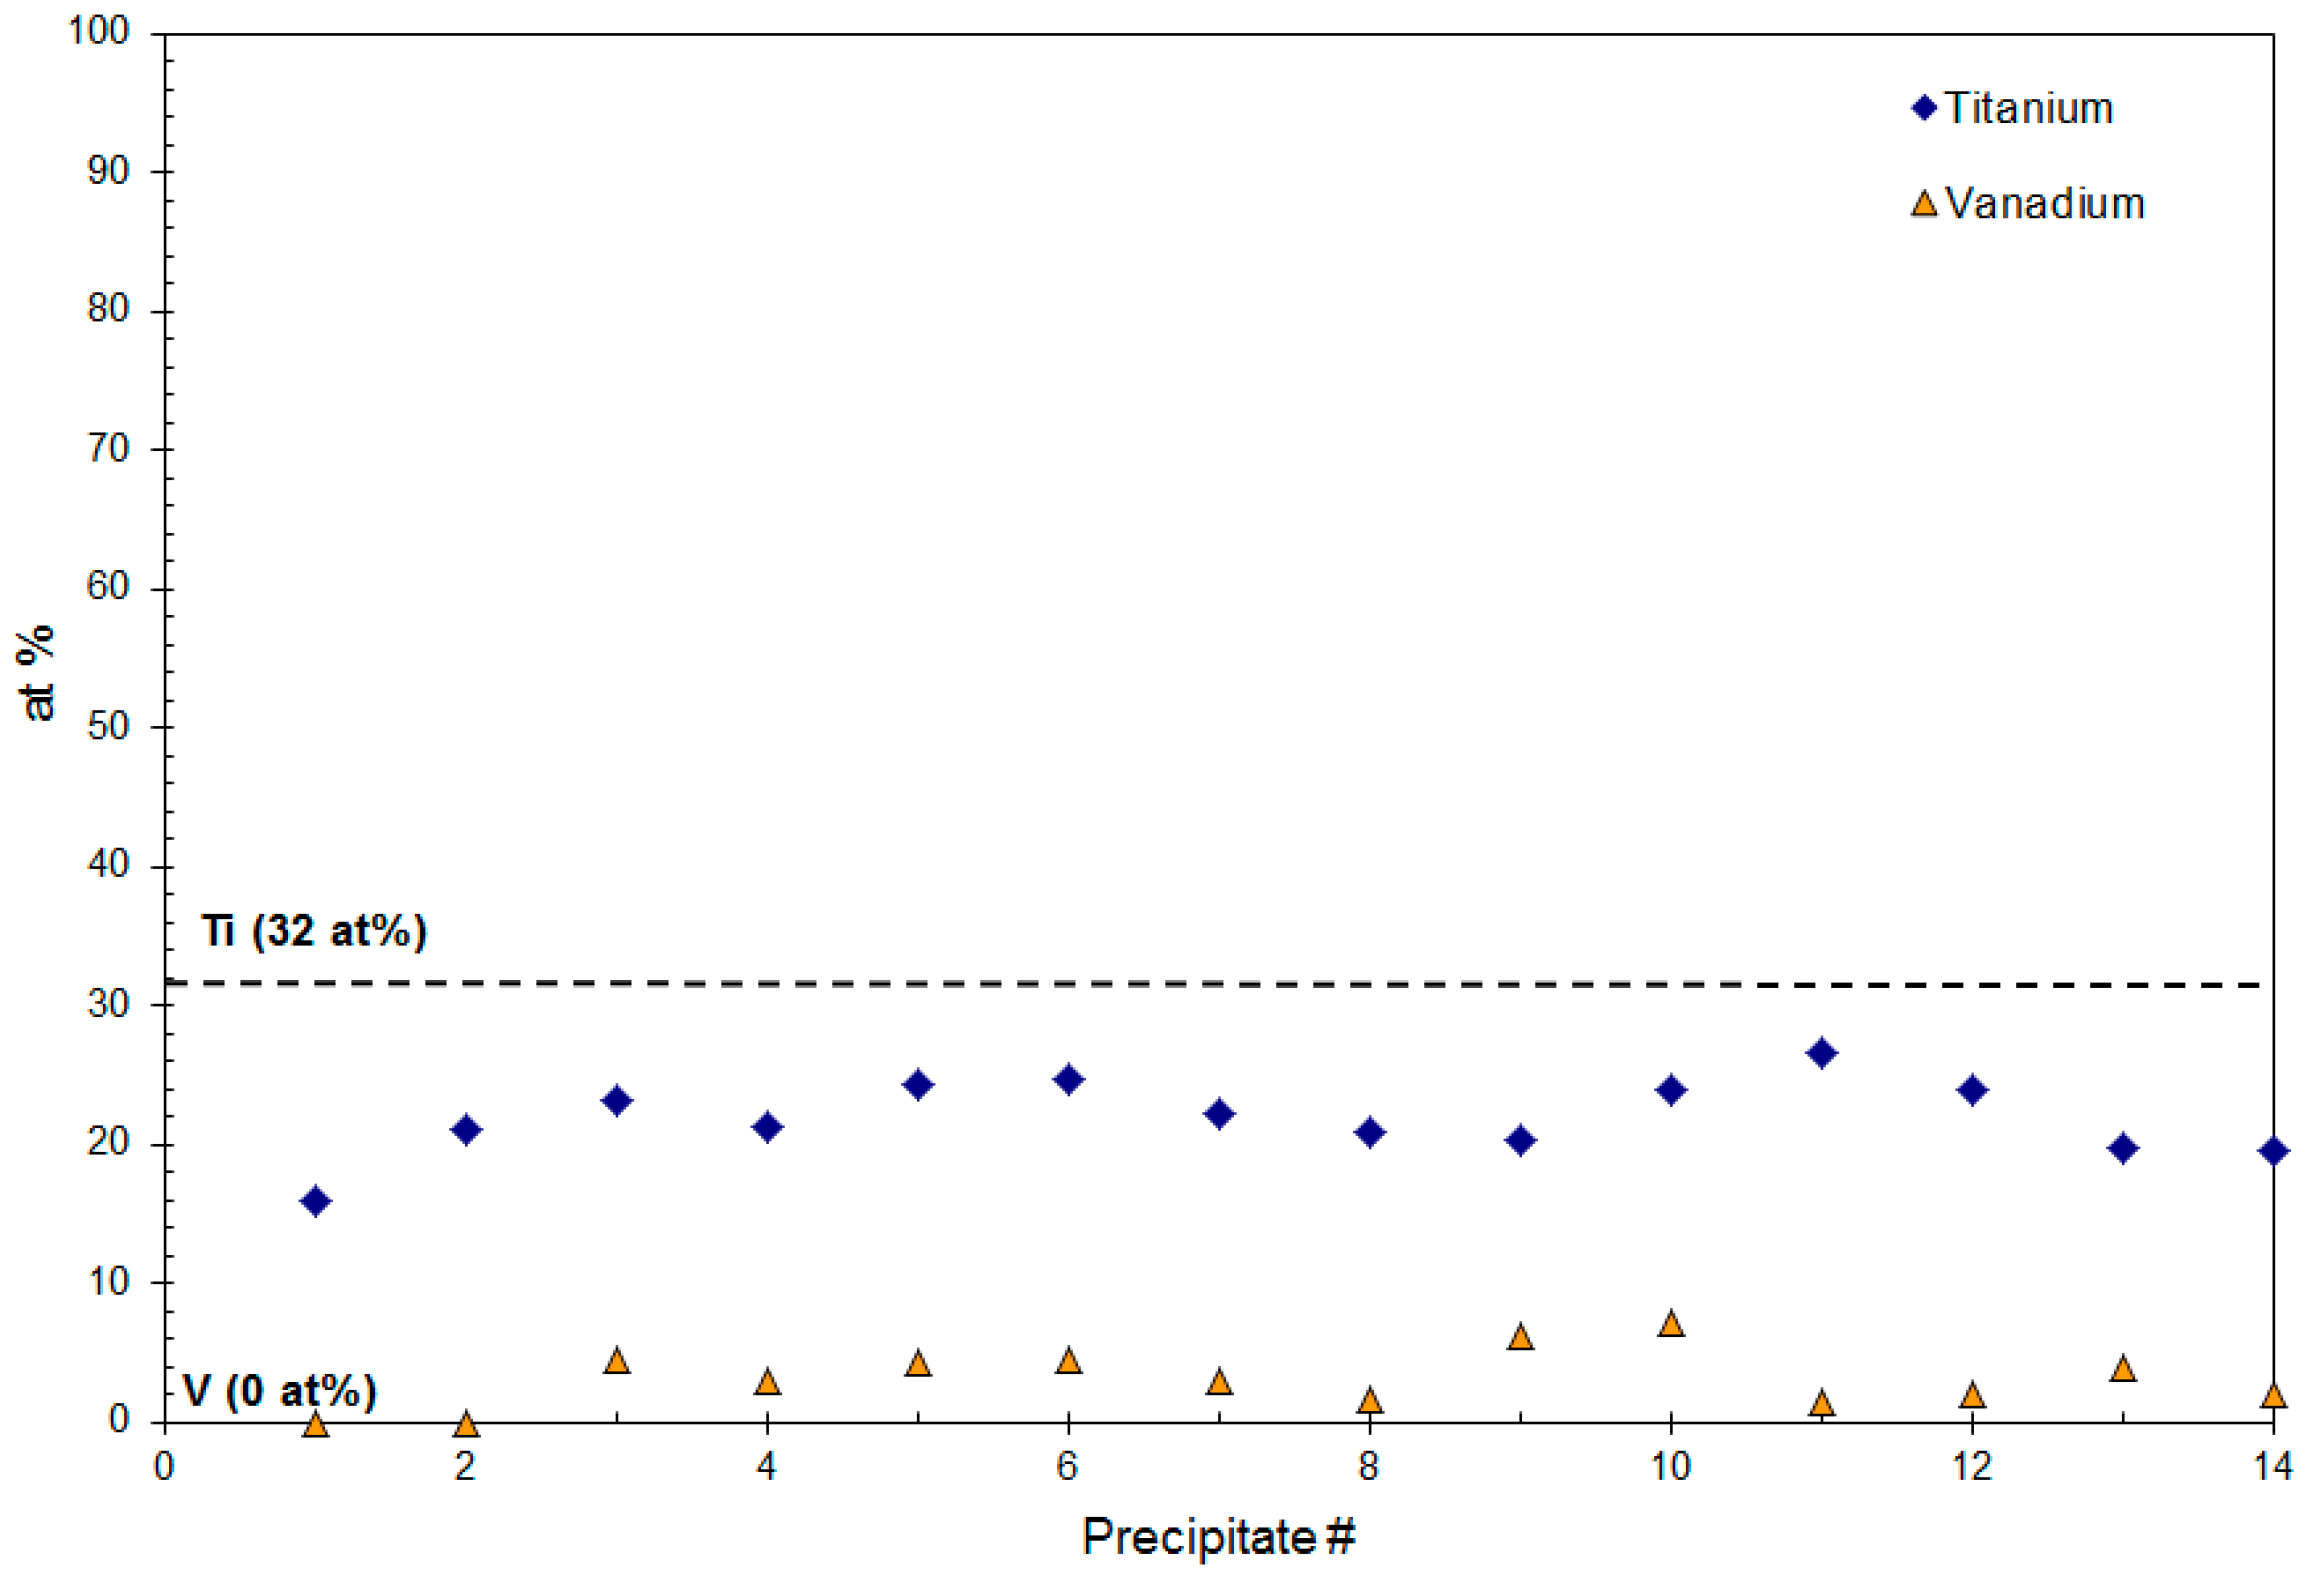
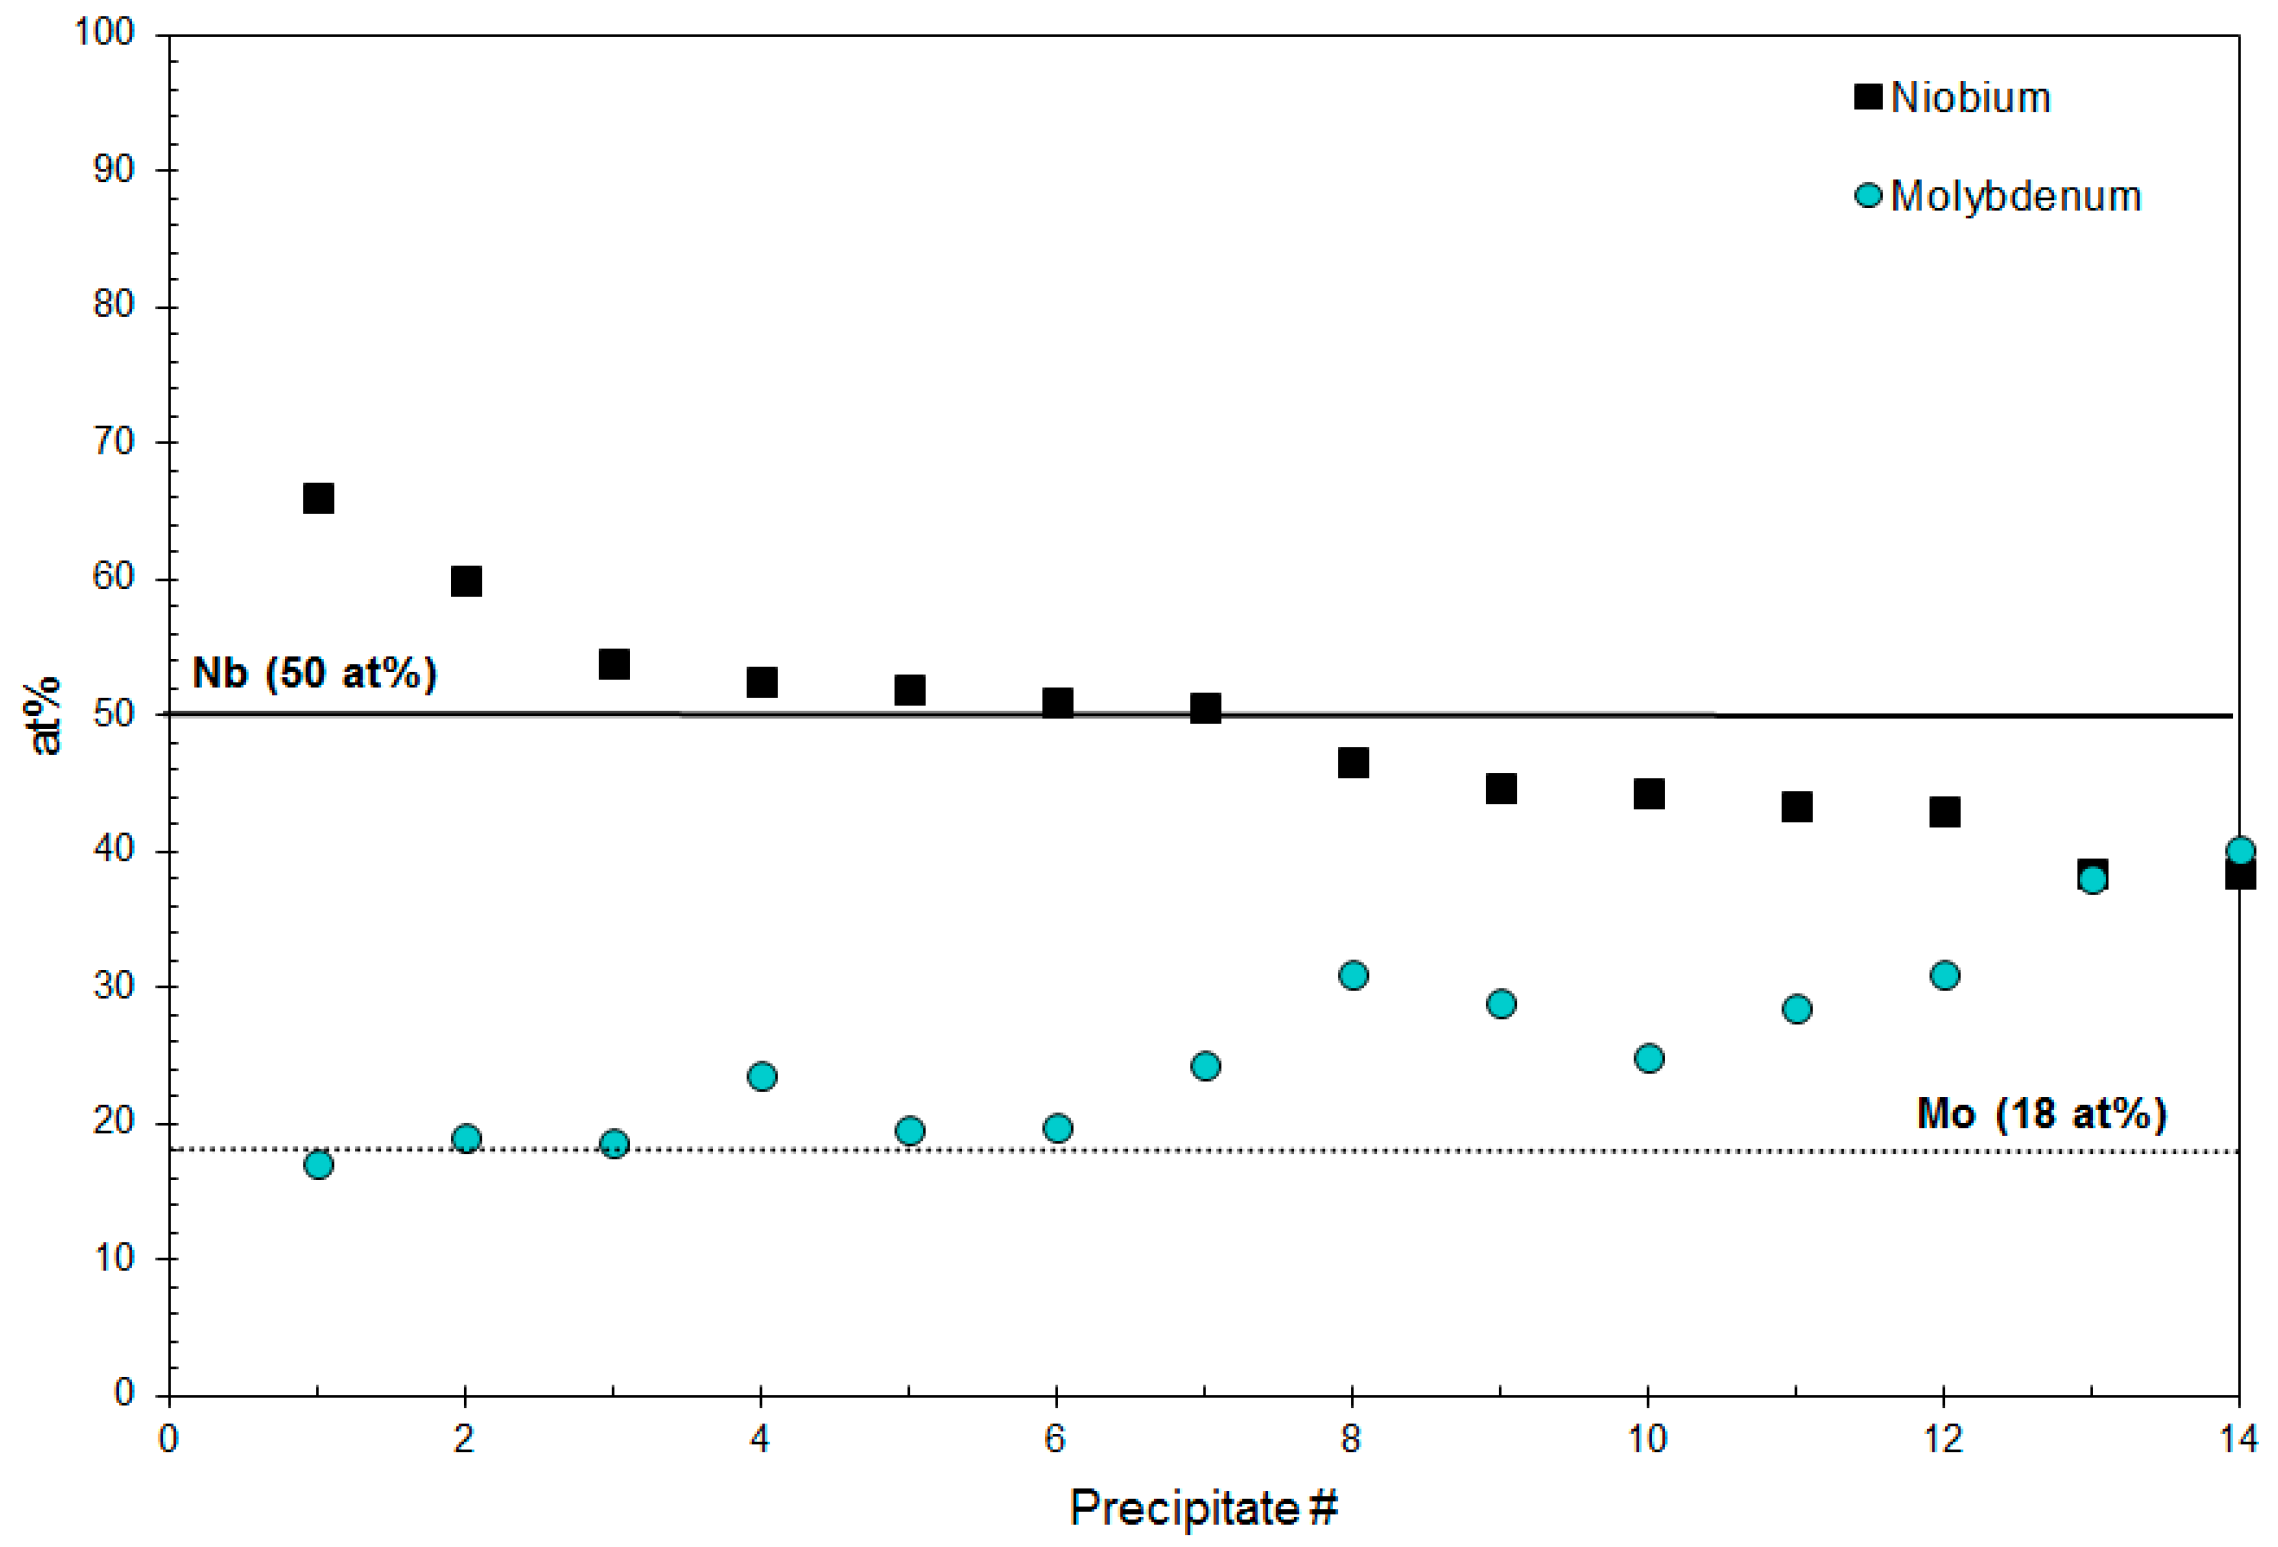
4.1.2. Composition of Precipitates <10 nm in Size

The composition predicted by the Rietveld analysis for the Group 4 nano-size precipitates is (Nb0.50Ti0.32M0.18)(C0.59N0.41) (Table 2). The predicted Rietveld compositions (solid and dashed horizontal lines) are compared with the measured EDX analysis compositions for both Nb and Mo in Figure 8 and for both Ti and V in Figure 9. For both figures, the measured composition shows some deviation from the QXRD predicted compositions. In particular, the predicted level of V is zero even though EDX analysis confirmed its presence. It is believed that the amount of V present in the precipitates (<5 at. %) may be below the sensitivity of the quantitative XRD analysis.
The deviations observed in Figure 8 and Figure 9 may be attributed to the relative difference in atomic scattering factors used in the QXRD intensity calculations (Equation (2)) for each atom type. The structure factors (F) are nearly identical for both Nb and Mo, since they have similar atomic scattering factors (they are adjacent to one other in the periodic table); 41 for Nb and 42 for Mo at sinθ/λ = 0. In an analogous manner, both Ti and V exhibit similar (though significantly smaller) atomic scattering factors; 22 for Ti and 23 for V at sinθ/λ = 0. The small difference in atomic scattering between each pair of atoms may be indistinguishable within the QXRD calculations. Figure 10 compares the total QRDX predicted values for both (Nb + Mo) composition and (Ti + V) composition with the measured combined composition values. For both cases, there is better agreement between the measured composition values and the QXRD predicted values. These results indicate a limitation for using QXRD to distinguish between similar atoms in a precipitate crystal structure.
In addition to the levels of the microalloying elements present, a relatively balanced amount of C and N (C0.59 vs. N0.41) is observed in the nano-precipitates (Table 2). This suggests that a sufficient amount of both C and N was still available in solution during the nano-precipitation event. However, the relative amount of C/N predicted by QXRD has not been independently confirmed.

4.2. Size (Lvol) Analysis

A comparison between the predicted and measured size of the large (>90 nm) precipitates has been undertaken. This is followed by a comparison of the predicted size of the nano-size (<10 nm) precipitates with SANS precipitate size results measured by the authors in previous work [10].

4.2.1. Size of Precipitates >90 nm

The wide variation in both composition (Figure 6) and size (Figure 7) for Group 1 to 3 precipitates is believed to have a strong effect on both the size (Lvol) and strain (εo) values predicted using QXRD.
The domain sizes (Lvol) predicted by quantitative XRD analysis (Table 2) for Group 1 to 3 precipitates (70 nm, 115 nm, and 40.3 nm) are smaller than the minimum size range reported in Figure 7. This contradiction between the size predicted by quantitative XRD and the size directly measured is likely related to the compositional complexity of the precipitates present in the Grade 100 steel. As discussed earlier, the predicted values of domain sizes (and microstrain) are based only on the broadening of the diffraction peak. However, artificially broadening of a diffraction peak can also arise from slight variations in lattice parameter (i.e., a change in d spacing) due to a variation in the relative amounts of Ti and Nb in the Group 1–3 precipitates. Alternatively, XRD broadening may arise from a polycrystalline precipitate structure (i.e., the domain size is a measure of the grain size within the precipitate and not the total precipitate size). However, selected area diffraction (SAD) analysis of the relatively large microalloyed steel precipitates [1] indicates the precipitates are single crystals; as such, the domain and precipitate size are equivalent.

4.2.2. Size of the Group 4 Precipitates

The average domain size (Lvol) predicted for the (NbxTiyMo1−xy)(CN) precipitates (0 ≤ x, y ≤ 1) (Table 2) of 4.7 nm is in good agreement with the average size obtained using SANS (5.5 nm) [10] and TEM (3.9 nm) [28]. SAD analysis of the small size precipitates indicates that they are single crystals; hence, the value of Lvol is equivalent to the precipitate size. It should be noted that the SANS and TEM data were originally obtained in the form of a size distribution. The TEM precipitate size (3.9 nm) corresponds to the size at which the maximum number of precipitates was observed. Similarly, the SANS analysis showed that the nano-size consisted of two overlapping log normal distributions with mean values of 3.4 nm and 6.6 nm [10]. A weighted average of each distribution was used to obtain the overall mean size of 5.5 nm from the SANS analysis. The effect of a multimodal distribution on the peak broadening effect in the Rietveld analysis is not known.

5. Conclusions

  • Quantitative X-ray diffraction (QXRD) via the Rietveld method can be used to quantify both the average size and composition of nano-size precipitates in a microalloyed steel. The average predicted Lvol size of 4.7 nm corresponds well with precipitate size analysis conducted using transmission electron microscopy (TEM) (3.9 nm) and small angle neutron scattering (SANS) (5.5 nm). The predicted composition of the nano-size precipitates ((Nb0.50Ti0.32M0.18)(C0.59N0.41)) also compares favorably with the individual compositions measured by energy dispersive X-ray (EDX) analysis.
  • The variation in the Nb and Ti composition (as measured with EDX) of the relative large (>90 nm) precipitates present in the Grade 100 steel limited the microstructure information that could be obtained from QXRD. In particular, the Lvol predicted by quantitative XRD was inconsistent with the individual precipitate sizes physically measured.
  • QXRD can be used to quantify the effect of TCMP processing on precipitation in a microalloyed steel, as long as the limitations are adequately accounted for.

Acknowledgments

The authors would like to thank Laurie Collins for his input and EVRAZ N.A. Inc., Enbridge, TCPL, Alliance Pipelines and UT Quality for financial support.

Author Contributions

Lu completed her Ph.D. on precipitate characterization in microalloyed steels. Wiskel and Omotoso contributed to the QXRD section and Ivey and Henein contributed to the EDX/TEM section.

Conflicts of Interest

The authors declare no conflict of interest.

References

  1. Sharma, U. Microstructural Characterization of Microalloyed Linepipe Steels. M.Sc. Thesis, University of Alberta, Edmonton, Canada, 1999. [Google Scholar]
  2. Akhlaghi, S.; Ivey, D.G. Precipitation behaviour of a grade 100 structural steel. Can. Metall. Q. 2002, 41, 111–119. [Google Scholar] [CrossRef]
  3. Lu, J. Quantitative microstructural characterization of microalloyed steels. Ph.D. Thesis, University of Alberta, Edmonton, Canada, 2009. [Google Scholar]
  4. Elwazri, A.M.; Varano, R.; Siciliano, F.; Bai, D.; Yue, S. Characterization of precipitation of niobium carbide using carbon extraction replicas and thin foils by FESEM. Mater. Sci. Technol. 2006, 22, 537–541. [Google Scholar] [CrossRef]
  5. Nagarajan, V.; Palmiere, E.J.; Sellars, C.M. New approach for modelling strain induced precipitation of Nb(C,N) in HSLA steels during multipass hot deformation in austenite. Mater. Sci. Technol. 2009, 25, 1168–1174. [Google Scholar] [CrossRef]
  6. Charleux, M.; Poole, W.J.; Militzer, M.; Deschamps, A. Precipitation behaviour and its effect on strengthening of an HSLA-Nb/Ti steel. Metall. Mater. Trans. A 2001, 32A, 1635–1647. [Google Scholar] [CrossRef]
  7. Shanmugam, S.; Ramisetti, N.K.; Misra, R.D.K.; Hartmann, J.; Jansto, S.G. Microstructure and high strength-toughness combination of a new 700 MPa Nb-microalloyed pipeline steel. Mater. Sci. Eng. A 2008, A478, 26–37. [Google Scholar] [CrossRef]
  8. Lee, W.; Hong, S.G.; Park, C.G.; Park, S.H. Carbide precipitation and high-temperature strength of hot-rolled high-strength, low-alloy steels containing Nb and Mo. Metall. Mater.Trans. A 2002, 33A, 1689–1698. [Google Scholar] [CrossRef]
  9. Fatehi, A.; Calvo, J.; Elwazri, A.M.; Yue, S. Strengthening of HSLA steels by cool deformation. Mater. Sci. Eng. A 2010, A27, 4233–4240. [Google Scholar] [CrossRef]
  10. Wiskel, J.B.; Ivey, D.G.; Henein, H. The effects of finish rolling temperature and cooling interrupt conditions on precipitation in microalloyed steels using small angle neutron scattering. Metall. Trans. A 2008, 39B, 116–124. [Google Scholar] [CrossRef]
  11. Hua, M.; Garcia, C.I.; Deardo, A.J. Precipitation behaviour in ultra-low-carbon steels containing titanium and niobium. Metall. Trans. A 1997, 28A, 1769–1780. [Google Scholar] [CrossRef]
  12. Deardo, A.J. Niobium in modern steels. Int. Met. Rev. 2003, 48, 371–402. [Google Scholar] [CrossRef]
  13. Cheary, R.W.; Ma-Sorrell, Y. Quantitative phase analysis by X-ray diffraction of martensite and austenite in strongly oriented orthodontic stainless steel wires. J. Mater. Sci. 2000, 35, 1105–1113. [Google Scholar] [CrossRef]
  14. Martiez-Blanco, D.; Gorria, P.; Blanco, J.A.; Perez, M.J.; Campo, J. Analysis of the diffraction-line broadening on nanostructured Fe: Size-strain effects induced by milling and heating. J. Phys. Cond. Mater. 2008, 2, 1–10. [Google Scholar]
  15. Balzar, D.; Audebrand, N.; Daymond, M.R.; Fitch, A.; Hewat, A.; Langford, J.I.; le Bail, A.; Loue, D.; Masson, O.; McCowan, C.N.; et al. Size-strain line-broadening analysis of the ceria round-robin sample. J. Appl. Crystallogr. 2004, 37, 911–924. [Google Scholar] [CrossRef]
  16. Pourghahramani, P.; Forssberg, E. The characterization of structural changes in hematite ground in a confined particle bed using Rietveld analysis. Int. J. Miner. Process. 2007, 83, 47–59. [Google Scholar] [CrossRef]
  17. Langfordy, J.I.; Louer, D. Powder diffraction. Rep. Prog. Phys. 1996, 59, 131–234. [Google Scholar] [CrossRef]
  18. Young, R.A. Introduction to the Rietveld Method. In The Rietveld Method; Young, R.A., Ed.; Oxford University Press: Oxford, UK, 1993; pp. 1–30. [Google Scholar]
  19. Snyder, R.L. Analytical profile fitting of X-ray powder diffraction profiles. In The Rietveld Method; Young, R.A., Ed.; Oxford University Press: Oxford, UK, 1993; pp. 112–131. [Google Scholar]
  20. Delhez, R.D.; de Keijser, T.H.; Langford, J.I.; Louer, D.; Mittemeijer, E.J.; Sonneveld, E.J. Crystal imperfection broadening and peak shape in the Rietveld method. In The Rietveld Method; Young, R.A., Ed.; Oxford University Press: Oxford, UK, 1993; pp. 132–166. [Google Scholar]
  21. Kuzel, R.; Holy, V.; Cernansky, M.; Kubena, J.; Simek, D.; Kub, J. Study of submicrocrystalline materials by diffuse scattering in transmitted waves. In Diffraction Analysis of the Microstructure of Material; Mittemeijer, E.J., Scardi, P., Eds.; Springer: New York, NY, USA, 1984; pp. 229–245. [Google Scholar]
  22. Balzar, D.; Popa, N.C. Crystallite size and residual strain/stress modelling in Rietveld refinement. In Diffraction Analysis of the Microstructure of Material; Mittemeijer, E.J., Scardi, P., Eds.; Springer: New York, NY, USA, 1984; pp. 125–145. [Google Scholar]
  23. Coelho, A. Topas Academic Version 4.1; software for analysis of powder diffraction data, Coelho software: Brisbane, Australia, 2007.
  24. Scardi, P; Leoni, M. Whole profile pattern modelling: theory and applications. In Diffraction Analysis of the Microstructure of Material; Mittemeijer, E.J., Scardi, P., Eds.; Springer: New York, NY, USA, 1984; pp. 51–91. [Google Scholar]
  25. Balzar, D. Voigt function model in diffraction-line broadening analysis. In Microstructure Analysis from Diffraction; Snyder, R.L., Bunge, H.J., Fiala, J., Eds.; Oxford University Press: Oxford, UK, 1999; pp. 94–124. [Google Scholar]
  26. He, J.; Laverna, E.J.; Mateczyk, D.; Bampton, C.; Schoenung, J.M. Quantitative analysis of grain size in bimodal powders by X-ray diffraction and transmission electron microscopy. J. Mater. Sci. 2004, 39, 6957–6964. [Google Scholar] [CrossRef]
  27. Vives, S.; Gaffet, E.; Meunier, C. X-ray diffraction line profile analysis of iron ball milled powders. Mater. Sci. Eng. 2004, A366, 229–238. [Google Scholar] [CrossRef]
  28. Poorhaydari-Anaraki, K. Microstructure and Property Examination of the Weld HAZ in Grade 100 Microalloyed Steel. Ph.D. Thesis, University of Alberta, Edmonton, Canada, 2005. [Google Scholar]
Figure 1. Magnified view (65° < 2θ < 75°) of the measured XRD pattern.
Metals 06 00090 g001
Figure 2. Comparison between the measured and predicted XRD pattern.
Metals 06 00090 g002
Figure 3. Comparison of the measured and predicted (bottom smooth curve) XRD patterns for the Group 4 precipitates for the (220) plane.
Metals 06 00090 g003
Figure 4. (a) TEM BF image of extracted nano-size precipitates and (b) EDX spectrum from a single circled region. Note that the Cu peaks are from the support grid, trace amounts of Cr from the Grade 100 composition, while Ca and Si are from inclusions also generated during the extraction process.
Metals 06 00090 g004
Figure 5. Amount of Ti (solid triangles) and Nb (open circles) for selected precipitates measured by EDX analysis.
Metals 06 00090 g005
Figure 6. Ti composition vs. precipitate size, measured by EDX analysis, for the Group 1–3 precipitates.
Metals 06 00090 g006
Figure 7. Number of precipitates, in Groups 2 and 3, as a function of measured Ti composition.
Metals 06 00090 g007
Figure 8. Measured Nb (squares) and Mo (circles) compositions vs. QXRD predicted compositions (solid line for Nb and dotted line for Mo).
Metals 06 00090 g008
Figure 9. Measured Ti (diamonds) and V (triangles) compositions vs. QXRD predicted compositions (dashed line for Ti and 0 at % for V).
Metals 06 00090 g009
Figure 10. Measured (Nb + Mo) composition (squares) and measured composition (Ti + V) (diamonds) vs. predicted combined compositions (dashed lines).
Metals 06 00090 g010
Table 1. XRD instrument parameters.
ParameterValueParameterValue
filament length 12 mmprimary soller angle2.3°
sample length 20 mmaxial beta20°
receiving slit length 50 mmaxial del0.0053°
slit width 0.15 mm--
Table 2. QXRD values for composition, weight fraction, and microstructure dependent variables.
GroupAtomic Compositionwt. %a (Å)Lvol (nm)εo (%)
1TiN12.94.2570.08.8
2Ti0.87Nb0.13N31.74.28115.030.1
3Nb0.82Ti0.18C0.87N0.1313.14.4240.39.9
4Nb0.50Ti0.32Mo0.18C0.59N0.4142.24.394.725.2

