Article

Characterisation of an Advanced Nickel Based Superalloy Post Cold Work by Swaging

1
Institute of Structural Materials, Swansea University, Bay Campus, Fabian Way, Swansea SA1 8EN, UK
2
School of Materials, University of Manchester, Oxford Rd, Manchester M13 9PL, UK
3
Rolls-Royce plc, P.O. Box 31, Derby DE24 8BJ, UK
*
Author to whom correspondence should be addressed.
Metals 2016, 6(3), 54; https://doi.org/10.3390/met6030054
Submission received: 21 December 2015 / Revised: 27 January 2016 / Accepted: 23 February 2016 / Published: 4 March 2016
(This article belongs to the Special Issue Superalloys)

Abstract

:
Cylindrical bars of the advanced nickel based superalloy RR1000 were subjected to swaging to induce approximately 30% cold work. Grain size analysis demonstrated a distinct modification to the microstructure whilst electron back scattered diffraction (EBSD) measurements confirmed the evolution of a relatively strong <111> texture parallel with the longitudinal bar axis. Intragranular strain damage was identified. The effects of the swaging on bulk mechanical properties are illustrated across a range of test temperatures.

Graphical Abstract

1. Introduction

Surface treatments such as shot peening or burnishing are often applied to engineering components, in order to resist fatigue crack initiation in particular. The benefits are evident by an increase in the fatigue endurance strength, especially notable in the high cycle fatigue regime. This strength improvement can be assigned to the combined effects of the compressive, residual stress and the degree of cold work (pre-strain) induced at or near surface.
The partitioning of the relative effects of these two factors is difficult to discern. However, previous high temperature fatigue studies have indicated that the joint application of high temperature and high strain can cause significant relaxation of shot peened residual stresses. Fatigue testing of shot peened Udimet® 720Li at 350 °C, 650 °C and 700 °C, at a strain range of 1.2% by Evans et al. [1], measured approximately 50% relaxation of residual stresses after the initial fatigue cycle alone. Kirk [2] showed that a small amount of plastic strain applied under static tension could cause significant stress relaxation in shot peened copper and nickel. However, at the same time, both of those studies illustrated that the prevailing thermomechanical conditions did not significantly affect the inherent cold work microstructure. Hasegawa et al. [3] showed increased fatigue life at low temperatures in shot peened 0.5% carbon steel despite relaxation of residual stresses. Life deficits were only found after cold work levels relaxed at higher temperatures. Many aspects of these studies indicate that it is the cold work from shot peening that improves the fatigue performance over and above the effects of the compressive residual stress.
In an attempt to isolate the effects of cold work on mechanical behaviour, the current study applied swaging to cylindrical bars of the nickel based superalloy RR1000. Detailed characterisation of the post swaged microstructures will demonstrate the resultant grain size and form, together with the evolution of microstructural texture. Mechanical assessment included microhardness and monotonic tension across a range of temperatures.

2. Materials and Methods

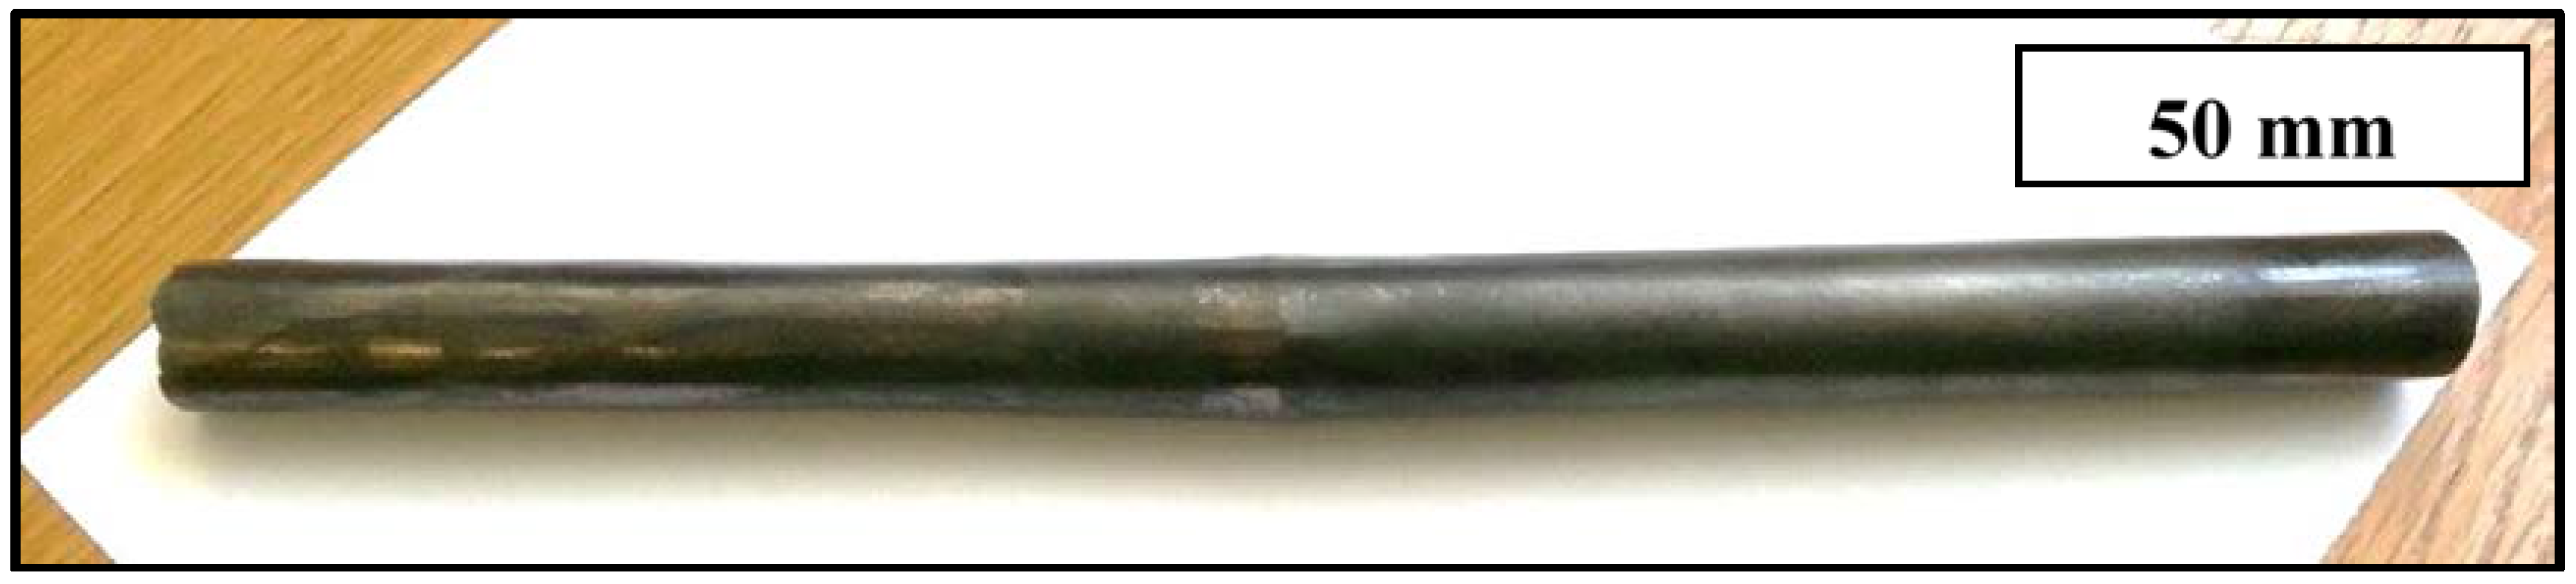
2.1. Alloy Preparation

Utilised for high pressure compressor and turbine discs, RR1000 offers good high temperature strength through an optimised microstructure containing coherent primary, secondary and tertiary γ’ precipitates within a disordered γ matrix. The size and form of these precipitates together with grain size are controlled via precise thermo-mechanical processing. The reader is directed to a previously published paper by Mitchell and co-workers describing the detailed microstructural evolution of this alloy together with implications for mechanical properties [4]. The nominal composition of RR1000 is provided in Table 1.
Six cylindrical bars of RR1000, approximately 300 mm length and original diameter 27 mm, were rotary swaged at room temperature aiming to achieve a final nominal diameter of 20.9 mm (i.e., 40% area reduction). The source of these bars was a proprietary disc forging of the “fine grained RR1000” variant.
The final diameter after swaging was measured at 20 mm intervals along the length of each bar (e.g., as shown in Figure 1), using calibrated vernier callipers. All diameter measurements are plotted in Figure 2. The measured bar diameters were used to determine the local area reduction and the predicted cold work achieved, Figure 3.
Swaged bar diameters ranged between 21.4 mm and 23.1 mm, which constituted an area reduction of 26.6% to 37.9%. The mean cold work was 31.3%, slightly lower than originally desired but a reflection of the considerable room temperature strength of the alloy.

2.2. Metallography

A series of metallographic based inspection techniques were applied to the pre and post swaged material to characterise the microstructure in various orientations. Figure 4 shows the axis labelling system employed to describe the results of X-ray diffraction (XRD) and EBSD studies.
Grain size analysis was performed before and after swaging in the radial (X and Y) and axial (Z) directions. Standard metallographic sections were prepared, including final polishing with colloidal silica media. Images of the grain structure were captured by a Field Emission Gun Scanning Electron Microscope (FEG-SEM, FEI, Eindhoven, The Netherlands). The average and Feret diameter (i.e., the greatest distance between any two points on a grain boundary) was measured using ImageJ software (1.4.0., National Institutes of Health, New York, NY, USA). The ratio between the Feret and average grain size was used to indicate the typical grain form. Average grain sizes were also converted to ASTM classifications. Grain size data are presented in Table 2.
Typical examples of the pre and post swaged microstructures viewed on the radial X-Y plane are illustrated in Figure 5a,b, respectively. All images relate to areas near the central axis of the bars.
The grain size prior to swaging was within proprietary specifications for the fine grained (FG) variant of RR1000 and the grain morphology was close to equiaxed. However, the swaging process has reduced the average grain size from 8 μm to 6 μm in the radial direction, alongside an elongation to 9 μm in the axial sense. Each Feret diameter was plotted on a cumulative distribution function (CDF) graph to emphasise this effect, Figure 6.
As well as affecting grain size, the swaging process has imparted strain deformation within individual grains. This was most evident when viewed on the X-Y radial planes. Intersecting slip lines were visible within many grains (Figure 7a), with others indicating the presence of intra-granular twin boundaries (Figure 7b). For reference, similar deformation features were found in conventional shot peened RR1000 material but at a much lower severity than the swaged material and isolated to grains immediately adjacent to the surface (Figure 7c). When inspecting microstructures on the axial plane the elongated form of individual grains was evident, Figure 8.

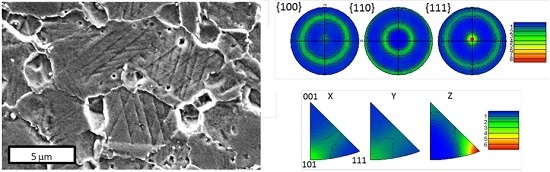
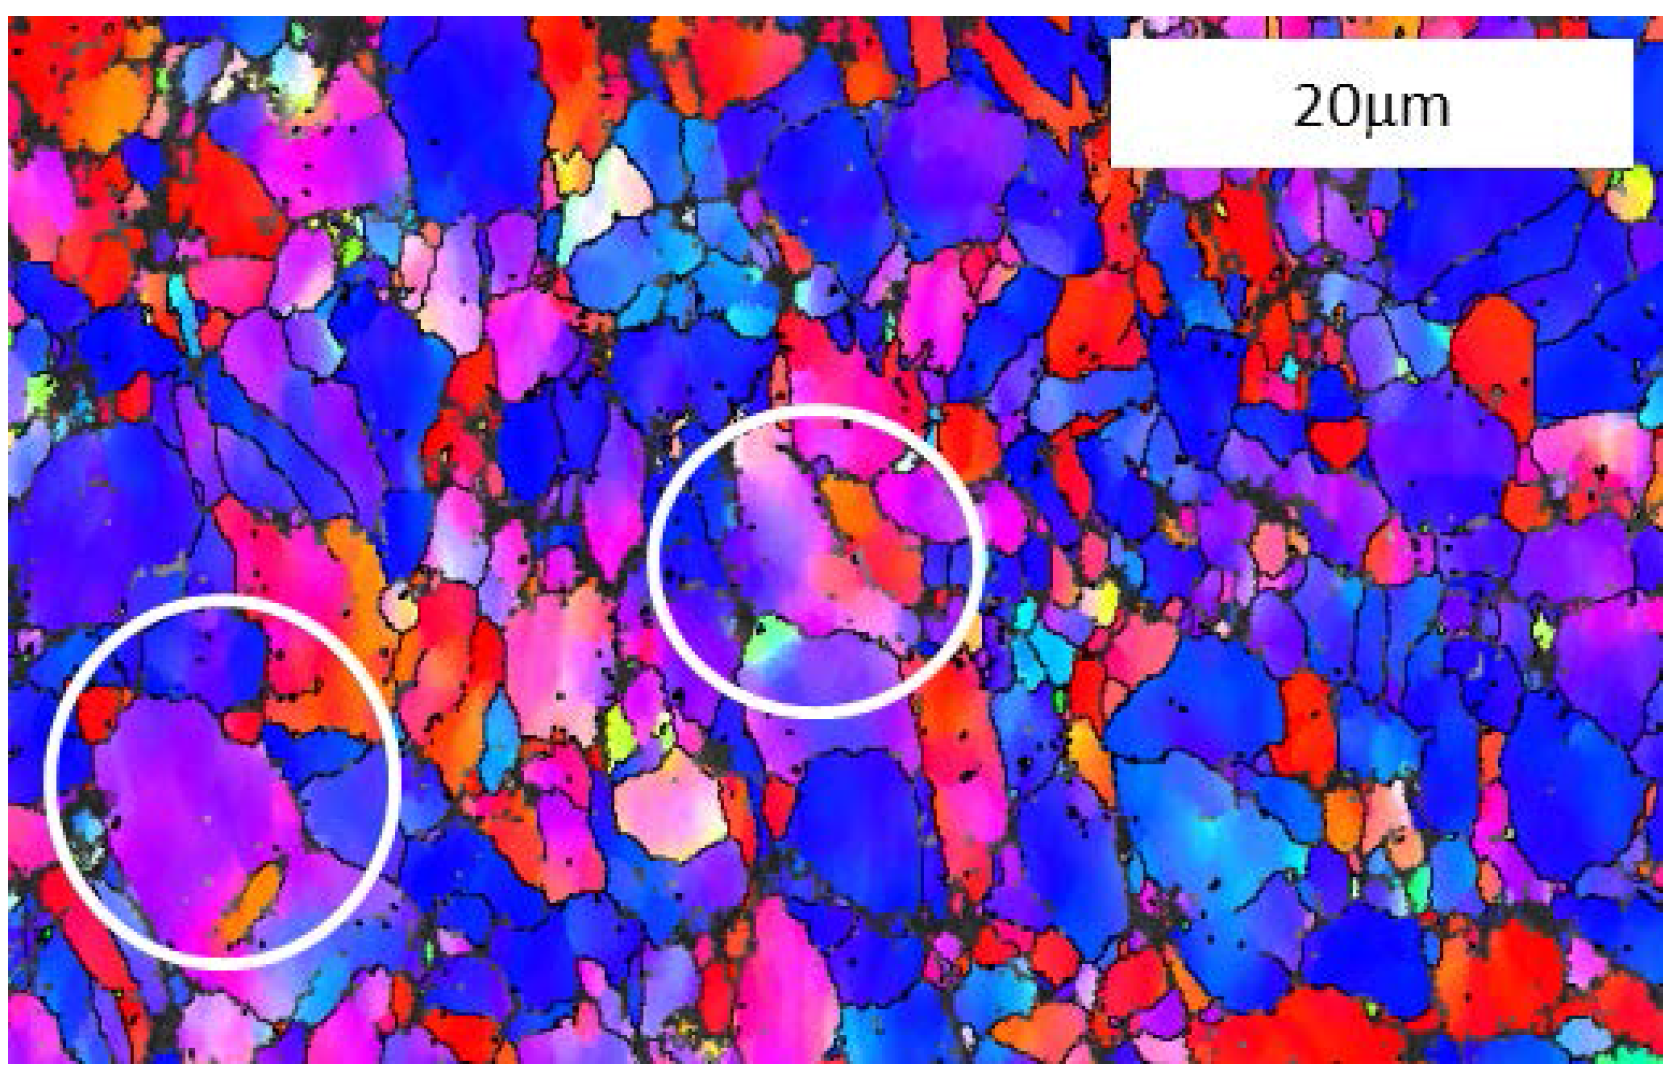
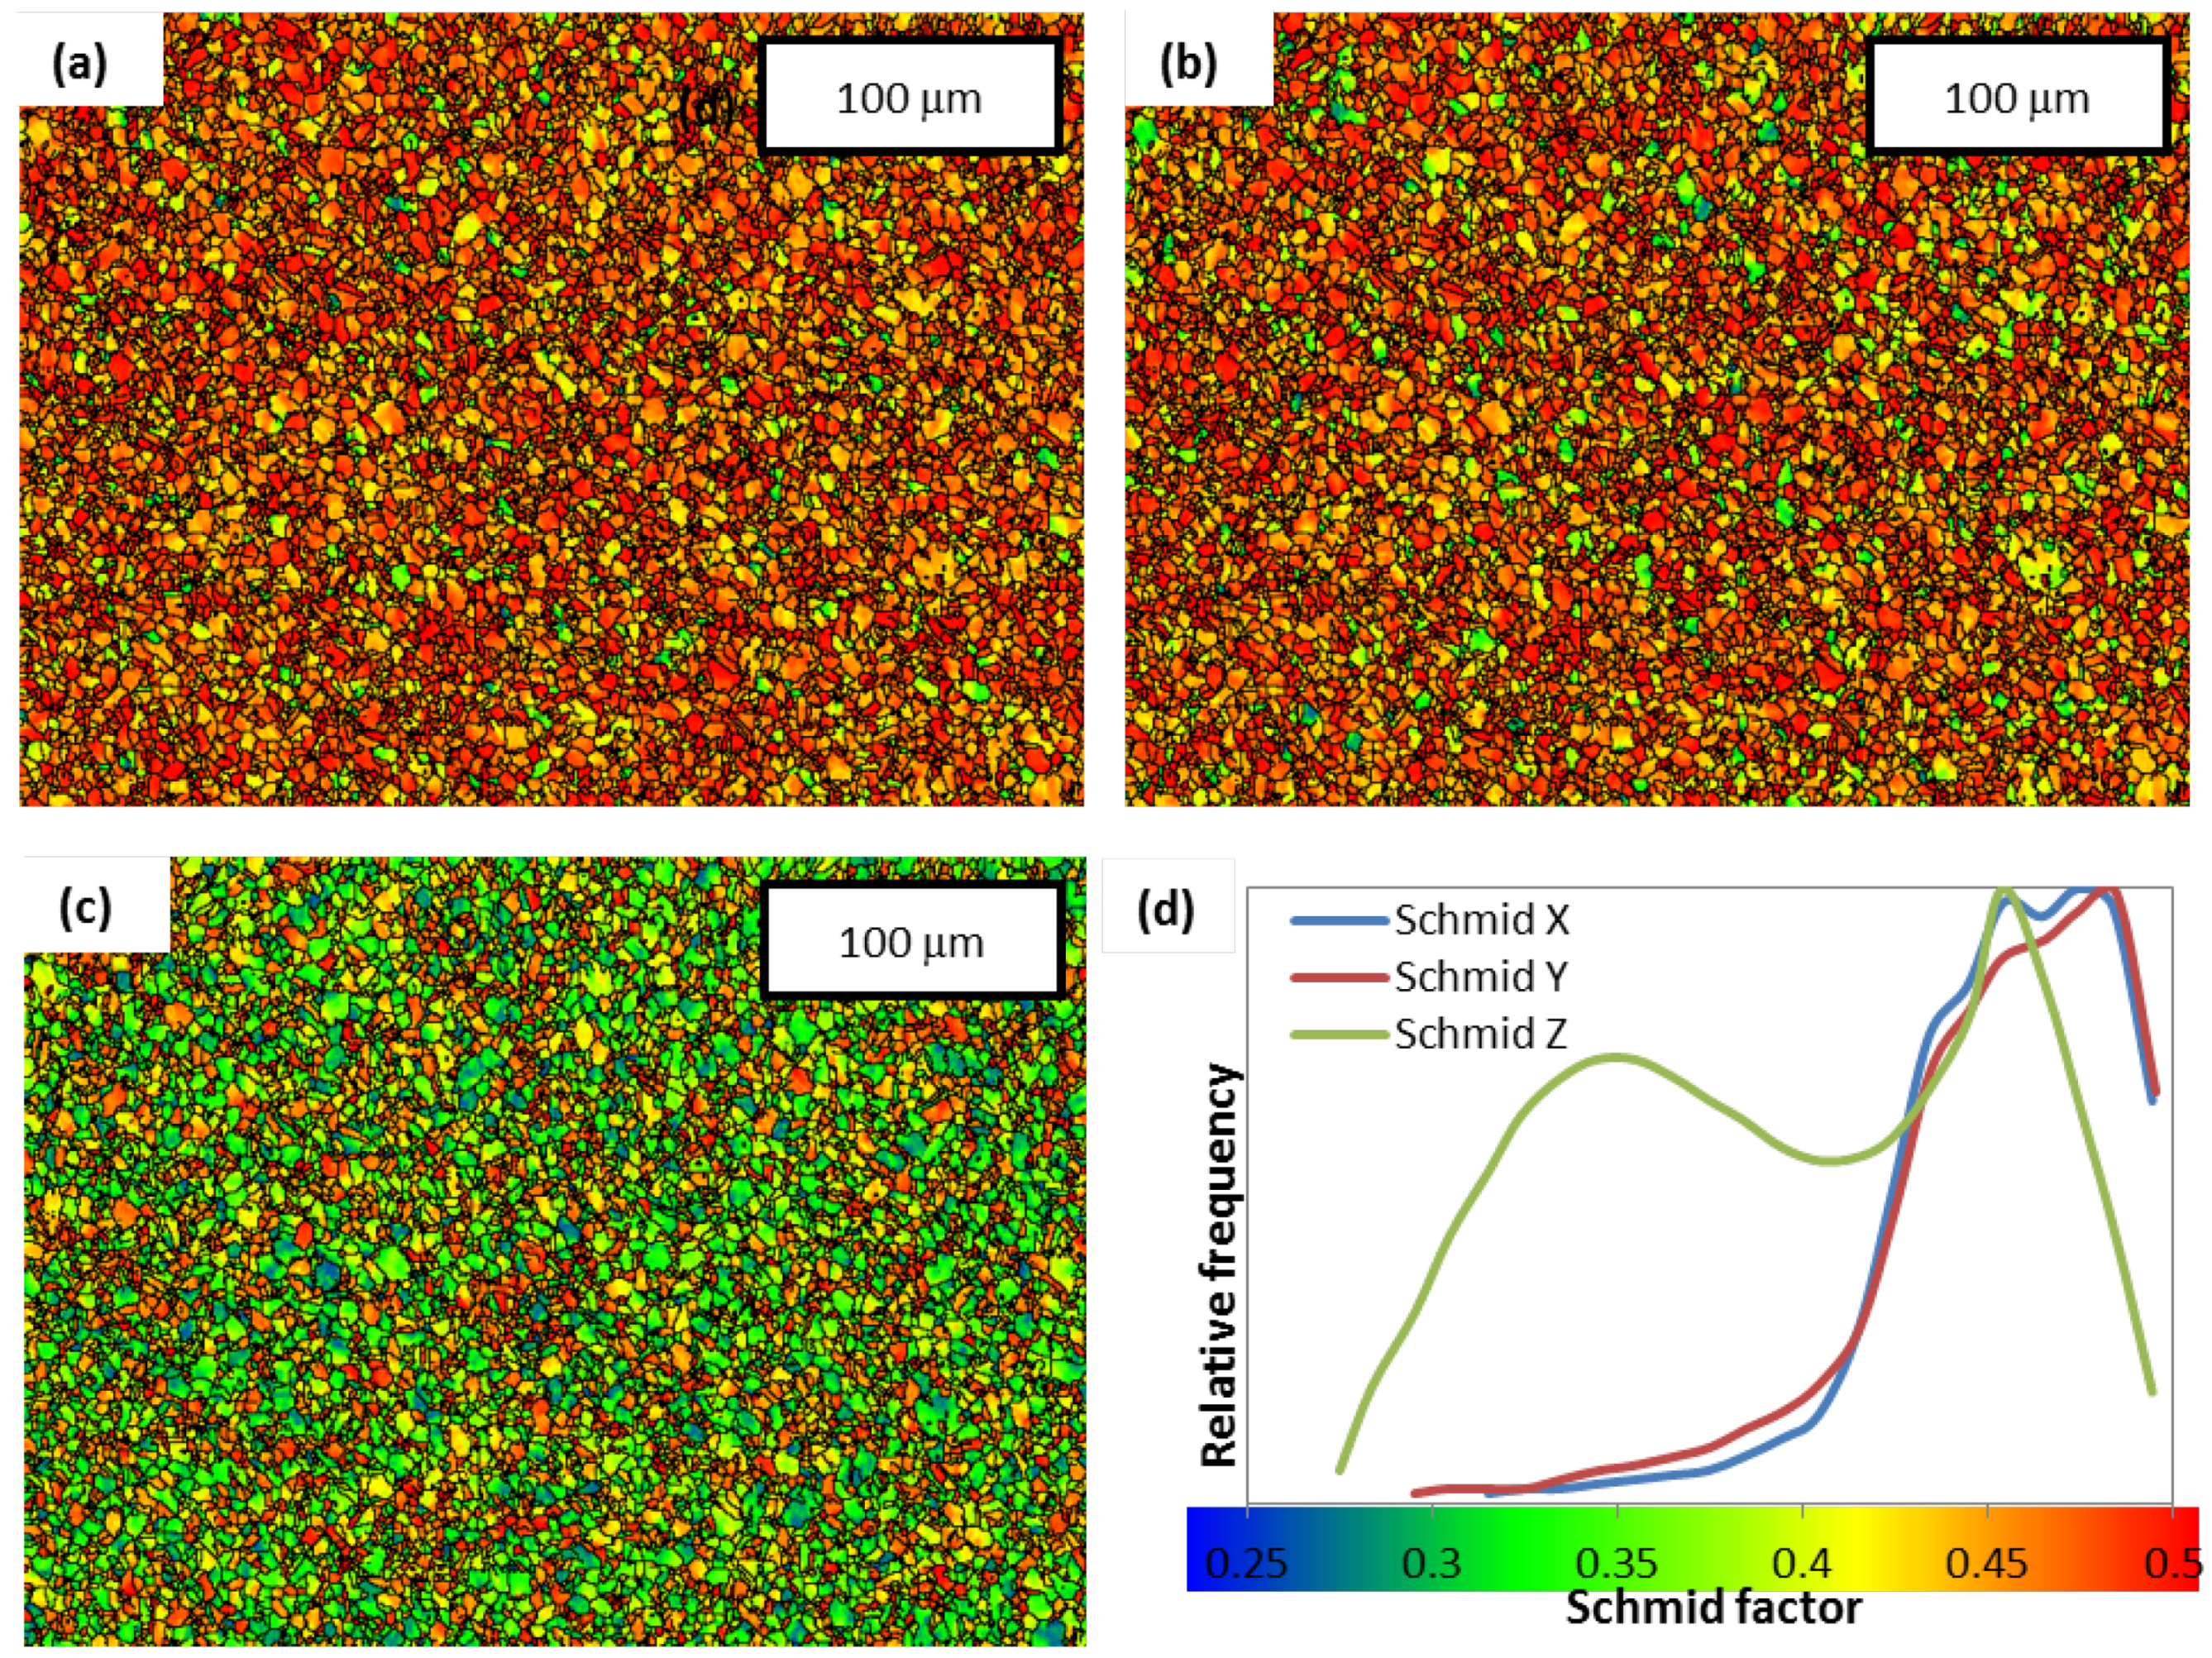
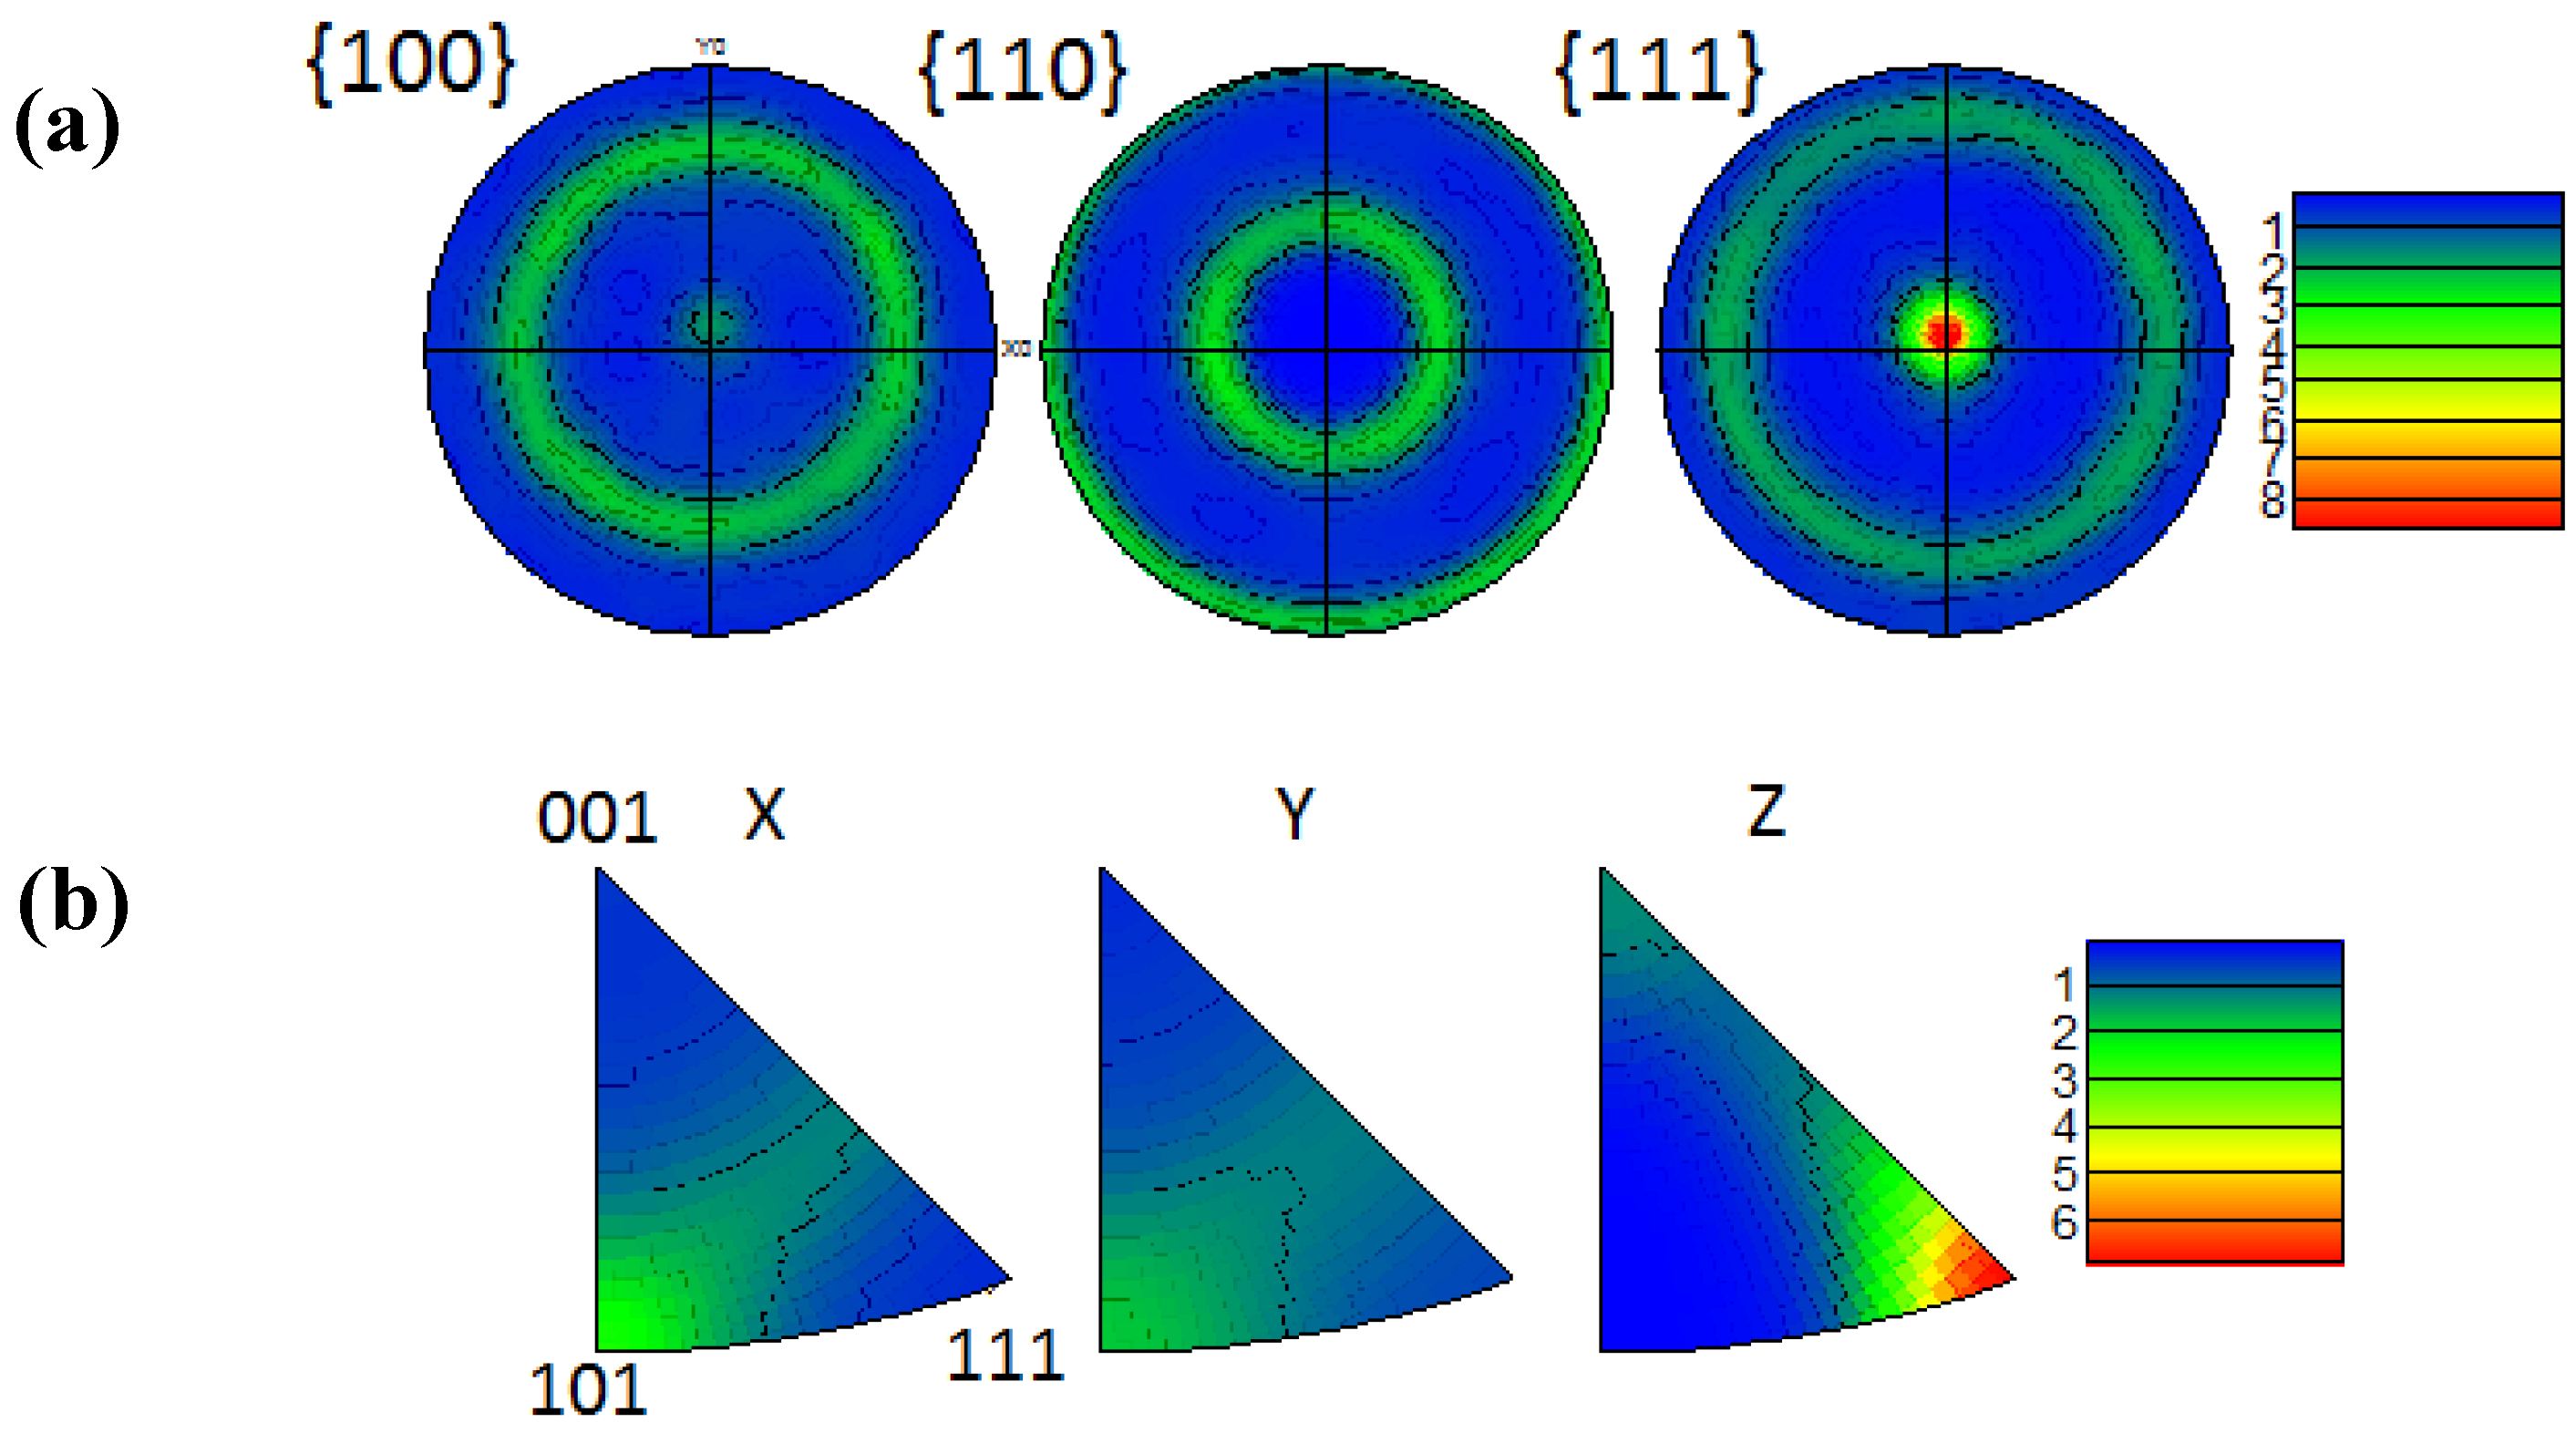
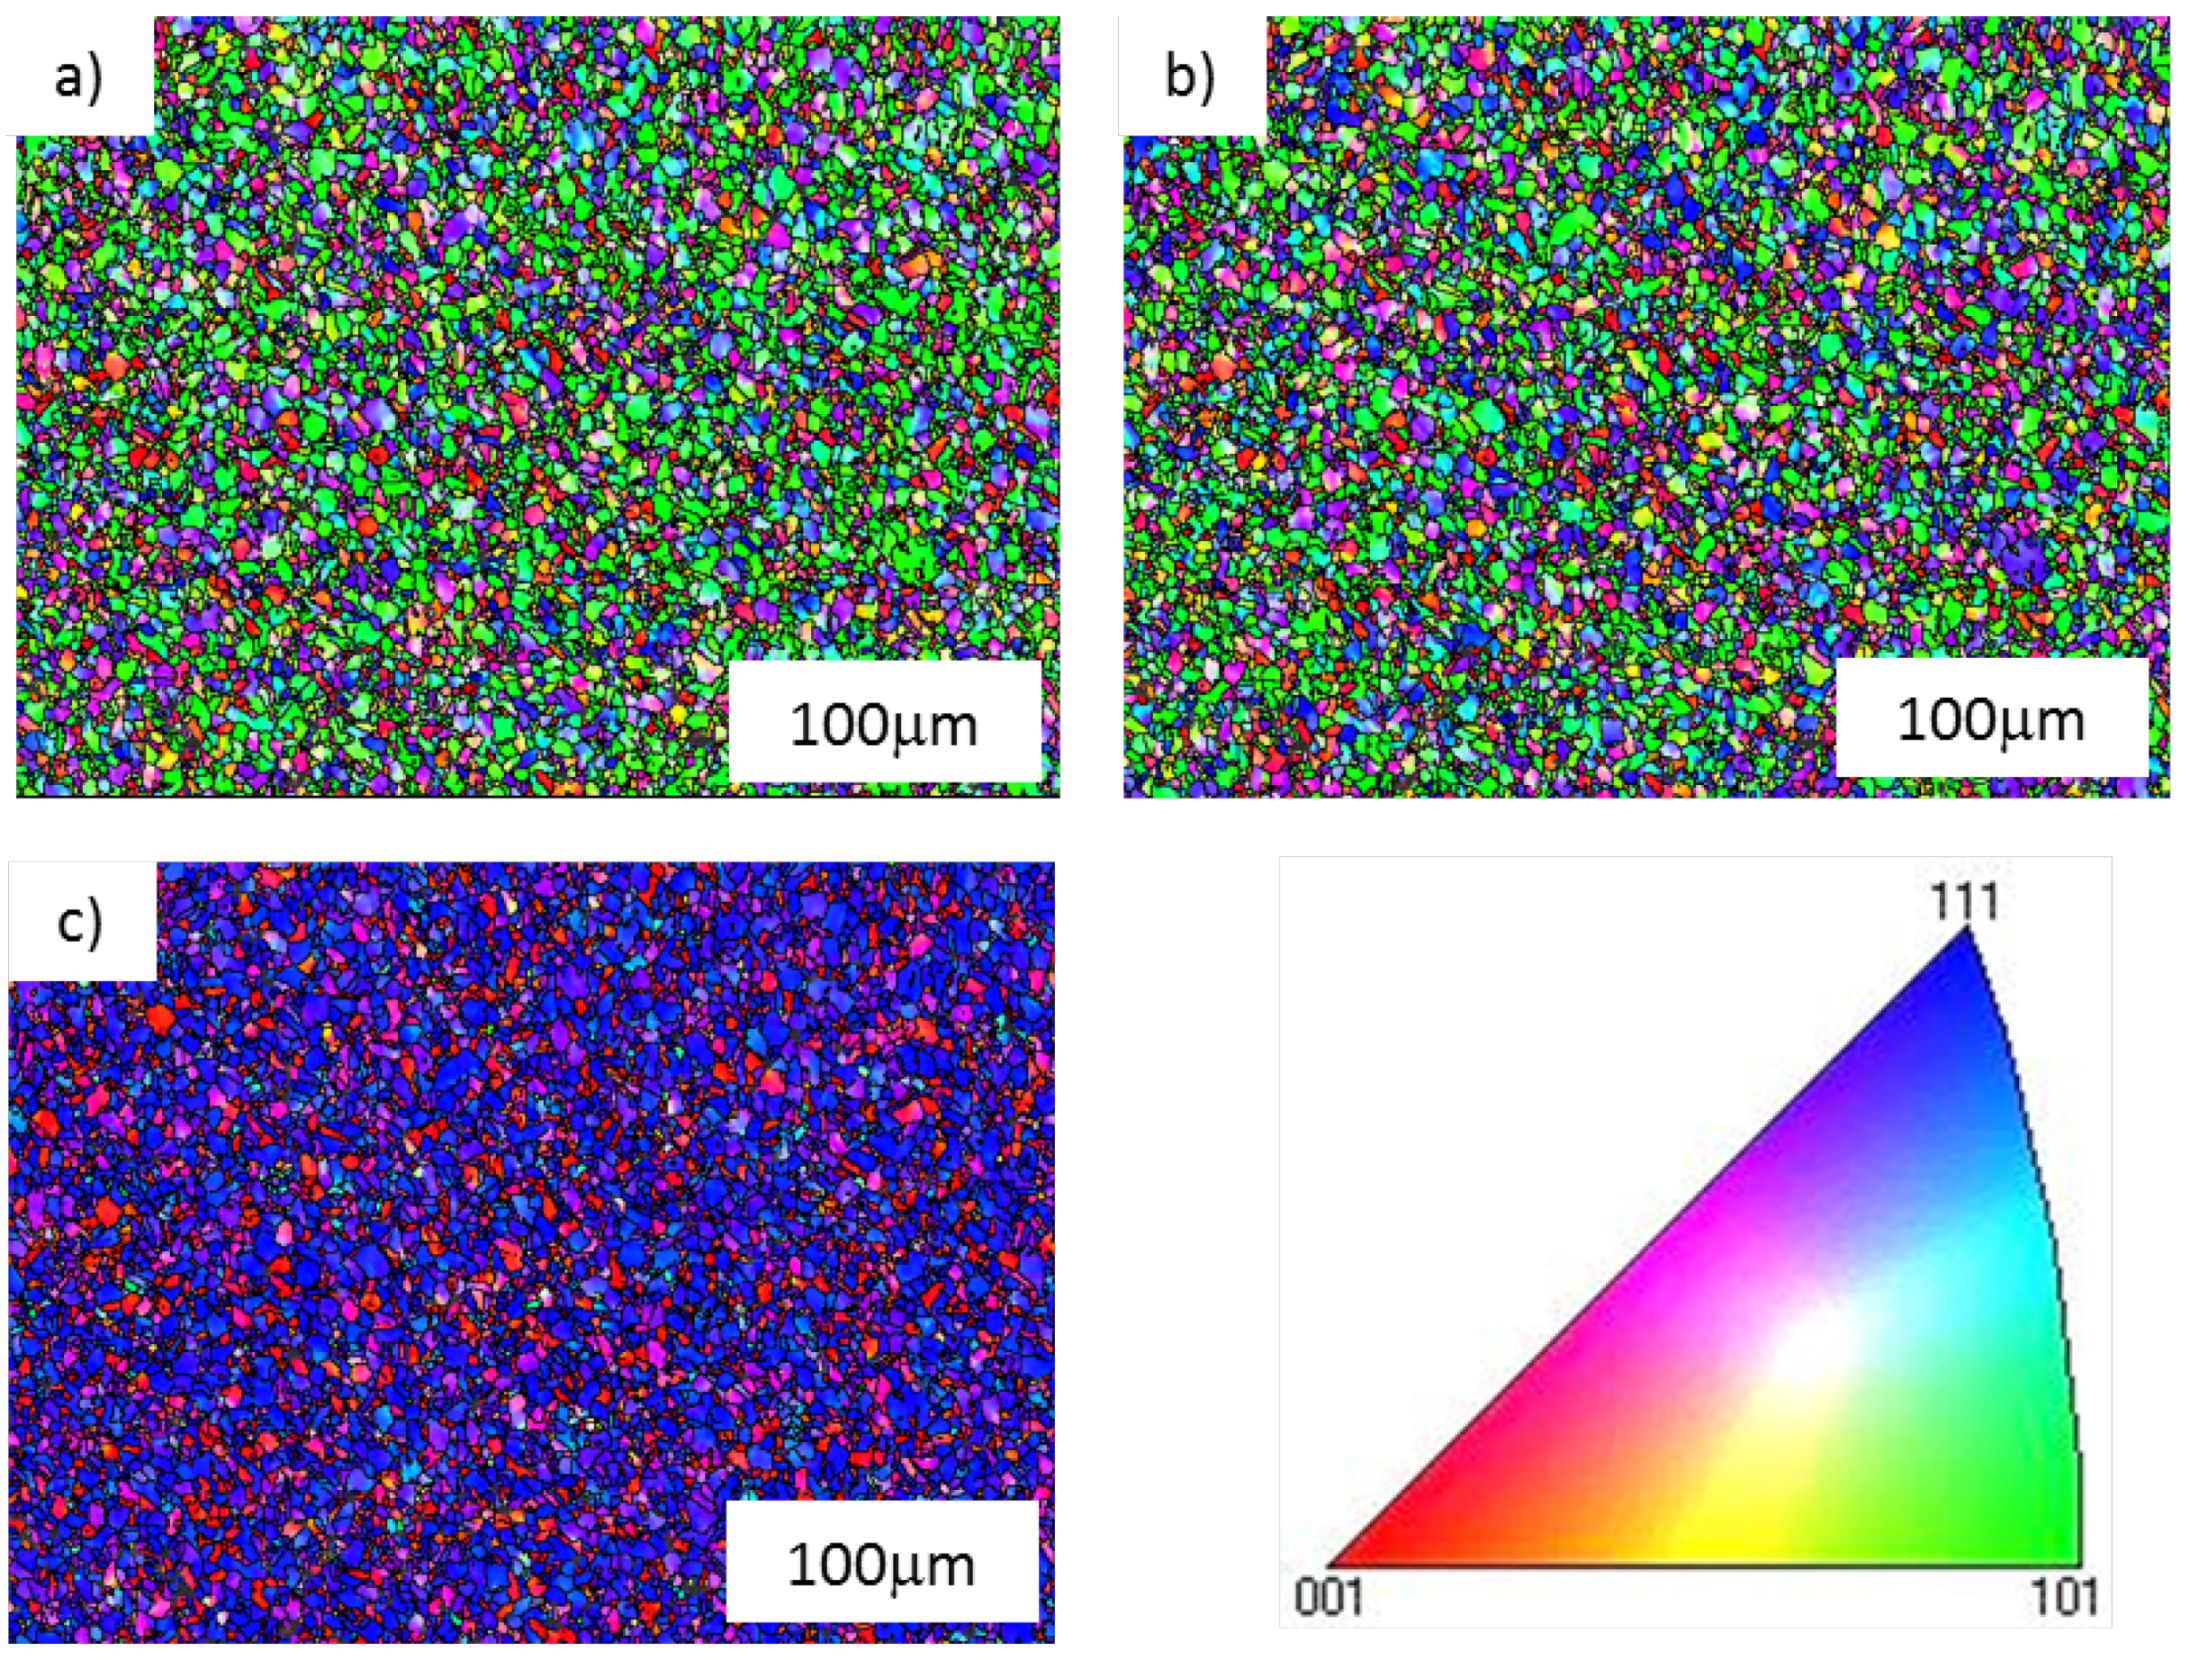
2.3. Micro-Texture Analysis

A radial section of swaged RR1000 was examined by electron backscatter diffraction (EBSD) to study grain orientation, the propensity for slip and localised misorientation. Samples were mounted in Bakelite and polished with 0.06 μm colloidal silica solution to produce the highly polished surface required for high quality EBSD mapping.
Low and high magnification EBSD maps were obtained. Pole and inverse pole figures at low magnification, shown in Figure 9, indicate considerable evidence of texture in the {111} direction parallel to the Z axis (axial direction). The high exposure densities (red regions) shown at the centre of the {111} pole figure (Figure 9a) and the {111} corner of Z inverse pole figure (Figure 9b), indicate a strong fibre-like texture.
The low magnification inverse pole figure (IPF) orientation maps, Figure 10a,b, re-emphasise the heterogeneous distribution of grains in the X and Y directions, as indicated by the random grain colours. The {111} texture parallel to the Z direction is then noted from the domination of blue coloured grains in the Figure 10c. It would appear that most of the {101} orientated grains parallel to the Z direction have been re-orientated towards the {111} orientation by the swaging operation, as indicated by the low number of green coloured grains in Figure 10c. High magnification images show evidence of the highly strained swaged microstructure as orientation varies within individual grains in Figure 11. Grains demonstrating this were often surrounded by smaller grains, most likely to be γ’ precipitates.
Schmid factor maps illustrated a majority of grains with a Schmid factor between 0.4 and 0.5 in the X and Y directions, as shown in Figure 12a,b. The {111} texture in the Z direction provided a significantly lower number of {111} planes favourably orientated at 45° to the Z direction in Figure 12c, therefore giving a reduced propensity for slip in the fibre texture direction (Z). The distribution in Schmid factors measured in the three directions is plotted in Figure 12d.

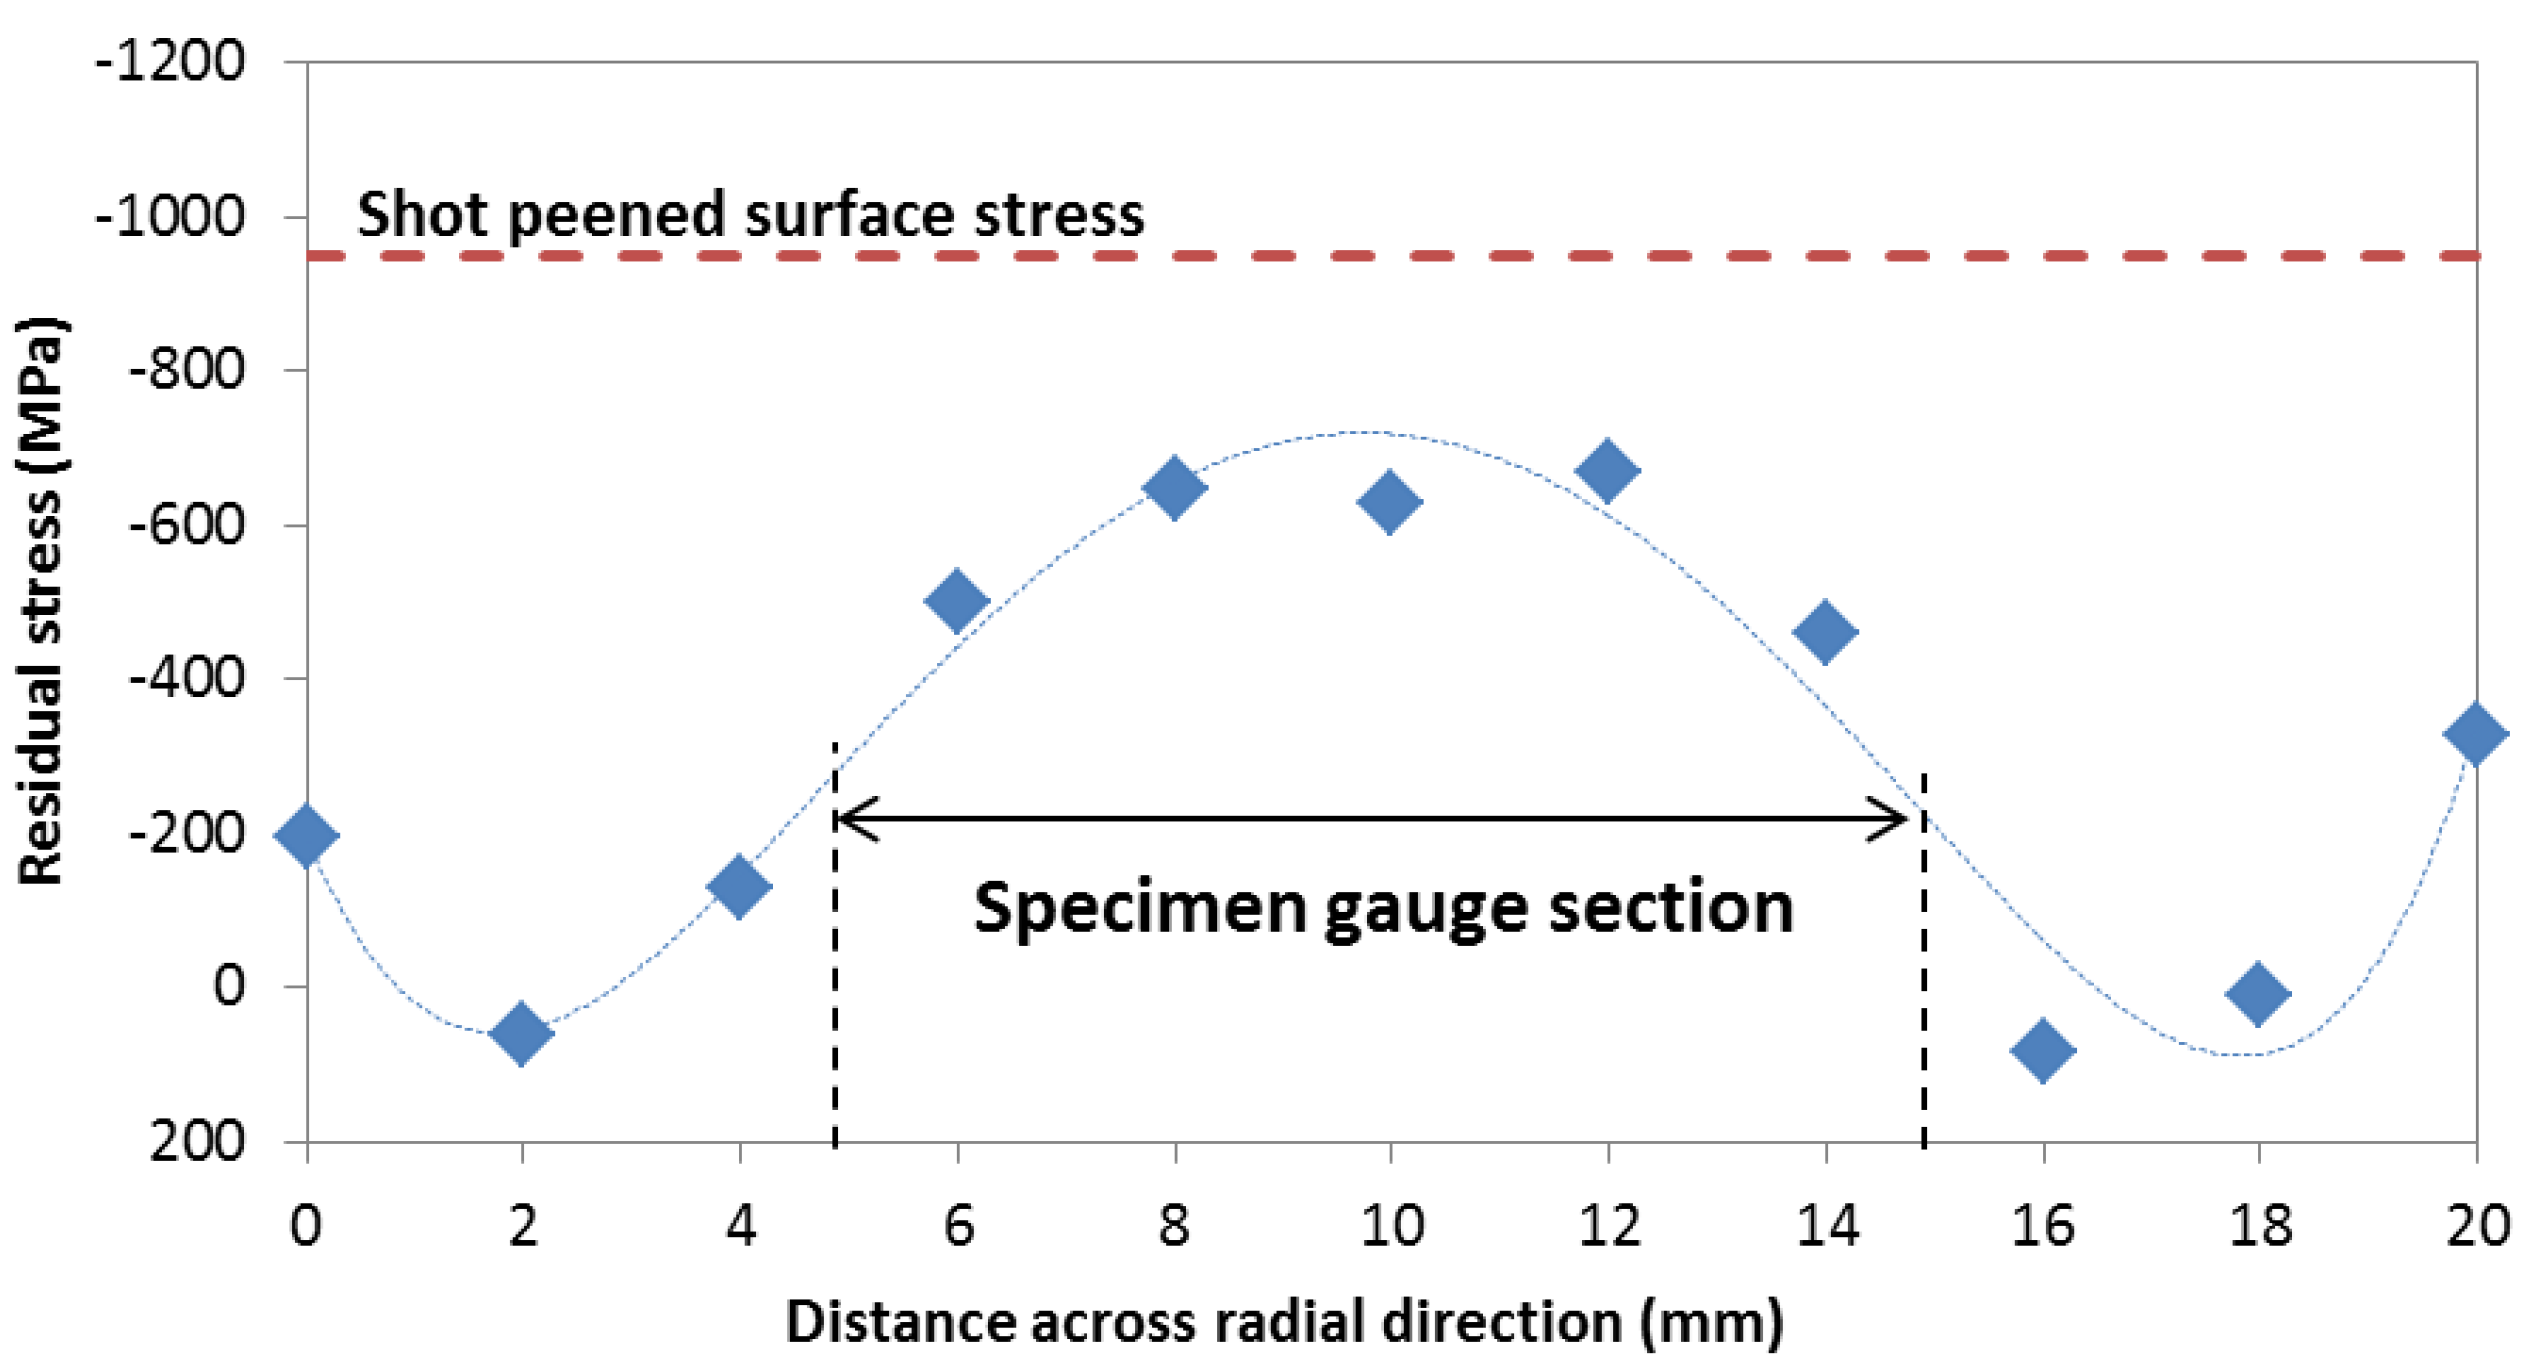
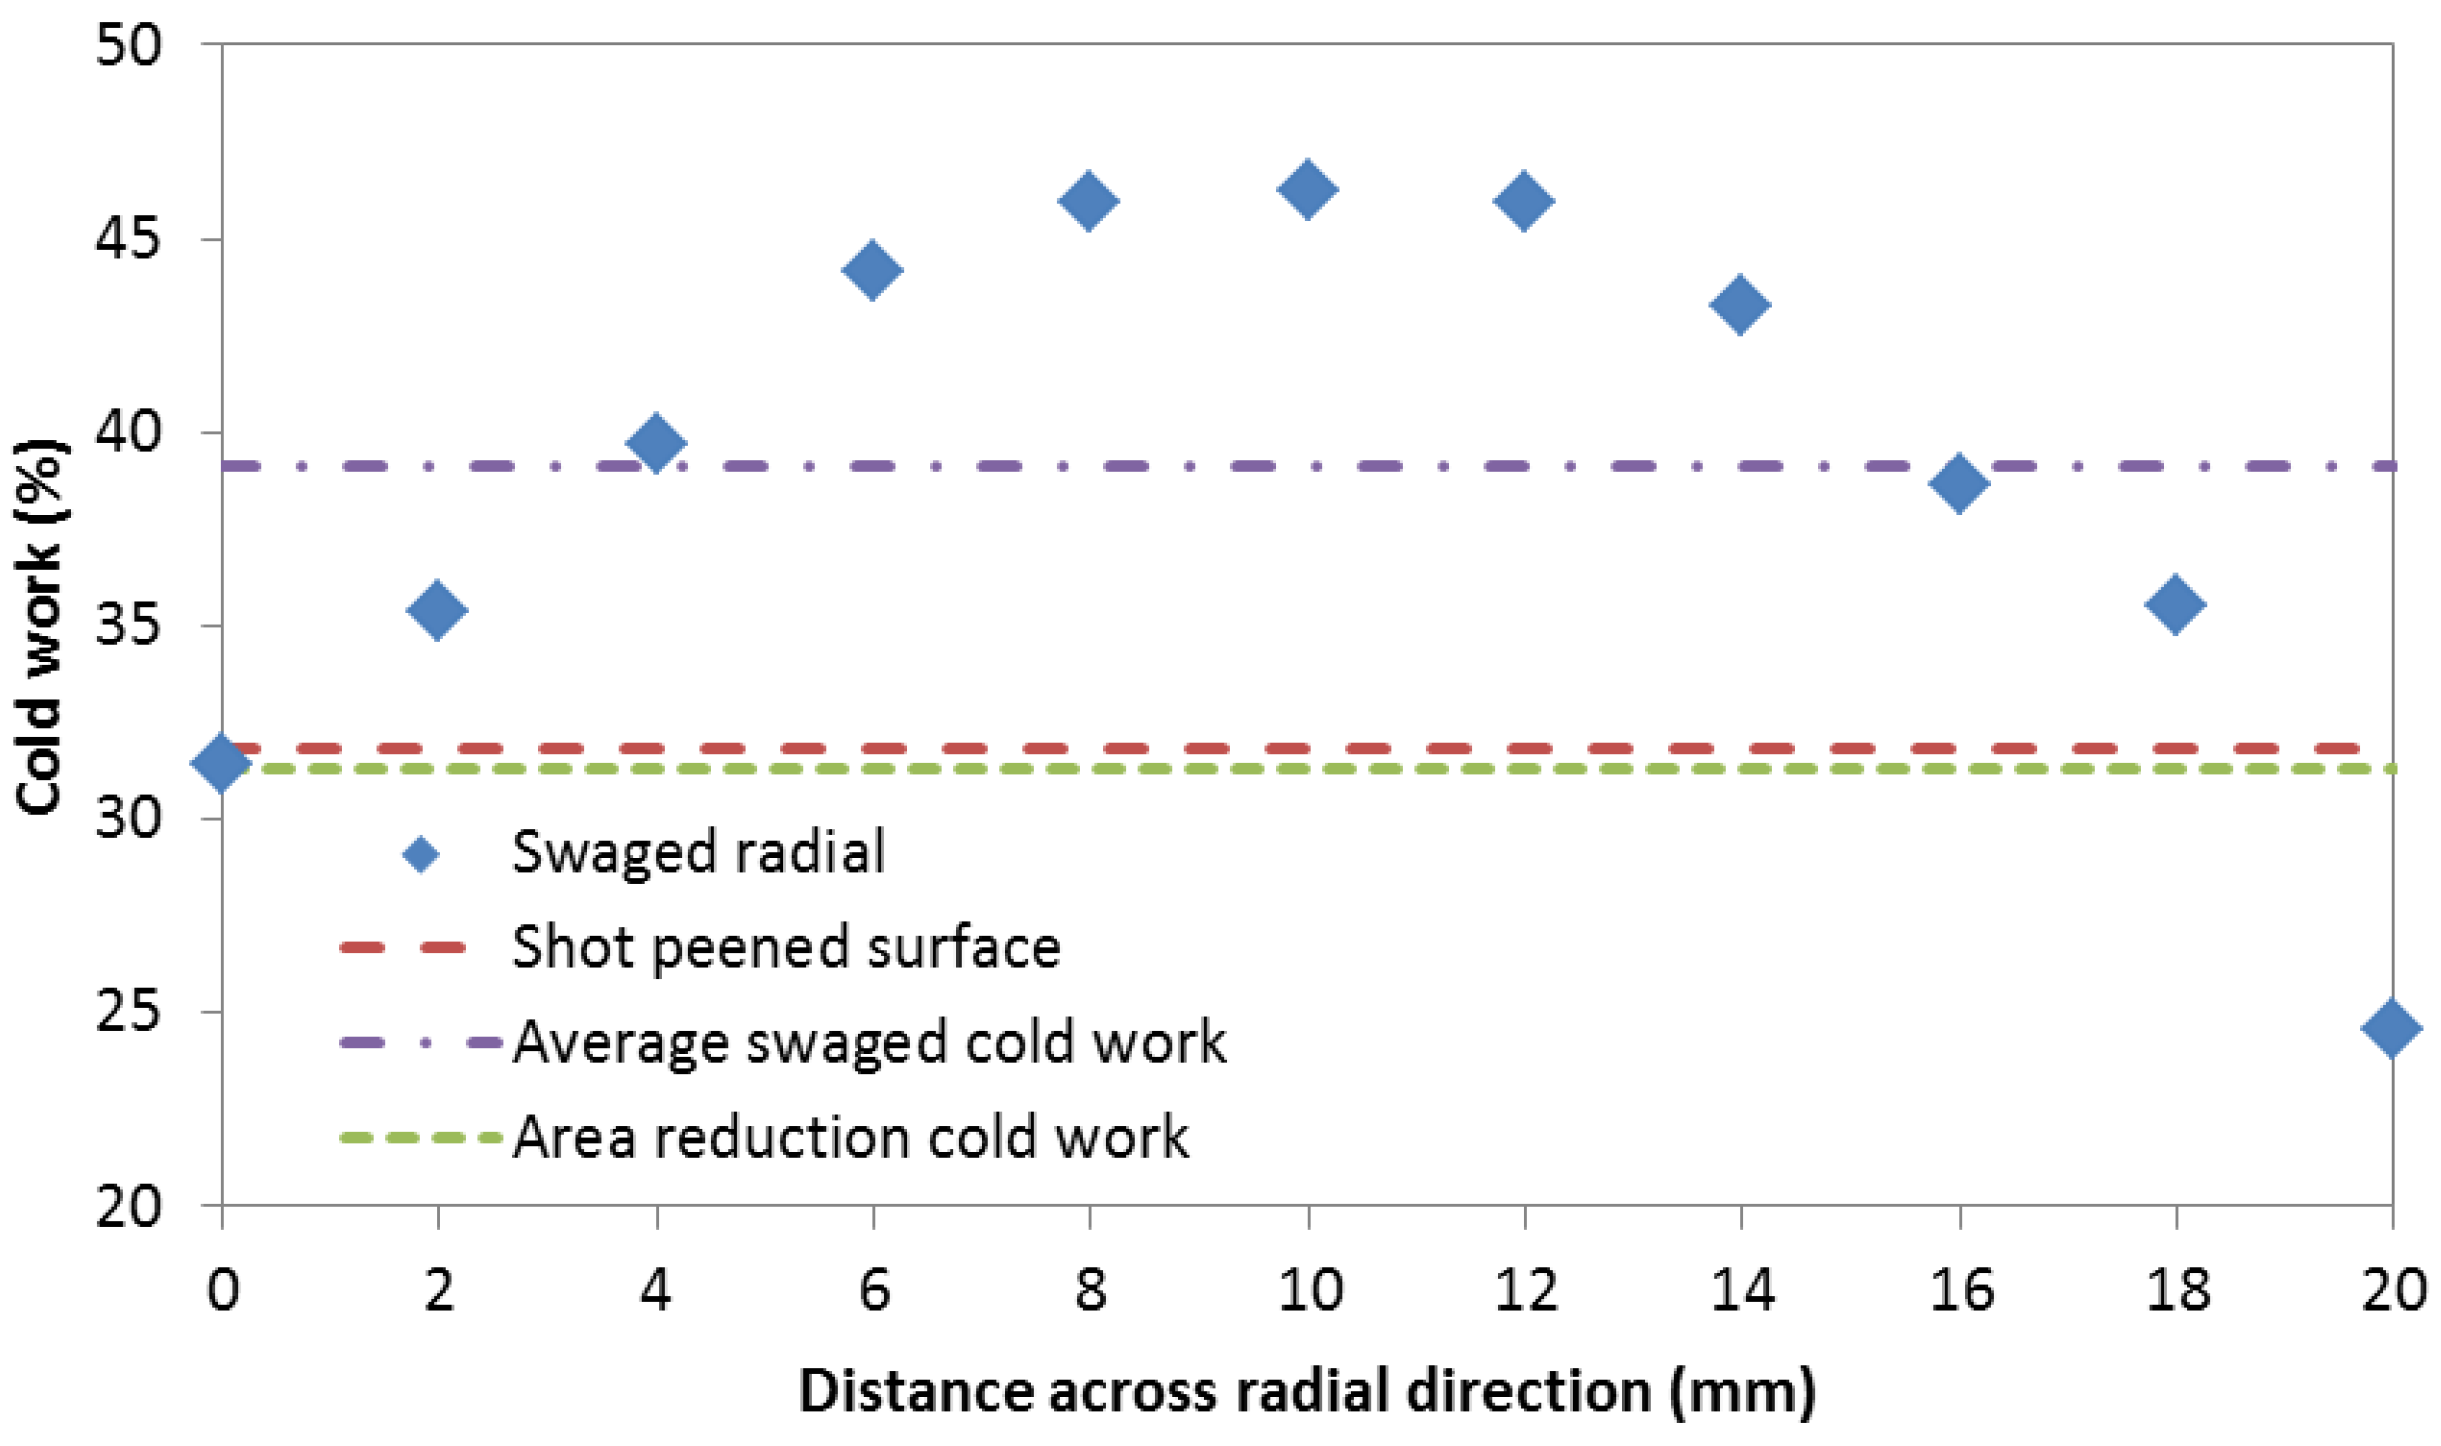
2.4. Residual Stress Measurements

Axial residual stress and cold work measurements were obtained at 2 mm intervals across the radial surface by XRD. A large collimator (2 mm) was used with a high number of exposures (20) and long exposure time (5 s) to increase the amount of analysed material and enhance the accuracy of XRD results. The cold work was predicted from the measured full width half maximum (FWHM) diffraction data using the following equation [4].
Cold work = 9.9296 × FWHM − 22.6
Axial residual stresses in the swaged material were relatively symmetrical across the radial surface, with a minimum stress around −667 MPa near the centre of the bar and tensile stresses of +85 MPa approximately 2 mm to 4 mm inboard of the bar surface, Figure 13. The typical level of compressive residual stress due to shot peening is indicated for comparison. Compressive residual stresses ranged between −459 MPa and −667 MPa in the central 10 mm diameter core of the bar. For later reference, this was the region sampled by the gauge section of the specimens extracted for subsequent mechanical testing.
The swaged cold work was predicted from the FWHM measurements and plotted in Figure 14, along with the average shot peened surface cold work and the average cold work predicted from the area reduction achieved by swaging.

3. Mechanical Properties
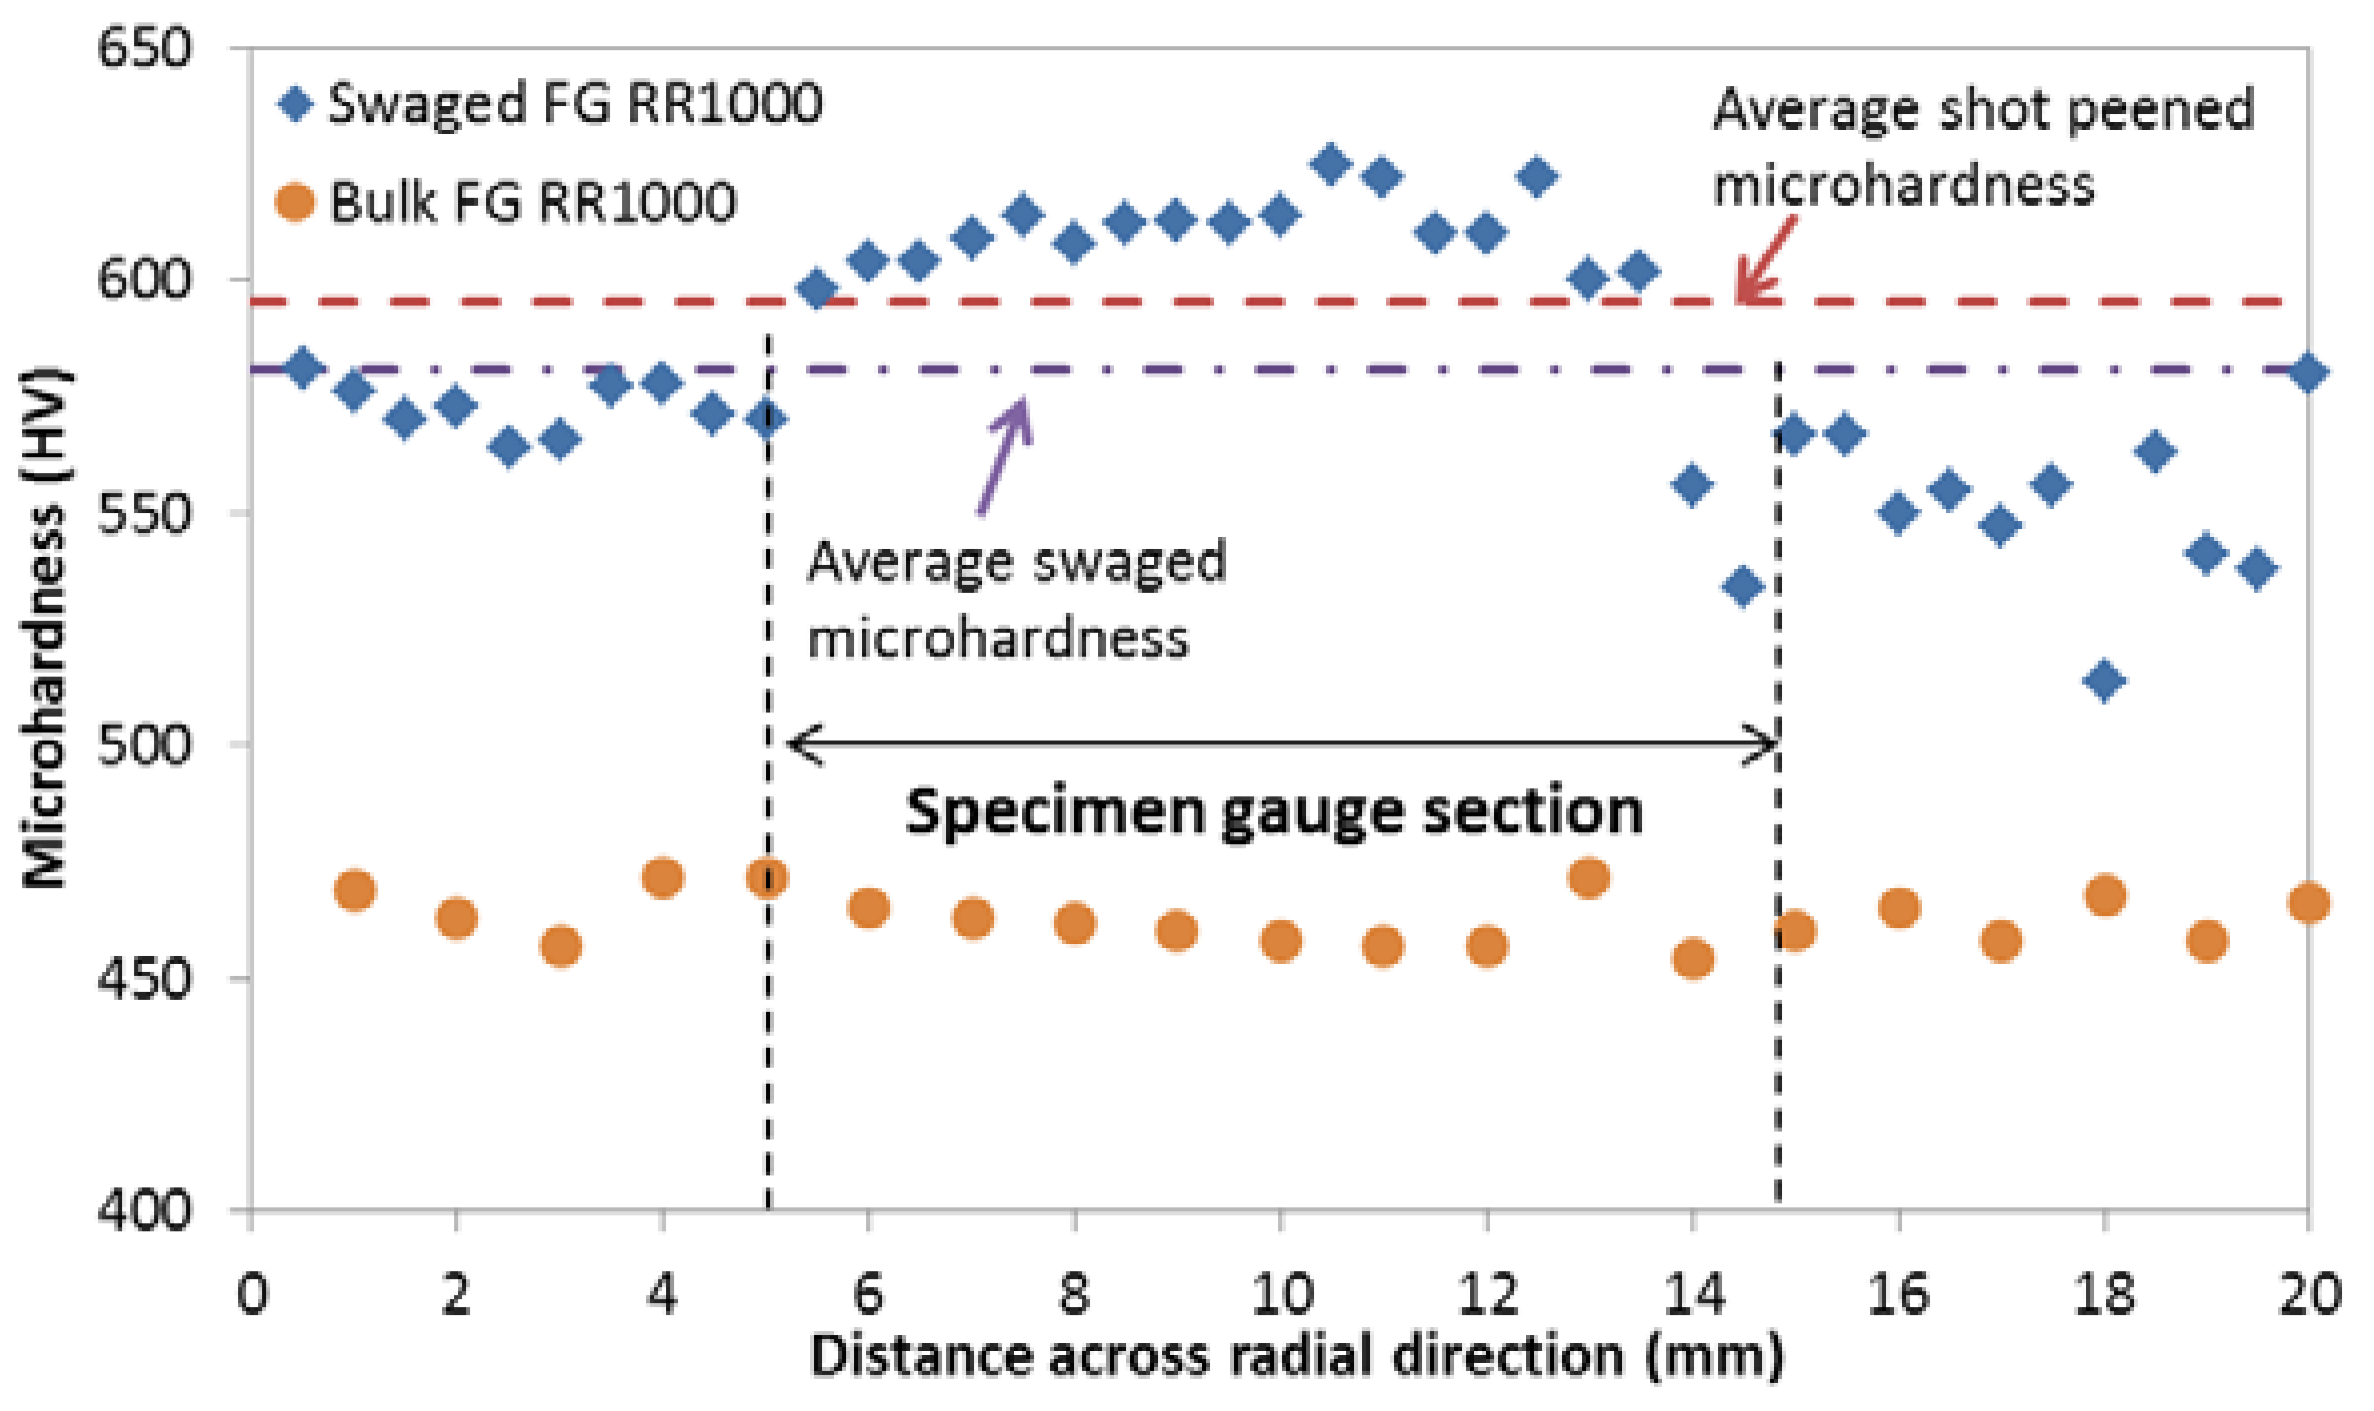
3.1. Micro-Hardness

Vickers micro-hardness measurements of the alloy were performed before and after swaging on a radial section of material with a 1 kg load. Hardness indentations were produced at 0.5 mm intervals across the centre line of the swaged radial section and at 1 mm intervals across a sample taken prior to swaging. The measured micro-hardness values (HV) are shown in Figure 15.
The trend in the micro-hardness data for the swaged bar was similar to that illustrated by the residual stress and cold work measurements, whereby peak micro-hardness levels (625 HV) were found near the bar centre and regions of considerably lower hardness were noted between 2 mm and 4 mm from the bar surface. Average micro-hardness measurements performed prior to swaging (463 HV) and after swaging (581 HV) showed a 26% increase in hardness of the swaged material.

3.2. Monotonic Tension
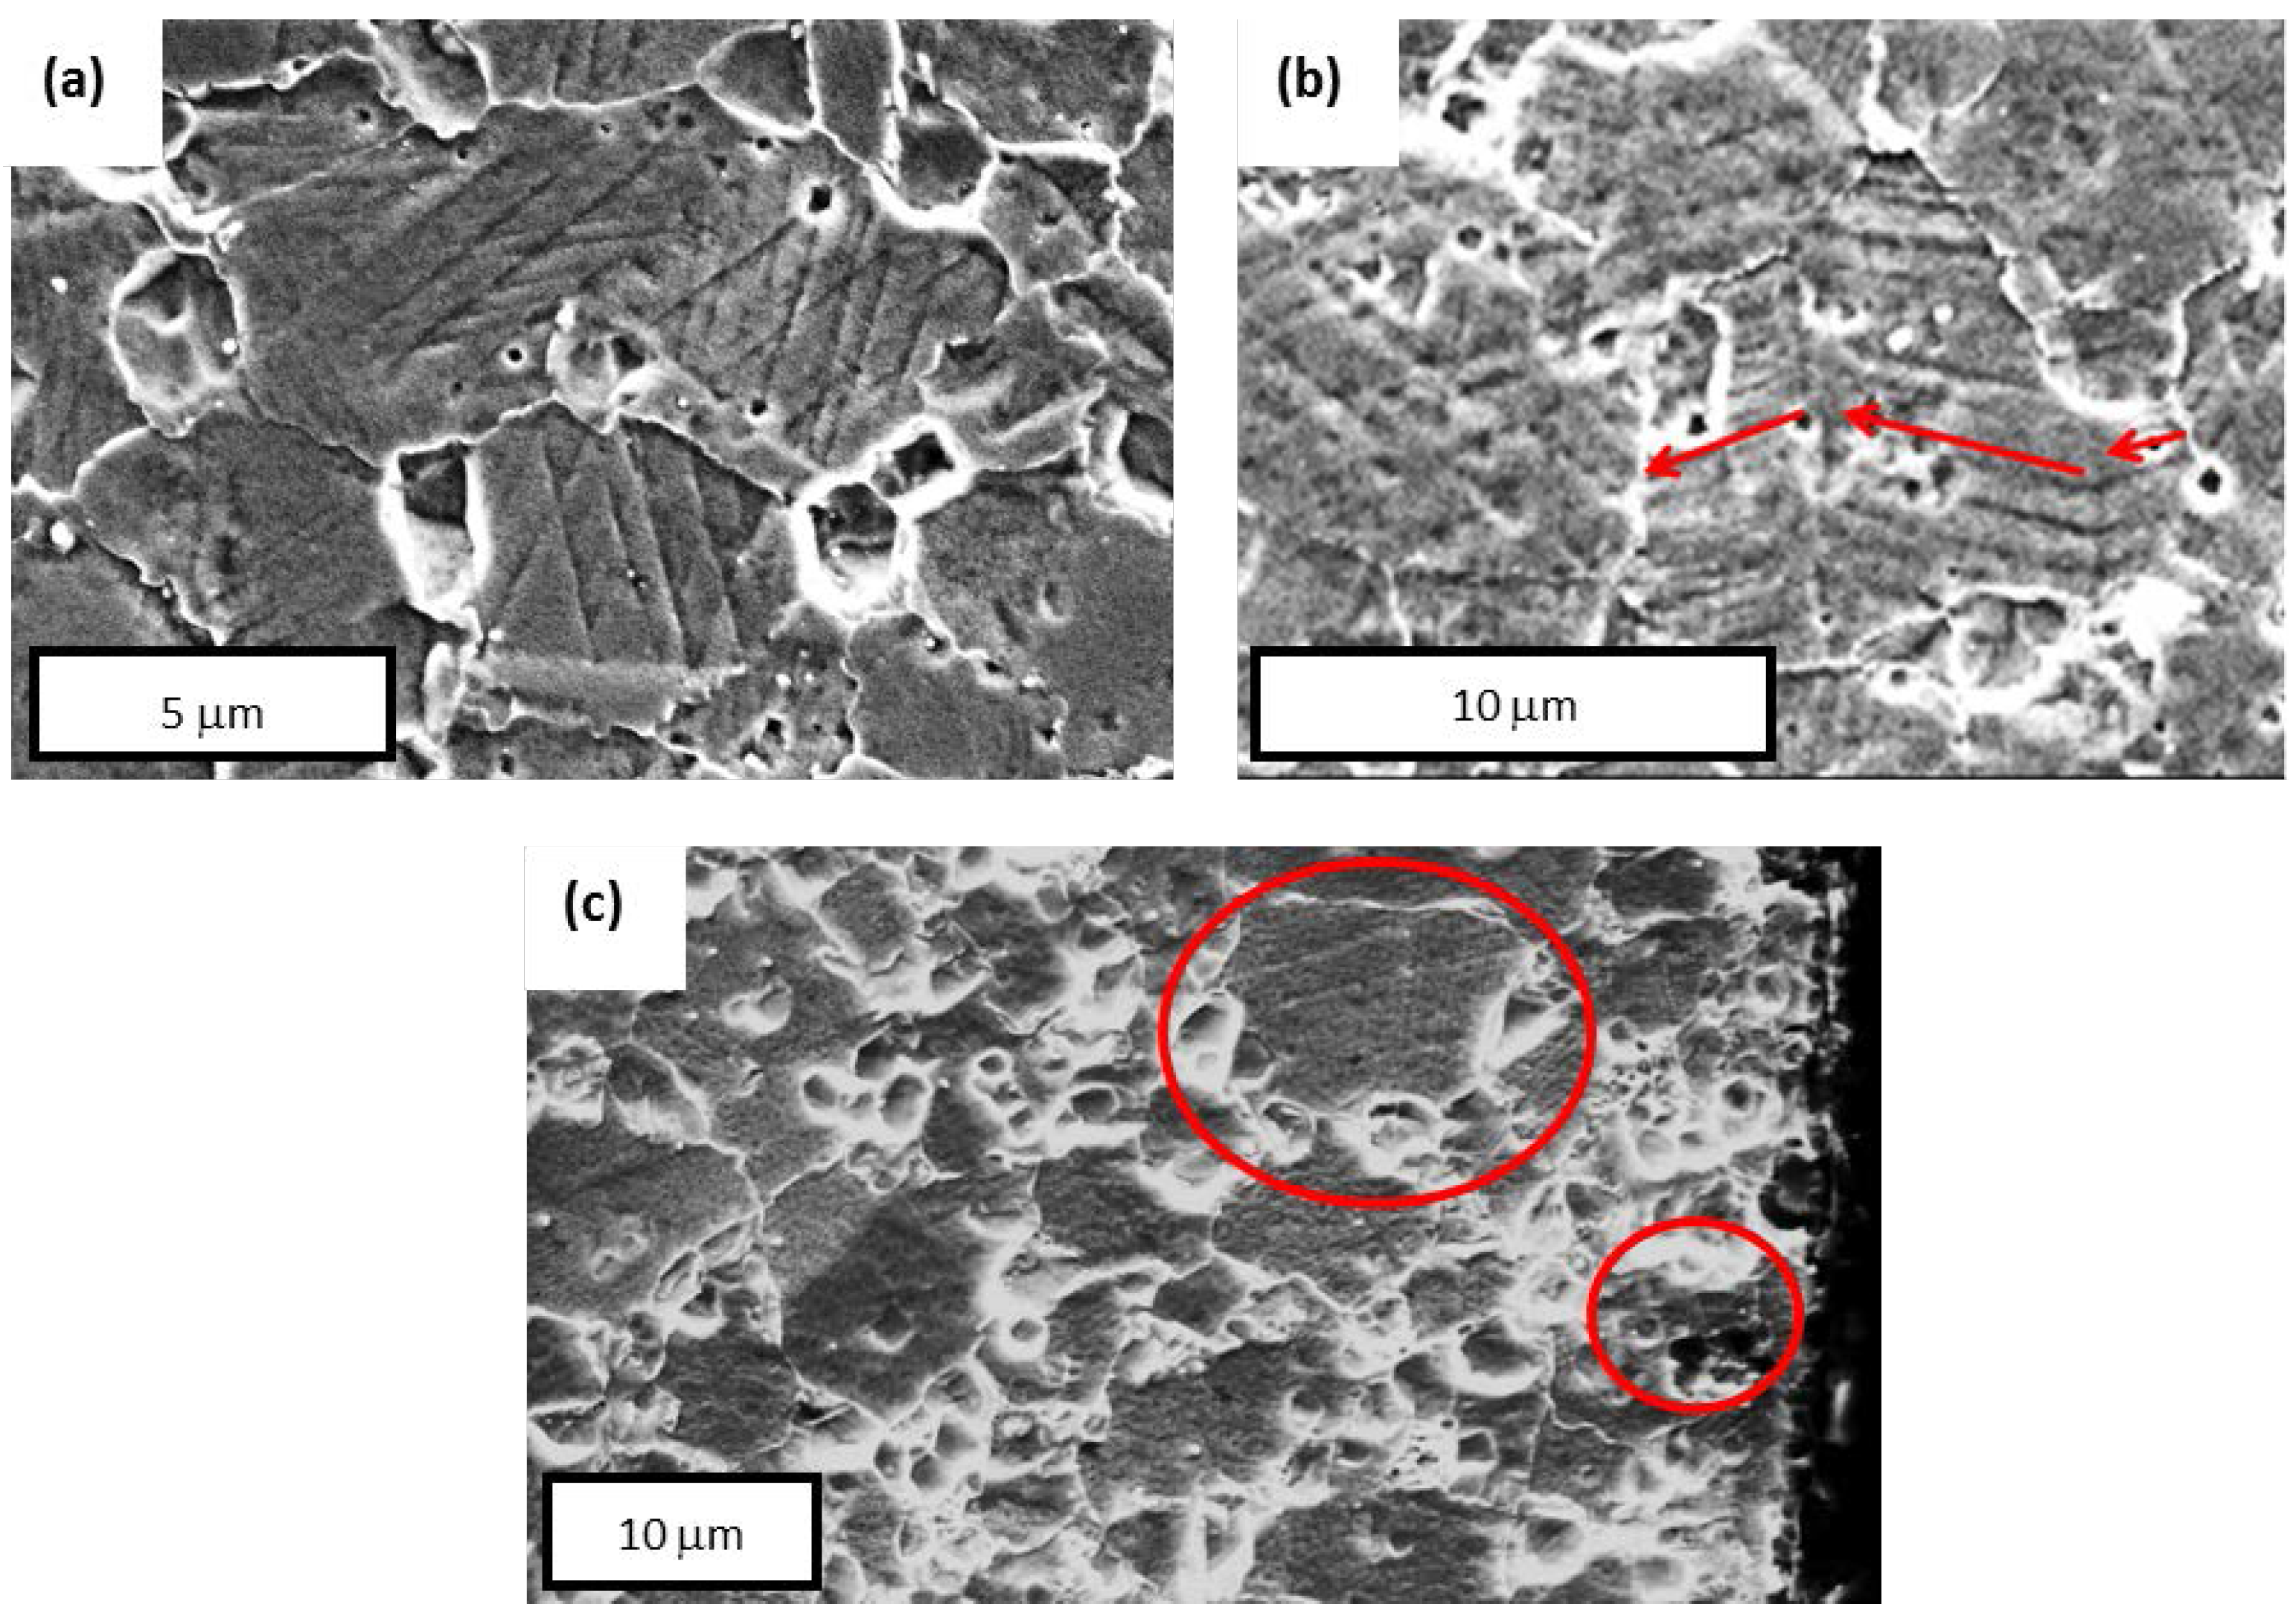
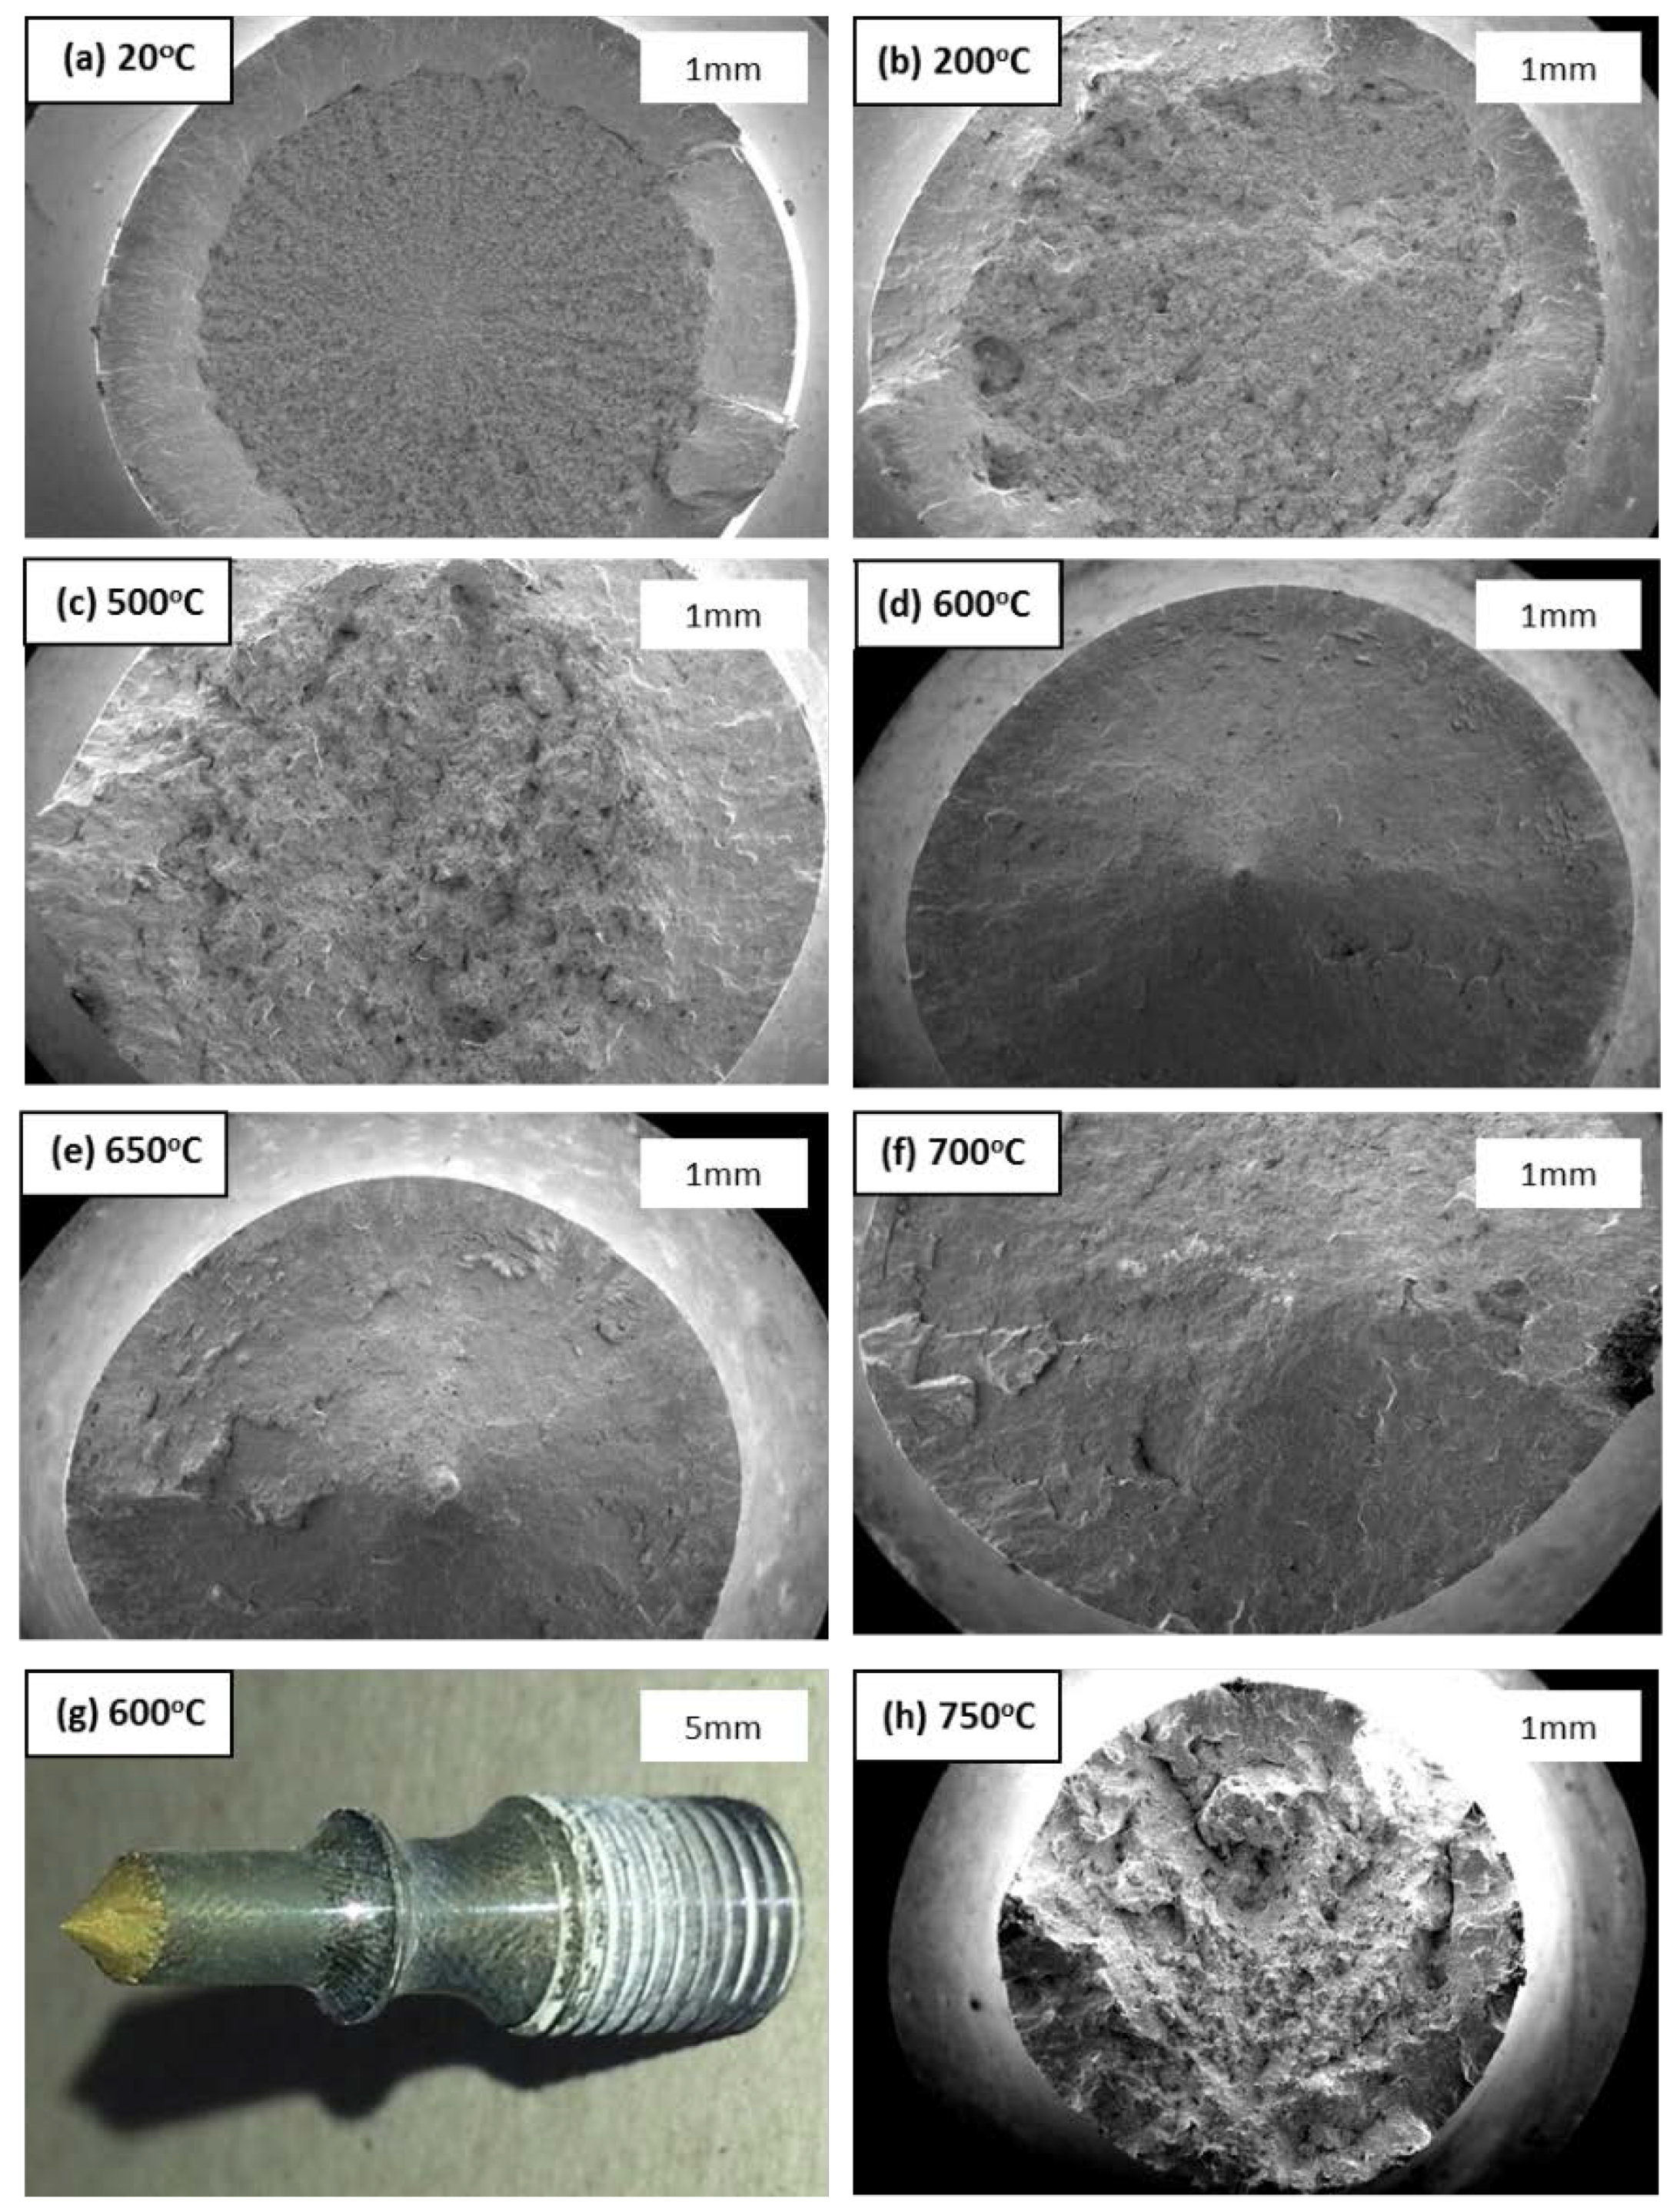
Plain cylindrical test specimens, Figure 16, were machined from swaged bars, with their central axis coincident with the bar centre line. The gauge diameter was 10 mm. Swaged test pieces were subjected to the same surface finish as pre-swaged test pieces (i.e., Ra < 0.25 μm achieved via longitudinal polishing).
Tensile tests were performed on swaged RR1000 at various temperatures between 20 °C and 750 °C, Figure 17. The high levels of cold work within the swaged material significantly increased the UTS and 0.2% yield strength compared to the conventional variant of RR1000 (UTS is typically between 1120 and 1620 MPa for a similar temperature range). However, this was matched by relatively low ductility. The swaged alloy demonstrated minimal work hardening beyond yield. There are two distinct types of behaviour separated by temperature regimes. At relatively low temperatures (20–500 °C) ductility was inversely proportional to temperature, but under higher temperatures (600–750 °C) ductility increased with temperature.

3.3. Fractography

In the low temperature regime (i.e., below 500 °C) fracture surfaces were typical of classical “cup and cone” fractures, with evidence of micro-void coalescence in the central regions and a surrounding, concentric shear lip, Figure 18a–c.
Between 500 °C and 700 °C, the failure mode was dominated by shear at 45° to the tensile axis to produce a point fracture, Figure 18d–g. Specimens tested at 750 °C demonstrated a third form of failure, where shear lips were virtually absent and the entire fracture surface illustrated a highly intergranular form, Figure 18h. All specimens tested below 750 °C showed no evidence of secondary cracking along the length of the gauge section, however, there were numerous intergranular crack initiation sites covering the gauge of the 750 °C specimens, Figure 19.

4. Discussion

Swaging has induced a significant increase in the ultimate tensile strength (UTS) and yield strength of RR1000 between room temperature and 750 °C, although the improved strength characteristics were achieved at the cost of reducing the alloy ductility. The high strain levels imposed by swaging meant there was minimal evidence of work hardening following yield, as shown by the relatively small difference in yield strength and UTS, resulting in the elastic to fully plastic response shown in Figure 17. Similar behaviour has been widely documented for a variety of different cold worked materials [5,6,7,8,9,10,11,12,13], typically processed by cold rolling.
As shown in Figure 17, there was a considerable increase in the tensile strength and ductility in the cross-over between the low and high temperature regimes (500 °C and 600 °C). Whereas between room temperature and 500 °C, the ductility reduced with increasing temperature, increasing temperatures above 600 °C showed significant recovery in ductility. Hong and Lee [14] identified three temperature regimes in cold worked 316L stainless steel, where the ductility, yield strength and UTS response was vastly different in each temperature regime. During their intermediate temperature regime (250–600 °C), Hong and Lee showed stable, and even increased, UTS before eventual reductions at higher temperatures. This intermediate regime also showed a debit in ductility before rapidly increasing in the high temperature regime. A similar response was found during the present study on swaged RR1000. Hong and Lee believed that this phenomenon was a result of dynamic strain ageing during the intermediate temperature regime [15]. Thermal exposure then allows yield properties to be recovered, enhancing the tensile strength and ductility of a cold worked material [15,16]. As swaging has effectively pre-strained the studied alloy here, it is assumed that dynamic strain ageing, occurring between 500 °C and 600 °C, has allowed sufficient recovery of tensile strength and ductility, and produces the yield strength, UTS and ductility increases. Although the present tests on RR1000 did not indicate serrated yield traces, normally indicative of dynamic strain ageing, the tensile steel fractures reported by Hong and Lee [15] did illustrate a marked reduction in the area of ductile failure with increasing temperatures, resembling the point tensile fractures of the swaged FG RR1000 in Figure 18d–g. In addition, almost identical point fractures have been reported by Ševčík [17] in cast low carbon steels, again attributed to dynamic recrystalisation.
Shot peening has the potential to significantly improve the fatigue life of engineering components, however, the complex nature of the peened volume, i.e., the combined cold work, residual stress, surface roughness, intra-granular strain damage etc., makes determination of the optimum peening parameters for enhanced fatigue performance difficult. By removing the surface roughness effect and producing a consistent level of cold work throughout the cross-section by swaging, some of these parameters can be partitioned to support optimisation of the peening process. From the present studies of swaged RR1000 and work available in the literature, the formation of strain bands has been determined to be detrimental to fatigue and stable elastic properties. Further shot peening and swaging trials could identify the threshold strain rate required for greatest plastic deformation whilst maintaining a strain band free microstructure. In addition, the constitutive assessment of swaged RR1000 could enable discrete finite element (FE) modelling of shot peened surface material.

5. Conclusions

The swaging technique was used to induce approximately 30% cold work into bars of RR1000 as an academic exercise to assess the effects of cold work on bulk mechanical properties. The following conclusions can be drawn:
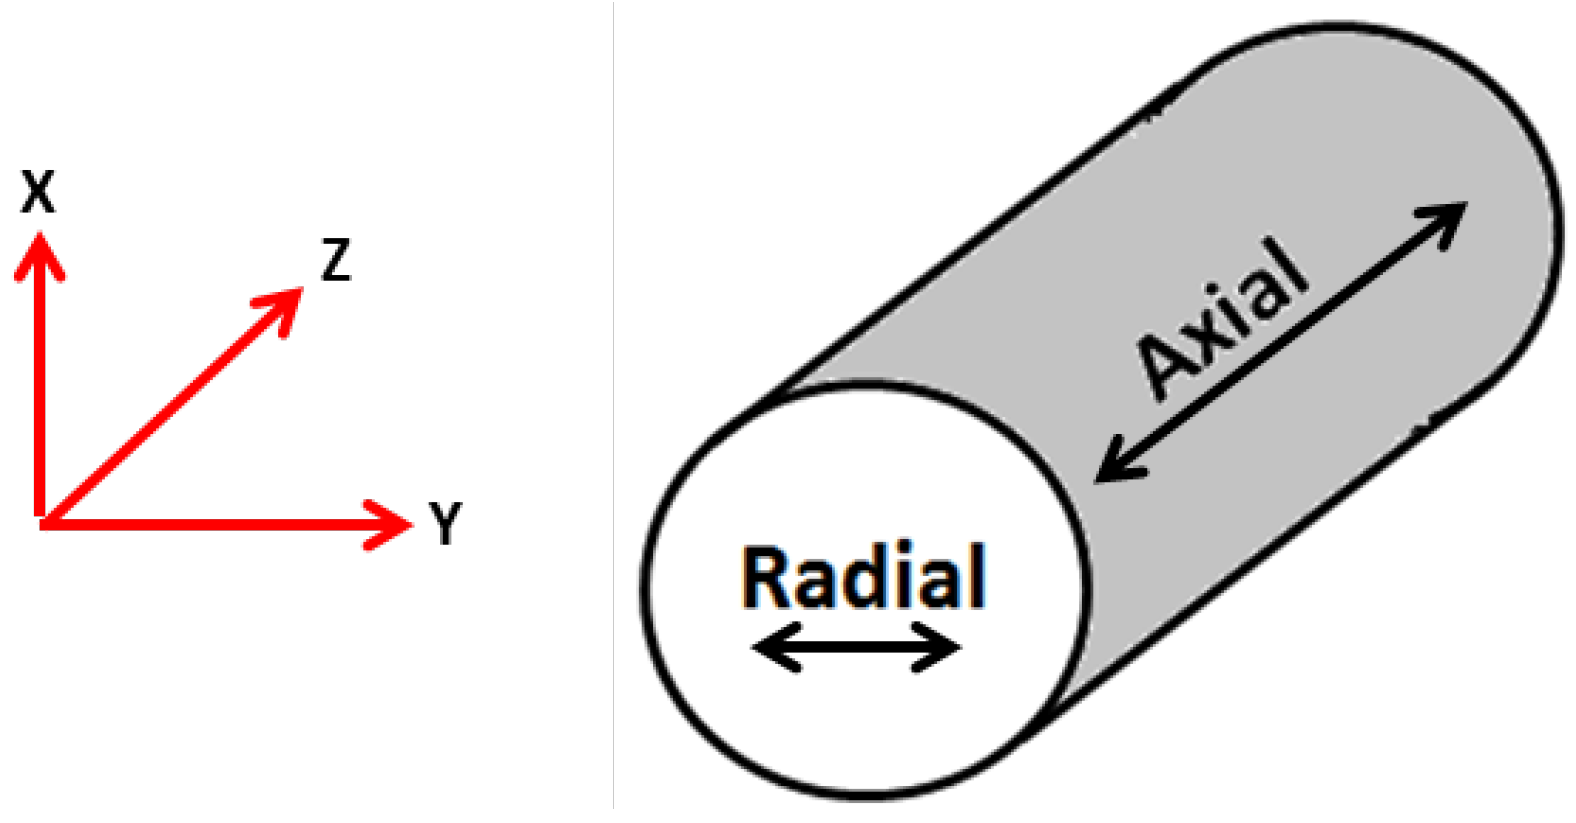
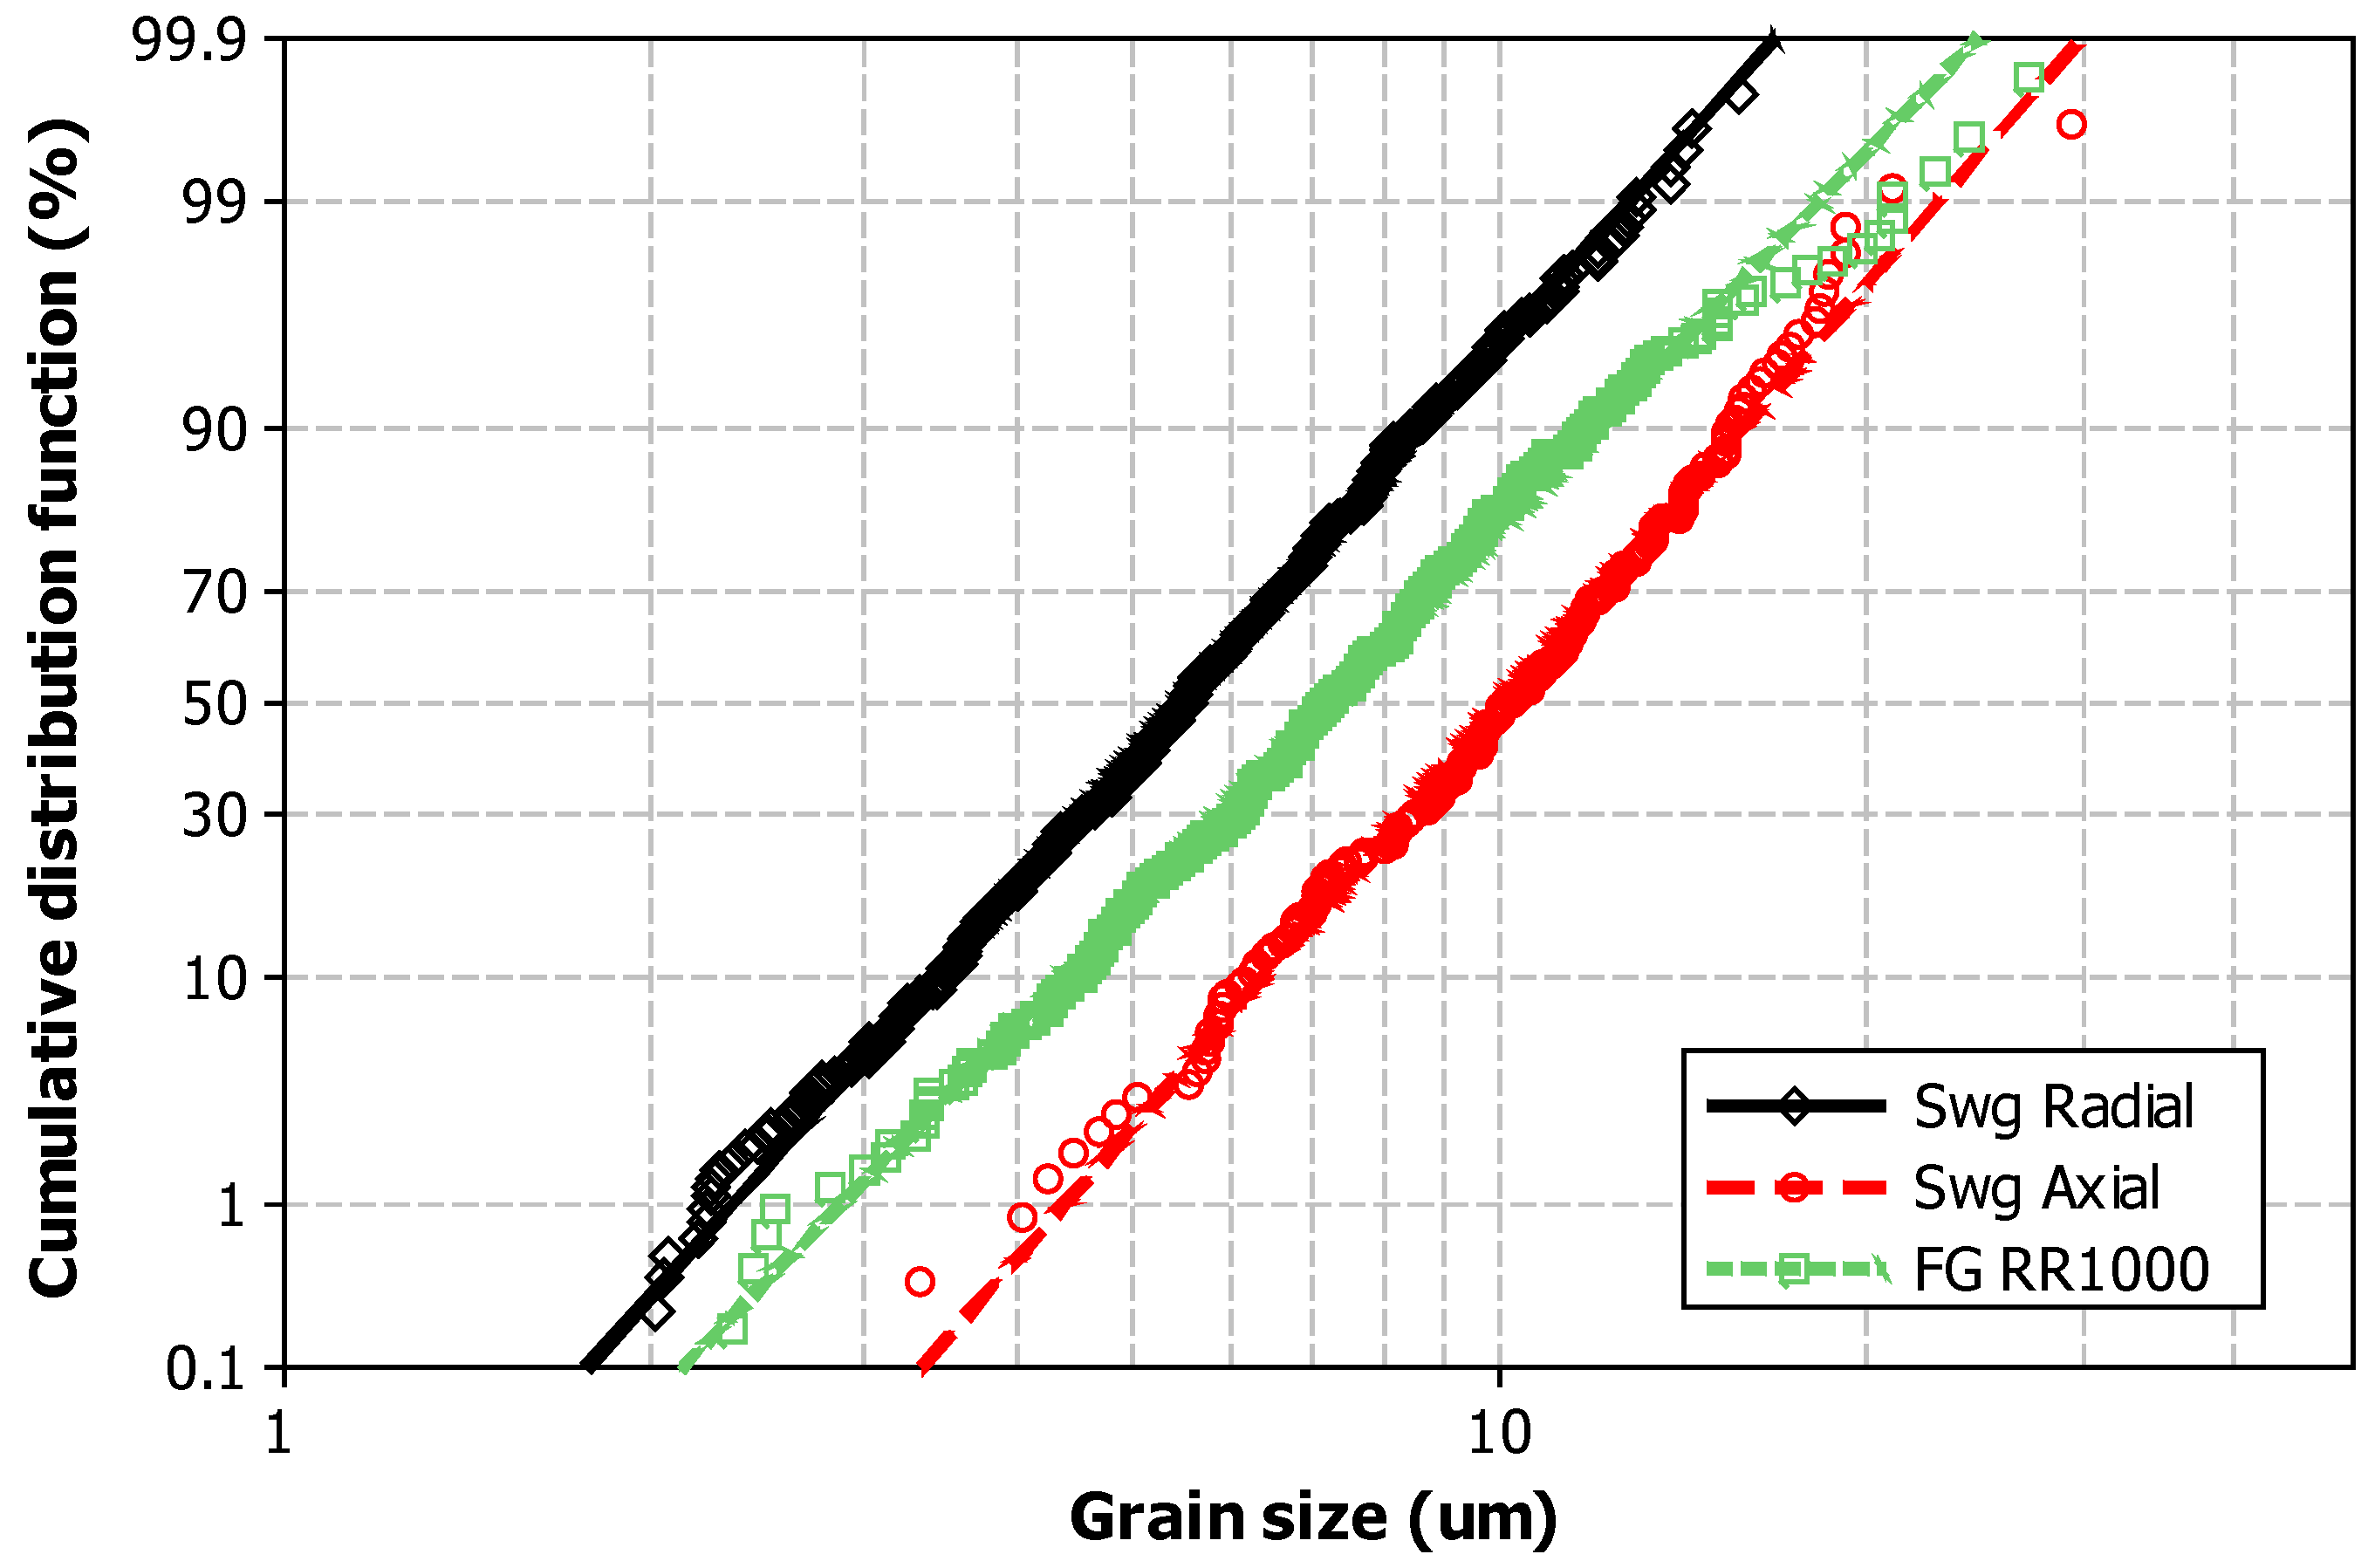
  • The swaging process considerably deforms the microstructure of RR1000. The grain size was reduced from 7.8 μm to 5.7 μm in the radial direction, whilst increased and elongated in the axial direction (to a maximum grain Feret dimension of 8.9 μm).
  • A relatively strong {111} fibre texture was induced parallel to the axial direction, along with a high level of intra-granular slip deformation.
  • The cold work imparted to the swaged RR1000 varied between 25.6% (at the surface) and 46.2% (in the centre). Micro-hardness correlated well with the degree of cold work. The levels of residual stress throughout the bulk of the swaged material were considerably lower to those typical of shot peened surfaces.
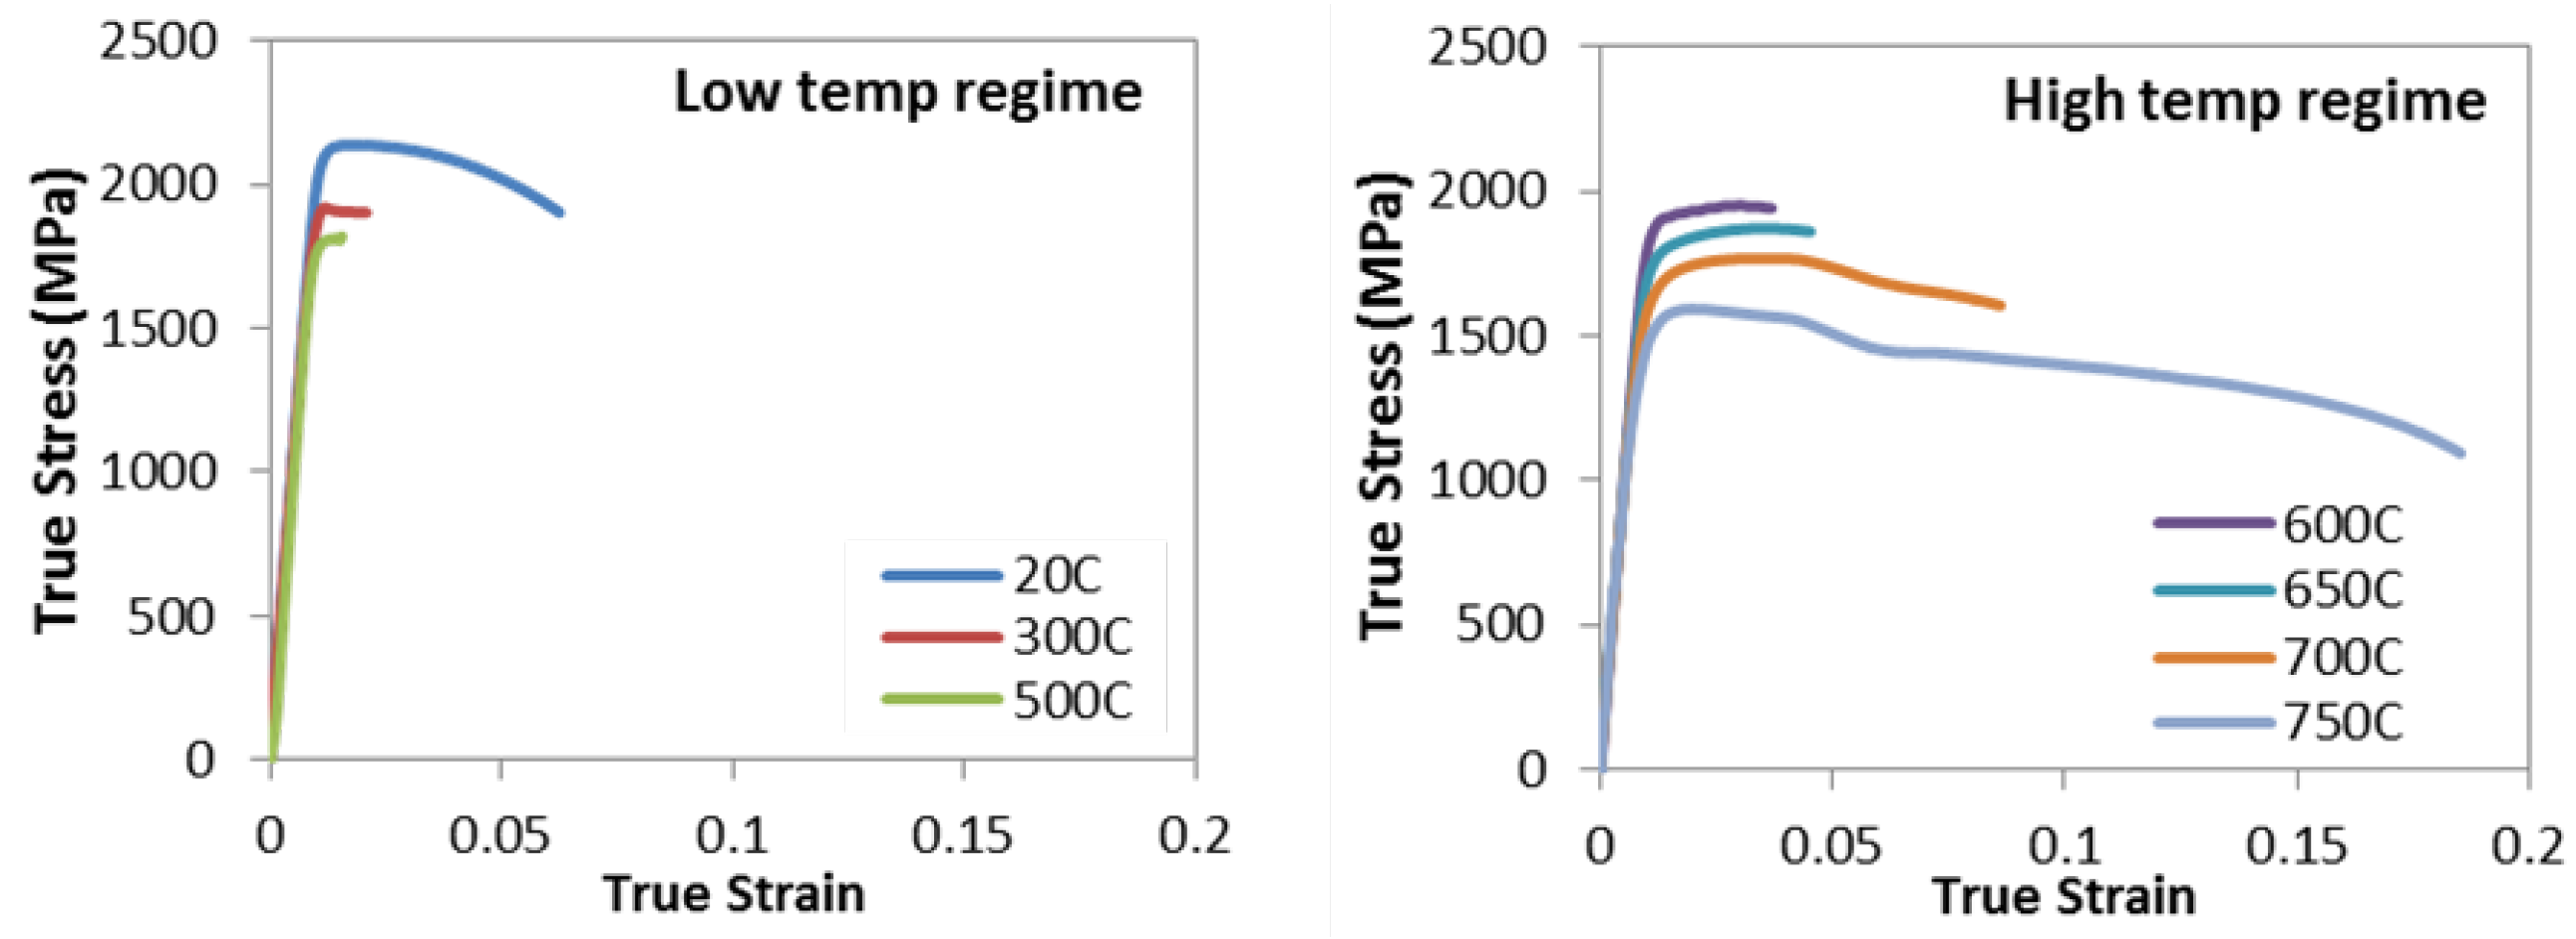
  • Tensile testing generally showed increased ultimate tensile strength (UTS) and yield strength over non-swaged RR1000, but also resulted in reduced ductility. There was a considerable debit in ductility between room temperature and 500 °C before ductility then recovered at higher temperatures, thought to be through a dynamic strain ageing process.

Acknowledgments

Swaging was performed by Elmill Swaging Ltd., Wiltshire, UK. The research was funded by the EPSRC Rolls-Royce Strategic Partnership in Structural Metallic Systems for Gas Turbines (grants EP/H500383/1 and EP/H022309/1). The provision of materials and technical support from Rolls-Royce plc. is gratefully acknowledged.

Author Contributions

All authors contributed to this work. Mark Hardy and Dan Child conceived and designed the experiments; James O’Hanlon performed the experiments and analyzed the data; Philip Withers contributed technical expertise and interpretation of residual stress and texture measurements; and Martin Bache acted as Academic Supervisor to the EngD student (JO’H) and wrote the paper.

Conflicts of Interest

The authors declare no conflict of interest.

References

  1. Evans, A.; Kim, S.-B.; Shackleton, J.; Bruno, G.; Preuss, M.; Withers, P.J. Relaxation of residual stress in shot peened Udimet 720Li under high temperature isothermal fatigue. Int. J. Fatigue 2005, 27, 1530–1534. [Google Scholar] [CrossRef]
  2. Kirk, D. Effects of plastic straining on residual stresses induced by shot-peening. In Proceedings of the 3rd International Conference on Shot Peening (ICSP3), Garmisch-Partenkirchen, Germany, September 1987; Wohlfahrt, H., Kopp, R., Vöhringer, O., Eds.; DGM Informationsgesellschaft Verlag: Oberursel, Germany, 1987; pp. 213–220. [Google Scholar]
  3. Hasegawa, N.; Watanabe, Y.; Kato, Y. Effect of shot peening on fatigue strength of carbon steel at elevated temperature. In Proceedings of the 5th International Conference on Shot Peening Pre-Prints, Oxford, UK, 13–17 September 1993; pp. 134–139.
  4. Mitchell, R.J.; Hardy, M.C.; Preuss, M.; Tin, S. Development of γ′ Morphology in P/M Rotor Disc Alloys During Het Treatment; Green, K.A., Pollack, T.M., Harada, H., Howson, T.E., Reed, R.C., Shira, J.J., Watson, S., Eds.; The Minerals, Metals & Materials Society: Warrendale, PA, USA, 2004. [Google Scholar]
  5. Li, W.; Withers, P.J.; Axinte, D.; Preuss, M.; Andrews, P. Residual stresses in face finish turning of high strength nickel-based superalloys. J. Mater. Process. Technol. 2009, 209, 4896–4902. [Google Scholar] [CrossRef]
  6. Wang, Y.; Zhao, J.; Dai, S.; Chen, F.; Yu, X.; Zhang, Y. Influence of cold rolling and ageing treatment on microstructure and mechanical properties of Ti-30Nb-5Ta-6Zr alloy. J. Mech. Behav. Biomed. Mater. 2013, 27, 33–42. [Google Scholar] [CrossRef] [PubMed]
  7. Hedayati, A.; Najafizadeh, A.; Kermanpur, A.; Forouzan, F. The effect of cold rolling regime on microstructure and mechanical properties of AISI 304L stainless steel. J. Mater. Process. Technol. 2010, 210, 1017–1022. [Google Scholar] [CrossRef]
  8. Tewary, N.K.; Ghosh, S.K.; Bera, S.; Chakrabarti, D.; Chatterjee, S. Influence of cold rolling on microstructure, texture and mechanical properties of low carbon high Mn TWIP steel. Mater. Sci. Eng. A 2014, 615, 405–415. [Google Scholar] [CrossRef]
  9. Fu, Y.; Liu, J.; Shi, J.; Cao, W.; Dong, H. Effects of cold rolling reduction on retained austenite fraction and mechanical properties of high-Si TRIP steel. Int. J. Iron Steel Res. 2013, 20, 50–56. [Google Scholar] [CrossRef]
  10. Markandeya, R.; Nagarjuna, S.; Sarma, D.S. Effect of prior cold work on age hardening of Cu-3Ti-1Cr alloy. Mater. Charact. 2006, 57, 348–357. [Google Scholar] [CrossRef]
  11. Abdulstaar, M.A.; El-Danaf, E.A.; Waluyo, N.S.; Wagner, L. Severe plastic deformation of commercial purity aluminium by rotary swaging: Microstructure evolution and mechanical properties. Mater. Sci. Eng. A 2013, 565, 351–358. [Google Scholar] [CrossRef]
  12. Durlu, N.; Caliskan, N.K.; Bor, S. Effect of swaging on microstructure and tensile properties of W-Ni-Fe alloys. Int. J. Refract. Metals Hard Mater. 2014, 42, 126–131. [Google Scholar] [CrossRef]
  13. Viswanath, A.; Rao, B.P.C.; Mahadevan, S.; Parameswaran, P.; Jayakumar, T.; Raj, B. Nondestructive assessment of tensile properties of cold worked AISI type 304 stainless steel using nonlinear ultrasonic technique. J. Mater. Process. Technol. 2011, 211, 538–544. [Google Scholar] [CrossRef]
  14. Hong, S.G.; Lee, S.B. The tensile and low-cycle fatigue behavior of cold worked 316L stainless steel: Influence of dynamic strain aging. Int. J. Fatigue 2004, 26, 899–910. [Google Scholar] [CrossRef]
  15. Hong, S.G.; Lee, S.B. Mechanism of dynamic strain aging and characterization of its effect on the low-cycle fatigue behaviour in type 316L stainless steel. J. Nucl. Mater. 2005, 340, 307–314. [Google Scholar] [CrossRef]
  16. Dieter, G.E. Mechanical Metallurgy. In Materials Science and Metallurgy; McGraw-Hill Book Company: New York, NY, USA, 1988. [Google Scholar]
  17. Ševčík, A. High temperature strength analysis of low carbon steels in the as-cast state. Metalurgija 2005, 44, 243–248. [Google Scholar]
Figure 1. Post-swaged RR1000 bar.
Metals 06 00054 g001
Figure 2. Combined post swage bar diameter measurements.
Metals 06 00054 g002
Figure 3. Associated cold work statistics.
Metals 06 00054 g003
Figure 4. Reference system used to describe bar microstructures.
Metals 06 00054 g004
Figure 5. Typical microstructures from (a) pre swaged RR1000 (X-Y plane, optical microscopy); (b) post swaging (X-Y plane, secondary electron SEM) and (c) post swaging (along Z axis, SEM).
Metals 06 00054 g005
Figure 6. Cumulative distribution plot of Feret diameters, pre and post swaging.
Metals 06 00054 g006
Figure 7. Intra-granular strain deformation in swaged material (a) intersecting slip; (b) slip defining twinning; (c) within isolated grains beneath a shot peened surface.
Metals 06 00054 g007
Figure 8. Intra-granular slip and elongated grain structure viewed on the axial plane.
Metals 06 00054 g008
Figure 9. (a) The pole and (b) inverse pole figures measured by electron back scattered diffraction (EBSD) on swaged RR1000. Intensity (times random orientation) indicated by the colour keys in each case.
Metals 06 00054 g009
Figure 10. Inverse pole figure maps in the (a) X direction; (b) Y direction and (c) Z direction. Orientation colour key indicated.
Metals 06 00054 g010
Figure 11. High magnification inverse pole figure (IPF) map taken from the axial plane indicating intra-grain misorientation (examples within circled regions).
Metals 06 00054 g011
Figure 12. Schmid factor maps in the (a) X, (b) Y and (c) Z directions. Distribution data representing each direction is plotted in (d).
Metals 06 00054 g012
Figure 13. Axial residual stress data measured across the radial plane of a swaged bar.
Metals 06 00054 g013
Figure 14. Cold work predicted from the full width half maximum (FWHM) measurements on a radial section of swaged material compared to average level predicted from bulk area reduction.
Metals 06 00054 g014
Figure 15. Micro-hardness measurements across radial sections of pre and post swaged bar materials.
Metals 06 00054 g015
Figure 16. Plain cylindrical test specimen.
Metals 06 00054 g016
Figure 17. True stress versus true strain measured from tensile tests, with data divided into two distinct regimes of behaviour.
Metals 06 00054 g017
Figure 18. Tensile fracture surfaces indicating: cup and cone fractures at (a) 20 °C, (b) 200 °C and (c) 500 °C; point fractures at (d) 600 °C, (e) 650 °C, (f) 700 °C and (g) 600 °C; (h) intergranular fracture surface at 750 °C.
Metals 06 00054 g018
Figure 19. Multiple intergranular crack initiation along the gauge surface of a specimen tested at 750 °C.
Metals 06 00054 g019
Table 1. RR1000 nominal composition (wt. %).
RR1000CoCrMoTiAlTaHfZrCBNi
Element18.51553.6320.50.060.0270.015Balance
Table 2. Pre and post swaging grain size data.
SampleNo. of Grains MeasuredAverage Grain Size (μm)Feret Diameter (μm)ASTM ClassFeret Average
Pre Swage1918811.11.03
Post Swage radial2406612.01.07
Post Swage axial20091110.71.19

