
Simulation and Experimental Investigation for the Homogeneity of Ti49.2Ni50.8 Alloy Processed by Equal Channel Angular Pressing


Abstract
:1. Introduction
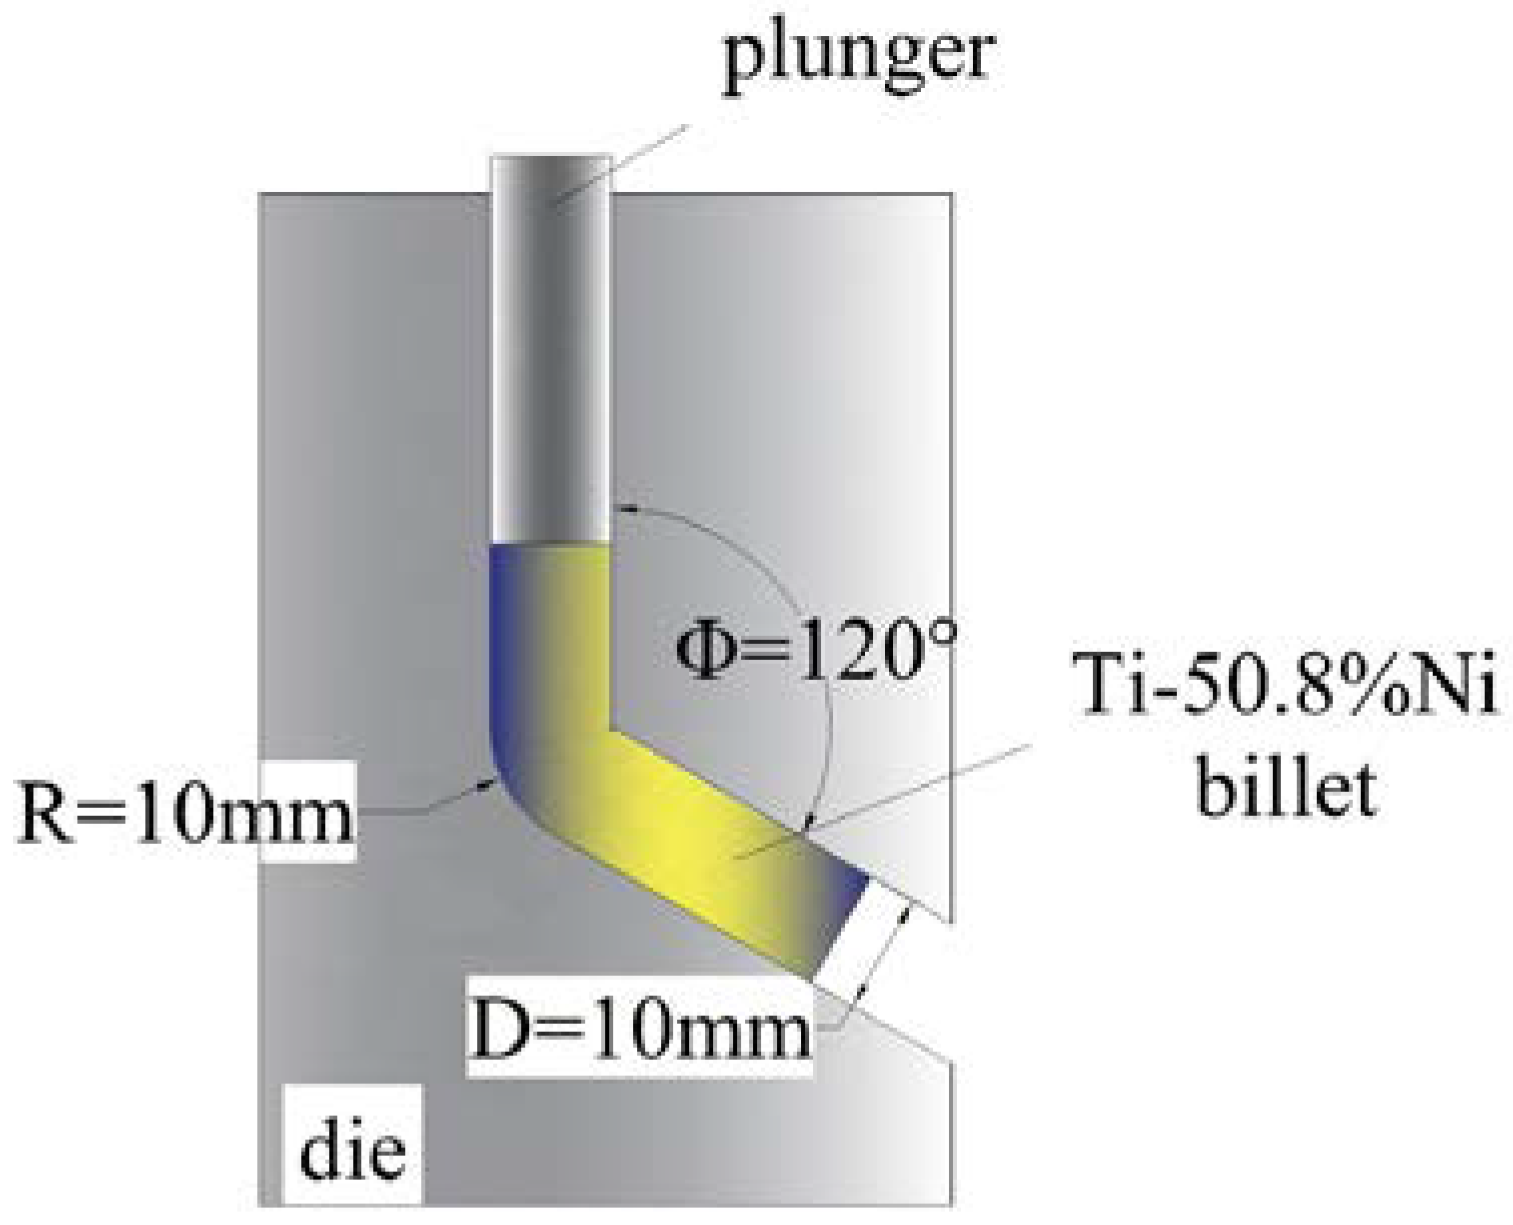
2. Simulation Models
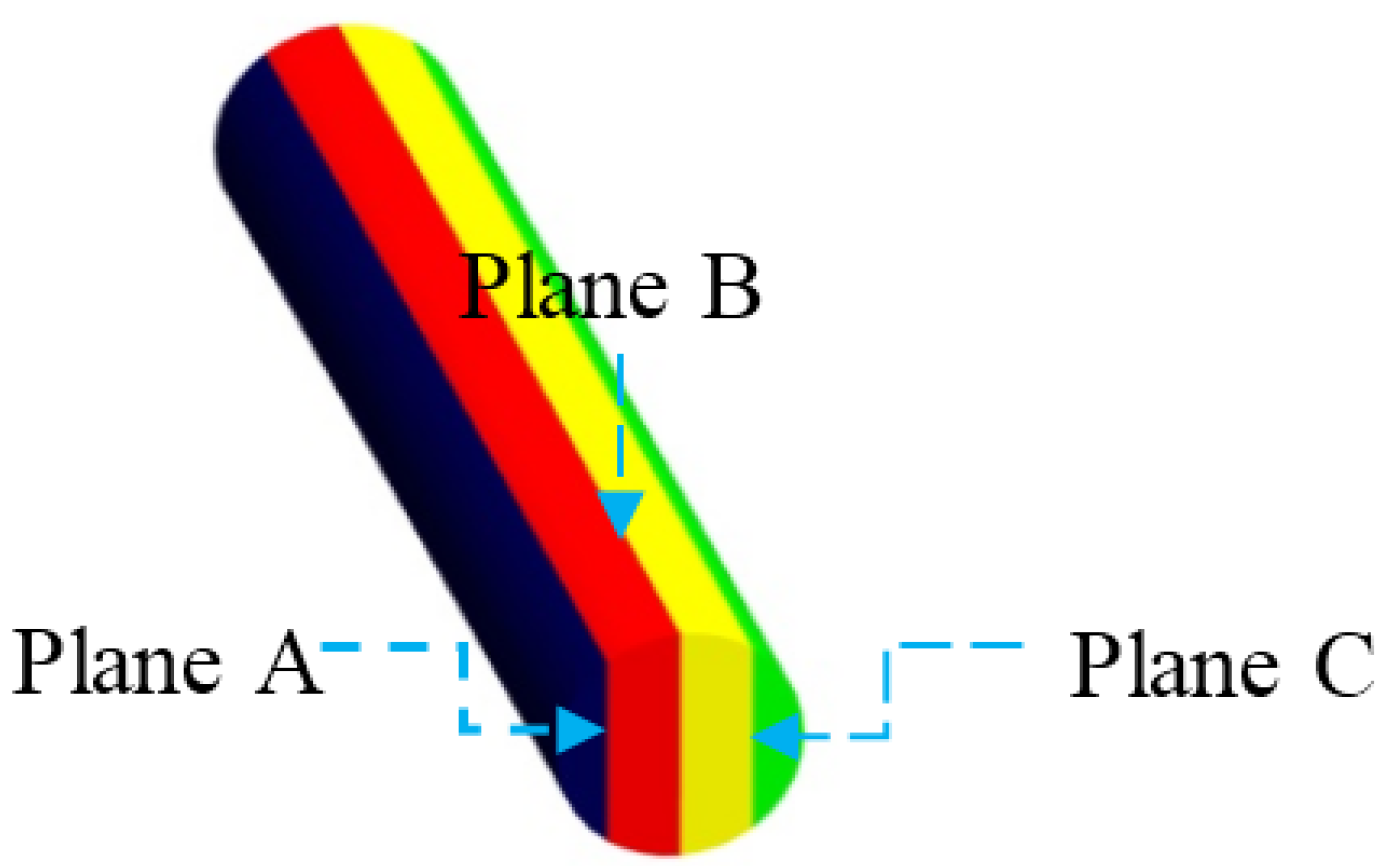
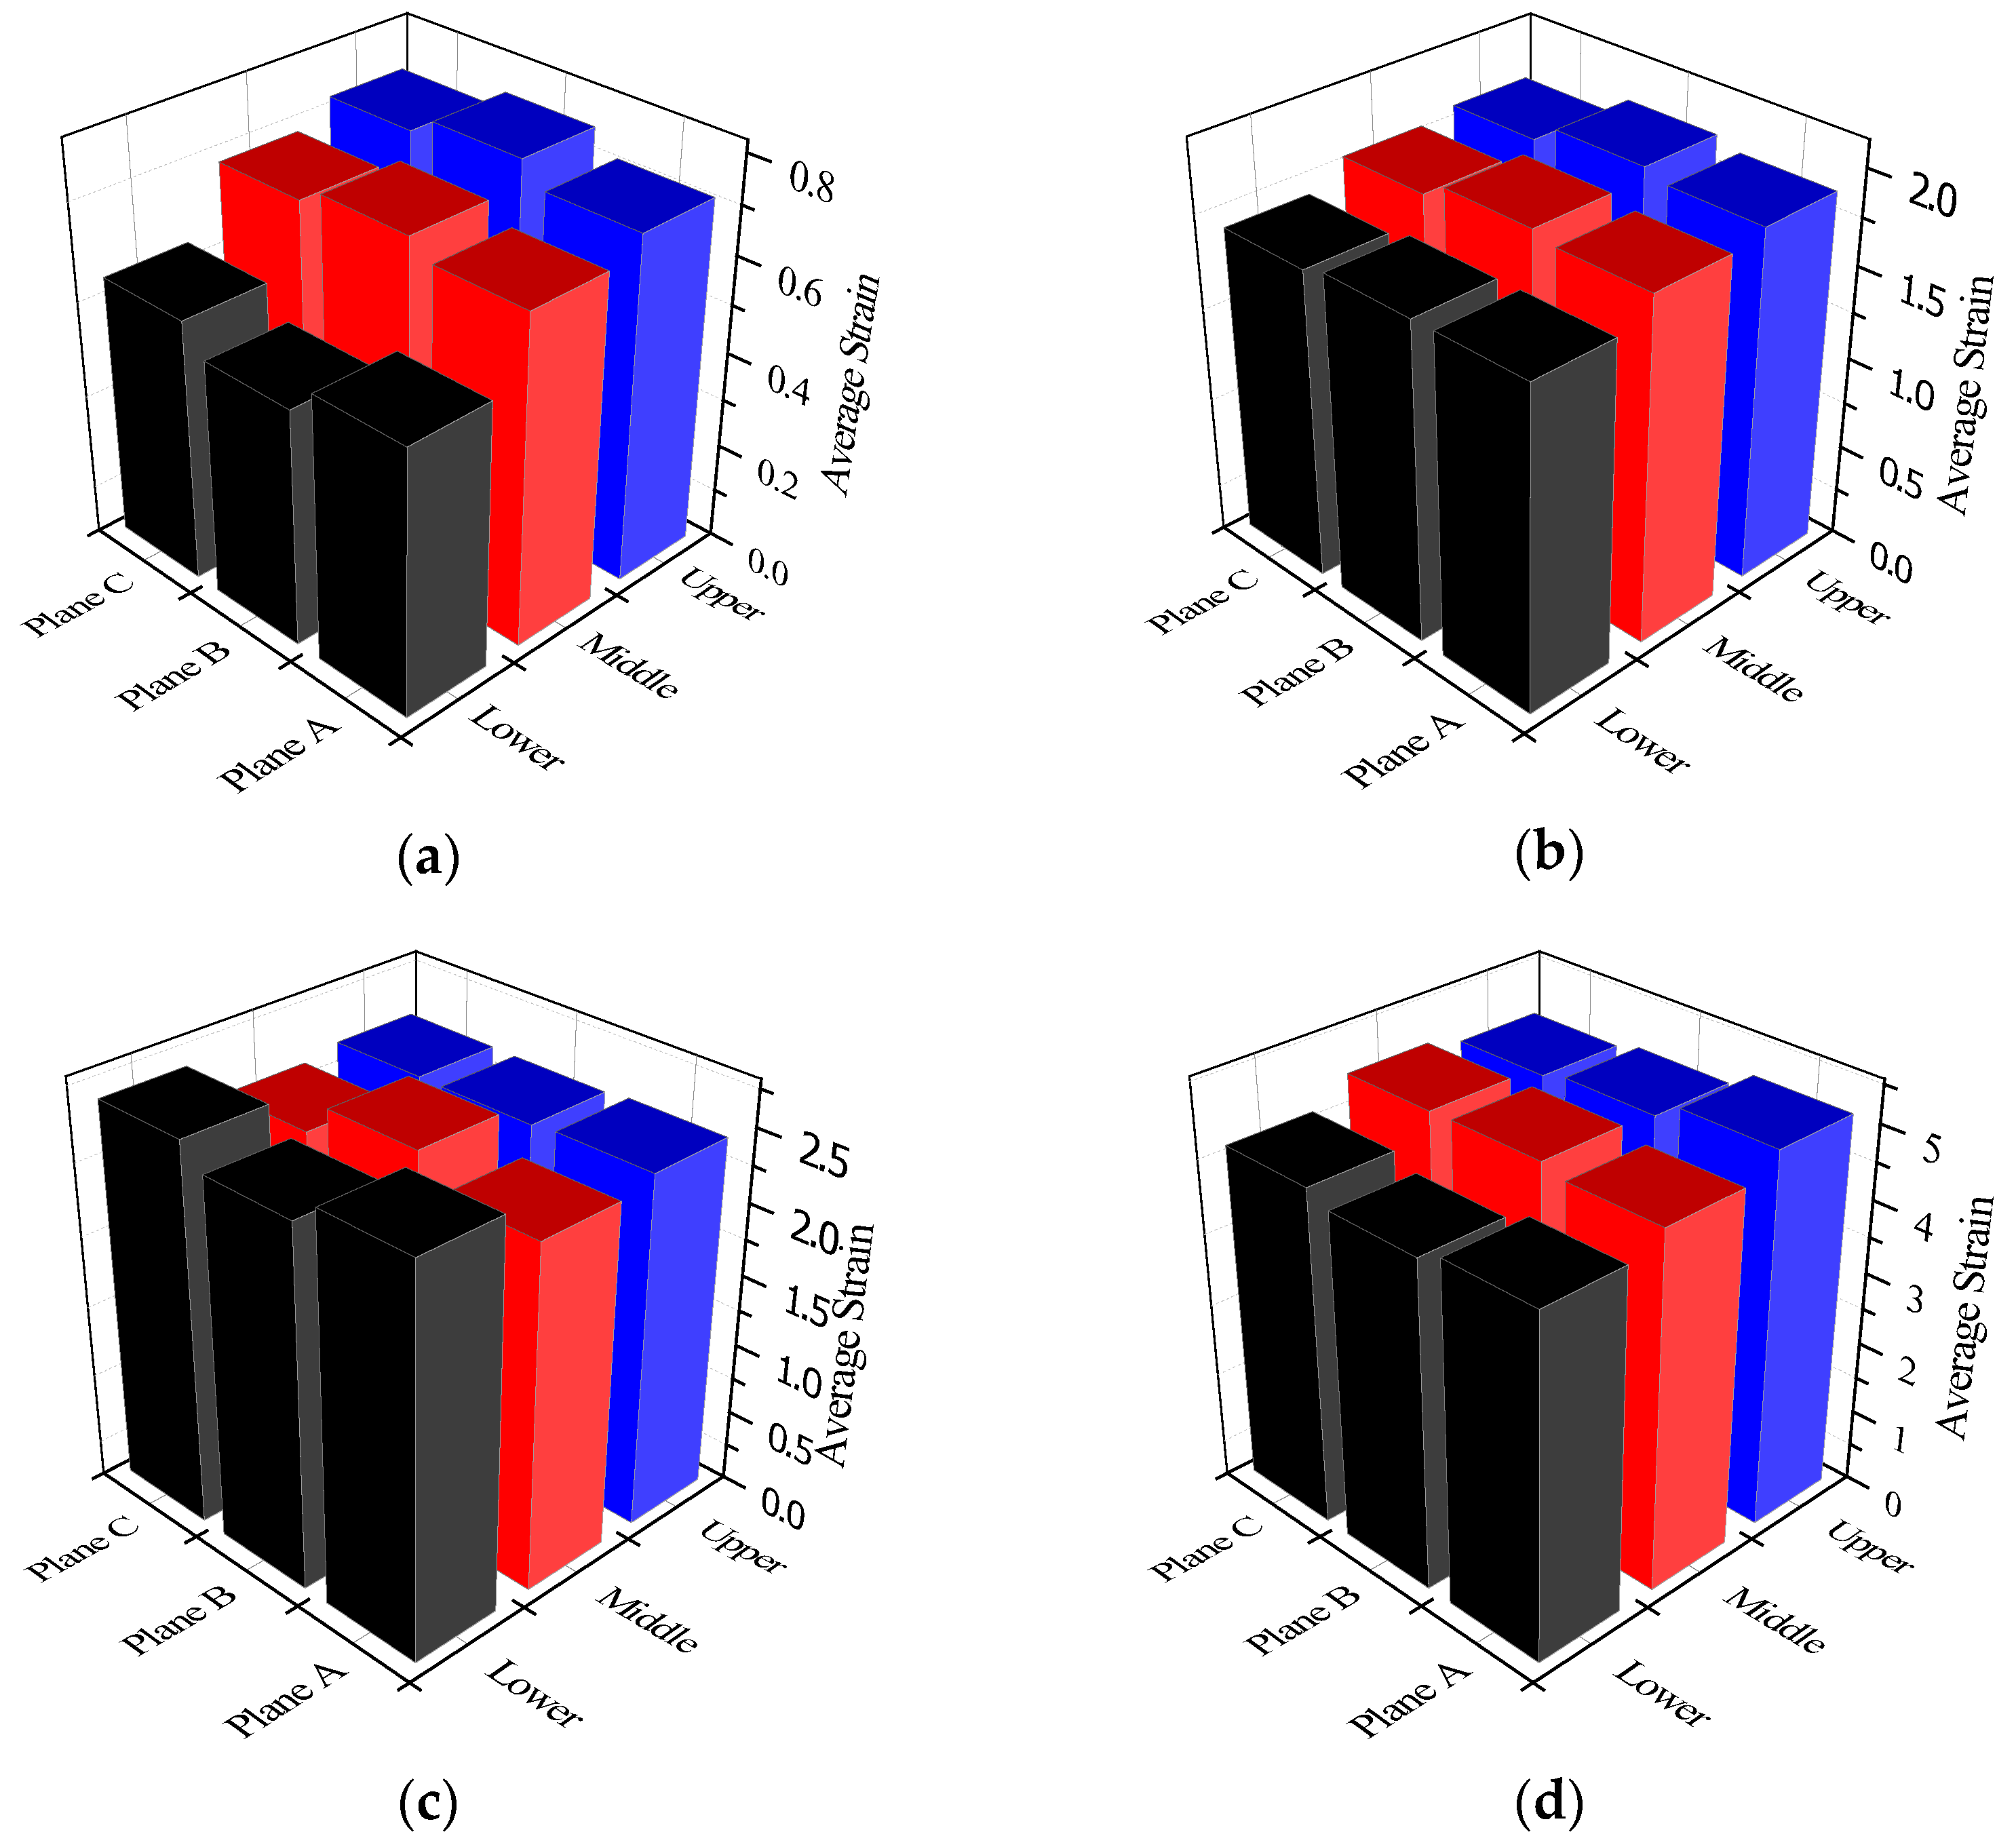
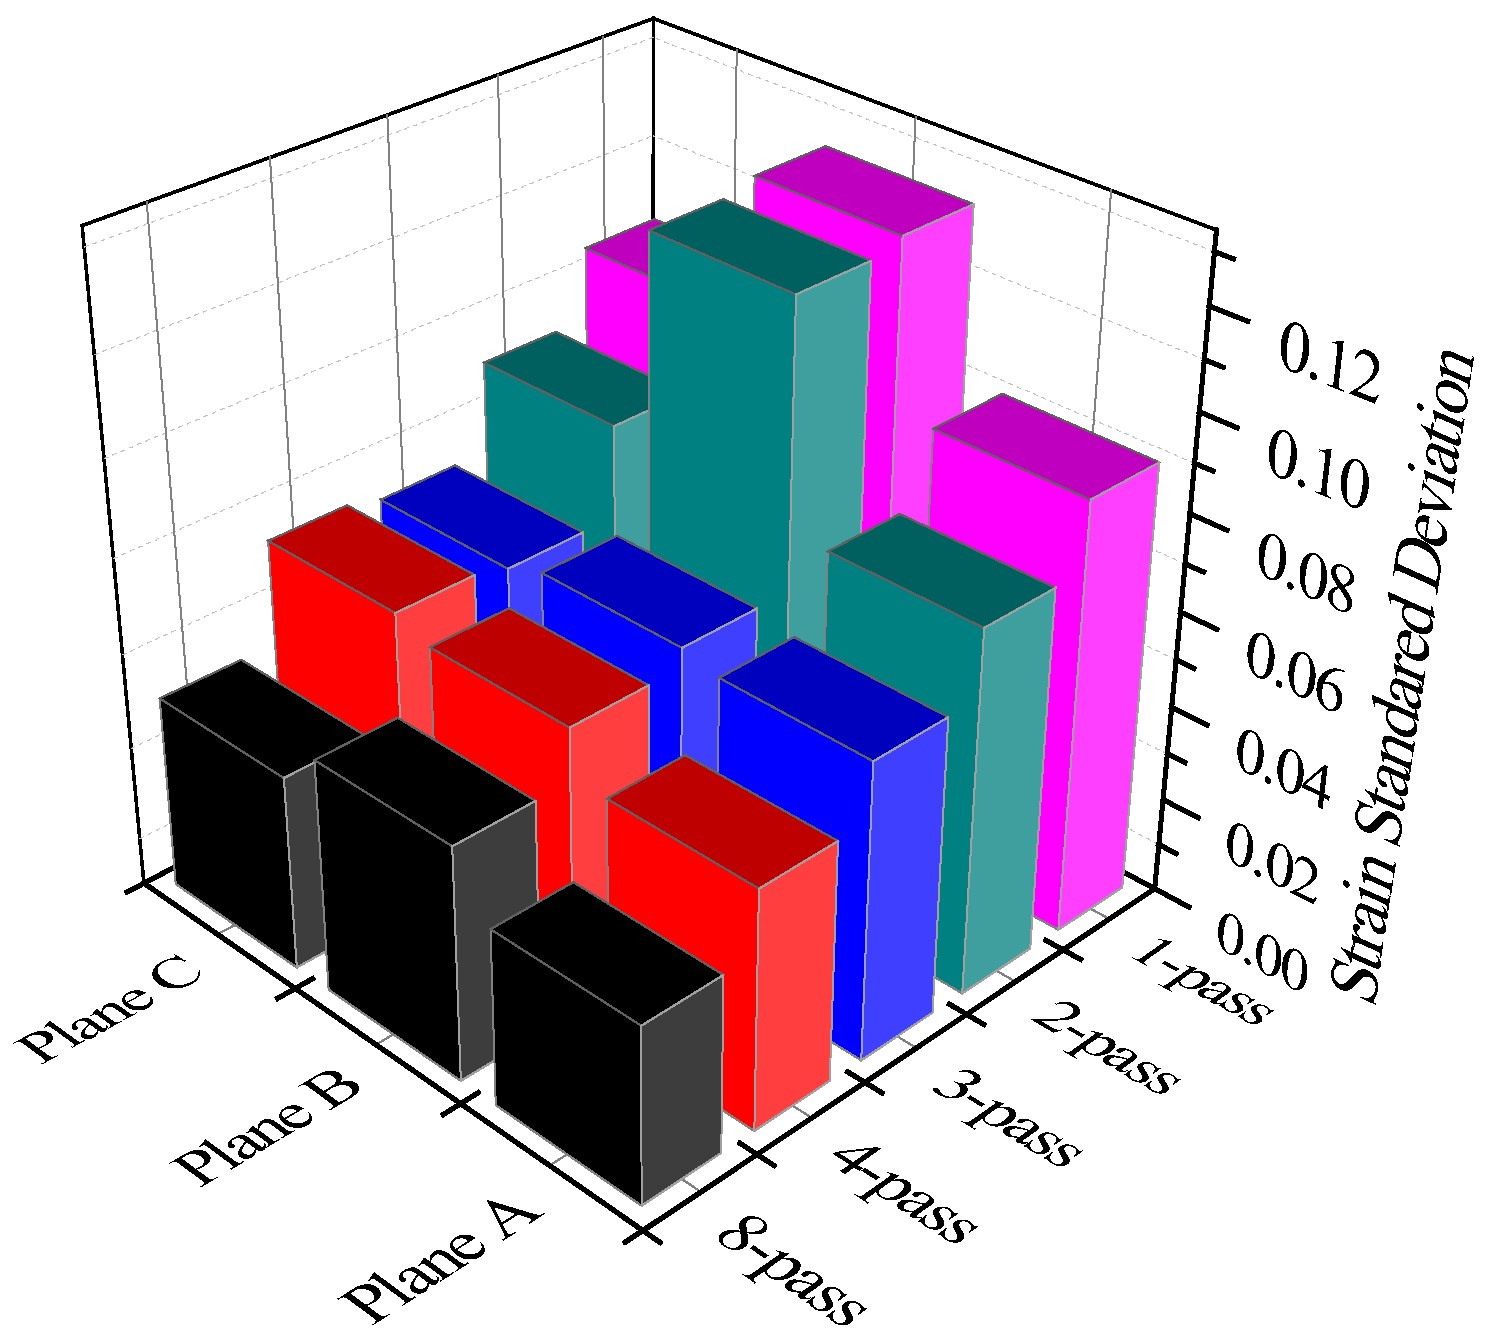
3. Homogeneity Calculation
4. Experimental Details
5. Results and Discussion
6. Conclusions
Acknowledgments
Author Contributions
Conflicts of Interest
Abbreviations
| ECAP | Equal channel angular pressing |
| SMA | Shape memory alloy |
| SSD | Strain standard deviation |
| FEM | Finite element method |
| SPD | Severe plastic deformation |
| HPT | High pressure torsion |
References
- Otsuka, K.; Kakeshita, T. Science and technology of shape-memory alloys: New developments. MRS Bull. 2002, 27, 91–100. [Google Scholar] [CrossRef]
- Otsuka, K.; Ren, X. Physical metallurgy of Ti-Ni-based shape memory alloys. Prog. Mater. Sci. 2005, 50, 511–678. [Google Scholar] [CrossRef]
- Valiev, R.Z.; Mukherjee, A.K. Nanostructures and unique properties in intermetallics, subjected severe plastic deformation. Scripta Mater. 2001, 44, 1747–1750. [Google Scholar] [CrossRef]
- Prokofiev, E.; Gunderov, D.V.; Lukyanov, A.; Pushin, V.; Valiev, R.Z. Mechanical behavior and stress-induced martensitic transformation in nanocrystalline Ti49.4Ni50.6 alloy. Mater. Sci. Forum. 2008, 584, 470–474. [Google Scholar] [CrossRef]
- Valiev, R.Z.; Langdon, T.G. Principles of equal-channel angular pressing as a processing tool for grain refinement. Prog. Mater. Sci. 2006, 51, 881–981. [Google Scholar] [CrossRef]
- Waitz, T.; Kazykhanov, V.; Karnthaler, H.P. Martensitic phase transformations in nanocrystalline NiTi studied by TEM. Acta Mater. 2004, 52, 137–147. [Google Scholar] [CrossRef]
- Kočiško, R.; Kvačkaj, T.; Kováčová, A.; Zemko, M. The influence of ECAP geometry on the effective strain distribution. Adv. Mater. Res. 2015, 1127, 135–141. [Google Scholar] [CrossRef]
- Quang, P.; Nghiep, D.M.; Kim, H.S. Simulation of the effective of friction on the deformation in equal channel angular pressing (ECAP). Key Eng. Mater. 2015, 656–657, 526–531. [Google Scholar] [CrossRef]
- Medeiros, N.; Moreira, L.P. Upper-bound analysis of die corner gap formation for strain-hardening materials in ECAP process. Comput. Mater. Sci. 2014, 91, 350–358. [Google Scholar] [CrossRef]
- Waitz, T.; Tsuchiya, K.; Antretter, T.; Fischer, F.D. Phase transformations of nanocrystalline martensitic materials. MRS Bull. 2009, 34, 814–821. [Google Scholar] [CrossRef]
- Tong, Y.X.; Liu, Y.; Miao, J.M.; Zhao, L.C. Characterization of a nanocrystalline NiTiHf high temperature shape memory alloy thin film. Scripta Mater. 2005, 52, 983–987. [Google Scholar] [CrossRef]
- Kuranova, N.N.; Makarov, V.V.; Pushin, V.G.; Uksusnikov, A.N. Thermo- and deformation induced martensitic transformations in binary TiNi-based alloys, subjected severe plastic deformation. Mater. Sci. Forum. 2013, 738–739, 530–534. [Google Scholar] [CrossRef]
- Lin, H.C.; Wu, S.K.; Chou, T.S.; Kao, H.P. The Effects of cold rolling on the martensitic transformation of an equiatomic TiNi alloy. Acta Metall. Mater. 1991, 39, 2069–2080. [Google Scholar] [CrossRef]
- Miller, D.A.; Lagoudas, D.C. Influence of cold work and heat treatment on the shape memory effect and plastic strain development of NiTi. Mater. Sci. Eng. A 2001, 308, 161–175. [Google Scholar] [CrossRef]
- Zhao, L.C.; Zheng, Y.F.; Cai, W. Study of deformation micromechanism in cold-deformed TiNi based alloys. Intermetallics 2005, 13, 281–288. [Google Scholar] [CrossRef]
- Lu, S.K.; Liu, H.Y.; Yu, L.; Jiang, Y.L.; Su, J.H. 3D FEM simulations for the homogeneity of plastic deformation in aluminum alloy HS6061-T6 during ECAP. Procedia Eng. 2011, 12, 35–40. [Google Scholar] [CrossRef]
- Djavanroodi, F.; Omranpour, B.; Ebrahimi, M.; Sedighi, M. Designing of ECAP parameters based on strain distribution uniformity. Prog. Nat. Sci. 2012, 22, 452–460. [Google Scholar] [CrossRef]
- Mahallawy, N.E.; Shehata, F.A.; Hameed, M.A.E.; Aal, M.I.A.E.; Kim, H.S. 3D FEM simulations for the homogeneity of plastic deformation in Al-Cu alloys during ECAP. Mater. Sci. Eng. A 2010, 527, 1404–1410. [Google Scholar] [CrossRef]
- Tong, Y.X.; Guo, B.; Chen, F.; Tian, B.; Li, L.; Zheng, Y.F.; Prokofiev, E.A.; Gunderov, D.V.; Valiev, R.Z. Thermal cycling stability of ultrafine-grained TiNi shape memory alloys processed by equal channel angular pressing. Scripta Mater. 2012, 67, 1–4. [Google Scholar] [CrossRef]
- Zaïri, F.; Aour, B.; Gloaguen, J.M.; Naït-Abdelaziz, M.; Lefebvre, J.M. Numerical modelling of elastic-viscoplastic equal channel angular extrusion process of a polymer. Comput. Mater. Sci. 2006, 38, 202–216. [Google Scholar] [CrossRef]
- Zhang, X.; Hua, L.; Liu, Y. FE simulation and experimental investigation of ZK60 magnesium alloy with different radial diameters processed by equal channel angular pressing. Mater. Sci. Eng. A 2012, 535, 153–163. [Google Scholar] [CrossRef]
- Kim, H.S. Finite element analysis of equal channel angular pressing using a round corner die. Mater. Sci. Eng. A 2001, 315, 122–128. [Google Scholar] [CrossRef]
- Kim, H.S. On the effect of acute angles on deformation homogeneity in equal channel angular pressing. Mater. Sci. Eng. A 2006, 430, 346–349. [Google Scholar] [CrossRef]
- Kim, H.S.; Seo, M.H.; Hong, S.I. On the die corner gap formation in equal channel angular pressing. Mater. Sci. Eng. A 2000, 291, 86–90. [Google Scholar] [CrossRef]


| Parameter | Value |
|---|---|
| Billet length (mm) | 60 |
| Billet Diameter (mm) | 10 |
| Initial billet temperature (°C) | 450 |
| Initial tooling temperature (°C) | 450 |
| Temperature range for flow stress (°C) | 450 |
| Strain rate range for flow stress (s−1) | 0.001–10 |
| Punch speed (mm/s) | 10 |
| Friction coefficient between Die and billet | 0.25 |
| Friction coefficient between Die and ram | 0.25 |
| Total number of mesh elements | 12,000 |
| Minimum size of mesh element (mm) | 0.7 |
| Mesh density type | relative |
| Relative interference depth | 0.7 |
| Density (g·cm−3) | 6.45 |
| Process | Pass No. | Position at the Billet | ||
|---|---|---|---|---|
| Plane A | Plane B | Plane C | ||
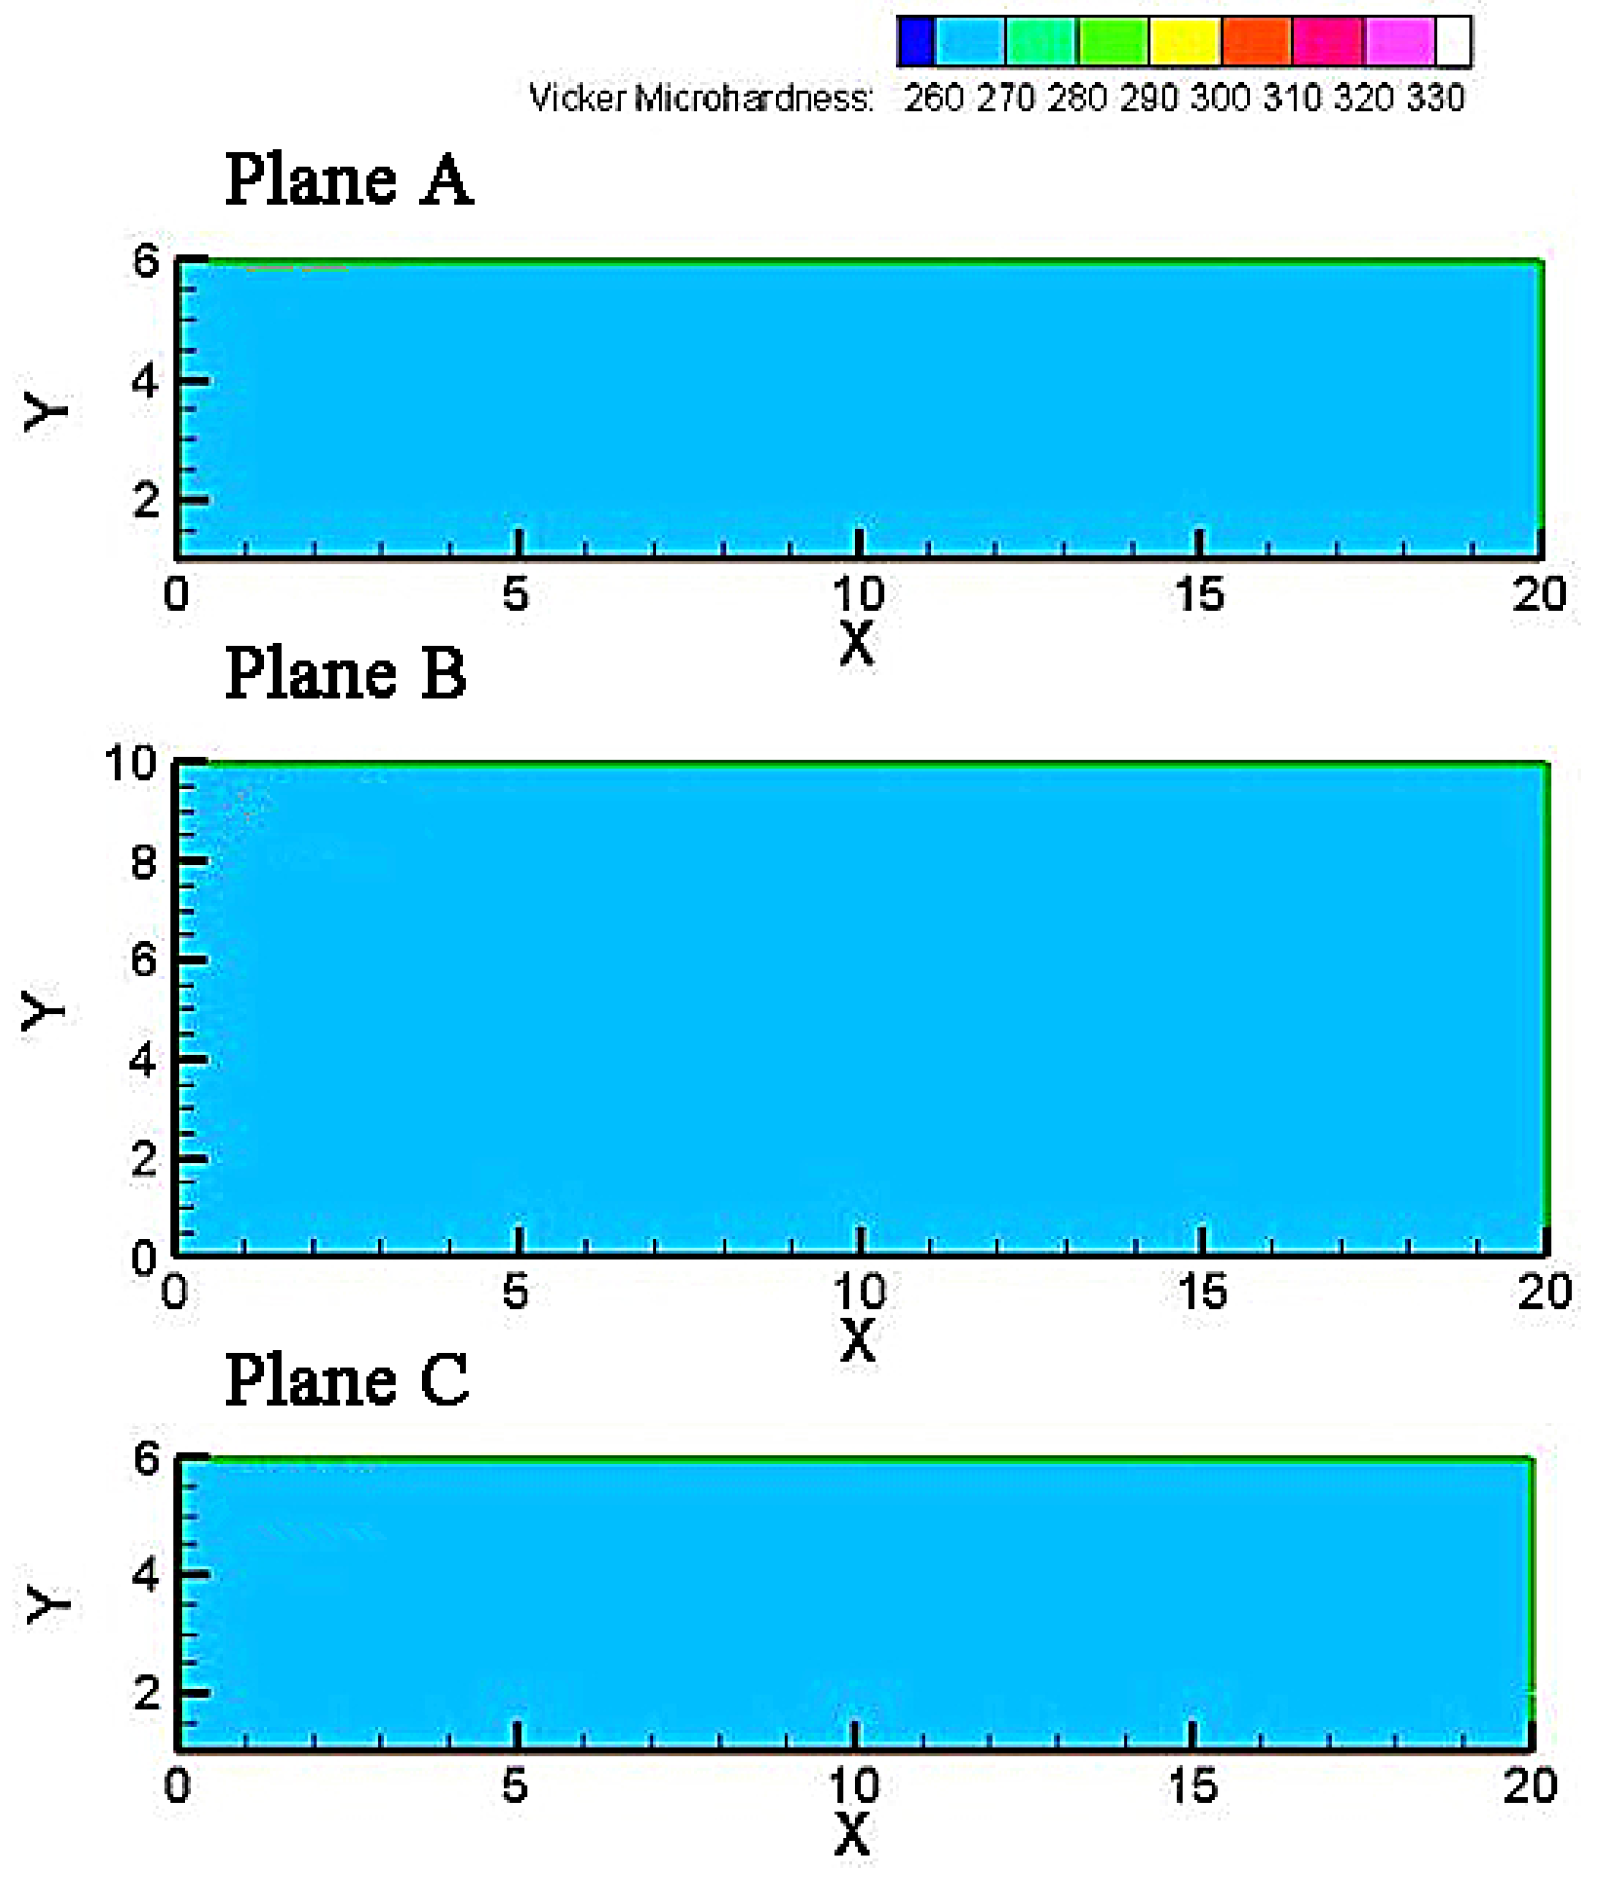
| Solution treated | 0 | 265 ± 2 | 265 ± 2 | 265 ± 2 |
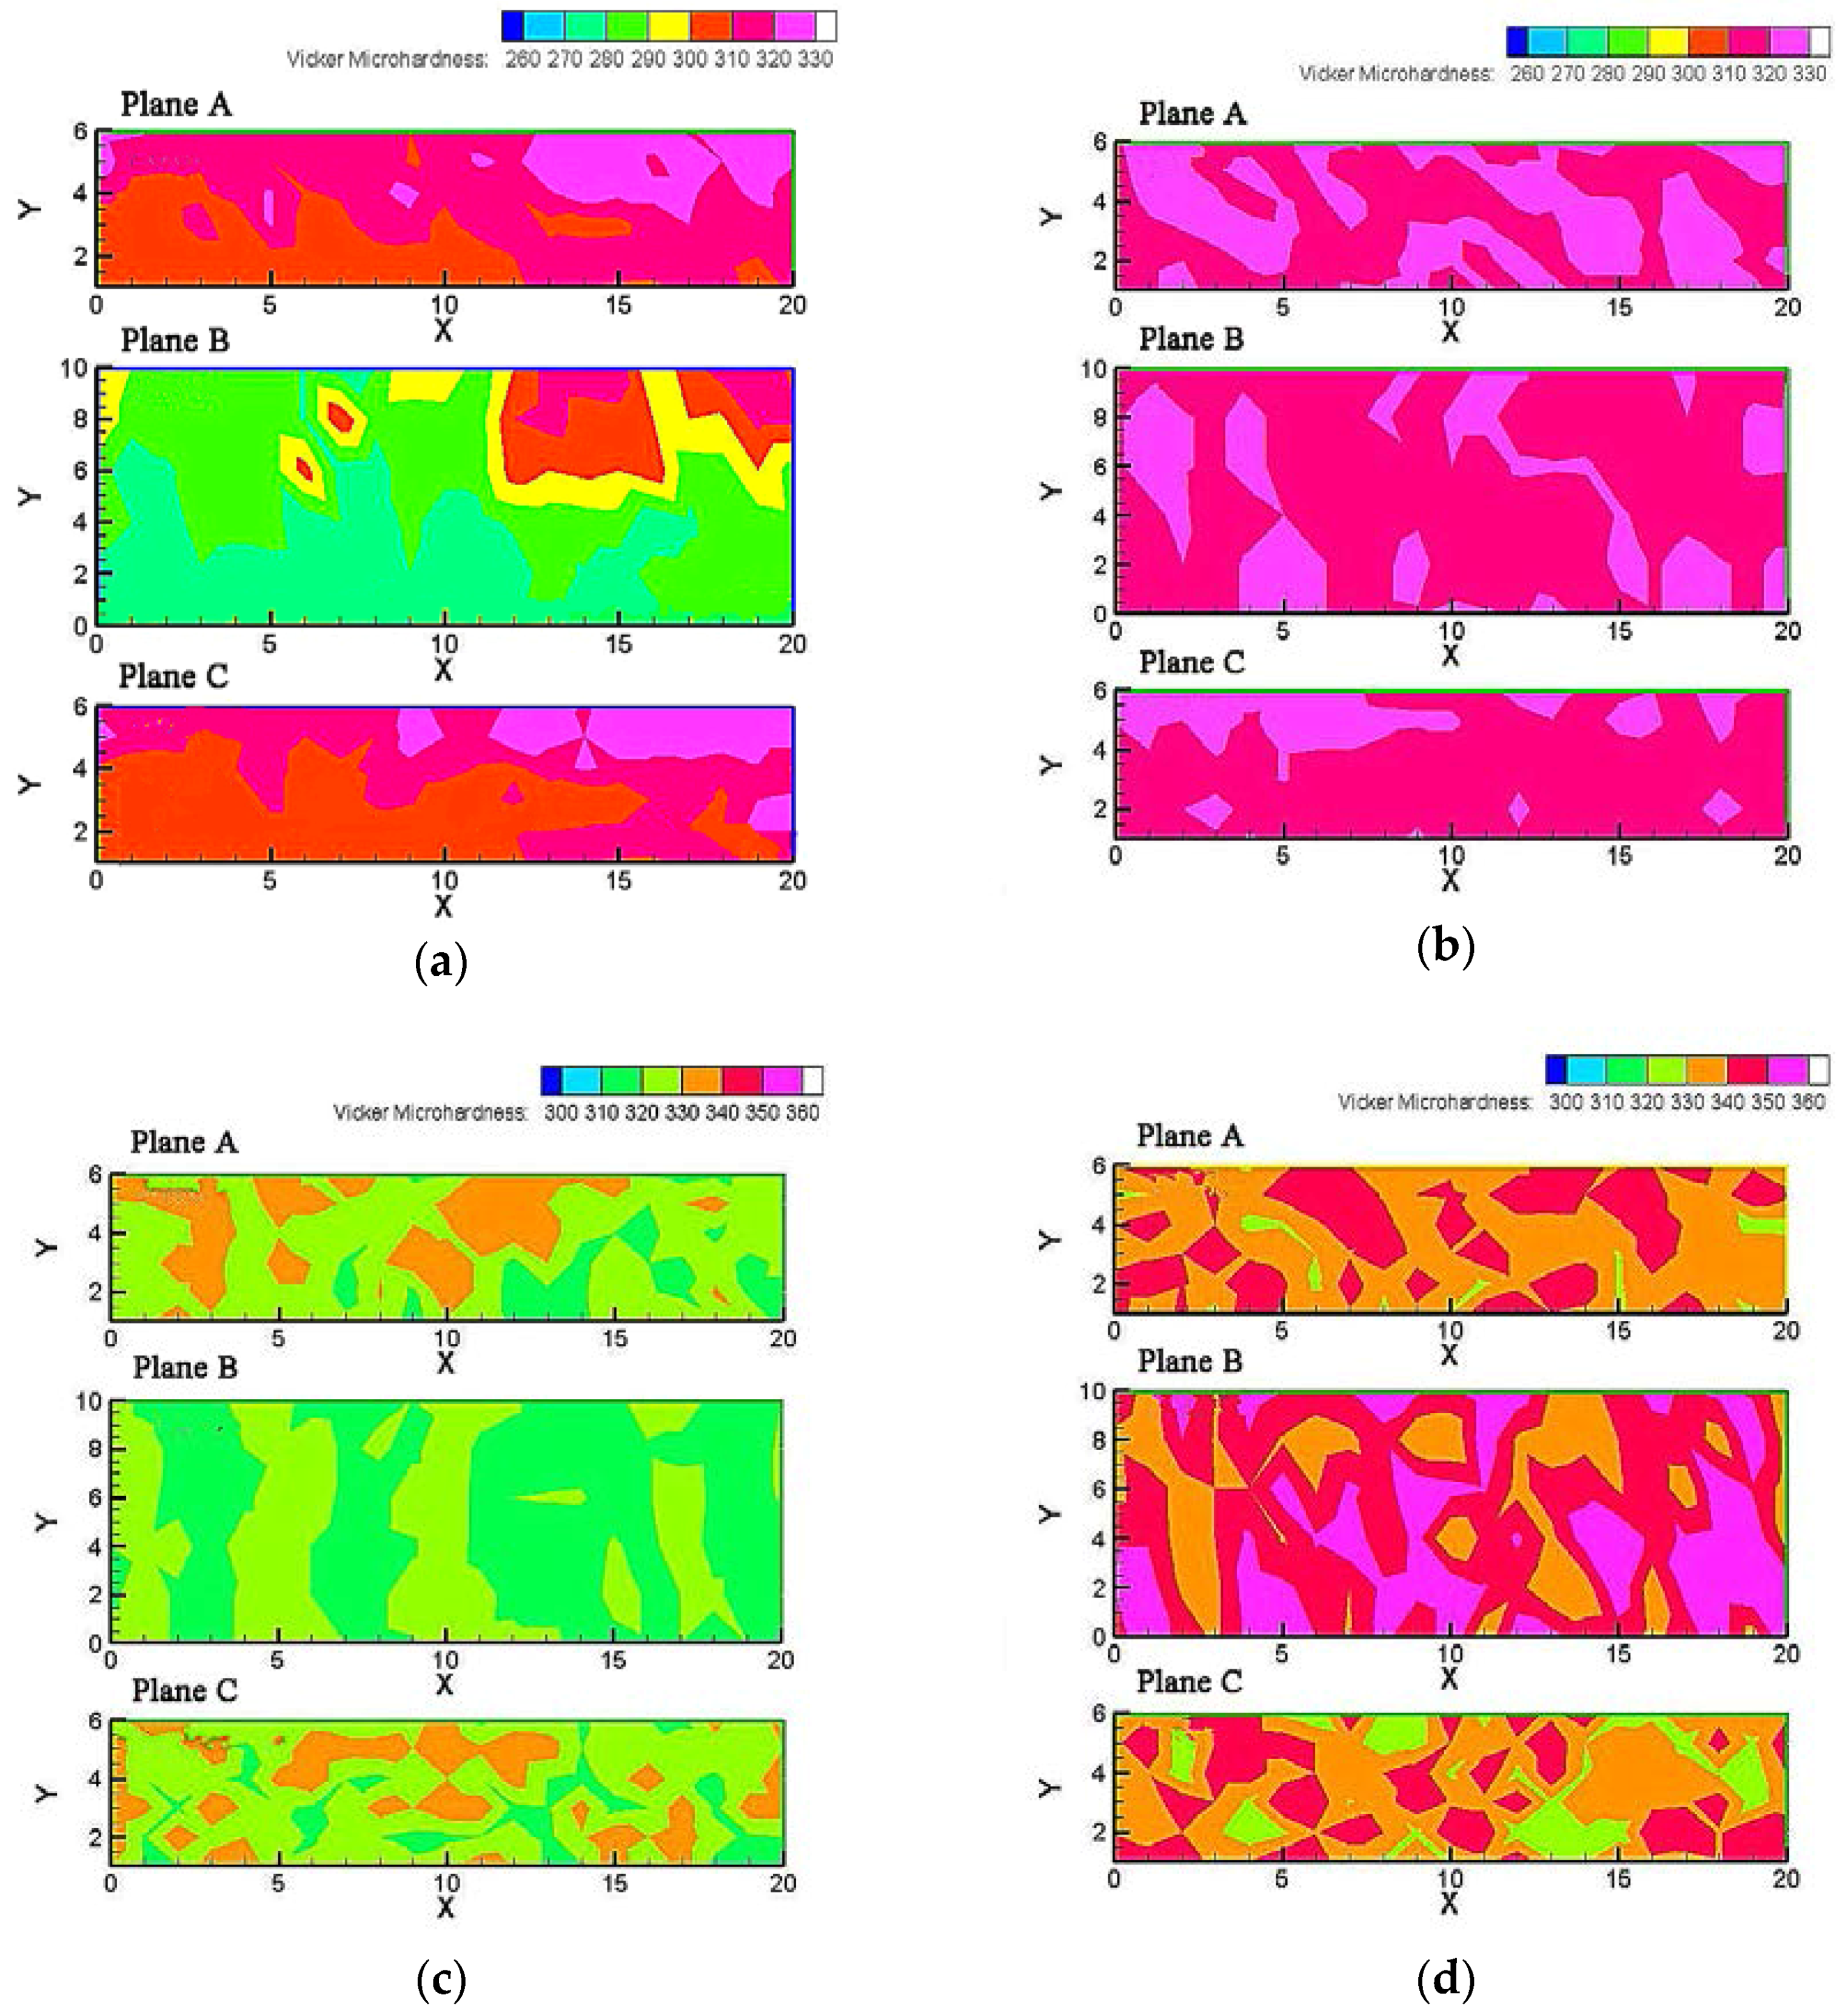
| ECAPed | 1 | 313 ± 14 | 285 ± 20 | 310 ± 15.5 |
| 3 | 319 ± 6 | 317 ± 7.5 | 318 ± 6.5 | |
| 4 | 326 ± 11 | 320 ± 7.5 | 327 ± 11.5 | |
| 8 | 338 ± 10 | 346 ± 9 | 337 ± 12 | |
© 2016 by the authors; licensee MDPI, Basel, Switzerland. This article is an open access article distributed under the terms and conditions of the Creative Commons by Attribution (CC-BY) license (http://creativecommons.org/licenses/by/4.0/).
Share and Cite
Zhang, D.; Osman, M.; Li, L.; Zheng, Y.; Tong, Y. Simulation and Experimental Investigation for the Homogeneity of Ti49.2Ni50.8 Alloy Processed by Equal Channel Angular Pressing. Metals 2016, 6, 45. https://doi.org/10.3390/met6030045
Zhang D, Osman M, Li L, Zheng Y, Tong Y. Simulation and Experimental Investigation for the Homogeneity of Ti49.2Ni50.8 Alloy Processed by Equal Channel Angular Pressing. Metals. 2016; 6(3):45. https://doi.org/10.3390/met6030045
Chicago/Turabian StyleZhang, Diantao, Mohamed Osman, Li Li, Yufeng Zheng, and Yunxiang Tong. 2016. "Simulation and Experimental Investigation for the Homogeneity of Ti49.2Ni50.8 Alloy Processed by Equal Channel Angular Pressing" Metals 6, no. 3: 45. https://doi.org/10.3390/met6030045
APA StyleZhang, D., Osman, M., Li, L., Zheng, Y., & Tong, Y. (2016). Simulation and Experimental Investigation for the Homogeneity of Ti49.2Ni50.8 Alloy Processed by Equal Channel Angular Pressing. Metals, 6(3), 45. https://doi.org/10.3390/met6030045